0001163653 us-gaap:ForeignGovernmentDebtSecuritiesMember us-gaap:FairValueMeasurementsRecurringMember us-gaap:FairValueInputsLevel2Member 2021-09-30 0001163653 us-gaap:ForeignExchangeContractMember us-gaap:NondesignatedMember 2021-04-01 2021-09-30 0001163653 us-gaap:CreditRiskContractMember us-gaap:FairValueMeasurementsRecurringMember us-gaap:FairValueInputsLevel3Member 2020-06-30
FORM
6-K
U.S. SECURITIES AND EXCHANGE COMMISSION
Washington, D.C. 20549
Report of Foreign Private Issuer
Pursuant to Rule
13a-16
or15d-16
ofthe Securities Exchange Act of 1934
Commission File Number:
1-15270
For the month of December 2021
NOMURA HOLDINGS, INC.
(Translation of registrant’s name into English)
13-1,
Nihonbashi1-chome
Chuo-ku,
Tokyo103-8645
Japan
(Address of principal executive offices)
Indicate by check mark whether the registrant files or will file annual reports under cover Form
20-F
or Form40-F.
Form
20-F
X
Form40-F
Indicate by check mark if the registrant is submitting the Form
6-K
in paper as permitted by RegulationS-T
Rule 101(b)(1):Indicate by check mark if the registrant is submitting the Form
6-K
in paper as permitted by RegulationS-T
Rule 101(b)(7):Incorporation by Reference
The registrant hereby incorporates Exhibits 1 and 17 to this report on Form
6-K
by reference in the prospectus that is part of the Registration Statement on FormF-3
(RegistrationNo. 333-229191)
of the registrant, filed with the SEC on January 11, 2019.Information furnished on this form:
EXHIBITS
Exhibit Number | ||||
| 1. | ||||
| 15. | ||||
| 17. | ||||
| 101.INS | Inline XBRL Instance Document—the instance document does not appear in the Interactive Data File because its XBRL tags are embedded within the Inline XBRL document | |||
| 101.SCH | Inline XBRL Taxonomy Extension Schema | |||
| 101.CAL | Inline XBRL Taxonomy Extension Calculation Linkbase | |||
| 101.DEF | Inline XBRL Taxonomy Extension Definition Linkbase | |||
| 101.LAB | Inline XBRL Taxonomy Extension Label Linkbase | |||
| 101.PRE | Inline XBRL Taxonomy Extension Presentation Linkbase | |||
SIGNATURES
Pursuant to the requirements of the Securities Exchange Act of 1934, the registrant has duly caused this report to be signed on its behalf by the undersigned, thereunto duly authorized.
NOMURA HOLDINGS, INC. | ||||
| Date: December 17, 2021 | By: | /s/ Yoshifumi Kishida | ||
| Yoshifumi Kishida | ||||
| Senior Managing Director | ||||
Exhibit 1
NOMURA HOLDINGS, INC.
INTERIM OPERATING AND FINANCIAL REVIEW
TABLE OF CONTENTS
| 1 | ||||
| 2 | ||||
| 3 | ||||
| 5 | ||||
| F-2 | ||||
| F-5 | ||||
| F-7 | ||||
| F-8 | ||||
| F-10 | ||||
| F-12 | ||||
| F-94 | ||||
Presentation of Financial and Other Information
As used in this Form
6-K,
references to the “Company”, “Nomura”, “Nomura Group”, “we”, “us” and “our” are to Nomura Holdings, Inc. and, except as the context otherwise requires, its consolidated subsidiaries. As part of certain line items in Nomura’s financial statements and information included in this Form6-K,
references to “NHI” are to Nomura Holdings, Inc.Unless otherwise stated, references in this Form
6-K
to “yen” and “¥” are to the lawful currency of Japan and references to “U.S. dollars” and “$” are to the lawful currency of the United States of America (“U.S.”).All ownership data with respect to us presented in this Form
6-K
is presented based on the voting interests directly or indirectly held by us. Our voting interest is presented in accordance with Japanese reporting requirements, pursuant to which the amount presented with respect to each subsidiary is the percentage of voting rights of such subsidiary held directly by us or our subsidiaries.For example, wholly-owned subsidiaries of our subsidiaries are listed as 100%, regardless of the level of our direct interest in the intermediate subsidiaries.
Amounts shown within this Form
6-K
have been rounded to the nearest indicated digit unless otherwise specified. In tables and graphs with rounded figures, sums may not add up due to rounding.Except as otherwise indicated, all financial information with respect to us presented in this Form
6-K
is presented on a consolidated basis. Our fiscal year ends on March 31 of each year. We prepare interim consolidated financial statements in accordance with U.S. generally accepted accounting principles (“U.S. GAAP”). Our interim consolidated financial statements, including the notes thereto, for the six months ended September 30, 2020 and 2021 are included elsewhere in this Form6-K.
The interim consolidated financial statements included in this Form6-K
have been reviewed in accordance with the standards of the Public Company Accounting Oversight Board (United States) by our independent auditors.1
Recent Regulatory Developments
This section updates certain disclosure presented under Item 4. Information on the Company—B. Business Overview—Regulation of our annual report on Form
20-F
for the fiscal year ended March 31, 2021.Regulatory Developments in the U.S. and the U.K
Regulatory Changes
In October 2021, rules issued by the Securities and Exchange Commission establishing capital, margin and segregation requirements for security-based swap dealers took effect. NGFP and NIP, Nomura’s subsidiaries subject to these rules, were registered as security-based swap dealers and were compliant with the relevant requirements as of the effective date.
In the U.K., the U.K FCA has recently consulted on proposed changes to the conduct and organizational rules in the U.K. Markets in Financial Instruments Directive (“MiFID”), specifically relating to research and best execution reporting. The final policy is expected to be published in the second half of 2021. On July 1, 2021 the U.K. HM Treasury launched a Wholesale Market Review Consultation. The consultation is part of the Government’s commitment to improving the competitiveness of the UK as a hub for capital markets, and is a central part of the Government’s post-Brexit strategy for financial services. It has a wide ranging focus, including the regulatory framework for trading venues, systematic internalisers, market data, and fixed income, equity, derivative and commodity markets. It proposes a number of amendments to the U.K.’s onshored MiFID regime and asks for industry input on a range of other topics.
On September 24, 2021 the European Securities and Markets Authority (“ESMA”) wrote to European Commission regarding the implementation of the Central Securities Depositories Regulation, urging it to consider a delay of the mandatory
buy-in
regime. ESMA is in favor of delaying the entry into force of thebuy-in
requirements—scheduled on February 1, 2022—while applying the other settlement discipline requirements, such as settlement fails reporting and cash penalties regime, as planned.In addition, interest rate benchmarks including, among others, the London Interbank Offered Rate (“LIBOR”), the Euro Interbank Offered Rate (EURIBOR), the Euro Overnight Index Average (EONIA) and certain other Interbank Offered Rates (“IBORs”) are being reformed. The U.K. is due to make the transition from LIBOR to Sterling Overnight Index Average (“SONIA”) by the end of 2021 although certain interim milestones have been extended due to the
COVID-19
pandemic. To avoid disruption to legacy contracts that reference the1-,
3-
and6-month
sterling and Japanese yen LIBOR settings, on September 30, 2021, the U.K. FCA announced that it will require the LIBOR benchmark administrator to publish these settings under a ‘synthetic’ methodology, based on term risk-free rates, for the duration of 2022. These six LIBOR settings will be available only for use in some legacy contracts, and are not for use in new business. The U.K. FCA also announced that will decide and specify before the end of 2021 which legacy contracts are permitted to use these synthetic LIBOR rates.2
Risk Factors
Significant changes in our Risk Factors which were described in our annual report on Form
20-F
for the fiscal year ended March 31, 2021 (the “202020-F”)
are stated below. The captions below correspond to “Item 3. Key Information—D. Risk Factors—Risks Relating to Our Business—Our Business may incur losses due to various factors in the conduct of its operations—(1) We may incur significant losses from our trading and investment activities” in the 202020-F.
5. Our business may incur losses due to various factors in the conduct of its operations.
(1) We may incur significant losses from our trading and investment activities
Explanatory Note: We are updating only the following sentence of this Risk Factor, which is replaced in its entirety as shown below. No other updates are being made to this Risk Factor
(Disclosure contained in the 2020
20-F)
The unwinding of the underlying positions was completed in the first quarter of the fiscal year ending March 31, 2022, and we expect to recognize additional losses of approximately ¥65 billion in the three months ending June 30, 2021 as a result.
()
Disclosure as updated
The unwinding of the underlying positions was completed in the first quarter of the fiscal year ending March 31, 2022, and we recognized additional losses of ¥65.4 billion in the three months ended June 30, 2021 as a result.
3
Special Note Regarding Forward-Looking Statements
This report contains forward-looking statements that are based on our current expectations, assumptions, estimates and projections about our business, our industry and capital markets around the world. These forward-looking statements are subject to various risks and uncertainties. Generally, these forward-looking statements can be identified by the use of forward-looking terminology such as “may”, “will”, “expect”, “anticipate”, “estimate”, “plan” or similar words. These statements discuss future expectations, identify strategies, contain projections of our results of operations or financial condition, or state other forward-looking information.
Known and unknown risks, uncertainties and other factors may cause our actual results, performance, achievements or financial position to differ materially from any future results, performance, achievements or financial position expressed or implied by any forward-looking statements contained in this report. Such risks, uncertainties and other factors are set forth in “” above and in Item 3. D of our annual report on Form
Risk Factors
20-F
for the fiscal year ended March 31, 2021, as well as elsewhere in this Form6-K.
4
Operating and Financial Review and Prospects
Results of Operations—Six Months Ended September 30, 2020 and 2021
The unaudited interim consolidated financial statements are prepared on a basis consistent with the audited consolidated financial statements included in our Form” to the interim consolidated financial statements.
20-F
for the fiscal year ended March 31, 2021 filed on June 25, 2021, except for the effect of new accounting pronouncements recently adopted by Nomura as disclosed in Note 1 “summary of accounting policies
In April 2021, the Investment Management Division was newly established by replacing the Asset Management Division and the Merchant Banking Division. Accordingly, our operating management and management reporting are prepared based on the Retail, the Investment Management and the Wholesale segments. We disclose business segment information in accordance with this structure from the first quarter commencing on April 1, 2021.
5
Progress on Key Performance Indicators
[Management Indicators]
One component of Nomura’s management vision is “achieving sustainable growth by solving social issues” and we have set Return on Equity (ROE) as one of the most important indicators towards the fiscal year ending March 2025. After the introduction of the Corporate Governance Code in Japan, the importance of management having an awareness of capital costs has increased among Japanese companies. In addition, since the financial services industry is subject to stringent financial capital regulations, more effective use of capital is required. As a result, we believe that the optimal allocation of management resources will become even more important for our company in the future. Accordingly, beginning in the year ended March 31, 2020, we adopted ROE as a key management indicator, which management uses to track the progress of our sustainable business transformation. At the Board of Directors meeting held in May 2020,
in-depth
discussions were held on the management indicators and basic concepts described as follows.Return on equity
ROE is defined and calculated as net income attributable to NHI shareholders divided by total NHI shareholders’ equity. We believe that disclosure of ROE is useful to investors in that it helps them to assess business conditions and effective use of capital to enhance corporate value. We currently calculate and measure ROE on a quarterly basis. We have set a medium to long-term ROE target of
8-10%
for the fiscal year end March 2025, reflecting the cost of capital demanded by our company. However, ROE may be of limited use in that it does not necessarily reflect financial soundness. In order to avoid the excessive pursuit of capital efficiency with the aim of improving ROE at the expense of financial soundness, we attach importance to the creation of corporate value, giving due consideration to financial soundness, and thereby improving ROE. ROE (calculated using annualized net income attributable to shareholders for each period) for the six months ended September 30, 2021 decreased to 3.8% from 15.6% for the same period in the prior year, primarily due to losses arising from the U.S. Prime Brokerage Event in March this year and a provision for legal costs related to legacy transactions.Common equity Tier1 ratio (CET1 ratio)
In addition to ROE, there are multiple global financial regulations that we must comply with, including capital regulations established by Basel Committee on Banking Supervision as interpreted and implemented by the FSA which have a direct impact on the way we conduct business. For this reason, we have set a target of maintaining a common equity Tier 1 ratio (CET1 ratio) of at least 11%, so that we will take into consideration the financial soundness including certain buffer against severe market stress. Our CET1 ratio increased to 17.7% as of September 30, 2021 from 15.8% as of March 31, 2021. For further details, on the key capital requirements we must follow, see “Consolidated Regulatory Capital Requirements.”
[Indicators by Business Segment]
In addition to the Group KPIs, our management also uses certain divisional specific KPIs to monitor and assess performance of the divisions.
6
Retail
We have adopted the following key indicators in the Retail Division to quantify the outcomes of our efforts and monitor our business: Recurring revenue assets; Consulting-related revenue; Net inflows of cash and securities; and Active clients; so that our management will be able to monitor the progress of our businesses and target sustainable and further business growth. We believe that disclosure of those indicators is useful to investors in that it helps them to assess the progress of the division’s client-facing activities as well as digest and understand our growth potential.
Billions of yen, except for percentages | ||||||||||||
March 31, 2021 | September 30, 2021 | % Change from March 31, 2021 | ||||||||||
Recurring revenue assets | ¥ | 18,200 | ¥ | 19,500 | 7.1 | % | ||||||
Billions of yen, except for percentages and number of active clients | ||||||||||||
Six months ended September 30, | ||||||||||||
2020 | 2021 | % Change from previous year | ||||||||||
Consulting-related revenue | ¥ | 5.5 | ¥ | 8.3 | 50.9 | % | ||||||
Net inflows of cash and securities | ¥ | 767.6 | ¥ | 324.2 | -57.8 | % | ||||||
Active clients | 717,000 | 704,000 | -1.8 | % | ||||||||
Recurring revenue assets
Recurring revenue assets are defined and calculated as the total of assets under custody and related loans, which loans totaled ¥520.0 billion withinin the consolidated balance sheets as of September 30, 2021. The total recurring revenue assets as of September 30, 2021 has increased to ¥19.5 trillion from ¥18.2 trillion as of March 31, 2021 and has marked the highest levels since we started monitoring this indicator beginning from March 31, 2020, as a result from providing appropriate asset allocation to our clients. In addition, monthly net increase of recurring revenue assets has continued throughout the first six months of the fiscal year ending March 31, 2022, compared to the consecutive outflow in the previous fiscal year.
Loans receivable
Consulting-related revenue
Consulting-related revenue, defined as fees from investment banking, has exceeded ¥8.0 billion for the six months ended September 30, 2021, compared to ¥5.5 billion for the six months ended September 30, 2020, which is a higher level compared to the first six months of each of the past two fiscal years. By pursuing a policy of assigning highly specialized partners according to client attributes, we believe that we have established a system that can respond to a wide range of client needs and provide various services.
Net inflows of cash and securities
Net inflows of cash and securities are defined and calculated as cash and securities inflows minus outflows, excluding those attributable to regional financial institutions. Net inflows of cash and securities were over ¥300.0 billion in annual total as of September 30, 2021 and achieved ¥128.7 trillion in retail client assets. The impact of inflows and outflows in the wealth management channel remains significant, but the Net & Call online trading channel continues to see capital inflows and we believe that our business initiatives are beginning to show results.
Active clients
Active clients are defined as number of clients who transacted at least once since April 1 (accumulated) of the relevant fiscal year. The number of active clients through the six months ended September 30, 2021 was approximately 700 thousand, in line with the same period during the previous fiscal year. We have been able to steadily increase the number of active clients in a market environment with relatively low volatility.
7
Investment Management Division
We have set the balance of assets under management as a key performance indicator in the Investment Management Division. The businesses in the Investment Management Division generally earn asset management and similar fees based on the amount of assets under management, meaning that revenue trends for these businesses tends to follow trends in the amount of assets under management, and our management considers this measure to be effective in monitoring the progress of these businesses. We also believe that it is an important indicator of how well investment products are received by investors.
Trillions of yen, except for percentages | ||||||||||||
March 31, 2021 | September 30, 2021 | % Change from March 31, 2021 | ||||||||||
Assets under management | ¥ | 64.7 | ¥ | 67.8 | 4.8 | % | ||||||
The balance of assets under management includes the net balance (after deducting duplications) of assets under management (gross) of Nomura Asset Management, Nomura Corporate Research and Asset Management, and Wealth Square, as well as third-party investments in funds managed by Nomura Mezzanine Partners, Nomura Capital Partners, and Nomura Research & Advisory.
During the six months ended September 30, 2021, the balance of assets under management increased due to the continued inflow of funds to investment trusts such as dedicated to defined contribution pension plans and ETFs, as well as both the inflow of funds in the overseas business and institutional channels, and market factors.
Wholesale
Starting April 2019, we have adopted aratio and a revenue to modified RWA ratio as additional key performance indicators in our Wholesale Division. We believe that disclosure of these indicators would be useful for investors to assess progress in terms of cost and resource efficiency. Additionally, we use these indicators to evaluate our business based on progress on cost savings initiatives and return on resources.
cost-to-income
Three months ended | ||||||||||||||||||||||||
June 30, 2020 | September 30, 2020 | June 30, 2021 | % Change from previous year | September 30, 2021 | % Change from previous year | |||||||||||||||||||
Cost-to-income | 65 | % | 70 | % | 121 | % | 86 | % | 86 | % | 23 | % | ||||||||||||
Revenue/modified RWA | 7.9 | % | 8.5 | % | 4.9 | % | -38 | % | 7.1 | % | -16 | % | ||||||||||||
Cost-to-income
Theratio for the Wholesale Division is calculated by dividing
cost-to-income
non-interest
expenses for the division for a given reporting period by net revenue generated by the division for the same period, calculated consistently, in each case, with our segment presentation for the division. It is monitored at a divisional level to track operating margins for the business. The ratio increased for the quarter ended June 30, 2021 compared to the prior fiscal year primarily due to the impact on revenue and expenses from the U.S. Prime Brokerage Event. However, the negative impact was partly offset by increase in Investment Banking revenue as well aspro-active
cost management. The ratio increased for the quarter ended September 30, 2021 compared to the prior fiscal year mainly due to decline in Global Markets revenue, partly offset by higher Investment Banking revenue and reduction in costs.Revenue to modified Risk Weighted Asset (RWA) ratio
The revenue to modified RWA ratio for the Wholesale division is calculated by dividing net revenue generated by our Wholesale Division for a given reporting period (in the case of net revenue for the Wholesale Division for periods shorter than a full fiscal year, on an annualized basis) by the average balance of modified RWA used by the Wholesale Division for the same period. The Revenue to modified RWA ratio is monitored to track our revenue earning capacity against risk resources deployed. Modified RWA is the total of (i) average daily risk-weighted assets as calculated and presented under Basel regulations as interpreted and implemented by the FSA and (ii) an adjustment equal to the regulatory adjustment to common equity tier1 (CET1) capital calculated and presented under Basel regulations as interpreted and implemented by the FSA divided by our internal minimum capital ratio target of 12.5%. (daily average for the accounting period), which we use to estimate the amount of deductions to RWA generated by the division. The revenue to modified RWA as we calculate and present it may differ from similarly titled measures presented by our competitors due to the approach and methodologies used for calculation. Our credit risk-weighted assets and operational risk equivalent assets are calculated by using the foundation Internal Ratings-Based Approach and the Standardized Approach, respectively, with the approval of the FSA. Furthermore, Market risk equivalent assets are calculated by using the Internal Models Approach for market risk. The conversion of Wholesale RWA to modified RWA is based on adjustments reflecting our internal minimum capital ratio target. Moreover, the usefulness of this ratio may be limited in that the adjustment applied to RWA, which is intended to capture the appropriate amount of RWA to attribute to our businesses (as opposed to RWA as calculated for regulatory capital purposes), is an estimate incorporating our internal risk tolerance; however, this adjustment may not appropriately reflect the actual regulatory capital impact of the charged assets that are used by our business. Revenue to modified RWA decreased for the quarter ended June 30, 2021 compared to the prior fiscal year was primarily because of the adverse impact of the U.S. Prime Brokerage Event on revenue as well as RWA. The ratio decreased for the quarter ended September 30, 2021 compared to the prior fiscal year mainly due to decline in Global Markets revenue, partly offset by strong Investment Banking revenue and reduction in RWA.
8
Current Challenges
There is no significant change to our current challenges nor new challenges for the six months ended September 30, 2021.
In addition, regarding the issues relating to the U.S. Prime Brokerage Event reported in the previous consolidated accounting year, we made progress as follows in this six months ended September 30, 2021.
| • | Phase 1: Initial Responses (completed). |
| • | Phase 2: Review of Prime Brokerage Risk Management Framework (completed). As part of this phase, we are taking actions to enhance the monitoring of concentrated positions, revise our margin rates applicable to clients and to enhance management of margin rates for individual transactions (including internal approvals and other processes). |
| • | Phase 3: Comprehensive Review of Wholesale Risk Framework (completed). We have already completed our comprehensive review of the risk management framework in the Wholesale division. Based on those, we have determined various measures to enhance risk management and its governance structure to drive it forward, including establishment of a Steering Committee for Enhancement of Risk Management as well as a role of Chief Transformation Officer (“CTO”). |
| • | Phase 4: Enhance Global Risk Governance (completed): We took measures to strengthen the functions of our risk management committees, including expanding the scope of our Wholesale division’s risk monitoring beyond our financing businesses to include other businesses in the Wholesale division. In addition, we decided to establish a Board Risk Committee (“BRC”), effective October 29, 2021, which is chaired by an independent director and constituted of non-executive directors, to discuss important risk matters from a standpoint independent of execution. At the same time, the existing committee to discuss risk management on execution side is partially reformed, from Group Integrated Risk Management Committee (“GIRMC”) to Group Risk Management Committee (“GRMC”), in order to effectively coordinate with the BRC of supervisory side. For the detail, see‘Quantitative and Qualitative Disclosures about Market, Credit and Other Risk’ |
9
Overview
The following table provides selected consolidated statements of income information for the six months ended September 30, 2020 and 2021.
Millions of yen except percentages | ||||||||||||
Six months ended September 30 | ||||||||||||
2020 | 2021 | % Change from previous year | ||||||||||
Non-interest revenues: | ||||||||||||
Commissions | ¥ | 177,765 | ¥ | 174,522 | (1.8 | )% | ||||||
Fees from investment banking | 37,859 | 69,604 | 83.9 | |||||||||
Asset management and portfolio service fees | 111,073 | 131,237 | 18.2 | |||||||||
Net gain on trading | 270,552 | 143,136 | (47.1 | ) | ||||||||
Gain (loss) on private equity investments | 2,875 | 26,463 | 820.5 | |||||||||
Gain (loss) on investments in equity securities | 5,413 | 5,550 | 2.5 | |||||||||
Other | 138,817 | 99,408 | (28.4 | ) | ||||||||
Total non-interest revenues | 744,354 | 649,920 | (12.7 | ) | ||||||||
Net interest revenue | 85,391 | 22,221 | (74.0 | ) | ||||||||
Net revenue | 829,745 | 672,141 | (19.0 | ) | ||||||||
Non-interest expenses | 564,307 | 575,141 | 1.9 | |||||||||
Income before income taxes | 265,438 | 97,000 | (63.5 | ) | ||||||||
Income tax expense | 52,217 | 41,524 | (20.5 | ) | ||||||||
Net income (loss) | 213,221 | 55,476 | (74.0 | )% | ||||||||
Less: Net income attributable to noncontrolling interests | 3,063 | 3,776 | 23.3 | |||||||||
Net income (loss) attributable to NHI shareholders | ¥ | 210,158 | ¥ | 51,700 | (75.4 | )% | ||||||
Return on shareholders’ equity (annualized) (1) | 15.6 | % | 3.8 | % | ||||||||
| (1) | Calculated as Net income attributable to NHI shareholders divided by average Total NHI shareholders’ equity multiplied by two. |
Net revenue
Commissions
Fees from investment banking
Asset management and portfolio service fees
Net gain
on trading
Gain on private equity investments
Other revenue
non-recurring
gain from the rights conversion of the Tokyo Nihonbashi district redevelopment project being recognized during the six months ended September 30, 2020, which was partially offset by the income in June 2021 from the sale of a part of our shares held in Nomura Research Institute, Ltd. being recognized during the six months ended September 30, 2021.Net interest revenue
Net interest revenue
Net interest revenue
Non-interest
revenuesNon-interest
expenses10
We are subject to a number of different taxes in Japan and have adopted the consolidated tax filing system permitted under Japanese tax law. The consolidated tax filing system only imposes a national tax. Our foreign subsidiaries are subject to the income taxes of the countries in which they operate, which are generally lower than those in Japan. The Company’s effective statutory tax rate in any one year is therefore dependent on our geographic mix of profits and losses and also on the specific tax treatment applicable in each location.
For the six months ended September 30, 2020, the difference between the effective statutory tax rate of 31% and the effective tax rate of 19.7% was mainly due to a decrease in valuation allowance of foreign subsidiaries, whereas
non-deductible
expenses increased the effective tax rate.For the six months ended September 30, 2021, the difference between the effective statutory tax rate of 31% and the effective tax rate of 42.8% was mainly due to an increase of the valuation allowance of foreign subsidiaries.
Retail
In our Retail Division, our sales activities focus on providing consultation services and investment proposals to clients for which we receive commissions and fees. Additionally, we receive fees from asset management companies in connection with administration services we provide in connection with investment trust certificates that we distribute. We also receive agent commissions from insurance companies for the insurance products we sell as an agent.
Millions of yen | ||||||||||||
Six months ended September 30 | ||||||||||||
2020 | 2021 | % Change from previous year | ||||||||||
Non-interest revenues | ¥ | 172,676 | ¥ | 168,475 | (2.4 | )% | ||||||
Net interest revenue | 1,197 | 1,702 | 42.2 | |||||||||
Net revenue | 173,873 | 170,177 | (2.1 | ) | ||||||||
Non-interest expenses | 135,979 | 134,171 | (1.3 | ) | ||||||||
Income before income taxes | ¥ | 37,894 | ¥ | 36,006 | (5.0 | )% | ||||||
Net revenue
Non-interest
expensesIncome before income taxes
The following table presents a breakdown of Retail
non-interest
revenues for the six months ended September 30, 2020 and 2021.Millions of yen | ||||||||||||
Six months ended September 30 | ||||||||||||
2020 | 2021 | % Change from previous year | ||||||||||
Commissions | ¥ | 87,435 | ¥ | 74,198 | (15.1 | )% | ||||||
Brokerage commissions | 41,966 | 35,373 | (15.7 | ) | ||||||||
Commissions for distribution of investment trusts | 33,498 | 25,484 | (23.9 | ) | ||||||||
Other commissions | 11,970 | 13,340 | 11.4 | |||||||||
Net gain on trading | 28,432 | 23,445 | (17.5 | ) | ||||||||
Fees from investment banking | 9,329 | 10,176 | 9.1 | |||||||||
Asset management fees | 42,344 | 54,205 | 28.0 | |||||||||
Others | 5,137 | 6,451 | 25.6 | |||||||||
Non-interest revenues | ¥ | 172,676 | ¥ | 168,475 | (2.4 | )% | ||||||
11
Commissions
Net gain on trading
Fees from investment banking
Asset management fees
Retail Client Assets
The following table presents the amounts and details of Retail client assets as of March 31, 2021 and September 30, 2021.
Trillions of yen | ||||||||||||||||||||
From March 31, 2021 to September 30, 2021 | ||||||||||||||||||||
Balance at March 31, 2021 | Gross inflows | Gross outflows | Market appreciation / (depreciation) | Balance at September 30, 2021 | ||||||||||||||||
Equities | ¥ | 82.3 | ¥ | 7.9 | ¥ | (7.7 | ) | ¥ | 1.6 | ¥ | 84.1 | |||||||||
Debt securities | 18.1 | 7.0 | (6.4 | ) | (0.8 | ) | 17.9 | |||||||||||||
Stock investment trusts | 10.2 | 1.3 | (1.0 | ) | 0.4 | 10.9 | ||||||||||||||
Bond investment trusts | 8.0 | 0.1 | (0.3 | ) | (0.0 | ) | 7.8 | |||||||||||||
Overseas mutual funds | 1.1 | 0.1 | (0.1 | ) | 0.1 | 1.2 | ||||||||||||||
Others | 6.9 | 0.5 | (0.4 | ) | (0.2 | ) | 6.8 | |||||||||||||
Total | ¥ | 126.6 | ¥ | 16.9 | ¥ | (15.9 | ) | ¥ | 1.1 | ¥ | 128.7 | |||||||||
Retail client assets increased by ¥ 2.1 trillion from ¥126.6 trillion as of March 31, 2021 to ¥128.7 trillion as of September 30, 2021. The balances of our clients’ equity and equity-related products was ¥82.3 trillion as of March 31, 2021 and ¥84.1 trillion as of September 30, 2021. The balances of our clients’ investment trusts and mutual funds increased by ¥ 0.6 trillion from ¥19.3 trillion as of March 31, 2021 to ¥19.8 trillion as of September 30, 2021.
12
Investment Management
Our Investment Management Division is conducted through Nomura Asset Management Co., Ltd. (“NAM”) and other investment and asset management subsidiaries. We earn portfolio management fees through the development and management of collective investment schemes such as investment trusts, provide investment advisory services for pension funds and other institutional clients. We also provide private equity/debt strategies as well as product offering platform that invests in tangible assets such as infrastructure, real estate and aircraft. Our revenue also include investment gain/loss related to our investments in American Century Investments and in other investment businesses.
Millions of yen | ||||||||||||
Six months ended September 30 | ||||||||||||
2020 | 2021 | % Change from previous year | ||||||||||
Non-interest revenues | ¥ | 69,888 | ¥ | 97,944 | 40.1 | % | ||||||
Net interest revenue | (146 | ) | (133 | ) | — | |||||||
Net revenue | 69,742 | 97,811 | 40.2 | |||||||||
Non-interest expenses | 35,521 | 37,869 | 6.6 | |||||||||
Income before income taxes | ¥ | 34,221 | ¥ | 59,942 | 75.2 | % | ||||||
Net revenue
Non-interest
expensesThe breakdown of net revenue for Investment Management is as follows:
Millions of yen | ||||||||
Six months ended September 30 | ||||||||
2020 | 2021 | |||||||
Business revenue (1) | ¥ | 53,318 | ¥ | 57,291 | ||||
Investment gain/ loss (2) | 16,424 | 40,520 | ||||||
Net revenue | ¥ | 69,742 | ¥ | 97,811 | ||||
Note: Prior period amounts have been reclassified to conform to the current year presentation.
| (1) | Consists of division revenue, other than investment gain/loss, including revenue generated by our asset management business (excluding gains and losses related to our investment in American Century Investments), revenues generated by Nomura Babcock & Brown Co., Ltd.’s aircraft leasing-related businesses and management fee revenues generated from our private equity and other investment businesses |
| (2) | Consists of division revenue attributable to investments (including fair value fluctuations, funding cost and dividends), including gains and losses related to our investment in American Century Investments, our investments held in our private equity and other investment businesses and our investment in Mebuki Financial Group, Inc. |
13
The following table presents assets under management of each principal Nomura entity within Investment Management Division as of March 31, 2021 and September 30, 2021.
Billions of yen | ||||||||||||||||||||
From March 31, 2021 to September 30, 2021 | ||||||||||||||||||||
Balance at March 31, 2021 | Gross inflows | Gross outflows | Market appreciation / (depreciation) | Balance at September 30, 2021 | ||||||||||||||||
Nomura Asset Management Co., Ltd. | ¥ | 66,157 | ¥ | 14,258 | ¥ | (13,305 | ) | ¥ | 2,236 | ¥ | 69,346 | |||||||||
Nomura Corporate Research and Asset Management Inc. etc | 3,301 | 627 | (285 | ) | 157 | 3,800 | ||||||||||||||
Combined total | 69,458 | 14,885 | (13,590 | ) | 2,393 | 73,146 | ||||||||||||||
Shared across group companies | (4,792 | ) | (977 | ) | 625 | (213 | ) | (5,357 | ) | |||||||||||
Total | ¥ | 64,666 | ¥ | 13,908 | ¥ | (12,965 | ) | ¥ | 2,180 | ¥ | 67,789 | |||||||||
Assets under management increased primarily due to increases in the market value of assets and inflows to our investment trust and investment advisory businesses.
The following table shows NAM’s share, in terms of net asset value, in the Japanese Asset management market as of March 31, 2021 and September 30, 2021.
March 31 2021 | September 30 2021 | |||||||
Total of publicly offered investment trusts | 28 | % | 27 | % | ||||
Stock investment trusts | 26 | % | 26 | % | ||||
Bond investment trusts | 44 | % | 44 | % | ||||
14
Wholesale
In Wholesale, we are engaged in the sales and trading of debt securities and equity securities and currencies on a global basis to various institutions, providing investment banking services such as the underwriting of bonds and equities as well as mergers and acquisitions and financial advice and investing in private equity businesses with the goal of maximizing returns on these investments by increasing the corporate value of investee companies.
Millions of yen | ||||||||||||
Six months ended September 30 | ||||||||||||
2020 | 2021 | % Change from previous year | ||||||||||
Non-interest revenues | ¥ | 376,148 | ¥ | 255,957 | (32.0 | )% | ||||||
Net interest revenue | 92,826 | 49,489 | (46.7 | ) | ||||||||
Net revenue | 468,974 | 305,446 | (34.9 | ) | ||||||||
Non-interest expenses | 315,628 | 308,834 | (2.2 | ) | ||||||||
Income (loss) before income taxes | ¥ | 153,346 | ¥ | (3,388 | ) | — | % | |||||
Net revenue
Non-interest
expensesThe following table presents a breakdown of net revenue for Wholesale for the six months ended September 30, 2020 and 2021.
Millions of yen | ||||||||||||
Six months ended September 30 | ||||||||||||
2020 | 2021 | % Change from previous year | ||||||||||
Global Markets | ¥ | 424,839 | ¥ | 234,456 | (44.8 | )% | ||||||
Investment Banking | 44,135 | 70,990 | 60.8 | |||||||||
Net revenue | ¥ | 468,974 | ¥ | 305,446 | (34.9 | )% | ||||||
Global Markets net revenue was ¥234.5 billion. Fixed Income net revenue decreased from ¥259.5 billion for the six months ended September 30, 2020 to ¥158.9 billion for the six months ended September 30, 2021 because of market normalization. Equities net revenue decreased from ¥165.4 billion for the six months ended September 30, 2020 to ¥75.6 billion for the six months ended September 30, 2021 due to the U.S. Prime Brokerage Event. Investment banking net revenue was ¥71.0 billion.
15
Other Operating Results
Other operating results include net gain (loss) related to economic hedging transactions, realized gain (loss) on investments in equity securities held for operating purposes, equity in earnings of affiliates, corporate items, and other financial adjustments. See Note 16 “” in our interim consolidated financial statements.
Segment and geographic information
Net revenue
Non-interest
expensesIncome (loss) before income taxes
Other operating results for the six months ended September 30, 2021 include gains from changes in the fair value of derivative liabilities of ¥0.3 billion attributable to the change in Nomura’s own creditworthiness and gains from changes in counterparty credit spreads of ¥1.7 billion.
Number of Employees
The following table presents the number of our employees as of September 30, 2020 and 2021.
September 30 | ||||||||
2020 | 2021 | |||||||
Japan | 15,807 | 15,393 | ||||||
Europe | 2,765 | 2,811 | ||||||
Americas | 2,157 | 2,171 | ||||||
Asia and Oceania | 6,140 | 6,216 | ||||||
Total | 26,869 | 26,591 | ||||||
16
Summary of Regional Contributions
For a summary of our net revenue, income (loss) before income taxes and long-lived assets by geographic region, see Note 16
“” in our interim consolidated financial statements.
Segment and geographic information
Regulatory Capital Requirements
Many of our business activities are subject to statutory capital requirements, including those of Japan, the U.S., the U.K. and certain other countries in which we operate.
Translation Exposure
A significant portion of our business is conducted in currencies other than Japanese Yen—most significantly, U.S. Dollars, British Pounds and Euros. We prepare financial statements of each of our consolidated subsidiaries in its functional currency, which is the currency of the primary economic environment in which the entity operates. Translation exposure is the risk arising from the effect of fluctuations in exchange rates on the net assets of our foreign subsidiaries. Translation exposure is not recognized in our consolidated statements of income unless and until we dispose of, or liquidate, the relevant foreign subsidiary.
Critical Accounting Policies and Estimates
Critical accounting policies are the accounting policies which have the most significant impact on the preparation of our consolidated financial statements included within this report and which require the most difficult, subjective and complex judgments by management to develop estimates used in the application of these policies. Such estimates determined by management include estimates regarding the fair value of financial instruments, the outcome of litigation and tax examinations and other matters that affect the reported amounts of assets and liabilities as well as the disclosures in the consolidated financial statements. Estimates, by their nature, are based on underlying assumptions which require management judgment and depend on the extent of available information. Actual results in future periods may differ from current estimates, which could have a material impact on the consolidated financial statements.
Fair value for financial instruments
A significant amount of our financial instruments are carried at fair value, with changes in fair value recognized through the consolidated statements of income or the consolidated statements of comprehensive income on a recurring basis. Use of fair value is either specifically required under U.S. GAAP or we make an election to use fair value for certain eligible items under the fair value option.
Other financial assets and financial liabilities are carried at fair value on a nonrecurring basis, where the primary measurement basis is not fair value. Fair value is only used in specific circumstances after initial recognition, such as to measure impairment.
In accordance with Accounting Standard Codification (“ASC”) 820 “”, all financial instruments measured at fair value have been categorized into a three-level hierarchy based on the transparency of inputs used to establish fair value.
Fair Value Measurements and Disclosures
Level 1:
Observable valuation inputs that reflect quoted prices (unadjusted) for identical financial instruments traded in active markets at the measurement date.
Level 2:
Valuation inputs other than quoted prices included within Level 1 that are either directly or indirectly observable for the financial instrument.
Level 3:
Unobservable valuation inputs which reflect Nomura assumptions and specific data.
The availability of valuation inputs observable in the market varies by product and can be affected by a variety of factors. Significant factors include, but are not restricted to the prevalence of similar products in the market, especially for customized products, how established the product is in the market, for example, whether it is a new product or is relatively mature, and the reliability of information provided in the market which would depend, for example, on the frequency and volume of current data. A period of significant change in the market may reduce the availability of observable data. Under such circumstances, financial instruments may be reclassified into a lower level in the fair value hierarchy.
Significant judgments used in determining the classification of financial instruments include the nature of the market in which the product would be traded, the underlying risks, the type and liquidity of market data inputs and the nature of observed transactions for similar instruments.
17
Where valuation models include the use of parameters which are less observable or unobservable in the market, significant management judgment is used in establishing fair value. The valuations for Level 3 financial instruments, therefore, involve a greater degree of judgment than those valuations for Level 1 or Level 2 financial instruments.
Certain criteria management use to determine whether a market is active or inactive include the number of transactions, the frequency that pricing is updated by other market participants, the variability of price quotes among market participants, and the amount of publicly available information.
18
Level 3 financial assets as a proportion of total financial assets, carried at fair value on a recurring basis were 5% as of September 30, 2021 (5% as of March 31, 2021) as listed below:
Billions of yen | ||||||||||||||||||||
September 30, 2021 | ||||||||||||||||||||
Level 1 | Level 2 | Level 3 | Counterparty and Cash Collateral Netting | Total | ||||||||||||||||
Financial assets measured at fair value (Excluding derivative assets) | ¥ | 9,022 | ¥ | 7,802 | ¥ | 709 | ¥ | — | ¥ | 17,533 | ||||||||||
Derivative assets | 32 | 13,279 | 187 | (12,333 | ) | 1,165 | ||||||||||||||
Total | ¥ | 9,054 | ¥ | 21,081 | ¥ | 896 | ¥ | (12,333 | ) | ¥ | 18,698 | |||||||||
See Note 2 “” in our interim consolidated financial statements.
Fair value measurements
19
Assets and Liabilities Associated with Investment and Financial Services Business
Exposure to Certain Financial Instruments and Counterparties
Market conditions continue to impact numerous products to which we have certain exposures. We also have exposures to Special Purpose Entities (“SPEs”) and others in the normal course of business.
Leveraged Finance
We provide loans to clients in connection with leveraged
buy-outs
and leveragedbuy-ins.
As this type of finance is usually initially provided through a commitment, we have both funded and unfunded exposures on these transactions.The following table sets forth our exposure to leveraged finance with unfunded commitments, presenting funded and unfunded
portions by geographic location of the target company as of September 30, 2021.
Millions of yen | ||||||||||||
September 30, 2021 | ||||||||||||
Funded | Unfunded | Total | ||||||||||
Europe | ¥ | 4,480 | ¥ | 330,012 | ¥ | 334,492 | ||||||
Americas | 9,196 | 101,795 | 110,991 | |||||||||
Asia and Oceania | 17,619 | 58,055 | 75,674 | |||||||||
Total | ¥ | 31,295 | ¥ | 489,862 | ¥ | 521,157 | ||||||
Special Purpose Entities (“SPEs”)
Our involvement with these entities includes structuring, underwriting, distributing and selling debt instruments and beneficial interests issued by these entities, subject to prevailing market conditions. In connection with our securitization and equity derivative activities, we also act as a transferor of financial assets to these entities, as well as, underwriter, distributor and seller of asset-repackaged financial instruments issued by these entities. We retain, purchase and sell variable interests in SPEs in connection with our market-making, investing and structuring activities. Our other types of involvement with SPEs include guarantee agreements and derivative contracts.
For further discussion on Nomura’s involvement with variable interest entities (“VIEs”), see Note 6. “” included in our interim consolidated financial statements.
Securitizations and Variable Interest Entities
Accounting Developments
See Note 1in our interim consolidated financial statements.
“Summary of accounting policies: New accounting pronouncements recently adopted”
20
Deferred Tax Assets Information
Details of deferred tax assets and liabilities
The following table presents details of deferred tax assets and liabilities reported withinand, respectively, in the consolidated balance sheets as of September 30, 2021.
Other assets—Other
Other liabilities
Millions of yen | ||||
September 30, 2021 | ||||
Deferred tax assets | ||||
Depreciation, amortization and valuation of fixed assets | ¥ | 27,586 | ||
Investments in subsidiaries and affiliates | 20,738 | |||
Valuation of financial instruments | 72,767 | |||
Accrued pension and severance costs | 19,956 | |||
Other accrued expenses and provisions | 64,174 | |||
Operating losses | 405,134 | |||
Lease liabilities | 50,408 | |||
Other | 10,985 | |||
Gross deferred tax assets | 671,748 | |||
Less—Valuation allowance | (478,801 | ) | ||
Total deferred tax assets | 192,947 | |||
Deferred tax liabilities | ||||
Investments in subsidiaries and affiliates | 93,162 | |||
Valuation of financial instruments | 52,774 | |||
Undistributed earnings of foreign subsidiaries | 2,618 | |||
Valuation of fixed assets | 23,083 | |||
Right-of-use | 49,764 | |||
Other | 5,447 | |||
Total deferred tax liabilities | 226,848 | |||
Net deferred tax assets (liabilities) | ¥ | (33,901 | ) | |
Calculation method of deferred tax assets
In accordance with U. S. GAAP, we recognize deferred tax assets to the extent we believe that it is more likely than not that a benefit will be realized. A valuation allowance is provided for tax benefits available to us, which are not deemed more likely than not to be realized.
Legal Proceedings
For a discussion of our litigation and related matters, see Note 15 “” in our interim consolidated financial statements.
Commitments, contingencies and guarantees
21
Liquidity and Capital Resources
Funding and Liquidity Management
Overview
We define liquidity risk as the risk of loss arising from difficulty in securing the necessary funding or from a significantly higher cost of funding than normal levels due to deterioration of the Nomura Group’s creditworthiness or deterioration in market conditions. This risk could arise from Nomura-specific or market-wide events such as inability to access the secured or unsecured debt markets, a deterioration in our credit ratings, a failure to manage unplanned changes in funding requirements, a failure to liquidate assets quickly and with minimal loss in value, or changes in regulatory capital restrictions which may prevent the free flow of funds between different group entities. Our global liquidity risk management policy is based on liquidity risk appetite formulated by the Executive Management Board (“EMB”). Nomura’s liquidity risk management, under market-wide stress and in addition, under Nomura-specific stress, seeks to ensure enough continuous liquidity to meet all funding requirements and unsecured debt obligations across one year and
30-day
periods, respectively, without raising funds through unsecured funding or through the liquidation of assets. We are required to meet regulatory notice on the liquidity coverage ratio issued by the FSA.We have in place a number of liquidity risk management frameworks that enable us to achieve our primary liquidity objective. These frameworks include (1) Centralized Control of Residual Cash and Maintenance of Liquidity Portfolio; (2) Utilization of Unencumbered Assets as Part of Our Liquidity Portfolio; (3) Appropriate Funding and Diversification of Funding Sources and Maturities Commensurate with the Composition of Assets; (4) Management of Credit Lines to Nomura Group Entities; (5) Implementation of Liquidity Stress Tests; and (6) Contingency Funding Plan.
Our EMB has the authority to make decisions concerning group liquidity management. The Chief Financial Officer (“CFO”) has the operational authority and responsibility over our liquidity management based on decisions made by the EMB.
1. Centralized Control of Residual Cash and Maintenance of Liquidity Portfolio.
We centrally control residual cash held at Nomura Group entities for effective liquidity utilization purposes. As for the usage of funds, the CFO decides the maximum amount of available funds, provided without posting any collateral, for allocation within Nomura and the EMB allocates the funds to each business division. Global Treasury monitors usage by businesses and reports to the EMB.
In order to enable us to transfer funds smoothly between group entities, we limit the issuance of securities by regulated broker-dealers or banking entities within the Nomura Group and seek to raise unsecured funding primarily through the Company or through unregulated subsidiaries. The primary benefits of this strategy include cost minimization, wider investor name recognition and greater flexibility in providing funding to various subsidiaries across the Nomura Group.
To meet any potential liquidity requirement, we maintain a liquidity portfolio, managed by Global Treasury apart from other assets, in the form of cash and highly liquid, unencumbered securities that may be sold or pledged to provide liquidity. As of September 30, 2021, our liquidity portfolio was ¥7,025.9 billion which sufficiently met liquidity requirements under the stress scenarios.
The following table presents a breakdown of our liquidity portfolio by type of financial assets as of March 31, 2021 and September 30, 2021 and averages maintained for the years ended March 31, 2021 and September 30, 2021. Yearly averages are calculated using
month-end
amounts.Billions of yen | ||||||||||||||||
Average for year ended March 31, 2021 | March 31, 2021 | Average for six months ended September 30, 2021 | September 30, 2021 | |||||||||||||
Cash, cash equivalents and time deposits (1) | ¥ | 2,775.9 | ¥ | 2,765.0 | ¥ | 3,140.5 | ¥ | 3,641.3 | ||||||||
Government securities | 3,082.8 | 2,641.2 | 3,460.8 | 3,109.3 | ||||||||||||
Others (2) | 254.0 | 252.1 | 243.3 | 275.2 | ||||||||||||
Total liquidity portfolio | ¥ | 6,112.7 | ¥ | 5,658.3 | ¥ | 6,844.6 | ¥ | 7,025.9 | ||||||||
| (1) | Cash, cash equivalents, and time deposits include nostro balances and deposits with both central banks and market counterparties that are readily available to support the liquidity position of Nomura. |
| (2) | Others include other liquid financial assets such as money market funds and U.S. agency securities. |
22
The following table presents a breakdown of our liquidity portfolio by currency as of March 31, 2021 and September 30, 2021 and averages maintained for the years ended March 31, 2021 and September 30, 2021. Yearly averages are calculated using
month-end
amounts.Billions of yen | ||||||||||||||||
Average for year ended March 31, 2021 | March 31, 2021 | Average for six months ended September 30, 2021 | September 30, 2021 | |||||||||||||
Japanese Yen | ¥ | 2,298.1 | ¥ | 966.5 | ¥ | 2,010.8 | ¥ | 2,158.2 | ||||||||
U.S. Dollar | 2,441.2 | 3,367.1 | 3,262.3 | 3,240.5 | ||||||||||||
Euro | 795.1 | 793.5 | 800.4 | 797.1 | ||||||||||||
British Pound | 405.4 | 333.8 | 565.1 | 577.7 | ||||||||||||
Others (1) | 172.9 | 197.5 | 206.0 | 252.5 | ||||||||||||
Total liquidity portfolio | ¥ | 6,112.7 | ¥ | 5,658.3 | ¥ | 6,844.6 | ¥ | 7,025.9 | ||||||||
| (1) | Includes other currencies such as the Australian dollar, the Canadian dollar and the Swiss franc. |
We assess our liquidity portfolio requirements globally as well as by each major operating entity in the Nomura Group. We primarily maintain our liquidity portfolio at Nomura Holdings, Inc. (“NHI”) and Nomura Securities Co. Ltd. (“NSC”), our other major broker-dealer subsidiaries, our bank subsidiaries, and other group entities. In determining the amounts and entities which hold this liquidity portfolio, we consider legal, regulatory and tax restrictions which may impact our ability to freely transfer liquidity across different entities in the Nomura Group.
The following table presents a breakdown of our liquidity portfolio by entity as of March 31, 2021 and September 30, 2021.
Billions of yen | ||||||||
March 31, 2021 | September 30, 2021 | |||||||
NHI and NSC (1) | ¥ | 981.8 | ¥ | 2,243.6 | ||||
Major broker-dealer subsidiaries | 2,632.6 | 2,924.2 | ||||||
Bank subsidiaries (2) | 752.6 | 836.1 | ||||||
Other affiliates | 1,291.3 | 1,022.0 | ||||||
Total liquidity portfolio | ¥ | 5,658.3 | ¥ | 7,025.9 | ||||
| (1) | NSC, a broker-dealer located in Japan, holds an account with the Bank of Japan (“BOJ”) and has direct access to the BOJ Lombard facility through which same day funding is available for our securities pool. Any liquidity surplus at NHI is lent to NSC via short-term intercompany loans, which can be unwound immediately when needed. |
| (2) | Includes Nomura Bank International plc (“NBI”), Nomura Singapore Limited and Nomura Bank Luxembourg S.A. |
2. Utilization of Unencumbered Assets as Part of Our Liquidity Portfolio.
In addition to our liquidity portfolio, we had ¥2,532.1 billion of other unencumbered assets comprising mainly of unpledged trading assets that can be used as an additional source of secured funding. Global Treasury monitors other unencumbered assets and can, under a liquidity stress event when the contingency funding plan has been invoked, monetize and utilize the cash generated as a result. The aggregate of our liquidity portfolio and other unencumbered assets as of September 30, 2021 was ¥9,558.0 billion, which represented 357.8% of our total unsecured debt maturing within one year.
Billions of yen | ||||||||
March 31, 2021 | September 30, 2021 | |||||||
Net liquidity value of other unencumbered assets | ¥ | 2,771.6 | ¥ | 2,532.1 | ||||
Liquidity portfolio | 5,658.3 | 7,025.9 | ||||||
Total | ¥ | 8,429.9 | ¥ | 9,558.0 | ||||
23
3. Appropriate Funding and Diversification of Funding Sources and Maturities Commensurate with the Composition of Assets
We seek to maintain a surplus of long-term debt and equity above the cash capital requirements of our assets. We also seek to achieve diversification of our funding by market, instrument type, investors, currency, and staggered maturities in order to reduce unsecured refinancing risk.
We diversify funding by issuing various types of debt instruments—these include both structured loans and structured notes with returns linked to interest rates, currencies, equities, commodities, or related indices. We issue structured loans and structured notes in order to increase the diversity of our debt instruments. We typically hedge the returns we are obliged to pay with derivatives and/or the underlying assets to obtain funding equivalent to our unsecured long-term debt. The proportion of our
non-Japanese
Yen denominated long-term debt increased to 47.4% of total long-term debt outstanding as of September 30, 2021 from 47.2% as of March 31, 2021.3.1 Short-Term Unsecured Debt
Our short-term unsecured debt consists of short-term bank borrowings (including long-term bank borrowings maturing within one year), other loans, commercial paper, deposit at banking entities, certificates of deposit and debt securities maturing within one year. Deposits at banking entities and certificates of deposit comprise customer deposits and certificates of deposit of our banking subsidiaries. Short-term unsecured debt includes the current portion of long-term unsecured debt.
The following table presents an analysis of our short-term unsecured debt by type of financial liability as of March 31, 2021 and September 30, 2021.
Billions of yen | ||||||||
March 31, 2021 | September 30, 2021 | |||||||
Short-term bank borrowings | ¥ | 265.8 | ¥ | 105.8 | ||||
Other loans | 138.7 | 197.4 | ||||||
Commercial paper | 460.0 | 263.8 | ||||||
Deposits at banking entities | 1,149.9 | 1,227.5 | ||||||
Certificates of deposit | 83.6 | 135.6 | ||||||
Debt securities maturing within one year | 831.5 | 741.5 | ||||||
Total short-term unsecured debt | ¥ | 2,929.5 | ¥ | 2,671.6 | ||||
3.2 Long-Term Unsecured Debt
We meet our long-term capital requirements and also achieve both cost-effective funding and an appropriate maturity profile by routinely funding through long-term debt and diversifying across various maturities and currencies.
Our long-term unsecured debt includes senior and subordinated debt issued through U.S. registered shelf offerings and our U.S. registered medium-term note programs, our Euro medium-term note programs, registered shelf offerings in Japan and various other debt programs.
As a globally competitive financial services group in Japan, we have access to multiple global markets and major funding centers. The Company, NSC, Nomura Europe Finance N.V., NBI, Nomura International Funding Pte. Ltd. and Nomura Global Finance Co., LTD. are the main group entities that borrow externally, issue debt instruments and engage in other funding activities. By raising funds to match the currencies and liquidities of our assets or by using foreign exchange swaps as necessary, we pursue optimization of our funding structures.
We use a wide range of products and currencies to ensure that our funding is efficient and well diversified across markets and investor types. Our unsecured senior debt is mostly issued without financial covenants, such as covenants related to adverse changes in our credit ratings, cash flows, results of operations or financial ratios, which could trigger an increase in our cost of financing or accelerate repayment of the debt.
24
The following table presents an analysis of our long-term unsecured debt by type of financial liability as of March 31, 2021 and September 30, 2021.
Billions of yen | ||||||||
March 31, 2021 | September 30, 2021 | |||||||
Long-term deposits at banking entities | ¥ | 109.0 | ¥ | 100.6 | ||||
Long-term bank borrowings | 2,635.2 | 2,717.9 | ||||||
Other loans | 74.2 | 130.3 | ||||||
Debt securities (1) | 3,877.9 | 4,398.8 | ||||||
Total long-term unsecured debt | ¥ | 6,696.3 | ¥ | 7,347.6 | ||||
| (1) | Excludes long-term debt securities issued by consolidated special purpose entities and similar entities that meet the definition of variable interest entities under ASC 810 “ Consolidation Long-term borrowings Transfer and Servicing. |
3.3 Maturity Profile
We also seek to maintain an average maturity for our plain vanilla debt securities and borrowings greater than or equal to three years. The average maturity for our plain vanilla debt securities and borrowings with maturities longer than one year was 4.4 years as of September 30, 2021. A significant amount of our structured loans and structured notes are linked to interest rates, currencies, equities, commodities, or related indices. These maturities are evaluated based on internal models and monitored by Global Treasury. Where there is a possibility that these may be called prior to their scheduled maturity date, maturities are based on our internal stress option adjusted model. The model values the embedded optionality under stress market conditions in order to determine when the debt securities or borrowing is likely to be called. The graph below shows the distribution of maturities of our outstanding long-term debt securities and borrowings by the model.
On this basis, the average maturity of our structured loans and structured notes with maturities longer than one year was 6.0 years as of September 30, 2021. The average maturity of our entire long-term debt with maturities longer than one year including plain vanilla debt securities and borrowings, was 5.2 years as of September 30, 2021.

3.4 Secured Funding
We typically fund our trading activities through secured borrowings, repurchase agreements and Japanese “Gensaki Repo” transactions. We believe such funding activities in the secured markets are more cost-efficient and less credit-rating sensitive than financing in the unsecured market. Our secured funding capabilities depend on the quality of the underlying collateral and market conditions. While we have shorter term secured financing for highly liquid assets, we seek longer terms for less liquid assets. We also seek to lower the refinancing risks of secured funding by transacting with a diverse group of global counterparties and delivering various types of securities collateral. In addition, we reserve an appropriate level of liquidity portfolio for the refinancing risks of secured funding maturing in the short term for less liquid assets. For more detail of secured borrowings and repurchase agreements, see Note 5 “” in our consolidated financial statements.
Collateralized transactions
25
4. Management of Credit Lines to Nomura Group Entities
We maintain and expand credit lines to Nomura Group entities from other financial institutions to secure stable funding. We ensure that the maturity dates of borrowing agreements are distributed evenly throughout the year in order to prevent excessive maturities in any given period.
5. Implementation of Liquidity Stress Tests
We maintain our liquidity portfolio and monitor the sufficiency of our liquidity based on an internal model which simulates changes in cash outflow under specified stress scenarios to comply with our above mentioned liquidity management policy.
We assess the liquidity requirements of the Nomura Group under various stress scenarios with differing levels of severity over multiple time horizons. We evaluate these requirements under Nomura-specific and broad market-wide events, including potential credit rating downgrades at the Company and subsidiary levels. We call this risk analysis our Maximum Cumulative Outflow (“MCO”) framework.
The MCO framework is designed to incorporate the primary liquidity risks for Nomura and models the relevant future cash flows in the following two primary scenarios:
| • | Stressed scenario—To maintain adequate liquidity during a severe market-wide liquidity event without raising funds through unsecured financing or through the liquidation of assets for a year; and |
| • | Acute stress scenario—To maintain adequate liquidity during a severe market-wide liquidity event coupled with credit concerns regarding Nomura’s liquidity position, without raising funds through unsecured funding or through the liquidation of assets for 30 days. |
We assume that Nomura will not be able to liquidate assets or adjust its business model during the time horizons used in each of these scenarios. The MCO framework therefore defines the amount of liquidity required to be held in order to meet our expected liquidity needs in a stress event to a level we believe appropriate based on our liquidity risk appetite.
As of September 30, 2021, our liquidity portfolio exceeded net cash outflows under the stress scenarios described above.
We constantly evaluate and modify our liquidity risk assumptions based on regulatory and market changes. The model we use in order to simulate the impact of stress scenarios includes the following assumptions:
| • | No liquidation of assets; |
| • | No ability to issue additional unsecured funding; |
| • | Upcoming maturities of unsecured debt (maturities less than one year); |
| • | Potential buybacks of our outstanding debt; |
| • | Loss of secured funding lines particularly for less liquid assets; |
| • | Fluctuation of funding needs under normal business circumstances; |
| • | Cash deposits and free collateral roll-off in a stress event; |
| • | Widening of haircuts on outstanding repo funding; |
| • | Additional collateralization requirements of clearing banks and depositories; |
| • | Drawdown on loan commitments; |
| • | Loss of liquidity from market losses; |
| • | Assuming a two-notch downgrade of our credit ratings, the aggregate fair value of assets that we would be required to post as additional collateral in connection with our derivative contracts; and |
| • | Legal and regulatory requirements that can restrict the flow of funds between entities in the Nomura Group. |
26
6. Contingency Funding Plan
We have developed a detailed contingency funding plan to integrate liquidity risk control into our comprehensive risk management strategy and to enhance the quantitative aspects of our liquidity risk control procedures. As a part of our Contingency Funding Plan (“CFP”), we have developed an approach for analyzing and quantifying the impact of any liquidity crisis. This allows us to estimate the likely impact of both Nomura-specific and market-wide events; and specifies the immediate action to be taken to mitigate any risk. The CFP lists details of key internal and external parties to be contacted and the processes by which information is to be disseminated. This has been developed at a legal entity level in order to capture specific cash requirements at the local level—it assumes that our parent company does not have access to cash that may be trapped at a subsidiary level due to regulatory, legal or tax constraints. We periodically test the effectiveness of our funding plans for different Nomura-specific and market-wide events. We also have access to central banks including, but not exclusively, the BOJ, which provide financing against various types of securities. These operations are accessed in the normal course of business and are an important tool in mitigating contingent risk from market disruptions.
Liquidity Regulatory Framework
In 2008, the Basel Committee published “Principles for Sound Liquidity Risk Management and Supervision”. To complement these principles, the Committee has further strengthened its liquidity framework by developing two minimum standards for funding liquidity. These standards have been developed to achieve two separate but complementary objectives.
The first objective is to promote short-term resilience of a financial institution’s liquidity risk profile by ensuring that it has sufficient high-quality liquid assets to survive a significant stress scenario lasting for 30 days. The Committee developed the Liquidity Coverage Ratio (“LCR”) to achieve this objective.
The second objective is to promote resilience over a longer time horizon by creating additional incentives for financial institutions to fund their activities with more stable sources of funding on an ongoing basis. The Net Stable Funding Ratio (“NSFR”) has a time horizon of one year and has been developed to provide a sustainable maturity structure of assets and liabilities.
These two standards are comprised mainly of specific parameters which are internationally “harmonized” with prescribed values. Certain parameters, however, contain elements of national discretion to reflect jurisdiction-specific conditions.
In Japan, the regulatory notice on the LCR, based on the international agreement issued by the Basel Committee with necessary national revisions, was published by Financial Services Agency. The notices have been implemented since the end of March 2015 with
phased-in
minimum standards. Average of Nomura’s LCRs for the three months ended September 30, 2021 was 272.8%, and Nomura was compliant with requirements of the above notices. As for the NSFR, the revision of the liquidity regulatory notice was published by Financial Services Agency (on March 31, 2021) and it has been implemented from the end of September 2021. Nomura’s NSFR as of September 30, 2021 was compliant with the regulatory requirements.27
Cash Flows
Nomura’s cash flows are primarily generated from operating activities undertaken in connection with our client flows and trading and from financing activities which are closely related to such activities. As a financial institution, growth in operations tends to result in cash outflows from operating activities as well as investing activities. For the six months ended September 2020, we recorded net cash inflows from operating activities and net cash outflows from investing activities. For the six months ended September 2021, we recorded net cash outflows from operating activities as well as investing activities as discussed in the comparative analysis below.
The following table presents the summary information on our consolidated cash flows for the six months ended September 30, 2020 and 2021.
Billions of yen | ||||||||
Six months ended September 30 | ||||||||
2020 | 2021 | |||||||
Net cash provided by (used in) operating activities | ¥ | 823.0 | ¥ | (222.6 | ) | |||
Net income | 213.2 | 55.5 | ||||||
Trading assets and private equity and debt investments | 133.7 | (591.6 | ) | |||||
Trading liabilities | 347.7 | 139.8 | ||||||
Securities purchased under agreements to resell, net of securities sold under agreements to repurchase | (458.3 | ) | (409.5 | ) | ||||
Securities borrowed, net of securities loaned | 160.4 | 745.8 | ||||||
Loans and receivables, net of allowance for credit losses | 1,335.7 | (124.0 | ) | |||||
Payables | (568.2 | ) | 47.2 | |||||
Other, net | (341.2 | ) | (85.7 | ) | ||||
Net cash used in investing activities | (4.5 | ) | (5.9 | ) | ||||
Decrease in investments in affiliated companies, net | (9.7 | ) | 49.8 | |||||
Other, net | 5.1 | (55.8 | ) | |||||
Net cash provided by (used in) financing activities | (48.6 | ) | 548.1 | |||||
Long-term borrowings, net | 322.9 | 671.3 | ||||||
Short-term borrowings, net | (257.2 | ) | (230.2 | ) | ||||
Other, net | (114.3 | ) | 106.9 | |||||
Effect of exchange rate changes on cash, cash equivalents, restricted cash and restricted cash equivalents | (20.2 | ) | 6.7 | |||||
Net increase in cash, cash equivalents, restricted cash and restricted cash equivalents | 749.6 | 326.2 | ||||||
Cash, cash equivalents, restricted cash and restricted cash equivalents at beginning of year | 3,192.3 | 3,510.0 | ||||||
Cash, cash equivalents, restricted cash and restricted cash equivalents at end of period | ¥ | 3,941.9 | ¥ | 3,836.2 | ||||
See the consolidated statements of cash flows in our consolidated financial statements included within this annual report for more detailed information.
For the six months ended September 30, 2021, our cash, cash equivalents, restricted cash and restricted cash equivalents increased by ¥326.2 billion to ¥3,836.2 billion. There were net cash inflows of ¥548.1 billion from financing activities, primary due to net cash inflows of ¥671.3 billion by an increase inThere were net cash outflows of ¥222.6 billion from operating activities, primary due to an increase of ¥591.6 billion in, offset against a decrease of ¥745.8 billion in.
Long-term borrowings, net.
Trading assets and private equity and debt investments
Securities borrowed, net of securities loaned
For the six months ended September 30, 2020, our cash, cash equivalents, restricted cash and restricted cash equivalents increased by ¥749.6 billion to ¥3,941.9 billion. There were net cash outflows of ¥48.6 billion from financing activities, primary due to net cash outflows of ¥257.2 billion by a decrease inThere were net cash inflows of ¥823.0 billion from operating activities, primary due to a decrease of ¥1,335.7 billion inoffset against
Short-term borrowings, net.
Loans and receivables, net of allowance for credit losses,
net cash outflows of ¥568.2 billion due to a decrease in
Payables.
28
Balance Sheet and Financial Leverage
Total assets as of September 30, 2021, were ¥43,346.6 billion, an increase of ¥830.1 billion compared with ¥42,516.5 billion as of March 31, 2021, primarily due to increases in Trading assets. Total liabilities as of September 30, 2021, were ¥40,544.9 billion, an increase of ¥784.9 billion compared with ¥39,760.0 billion as of March 31, 2021, primarily due to an increase in Long-term borrowings. NHI shareholders’ equity as of September 30, 2021, was ¥2,734.1 billion, an increase of ¥39.1 billion compared with ¥2,694.9 billion as of March 31, 2021, primarily due to an increase in Retained earnings.
We seek to maintain sufficient capital at all times to withstand losses due to extreme market movements. The EMB is responsible for implementing and enforcing capital policies. This includes the determination of our balance sheet size and required capital levels. We continuously review our equity capital base to ensure that it can support the economic risk inherent in our business. There are also regulatory requirements for minimum capital of entities that operate in regulated securities or banking businesses.
As leverage ratios are commonly used by other financial institutions similar to us, we voluntarily provide a Leverage ratio and Adjusted leverage ratio primarily for benchmarking purposes so that users of our annual report can compare our leverage against other financial institutions. Adjusted leverage ratio is a
non-GAAP
financial measure that Nomura considers to be a useful supplemental measure of leverage.The following table presents NHI shareholders’ equity, total assets, adjusted assets and leverage ratios as of March 31, 2021 and September 30, 2021.
Billions of yen, except ratios | ||||||||
March 31, 2021 | September 30, 2021 | |||||||
NHI shareholders’ equity | ¥ | 2,694.9 | ¥ | 2,734.1 | ||||
Total assets | 42,516.5 | 43,346.6 | ||||||
Adjusted assets (1) | 26,477.0 | 27,415.1 | ||||||
Leverage ratio (2) | 15.8 | x | 15.9 | x | ||||
Adjusted leverage ratio (3) | 9.8 | x | 10.0 | x | ||||
| (1) | Represents total assets less Securities purchased under agreements to resell Securities borrowed non-GAAP financial measure and is calculated as follows: |
| (2) | Equals total assets divided by NHI shareholders’ equity. |
| (3) | Equals adjusted assets divided by NHI shareholders’ equity. |
Billions of yen | ||||||||
March 31, 2021 | September 30, 2021 | |||||||
Total assets | ¥ | 42,516.5 | ¥ | 43,346.6 | ||||
Less: | ||||||||
Securities purchased under agreements to resell | 10,775.1 | 11,272.6 | ||||||
Securities borrowed | 5,264.4 | 4,658.9 | ||||||
Adjusted assets | ¥ | 26,477.0 | ¥ | 27,415.1 | ||||
Total assets increased by 2.0% reflecting primarily an increases in Trading assets. NHI shareholders’ equity increased by 1.5% primarily due to an increase in Retained earnings. As a result, our leverage ratio rose from 15.8 times as of March 31, 2021 to 15.9 times as of September 30, 2021.
Adjusted assets increased primarily due to an increase in Trading assets. As a result, our adjusted leverage ratio rose from 9.8 times as of March 31, 2021 to 10.0 times as of September 30, 2021.
29
Capital Management
Capital Management Policy
We seek to enhance shareholder value and to capture growing business opportunities by maintaining sufficient levels of capital. We will continue to review our levels of capital as appropriate, taking into consideration the economic risks inherent to operating our businesses, the regulatory requirements, and maintaining our ratings necessary to operate businesses globally.
Dividends
We believe that raising corporate value over the long term and paying dividends is essential to rewarding shareholders. We will strive to pay dividends using a consolidated
pay-out
ratio of 30 percent of each semi-annual consolidated earnings as a key indicator.Dividend payments are determined taking into account a comprehensive range of factors such as the tightening of Basel regulations and other changes to the regulatory environment as well as the Company’s consolidated financial performance.
Dividends will in principle be paid on a semi-annual basis with record dates of September 30 and March 31.
Additionally we will aim for a total payout ratio, which includes dividends and share buybacks, of at least 50 percent.
With respect to retained earnings, in order to implement measures to adapt to regulatory changes and to increase shareholder value, we seek to efficiently invest in business areas where high profitability and growth may reasonably be expected, including the development and expansion of infrastructure.
Dividends for the Fiscal Year
Based on our Capital Management Policy described above, we paid a dividend of ¥8 per share to shareholders of record as of September 30, 2021.
The following table sets forth the amounts of dividends per share paid by us in respect of the periods indicated:
Fiscal year ended or ending March 31, | First Quarter | Second Quarter | Third Quarter | Fourth Quarter | Total | |||||||||||||||
2017 | ¥ | — | ¥ | 9.00 | ¥ | — | ¥ | 11.00 | ¥ | 20.00 | ||||||||||
2018 | — | 9.00 | — | 11.00 | 20.00 | |||||||||||||||
2019 | — | 3.00 | — | 3.00 | 6.00 | |||||||||||||||
2020 | — | 15.00 | — | 5.00 | 20.00 | |||||||||||||||
2021 | — | 20.00 | — | 15.00 | 35.00 | |||||||||||||||
2022 | — | 8.00 | — | |||||||||||||||||
Consolidated Regulatory Capital Requirements
The FSA established the “Guideline for Financial Conglomerates Supervision” (“Financial Conglomerates Guideline”) in June 2005 and set out the rules on consolidated regulatory capital. We started monitoring our consolidated capital adequacy ratio in accordance with the Financial Conglomerates Guideline from April 2005.
The Company has been assigned by the FSA as a Final Designated Parent Company who must calculate a consolidated capital adequacy ratio according to the Capital Adequacy Notice on Final Designated Parent Company in April 2011. Since then, we have been calculating our consolidated capital adequacy ratio according to the Capital Adequacy Notice on Final Designated Parent Company. The Capital Adequacy Notice on Final Designated Parent Company has been revised to be in line with Basel 2.5 and Basel III since then. We have calculated a Basel
III-based
consolidated capital adequacy ratio from the end of March 2013. Basel 2.5 includes significant change in calculation method of market risk and Basel III includes redefinition of capital items for the purpose of requiring higher quality of capital and expansion of the scope of credit risk-weighted assets calculation.30
In accordance with Article 2 of the Capital Adequacy Notice on Final Designated Parent Company, our consolidated capital adequacy ratio is currently calculated based on the amounts of common equity Tier 1 capital, Tier 1 capital (sum of common equity Tier 1 capital and additional Tier 1 capital), total capital (sum of Tier 1 capital and Tier 2 capital), credit risk-weighted assets, market risk and operational risk. As of September 30, 2021, our common equity Tier 1 capital ratio (common equity Tier 1 capital divided by risk-weighted assets) was 17.70%, Tier 1 capital ratio (Tier 1 capital divided by risk-weighted assets) was 20.26% and consolidated capital adequacy ratio (total capital divided by risk-weighted assets) was 20.29% and we were in compliance with the requirement for each ratio set out in the Capital Adequacy Notice on Final Designated Parent Company (required level as of September 30, 2021 was 7.52% for common equity Tier 1 capital ratio, 9.02% for Tier 1 capital ratio and 11.02% for consolidated capital adequacy ratio).
In accordance with Article 2 of the “Notice of the Establishment of Standards that Indicate Soundness pertaining to Loss-absorbing and Recapitalization Capacity, Established as Criteria by which the Highest Designated Parent Company is to Judge the Soundness in the Management of the Highest Designated Parent Company and its Subsidiary Corporations, etc., under Paragraph 1, Article
57-17
of the Financial Instruments and Exchange Act” (the “TLAC Notification”), we have started calculating our external TLAC ratio on a risk-weighted assets basis from March 2021. As of September 30, 2021, our external TLAC as a percentage of risk-weighted assets is 29.40% and we are in compliance with the requirement set out in the TLAC Notification.The following table presents the Company’s consolidated capital adequacy ratios and External TLAC as a percentage of risk-weighted assets as of March 31, 2021 and September 30, 2021.
Billions of yen, except ratios | ||||||||
March 31, 2021 | September 30, 2021 (1) | |||||||
Common equity Tier 1 capital | ¥ | 2,522.1 | ¥ | 2,602.7 | ||||
Tier 1 capital | 2,840.5 | 2,979.3 | ||||||
Total capital | 2,845.2 | 2,983.7 | ||||||
Risk-Weighted Assets | ||||||||
Credit risk-weighted assets | 8,550.9 | 7,817.4 | ||||||
Market risk equivalent assets | 4,951.6 | 4,352.6 | ||||||
Operational risk equivalent assets | 2,448.5 | 2,533.2 | ||||||
Total risk-weighted assets | ¥ | 15,951.0 | ¥ | 14,703.2 | ||||
Consolidated Capital Adequacy Ratios | ||||||||
Common equity Tier 1 capital ratio | 15.81 | % | 17.70 | % | ||||
Tier 1 capital ratio | 17.80 | % | 20.26 | % | ||||
Consolidated capital adequacy ratio | 17.83 | % | 20.29 | % | ||||
External TLAC as a percentage of risk-weighted assets | 23.06 | % | 29.40 | % | ||||
Since the end of March 2011, we have been calculating credit risk-weighted assets and operational risk equivalent assets by using the foundation Internal Ratings-Based Approach and the Standardized Approach, respectively, with the approval of the FSA. Furthermore, Market risk equivalent assets are calculated by using the Internal Models Approach for market risk.
We provide consolidated capital adequacy ratios not only to demonstrate that we are in compliance with the requirements set out in the Capital Adequacy Notice on Final Designated Parent Company but also for benchmarking purposes so that users of this annual report can compare our capital position against those of other financial groups to which Basel III is applied. Management receives and reviews these capital ratios on a regular basis.
31
Consolidated Leverage Ratio Requirements
In March 2019, the FSA set out requirements for the calculation and disclosure and minimum requirement of 3% of a consolidated leverage ratio, and the publication of “Notice of the Establishment of Standards for Determining Whether the Adequacy of Leverage, the Supplementary Measure to the Adequacy of Equity Capital of a Final Designated Parent Company and its Subsidiary Corporations, etc. is Appropriate Compared to the Assets Held by the Final Designated Parent Company and its Subsidiary Corporations, etc., under Paragraph 1, Article
57-17
of the Financial Instruments and Exchange Act” (2019 FSA Regulatory Notice No. 13; “Notice on Consolidated Leverage Ratio”), through amendments to revising “Specification of items which a final designated parent company should disclose on documents to show the status of its sound management” (2010 FSA Regulatory Notice No. 132; “Notice on Pillar 3 Disclosure”). We started calculating and disclosing a consolidated leverage ratio from March 31, 2015 in accordance with these Notices. We have also started calculating a consolidated leverage ratio from March 31, 2019 in accordance with the Notice on Pillar 3 Disclosure, Notice on Consolidated Leverage Ratio and other related Notices. In June 2020, in coordination with the monetary policy of the Bank of Japan in response to the impact of theCOVID-19
pandemic, the FSA published amendments to the Notice on Consolidated Leverage Ratio. Under these amendments, deposits with the Bank of Japan have been excluded from the total exposures measure used to calculate the leverage ratio during the period from June 30, 2020 to March 31, 2021. In March 2021, the FSA announced this measure will be extended for one year due to the continuous uncertainly regarding the impact ofCOVID-19.
As of September 30, 2021, our consolidated leverage ratio is 5.90%.In accordance with Article 2 of the TLAC Notification we have started calculating our external TLAC ratio on a total exposure basis from March 2021. As of September 30, 2021, our external TLAC as a percentage of leverage ratio exposure measure is 9.45% and we are in compliance with the requirement set out in the TLAC Notification.
32
Regulatory changes which affect us
The Basel Committee has issued a series of announcements regarding a Basel III program designed to strengthen the regulatory capital framework in light of weaknesses revealed by the financial crises. The following is a summary of the proposals which are most relevant to us.
On December 16, 2010, in an effort to promote a more resilient banking sector, the Basel Committee issued Basel III, that is, “International framework for liquidity risk measurement, standards and monitoring” and “A global regulatory framework for more resilient banks and banking systems”. They include raising the quality, consistency and transparency of the capital base; strengthening the risk coverage of the capital framework such as the implementation of a credit value adjustment (“CVA”) charge for OTC derivative trades; introducing a leverage ratio requirement as a supplemental measure to the risk-based framework; introducing a series of measures to address concerns over the “procyclicality” of the current framework; and introducing a minimum liquidity standard including a
30-day
liquidity coverage ratio as well as a longer-term structural liquidity ratio. These standards were implemented from 2013, which includes transitional treatment, (i.e. they are phased in gradually from 2013). In addition, the Basel Committee has issued interim rules for the capitalization of bank exposures to central counterparties (“CCPs”) on July 25, 2012, which came into effect in 2013 as part of Basel III. Moreover, in addition to Basel III leverage ratio framework under which we started the calculation and disclosure of consolidated leverage ratio as above, a series of final standards on the regulatory frameworks such as capital requirements for banks’ equity investments in funds, the standardized approach for measuring counterparty credit risk exposures, capital requirements for bank exposures to CCPs, supervisory framework for measuring and controlling large exposures, Basel III: The Net Stable Funding Ratio and revisions to the securitization framework, and revised framework for market risk capital requirements have been published by the Basel Committee.At the
G-20
summit in November 2011, the Financial Stability Board (“FSB”) and the Basel Committee announced the list of global systemically important banks(“G-SIBs”)
and the additional requirements to theG-SIBs
including the recovery and resolution plan. The group ofG-SIBs
have been updated annually and published by the FSB each November. Since November 2011, we have not been designated as aG-SIBs.
On the other hand, the FSB and the Basel Committee were asked to work on extending the framework forG-SIBs
to domestic systemically important financial institutions(“D-SIBs”)
and the Basel Committee developed and published a set of principles on the assessment methodology and the higher loss absorbency requirement forD-SIBs.
In December 2015, the FSA identified us as aD-SIB
and required additional capital charge of 0.5% after March 2016, with3-year
transitional arrangement.In November 2015, the FSB issued the final TLAC standard for
G-SIBs.
The TLAC standard has been designed so that failingG-SIBs
will have sufficient loss-absorbing and recapitalization capacity available in resolution for authorities to implement an orderly resolution. In response to the FSB’s publication of the TLAC standard, in April 2016, the FSA published its policy to develop the TLAC framework in Japan applicable to JapaneseG-SIBs
and, in April 2018, revised such policy to apply the TLAC requirements in Japan not only to JapaneseG-SIBs
but also to JapaneseD-SIBs
that are deemed (i) of particular need for a cross-border resolution arrangement and (ii) of particular systemic significance to Japanese financial system if they fail. In the revised policy, the JapaneseG-SIBs
and Nomura (“TLAC Covered SIBs”) would be subject to the TLAC requirements in Japan. On March 2019, the FSA published the notices and revised the guidelines of TLAC regulations. Although Nomura is not identified as aG-SIB
as of the date of this annual report, the TLAC Covered SIBs, including Nomura, are required to meet the TLAC requirement alongside the minimum regulatory requirements set out in the Basel III framework. Specifically, Nomura is required to meet a minimum TLAC requirement of holding TLAC in an amount at least 16% of our consolidated risk-weighted assets as from March 31, 2021 and at least 18% as from March 31, 2024 as well as at least 6% of the applicable Basel III leverage ratio denominator from March 31, 2021 and at least 6.75% from March 31, 2024.Furthermore, according to the FSA’s revised policy published in April 2018, which is subject to change based on future international discussions, the preferred resolution strategy for the TLAC Covered SIBs is Single Point of Entry (“SPE”) resolution, in which resolution powers are applied to the top of a group by a single national resolution authority (i.e. the FSA), although the actual measures to be taken will be determined on abasis considering the actual condition of the relevant the TLAC Covered SIBs in crisis.
case-by-case
To implement this SPE resolution strategy effectively, the FSA requires holding companies of the TLAC Covered SIBs (“Domestic Resolution Entities”) to (i) meet the minimum external TLAC requirements and (ii) cause their material subsidiaries that are designated as systemically important by the FSA, including but not limited to certain material
sub-groups
as provided in the FSB’s TLAC standard, to maintain a certain level of capital and debt recognized by the FSA as having loss-absorbing and recapitalization capacity, or Internal TLAC.33
In addition, the TLAC Covered SIBs’ Domestic Resolution Entities will be allowed to count the amount equivalent to 2.5% of their consolidated risk-weighted assets from the implementation date of the TLAC requirements in Japan (March 31, 2021 for Nomura) and 3.5% of their consolidated risk-weighted assets from 3 years after the implementation date (March 31, 2024 for Nomura) as our external TLAC, considering the Japanese Deposit Insurance Fund Reserves.
It is likely that the FSA’s regulation and notice will be revised further to be in line with a series of rules and standards proposed by the Basel Committee, FSB or International Organization of Securities Commissions.
34
Credit Ratings
The cost and availability of unsecured funding are generally dependent on credit ratings. Our short-term and long-term debt is rated by several recognized credit rating agencies. We believe that our credit ratings include the credit ratings agencies’ assessment of the general operating environment, our positions in the markets in which we operate, reputation, earnings structure, trend and volatility of our earnings, risk management framework, liquidity and capital management. An adverse change in any of these factors could result in a downgrade of our credit ratings, and that could, in turn, increase our borrowing costs and limit our access to the capital markets or require us to post additional collateral and permit counterparties to terminate transactions pursuant to certain contractual obligations. In addition, our credit ratings can have a significant impact on certain of our trading revenues, particularly in those businesses where longer term counterparty performance is critical, such as OTC derivative transactions.
As of November 13, 2021, the credit ratings of the Company and NSC were as follows:
Nomura Holdings, Inc. | Short-term Debt | Long-term Debt | ||
S&P Global Ratings | A-2 | BBB+ (Stable) | ||
Moody’s Investors Service | — | Baa1 (Negative) | ||
Fitch Ratings | F1 | A- (Stable) | ||
Rating and Investment Information, Inc. | a-1 | A (Stable) | ||
Japan Credit Rating Agency, Ltd. | — | AA- (Stable) | ||
Nomura Securities Co., Ltd. | Short-term Debt | Long-term Debt | ||
S&P Global Ratings | A-2 | A- (Stable) | ||
Moody’s Investors Service | P-2 | A3 (Negative) | ||
Fitch Ratings | F1 | A- (Stable) | ||
Rating and Investment Information, Inc. | a-1 | A+ (Stable) | ||
Japan Credit Rating Agency, Ltd. | — | AA- (Stable) | ||
Both Rating and Investment Information, Inc. and Japan Credit Rating Agency, Ltd. are credit rating agencies nationally recognized in Japan. We rely on, or utilize, credit ratings on our long-term and short-term debt provided by these Japanese credit rating agencies, as well as S&P Global Ratings, Moody’s Investors Service, and Fitch Ratings for unsecured funding and other financing purposes and also for our trading and other business activities.
On September 2, 2021, Fitch Ratings removed the negative watch on the bbb+ viability ratings of the Company and NSC.
35
Off-Balance
Sheet ArrangementsOff-balance
sheet entitiesIn the normal course of business, we engage in a variety of
off-balance
sheet arrangements withoff-balance
sheet entities which may have an impact on Nomura’s future financial position and performance.Off-balance
sheet arrangements withoff-balance
sheet entities include where Nomura has:| • | an obligation under a guarantee contract; |
| • | a retained or contingent interest in assets transferred to an off-balance sheet entity or similar arrangement that serves to provide credit, liquidity or market risk support to such entity; |
| • | any obligation, including a contingent obligation, under a contract that would be accounted for as a derivative instrument; or |
| • | any obligation, including a contingent obligation, arising out of a variable interest in an off-balance sheet entity that is held by, and material to, us, where such entity provides financing, liquidity, market risk or credit risk support to, or engages in leasing, hedging or research and development services with, us. |
Off-balance
sheet entities may take the form of a corporation, partnership, fund, trust or other legal vehicle which is designed to fulfill a limited, specific purpose by its sponsor. We both create or sponsor these entities and also enter into arrangements with entities created or sponsored by others.Our involvement with these entities includes structuring, underwriting, distributing and selling debt instruments and beneficial interests issued by these entities, subject to prevailing market conditions. In connection with our securitization and equity derivative activities, we also act as a transferor of financial assets to these entities, as well as, underwriter, distributor and seller of asset-repackaged financial instruments issued by these entities. We retain, purchase and sell variable interests in SPEs in connection with our market-making, investing and structuring activities. Our other types of
off-balance
sheet arrangements include guarantee agreements and derivative contracts. Significant involvement is assessed based on all of our arrangements with these entities, even if the probability of loss, as assessed at the balance sheet date, is remote.For further information about transactions with VIEs, see Note 6 “” in our interim consolidated financial statements.
Securitizations and Variable Interest Entities
Contractual Obligations
Since March 31, 2021, there have been no other material changes outside our ordinary course of business in connection with our standby letters of credit and other guarantees, long-term borrowings and contractual interest payments, operating lease commitments, finance lease commitments, purchase obligations, commitments to extend credit and commitments to invest in partnerships.
For further details on our commitments, contingencies and guarantees, see Note 15 “” in our interim consolidated financial statements.
Commitments, contingencies and guarantees
36
Quantitative and Qualitative Disclosures about Market, Credit and Other Risk
Risk Management
Nomura defines risks as (i) the potential erosion of Nomura’s capital base due to unexpected losses arising from risks to which its business operations are exposed, such as market risk, credit risk, operational risk and model risk, (ii) liquidity risk, the potential lack of access to funds or higher cost of funding than normal levels due to a deterioration in Nomura’s creditworthiness or deterioration in market conditions, and (iii) strategic risk, the potential failure of revenues to cover costs due to a deterioration in the earnings environment or a deterioration in the efficiency or effectiveness of its business operations.
A fundamental principle established by Nomura is that all employees shall regard themselves as principals of risk management and appropriately manage these risks. Nomura seeks to promote a culture of proactive risk management throughout all levels of the organization and to limit risks to the confines of its risk appetite. The risk management framework that Nomura uses to manage these risks consists of its risk appetite, risk management governance and oversight, the management of financial resources, the management of all risk classes, and processes to measure and control risks. Each of these key components is explained in further detail below.
Risk Appetite
Nomura has determined the types and levels of risk that it will assume in pursuit of its strategic objectives and business plan and has articulated this in its Risk Appetite Statement. This document is jointly submitted by the Chief Risk Officer (“CRO”), the Chief Financial Officer (“CFO”) and the Chief Compliance Officer (“CCO”) to the Executive Management Board (“EMB”) for approval.
The Risk Appetite Statement provides an aggregated view of risk and includes capital adequacy, liquidity, financial risk and
non-financial
risk. It is subject to regular monitoring and breach escalation as appropriate by the owner of the relevant risk appetite statement.Nomura’s Risk Appetite Statement is required to be reviewed at least annually by the EMB but it is reviewed on an ad hoc basis if necessary, and must specifically be reviewed following any significant changes in Nomura’s strategy. Risk appetite underpins all additional aspects of Nomura’s risk management framework.
37
Risk Management Governance and Oversight
Committee Governance
Nomura has established a committee structure to facilitate effective business operations and management of Nomura’s risks. The formal governance structure for risk management within Nomura is as follows:
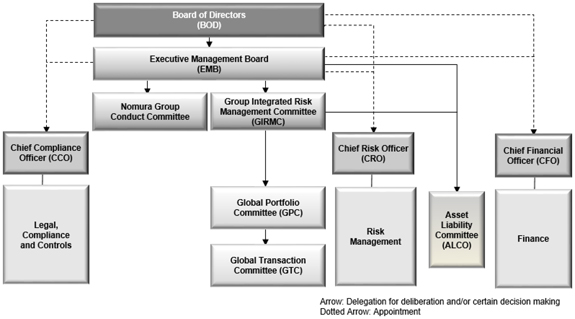
Board of Directors (“BoD”)
The BoD determines the policy for the execution of the business of Nomura and other matters prescribed in laws and regulations, supervises the execution of Directors’ and Executive Officers’ duties and has the authority to adopt, alter or abolish the regulations of the EMB.
Executive Management Board (“EMB”)
The EMB deliberates on and determines management strategy, the allocation of management resources and important management matters of Nomura, and seeks to increase shareholder value by promoting effective use of management resources and unified decision-making with regard to the execution of business. The EMB delegates responsibility for deliberation of matters concerning risk management to the Group Integrated Risk Management Committee (“GIRMC”). Key responsibilities of the EMB include the following:
| • | Resource Allocation—At the beginning of each financial year, the EMB determines the allocation of management resources and financial resources such as risk-weighted asset and unsecured funding to business units and establishes usage limits for these resources; |
| • | Business Plan—At the beginning of each financial year, the EMB approves the business plan and budget of Nomura. Introduction of significant new businesses, changes to business plans, the budget and the allocation of management resources during the year are also approved by the EMB; and |
| • | Reporting—The EMB reports the status of its deliberations to the BoD. |
Group Integrated Risk Management Committee (“GIRMC”)
Upon delegation from the EMB, the GIRMC deliberates on or determines important matters concerning integrated risk management of Nomura to assure the sound and effective management of its businesses. The GIRMC establishes a framework of integrated risk management consistent with Nomura’s risk appetite. The GIRMC supervises Nomura’s risk management by establishing and operating its risk management framework. The GIRMC reports the status of key risk management issues and any other matters deemed necessary by the committee chairman to the BoD and the EMB.
In addition, the GIRMC, upon delegation from the EMB, has established the Risk Management Policy, describing Nomura’s overall risk management framework including the fundamental risk management principles followed by Nomura.
38
Nomura Group Conduct Committee
Upon delegation from the EMB, the Nomura Group Conduct Committee deliberates on the matters necessary for compliance and conduct risk management to assure the sound and effective management of its businesses
..
Global Portfolio Committee (“GPC”)
Upon delegation from the GIRMC, the GPC deliberates on or determines matters in relation to the management of global portfolio concentration risk in addition to a specific portfolio, for the purpose of achieving a risk profile consistent with the risk allocation and risk appetite of Nomura. The portfolio consists of businesses and products that fall within at least one of the three following categories: event financing, term financing and asset-based financing
.
Asset Liability Committee (“ALCO”)
Upon delegation from the EMB and the GIRMC, the ALCO deliberates on, based on Nomura’s risk appetite determined by the EMB, balance sheet management, financial resource allocation, liquidity management and related matters. The ALCO reports to the GIRMC the status of discussions at its meetings and any other matters as deemed necessary by the committee chairman.
Global Transaction Committee (“GTC”)
Upon delegation from the GPC, the GTC deliberates on or determines individual transactions in line with Nomura’s risk appetite determined by the EMB and thereby seeks to assure the sound and effective management of Nomura’s businesses.
Other Committees
The Global Risk Analytics Committee and the Model Risk Analytics Committee deliberate on or determine matters concerning the development, management and strategy of risk models and valuation models upon delegation from the CRO, respectively. The primary responsibility of these committees is to govern and provide oversight of model management, including the approval of new models and significant model changes. Both committees report significant matters and material decisions taken to the CRO on a regular basis. The Collateral Steering Committee deliberates on or determines Nomura’s collateral risk management, including concentrations, liquidity, collateral
re-use,
limits and stress tests, provides direction on Nomura’s collateral strategy and ensures compliance with regulatory collateral requirements upon delegation from the CRO.Chief Risk Officer (“CRO”)
The CRO is responsible for setting the overall strategy and direction of the Risk Management Division. The CRO is responsible for supervising the Risk Management Division and maintaining the effectiveness of the risk management framework independently from the business units within Nomura. The CRO regularly reports on the status of Nomura’s risk management to the GIRMC, and reports to and seeks the approval of the GIRMC on measures required for risk management.
Chief Financial Officer (“CFO”)
The CFO is responsible for overall financial strategy of Nomura, and has operational authority and responsibility over Nomura’s liquidity management based on decisions made by the EMB.
Chief Compliance Officer (“CCO”)
The CCO is responsible for supervising the Legal, Compliance and Controls Division (“LCC Division”) and maintaining the effectiveness of the
non-financial
risk management framework (operational risk and reputational risk).Risk Management Division, Finance Division and LCC Division
The Risk Management Division, the Finance Division and the LCC Division comprise various departments or units established independently from Nomura’s business units. These three divisions are responsible for establishing and operating risk management processes, establishing and enforcing risk management policies and regulations, verifying the effectiveness of risk management methods, gathering reports from Nomura Group entities, reporting to Executive Officers/Senior Managing Directors and the GIRMC and others, as well as reporting to regulatory bodies and handling regulatory applications concerning risk management methods and other items as necessary. Important risk management issues are closely communicated between these three divisions and the CRO, CFO and CCO. The CRO, CFO and CCO regularly attend the EMB and GIRMC meetings to report specific risk issues.
39
Recent Development
As a part of the efforts to enhance the risk management governance, the Board Risk Committee (the “BRC”) was formally established on October 29, 2021 to discuss important risks independently of the execution side within the high-level governance structure. The BRC assists the BoD in supervising such matters as (i) providing consent to Risk Appetite Statement, (ii) providing consent to the main design of the risk management framework, (iii) results of analysis and verification or future forecasts of risk environment, and (iv) supervision over execution state of the overall risk management and medium- to long-term risk strategies for contributing to the sophistication of the Group’s risk management. Besides, the GIRMC was formally changed its name to the Group Risk Management Committee (the “GRMC”), further ensuring global representatives and efficiency in the operations, with an intention to increase the senior management’s involvement in risk management, stimulate dialog and analysis further, and effectively coordinate with the BRC of supervisory side.
Risk Policy Framework
Policies and procedures are essential tools of governance and define principles, rules and standards, and the specific processes that must be adhered to in order to effectively manage risk at Nomura. Risk management operations are designed to function in accordance with these policies and procedures.
40
Monitoring, Reporting and Data Integrity
Development, consolidation, monitoring and reporting of risk management information (“risk MI”) are fundamental to the appropriate management of risk. The aim of all risk MI is to provide a basis for sound decision-making, action and escalation as required. The Risk Management Division, the Finance Division and the LCC Division are responsible for producing regular risk MI, which reflects the position of Nomura relative to stated risk appetite. Risk MI includes information from across the risk classes defined in the risk management framework and reflect the use of the various risk tools used to identify and assess those risks. These three divisions are responsible for implementing appropriate controls over data integrity for risk MI.
Management of Financial Resources
Nomura has established a framework for management of financial resources in order to adequately manage utilization of these resources. The EMB allocates financial resources to business units at the beginning of each financial year. These allocations are used to set revenue forecasts for each business units. Key components are set out below:
Risk-weighted assets
A key component used in the calculation of our consolidated capital adequacy ratios is risk-weighted assets. The EMB determines the risk appetite for our consolidated Tier 1 capital ratio on an annual basis and sets the limits for the usage of risk-weighted assets by each division and by additional lower levels of the division. In addition the EMB determines the risk appetite for the level of exposures under the leverage ratio framework which is a” of our annual report on Form” and “” in this annual report for further information on our consolidated capital adequacy ratios and risk-weighted assets.
non-risk
based measure to supplement risk-weighted assets. See Item 4.B. “Business Overview—Regulatory Capital Rules
20-F
for the fiscal year ended March 31, 2021, and “Consolidated Regulatory Capital Requirements
Consolidated Leverage Ratio Requirements
Available Funds
The CFO decides the maximum amount of available funds, provided without posting of any collateral, for allocation within Nomura and the EMB approves the allocation of the funds to each business division. Global Treasury monitors the usage by businesses and reports to the EMB.
41
Classification and Definition of Risk
Nomura classifies and defines risks as follows and has established departments or units to manage each risk type.
Risk Category | Definition | |
Financial Risk | ||
Market risk | Risk of losses arising from fluctuations in values of financial assets or debts (including off-balance sheet items) due to fluctuations in market risk factors (interest rates, foreign exchange rates, prices of securities and others). | |
Credit risk | Risk of loss arising from an obligor’s default, insolvency or administrative proceeding which results in the obligor’s failure to meet its contractual obligations in accordance with agreed terms. It is also the risk of loss arising through a credit valuation adjustment (“CVA”) associated with deterioration in the creditworthiness of a counterparty. | |
Model risk | Risk of financial loss, incorrect decision making, or damage to the firm’s credibility arising from model errors or incorrect or inappropriate model application. | |
Liquidity risk | Risk of loss arising from difficulty in securing the necessary funding or from a significantly higher cost of funding than normal levels due to deterioration of Nomura Group’s creditworthiness or deterioration in market conditions. | |
Non-financial Risk | ||
Operational risk | Risk of financial loss or non-financial impact arising from inadequate or failed internal processes, people and systems, or from external events. Operational risk includes in its definition Compliance, Legal, IT and Cyber Security, Fraud, Third Party and othernon-financial risks. Operational risk does not include strategic risk and reputational risk, however, some operational risks can lead to reputational issues and as such operational and reputational risks may be closely linked. | |
Reputational risk | Possible damage to Nomura’s reputation and associated risk to earnings, capital or liquidity arising from any association, action or inaction which could be perceived by stakeholders to be inappropriate, unethical or inconsistent with Nomura Group’s values and corporate philosophy. | |
Other Risks | ||
ESG: Environmental, Social and Governance | ESG is a collective term for Environmental (E), Social (S) and Governance (G) factors. “Environmental” includes issues related to impacts on the natural environment, including climate change. “Social” includes interactions with stakeholders and communities, for example the approach to human rights, workplace related issues and engagement on social issues. Governance includes issues related to corporate governance, corporate behaviour and the approach to transparent reporting. | |
Strategic risk | Risk to current or anticipated earning, capital, liquidity, enterprise value, or the Nomura Group’s reputation arising from adverse business decisions, poor implementation of business decisions, or lack of responsiveness to change in the industry or external environment. | |
Market Risk Management
Market risk is the risk of loss arising from fluctuations in values of financial assets and liabilities (including
off-balance
sheet items) due to fluctuations in market risk factors (interest rates, foreign exchange rates, prices of securities and others).Market Risk Management Process
Effective management of market risk requires the ability to analyze a complex and evolving portfolio in a constantly changing global market environment, identify problematic trends and ensure that appropriate action is taken in a timely manner.
Nomura uses a variety of statistical risk measurement tools to assess and monitor market risk on an ongoing basis, including, but not limited to, Value at Risk (“VaR”), Stressed VaR (“SVaR”) and Incremental Risk Charge. In addition, Nomura uses sensitivity analysis and stress testing to measure and analyze its market risk. Sensitivities are measures used to show the potential changes to a portfolio due to standard moves in market risk factors. They are specific to each asset class and cannot usually be aggregated across risk factors. Stress testing enables the analysis of portfolio risks or tail risks, including
non-linear
behaviors and can be aggregated across risk factors at any level of the group hierarchy, from group level to business division, units or desk levels. Market risk is monitored against a set of approved limits, with daily reports and other management information provided to the business units and senior management.42
Value at Risk
VaR is a measure of the potential loss due to adverse movements of market factors, such as equity prices, interest rates, credit, foreign exchange rates, and commodities with associated volatilities and correlations.
VaR Methodology Assumptions
Nomura uses a single VaR model which has been implemented globally in order to determine the total trading VaR. A historical simulation is implemented, where historical market moves over a
two-year
window are applied to current exposure in order to construct a profit and loss distribution. Potential losses can be estimated at required confidence levels or probabilities. For internal risk management purposes, VaR is calculated across Nomura using a1-day
time horizon; this data is presented below. A scenario weighting scheme is employed to ensure that the VaR model responds to changing market volatility. For regulatory reporting purposes, Nomura uses a10-day
time horizon, calculated using actual10-day
historical market moves and employ an equal weight scheme to ensure VaR is not overly sensitive to changing market volatility. To complement VaR under Basel 2.5 regulations, Nomura also computes SVaR, which samples from aone-year
window during a period of financial stress. The SVaR window is regularly calibrated and observations are equally weighted.Nomura’s VaR model uses exact time series for each individual risk factor. However, if good quality data is not available, a ‘proxy logic’ maps the exposure to an appropriate time series. The level of proxying taking place is carefully monitored through internal risk management processes and there is a continual effort to source new time series to use in the VaR calculation.
VaR Backtesting
The performance of Nomura’s VaR model is closely monitored to help ensure that it remains fit for purpose. The main approach for validating VaR is to compare actual
1-day
trading losses with the corresponding VaR estimate. Nomura’s VaR model is backtested at different hierarchy levels. Backtesting results are reviewed on a monthly basis by Nomura’s Risk Management Division.One-day
trading losses did not exceed the 99% VaR estimate at the Nomura Group level on any occasion for the six months ended September 30, 2021.Limitations and Advantages of VaR
VaR aggregates risks from different asset classes in a transparent and intuitive way. However, there are limitations. VaR is a backward-looking measure: it implicitly assumes that distributions and correlations of recent factor moves are adequate to represent moves in the near future. VaR is appropriate for liquid markets and is not appropriate for risk factors that exhibit sudden jumps. Therefore it may understate the impact of severe events. Given these limitations, Nomura uses VaR only as one component of a diverse market risk management process.
43
VaR metrics
The following graph shows the daily VaR over the last six quarters for substantially all of Nomura’s trading positions:
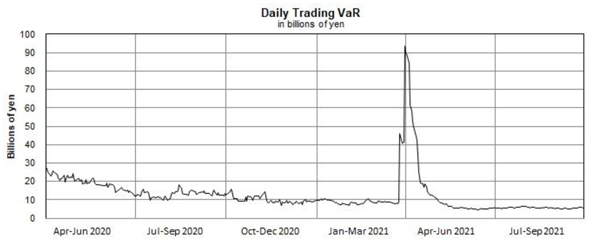
The following tables show the VaR as of each of the dates indicated for substantially all of Nomura’s trading positions:
Billions of yen | ||||||||||||
As of | ||||||||||||
Mar. 31, 2020 | Mar. 31, 2021 | Sep. 30, 2021 | ||||||||||
Equity | ¥ | 8.88 | ¥ | 93.43 | ¥ | 3.84 | ||||||
Interest rate | 22.35 | 8.56 | 4.74 | |||||||||
Foreign exchange | 5.08 | 4.17 | 1.27 | |||||||||
Subtotal | 36.31 | 106.16 | 9.85 | |||||||||
Less: Diversification Benefit | (11.00 | ) | (12.77 | ) | (4.53 | ) | ||||||
VaR | ¥ | 25.31 | ¥ | 93.39 | ¥ | 5.32 | ||||||
Billions of yen | ||||||||||||
For the twelve months ended | For the six months ended | |||||||||||
Mar. 31, 2020 | Mar. 31, 2021 | Sep. 30, 2021 | ||||||||||
Maximum daily VaR (1) | ¥ | 32.89 | ¥ | 93.39 | ¥ | 89.68 | ||||||
Average daily VaR (1) | 6.67 | 13.58 | 10.84 | |||||||||
Minimum daily VaR (1) | 3.62 | 7.14 | 4.78 | |||||||||
| (1) | Represents the maximum, average and minimum VaR based on all daily calculations for the twelve months ended March 31, 2020, March 31, 2021, and for the six months ended September 30, 2021. |
44
Total VaR decreased to ¥5.32 billion as of September 30, 2021 from ¥93.39 billion as of March 31, 2021. VaR relating to equity risk decreased to ¥3.84 billion as of September 30, 2021, compared to ¥93.43 billion as of March 31, 2021. VaR relating to interest rate risk decreased to ¥4.74 billion as of September 30, 2021, compared to ¥8.56 billion as of March 31, 2021. VaR relating to foreign exchange risk decreased to ¥1.27 billion as of September 30, 2021, compared to ¥4.17 billion as of March 31, 2021.
Total VaR increased to ¥93.39 billion as of March 31, 2021 from ¥25.31 billion as of March 31, 2020. VaR relating to equity risk increased to ¥93.43 billion as of March 31, 2021, compared to ¥8.88 billion as of March 31, 2020. VaR relating to interest rate risk decreased to ¥8.56 billion as of March 31, 2021, compared to ¥22.35 billion as of March 31, 2020. VaR relating to foreign exchange risk decreased to ¥4.17 billion as of March 31, 2021, compared to ¥5.08 billion as of March 31, 2020.
Stress Testing
Nomura conducts market risk stress testing since VaR and sensitivity analysis have limited ability to capture all portfolio risks or tail risks. Stress testing for market risk is conducted regularly, using various scenarios based upon features of trading strategies. Nomura conducts stress testing not only at the desk level, but also at the Nomura Group level with a set of common global scenarios in order to reflect the impact of market fluctuations on the entire Nomura Group.
Non-Trading
RiskA major market risk in Nomura’s
non-trading
portfolio relates to equity investments held for operating purposes and on a long-term basis. Equity investments held for operating purposes are minority stakes in the equity securities of unaffiliated Japanese financial institutions and corporations held in order to promote existing and potential business relationships. Thisnon-trading
portfolio is exposed mainly to volatility in the Japanese stock market. One method that can estimate the market risk in this portfolio is to analyze market sensitivity based on changes in the TOPIX, which is a leading index of prices of stocks on the First Section of the Tokyo Stock Exchange.Nomura uses regression analysis covering the previous 90 days which tracks and compares fluctuations in the TOPIX and the fair value of Nomura’s equity investments held for operating purposes, which allows to determine a correlation factor. Based on this analysis for each 10% change in the TOPIX, the fair value of Nomura’s operating equity investments held for operating purposes can be expected to change by ¥9,800 million at the end of March 2021 and ¥11,095 million at the end of September 2021. The TOPIX closed at 1,954.00 points at the end of March 2021 and at 2,030.16 points at the end of September 2021. This simulation analyzes data for the entire portfolio of equity investments held for operating purposes at Nomura and therefore actual results may differ from Nomura’s expectations because of price fluctuations of individual equities.
Credit Risk Management
Credit risk is the risk of loss arising from an obligor’s default, insolvency or administrative proceeding which results in the obligor’s failure to meet its contractual obligations in accordance with agreed terms. This includes both on and
off-balance
sheet exposures. It is also the risk of loss arising through a CVA associated with deterioration in the creditworthiness of a counterparty.Nomura manages credit risk on a global basis and on an individual Nomura legal entity basis.
Credit Risk Management Framework
The measurement, monitoring and management of credit risk at Nomura are governed by a set of global policies and procedures. Credit Risk Management (“CRM”), a global function within the Risk Management Division, is responsible for the implementation and maintenance of these policies and procedures. These policies are authorized by the GIRMC and/or Global Risk Strategic Committee (“GRSC”), prescribe the basic principles of credit risk management and set delegated authority, which enables CRM personnel to set credit limits.
Credit risk is managed by CRM together with various global and regional risk committees. This helps to ensure transparency of material credit risks and compliance with established credit limits, the approval of material extensions of credit and the escalation of risk concentrations to appropriate senior management.
45
Credit Risk Management Process
CRM operates as a credit risk control function within the Risk Management Division, reporting to the CRO. The process for managing credit risk at Nomura includes:
| • | Evaluation of likelihood that a counterparty defaults on its payments and obligations; |
| • | Assignment of internal ratings to all active counterparties; |
| • | Approval of extensions of credit and establishment of credit limits; |
| • | Measurement, monitoring and management of Nomura’s current and potential future credit exposures; |
| • | Setting credit terms in legal documentation; and |
| • | Use of appropriate credit risk mitigants including netting, collateral and hedging. |
The scope of credit risk management includes counterparty trading and various debt or equity instruments including loans, private equity investments, fund investments, investment securities and any other as deemed necessary from a credit risk management perspective.
The evaluation of counterparties’ creditworthiness involves a thorough due diligence and analysis of the business environments in which they operate, their competitive positions, management and financial strength and flexibility. Credit analysts also take into account the corporate structure and any explicit or implicit credit support. CRM evaluates credit risk not only by counterparty, but also by counterparty group.
Following the credit analysis, CRM estimates the probability of default of a given counterparty or obligor through an alphanumeric ratings scale similar to that used by rating agencies and a corresponding numeric scale. Credit analysts are responsible for assigning and maintaining the internal ratings, ensuring that each rating is reviewed and approved at least annually.
Nomura’s internal rating system employs a range of ratings models to achieve global consistency and accuracy. These models are developed and maintained by the Risk Methodology Group. Internal ratings represent a critical component of Nomura’s approach to managing counterparty credit risk. They are frequently used as key factors in:
| • | Establishing the amount of counterparty credit risk that Nomura is willing to take to an individual counterparty or counterparty group (setting of credit limits); |
| • | Determining the level of delegated authority for setting credit limits (including tenor); |
| • | The frequency of credit reviews (renewal of credit limits); |
| • | Reporting counterparty credit risk to senior management within Nomura; and |
| • | Reporting counterparty credit risk to stakeholders outside of Nomura. |
The Credit Risk Control Unit is a function within the Model Validation Group (“MVG”) which is independent of CRM. It seeks to ensure that Nomura’s internal rating system is properly reviewed and validated, and that breaks or issues are reported to senior management for timely resolution. The unit is responsible for ensuring that the system remains accurate and predictive of risk and provides periodic reporting on the system to senior management.
For regulatory capital calculation purposes, Nomura has been applying the Foundation Internal Rating Based Approach in calculating credit risk-weighted assets since the end of March 2011. The Standardized Approach is applied to certain business units or asset types, which are considered immaterial to the calculation of credit risk-weighted assets.
46
Credit Limits and Risk Measures
Internal ratings form an integral part in the assignment of credit limits to counterparties. Nomura’s credit limit framework is designed to ensure that Nomura takes appropriate credit risk in a manner that is consistent with its overall risk appetite. Global Credit policies define the delegated authority matrices that establish the maximum aggregated limit amounts and tenors that may be set for any single counterparty group based on their internal rating.
Nomura’s main type of counterparty credit risk exposures arise from derivatives transactions or securities financing transactions. Credit exposures against counterparties are managed by means of setting credit limits based upon credit analysis of individual counterparty. Credit risk is managed daily through the monitoring of credit exposure against approved credit limits and the ongoing monitoring of the creditworthiness of Nomura’s counterparties. Changes in circumstances that alter Nomura’s risk appetite for any particular counterparty, sector, industry or country are reflected in changes to the internal rating and credit limit as appropriate.
Nomura’s global credit risk management systems record credit limits and capture credit exposures to Nomura’s counterparties allowing CRM to measure, monitor and manage utilization of credit limits, ensure appropriate reporting and escalation of limit breaches.
For derivatives and securities financing transactions, Nomura measures credit risk primarily by way of a Monte Carlo-based simulation model that determines a Potential Exposure profile at a specified confidence level. The exposure calculation model used for counterparty credit risk management has also been used for the Internal Model Method based exposure calculation for regulatory capital reporting purposes since the end of December 2012.
Loans and lending commitments are measured and monitored on both a funded and unfunded basis.
Wrong Way Risk
Wrong Way Risk (“WWR”) occurs when exposure to a counterparty is highly correlated with the deterioration of creditworthiness of that counterparty. Nomura has established global policies that govern the management of WWR exposures. Stress testing is used to support the assessment of WWR embedded within existing portfolios and adjustments are made to credit exposures and regulatory capital, as appropriate.
Stress Testing
Stress Testing is an integral part of Nomura’s management of credit risk. Regular stress tests are used to support the assessment of credit risks by counterparties, sectors and regions. The stress tests include potential concentrations that are highlighted as a result of applying shocks to risk factors, probabilities of default or rating migrations.
Risk Mitigation
Nomura utilizes financial instruments, agreements and practices to assist in the management of credit risk. Nomura enters into legal agreements, such as the International Swap and Derivatives Association, Inc. (“ISDA”) agreements or equivalent (referred to as “Master Netting Agreements”), with many of its counterparties. Master Netting Agreements allow netting of receivables and payables and reduce losses potentially incurred as a result of a counterparty default. Further reduction in credit risk is achieved through entering into collateral agreements that allow Nomura to obtain collateral from counterparties either upfront or contingent on exposure levels, changes in credit rating or other factors.
47
Credit Risk to Counterparties in Derivatives Transaction
The credit exposures arising from Nomura’s trading-related derivatives as of March 31, 2021 are summarized in the table below, showing the positive fair value of derivative assets by counterparty credit rating and by remaining contractual maturity. The credit ratings are internally determined by Nomura’s CRM.
Billions of yen | ||||||||||||||||||||||||||||||||||||
Years to Maturity | ||||||||||||||||||||||||||||||||||||
Credit Rating | Less than 1 year | 1 to 3 years | 3 to 5 years | 5 to 7 years | More than 7 years | Cross-Maturity Netting (1) | Total Fair Value | Collateral obtained | Replacement cost (3) | |||||||||||||||||||||||||||
(a) | (b) | (a)-(b) | ||||||||||||||||||||||||||||||||||
AAA | ¥ | 25 | ¥ | 32 | ¥ | 1 | ¥ | 3 | ¥ | 50 | ¥ | (99 | ) | ¥ | 12 | ¥ | 0 | ¥ | 12 | |||||||||||||||||
AA | 350 | 310 | 126 | 94 | 442 | (1,034 | ) | 288 | 73 | 215 | ||||||||||||||||||||||||||
A | 829 | 465 | 347 | 164 | 948 | (2,433 | ) | 320 | 204 | 116 | ||||||||||||||||||||||||||
BBB | 245 | 197 | 118 | 93 | 608 | (961 | ) | 300 | 106 | 194 | ||||||||||||||||||||||||||
BB and lower | 73 | 61 | 42 | 44 | 57 | (117 | ) | 160 | 255 | 0 | ||||||||||||||||||||||||||
Other (2) | 50 | 73 | 169 | 90 | 594 | (1,015 | ) | (39 | ) | 94 | 0 | |||||||||||||||||||||||||
Sub-total | ¥ | 1,572 | ¥ | 1,138 | ¥ | 803 | ¥ | 488 | ¥ | 2,699 | ¥ | (5,659 | ) | ¥ | 1,041 | ¥ | 732 | ¥ | 537 | |||||||||||||||||
Listed | 453 | 74 | 7 | — | — | (355 | ) | 179 | 187 | 0 | ||||||||||||||||||||||||||
Total | ¥ | 2,025 | ¥ | 1,212 | ¥ | 810 | ¥ | 488 | ¥ | 2,699 | ¥ | (6,014 | ) | ¥ | 1,220 | ¥ | 919 | ¥ | 537 | |||||||||||||||||
| (1) | Represents netting of derivative liabilities against derivatives assets entered into with the same counterparty across different maturity bands. Derivative assets and derivative liabilities with the same counterparty in the same maturity band are net within the relevant maturity band. Cash collateral netting against net derivative assets in accordance with ASC 210-20 “Balance Sheet—Offsetting Derivatives and Hedging |
| (2) | “Other” comprises unrated counterparties and certain portfolio level valuation adjustments not allocated to specific counterparties. |
| (3) | Zero balances represent instances where total collateral received is in excess of the total fair value; therefore, Nomura’s credit exposure is zero. |
48
Country Risk
At Nomura, country risk is defined as the risk of loss arising from country-specific events (such as political, economic, legal and other events) that affect counterparties and/or issuers within that country, causing those counterparties and/or issuers to be unable to meet financial obligations. Nomura’s country risk framework acts as a complement to other risk management areas and encompasses a number of tools including, but not limited to, country limits, which restrict credit exposure concentration to any given country. Other tools to manage country risk include country ratings as well as country risk policies and procedures that describe responsibilities and delegation for decision-making.
Nomura’s credit portfolio remains well-diversified by country and concentrated towards highly-rated countries. The breakdown of top 10 country exposures is as follows:
Top 10 Country Exposures (1) | Billions of Yen | |||
(As of September 30, 2021) | ||||
United States | 2,924 | |||
Japan | 2,584 | |||
United Kingdom | 930 | |||
France | 510 | |||
Luxembourg | 194 | |||
Singapore | 191 | |||
India | 171 | |||
Netherlands | 170 | |||
Australia | 161 | |||
Canada | 123 | |||
| (1) | The table represents the Top 10 country exposures as of September 30, 2021 based on country of risk, combining counterparty and inventory exposures: |
| - | Counterparty exposures include cash and cash equivalents held at banks; the outstanding default fund and initial margin balances posted by Nomura to central clearing counterparties as legally required under its direct and affiliate clearing memberships; the aggregate marked-to-market |
| - | Inventory exposures are the market value of debt and equity securities, and equity and credit derivatives, using the net of long versus short positions. |
49
Operational Risk Management
Operational risk is the risk of financial loss or
non-financial
impact arising from inadequate or failed internal processes, people and systems, or from external events. Operational risk includes in its definition Compliance, Legal, IT and Cyber Security, Fraud, Third Party and othernon-financial
risks. Operational risk does not include strategic risk and reputational risk, however, some operational risks can lead to reputational issues and as such operational and reputational risks may be closely linked.The Three Lines of Defense
Nomura adopts the industry standard “Three Lines of Defense” for the management of operational risk, comprising the following elements:
| 1) | 1st Line of Defense: The business which owns and manages its risks |
| 2) | 2nd Line of Defense: The Operational Risk Management (“ORM”) function, which co-ordinates the Operational Risk Management Framework and its implementation |
| 3) | 3rd Line of Defense: Internal and External Audit, who provide independent assurance |
Operational Risk Management Framework
An Operational Risk Management Framework has been established in order to allow Nomura to identify, assess, manage, monitor and report on operational risk. The GIRMC, with delegated authority from the EMB has formal oversight over the management of operational risk.
This framework is set out below:
Infrastructure of the framework
| • | Policy framework: Sets standards for managing operational risk and details how to monitor adherence to these standards. |
| • | Training and awareness: Action taken by ORM to improve business understanding of operational risk. |
Products and Services
| • | Event Reporting: This process is used to identify and report any event which resulted in or had the potential to result in a loss or gain or other impact associated with inadequate or failed internal processes, people and systems, or from external events. |
| • | Risk and Control Self-Assessment (“RCSA”): This process is used to identify the inherent risks the business faces, the key controls associated with those risks and relevant actions to mitigate the residual risks. Global ORM are responsible for developing the RCSA process and supporting the business in its implementation. |
| • | Key Risk Indicators (“KRI”): KRIs are metrics used to monitor the business’ exposure to operational risk and trigger appropriate responses as thresholds are breached. |
| • | Scenario Analysis: The process used to assess and quantify potential high impact, low likelihood operational risk events. During the process actions may be identified to enhance the control environment which are then tracked via the Operational Risk Management Framework. |
Outputs
| • | Analysis and reporting: A key aspect of ORM’s role is to analyze, report, and challenge operational risk information provided by business units, and work with business units to develop action plans to mitigate risks. |
| • | Operational risk capital calculation: Calculate operational risk capital as required under applicable Basel standards and local regulatory requirements. |
50
Regulatory Capital Calculation for Operational Risk
Nomura uses the Standardized Approach for calculating regulatory capital for operational risk. This involves using a three-year average of gross income allocated to business lines, which is multiplied by a fixed percentage (“Beta Factor”) determined by the FSA, to establish the amount of required operational risk capital.
Nomura uses consolidated net revenue as gross income, however for certain consolidated subsidiaries, gross operating profit is used as gross income. Gross income allocation is performed by mapping the net revenue of each business segment as defined in Nomura’s management accounting data to each business line defined in the Standardized Approach as follows:
Business Line | Description | Beta Factor | ||||
Retail Banking | Retail deposit and loan-related services | 12 | % | |||
Commercial Banking | Deposit and loan-related services except for Retail Banking business | 15 | % | |||
Payment and Settlement | Payment and settlement services for clients’ transactions | 18 | % | |||
Retail Brokerage | Securities-related services mainly for individuals | 12 | % | |||
Trading and Sales | Market-related business | 18 | % | |||
Corporate Finance | M&A, underwriting, secondary and private offerings, and other funding services for clients | 18 | % | |||
Agency Services | Agency services for clients such as custody | 15 | % | |||
Asset Management | Fund management services for clients | 12 | % | |||
Nomura calculates the required amount of operational risk capital for each business line by multiplying the allocated annual gross income amount by the appropriate Beta Factor defined above. The operational risk capital for any gross income amount not allocated to a specific business line is determined by multiplying such unallocated gross income amount by a fixed percentage of 18%.
The total operational risk capital for Nomura is calculated by aggregating the total amount of operational risk capital required for each business line and unallocated amount and by determining a three-year average. Where the aggregated amount for a given year is negative, then the total operational risk capital amount for that year will be calculated as zero.
In any given year, negative amounts in any business line are offset against positive amounts in other business lines. However, negative unallocated amounts are not offset against positive amounts in other business lines and are calculated as zero.
Operational risk capital is calculated at the end of September and March each year.
Model Risk Management
Model Risk is the risk of financial loss, incorrect decision making, or damage to the firm’s credibility arising from Model errors or incorrect or inappropriate Model application.
To effectively manage the Firm’s Model Risk, Nomura has established a Model Risk Management Framework to govern the development, ownership, validation, approval, usage, ongoing monitoring, and periodic review of the Firm’s Models. The framework is supported by a set of policies and procedures that articulate process requirements for the various elements of the model lifecycle, including monitoring of model risk with respect to the Firm’s appetite.
New models and material changes to approved models must be independently validated prior to official use. Thresholds to assess the materiality of model changes are defined in Model Risk Management’s procedures. During independent validation, validation teams analyze a number of factors to assess a model’s suitability, identify model limitations, and quantify the associated model risk, which is ultimately mitigated through the imposition of approval conditions, such as usage conditions, model reserves and capital adjustments. Approved models are subject to Model Risk Management’s periodic review process and ongoing performance monitoring to assess their continued suitability. Appropriately delegated Model Risk Management Committees provide oversight, challenge, governance, and ultimate approval of validated Models.
51
Funding and Liquidity Risk Management
For further information on funding and liquidity risk management, see “” in this report.
Liquidity and Capital Resources—Funding and Liquidity Management
Risk Measures and Controls
Limit Frameworks
The establishment of robust limit monitoring and management is central to appropriate monitoring and management of risk. The limit management frameworks incorporate escalation policies to facilitate approval of limits at appropriate levels of seniority. The Risk Management Division, the Finance Division and the LCC Division are responsible foroperation of these limit frameworks including approval, monitoring, and reporting as required. Business units are responsible for complying with the agreed limits. Limits apply across a range of quantitative measures of risk and across market and credit risks.
day-to-day
New Business Risk Management
The new business approval process represents the starting point for new business in Nomura and exists to support management decision-making and ensure that risks associated with new products and transactions are identified and managed appropriately. The new business approval process consists of two components:
| 1) | Transaction committees are in place to provide formal governance over the review and decision-making process for individual transactions. |
| 2) | The new product approval process allows business unit sponsors to submit applications for new products and obtain approval from relevant departments prior to execution of the new products. The process is designed to capture and assess risks across various risk classes as a result of the new product or business. |
The new business approval process continues to seek assuring the sound and effective management to better meet the various changes observed in the market environment.
52
Stress Testing
Stress testing performed at the Nomura Group seeks to provide comprehensive coverage of risks across different hierarchical levels, and covers different time horizons, severities, plausibilities and stress testing methodologies. The results of stress tests are used in capital planning processes, capital adequacy assessments, liquidity adequacy assessments, recovery and resolution planning, assessments of whether risk appetite is appropriate, and in routine risk management.
Stress tests are run on a regular basis or on an ad hoc basis as needed, for example, in response to material changes in the external environment and/or in the Nomura Group risk profile. The results of stress tests with supporting detailed analysis are reported to senior management and other stakeholders as appropriate for the stress test being performed.
Stress testing is categorized either as sensitivity analysis or scenario analysis and may be performed on a Nomura Group-wide basis or at more granular levels.
| • | Sensitivity analysis is used to quantify the impact of a market move in one or two associated risk factors (for example, equity prices, equity volatilities) in order primarily to capture those risks which may not be readily identified by other risk models; |
| • | Scenario analysis is used to quantify the impact of a specified event across multiple asset classes and risk classes. This is a primary approach used in performing stress testing at the different hierarchical levels of the Nomura Group; |
Scenario analysis includes following examples.
| • | Nomura Group establishes several stress scenarios to validate risk appetite for capital and liquidity soundness, taking into account the business environment, business’s risk profile, economic environment and forecasts. |
| • | Group-wide stress to assess the capital adequacy of the Nomura Group under severe but plausible market scenarios is conducted on a quarterly basis at a minimum; and |
| • | Reverse stress testing, a process of considering the vulnerabilities of the firm and hence how it may react to situations where it becomes difficult to continue its business and reviewing the results of that analysis, is conducted on an annual basis at a minimum. |
Stress testing is an integral part of the Nomura Group’s overall governance and is used as a tool for forward-looking risk management, decision-making and enhancing communication amongst Corporate Functions, Business Divisions, and senior management.
53
Interim Consolidated Financial Statements (UNAUDITED)
Page | ||||
| F-2 | ||||
| F-5 | ||||
| F-7 | ||||
| F-8 | ||||
| F-10 | ||||
| F-12 | ||||
| F-94 | ||||
F-1
Interim Consolidated Financial Statements
Consolidated Balance Sheets (UNAUDITED)
Millions of yen | ||||||||
March 31, 2021 | September 30, 2021 | |||||||
ASSETS | ||||||||
| Cash and cash deposits: | ||||||||
| Cash and cash equivalents | ¥ | 3,509,754 | ¥ | 3,836,088 | ||||
| Time deposits | 281,422 | 342,778 | ||||||
| Deposits with stock exchanges and other segregated cash | 373,559 | 312,579 | ||||||
| Total cash and cash deposits | 4,164,735 | 4,491,445 | ||||||
| Loans and receivables: | ||||||||
| Loans receivable (including ¥818,523 million and ¥916,938 million measured at fair value by applying the fair value option as of March 31, 2021 and September 30, 2021, respectively) | 2,943,472 | 3,143,347 | ||||||
| Receivables from customers (including ¥163,388 million and ¥146,706 million measured at fair value by applying the fair value option as of March 31, 2021 and September 30, 2021, respectively) | 459,090 | 486,602 | ||||||
| Receivables from other than customers | 793,669 | 761,127 | ||||||
| Allowance for credit losses | (53,784 | ) | (61,711 | ) | ||||
| Total loans and receivables | 4,142,447 | 4,329,365 | ||||||
| Collateralized agreements: | ||||||||
| Securities purchased under agreements to resell (including ¥366,506 million and ¥314,439 million measured at fair value by applying the fair value option as of March 31, 2021 and September 30, 2021, respectively) | 10,775,078 | 11,272,573 | ||||||
| Securities borrowed | 5,264,360 | 4,658,853 | ||||||
| Total collateralized agreements | 16,039,438 | 15,931,426 | ||||||
| Trading assets and private equity and debt investments: | ||||||||
Trading assets (including securities pledged as collateral of ¥5,587,555 million and ¥5,383,531 million as of March 31, 2021 and September 30, 2021, respectively; including ¥10,122 million and ¥7,854 million measured respectively) | 15,674,354 | 16,333,623 | ||||||
| Private equity and debt investments (including ¥3,599 million and ¥6,627 million measured at fair value by applying the fair value option as of March 31, 2021 and September 30, 2021, respectively) | 63,825 | 77,820 | ||||||
| Total trading assets and private equity and debt investments | 15,738,179 | 16,411,443 | ||||||
| Other assets: | ||||||||
| Office buildings, land, equipment and facilities (net of accumulated depreciation and amortization of ¥395,429 million and ¥410,139 million as of March 31, 2021 and September 30, 2021, respectively) | 464,449 | 460,051 | ||||||
Non-trading debt securities (including securities pledged as collateral of ¥9,427 million and ¥16,776 million as ofMarch 31, 2021 and September 30, 2021, respectively) | 426,758 | 444,123 | ||||||
| Investments in equity securities | 126,649 | 135,959 | ||||||
| Investments in and advances to affiliated companies | 364,393 | 358,878 | ||||||
Other (including ¥171,482 million and ¥179,466 million measured at fair value by applying the fair value option as | 1,049,432 | 783,862 | ||||||
| Total other assets | 2,431,681 | 2,182,873 | ||||||
| Total assets | ¥ | 42,516,480 | ¥ | 43,346,552 | ||||
F-2
Consolidated Balance Sheets—(Continued) (UNAUDITED)
Millions of yen | ||||||||
March 31, 2021 | September 30, 2021 | |||||||
LIABILITIES AND EQUITY | ||||||||
| Short-term borrowings (including ¥634,714 million and ¥683,253 million measured at fair value by applying the fair value option as of March 31, 2021 and September 30, 2021, respectively) | ¥ | 1,368,098 | ¥ | 1,188,794 | ||||
| Payables and deposits: | ||||||||
| Payables to customers | 1,454,755 | 1,469,026 | ||||||
| Payables to other than customers | 1,773,699 | 1,793,857 | ||||||
| Deposits received at banks (including ¥49,874 million and ¥56,180 million measured at fair value by applying the fair value option as of March 31, 2021 and September 30, 2021, respectively) | 1,342,464 | 1,463,647 | ||||||
| Total payables and deposits | 4,570,918 | 4,726,530 | ||||||
| Collateralized financing: | ||||||||
| Securities sold under agreements to repurchase (including ¥224,056 million and ¥363,864 million measured at fair value by applying the fair value option as of March 31, 2021 and September 30, 2021, respectively) | 13,360,429 | 13,463,322 | ||||||
| Securities loaned (including ¥128,886 million and ¥110,905 million measured at fair value by applying the fair value option as of March 31, 2021 and September 30, 2021, respectively) | 1,380,629 | 1,515,820 | ||||||
| Other secured borrowings | 392,515 | 380,785 | ||||||
| Total collateralized financing | 15,133,573 | 15,359,927 | ||||||
| Trading liabilities | 9,473,261 | 9,645,764 | ||||||
| Other liabilities (including ¥44,708 million and ¥38,785 million measured at fair value by applying the fair value option as of March 31, 2021 and September 30, 2021, respectively) | 1,239,167 | 927,954 | ||||||
| Long-term borrowings (including ¥4,098,457 million and ¥4,369,366 million measured at fair value by applying the fair value option as of March 31, 2021 and September 30, 2021, respectively) | 7,975,012 | 8,695,951 | ||||||
| Total liabilities | 39,760,029 | 40,544,920 | ||||||
| Commitments and contingencies | 0 | |||||||
| Equity: | ||||||||
| Nomura Holdings, Inc. (“NHI”) shareholders’ equity: | ||||||||
| Common stock | ||||||||
| No par value share | ||||||||
| Authorized—6,000,000,000 shares as of March 31, 2021 and September 30, 2021 | ||||||||
| Issued—3,233,562,601 shares as of March 31, 2021 and September 30, 2021 | ||||||||
| Outstanding—3,063,155,434 shares as of March 31, 2021 and 3,094,756,680 shares as of September 30, 2021 | 594,493 | 594,493 | ||||||
Additional paid-in capital | 696,122 | 684,723 | ||||||
| Retained earnings | 1,533,713 | 1,557,697 | ||||||
| Accumulated other comprehensive income | (38,144 | ) | (28,506 | ) | ||||
| Total NHI shareholders’ equity before treasury stock | 2,786,184 | 2,808,407 | ||||||
| Common stock held in treasury, at cost—170,407,167 shares as of March 31, 2021 and 138,805,921 shares as of September 30, 2021 | (91,246 | ) | (74,321 | ) | ||||
| Total NHI shareholders’ equity | 2,694,938 | 2,734,086 | ||||||
| Noncontrolling interests | 61,513 | 67,546 | ||||||
| Total equity | 2,756,451 | 2,801,632 | ||||||
| Total liabilities and equity | ¥ | 42,516,480 | ¥ | 43,346,552 | ||||
F-3
Consolidated Balance Sheets—(Continued) (UNAUDITED)
The following table presents the classification of consolidated variable interest entities’ (“VIEs”) assets and liabilities included in the consolidated balance sheets above. The assets of a consolidated VIE may only be used to settle obligations of that VIE. Creditors do not typically have any recourse to Nomura beyond the assets held in the VIEs. See Note 6 “” for further information.
Securitizations and Variable Interest Entities
Billions of yen | ||||||||
March 31, 2021 | September 30, 2021 | |||||||
| Cash and cash deposits | ¥ | 13 | ¥ | 9 | ||||
| Trading assets and private equity and debt investments | 984 | 1,088 | ||||||
| Other assets | 77 | 219 | ||||||
| Total assets | ¥ | 1,074 | ¥ | 1,316 | ||||
| Trading liabilities | ¥ | 2 | ¥ | 2 | ||||
| Other liabilities | 2 | 2 | ||||||
| Borrowings | 837 | 930 | ||||||
| Total liabilities | ¥ | 841 | ¥ | 934 | ||||
The accompanying notes are an integral part of these consolidated financial statements.
F-4
Consolidated Statements of Income (UNAUDITED)
Millions of yen | ||||||||
Six months ended September 30 | ||||||||
2020 | 2021 | |||||||
| Revenue: | ||||||||
| Commissions | ¥ | 177,765 | ¥ | 174,522 | ||||
| Fees from investment banking | 37,859 | 69,604 | ||||||
| Asset management and portfolio service fees | 111,073 | 131,237 | ||||||
| Net gain on trading | 270,552 | 143,136 | ||||||
| Gain on private equity and debt investments | 2,875 | 26,463 | ||||||
| Interest and dividends | 189,037 | 134,461 | ||||||
| Gain on investments in equity securities | 5,413 | 5,550 | ||||||
| Other | 138,817 | 99,408 | ||||||
| Total revenue | 933,391 | 784,381 | ||||||
| Interest expense | 103,646 | 112,240 | ||||||
| Net revenue | 829,745 | 672,141 | ||||||
Non-interest expenses: | ||||||||
| Compensation and benefits | 275,303 | 264,848 | ||||||
| Commissions and floor brokerage | 56,186 | 54,213 | ||||||
| Information processing and communications | 85,822 | 89,235 | ||||||
| Occupancy and related depreciation | 36,114 | 34,562 | ||||||
| Business development expenses | 6,464 | 7,196 | ||||||
| Other | 104,418 | 125,087 | ||||||
Total non-interest expenses | 564,307 | 575,141 | ||||||
| Income before income taxes | 265,438 | 97,000 | ||||||
| Income tax expense | 52,217 | 41,524 | ||||||
| Net income | ¥ | 213,221 | ¥ | 55,476 | ||||
| Less: Net income attributable to noncontrolling interests | 3,063 | 3,776 | ||||||
| Net income attributable to NHI shareholders | ¥ | 210,158 | ¥ | 51,700 | ||||
Yen | ||||||||
Six months ended September 30 | ||||||||
2020 | 2021 | |||||||
| Per share of common stock: | ||||||||
| Basic— | ||||||||
| Net income attributable to NHI shareholders per share | ¥ | 68.87 | ¥ | 16.76 | ||||
| Diluted— | ||||||||
| Net income attributable to NHI shareholders per share | ¥ | 67.10 | ¥ | 16.25 | ||||
The accompanying notes are an integral part of these consolidated financial statements.
F-5
Consolidated Statements of Income—(Continued) (UNAUDITED)
Millions of yen | ||||||||
Three months ended September 30 | ||||||||
2020 | 2021 | |||||||
Revenue: | ||||||||
Commissions | ¥ | 92,253 | ¥ | 91,636 | ||||
Fees from investment banking | 27,031 | 33,901 | ||||||
Asset management and portfolio service fees | 57,417 | 67,193 | ||||||
Net gain on trading | 131,463 | 91,142 | ||||||
Gain on private equity and debt investments | 1,805 | 475 | ||||||
Interest and dividends | 82,494 | 69,925 | ||||||
Gain on investments in equity securities | 1,940 | 2,082 | ||||||
Other | 24,939 | 22,855 | ||||||
Total revenue | 419,342 | 379,209 | ||||||
Interest expense | 50,344 | 60,343 | ||||||
Net revenue | 368,998 | 318,866 | ||||||
Non-interest expenses: | ||||||||
Compensation and benefits | 137,006 | 129,245 | ||||||
Commissions and floor brokerage | 27,675 | 27,397 | ||||||
Information processing and communications | 42,584 | 45,136 | ||||||
Occupancy and related depreciation | 19,056 | 17,846 | ||||||
Business development expenses | 3,632 | 3,902 | ||||||
Other | 55,418 | 76,873 | ||||||
Total non-interest expenses | 285,371 | 300,399 | ||||||
| Income before income taxes | 83,627 | 18,467 | ||||||
| Income tax expense | 14,704 | 12,984 | ||||||
| Net income | ¥ | 68,923 | ¥ | 5,483 | ||||
| Less: Net income attributable to noncontrolling interests | 1,281 | 2,270 | ||||||
| Net income attributable to NHI shareholders | ¥ | 67,642 | ¥ | 3,213 | ||||
Yen | ||||||||
Three months ended September 30 | ||||||||
2020 | 2021 | |||||||
| Per share of common stock: | ||||||||
| Basic— | ||||||||
| Net income attributable to NHI shareholders per share | ¥ | 22.13 | ¥ | 1.04 | ||||
| Diluted— | ||||||||
| Net income attributable to NHI shareholders per share | ¥ | 21.52 | ¥ | 1.01 | ||||
The accompanying notes are an integral part of these consolidated financial statements.
F-6
Consolidated Statements of Comprehensive Income (UNAUDITED)
Millions of yen | ||||||||||
Six months ended September 30 | ||||||||||
2020 | 2021 | |||||||||
| Net income | ¥ | 213,221 | ¥ | 55,476 | ||||||
| Other comprehensive income (loss): | ||||||||||
Cumulative translation adjustments: | ||||||||||
Cumulative translation adjustments | (19,837 | ) | 6,370 | |||||||
Deferred income taxes | (60 | ) | (202 | ) | ||||||
Total | (19,897 | ) | 6,168 | |||||||
Defined benefit pension plans: | ||||||||||
Pension liability adjustment | 4,017 | 680 | ||||||||
Deferred income taxes | (627 | ) | (196 | ) | ||||||
Total | 3,390 | 484 | ||||||||
Own credit adjustments: | ||||||||||
Own credit adjustments | (53,351 | ) | 5,956 | |||||||
Deferred income taxes | 7,567 | (2,131 | ) | |||||||
Total | (45,784 | ) | 3,825 | |||||||
| Total other comprehensive income (loss) | (62,291 | ) | 10,477 | |||||||
| Comprehensive income | ¥ | 150,930 | ¥ | 65,953 | ||||||
| Less: Comprehensive income attributable to noncontrolling interests | 3,373 | 4,615 | ||||||||
| Comprehensive income attributable to NHI shareholders | ¥ | 147,557 | ¥ | 61,338 | ||||||
Millions of yen | ||||||||||
Three months ended September 30 | ||||||||||
2020 | 2021 | |||||||||
| Net income | ¥ | 68,923 | ¥ | 5,483 | ||||||
| Other comprehensive income (loss): | ||||||||||
Cumulative translation adjustments: | ||||||||||
Cumulative translation adjustments | (19,742 | ) | 9,134 | |||||||
Deferred income taxes | (46 | ) | 109 | |||||||
Total | (19,788 | ) | 9,243 | |||||||
Defined benefit pension plans: | ||||||||||
Pension liability adjustment | 1,210 | 810 | ||||||||
Deferred income taxes | (128 | ) | (335 | ) | ||||||
Total | 1,082 | 475 | ||||||||
Own credit adjustments: | ||||||||||
Own credit adjustments | (53,954 | ) | 231 | |||||||
Deferred income taxes | 9,662 | (699 | ) | |||||||
Total | (44,292 | ) | (468 | ) | ||||||
| Total other comprehensive income (loss) | (62,998 | ) | 9,250 | |||||||
| Comprehensive income | ¥ | 5,925 | ¥ | 14,733 | ||||||
| Less: Comprehensive income attributable to noncontrolling interests | 1,016 | 2,850 | ||||||||
| Comprehensive income attributable to NHI shareholders | ¥ | 4,909 | ¥ | 11,883 | ||||||
The accompanying notes are an integral part of these consolidated financial statements.
F-7
Consolidated Statements of Changes in Equity (UNAUDITED)
Millions of yen | ||||||||||
Six months ended September 30 | ||||||||||
2020 | 2021 | |||||||||
| Common stock | ||||||||||
Balance at beginning of year | ¥ | 594,493 | ¥ | 594,493 | ||||||
Balance at end of period | 594,493 | 594,493 | ||||||||
Additional paid-in capital | ||||||||||
Balance at beginning of year | 683,232 | 696,122 | ||||||||
Stock-based compensation awards | (1,117 | ) | (11,381 | ) | ||||||
Changes in an affiliated company’s interests in its subsidiary | 1,118 | 0— | ||||||||
Changes in an affiliated company’s interests | 0— | (18 | ) | |||||||
Balance at end of period | 683,233 | 684,723 | ||||||||
Retained earnings | ||||||||||
Balance at beginning of year | 1,645,451 | 1,533,713 | ||||||||
Cumulative effect of change in accounting principle (1) | (18,200 | ) | 0— | |||||||
Net income attributable to NHI shareholders | 210,158 | 51,700 | ||||||||
Cash dividends (2) | (61,156 | ) | (24,758 | ) | ||||||
Gain (loss) on sales of treasury stock | (562 | ) | (2,958 | ) | ||||||
Balance at end of period | 1,775,691 | 1,557,697 | ||||||||
Accumulated other comprehensive income (loss) | ||||||||||
Cumulative translation adjustments | ||||||||||
Balance at beginning of year | (26,274 | ) | 18,316 | |||||||
Net change during the period | (20,207 | ) | 5,329 | |||||||
Balance at end of period | (46,481 | ) | 23,645 | |||||||
Defined benefit pension plans | ||||||||||
Balance at beginning of year | (62,571 | ) | (43,477 | ) | ||||||
Pension liability adjustment | 3,390 | 484 | ||||||||
Balance at end of period | (59,181 | ) | (42,993 | ) | ||||||
Own credit adjustments | ||||||||||
Balance at beginning of year | 62,740 | (12,983 | ) | |||||||
Own credit adjustments | (45,784 | ) | 3,825 | |||||||
Balance at end of period | 16,956 | (9,158 | ) | |||||||
Balance at end of period | (88,706 | ) | (28,506 | ) | ||||||
Common stock held in treasury | ||||||||||
Balance at beginning of year | (243,604 | ) | (91,246 | ) | ||||||
Repurchases of common stock | (3 | ) | (6 | ) | ||||||
Sales of common stock | 0 | 0 | ||||||||
Common stock issued to employees | 10,292 | 16,931 | ||||||||
Balance at end of period | (233,315 | ) | (74,321 | ) | ||||||
Total NHI shareholders’ equity | ||||||||||
Balance at end of period | 2,731,396 | 2,734,086 | ||||||||
Noncontrolling interests | ||||||||||
Balance at beginning of year | 77,797 | 61,513 | ||||||||
Cash dividends | (723 | ) | (1,914 | ) | ||||||
Net income attributable to noncontrolling interests | 3,063 | 3,776 | ||||||||
Accumulated other comprehensive income (loss) attributable to noncontrolling interests | 310 | 839 | ||||||||
Purchase / sale of subsidiary shares, net | 160 | 277 | ||||||||
Other net change in noncontrolling interests | (25,949 | ) | 3,055 | |||||||
Balance at end of period | 54,658 | 67,546 | ||||||||
Total equity | ||||||||||
Balance at end of period | ¥ | 2,786,054 | ¥ | 2,801,632 | ||||||
| (1) | Represents the adjustments to initially apply ASU 2016-13, “Measurement of Credit Losses on Financial Instruments |
| (2) | Dividends per share Six months ended September 30, 2020 ¥ 20.00 Six months ended September 30, 2021 ¥ 8.00 |
The accompanying notes are an integral part of these consolidated financial
statements.
F-8
Consolidated Statements of Changes in Equity—(Continued) (UNAUDITED)
Millions of yen | ||||||||||||
Three months ended September 30 | ||||||||||||
2020 | 2021 | |||||||||||
| Common stock | ||||||||||||
Balance at beginning of year | ¥ | 594,493 | ¥ | 594,493 | ||||||||
Balance at end of period | 594,493 | 594,493 | ||||||||||
Additional paid-in capital | ||||||||||||
Balance at beginning of year | 676,040 | 677,476 | ||||||||||
Stock-based compensation awards | 7,197 | 7,247 | ||||||||||
Changes in an affiliated company’s interests in its subsidiary | (4 | ) | 0— | |||||||||
Balance at end of period | 683,233 | 684,723 | ||||||||||
Retained earnings | ||||||||||||
Balance at beginning of year | 1,769,225 | 1,579,330 | ||||||||||
Net income attributable to NHI shareholders | 67,642 | 3,213 | ||||||||||
Cash dividends (1) | (61,156 | ) | (24,758 | ) | ||||||||
Gain (loss) on sales of treasury stock | (20 | ) | (88 | ) | ||||||||
Balance at end of period | 1,775,691 | 1,557,697 | ||||||||||
Accumulated other comprehensive income (loss) | ||||||||||||
Cumulative translation adjustments | ||||||||||||
Balance at beginning of year | (26,958 | ) | 14,982 | |||||||||
Net change during the period | (19,523 | ) | 8,663 | |||||||||
Balance at end of period | (46,481 | ) | 23,645 | |||||||||
Defined benefit pension plans | ||||||||||||
Balance at beginning of year | (60,263 | ) | (43,468 | ) | ||||||||
Pension liability adjustment | 1,082 | 475 | ||||||||||
Balance at end of period | (59,181 | ) | (42,993 | ) | ||||||||
Own credit adjustments | ||||||||||||
Balance at beginning of year | 61,248 | (8,690 | ) | |||||||||
Own credit adjustments | (44,292 | ) | (468 | ) | ||||||||
Balance at end of period | 16,956 | (9,158 | ) | |||||||||
Balance at end of period | (88,706 | ) | (28,506 | ) | ||||||||
Common stock held in treasury | ||||||||||||
Balance at beginning of year | (234,282 | ) | (74,896 | ) | ||||||||
Repurchases of common stock | (2 | ) | (3 | ) | ||||||||
Sales of common stock | 0 | 0 | ||||||||||
Common stock issued to employees | 969 | 578 | ||||||||||
Balance at end of period | (233,315 | ) | (74,321 | ) | ||||||||
Total NHI shareholders’ equity | ||||||||||||
Balance at end of period | 2,731,396 | 2,734,086 | ||||||||||
Noncontrolling interests | ||||||||||||
Balance at beginning of year | 51,140 | 65,093 | ||||||||||
Cash dividends | 267 | (304 | ) | |||||||||
Net income attributable to noncontrolling interests | 1,281 | 2,270 | ||||||||||
Accumulated other comprehensive income (loss) attributable to noncontrolling interests | (265 | ) | 580 | |||||||||
Purchase / sale of subsidiary shares, net | (370 | ) | 80 | |||||||||
Other net change in noncontrolling interests | 2,605 | (173 | ) | |||||||||
Balance at end of period | 54,658 | 67,546 | ||||||||||
Total equity | ||||||||||||
Balance at end of period | ¥ | 2,786,054 | ¥ | 2,801,632 | ||||||||
| (1) | Dividends per share Three months ended September 30, 2020 ¥ 20.00 Three months ended September 30, 2021 ¥ 8.00 |
The accompanying notes are an integral part of these consolidated financial statements.
F-9
Consolidated Statements of Cash Flows (UNAUDITED)
Millions of yen | ||||||||
Six months ended September 30 | ||||||||
2020 | 2021 | |||||||
Cash flows from operating activities: | ||||||||
Net income | ¥ | 213,221 | ¥ | 55,476 | ||||
Adjustments to reconcile net income to net cash provided by (used in) operating activities: | ||||||||
Depreciation and amortization | 30,848 | 29,574 | ||||||
Gain on investments in equity securities | (5,413 | ) | (5,550 | ) | ||||
Gain on investments in subsidiaries and affiliates | (2,440 | ) | (36,249 | ) | ||||
Gain on disposal of office buildings, land, equipment and facilities | (71,818 | ) | (3,957 | ) | ||||
Deferred income taxes | 13,429 | 11,263 | ||||||
Changes in operating assets and liabilities: | ||||||||
Time deposits | 121,608 | (61,957 | ) | |||||
Deposits with stock exchanges and other segregated cash | (21,109 | ) | 62,040 | |||||
Trading assets and private equity and debt investments | 133,749 | (591,566 | ) | |||||
Trading liabilities | 347,655 | 139,755 | ||||||
Securities purchased under agreements to resell, net of securities sold under agreements to repurchase | (458,341 | ) | (409,458 | ) | ||||
Securities borrowed, net of securities loaned | 160,407 | 745,760 | ||||||
Other secured borrowings | (368,925 | ) | (11,756 | ) | ||||
Loans and receivables, net of allowance for credit losses | 1,335,730 | (124,048 | ) | |||||
Payables | (568,245 | ) | 47,178 | |||||
Bonus accrual | (21,810 | ) | (62,677 | ) | ||||
Accrued income taxes, net | 19,934 | (52,004 | ) | |||||
Other, net | (35,469 | ) | 45,559 | |||||
Net cash provided by (used in) operating activities | 823,011 | (222,617 | ) | |||||
Cash flows from investing activities: | ||||||||
Payments for purchases of office buildings, land, equipment and facilities | (51,805 | ) | (51,843 | ) | ||||
Proceeds from sales of office buildings, land, equipment and facilities | 17,246 | 24,679 | ||||||
Payments for purchases of investments in equity securities | 0— | (100 | ) | |||||
Proceeds from sales of investments in equity securities | 4,743 | 434 | ||||||
Increase in loans receivable at banks, net | (6,026 | ) | (41,540 | ) | ||||
Decrease (increase) in non-trading debt securities, net | 46,414 | (17,578 | ) | |||||
Business acquisition | (11,152 | ) | 0— | |||||
Decrease (increase) in investments in affiliated companies, net | (9,651 | ) | 49,845 | |||||
Other, net | 5,697 | 30,162 | ||||||
Net cash used in investing activities | (4,534 | ) | (5,941 | ) | ||||
Cash flows from financing activities: | ||||||||
Increase in long-term borrowings | 1,329,842 | 2,320,541 | ||||||
Decrease in long-term borrowings | (1,006,945 | ) | (1,649,198 | ) | ||||
Decrease in short-term borrowings, net | (257,216 | ) | (230,220 | ) | ||||
Increase (decrease) in deposits received at banks, net | (105,361 | ) | 152,890 | |||||
Proceeds from sales of common stock held in treasury | 4 | 8 | ||||||
Payments for repurchases of common stock held in treasury | (3 | ) | (6 | ) | ||||
Payments for cash dividends | (15,195 | ) | (45,952 | ) | ||||
Contribution from noncontrolling interests | 6,257 | 0— | ||||||
Net cash provided by (used in) financing activities | (48,617 | ) | 548,063 | |||||
Effect of exchange rate changes on cash, cash equivalents, restricted cash and restricted cash equivalents | (20,229 | ) | 6,726 | |||||
Net increase in cash, cash equivalents, restricted cash and restricted cash equivalents | 749,631 | 326,231 | ||||||
Cash, cash equivalents, restricted cash and restricted cash equivalents at beginning of year | 3,192,310 | 3,510,011 | ||||||
Cash, cash equivalents, restricted cash and restricted cash equivalents at end of period | ¥ | 3,941,941 | ¥ | 3,836,242 | ||||
Supplemental information: | ||||||||
Cash paid during the period for— | ||||||||
Interest | ¥ | 111,043 | ¥ | 112,168 | ||||
Income tax payments, net | ¥ | 18,855 | ¥ | 82,265 | ||||
F-10
Consolidated Statements of Cash Flows—(Continued) (UNAUDITED)
The following table presents a reconciliation of cash, cash equivalents, restricted cash and restricted cash equivalents as reported within the consolidated balance sheets to the total of the same such amounts shown in the statements of cash flows above. Restricted cash and restricted cash equivalents are amounts where access, withdrawal or usage by Nomura is substantively prohibited by a third party entity outside of the Nomura group.
Millions of yen | ||||||||
Six months ended September 30 | ||||||||
2020 | 2021 | |||||||
Cash and cash equivalents reported in Cash and cash equivalents | ¥ | 3,941,802 | ¥ | 3,836,088 | ||||
Restricted cash and restricted cash equivalents reported in Deposits with stock exchanges and other segregated cash | ¥ | 139 | ¥ | 154 | ||||
| Total cash, cash equivalent, restricted cash and restricted cash equivalents | ¥ | 3,941,941 | ¥ | 3,836,242 | ||||
Non-cash—
Total amount of Right- of use assets recognized during the six months ended September 30, 2020 and September 30, 2021 were ¥45,445 million and ¥16,317 million, respectively.
The accompanying notes are an integral part of these consolidated financial statements.
F-11
Notes to the Interim Consolidated Financial Statements (UNAUDITED)
1. Summary of accounting policies:
Description of business—
Nomura Holdings, Inc. (“Company”) and its broker-dealer, banking and other financial services subsidiaries provide investment, financing and related services to individual, institutional and government clients on a global basis. The Company and other entities in which it has a controlling financial interest are collectively referred to as “Nomura” within these consolidated financial statements.
Nomura operates its business through various divisions based upon the nature of specific products and services, its main client base and its management structure. Nomura reports operating results through 3 business segments:
Retail,
Investment
Management and Wholesale.In its Retail segment, Nomura provides investment consultation services mainly to individual clients in Japan. In its
Investment
Management segment, Nomura develops and manages investment trusts, and provides investment advisory services. In its Wholesale segment, Nomura engages in the sales and trading of debt and equity securities, derivatives, and currencies on a global basis, and provides investment banking services such as the underwriting of debt and equity securities as well as mergers and acquisitions and financial advice.The accounting and financial reporting policies of Nomura conform to U. S. generally accepted accounting principles (“U. S.GAAP”) as applicable to broker dealers. A summary of the significant accounting policies applied by Nomura within these interim consolidated financial statements is provided within in the notes to the consolidated financial statements of Nomura’s annual report on Form
20-F
for the year ended March 31, 2021 as filed on June 25, 2021 as amended by certain new accounting pronouncements adopted by the Company during the six months ended September 30, 2021 and discussed further below.Use of estimates—
While the COVID-19 pandemic has impacted some of the critical accounting estimates and underlying assumptions used in the consolidated financial statements during the year ended March 31, 2021, no further significant adverse changes in these estimates occurred during the six months ended September 30, 2021 as a result of the COVID-19 pandemic.
New accounting pronouncements recently adopted—
No new accounting pronouncements relevant to Nomura were adopted during the six months ended September 30, 2021.
Future accounting developments—
There are no new authoritative accounting pronouncements relevant to Nomura which may have a material impact on these consolidated financial statements to be adopted on or after April 1, 2022.
F-12
Notes to the Interim Consolidated Financial Statements—(Continued) (UNAUDITED)
2. Fair value measurements:
The fair value of financial instruments
A significant amount of Nomura’s financial instruments are measured at fair value. Financial assets measured at fair value on a recurring basis are reported in the consolidated balance sheets withinand. Financial liabilities measured at fair value on a recurring basis are reported withinand
Trading assets and private equity and debt investments, Loans and receivables, Collateralized agreements
Other assets
Trading liabilities, Short-term borrowings, Payables and deposits, Collateralized financing, Long-term borrowings
Other liabilities.
Other financial assets and financial liabilities are measured at fair value on a nonrecurring basis, where the primary measurement basis is not fair value but where fair value is used in specific circumstances after initial recognition, such as to measure impairment.
In all cases, fair value is determined in accordance with ASC 820 “” (“ASC 820”) which defines fair value as the amount that would be exchanged to sell a financial asset or transfer a financial liability in an orderly transaction between market participants at the measurement date. It assumes that the transaction occurs in the principal market for the relevant financial assets or financial liabilities, or in the absence of a principal market, the most advantageous market.
Fair Value Measurements and Disclosures
Fair value is usually determined on an individual financial instrument basis consistent with the unit of account of the financial instrument. However, certain financial instruments managed on a portfolio basis are valued as a portfolio, namely based on the price that would be received to sell a net long position (i.e., a net financial asset) or transfer a net short position (i.e., a net financial liability) consistent with how market participants would price the net risk exposure at the measurement date.
Financial assets measured at fair value also include investments in certain funds where, as a practical expedient, fair value is determined on the basis of net asset value per share (“NAV per share”) if the NAV per share is calculated in accordance with certain industry standard principles.
Increases and decreases in the fair value of assets and liabilities will significantly impact Nomura’s position, performance, liquidity and capital resources. As explained below, valuation techniques applied contain inherent uncertainties and Nomura is unable to predict the accurate impact of future developments in the market. The valuation of financial instruments is more difficult during periods of market stress as a result of greater volatility and reduced price transparency, which has been the case during the
COVID-19
pandemic in 2020, and may therefore require the greater use of judgement in the determination of fair value. Where appropriate, Nomura uses economic hedging strategies to mitigate its risk, although these hedges are also subject to unpredictable movements in the market.Valuation methodology for financial instruments carried at fair value on a recurring basis
The fair value of financial instruments is based on quoted market prices including market indices, broker or dealer quotations or an estimation by management of the expected exit price under current market conditions. Various financial instruments, including cash instruments and(“OTC”) contracts, have bid and offer prices that are observable in the market. These are measured at the point within the
over-the-counter
bid-offer
range which best represents Nomura’s estimate of fair value. Where quoted market prices or broker or dealer quotations are not available, prices for similar instruments or valuation pricing models are considered in the determination of fair value.Where quoted prices are available in active markets, no valuation adjustments are taken to modify the fair value of assets or liabilities marked using such prices. Other instruments may be measured using valuation techniques, such as valuation pricing models incorporating observable valuation inputs, unobservable parameters or a combination of both. Valuation pricing models use valuation inputs which would be considered by market participants in valuing similar financial instruments.
Valuation pricing models and their underlying assumptions impact the amount and timing of unrealized and realized gains and losses recognized, and the use of different valuation pricing models or underlying assumptions could produce different financial results. Valuation uncertainty results from a variety of factors, including the valuation technique or model selected, the quantitative assumptions used within the valuation model, the inputs into the model, as well as other factors. Valuation adjustments are used to reflect the assessment of this uncertainty. Common valuation adjustments include model reserves, credit adjustments,
close-out
adjustments, and other appropriate instrument-specific adjustments, such as those to reflect transfer or sale restrictions. F-13
Notes to the Interim Consolidated Financial Statements—(Continued) (UNAUDITED)
The level of adjustments is largely judgmental and is based on an assessment of the factors that management believe other market participants would use in determining the fair value of similar financial instruments. The type of adjustments taken, the methodology for the calculation of these adjustments, and the valuation inputs for these calculations are reassessed periodically to reflect current market practice and the availability of new information.
For example, the fair value of certain financial instruments includes adjustments for credit risk; both with regards to counterparty credit risk on positions held and Nomura’s own creditworthiness on positions issued. Credit risk on financial assets is significantly mitigated by credit enhancements such as collateral and netting arrangements. Any net credit exposure is measured using available and applicable valuation inputs for the relevant counterparty. The same approach is used to measure the credit exposure on Nomura’s financial liabilities as is used to measure counterparty credit risk on Nomura’s financial assets.
Such valuation pricing models are calibrated to the market on a regular basis and inputs used are adjusted for current market conditions and risks. The Valuation Model Validation Group (“VMVG”) within Nomura’s Risk Management Department reviews pricing models and assesses model appropriateness and consistency independently of the front office. The model reviews consider a number of factors about a model’s suitability for valuation and sensitivity of a particular product. Valuation models are calibrated to the market on a periodic basis by comparison to observable market pricing, comparison with alternative models and analysis of risk profiles.
As explained above, any changes in fixed income, equity, foreign exchange and commodity markets can impact Nomura’s estimates of fair value in the future, potentially affecting trading gains and losses. Where financial contracts have longer maturity dates, Nomura’s estimates of fair value may involve greater subjectivity due to the lack of transparent market data.
Fair value hierarchy
All financial instruments measured at fair value, including those measured at fair value using the fair value option, have been categorized into a three-level hierarchy (“fair value hierarchy”) based on the transparency of valuation inputs used by Nomura to estimate fair value. A financial instrument is classified in the fair value hierarchy based on the lowest level of input that is significant to the fair value measurement of the financial instrument. The three levels of the fair value hierarchy are defined as follows, with Level 1 representing the most transparent inputs and Level 3 representing the least transparent inputs:
Level 1:
Observable valuation inputs that reflect quoted prices (unadjusted) for identical financial instruments traded in active markets at the measurement date.
Level 2:
Valuation inputs other than quoted prices included within Level 1 that are either directly or indirectly observable for the financial instrument.
Level 3:
Unobservable valuation inputs which reflect Nomura assumptions and specific data.
The availability of valuation inputs observable in the market varies by product and can be affected by a variety of factors. Significant factors include, but are not restricted to the prevalence of similar products in the market, especially for customized products, how established the product is in the market, for example, whether it is a new product or is relatively mature, and the reliability of information provided in the market which would depend, for example, on the frequency and volume of current data. A period of significant change in the market may reduce the availability of observable data. Under such circumstances, financial instruments may be reclassified into a lower level in the fair value hierarchy.
Significant judgments used in determining the classification of financial instruments include the nature of the market in which the product would be traded, the underlying risks, the type and liquidity of market data inputs and the nature of observed transactions for similar instruments.
Where valuation models include the use of valuation inputs which are less observable or unobservable in the market, significant management judgment is used in establishing fair value. The valuations for Level 3 financial instruments, therefore, involve a greater degree of judgment than those valuations for Level 1 or Level 2 financial instruments and has become more prevalent during the
COVID-19
pandemic.Certain criteria management use to determine whether a market is active or inactive include the number of transactions, the frequency that pricing is updated by other market participants, the variability of price quotes among market participants, and the amount of publicly available information.
F-14
Notes to the Interim Consolidated Financial Statements—(Continued) (UNAUDITED)
The following tables present the amounts of Nomura’s financial instruments measured at fair value on a recurring basis as of March 31, 2021 and September 30, 2021 within the fair value hierarchy.
Billions of yen | ||||||||||||||||||||
March 31, 2021 | ||||||||||||||||||||
Level 1 | Level 2 | Level 3 | Counterparty and Cash Collateral Netting (1) | Balance as of March 31, 2021 | ||||||||||||||||
Assets: | ||||||||||||||||||||
Trading assets and private equity and debt investments (2) | ||||||||||||||||||||
Equities (3) | ¥ | 2,338 | ¥ | 968 | ¥ | 16 | ¥ | 0— | ¥ | 3,322 | ||||||||||
Private equity and debt investments (4) | 0— | 0— | 58 | 0— | 58 | |||||||||||||||
Japanese government securities | 1,637 | 0— | 0— | 0— | 1,637 | |||||||||||||||
Japanese agency and municipal securities | 0— | 76 | 2 | 0— | 78 | |||||||||||||||
Foreign government, agency and municipal securities | 2,838 | 1,987 | 12 | 0— | 4,837 | |||||||||||||||
Bank and corporate debt securities and loans for trading purposes | 0— | 1,259 | 135 | 0— | 1,394 | |||||||||||||||
Commercial mortgage-backed securities (“CMBS”) | 0— | 0 | 8 | 0— | 8 | |||||||||||||||
Residential mortgage-backed securities (“RMBS”) | 0— | 2,387 | 6 | 0— | 2,393 | |||||||||||||||
Issued/Guaranteed by government sponsored entity | 0— | 2,325 | 0— | 0— | 2,325 | |||||||||||||||
Other | 0— | 62 | 6 | 0— | 68 | |||||||||||||||
Real estate-backed securities | 0— | 0 | 106 | 0— | 106 | |||||||||||||||
Collateralized debt obligations (“CDOs”) and other (5) | 0— | 36 | 23 | 0— | 59 | |||||||||||||||
Investment trust funds and other | 573 | 29 | 0 | 0— | 602 | |||||||||||||||
Total trading assets and private equity and debt investments | 7,386 | 6,742 | 366 | 0— | 14,494 | |||||||||||||||
Derivative assets (6) | ||||||||||||||||||||
Equity contracts | 9 | 1,318 | 75 | 0— | 1,402 | |||||||||||||||
Interest rate contracts | 29 | 9,577 | 26 | 0— | 9,632 | |||||||||||||||
Credit contracts | 4 | 427 | 24 | 0— | 455 | |||||||||||||||
Foreign exchange contracts | 0 | 4,479 | 37 | 0— | 4,516 | |||||||||||||||
Commodity contracts | 1 | 0 | 0— | 0— | 1 | |||||||||||||||
Netting | 0— | 0— | 0— | (14,786 | ) | (14,786 | ) | |||||||||||||
Total derivative assets | 43 | 15,801 | 162 | (14,786 | ) | 1,220 | ||||||||||||||
Subtotal | ¥ | 7,429 | ¥ | 22,543 | ¥ | 528 | ¥ | (14,786 | ) | ¥ | 15,714 | |||||||||
Loans and receivables (7) | 0— | 878 | 104 | 0— | 982 | |||||||||||||||
Collateralized agreements (8) | 0— | 349 | 18 | 0— | 367 | |||||||||||||||
Other assets | ||||||||||||||||||||
Non-trading debt securities | 123 | 304 | 0— | 0— | 427 | |||||||||||||||
Other (2)(3) | 353 | 173 | 185 | 0— | 711 | |||||||||||||||
Total | ¥ | 7,905 | ¥ | 24,247 | ¥ | 835 | ¥ | (14,786 | ) | ¥ | 18,201 | |||||||||
Liabilities: | ||||||||||||||||||||
Trading liabilities | ||||||||||||||||||||
Equities | ¥ | 2,341 | ¥ | 20 | ¥ | 0 | ¥ | 0— | ¥ | 2,361 | ||||||||||
Japanese government securities | 1,039 | 0— | 0— | 0— | 1,039 | |||||||||||||||
Japanese agency and municipal securities | 0— | 1 | 0— | 0— | 1 | |||||||||||||||
Foreign government, agency and municipal securities | 2,912 | 1,172 | 1 | 0— | 4,085 | |||||||||||||||
Bank and corporate debt securities | 0— | 230 | 5 | 0— | 235 | |||||||||||||||
Residential mortgage-backed securities (“RMBS”) | 0— | 0 | 0— | 0— | 0 | |||||||||||||||
Collateralized debt obligations (“CDOs”) and other (5) | 0— | 0 | 1 | 0— | 1 | |||||||||||||||
Investment trust funds and other | 243 | 13 | 0 | 0— | 256 | |||||||||||||||
Total trading liabilities | 6,535 | 1,436 | 7 | 0— | 7,978 | |||||||||||||||
Derivative liabilities (6) | ||||||||||||||||||||
Equity contracts | 1 | 2,112 | 116 | 0— | 2,229 | |||||||||||||||
Interest rate contracts | 21 | 8,948 | 69 | 0— | 9,038 | |||||||||||||||
Credit contracts | 3 | 458 | 62 | 0— | 523 | |||||||||||||||
Foreign exchange contracts | 0— | 4,380 | 22 | 0— | 4,402 | |||||||||||||||
Commodity contracts | 0 | 0 | 0— | 0— | 0 | |||||||||||||||
Netting | 0— | 0— | 0— | (14,697 | ) | (14,697 | ) | |||||||||||||
Total derivative liabilities | 25 | 15,898 | 269 | (14,697 | ) | 1,495 | ||||||||||||||
Subtotal | ¥ | 6,560 | ¥ | 17,334 | ¥ | 276 | ¥ | (14,697 | ) | ¥ | 9,473 | |||||||||
Short-term borrowings (9) | ¥ | 0— | ¥ | 532 | ¥ | 103 | ¥ | 0— | ¥ | 635 | ||||||||||
Payables and deposits (10) | 0— | 49 | 1 | 0— | 50 | |||||||||||||||
Collateralized financing (8) | 0— | 352 | 1 | 0— | 353 | |||||||||||||||
Long-term borrowings (9)(11)(12) | 5 | 3,546 | 547 | 0— | 4,098 | |||||||||||||||
Other liabilities (13) | 231 | 179 | 35 | 0— | 445 | |||||||||||||||
Total | ¥ | 6,796 | ¥ | 21,992 | ¥ | 963 | ¥ | (14,697 | ) | ¥ | 15,054 | |||||||||
F-15
Notes to the Interim Consolidated Financial Statements—(Continued) (UNAUDITED)
Billions of yen | ||||||||||||||||||||
September 30, 2021 | ||||||||||||||||||||
Level 1 | Level 2 | Level 3 | Counterparty and Cash Collateral Netting (1) | Balance as of September 30, 2021 | ||||||||||||||||
Assets: | ||||||||||||||||||||
Trading assets and private equity and debt investments (2) | ||||||||||||||||||||
Equities (3) | ¥ | 2,100 | ¥ | 941 | ¥ | 12 | ¥ | 0— | ¥ | 3,053 | ||||||||||
Private equity and debt investments (4) | 23 | 0— | 47 | 0— | 70 | |||||||||||||||
Japanese government securities | 2,110 | 0— | 0— | 0— | 2,110 | |||||||||||||||
Japanese agency and municipal securities | 0— | 62 | 2 | 0— | 64 | |||||||||||||||
Foreign government, agency and municipal securities | 4,206 | 1,819 | 10 | 0— | 6,035 | |||||||||||||||
Bank and corporate debt securities and loans for trading purposes | 0— | 1,231 | 132 | 0— | 1,363 | |||||||||||||||
Commercial mortgage-backed securities (“CMBS”) | 0— | 0 | 8 | 0— | 8 | |||||||||||||||
Residential mortgage-backed securities (“RMBS”) | 0— | 2,032 | 7 | 0— | 2,039 | |||||||||||||||
Issued/Guaranteed by government sponsored entity | 0— | 1,967 | 0— | 0— | 1,967 | |||||||||||||||
Other | 0— | 65 | 7 | 0— | 72 | |||||||||||||||
Real estate-backed securities | 0— | 0 | 123 | 0— | 123 | |||||||||||||||
Collateralized debt obligations (“CDOs”) and other (5) | 0— | 28 | 23 | 0— | 51 | |||||||||||||||
Investment trust funds and other | 277 | 21 | 0 | 0— | 298 | |||||||||||||||
Total trading assets and private equity and debt investments | 8,716 | 6,134 | 364 | 0— | 15,214 | |||||||||||||||
Derivative assets (6) | ||||||||||||||||||||
Equity contracts | 0 | 1,047 | 107 | 0— | 1,154 | |||||||||||||||
Interest rate contracts | 25 | 8,247 | 25 | 0— | 8,297 | |||||||||||||||
Credit contracts | 3 | 398 | 25 | 0— | 426 | |||||||||||||||
Foreign exchange contracts | 1 | 3,587 | 30 | 0— | 3,618 | |||||||||||||||
Commodity contracts | 3 | 0 | 0— | 0— | 3 | |||||||||||||||
Netting | 0— | 0— | 0— | (12,333 | ) | (12,333 | ) | |||||||||||||
Total derivative assets | 32 | 13,279 | 187 | (12,333 | ) | 1,165 | ||||||||||||||
Subtotal | ¥ | 8,748 | ¥ | 19,413 | ¥ | 551 | ¥ | (12,333 | ) | ¥ | 16,379 | |||||||||
Loans and receivables (7) | 0— | 941 | 123 | 0— | 1,064 | |||||||||||||||
Collateralized agreements (8) | 0— | 301 | 13 | 0— | 314 | |||||||||||||||
Other assets | ||||||||||||||||||||
Non-trading debt securities | 122 | 322 | 0— | 0— | 444 | |||||||||||||||
Other (2)(3) | 184 | 104 | 209 | 0— | 497 | |||||||||||||||
Total | ¥ | 9,054 | ¥ | 21,081 | ¥ | 896 | ¥ | (12,333 | ) | ¥ | 18,698 | |||||||||
Liabilities: | ||||||||||||||||||||
Trading liabilities | ||||||||||||||||||||
Equities | ¥ | 1,586 | ¥ | 16 | ¥ | 0 | ¥ | 0— | ¥ | 1,602 | ||||||||||
Japanese government securities | 988 | 0— | 0— | 0— | 988 | |||||||||||||||
Japanese agency and municipal securities | 0— | 0 | 0— | 0— | 0 | |||||||||||||||
Foreign government, agency and municipal securities | 4,152 | 1,185 | 0 | 0— | 5,337 | |||||||||||||||
Bank and corporate debt securities | 0— | 241 | 6 | 0— | 247 | |||||||||||||||
Residential mortgage-backed securities (“RMBS”) | 0— | 0 | 0— | 0— | 0 | |||||||||||||||
Collateralized debt obligations (“CDOs”) and other (5) | 0— | 0 | 0 | 0— | 0 | |||||||||||||||
Investment trust funds and other | 168 | 25 | 0 | 0— | 193 | |||||||||||||||
Total trading liabilities | 6,894 | 1,467 | 6 | 0— | 8,367 | |||||||||||||||
Derivative liabilities (6) | ||||||||||||||||||||
Equity contracts | 1 | 1,441 | 98 | 0— | 1,540 | |||||||||||||||
Interest rate contracts | 20 | 7,611 | 53 | 0— | 7,684 | |||||||||||||||
Credit contracts | 1 | 416 | 62 | 0— | 479 | |||||||||||||||
Foreign exchange contracts | 0— | 3,550 | 20 | 0— | 3,570 | |||||||||||||||
Commodity contracts | 0 | 0 | 0— | 0— | 0 | |||||||||||||||
Netting | 0— | 0— | 0— | (11,994 | ) | (11,994 | ) | |||||||||||||
Total derivative liabilities | 22 | 13,018 | 233 | (11,994 | ) | 1,279 | ||||||||||||||
Subtotal | ¥ | 6,916 | ¥ | 14,485 | ¥ | 239 | ¥ | (11,994 | ) | ¥ | 9,646 | |||||||||
Short-term borrowings (9) | 0— | 597 | 86 | 0— | 683 | |||||||||||||||
Payables and deposits (10) | 0— | 54 | 2 | 0— | 56 | |||||||||||||||
Collateralized financing (8) | 0— | 475 | 0— | 0— | 475 | |||||||||||||||
Long-term borrowings (9)(11)(12) | 11 | 3,847 | 511 | 0— | 4,369 | |||||||||||||||
Other liabilities (13) | 70 | 117 | 24 | 0— | 211 | |||||||||||||||
Total | ¥ | 6,997 | ¥ | 19,575 | ¥ | 862 | ¥ | (11,994 | ) | ¥ | 15,440 | |||||||||
F-16
Notes to the Interim Consolidated Financial Statements—(Continued) (UNAUDITED)
| (1) | Represents the amount offset under counterparty netting of derivative assets and liabilities as well as cash collateral netting against net derivatives. |
| (2) | Certain investments that are measured at fair value using net asset value per share as a practical expedient have not been classified in the fair value hierarchy. As of March 31, 2021 and September 30, 2021, the fair values of these investments which are included in Trading assets and private equity and debt investments Other assets—Others |
| (3) | Includes equity investments that would have been accounted for under the equity method had Nomura not chosen to elect the fair value option. |
| (4) | Private equity and debt investments non-traded financial instruments including ownership or other forms of junior capital (such as mezzanine loan). Includes equity investments that would have been accounted for under the equity method had Nomura not chosen to elect the fair value option. |
| (5) | Includes collateralized loan obligations (“CLOs”) and asset-backed securities (“ABS”) such as those secured on credit card loans, auto loans and student loans. |
| (6) | Each derivative classification includes derivatives with multiple risk underlyings. For example, interest rate contracts include complex derivatives referencing interest rate risk as well as foreign exchange risk or other factors such as prepayment rates. Credit contracts include credit default swaps as well as derivatives referencing corporate and government debt securities. |
| (7) | Includes loans for which the fair value option has been elected. |
| (8) | Includes collateralized agreements or collateralized financing for which the fair value option has been elected. |
| (9) | Includes structured notes for which the fair value option has been elected. |
| (10) | Includes embedded derivatives bifurcated from deposits received at banks. If unrealized gains are greater than unrealized losses, deposits are reduced by the excess amount. |
| (11) | Includes embedded derivatives bifurcated from issued structured notes. If unrealized gains are greater than unrealized losses, borrowings are reduced by the excess amount. |
| (12) | Includes liabilities recognized from secured financing transactions that are accounted for as financings rather than sales. Nomura elected the fair value option for these liabilities. |
| (13) | Includes loan commitments for which the fair value option has been elected. |
F-17
Notes to the Interim Consolidated Financial Statements—(Continued) (UNAUDITED)
Valuation techniques by major class of financial instrument
The valuation techniques used by Nomura to estimate fair value for major classes of financial instruments, together with the significant inputs which determine classification in the fair value hierarchy, are as follows.
Equities
Other assets
Other assets
mid-market
prices. Nomura determines whether the market is active depending on the sufficiency and frequency of trading activity. Where these securities are classified in Level 1 of the fair value hierarchy, no valuation adjustments are made to fair value. Listed equity securities traded in inactive markets are also generally valued using the exchange price and are classified in Level 2. Whilst rare in practice, Nomura may apply a discount or liquidity adjustment to the exchange price of a listed equity security traded in an inactive market if the exchange price is not considered to be an appropriate representation of fair value. These adjustments are determined by individual security and are not determined or influenced by the size of holding. The amount of such adjustments made to listed equity securities traded in inactive markets was ¥nil as of March 31, 2021 and September 30, 2021, respectively. The fair value of unlisted equity securities is determined using the same methodology as private equity and debt investments described below and are usually classified in Level 3 because significant valuation inputs such as liquidity discounts and credit spreads are unobservable.Private equity and debt investments
Government, agency and municipal securities
Non-G7
government securities, agency securities and municipal securities are valued using similar pricing sources but are generally classified in Level 2 as they are traded in inactive markets. Certainnon-G7
securities may be classified in Level 1 because they are traded in active markets. Certain securities may be classified in Level 3 because they are traded infrequently and there is not sufficient information from comparable securities to classify them in Level 2. These are valued using DCF valuation techniques which include significant unobservable inputs such as credit spreads of the issuer.F-18
Notes to the Interim Consolidated Financial Statements—(Continued) (UNAUDITED)
Bank and corporate debt securities
Commercial mortgage-backed securities (“CMBS”)
Residential mortgage-backed securities (“RMBS”)
Real estate-backed securities
Collateralized debt obligations (“CDOs”) and other
Investment trust funds and other
Investment trust funds and other
F-19
Notes to the Interim Consolidated Financial Statements—(Continued) (UNAUDITED)
Derivatives—Equity contracts—
Derivatives—Interest rate contracts
Derivatives—Credit contracts
Derivatives—Foreign exchange
contracts
Nomura includes valuation adjustments in its estimation of fair value of certain OTC derivatives relating to funding costs associated with these transactions to be consistent with how market participants in the principal market for these derivatives would determine fair value.
F-20
Notes to the Interim Consolidated Financial Statements—(Continued) (UNAUDITED)
Loans
Collateralized agreements
Collateralized financing
Non-trading
debt securitiesnon-trading
subsidiaries in the group and are valued and classified in the fair value hierarchy using the same valuation techniques used for other debt securities classified asGovernment, agency and municipal securities
Bank and corporate debt securities
Short-term
long-term borrowings (“Structured notes”)
The fair value of structured notes is determined using a quoted price in an active market for the identical liability if available, and where not available, using a mixture of valuation techniques that use the quoted price of the identical liability when traded as an asset, quoted prices for similar liabilities, similar liabilities when traded as assets, or an internal model which combines DCF valuation techniques and option pricing models, depending on the nature of the embedded features within the structured note. Where an internal model is used, Nomura estimates the fair value of both the underlying debt instrument and the embedded derivative components. The significant valuation inputs used to estimate the fair value of the debt instrument component include yield curves, prepayment rates, default probabilities and loss severities. The significant valuation inputs used to estimate the fair value of the embedded derivative component are the same as those used for the relevant type of freestanding OTC derivative discussed above. A valuation adjustment is also made to the entire structured note in order to reflect Nomura’s own creditworthiness. This adjustment is determined based on recent observable secondary market transactions and executable broker quotes involving Nomura debt instruments and is therefore typically treated as a Level 2 valuation input. Structured notes are generally classified in Level 2 of the fair value hierarchy as all significant valuation inputs and adjustments are observable. Where any unobservable inputs are significant, such as yields, prepayment rates, default probabilities, loss severities, volatilities and correlations used to estimate the fair value of the embedded derivative component, structured notes are classified in Level 3.
Long-term borrowings (“Secured financing transactions”)
Transfer and Servicing
(“ASC 860”) and therefore the transaction is accounted for as a secured borrowing. These liabilities are valued using the same valuation techniques that are applied to the transferred financial assets which remain on the consolidated balance sheets and are therefore classified in the same level in the fair value hierarchy as the transferred financial assets. These liabilities do not provide general recourse to Nomura and therefore no adjustment is made to reflect Nomura’s own creditworthiness.
F-21
Notes to the Interim Consolidated Financial Statements—(Continued) (UNAUDITED)
Level 3 financial instruments
The valuation of Level 3 financial assets and liabilities is dependent on certain significant valuation inputs which are unobservable. Common characteristics of an inactive market include a low number of transactions of the financial instrument, stale or
non-current
price quotes, price quotes that vary substantially either over time or among market makers,non-executable
broker quotes or little publicly released information.If corroborative evidence is not available to value Level 3 financial instruments, fair value may be measured using other equivalent products in the market. The level of correlation between the specific Level 3 financial instrument and the available benchmark instrument is considered as an unobservable valuation input. Other techniques for determining an appropriate value for unobservable input may consider information such as consensus pricing data among certain market participants, historical trends, extrapolation from observable market data and other information Nomura would expect market participants to use in valuing similar instruments.
Use of reasonably possible alternative valuation input assumptions to value Level 3 financial instruments will significantly influence fair value determination. Ultimately, the uncertainties described above about input assumptions imply that the fair value of Level 3 financial instruments is a judgmental estimate. The specific valuation for each instrument is based on management’s judgment of prevailing market conditions, in accordance with Nomura’s established valuation policies and procedures.
F-22
Notes to the Interim Consolidated Financial Statements—(Continued) (UNAUDITED)
Quantitative and qualitative information regarding significant unobservable inputs
The following tables present quantitative and qualitative information about the significant unobservable valuation inputs used by Nomura to measure the fair value of financial instruments classified in Level 3 as of March 31, 2021 and September 30, 2021. These financial instruments will also typically include observable valuation inputs (i.e. Level 1 or Level 2 valuation inputs) which are not included in the table and are also often hedged using financial instruments which are classified in Level 1 or Level 2 of the fair value hierarchy. Changes in each of these significant unobservable valuation inputs used by Nomura will impact upon the fair value measurement of the financial instrument. The following tables also illustrate qualitatively how an increase in those significant unobservable valuation inputs might result in a higher or lower fair value measurement at the reporting date and the interrelationship between significant unobservable valuation inputs where more than one is used to determine fair value measurement of the financial instruments. The impact of the
COVID-19
pandemic on financial markets has been considered in determining which valuation inputs are used to measure fair value.March 31, 2021 | ||||||||||||||||
Financial Instrument | Fair value in billions of yen | Valuation technique | Significant unobservable valuation input | Range of valuation inputs (1) | Weighted Average (2) | Impact of increases in significant unobservable valuation inputs (3)(4) | Interrelationships between valuation inputs (5) | |||||||||
| Assets: | ||||||||||||||||
| Trading assets and private equity and debt investments | ||||||||||||||||
| Equities | ¥ | 16 | DCF | Liquidity discounts | 75.0% | 75.0% | Lower fair value | Not applicable | ||||||||
Private equity | 58 | DCF | WACC Growth rates Credit spreads Liquidity discounts | 6.3 – 11.5% 0.0 – 1.0% 7.6 – 8.8% 5.0 – 30.0% | 8.4% 0.5% 8.1% 12.8% | Lower fair value Higher fair value Lower fair value Lower fair value | No predictable interrelationship | |||||||||
| Market multiples | EV/EBITDA ratios PE Ratios Liquidity discounts | 1.9 – 10.8 x 11.1 x 5.0 – 20.0% | 6.5 x 11.1 x 12.2% | Higher fair value Higher fair value Lower fair value | No predictable interrelationship | |||||||||||
| Foreign government, agency and municipal securities | 12 | DCF | Credit spreads Recovery rates | 0.0 – 1.5% 9.2 – 9.3% | 0.4% 9.2% | Lower fair value Higher fair value | No predictable interrelationship | |||||||||
| Bank and corporate debt securities and loans for trading purposes | 135 | DCF | Credit spreads Recovery rates | 0.0 – 23.1% 0.0 – 100.0% | 7.4% 73.3% | Lower fair value Higher fair value | No predictable interrelationship | |||||||||
| Commercial mortgage backed securities (“CMBS”) | 8 | DCF | Yields Loss severities | 4.2 – 10.6% 27.5 – 69.5% | 5.0% 50.3% | Lower fair value Lower fair value | No predictable interrelationship | |||||||||
| Residential mortgage backed securities (“RMBS”) | 6 | DCF | Yields Prepayment rates Loss severities | 0.0 – 14.3% 6.4 – 15.0% 0.8 – 100.0% | 1.4% 7.2% 5.8% | Lower fair value Lower fair value Lower fair value | No predictable interrelationship | |||||||||
| Real estate-backed securities | 106 | DCF | Loss severities | 0.0 – 18.6% | 2.4% | Lower fair value | Not applicable | |||||||||
| Collateralized debt obligations (“CDOs”) and other | 23 | DCF | Yields Prepayment rates Default probabilities Loss severities | 5.4 – 35.0% 20.0% 2.0% 77.0 – 100.0% | 11.0% 20.0% 2.0% 88.1% | Lower fair value Lower fair value Lower fair value Lower fair value | Change in default probabilities typically accompanied by directionally similar change in loss severities and opposite change in prepayment rates | |||||||||
F-2
3
Notes to the Interim Consolidated Financial Statements—(Continued) (UNAUDITED)
March 31, 2021 | ||||||||||||||||
Financial Instrument | Fair value in billions of yen | Valuation technique | Significant unobservable valuation input | Range of valuation inputs (1) | Weighted Average (2) | Impact of increases in significant unobservable valuation inputs (3)(4) | Interrelationships between valuation inputs (5) | |||||||||
| Derivatives, net: | ||||||||||||||||
| Equity contracts | ¥ | (41 | ) | Option models | Dividend yield Volatilities Correlations | 0.0 – 9.8% 4.0 – 102.0% (0.80) – 0.98 | — — — | Higher fair value Higher fair value Higher fair value | No predictable interrelationship | |||||||
| Interest rate contracts | (43 | ) | DCF/ Option models | Interest rates Volatilities Volatilities Correlations | 0.1 – 2.3% 9.6 – 13.1% 24.9 – 94.0 bp (1.00) – 0.98 | — — — — | Higher fair value Higher fair value Higher fair value Higher fair value | No predictable interrelationship | ||||||||
| Credit contracts | (38 | ) | DCF/ Option models | Credit spreads Recovery rates Volatilities Correlations | 0.0 – 20.8% 0.0 – 100.4% 41.9 – 65.0% 0.29 – 0.72 | — — — — | Higher fair value Higher fair value Higher fair value Higher fair value | No predictable interrelationship | ||||||||
| Foreign exchange contracts | 15 | Option models | Interest rates Volatilities Volatilities Correlations | 0.1 – 2.1% 2.6 – 31.5% 16.2 – 25.5 bp (0.25) – 0.80 | — — — — | Higher fair value Higher fair value Higher fair value Higher fair value | No predictable interrelationship | |||||||||
| Loans and receivables | 104 | DCF | Credit spreads Recovery rates | 0.0 – 25.6% 26.4 – 100.0% | 6.6% 95.8% | Lower fair value Higher fair value | No predictable interrelationship | |||||||||
| Collateralized agreements | 18 | DCF | Repo rate | 2.8 – 5.8% | 4.0% | Lower fair value | Not applicable | |||||||||
| Other assets | ||||||||||||||||
Other (6) | 185 | DCF | WACC Growth rates Liquidity discounts | 9.2% 2.0% 10.0% | 9.2% 2.0% 10.0% | Lower fair value Higher fair value Lower fair value | No predictable interrelationship | |||||||||
| Market multiples | EV/EBITDA ratios PE Ratios Price/Book ratios Liquidity discounts | 5.0 – 6.2 x 8.2 – 32.0 x 0.3 – 1.6 x 10.0 – 40.0% | 5.4 x 13.8 x 0.9 x 30.6% | Higher fair value Higher fair value Higher fair value Lower fair value | Generally changes in multiples result in a corresponding similar directional change in a fair value measurement, assuming earnings levels remain constant. | |||||||||||
| Liabilities: | ||||||||||||||||
| Trading Liabilities | ||||||||||||||||
| Bank and corporate debt securities | 5 | DCF | Recovery rates | 3.4 – 3.5% | 3.4% | Higher fair value | Not applicable | |||||||||
| Short-term borrowings | 103 | DCF/ Option models | Volatilities Correlations | 13.8 – 82.3% (0.69) – 0.96 | — — | Higher fair value Higher fair value | No predictable interrelationship | |||||||||
| Long-term borrowings | 547 | DCF/ Option models | Volatilities Volatilities Correlations | 9.5 – 82.3% 29.6 – 77.0 bp (1.00) – 0.98 | — — — | Higher fair value Higher fair value Higher fair value | No predictable interrelationship | |||||||||
F-2
4
Notes to the Interim Consolidated Financial Statements—(Continued) (UNAUDITED)
September 30, 2021 | ||||||||||||||||
Financial Instrument | Fair value in billions of yen | Valuation technique | Significant unobservable input | Range of valuation inputs (1) | Weighted Average (2) | Impact of increases in significant unobservable valuation inputs (3)(4) | Interrelationships between valuation inputs (5) | |||||||||
Assets: | ||||||||||||||||
Trading assets and private equity and debt investments | ||||||||||||||||
Equities | ¥ | 12 | DCF | Liquidity discounts | 75.0% | 75.0% | Lower fair value | Not applicable | ||||||||
Private equity and debt investments | 47 | DCF | WACC Growth rates Credit spreads Liquidity discounts | 6.7 – 11.4% 0.0 – 0.3% 8.0 – 8.6% 5.0 – 30.0% | 9.5% 0.1% 8.2% 16.2% | Lower fair value Higher fair value Lower fair value Lower fair value | No predictable interrelationship | |||||||||
| Market multiples | EV/EBITDA ratios PE Ratios Liquidity discounts | 0.4 – 11.0 x 11.6 x 5.0 – 20.0% | 5.4 x 11.6 x 12.9% | Higher fair value Higher fair value Lower fair value | No predictable interrelationship | |||||||||||
Foreign government, agency and municipal securities | 10 | DCF | Credit spreads Recovery rates | 0.0 – 1.6% 9.7 – 27.0% | 0.6% 12.3% | Lower fair value Higher fair value | No predictable interrelationship | |||||||||
Bank and corporate debt securities and loans for trading purposes | 132 | DCF | Credit spreads Recovery rates | 0.4 – 183.0% 0.0 – 100.0% | 6.7% 78.3% | Lower fair value Higher fair value | No predictable interrelationship | |||||||||
Commercial mortgage backed securities (“CMBS”) | 8 | DCF | Yields Loss severities | 4.1 – 10.1% 28.3 – 73.0% | 4.8% 41.4% | Lower fair value Lower fair value | No predictable interrelationship | |||||||||
Residential mortgage backed securities (“RMBS”) | 7 | DCF | Yields Prepayment rates Loss severities | 0.0 – 23.3% 6.7 – 15.0% 0.0 – 99.9% | 1.0% 7.0% 8.4% | Lower fair value Lower fair value Lower fair value | No predictable interrelationship | |||||||||
Real estate-backed securities | 123 | DCF | Loss severities | 0.0 – 28.6% | 1.0% | Lower fair value | Not applicable | |||||||||
Collateralized debt obligations (“CDOs”) and other | 23 | DCF | Yields Prepayment rates Default probabilities Loss severities | 5.4 – 37.4% 20.0% 2.0% 40.0 – 100.0% | 11.9% 20.0% 2.0% 87.9% | Lower fair value Lower fair value Lower fair value Lower fair value | Change in default probabilities typically accompanied by directionally similar change in loss severities and opposite change in prepayment rates | |||||||||
F-2
5
Notes to the Interim Consolidated Financial Statements—(Continued) (UNAUDITED)
September 30, 2021 | ||||||||||||||||
Financial Instrument | Fair value in billions of yen | Valuation technique | Significant unobservable input | Range of valuation inputs (1) | Weighted Average (2) | Impact of increases in significant unobservable valuation inputs (3)(4) | Interrelationships between valuation inputs (5) | |||||||||
Derivatives, net: | ||||||||||||||||
Equity contracts | ¥ | 9 | Option models | Dividend yield Volatilities Correlations | 0.0 – 15.6% 4.9 – 82.8% (0.80) – 0.98 | — — — | Higher fair value Higher fair value Higher fair value | No predictable interrelationship | ||||||||
Interest rate contracts | (28 | ) | DCF/ Option models | Interest rates Volatilities Volatilities Correlations | 0.2 – 2.2% 8.7 – 13.4% 25.2 – 75.1 bp (1.00) – 0.97 | — — — — | Higher fair value Higher fair value Higher fair value Higher fair value | No predictable interrelationship | ||||||||
Credit contracts | (37 | ) | DCF/ Option models | Credit spreads Recovery rates Volatilities Correlations | 0.0 – 49.0% 0.0 – 106.3% 39.7 – 50.0% 0.29 – 0.90 | — — — — | Higher fair value Higher fair value Higher fair value Higher fair value | No predictable interrelationship | ||||||||
Foreign exchange contracts | 10 | Option models | Interest rates Volatilities Volatilities Correlations | 0.2 – 2.1% 2.4 – 25.0% 11.7 – 21.3 bp (1.00) – 0.74 | — — — — | Higher fair value Higher fair value Higher fair value Higher fair value | No predictable interrelationship | |||||||||
Loans and receivables | 123 | DCF | Credit spreads Recovery rates | 0.0 – 22.7% 54.0 – 100.0% | 7.7% 97.7% | Lower fair value Higher fair value | No predictable interrelationship | |||||||||
Collateralized agreements | 13 | DCF | Repo rate | 2.8 – 3.8% | 3.2% | Lower fair value | Not applicable | |||||||||
Other assets | ||||||||||||||||
Other (6) | 209 | DCF | WACC Growth rates Liquidity discounts | 8.8% 2.0% 10.0% | 8.8% 2.0% 10.0% | Lower fair value Higher fair value Lower fair value | No predictable interrelationship | |||||||||
Market multiples | EV/EBITDA ratios PE Ratios Price/Book ratios Liquidity discounts | 4.4 – 6.2 x 8.1 – 30.8 x 0.2 – 1.5 x 25.0 – 40.0% | 5.1 x 13.1 x 0.9 x 30.6% | Higher fair value Higher fair value Higher fair value Lower fair value | Generally changes in multiples result in a corresponding similar directional change in a fair value measurement, assuming earnings levels remain constant. | |||||||||||
Liabilities: | ||||||||||||||||
Trading Liabilities | ||||||||||||||||
Bank and corporate debt securities | 6 | DCF | Recovery rates | 4.3 – 97.0% | 55.9% | Higher fair value | Not applicable | |||||||||
Short-term borrowings | 86 | DCF/ Option models | Volatilities Correlations | 13.4 – 68.1% (0.74) – 0.94 | — — | Higher fair value Higher fair value | No predictable interrelationship | |||||||||
Payables and deposits | 2 | DCF/ Option models | Volatilities Volatilities Correlations | 8.7 – 10.6% 29.7 – 58.7 bp (1.00) – 0.97 | — — — | Higher fair value Higher fair value Higher fair value | No predictable interrelationship | |||||||||
Long-term borrowings | 511 | DCF/ Option models | Volatilities Volatilities Correlations | 8.7 – 68.1% 29.7 – 58.7 bp (1.00) – 0.97 | — — — | Higher fair value Higher fair value Higher fair value | No predictable interrelationship | |||||||||
Other liabilities | 24 | DCF | Recovery rates | 88.8% | 88.8% | Higher fair value | Not applicable | |||||||||
| (1) | Range information is provided in percentages, coefficients and multiples and represents the highest and lowest level significant unobservable valuation input used to value that type of financial instrument. A wide dispersion in the range does not necessarily reflect increased uncertainty or subjectivity in the valuation input and is typically just a consequence of the different characteristics of the financial instruments themselves. |
| (2) | Weighted average information for non-derivative instruments is calculated by weighting each valuation input by the fair value of the financial instrument. |
| (3) | The above table only considers the impact of an increase in each significant unobservable valuation input on the fair value measurement of the financial instrument. However, a decrease in the significant unobservable valuation input would have the opposite effect on the fair value measurement of the financial instrument. For example, if an increase in a significant unobservable valuation input would result in a lower fair value measurement, a decrease in the significant unobservable valuation input would result in a higher fair value measurement. |
| (4) | The impact of an increase in the significant unobservable input on the fair value measurement for a derivative assumes Nomura is long risk to the input e.g., long volatility. Where Nomura is short such risk, the impact of an increase would have a converse effect on the fair value measurement of the derivative. |
| (5) | Consideration of the interrelationships between significant unobservable inputs is only relevant where more than one unobservable valuation input is used to determine the fair value measurement of the financial instrument. |
| (6) | Valuation technique(s) and unobservable valuation inputs in respect of equity securities reported within Other assets |
F-2
6
Notes to the Interim Consolidated Financial Statements—(Continued) (UNAUDITED)
Qualitative discussion of the ranges of significant unobservable inputs
The following comments present qualitative discussion about the significant unobservable valuation inputs used by Nomura for financial instruments classified in Level 3.
Derivatives—Equity contracts
Derivatives—Interest rate contracts
Derivatives—Credit contracts
Derivatives—Foreign exchange contracts
Short-term borrowings and Long-term borrowings
F-27
Notes to the Interim Consolidated Financial Statements—(Continued) (UNAUDITED)
Movements in Level 3 financial instruments
The following tables present gains and losses as well as increases and decreases of financial instruments measured at fair value on a recurring basis which Nomura classified in Level 3 for the six and three months ended September 30, 2020 and 2021. Financial instruments classified in Level 3 are often hedged with instruments within Level 1 or Level 2 of the fair value hierarchy. The gains or losses presented below do not reflect the offsetting gains or losses for these hedging instruments. Level 3 financial instruments are also measured using both observable and unobservable valuation inputs. Fair value changes presented below, therefore, reflect realized and unrealized gains and losses resulting from movements in both observable and unobservable valuation inputs.
For the six months ended September 30, 2020 and 2021, gains and losses related to Level 3 assets and liabilities did not have a material impact on Nomura’s liquidity and capital resources management.
Billions of yen | ||||||||||||||||||||||||||||||||||||||||
Six months ended September 30, 2020 | ||||||||||||||||||||||||||||||||||||||||
Beginning balance as of six months ended September 30, 2020 | Total gains (losses) recognized in net revenue (1) | Total gains (losses) recognized in other comprehensive income | Purchases / issues (2) | Sales / redemptions (2) | Settlements | Foreign exchange movements | Transfers into Level 3 (4)(5) | Transfers out of Level 3 (5) | Balance as of six months ended September 30, 2020 | |||||||||||||||||||||||||||||||
Assets: | ||||||||||||||||||||||||||||||||||||||||
Trading assets and private equity and debt investments | ||||||||||||||||||||||||||||||||||||||||
Equities | ¥ | 14 | ¥ | 2 | ¥ | 0— | ¥ | 22 | ¥ | (27 | ) | ¥ | 0— | ¥ | 0 | ¥ | 0 | ¥ | (1 | ) | ¥ | 10 | ||||||||||||||||||
Private equity and debt investments | 31 | 3 | 0— | 17 | (2 | ) | 0— | 0 | 0— | 0— | 49 | |||||||||||||||||||||||||||||
Japanese agency and municipal securities | 2 | 0 | 0— | 0 | 0 | 0— | 0— | 0 | 0 | 2 | ||||||||||||||||||||||||||||||
Foreign government, agency and municipal securities | 8 | 0 | 0— | 11 | (7 | ) | 0— | 0 | 3 | (2 | ) | 13 | ||||||||||||||||||||||||||||
Bank and corporate debt securities and loans for trading purposes | 228 | (1 | ) | 0— | 25 | (115 | ) | 0— | (3 | ) | 19 | (24 | ) | 129 | ||||||||||||||||||||||||||
Commercial mortgage-backed securities (“CMBS”) | 1 | 0 | 0— | 1 | 0 | 0— | 0— | 0— | 0 | 2 | ||||||||||||||||||||||||||||||
Residential mortgage-backed securities (“RMBS”) | 62 | 0 | 0— | 10 | (29 | ) | 0— | (1 | ) | 0— | (22 | ) | 20 | |||||||||||||||||||||||||||
Real estate-backed securities | 94 | (5 | ) | 0— | 41 | (66 | ) | 0— | (2 | ) | 0— | 0 | 62 | |||||||||||||||||||||||||||
Collateralized debt obligations (“CDOs”) and other | 32 | (2 | ) | 0— | 36 | (48 | ) | 0— | 0 | 0 | (7 | ) | 11 | |||||||||||||||||||||||||||
Investment trust funds and other | 0 | 0 | 0— | 0— | 0— | 0— | 0 | 0— | 0— | 0 | ||||||||||||||||||||||||||||||
Total trading assets and private equity and debt investments | 472 | (3 | ) | 0— | 163 | (294 | ) | 0— | (6 | ) | 22 | (56 | ) | 298 | ||||||||||||||||||||||||||
Derivatives, net (3) | ||||||||||||||||||||||||||||||||||||||||
Equity contracts | 19 | (28 | ) | 0— | 0— | 0— | (15 | ) | 0 | 13 | (8 | ) | (19 | ) | ||||||||||||||||||||||||||
Interest rate contracts | (54 | ) | (4 | ) | 0— | 0— | 0— | 1 | 0 | (4 | ) | 3 | (58 | ) | ||||||||||||||||||||||||||
Credit contracts | (1 | ) | (10 | ) | 0— | 0— | 0— | (2 | ) | 0 | (3 | ) | 1 | (15 | ) | |||||||||||||||||||||||||
Foreign exchange contracts | 7 | 2 | 0— | 0— | 0— | (9 | ) | 0 | (3 | ) | 3 | 0 | ||||||||||||||||||||||||||||
Total derivatives, net | (29 | ) | (40 | ) | 0— | 0— | 0— | (25 | ) | 0 | 3 | (1 | ) | (92 | ) | |||||||||||||||||||||||||
Subtotal | ¥ | 443 | ¥ | (43 | ) | ¥ | 0— | ¥ | 163 | ¥ | (294 | ) | ¥ | (25 | ) | ¥ | (6 | ) | ¥ | 25 | ¥ | (57 | ) | ¥ | 206 | |||||||||||||||
Loans and receivables | 96 | 3 | 0— | 25 | (36 | ) | 0— | (2 | ) | 9 | (7 | ) | 88 | |||||||||||||||||||||||||||
Collateralized agreements | 15 | 0 | 0— | 0— | 0— | 0— | 0 | 3 | 0— | 18 | ||||||||||||||||||||||||||||||
Other assets | ||||||||||||||||||||||||||||||||||||||||
Other | 168 | 21 | 0— | 0 | (36 | ) | 0— | (3 | ) | 0— | 0 | 150 | ||||||||||||||||||||||||||||
Total | ¥ | 722 | ¥ | (19 | ) | ¥ | 0— | ¥ | 188 | ¥ | (366 | ) | ¥ | (25 | ) | ¥ | (11 | ) | ¥ | 37 | ¥ | (64 | ) | ¥ | 462 | |||||||||||||||
Liabilities: | ||||||||||||||||||||||||||||||||||||||||
Trading liabilities | ||||||||||||||||||||||||||||||||||||||||
Equities | ¥ | 0 | ¥ | 0 | ¥ | 0— | ¥ | 0 | ¥ | 0 | ¥ | 0— | ¥ | 0 | ¥ | 0 | ¥ | 0 | ¥ | 0 | ||||||||||||||||||||
Foreign government, agency and municipal securities | 0 | 0 | 0— | 0 | 0 | 0— | 0 | 0— | 0— | 0 | ||||||||||||||||||||||||||||||
Bank and corporate debt securities | 1 | 0 | 0— | 2 | (1 | ) | 0— | 0 | 1 | (1 | ) | 2 | ||||||||||||||||||||||||||||
Collateralized debt obligations (“CDOs”) and other | 1 | 0 | 0— | 6 | (4 | ) | 0— | 0 | 0— | 0— | 3 | |||||||||||||||||||||||||||||
Investment trust funds and other | 0 | 0 | 0— | 0— | 0 | 0— | 0 | 0— | 0— | 0 | ||||||||||||||||||||||||||||||
Total trading liabilities | ¥ | 2 | ¥ | 0 | ¥ | 0— | ¥ | 8 | ¥ | (5 | ) | ¥ | 0— | ¥ | 0 | ¥ | 1 | ¥ | (1 | ) | ¥ | 5 | ||||||||||||||||||
Short-term borrowings | 29 | (2 | ) | 0 | 84 | (46 | ) | 0— | (1 | ) | 11 | (5 | ) | 74 | ||||||||||||||||||||||||||
Payables and deposits | 1 | 0 | 0 | 0— | 0 | 0— | 0— | 0— | 0— | 1 | ||||||||||||||||||||||||||||||
Long-term borrowings | 409 | (21 | ) | 2 | 136 | (124 | ) | 0— | 0 | 36 | (17 | ) | 459 | |||||||||||||||||||||||||||
Other liabilities | 0 | (9 | ) | 0— | 4 | 0 | 0— | 0 | 1 | (1 | ) | 13 | ||||||||||||||||||||||||||||
Total | ¥ | 441 | ¥ | (32 | ) | ¥ | 2 | ¥ | 232 | ¥ | (175 | ) | ¥ | 0— | ¥ | (1 | ) | ¥ | 49 | ¥ | (24 | ) | ¥ | 552 | ||||||||||||||||
F-28
Notes to the Interim Consolidated Financial Statements—(Continued) (UNAUDITED)
Billions of yen | ||||||||||||||||||||||||||||||||||||||||
Six months ended September 30, 2021 | ||||||||||||||||||||||||||||||||||||||||
Beginning balance as of six months ended September 30, 2021 | Total gains (losses) recognized in net revenue (1) | Total gains (losses) recognized in other comprehensive income | Purchases / issues (2) | Sales / redemptions (2) | Settlements | Foreign exchange movements | Transfers into Level 3 (4)(5) | Transfers out of Level 3 (5) | Balance as of six months ended September 30, 2021 | |||||||||||||||||||||||||||||||
Assets: | ||||||||||||||||||||||||||||||||||||||||
Trading assets and private equity and debt investments | ||||||||||||||||||||||||||||||||||||||||
Equities | ¥ | 16 | ¥ | 0 | ¥ | 0— | ¥ | 1 | ¥ | (6 | ) | ¥ | 0— | ¥ | 0 | ¥ | 2 | ¥ | (1 | ) | ¥ | 12 | ||||||||||||||||||
Private equity and debt investments | 58 | 2 | 0— | 3 | (3 | ) | 0— | 0 | 0— | (13 | ) | 47 | ||||||||||||||||||||||||||||
Japanese agency and municipal securities | 2 | 0 | 0— | 0 | 0 | 0— | 0— | 0— | 0— | 2 | ||||||||||||||||||||||||||||||
Foreign government, agency and municipal securities | 12 | 0 | 0— | 6 | (9 | ) | 0— | 0 | 2 | (1 | ) | 10 | ||||||||||||||||||||||||||||
Bank and corporate debt securities and loans for trading purposes | 135 | 2 | 0— | 32 | (45 | ) | 0— | 1 | 22 | (15 | ) | 132 | ||||||||||||||||||||||||||||
Commercial mortgage-backed securities (“CMBS”) | 8 | 0 | 0— | 0 | 0 | 0— | 0 | 0— | 0 | 8 | ||||||||||||||||||||||||||||||
Residential mortgage-backed securities (“RMBS”) | 6 | 0 | 0— | 3 | (2 | ) | 0— | 0 | 0— | 0— | 7 | |||||||||||||||||||||||||||||
Real estate-backed securities | 106 | 3 | 0— | 195 | (182 | ) | 0— | 1 | 0— | 0— | 123 | |||||||||||||||||||||||||||||
Collateralized debt obligations (“CDOs”) and other | 23 | (1 | ) | 0— | 36 | (35 | ) | 0— | 0 | 0— | 0— | 23 | ||||||||||||||||||||||||||||
Investment trust funds and other | 0 | 0 | 0— | 16 | (16 | ) | 0— | 0 | 0 | 0— | 0 | |||||||||||||||||||||||||||||
Total trading assets and private equity and debt investments | 366 | 6 | 0— | 292 | (298 | ) | 0— | 2 | 26 | (30 | ) | 364 | ||||||||||||||||||||||||||||
Derivatives, net (3) | ||||||||||||||||||||||||||||||||||||||||
Equity contracts | (41 | ) | 20 | 0— | 0— | 0— | 1 | (1 | ) | (2 | ) | 32 | 9 | |||||||||||||||||||||||||||
Interest rate contracts | (43 | ) | (3 | ) | 0— | 0— | 0— | 11 | (1 | ) | 6 | 2 | (28 | ) | ||||||||||||||||||||||||||
Credit contracts | (38 | ) | (1 | ) | 0— | 0— | 0— | 3 | 0 | (2 | ) | 1 | (37 | ) | ||||||||||||||||||||||||||
Foreign exchange contracts | 15 | (3 | ) | 0— | 0— | 0— | (1 | ) | 0 | 0 | (1 | ) | 10 | |||||||||||||||||||||||||||
Total derivatives, net | (107 | ) | 13 | 0— | 0— | 0— | 14 | (2 | ) | 2 | 34 | (46 | ) | |||||||||||||||||||||||||||
Subtotal | ¥ | 259 | ¥ | 19 | ¥ | 0— | ¥ | 292 | ¥ | (298 | ) | ¥ | 14 | ¥ | 0 | ¥ | 28 | ¥ | 4 | ¥ | 318 | |||||||||||||||||||
Loans and receivables | 104 | 2 | 0— | 14 | (18 | ) | 0— | 2 | 27 | (8 | ) | 123 | ||||||||||||||||||||||||||||
Collateralized agreements | 18 | 0 | 0— | 0— | (5 | ) | 0— | 0 | 0— | 0— | 13 | |||||||||||||||||||||||||||||
Other assets | ||||||||||||||||||||||||||||||||||||||||
Other | 185 | 23 | 0— | 0 | 0 | 0— | 2 | 0 | (1 | ) | 209 | |||||||||||||||||||||||||||||
Total | ¥ | 566 | ¥ | 44 | ¥ | 0— | ¥ | 306 | ¥ | (321 | ) | ¥ | 14 | ¥ | 4 | ¥ | 55 | ¥ | (5 | ) | ¥ | 663 | ||||||||||||||||||
Liabilities: | ||||||||||||||||||||||||||||||||||||||||
Trading liabilities | ||||||||||||||||||||||||||||||||||||||||
Equities | ¥ | 0 | ¥ | 0 | ¥ | 0— | ¥ | 0 | ¥ | 0 | ¥ | 0— | ¥ | 0 | ¥ | 0— | ¥ | 0 | ¥ | 0 | ||||||||||||||||||||
Foreign government, agency and municipal securities | 1 | 0 | 0— | (1 | ) | 0— | 0 | 0— | 0— | 0 | ||||||||||||||||||||||||||||||
Bank and corporate debt securities | 5 | 0 | 0— | 3 | (1 | ) | 0— | 0 | 3 | (4 | ) | 6 | ||||||||||||||||||||||||||||
Collateralized debt obligations (“CDOs”) and other | 1 | 0 | 0— | 0 | (1 | ) | 0— | 0 | 0 | 0— | 0 | |||||||||||||||||||||||||||||
Investment trust funds and other | 0 | 0 | 0— | 0 | 0 | 0— | 0 | 0— | 0— | 0 | ||||||||||||||||||||||||||||||
Total trading liabilities | ¥ | 7 | ¥ | 0 | ¥ | 0— | ¥ | 3 | ¥ | (3 | ) | ¥ | 0— | ¥ | 0 | ¥ | 3 | ¥ | (4 | ) | ¥ | 6 | ||||||||||||||||||
Short-term borrowings | 103 | (7 | ) | 0 | 92 | (89 | ) | 0— | 0 | 8 | (35 | ) | 86 | |||||||||||||||||||||||||||
Payables and deposits | 1 | 0 | 0 | 0 | 0— | 0— | 0— | 1 | 0 | 2 | ||||||||||||||||||||||||||||||
Collateralized financing | 1 | 0— | 0 | 0— | 0— | 0— | 0— | 0— | (1 | ) | 0— | |||||||||||||||||||||||||||||
Long-term borrowings | 547 | (9 | ) | 2 | 289 | (256 | ) | 0— | 0 | 23 | (99 | ) | 511 | |||||||||||||||||||||||||||
Other liabilities | 35 | (4 | ) | 0— | 0 | (15 | ) | 0— | 0 | 0 | 0 | 24 | ||||||||||||||||||||||||||||
Total | ¥ | 694 | ¥ | (20 | ) | ¥ | 2 | ¥ | 384 | ¥ | (363 | ) | ¥ | 0— | ¥ | 0 | ¥ | 35 | ¥ | (139 | ) | ¥ | 629 | |||||||||||||||||
F-29
Notes to the Interim Consolidated Financial Statements—(Continued) (UNAUDITED)
Billions of yen | ||||||||||||||||||||||||||||||||||||||||
Three months ended September 30, 2020 | ||||||||||||||||||||||||||||||||||||||||
Beginning balance as of three months ended September 30, 2020 | Total gains (losses) recognized in net revenue (1) | Total gains (losses) recognized in other comprehensive income | Purchases / issues (2) | Sales / redemptions (2) | Settlements | Foreign exchange movements | Transfers into Level 3 (4)(5) | Transfers out of Level 3 (5) | Balance as of three months ended September 30, 2020 | |||||||||||||||||||||||||||||||
Assets: | ||||||||||||||||||||||||||||||||||||||||
Trading assets and private equity and debt investments | ||||||||||||||||||||||||||||||||||||||||
Equities | ¥ | 11 | ¥ | 2 | ¥ | 0— | ¥ | 22 | ¥ | (24 | ) | ¥ | 0— | ¥ | 0 | ¥ | 0 | ¥ | (1 | ) | ¥ | 10 | ||||||||||||||||||
Private equity and debt investments | 37 | 1 | 0— | 11 | 0— | 0— | 0 | 0— | 0— | 49 | ||||||||||||||||||||||||||||||
Japanese agency and municipal securities | 2 | 0 | 0— | 0 | 0 | 0— | 0— | 0— | 0 | 2 | ||||||||||||||||||||||||||||||
Foreign government, agency and municipal securities | 10 | 0 | 0— | 5 | (4 | ) | 0— | 0 | 2 | 0 | 13 | |||||||||||||||||||||||||||||
Bank and corporate debt securities and loans for trading purposes | 207 | 2 | 0— | 14 | (86 | ) | 0— | (3 | ) | 4 | (9 | ) | 129 | |||||||||||||||||||||||||||
Commercial mortgage-backed securities (“CMBS”) | 1 | 1 | 0— | 0— | 0 | 0— | 0— | 0— | 0— | 2 | ||||||||||||||||||||||||||||||
Residential mortgage-backed securities (“RMBS”) | 21 | 0 | 0— | 0— | (1 | ) | 0— | 0 | 0— | 0— | 20 | |||||||||||||||||||||||||||||
Real estate-backed securities | 82 | 0 | 0— | 25 | (44 | ) | 0— | (1 | ) | 0— | 0— | 62 | ||||||||||||||||||||||||||||
Collateralized debt obligations (“CDOs”) and other | 11 | 1 | 0— | 23 | (24 | ) | 0— | 0 | 0 | 0— | 11 | |||||||||||||||||||||||||||||
Investment trust funds and other | 0 | 0 | 0— | 0— | 0— | 0— | 0 | 0— | 0— | 0 | ||||||||||||||||||||||||||||||
Total trading assets and private equity and debt investments | 382 | 7 | 0— | 100 | (183 | ) | 0— | (4 | ) | 6 | (10 | ) | 298 | |||||||||||||||||||||||||||
Derivatives, net (3) | ||||||||||||||||||||||||||||||||||||||||
Equity contracts | (16 | ) | (6 | ) | 0— | 0— | 0— | (8 | ) | 0 | 5 | 6 | (19 | ) | ||||||||||||||||||||||||||
Interest rate contracts | (66 | ) | 2 | 0— | 0— | 0— | 4 | 0 | (2 | ) | 4 | (58 | ) | |||||||||||||||||||||||||||
Credit contracts | (8 | ) | (4 | ) | 0— | 0— | 0— | (4 | ) | 0 | 0— | 1 | (15 | ) | ||||||||||||||||||||||||||
Foreign exchange contracts | 0 | 0 | 0— | 0— | 0— | (2 | ) | 0 | 0 | 2 | 0 | |||||||||||||||||||||||||||||
Total derivatives, net | (90 | ) | (8 | ) | 0— | 0— | 0— | (10 | ) | 0 | 3 | 13 | (92 | ) | ||||||||||||||||||||||||||
Subtotal | ¥ | 292 | ¥ | (1 | ) | ¥ | 0— | ¥ | 100 | ¥ | (183 | ) | ¥ | (10 | ) | ¥ | (4 | ) | ¥ | 9 | ¥ | 3 | ¥ | 206 | ||||||||||||||||
Loans and receivables | 98 | 2 | 0— | 8 | (15 | ) | 0— | (1 | ) | 2 | (6 | ) | 88 | |||||||||||||||||||||||||||
Collateralized agreements | 19 | (1 | ) | 0— | 0— | 0— | 0— | 0 | 0— | 0— | 18 | |||||||||||||||||||||||||||||
Other assets | ||||||||||||||||||||||||||||||||||||||||
Other | 147 | 6 | 0— | 0 | 0 | 0— | (3 | ) | 0— | 0— | 150 | |||||||||||||||||||||||||||||
Total | ¥ | 556 | ¥ | 6 | ¥ | — | ¥ | 108 | ¥ | (198 | ) | ¥ | (10 | ) | ¥ | (8 | ) | ¥ | 11 | ¥ | (3 | ) | ¥ | 462 | ||||||||||||||||
| �� | ||||||||||||||||||||||||||||||||||||||||
Liabilities: | ||||||||||||||||||||||||||||||||||||||||
Trading liabilities | ||||||||||||||||||||||||||||||||||||||||
Equities | ¥ | 1 | ¥ | 0 | ¥ | 0— | ¥ | (1 | ) | ¥ | 0 | ¥ | 0— | ¥ | 0 | ¥ | 0— | ¥ | 0 | ¥ | 0 | |||||||||||||||||||
Foreign government, agency and municipal securities | 0 | 0 | 0— | 0 | 0— | 0— | 0 | 0— | 0— | 0 | ||||||||||||||||||||||||||||||
Bank and corporate debt securities | 2 | 0 | 0— | 1 | 0 | 0— | 0 | 0 | (1 | ) | 2 | |||||||||||||||||||||||||||||
Collateralized debt obligations (“CDOs”) and other | 1 | 0 | 0— | 5 | (3 | ) | 0— | 0 | 0— | 0— | 3 | |||||||||||||||||||||||||||||
Investment trust funds and other | 0 | 0 | 0— | 0— | 0 | 0— | 0 | 0— | 0— | 0 | ||||||||||||||||||||||||||||||
Total trading liabilities | ¥ | 4 | ¥ | 0 | ¥ | 0— | ¥ | 5 | ¥ | (3 | ) | ¥ | 0— | ¥ | 0 | ¥ | 0 | ¥ | (1 | ) | ¥ | 5 | ||||||||||||||||||
Short-term borrowings | 30 | 0 | 0 | 59 | (21 | ) | 0— | 0 | 8 | (2 | ) | 74 | ||||||||||||||||||||||||||||
Payables and deposits | 1 | 0 | 0 | 0— | 0 | 0— | 0— | 0— | 0— | 1 | ||||||||||||||||||||||||||||||
Long-term borrowings | 447 | (4 | ) | (2 | ) | 61 | (60 | ) | 0— | 0 | 16 | (11 | ) | 459 | ||||||||||||||||||||||||||
Other liabilities | 5 | (5 | ) | 0— | 3 | 0— | 0— | 0 | 1 | (1 | ) | 13 | ||||||||||||||||||||||||||||
Total | ¥ | 487 | ¥ | (9 | ) | ¥ | (2 | ) | ¥ | 128 | ¥ | (84 | ) | ¥ | 0— | ¥ | 0 | ¥ | 25 | ¥ | (15 | ) | ¥ | 552 | ||||||||||||||||
Notes to the Interim Consolidated Financial Statements—(Continued) (UNAUDITED)
Billions of yen | ||||||||||||||||||||||||||||||||||||||||
Three months ended September 30, 2021 | ||||||||||||||||||||||||||||||||||||||||
Beginning balance as of three months ended September 30, 2021 | Total gains (losses) recognized in net revenue (1) | Total gains (losses) recognized in other comprehensive income | Purchases / issues (2) | Sales / redemptions (2) | Settlements | Foreign exchange movements | Transfers into Level 3 (4)(5) | Transfers out of Level 3 (5) | Balance as of three months ended September 30, 2021 | |||||||||||||||||||||||||||||||
Assets: | ||||||||||||||||||||||||||||||||||||||||
Trading assets and private equity and debt investments | ||||||||||||||||||||||||||||||||||||||||
Equities | ¥ | 11 | ¥ | 0 | ¥ | 0— | ¥ | 1 | ¥ | (1 | ) | ¥ | 0— | ¥ | 0 | ¥ | 1 | ¥ | 0 | ¥ | 12 | |||||||||||||||||||
Private equity and debt investments | 45 | (1 | ) | 0— | 4 | (1 | ) | 0— | 0 | 0— | 0— | 47 | ||||||||||||||||||||||||||||
Japanese agency and municipal securities | 2 | 0 | 0— | 0 | 0 | 0— | 0— | 0— | 0— | 2 | ||||||||||||||||||||||||||||||
Foreign government, agency and municipal securities | 13 | 0 | 0— | 1 | (5 | ) | 0— | 0 | 1 | 0 | 10 | |||||||||||||||||||||||||||||
Bank and corporate debt securities and loans for trading purposes | 131 | 1 | 0— | 18 | (27 | ) | 0— | 1 | 12 | (4 | ) | 132 | ||||||||||||||||||||||||||||
Commercial mortgage-backed securities (“CMBS”) | 8 | 0 | 0— | 0— | 0 | 0— | 0 | 0— | 0 | 8 | ||||||||||||||||||||||||||||||
Residential mortgage-backed securities (“RMBS”) | 7 | 1 | 0— | 1 | (2 | ) | 0— | 0 | 0— | 0— | 7 | |||||||||||||||||||||||||||||
Real estate-backed securities | 158 | 0 | 0— | 84 | (121 | ) | 0— | 2 | 0— | 0— | 123 | |||||||||||||||||||||||||||||
Collateralized debt obligations (“CDOs”) and other | 21 | 0 | 0— | 15 | (13 | ) | 0— | 0 | 0— | 0— | 23 | |||||||||||||||||||||||||||||
Investment trust funds and other | 1 | 0 | 0— | 15 | (16 | ) | 0— | 0 | 0— | 0— | 0 | |||||||||||||||||||||||||||||
Total trading assets and private equity and debt investments | 397 | 1 | 0— | 139 | (186 | ) | 0— | 3 | 14 | (4 | ) | 364 | ||||||||||||||||||||||||||||
Derivatives, net (3) | ||||||||||||||||||||||||||||||||||||||||
Equity contracts | (39 | ) | 21 | 0— | 0— | 0— | 3 | (1 | ) | 6 | 19 | 9 | ||||||||||||||||||||||||||||
Interest rate contracts | (41 | ) | (1 | ) | 0— | 0— | 0— | 9 | 0 | 5 | 0 | (28 | ) | |||||||||||||||||||||||||||
Credit contracts | (31 | ) | (5 | ) | 0— | 0— | 0— | 1 | 0 | (2 | ) | 0 | (37 | ) | ||||||||||||||||||||||||||
Foreign exchange contracts | 9 | 4 | 0— | 0— | 0— | (2 | ) | 0 | 0 | (1 | ) | 10 | ||||||||||||||||||||||||||||
Total derivatives, net | (102 | ) | 19 | 0— | 0— | 0— | 11 | (1 | ) | 9 | 18 | (46 | ) | |||||||||||||||||||||||||||
Subtotal | ¥ | 295 | ¥ | 20 | ¥ | 0— | ¥ | 139 | ¥ | (186 | ) | ¥ | 11 | ¥ | 2 | ¥ | 23 | ¥ | 14 | ¥ | 318 | |||||||||||||||||||
Loans and receivables | 111 | 3 | 0— | 8 | (11 | ) | 0— | 1 | 18 | (7 | ) | 123 | ||||||||||||||||||||||||||||
Collateralized agreements | 16 | 0 | 0— | 0— | (3 | ) | 0— | 0 | 0— | 0— | 13 | |||||||||||||||||||||||||||||
Other assets | ||||||||||||||||||||||||||||||||||||||||
Other | 202 | 5 | 0— | 0— | 0— | 0— | 2 | 0 | 0— | 209 | ||||||||||||||||||||||||||||||
Total | ¥ | 624 | ¥ | 28 | ¥ | 0— | ¥ | 147 | ¥ | (200 | ) | ¥ | 11 | ¥ | 5 | ¥ | 41 | ¥ | 7 | ¥ | 663 | |||||||||||||||||||
Liabilities: | ||||||||||||||||||||||||||||||||||||||||
Trading liabilities | ||||||||||||||||||||||||||||||||||||||||
Equities | ¥ | 0 | ¥ | 0 | ¥ | 0— | ¥ | — | ¥ | 0 | ¥ | 0— | ¥ | 0 | ¥ | 0— | ¥ | 0— | ¥ | 0 | ||||||||||||||||||||
Foreign government, agency and municipal securities | 0 | 0 | 0— | 0— | 0 | 0— | 0 | 0— | 0— | 0 | ||||||||||||||||||||||||||||||
Bank and corporate debt securities | 2 | 0 | 0— | 2 | (1 | ) | 0— | 0 | 4 | (1 | ) | 6 | ||||||||||||||||||||||||||||
Collateralized debt obligations (“CDOs”) and other | 0 | 0 | 0— | 0 | 0 | 0— | 0 | 0— | 0— | 0 | ||||||||||||||||||||||||||||||
Investment trust funds and other | 0 | 0 | 0— | 0— | 0 | 0— | 0 | 0— | 0— | 0 | ||||||||||||||||||||||||||||||
Total trading liabilities | ¥ | 2 | ¥ | 0 | ¥ | 0— | ¥ | 2 | ¥ | (1 | ) | ¥ | 0— | ¥ | 0 | ¥ | 4 | ¥ | (1 | ) | ¥ | 6 | ||||||||||||||||||
Short-term borrowings | 94 | 2 | 0 | 49 | (48 | ) | 0— | 0 | 3 | (10 | ) | 86 | ||||||||||||||||||||||||||||
Payables and deposits | 2 | 0 | 0 | 0 | — | 0— | 0— | 0 | 0 | 2 | ||||||||||||||||||||||||||||||
Long-term borrowings | 508 | 5 | 0 | 129 | (110 | ) | 0— | 0 | 7 | (18 | ) | 511 | ||||||||||||||||||||||||||||
Other liabilities | 33 | (2 | ) | 0— | 0 | (11 | ) | 0— | 0 | 0— | 0 | 24 | ||||||||||||||||||||||||||||
Total | ¥ | 639 | ¥ | 5 | ¥ | 0 | ¥ | 180 | ¥ | (170 | ) | ¥ | 0— | ¥ | 0 | ¥ | 14 | ¥ | (29 | ) | ¥ | 629 | ||||||||||||||||||
| (1) | Includes gains and losses reported primarily within Net gain on trading, Gain on private equity and debt investments, Gain on investments in equity securities, Revenue—Other Non-interest expenses—Other,Interest and dividends Interest expense |
| (2) | Amounts reported in Purchases / issues Sales / redemptions |
| (3) | Each derivative classification includes derivatives with multiple risk underlyings. For example, interest rate contracts include complex derivatives referencing interest rate risk as well as foreign exchange risk or other factors such as prepayment rates. Credit contracts include credit default swaps as well as derivatives referencing corporate and government debt securities. |
| (4) | Amounts of gains and losses on these transfers which were recognized in the period when the Transfers into Level 3 |
| (5) | Transfers into Level 3 Transfers out of Level 3 Quantitative and qualitative information regarding significant unobservable inputs |
F-31
Notes to the Interim Consolidated Financial Statements—(Continued) (UNAUDITED)
Unrealized gains and losses recognized for Level 3 financial instruments
The following table presents the amounts of unrealized gains (losses) for the six and three months ended September 30, 2020 and 2021, relating to those financial instruments which Nomura classified in Level 3 within the fair value hierarchy and that were still held by Nomura at the relevant consolidated balance sheet date.
Billions of yen | ||||||||
Six months ended September 30 | ||||||||
2020 | 2021 | |||||||
Unrealized gains / (losses) (1) | ||||||||
Assets: | ||||||||
Trading assets and private equity and debt investments | ||||||||
Equities | ¥ | 1 | ¥ | 0 | ||||
Private equity and debt investments | 2 | 2 | ||||||
Japanese agency and municipal securities | 0 | 0 | ||||||
Foreign government, agency and municipal securities | 0 | 0 | ||||||
Bank and corporate debt securities and loans for trading purposes | 0 | 1 | ||||||
Commercial mortgage-backed securities (“CMBS”) | 0 | 0 | ||||||
Residential mortgage-backed securities (“RMBS”) | 0 | 0 | ||||||
Real estate-backed securities | (2 | ) | 2 | |||||
Collateralized debt obligations (“CDOs”) and other | (3 | ) | (2 | ) | ||||
Investment trust funds and other | 0— | 0 | ||||||
Total trading assets and private equity and debt investments | (2 | ) | 3 | |||||
Derivatives, net (2) | ||||||||
Equity contracts | (38 | ) | 24 | |||||
Interest rate contracts | (10 | ) | (9 | ) | ||||
Credit contracts | 12 | 2 | ||||||
Foreign exchange contracts | (15 | ) | (1 | ) | ||||
Total derivatives, net | (51 | ) | 16 | |||||
Subtotal | ¥ | (53 | ) | ¥ | 19 | |||
Loans and receivables | 1 | 1 | ||||||
Collateralized agreements | 0 | 0 | ||||||
Other assets | ||||||||
Other | 21 | 23 | ||||||
Total | ¥ | (31 | ) | ¥ | 43 | |||
Liabilities: | ||||||||
Trading liabilities | ||||||||
Equities | ¥ | 0 | ¥ | 0— | ||||
Foreign government, agency and municipal securities | 0 | 0 | ||||||
Bank and corporate debt securities | 0 | 0 | ||||||
Collateralized debt obligations (“CDOs”) and other | 0 | 0 | ||||||
Total trading liabilities | ¥ | 0 | ¥ | 0 | ||||
Short-term borrowings (3) | 2 | 3 | ||||||
Payables and deposits (3) | 0 | 0 | ||||||
Long-term borrowings (3) | (15 | ) | 4 | |||||
Other liabilities | (7 | ) | (1 | ) | ||||
Total | ¥ | (20 | ) | ¥ | 6 | |||
F-32
Notes to the Interim Consolidated Financial Statements—(Continued) (UNAUDITED)
Billions of yen | ||||||||
Three months ended September 30 | ||||||||
2020 | 2021 | |||||||
Unrealized gains / (losses) (1) | ||||||||
Assets: | ||||||||
Trading assets and private equity and debt investments | ||||||||
Equities | ¥ | 0 | ¥ | 1 | ||||
Private equity and debt investments | 1 | 1 | ||||||
Japanese agency and municipal securities | 0 | 0 | ||||||
Foreign government, agency and municipal securities | 0 | 0 | ||||||
Bank and corporate debt securities and loans for trading purposes | 1 | 0 | ||||||
Commercial mortgage-backed securities (“CMBS”) | 0 | 0 | ||||||
Residential mortgage-backed securities (“RMBS”) | 0 | 0 | ||||||
Real estate-backed securities | 0 | (1 | ) | |||||
Collateralized debt obligations (“CDOs”) and other | 0 | (2 | ) | |||||
Investment trust funds and other | 0 | 0 | ||||||
Total trading assets and private equity and debt investments | 2 | (1 | ) | |||||
Derivatives, net (2) | ||||||||
Equity contracts | (12 | ) | 25 | |||||
Interest rate contracts | 2 | (4 | ) | |||||
Credit contracts | (4 | ) | (3 | ) | ||||
Foreign exchange contracts | 0 | 5 | ||||||
Total derivatives, net | (14 | ) | 23 | |||||
Subtotal | ¥ | (12 | ) | ¥ | 22 | |||
Loans and receivables | 2 | 2 | ||||||
Collateralized agreements | 0 | 0— | ||||||
Other assets | ||||||||
Other | 6 | 5 | ||||||
Total | ¥ | (4 | ) | ¥ | 29 | |||
Liabilities: | ||||||||
Trading liabilities | ||||||||
Foreign government, agency and municipal securities | ¥ | 0 | ¥ | 0— | ||||
Bank and corporate debt securities | 0 | 0 | ||||||
Collateralized debt obligations (“CDOs”) and other | 0 | 0 | ||||||
Total trading liabilities | ¥ | 0 | ¥ | 0 | ||||
Short-term borrowings (3) | 1 | 5 | ||||||
Payables and deposits (3) | 0 | 0 | ||||||
Long-term borrowings (3) | (3 | ) | 8 | |||||
Other liabilities | (4 | ) | 0 | |||||
Total | ¥ | (6 | ) | ¥ | 13 | |||
| (1) | Includes gains and losses reported within Net gain on trading, Gain (loss) on private equity and debt investments, Gain on investments in equity securities, Revenue—Other Non-interest expenses—Other, Interest and dividendsInterest expense |
| (2) | Each derivative classification includes derivatives with multiple risk underlyings. For example, interest rate contracts include complex derivatives referencing interest rate risk as well as foreign exchange risk or other factors such as prepayment rates. Credit contracts include credit default swaps as well as derivatives referencing corporate and government debt securities. |
| (3) | Includes changes in unrealized gains and losses in Other comprehensive income (loss) |
F-33
Notes to the Interim Consolidated Financial Statements—(Continued) (UNAUDITED)
Investments in investment funds that calculate NAV per share
In the normal course of business, Nomura invests in
non-consolidated
funds which meet the definition of investment companies or are similar in nature and which do not have readily determinable fair values. For certain of these investments, Nomura uses NAV per share as the basis for valuation as a practical expedient. Some of these investments are redeemable at different amounts from NAV per share.The following tables present information on these investments where NAV per share is calculated or disclosed as of March 31, 2021 and September 30, 2021. Investments are presented by major category relevant to the nature of Nomura’s business and risks.
Billions of yen | ||||||||||||||||
March 31, 2021 | ||||||||||||||||
Fair value | Unfunded commitments (1) | Redemption frequency (if currently eligible) (2) | Redemption notice (3) | |||||||||||||
| Hedge funds | ¥ | 2 | ¥ | 0— | Monthly | Same day-30 days | ||||||||||
| Venture capital funds | 4 | 2 | 0— | 0— | ||||||||||||
| Private equity funds | 18 | 21 | 0— | 0— | ||||||||||||
| Real estate funds | 4 | 1 | 0— | 0— | ||||||||||||
| Total | ¥ | 28 | ¥ | 24 | ||||||||||||
Billions of yen | ||||||||||||||||
September 30, 2021 | ||||||||||||||||
Fair value | Unfunded commitments (1) | Redemption frequency (if currently eligible) (2) | Redemption notice (3) | |||||||||||||
| Hedge funds | ¥ | 11 | ¥ | 0— | Monthly | Same day-30 days | ||||||||||
| Venture capital funds | 4 | 4 | 0— | 0— | ||||||||||||
| Private equity funds | 17 | 21 | 0— | 0— | ||||||||||||
| Real estate funds | 3 | 1 | 0— | 0— | ||||||||||||
| Total | ¥ | 35 | ¥ | 26 | ||||||||||||
| (1) | The contractual amount of any unfunded commitments Nomura is required to make to the entities in which the investment is held. |
| (2) | The range in frequency with which Nomura can redeem investments. |
| (3) | The range in notice period required to be provided before redemption is possible. |
Hedge funds:
These investments include funds of funds that invest in multiple asset classes. The fair values of these investments are determined using NAV per share. Although most of these funds can be redeemed within six months, certain funds cannot be redeemed within six months due to contractual, liquidity or gating issues. The redemption period is unknown for certain suspended or liquidating funds. Some of these investments contain restrictions against transfers of the investments to third parties.
Venture capital funds:
These investments include primarily
start-up
funds. The fair values of these investments are determined using NAV per share. Most of these funds cannot be redeemed within six months. The redemption period is unknown for certain suspended or liquidating funds. Some of these investments contain restrictions against transfers of the investments to third parties.Private equity funds:
These investments are made mainly in various sectors in Europe, U.S. and Japan. The fair values of these investments are determined using NAV per share. Redemption is restricted for most of these investments. The redemption period is unknown for certain suspended or liquidating funds. Some of these investments contain restrictions against transfers of the investments to third parties.
Real estate funds:
These are investments in commercial and other types of real estate. The fair values of these investments are determined using NAV per share. Redemption is restricted for most of these investments. The redemption period is unknown for certain suspended or liquidating funds. Some of these investments contain restrictions against transfers of the investments to third parties.
F-34
Notes to the Interim Consolidated Financial Statements—(Continued) (UNAUDITED)
Fair value option for financial assets and financial liabilities
Nomura measures certain eligible financial assets and liabilities at fair value through the election of the fair value option permitted by ASC 815 “”” When Nomura elects the fair value option for an eligible item, changes in that item’s fair value are recognized through earnings. Election of the fair value option is generally irrevocable unless an event occurs that gives rise to a new basis of accounting for that instrument.
Derivatives and Hedging
and ASC 825 “
Financial Instruments.
The financial assets and financial liabilities primarily elected for the fair value option by Nomura, and the reasons for the election, are as follows:
| • | Equity method investments reported within Trading assets and private equity and debt investments Other assets |
| • | Loans receivables Receivables from customers Loans and receivables |
| • | Reverse repurchase and repurchase agreements reported within Collateralized agreements Collateralized financing |
| • | All structured notes issued on or after April 1, 2008 reported within Short-term borrowings Long-term borrowings |
| • | Certain structured deposit issuances reported within Deposits received at banks. Nomura elects the fair value option for those structured deposits primarily to mitigate the volatility through earnings caused by differences in the measurement basis for structured deposits and the derivatives Nomura uses to risk manage those positions. |
| • | Financial liabilities reported within Long-term borrowings |
| • | Financial reinsurance contracts reported within Other assets. |
In March 2021, Nomura also elected the fair value option for certain claims receivable arising from the U.S. Prime Brokerage Event. This election was made as these receivables will be prospectively managed on a fair value basis. The receivables are reported withinin the consolidated balance sheets and any subsequent changes in fair value recognized in earnings and reported withinin the consolidated statements of income.
Loans and receivables
Net gain (loss) on trading
.
Interest and dividends arising from financial instruments for which the fair value option has been elected are recognized withinor.
Interest and dividends, Interest expense
Net gain on trading
F-35
Notes to the Interim Consolidated Financial Statements—(Continued) (UNAUDITED)
The following table presents gains (losses) due to changes in fair value for financial instruments measured at fair value using the fair value option for the six and three months ended September 30, 2020 and 2021.
Billions of yen | ||||||||
Six months ended September 30 | ||||||||
2020 | 2021 | |||||||
Gains / (Losses) (1) | ||||||||
Assets: | ||||||||
Trading assets and private equity and debt investments (2) | ||||||||
Trading assets | ¥ | 1 | ¥ | 0 | ||||
Private equity and debt investments | 0 | 1 | ||||||
Loans and receivables | 4 | 8 | ||||||
Collateralized agreements (3) | 2 | 0 | ||||||
Other assets (2) | 24 | 16 | ||||||
Total | ¥ | 31 | ¥ | 25 | ||||
Liabilities: | ||||||||
Short-term borrowings (4) | ¥ | (27 | ) | ¥ | 21 | |||
Payables and deposits | 1 | 3 | ||||||
Collateralized financing (3) | (1 | ) | 6 | |||||
Long-term borrowings (4)(5) | (190 | ) | (25 | ) | ||||
Other liabilities (6) | (4 | ) | (10 | ) | ||||
Total | ¥ | (221 | ) | ¥ | (5 | ) | ||
Billions of yen | ||||||||
Three months ended September 30 | ||||||||
2020 | 2021 | |||||||
Gains / (Losses) (1) | ||||||||
Assets: | ||||||||
Trading assets and private equity and debt investments (2) | ||||||||
Trading assets | ¥ | 1 | ¥ | 0— | ||||
Private equity and debt investments | 0 | 1 | ||||||
Loans and receivables | 2 | 4 | ||||||
Collateralized agreements (3) | 3 | 0 | ||||||
Other assets (2) | 4 | 5 | ||||||
Total | ¥ | 10 | ¥ | 10 | ||||
Liabilities: | ||||||||
Short-term borrowings (4) | ¥ | 19 | ¥ | 33 | ||||
Payables and deposits | 0 | 0 | ||||||
Collateralized financing (3) | (2 | ) | 8 | |||||
Long-term borrowings (4)(5) | (36 | ) | 30 | |||||
Other liabilities (6) | (5 | ) | (6 | ) | ||||
Total | ¥ | (24 | ) | ¥ | 65 | |||
| (1) | Includes gains and losses reported primarily within Net gain on trading Revenue—Other |
| (2) | Includes equity investments that would have been accounted for under the equity method had Nomura not chosen to elect the fair value option. |
| (3) | Includes reverse repurchase and repurchase agreements. |
| (4) | Includes structured notes and other financial liabilities. |
| (5) | Includes secured financing transactions arising from transfers of financial assets which did not meet the criteria for sales accounting. |
| (6) | Includes unfunded written loan commitments. |
F-36
Notes to the Interim Consolidated Financial Statements—(Continued) (UNAUDITED)
As of March 31, 2021 and September 30, 2021, Nomura held an economic interest of 39.27% and 39.85% in American Century Companies, Inc., respectively. The investment is measured at fair value on a recurring basis through election of the fair value option and is reported withinin the consolidated balance sheets.
Other assets—Other
There was no significant impact on financial assets for which the fair value option was elected attributable to instrument-specific credit risk.
Nomura calculates the impact of changes in its own creditworthiness on certain financial liabilities for which the fair value option is elected by DCF valuation techniques using a rate which incorporates observable changes in its credit spread.
The following table presents changes in the valuation adjustment for Nomura’s own credit worthiness applied to certain financial liabilities for which the fair value option has been elected recognized in other comprehensive income during the period and cumulatively, and amounts reclassified to earnings from accumulated other comprehensive income on early settlement of such financial liabilities during the six and three months ended September 30, 2020 and 2021.
Billions of yen | ||||||||
Six months ended September 30 | ||||||||
2020 | 2021 | |||||||
| Changes recognized as a credit (debit) to other comprehensive income | ¥ | (53 | ) | ¥ | 6 | |||
| Credit (debit) amounts reclassified to earnings | (11 | ) | 1 | |||||
| Cumulative credit (debit) balance recognized in accumulated other comprehensive income | 27 | (5 | ) | |||||
Billions of yen | ||||||||
Three months ended September 30 | ||||||||
2020 | 2021 | |||||||
| Changes recognized as a credit (debit) to other comprehensive income | ¥ | (54 | ) | ¥ | 1 | |||
| Credit (debit) amounts reclassified to earnings | (2 | ) | 0 | |||||
As of March 31, 2021, the fair value of the aggregate unpaid principal balance (which is contractually principally protected) of Loans and receivables for which the fair value option was elected was ¥219¥45 billion less than the principal balance of such Long-term borrowings. There were no Loans and receivables for which the fair value option was elected that were 90 days or more past due.
billion less than the principal balance of such Loans and receivables. The significant portion of the principal balance is derived from receivables for the claim of the losses on the related hedges by the default of a client arising from the U.S. Prime Brokerage Event. The fair value of the aggregate unpaid principal balance (which is contractually principally protected) of Long-term borrowings for which the fair value option was elected was
As of September 30, 2021, the fair value of the aggregate unpaid principal balance (which is contractually principally protected) offor which the fair value option was elected was ¥273 billion less than the principal balance of such. The fair value of the aggregate unpaid principal balance (which is contractually principally protected) offor which the fair value option was elected was ¥31
Loans and receivables
Loans and receivables
Long-term borrowings
billion less than the principal balance of such. The unpaid principal balance offor which the fair value option was elected that were 90 days or more past due was
¥267 billion.Long-term borrowings
Loans and receivables
Investment by Investment companies
Nomura carries all of investments by investment companies under ASC 946 “” at fair value, with changes in fair value recognized through the consolidated statements of income.
Financial Services—Investment Companies
Concentrations of credit risk
Concentrations of credit risk may arise from trading, securities financing transactions and underwriting activities, and may be impacted by changes in political or economic factors. Nomura has credit risk concentrations on bonds issued by the Japanese Government, U.S. Government, British Government (“U.K.”), Governments within the European Union (“EU”), their states and municipalities, and their agencies. These concentrations generally arise from taking trading positions and are reported withinin the consolidated balance sheets. Government, agency and municipal securities, including, represented 15% of total assets as of March 31, 2021 and 19% as of September 30, 2021.
Trading assets
Securities pledged as collateral
F-37
Notes to the Interim Consolidated Financial Statements—(Continued) (UNAUDITED)
The following tables present geographic allocations of Nomura’s trading assets related to government, agency and municipal securities. See Note 3 “” for further information regarding the concentration of credit risk for derivatives.
Derivative instruments and hedging activities
Billions of yen | ||||||||||||||||||||
March 31, 2021 | ||||||||||||||||||||
Japan | U.S. | EU & U.K. | Other | Total (1) | ||||||||||||||||
| Government, agency and municipal securities | ¥ | 1,715 | ¥ | 1,888 | ¥ | 2,329 | ¥ | 620 | ¥ | 6,552 | ||||||||||
Billions of yen | ||||||||||||||||||||
September 30, 2021 | ||||||||||||||||||||
Japan | U.S. | EU & U.K. | Other | Total (1) | ||||||||||||||||
| Government, agency and municipal securities | ¥ | 2,174 | ¥ | 2,685 | ¥ | 2,696 | ¥ | 654 | ¥ | 8,209 | ||||||||||
| (1) | Other than above, there were ¥299 billion and ¥301 billion of government, agency and municipal securities reported within Other assets—Non-trading debt securities |
Estimated fair value of financial instruments not carried at fair value
Certain financial instruments are not carried at fair value on a recurring basis in the consolidated balance sheets since they are neither held for trading purposes nor are elected for the fair value option. These are typically carried at contractual amounts due or amortized cost.
The carrying value of the majority of the financial instruments detailed below will approximate fair value since they are short-term in nature and contain minimal credit risk. These financial instruments include financial assets reported withinandand financial liabilities reported withinandin the consolidated balance sheets.
Cash and cash equivalents, Time deposits, Deposits with stock exchanges and other segregated cash, Receivables from customers, Receivables from other than customers, Securities purchased under agreements to resell
Securities borrowed
Short-term borrowings, Payables to customers, Payables to other than customers, Deposits received at banks, Securities sold under agreements to repurchase, Securities loaned
Other secured borrowings
The fair values of other financial instruments which are longer-term in nature or may contain more than minimal credit risk may be different to their carrying value. Financial assets of this type primarily include certain loans which are reported withinwhile financial liabilities primarily include long-term borrowings which are reported within.
Loans receivable
Long-term borrowings
F-38
Notes to the Interim Consolidated Financial Statements—(Continued) (UNAUDITED)
The following tables present carrying values, fair values and classification within the fair value hierarchy for certain classes of financial instrument of which a portion of the ending balance was carried at fair value as of March 31, 2021 and September 30 2021.
Billions of yen | ||||||||||||||||||||
March 31, 2021 (1) | ||||||||||||||||||||
Carrying value | Fair value | Fair value by level | ||||||||||||||||||
Level 1 | Level 2 | Level 3 | ||||||||||||||||||
Assets: | ||||||||||||||||||||
Cash and cash equivalents | ¥ | 3,510 | ¥ | 3,510 | ¥ | 3,510 | ¥ | 0— | ¥ | 0— | ||||||||||
Time deposits | 281 | 281 | 0— | 281 | 0— | |||||||||||||||
Deposits with stock exchanges and other segregated cash | 374 | 374 | 0— | 374 | 0— | |||||||||||||||
Loans receivable (2) | 2,937 | 2,937 | 0— | 2,120 | 817 | |||||||||||||||
Securities purchased under agreements to resell | 10,775 | 10,775 | 0— | 10,757 | 18 | |||||||||||||||
Securities borrowed | 5,264 | 5,264 | 0— | 5,264 | 0— | |||||||||||||||
Total | ¥ | 23,141 | ¥ | 23,141 | ¥ | 3,510 | ¥ | 18,796 | ¥ | 835 | ||||||||||
Liabilities: | ||||||||||||||||||||
Short-term borrowings | ¥ | 1,368 | ¥ | 1,368 | ¥ | 0— | ¥ | 1,265 | ¥ | 103 | ||||||||||
Deposits received at banks | 1,342 | 1,343 | 0— | 1,342 | 1 | |||||||||||||||
Securities sold under agreements to repurchase | 13,360 | 13,360 | 0— | 13,360 | 0 | |||||||||||||||
Securities loaned | 1,381 | 1,381 | 0— | 1,381 | 0— | |||||||||||||||
Other secured borrowings | 393 | 393 | 0— | 393 | 0— | |||||||||||||||
Long-term borrowings | 7,975 | 7,978 | 5 | 7,370 | 603 | |||||||||||||||
Total | ¥ | 25,819 | ¥ | 25,823 | ¥ | 5 | ¥ | 25,111 | ¥ | 707 | ||||||||||
Billions of yen | ||||||||||||||||||||
September 30, 2021 (1) | ||||||||||||||||||||
Carrying value | Fair value | Fair value by level | ||||||||||||||||||
Level 1 | Level 2 | Level 3 | ||||||||||||||||||
Assets: | ||||||||||||||||||||
Cash and cash equivalents | ¥ | 3,836 | ¥ | 3,836 | ¥ | 3,836 | ¥ | 0— | ¥ | 0— | ||||||||||
Time deposits | 343 | 343 | 0— | 343 | 0— | |||||||||||||||
Deposits with stock exchanges and other segregated cash | 313 | 313 | 0— | 313 | 0— | |||||||||||||||
Loans receivable (2) | 3,084 | 3,084 | 0— | 2,214 | 870 | |||||||||||||||
Securities purchased under agreements to resell | 11,273 | 11,273 | 0— | 11,260 | 13 | |||||||||||||||
Securities borrowed | 4,659 | 4,657 | 0— | 4,657 | 0— | |||||||||||||||
Total | ¥ | 23,508 | ¥ | 23,506 | ¥ | 3,836 | ¥ | 18,787 | ¥ | 883 | ||||||||||
Liabilities: | ||||||||||||||||||||
Short-term borrowings | ¥ | 1,189 | ¥ | 1,189 | ¥ | 0— | ¥ | 1,103 | ¥ | 86 | ||||||||||
Deposits received at banks | 1,464 | 1,464 | 0— | 1,462 | 2 | |||||||||||||||
Securities sold under agreements to repurchase | 13,463 | 13,463 | 0— | 13,463 | 0— | |||||||||||||||
Securities loaned | 1,516 | 1,515 | 0— | 1,515 | 0— | |||||||||||||||
Other secured borrowings | 381 | 381 | 0— | 381 | 0— | |||||||||||||||
Long-term borrowings | 8,696 | 8,716 | 11 | 8,152 | 553 | |||||||||||||||
Total | ¥ | 26,709 | ¥ | 26,728 | ¥ | 11 | ¥ | 26,076 | ¥ | 641 | ||||||||||
| (1) | Includes financial instruments which are carried at fair value on a recurring basis. |
| (2) | Carrying values are shown after deducting relevant allowances for credit losses. |
F-39
Notes to the Interim Consolidated Financial Statements—(Continued) (UNAUDITED)
Assets and liabilities measured at fair value on a nonrecurring basis
In addition to financial instruments carried at fair value on a recurring basis, Nomura also measures other financial and
non-financial
assets and liabilities at fair value on a nonrecurring basis, where the primary measurement basis is not fair value. Fair value is only used in specific circumstances after initial recognition such as to measure impairment.As of March 31, 2021, the equity method investment in Nomura Real Estate Holdings, Inc., one of Nomura’s affiliated companies, is measured at fair value on a nonrecurring basis. The investment that is reported within Investments in and advances to affiliated companies in the consolidated balance sheets was impaired by ¥47,661 million. The fair value used to measure the other than temporary impairment was the quoted market price as of March 31, 2021 which would be classified in Level 1 of the fair value hierarchy.
As of September 30, 2021, there were no significant amount of assets and liabilities which were measured at fair value on a nonrecurring basis.
F-40
Notes to the Interim Consolidated Financial Statements—(Continued) (UNAUDITED)
3. Derivative instruments and hedging activities:
Nomura uses a variety of derivative financial instruments, including futures, forwards, options and swaps, for both trading and
non-trading
purposes.Derivatives used for trading purposes
In the normal course of business, Nomura enters into transactions involving derivative financial instruments to meet client needs, for trading purposes, and to reduce its own exposure to loss due to adverse fluctuations in interest rates, currency exchange rates and market prices of securities. These financial instruments include contractual agreements such as commitments to swap interest payment streams, exchange currencies or purchase or sell securities and other financial instruments on specific terms at specific future dates.
Nomura maintains active trading positions in a variety of derivative financial instruments. Most of Nomura’s trading activities are client oriented. Nomura utilizes a variety of derivative financial instruments as a means of bridging clients’ specific financial needs and investors’ demands in the securities markets. Nomura also actively trades securities and various derivatives to assist its clients in adjusting their risk profiles as markets change. In performing these activities, Nomura carries an inventory of capital markets instruments and maintains its access to market liquidity by quoting bid and offer prices to and trading with other market makers. These activities are essential to provide clients with securities and other capital market products at competitive prices.
Futures and forward contracts are commitments to either purchase or sell securities, foreign exchange contracts or other capital market instruments at a specific future date for a specified price and may be settled in cash or through delivery. Foreign exchange contracts include spot and forward contracts and involve the exchange of two currencies at a rate agreed by the contracting parties. Risks arise from the possible inability of counterparties to meet the terms of their contracts and from movements in market prices. Futures contracts are executed through exchanges which clear and guarantee performance of counterparties. Accordingly, credit risk associated with futures contracts is considered minimal. In contrast, forward contracts are generally negotiated between two counterparties and, therefore, are subject to counterparty risks.
Options are contracts that grant the purchaser, for a premium payment, the right to either purchase or sell a financial instrument at a specified price within a specified period of time or on a specified date from or to the writer of the option. The writer of options receives premiums and bears the risk of unfavorable changes in the market price of the financial instruments underlying the options.
Swaps are contractual agreements in which two counterparties agree to exchange certain cash flows, at specified future dates, based on an agreed contract. Certain agreements may result in combined interest rate and foreign exchange exposures. Entering into swap agreements may involve the risk of credit losses in the event of counterparty default.
To the extent these derivative financial instruments are economically hedging financial instruments or securities positions of Nomura, the overall risk of loss may be fully or partly mitigated by the hedged position.
Nomura seeks to minimize its exposure to market risk arising from its use of these derivative financial instruments through various control policies and procedures, including position limits, monitoring procedures and hedging strategies whereby Nomura enters into offsetting or other positions in a variety of financial instruments.
F-41
Notes to the Interim Consolidated Financial Statements—(Continued) (UNAUDITED)
Derivatives used for
non-trading
purposesNomura’s principal objectives in using derivatives for
non-trading
purposes are to manage interest rate risk, to modify interest rate risk profile of certain financial liabilities, to manage foreign exchange risk of certain foreign currency denominated debt securities, to manage net investment exposure to fluctuations in foreign exchange rates arising from certain foreign operations and to mitigate equity price risk arising from certain stock-based compensation awards given to employees. Credit risk associated with derivatives utilized fornon-trading
purposes is controlled and managed in the same way as that associated with derivatives used for trading purposes.Nomura designates certain derivative financial instruments as fair value hedges of interest rate risk arising from specific financial liabilities and foreign currency risk arising from specific foreign currency denominated debt securities. These derivatives are effective in reducing the risk associated with the exposure being hedged and are highly correlated with changes in the fair value and foreign currency rates of the underlying hedged items, both at inception and throughout the life of the hedging relationship. Changes in fair value of the hedging derivatives are reported together with those of the hedged liabilities and assets through the consolidated statements of income withinand, respectively.
Interest expense
Revenue—Other
Derivative financial instruments designated as hedges of the net investment in foreign operations relate to specific subsidiaries with. All other movements in fair value of highly effective hedging derivatives are reported through NHI shareholders’ equity within.
non-Japanese
Yen functional currencies. When determining the effectiveness of net investment hedges, the effective portion of the change in fair value of the hedging derivative is determined by changes in spot exchange rates. Changes in fair value of the hedging derivatives attributable to changes in the difference between the forward rate and spot rate are excluded from the measurement of hedge effectiveness and are reported in the consolidated statements of income withinRevenue—Other
Accumulated other comprehensive income (loss)
Concentrations of credit risk for derivatives
The following tables present Nomura’s significant concentration of exposures to credit risk in OTC derivatives with financial institutions including transactions cleared through central counterparties as of March 31, 2021 and September 30, 2021. The gross fair value of derivative assets represents the maximum amount of loss due to credit risk that Nomura would incur if the counterparties of Nomura failed to perform in accordance with the terms of the instruments and any collateral or other security Nomura held in relation to those instruments proved to be of no value.
Billions of yen | ||||||||||||||||
March 31, 2021 | ||||||||||||||||
Gross fair value of derivative assets | Impact of master netting agreements | Impact of collateral | Net exposure to credit risk | |||||||||||||
| Financial institutions | ¥ | 13,474 | ¥ | (11,473 | ) | ¥ | (1,500 | ) | ¥ | 501 | ||||||
Billions of yen | ||||||||||||||||
September 30, 2021 | ||||||||||||||||
Gross fair value of derivative assets | Impact of master netting agreements | Impact of collateral | Net exposure to credit risk | |||||||||||||
| Financial institutions | ¥ | 11,375 | ¥ | (9,566 | ) | ¥ | (1,466 | ) | ¥ | 343 | ||||||
F-42
Notes to the Interim Consolidated Financial Statements—(Continued) (UNAUDITED)
Derivative activities
The following tables quantify the volume of Nomura’s derivative activity as of March 31, 2021 and September 30, 2021 through a disclosure of notional amounts, in comparison with the fair value of those derivatives. All amounts are disclosed on a gross basis, prior to counterparty netting of derivative assets and liabilities and cash collateral netting against net derivatives.
Billions of yen | ||||||||||||
March 31, 2021 | ||||||||||||
Derivative assets | Derivative liabilities | |||||||||||
Total Notional (1) | Fair value | Fair value (1) | ||||||||||
Derivatives used for trading and non-trading purposes(2)(3) : | ||||||||||||
Equity contracts | ¥ | 40,396 | ¥ | 1,402 | ¥ | 2,229 | ||||||
Interest rate contracts | 2,524,407 | 9,617 | 9,023 | |||||||||
Credit contracts | 38,850 | 455 | 523 | |||||||||
Foreign exchange contracts | 351,662 | 4,511 | 4,402 | |||||||||
Commodity contracts | 334 | 1 | 0 | |||||||||
Total | ¥ | 2,955,649 | ¥ | 15,986 | ¥ | 16,177 | ||||||
Derivatives designated as hedging instruments: | ||||||||||||
Interest rate contracts | ¥ | 1,168 | ¥ | 15 | ¥ | 14 | ||||||
Foreign exchange contracts | 130 | 5 | 0— | |||||||||
Total | ¥ | 1,298 | ¥ | 20 | ¥ | 14 | ||||||
Total derivatives | ¥ | 2,956,947 | ¥ | 16,006 | ¥ | 16,191 | ||||||
Billions of yen | ||||||||||||
September 30, 2021 | ||||||||||||
Derivative assets | Derivative liabilities | |||||||||||
Total Notional (1) | Fair value | Fair value (1) | ||||||||||
Derivatives used for trading and non-trading purposes(2)(3) : | ||||||||||||
Equity contracts | ¥ | 36,347 | ¥ | 1,154 | ¥ | 1,540 | ||||||
Interest rate contracts | 2,660,846 | 8,291 | 7,669 | |||||||||
Credit contracts | 40,917 | 426 | 479 | |||||||||
Foreign exchange contracts | 359,352 | 3,616 | 3,570 | |||||||||
Commodity contracts | 338 | 3 | 0 | |||||||||
Total | ¥ | 3,097,800 | ¥ | 13,490 | ¥ | 13,258 | ||||||
Derivatives designated as hedging instruments: | ||||||||||||
Interest rate contracts | ¥ | 1,779 | ¥ | 6 | ¥ | 6 | ||||||
Foreign exchange contracts | 136 | 2 | 0— | |||||||||
Total | ¥ | 1,915 | ¥ | 8 | ¥ | 6 | ||||||
Total derivatives | ¥ | 3,099,715 | ¥ | 13,498 | ¥ | 13,264 | ||||||
| (1) | Includes the amount of embedded derivatives bifurcated in accordance with ASC 815. |
| (2) | Each derivative classification includes derivatives referencing multiple risk components. For example, certain interest rate contracts include complex derivatives referencing interest rate risk as well as foreign exchange risk or other factors such as prepayment rates. Credit contracts include credit default swaps as well as derivatives referencing corporate and government securities. |
| (3) | As of March 31, 2021 and September 30, 2021, the amounts reported include derivatives used for non-trading purposes which are not designated as fair value or net investment hedges. These amounts have not been separately presented since such amounts were not significant. |
Changes in fair value are recognized either through earnings or other comprehensive income depending on the purpose for which the derivatives are used.
F-43
Notes to the Interim Consolidated Financial Statements—(Continued) (UNAUDITED)
Offsetting of derivatives
Counterparty credit risk associated with derivative financial instruments is controlled by Nomura through credit approvals, limits and monitoring procedures. To reduce the risk of loss, Nomura requires collateral, principally cash collateral and government securities, for certain derivative transactions. In certain cases, Nomura may agree for such collateral to be posted to a third-party custodian under a control agreement that enables Nomura to take control of such collateral in the event of counterparty default. From an economic standpoint, Nomura evaluates default risk exposure net of related collateral. Furthermore, OTC derivative transactions are typically documented under industry standard master netting agreements which mitigate Nomura’s credit exposure to counterparties. A master netting agreement is a single agreement with a counterparty that permits multiple transactions governed by that agreement to be terminated or accelerated and settled through a single payment in a single currency in the event of a default of the counterparty
(“close-out
and offsetting rights”).For certain OTC centrally-cleared and exchange-traded derivatives, the clearing or membership agreements entered into by Nomura provide similar rights to Nomura in the event of default of the relevant central clearing party or exchange. Nomura generally seeks to obtain an external legal opinion in order to ascertain the enforceability of such
close-out
and offsetting rights within these agreements.For certain counterparties and /or in certain jurisdictions, Nomura may enter into derivative transactions which are not documented under a master netting agreement. Even when derivatives are documented under such agreements, Nomura may not have obtained, or may not be able to obtain evidence to determine with sufficient certainty that
close-out
and offsetting rights within such agreements are legally enforceable. This may be the case where the relevant local laws explicitly prohibit the enforceability of suchclose-out
and offsetting rights, or where the local laws are complex, ambiguous or silent on the enforceability of such rights. This may include derivative transactions executed with certain foreign governments, agencies, municipalities, central clearing counterparties, exchanges and pension funds.Nomura considers the enforceability of a master netting agreement in determining how credit risk arising from transactions with a specific counterparty is hedged, how counterparty credit exposures are calculated and applied to credit limits and the extent and nature of collateral requirements from the counterparty.
Derivative assets and liabilities with the same counterparty and the related cash collateral receivables and payables documented under an enforceable master netting agreement are presented on a net basis on the consolidated balance sheets where the specific criteria defined by ASC
210-20
“Balance Sheet—Offsetting”
(“ASC210-20”)
and ASC 815 are met.The following table presents information about offsetting of derivatives and related collateral amounts on the consolidated balance sheets as of March 31, 2021 and September 30, 2021 by type of derivative contract, and additional amounts permitted to be offset legally by Nomura under enforceable master netting agreements, central clearing counterparties or exchange rules in the event of counterparty default but not offset on the consolidated balance sheets due to one or more of the criteria defined by ASC
210-20
and ASC 815 are not met. Derivative transactions which are not documented under a master netting agreement or are documented under a master netting agreement for which Nomura does not have sufficient evidence of enforceability ofclose-out
and offsetting rights are not offset in the following table. F-44
Notes to the Interim Consolidated Financial Statements—(Continued) (UNAUDITED)
Billions of yen | Billions of yen | |||||||||||||||
March 31, 2021 | September 30, 2021 | |||||||||||||||
Derivative assets | Derivative liabilities (1) | Derivative assets | Derivative liabilities (1) | |||||||||||||
Equity contracts | ||||||||||||||||
OTC settled bilaterally | ¥ | 904 | ¥ | 1,439 | ¥ | 720 | ¥ | 904 | ||||||||
Exchange-traded | 498 | 790 | 434 | 636 | ||||||||||||
Interest rate contracts | ||||||||||||||||
OTC settled bilaterally | 8,456 | 7,871 | 7,446 | 6,810 | ||||||||||||
OTC centrally-cleared | 1,147 | 1,146 | 826 | 844 | ||||||||||||
Exchange-traded | 29 | 20 | 25 | 21 | ||||||||||||
Credit contracts | ||||||||||||||||
OTC settled bilaterally | 169 | 251 | 157 | 224 | ||||||||||||
OTC centrally-cleared | 282 | 269 | 267 | 254 | ||||||||||||
Exchange-traded | 4 | 3 | 2 | 1 | ||||||||||||
Foreign exchange contracts | ||||||||||||||||
OTC settled bilaterally | 4,516 | 4,402 | 3,618 | 3,570 | ||||||||||||
Commodity contracts | ||||||||||||||||
OTC settled bilaterally | 0 | 0 | 0 | 0 | ||||||||||||
Exchange-traded | 1 | 0 | 3 | 0 | ||||||||||||
Total gross derivative balances (2) | ¥ | 16,006 | ¥ | 16,191 | ¥ | 13,498 | ¥ | 13,264 | ||||||||
Less: Amounts offset in the consolidated balance sheets (3) | (14,786 | ) | (14,697 | ) | (12,333 | ) | (11,994 | ) | ||||||||
Total net amounts reported on the face of the consolidated balance sheets (4) | ¥ | 1,220 | ¥ | 1,494 | ¥ | 1,165 | ¥ | 1,270 | ||||||||
Less: Additional amounts not offset in the consolidated balance sheets (5) | ||||||||||||||||
Financial instruments and non-cash collateral | (240 | ) | (310 | ) | (334 | ) | (232 | ) | ||||||||
Net amount | ¥ | 980 | ¥ | 1,184 | ¥ | 831 | ¥ | 1,038 | ||||||||
| (1) | Includes the amount of embedded derivatives bifurcated in accordance with ASC 815. |
| (2) | Includes all gross derivative asset and liability balances irrespective of whether they are transacted under a master netting agreement or whether Nomura has obtained sufficient evidence of enforceability of the master netting agreement. As of March 31, 2021, the gross balance of derivative assets and derivative liabilities which are not documented under master netting agreements or are documented under master netting agreements for which Nomura has not yet obtained sufficient evidence of enforceability was ¥392 billion and ¥589 billion, respectively. As of September 30, 2021, the gross balance of such derivative assets and derivative liabilities was ¥364 billion and ¥565 billion, respectively. |
| (3) | Represents amounts offset through counterparty netting of derivative assets and liabilities as well as cash collateral netting against net derivatives under master netting and similar agreements for which Nomura has obtained sufficient evidence of enforceability in accordance with ASC 815. As of March 31, 2021, Nomura offset a total of ¥1,594 billion of cash collateral receivables against net derivative liabilities and ¥1,683 billion of cash collateral payables against net derivative assets. As of September 30, 2021, Nomura offset a total of ¥1,158 billion of cash collateral receivables against net derivative liabilities and ¥1,497 billion of cash collateral payables against net derivative assets. |
| (4) | Net derivative assets and net derivative liabilities are generally reported within Trading assets and private equity and debt investments—Trading assets Trading liabilities Short-term borrowings Long-term borrowings |
| (5) | Represents amounts which are not permitted to be offset on the face of the consolidated balance sheets in accordance with ASC 210-20 and ASC 815 but which provide Nomura with a legally enforceable right of offset in the event of counterparty default. Amounts relating to derivative and collateral agreements where Nomura has not yet obtained sufficient evidence of enforceability of such offsetting rights are excluded. As of March 31, 2021, a total of ¥283 billion of cash collateral receivables and ¥572 billion of cash collateral payables, including amounts reported in the table, have not been offset against net derivatives. As of September 30, 2021, a total of ¥241 billion of cash collateral receivables and ¥523 billion of cash collateral payables, including amounts reported in the table, have not been offset against net derivatives. |
F-45
Notes to the Interim Consolidated Financial Statements—(Continued) (UNAUDITED)
Derivatives used for trading purposes
Derivative financial instruments used for trading purposes, including bifurcated embedded derivatives, are carried at fair value with changes in fair value recognized through the consolidated statements of income within.
Revenue—Net gain on trading
The following table presents amounts included in the consolidated statements of income for the six months ended September 30, 2020 and 2021 related to derivatives used for trading and
non-trading
purposes by type of underlying derivative contract.Billions of yen | ||||||||
Six months ended September 30 | ||||||||
2020 | 2021 | |||||||
Derivatives used for trading and non-trading purposes(1)(2) : | ||||||||
| Equity contracts | ¥ | 90 | ¥ | (185 | ) | |||
| Interest rate contracts | 176 | 16 | ||||||
| Credit contracts | (85 | ) | 2 | |||||
| Foreign exchange contracts | (52 | ) | 26 | |||||
| Commodity contracts | (10 | ) | 33 | |||||
| Total | ¥ | 119 | ¥ | (108) | ||||
Billions of yen | ||||||||
Three months ended September 30 | ||||||||
2020 | 2021 | |||||||
Derivatives used for trading and non-trading purposes(1)(2) : | ||||||||
| Equity contracts | ¥ | (47 | ) | ¥ | (117 | ) | ||
| Interest rate contracts | 40 | 7 | ||||||
| Credit contracts | (78 | ) | (8 | ) | ||||
| Foreign exchange contracts | 7 | (43 | ) | |||||
| Commodity contracts | (5 | ) | 10 | |||||
| Total | ¥ | (83 | ) | ¥ | (151) | |||
| (1) | Each derivative classification includes derivatives referencing multiple risk components. For example, interest rates contracts include complex derivatives referencing interest rate risk as well as foreign exchange risk or other factors such as prepayment rates. Credit contracts include credit default swaps as well as derivatives referencing corporate and government securities. |
| (2) | Includes net gains (losses) on derivatives used for non-trading purposes which are not designated as fair value or net investment hedges. For the six and three months ended September 30, 2020 and 2021, these amounts have not been separately presented as net gains (losses) for thesenon-trading derivatives were not significant. |
F-46
Notes to the Interim Consolidated Financial Statements—(Continued) (UNAUDITED)
Fair value hedges
Nomura issues Japanese Yen and foreign currency denominated debts with both fixed and floating interest rates. Nomura generally enters into swap agreements to convert fixed rate interest payments on its debt obligations to a floating rate and applies fair value hedge accounting to these instruments. In conjunction with LIBOR transition, Nomura has terminated certain hedging instruments that reference LIBOR and entered into new hedging transactions. The arrangements were accounted for as discontinuation of hedge accounting and re-designation of new hedging relationships.
The following table presents the carrying value of the hedged items that are currently designated in a hedging relationship and the related cumulative amount of fair value hedging adjustment included in the carrying amount of the hedged items as of March 31, 2021 and September 30, 2021.
Billions of yen | ||||||||||||||||
Line items in the statement of financial position in which the hedged item is included: | Carrying amount of the hedged assets/liabilities | Cumulative gains/(losses) of fair value hedging adjustment included in the carrying amount of the hedged assets/liabilities | ||||||||||||||
March 31, 2021 | September 30, 2021 | March 31, 2021 | September 30, 2021 | |||||||||||||
| Long-term borrowings | ¥ | 1,164 | ¥ | 1,773 | ¥ | 2 | ¥ | 5 | ||||||||
| Total | ¥ | 1,164 | ¥ | 1,773 | ¥ | 2 | ¥ | 5 | ||||||||
Hedging derivatives designated as fair value hedges are carried at fair value attributable to the hedged risk, which is recognized in the consolidated statements of income withinand, respectively together with the change in fair value of the hedged items.
Interest expense
Revenue-Other
The cumulative amount of fair value hedging adjustments remaining for the liabilities which hedge accounting has been discontinued is ¥87 million as of March 31, 2021 and ¥482 million as of September 30, 2021.
The following table presents amounts included in the consolidated statements of income for the six and three months ended September 30, 2020 and 2021 related to derivatives designated as fair value hedges by type of underlying derivative contract and the nature of the hedged item.
Billions of yen | ||||||||
Six months ended September 30 | ||||||||
2020 | 2021 | |||||||
| Derivatives designated as hedging instruments: | ||||||||
| Interest rate contracts | ¥ | (1 | ) | ¥ | (3 | ) | ||
| Total | ¥ | (1 | ) | ¥ | (3 | ) | ||
| Hedged items: | ||||||||
| Long-term borrowings | ¥ | 1 | ¥ | 3 | ||||
| Total | ¥ | 1 | ¥ | 3 | ||||
Billions of yen | ||||||||
Three months ended September 30 | ||||||||
2020 | 2021 | |||||||
| Derivatives designated as hedging instruments: | ||||||||
| Interest rate contracts | ¥ | 1 | ¥ | 5 | ||||
| Total | ¥ | 1 | ¥ | 5 | ||||
| Hedged items: | ||||||||
| Long-term borrowings | ¥ | (1 | ) | ¥ | (5 | ) | ||
| Total | ¥ | (1 | ) | ¥ | (5 | ) | ||
F-47
Notes to the Interim Consolidated Financial Statements—(Continued) (UNAUDITED)
Net investment hedges
Nomura designates certain foreign currency derivative contracts, as hedges of net investments in certain foreign operations with significant foreign exchange risks and applies hedge accounting to these instruments. Accordingly, foreign exchange gains (losses) arising from the derivative contracts and. This is offset by the foreign exchange adjustments arising from consolidation of the relevant foreign subsidiaries.
non-derivative
financial products designated as hedges, except for the portion excluded from effectiveness assessment, are recognized through the consolidated statements of comprehensive income withinOther comprehensive income (loss)—Change in cumulative translation adjustments, net of tax
The following tables presents gains (losses) from derivatives designated as net investment hedges included in the consolidated statements of comprehensive income for the six and three months ended September 30, 2020 and 2021.
Billions of yen | ||||||||
Six months ended September 30 | ||||||||
2020 | 2021 | |||||||
| Hedging instruments: | ||||||||
| Foreign exchange contracts | ¥ | (7 | ) | ¥ | 2 | |||
| Total | ¥ | (7 | ) | ¥ | 2 | |||
Billions of yen | ||||||||
Three months ended September 30 | ||||||||
2020 | 2021 | |||||||
| Hedging instruments: | ||||||||
| Foreign exchange contracts | ¥ | (5 | ) | ¥ | 4 | |||
| Total | ¥ | (5 | ) | ¥ | 4 | |||
The portion of gains (losses) representing the amount excluded from the assessment of hedge effectiveness are recognized withinin the consolidated statements of income. The amount of gains (losses) was not significant during the six months ended September 30, 2020 and 2021. The amount of gains (losses) was not significant during the three months ended September 30, 2020 and 2021.
Revenue—Other
Derivatives containing credit risk related contingent features
Nomura enters into certain OTC derivatives and other agreements containing credit-risk-related contingent features. These features would require Nomura to post additional collateral or settle the instrument upon occurrence of a credit event, the most common of which would be a downgrade in the Company’s long-term credit rating.
The aggregate fair value of all derivative instruments with credit-risk-related contingent features that are in a liability position as of March 31, 2021 was ¥727 billion with related collateral pledged of ¥583 billion. In the event of a
one-notch
downgrade to Nomura’s long-term credit rating in effect as of March 31, 2021 the aggregate fair value of assets that would have been required to be posted as additional collateral or that would have been needed to settle the instruments immediately was ¥2 billion.The aggregate fair value of all derivative instruments with credit-risk-related contingent features that are in a liability position as of September 30, 2021 was ¥430 billion with related collateral pledged of ¥298 billion. In the event of a
one-notch
downgrade to Nomura’s long-term credit rating in effect as of September 30, 2021 the aggregate fair value of assets that would have been required to be posted as additional collateral or that would have been needed to settle the instruments immediately was ¥2 billion.F-48
Notes to the Interim Consolidated Financial Statements—(Continued) (UNAUDITED)
Credit derivatives
Credit derivatives are derivative instruments in which one or more of their underlyings are related to the credit risk of a specified entity (or group of entities) or an index based on the credit risk of a group of entities that expose the seller of credit protection to potential loss from credit events specified in the contract.
Written credit derivatives are instruments or embedded features where Nomura assumes third party credit risk, either as guarantor in a guarantee-type contract, or as the party that provides credit protection in an option-type contract, credit default swap, or any other credit derivative contract.
Nomura enters into credit derivatives as part of its normal trading activities as both purchaser and/ or seller of protection for credit risk mitigation, proprietary trading positions and for client transactions.
The most common type of credit derivatives used by Nomura are single-name credit default swaps where settlement of the derivative is based on the credit risk of a single third party. Nomura also writes credit derivatives linked to the performance of credit default indices and issues other credit risk related portfolio products.
Nomura would have to perform under a credit derivative contract if a credit event as defined in the respective contract occurs. Typical credit events include bankruptcy, failure to pay and restructuring of obligations of the reference asset.
Credit derivative contracts written by Nomura are either cash or physically settled. In cash-settled instruments, once payment is made upon an event of a default, the contract usually terminates with no further payments due. Nomura generally has no right to assume the reference assets of the counterparty in exchange for payment, nor does Nomura usually have any direct recourse to the actual issuers of the reference assets to recover the amount paid. In physically settled contracts, upon a default event, Nomura takes delivery of the reference asset in return for payment of the full notional amount of the contract.
Nomura actively monitors and manages its credit derivative exposures. Where protection is sold, risks may be mitigated by purchasing credit protection from other third parties either on identical underlying reference assets or on underlying reference assets with the same issuer which would be expected to behave in a correlated fashion. The most common form of recourse provision to enable Nomura to recover from third parties any amounts paid under a written credit derivative is therefore not through the derivative itself but rather through the purchase of separate credit derivative protection with identical or correlated underlyings.
Extent of these purchased credit protection contracts is quantified in the following tables under the column titled “Purchased Credit Protection.” These amounts represent purchased credit protection with identical underlyings to the written credit derivative contracts which act as a hedge against Nomura’s exposures. To the extent Nomura is required to pay out under the written credit derivative, a similar amount would generally become due to Nomura under the purchased credit protection.
Credit derivatives have a stated notional amount which represents the maximum payment Nomura may be required to make under the written credit derivative contract. However, this is generally not a true representation of the amount Nomura will actually pay under these contracts as there are other factors that affect the likelihood and amount of any payment obligations under the contracts, including:
Probability of default
Recovery value on the underlying asset
F-49
Notes to the Interim Consolidated Financial Statements—(Continued) (UNAUDITED)
Nomura holds assets as collateral in relation to written credit derivatives. However, these amounts do not enable Nomura to recover any amounts paid under the credit derivative but rather mitigate the risk of economic loss arising from a counterparty defaulting against amounts due to Nomura under the contract. Collateral requirements are determined on a counterparty level rather than individual contract, and also generally cover all types of derivative contracts rather than just credit derivatives.
The following tables present information about Nomura’s written credit derivatives and purchased credit protection with identical underlyings as of March 31, 2021 and September 30, 2021.
Billions of yen | ||||||||||||||||||||||||||||
March 31, 2021 | ||||||||||||||||||||||||||||
Maximum potential payout/Notional | Notional | |||||||||||||||||||||||||||
Years to maturity | Purchased credit protection | |||||||||||||||||||||||||||
Carrying value (Asset) / Liability (1) | Total | Less than 1 year | 1 to 3 years | 3 to 5 years | More than 5 years | |||||||||||||||||||||||
| Single-name credit default swaps | ¥ | (80 | ) | ¥ | 7,035 | ¥ | 1,318 | ¥ | 2,297 | ¥ | 2,642 | ¥ | 778 | ¥ | 5,452 | |||||||||||||
| Credit default indices | (246 | ) | 10,235 | 1,271 | 4,065 | 3,989 | 910 | 7,737 | ||||||||||||||||||||
| Other credit risk related portfolio products | 10 | 396 | 73 | 180 | 131 | 12 | 280 | |||||||||||||||||||||
| Credit-risk related options and swaptions | 0 | 39 | 0— | 0— | 39 | 0— | 33 | |||||||||||||||||||||
| Total | ¥ | (316 | ) | ¥ | 17,705 | ¥ | 2,662 | ¥ | 6,542 | ¥ | 6,801 | ¥ | 1,700 | ¥ | 13,502 | |||||||||||||
Billions of yen | ||||||||||||||||||||||||||||
September 30, 2021 | ||||||||||||||||||||||||||||
Maximum potential payout/Notional | Notional | |||||||||||||||||||||||||||
Years to maturity | Purchased credit protection | |||||||||||||||||||||||||||
Carrying value (Asset) / Liability (1) | Total | Less than 1 year | 1 to 3 years | 3 to 5 years | More than 5 years | |||||||||||||||||||||||
| Single-name credit default swaps | ¥ | (93 | ) | ¥ | 7,037 | ¥ | 1,147 | ¥ | 2,645 | ¥ | 2,393 | ¥ | 852 | ¥ | 5,400 | |||||||||||||
| Credit default indices | (231 | ) | 10,826 | 1,621 | 4,809 | 3,429 | 967 | 8,356 | ||||||||||||||||||||
| Other credit risk related portfolio products | 5 | 473 | 51 | 162 | 244 | 16 | 358 | |||||||||||||||||||||
| Credit-risk related options and swaptions | 0 | 7 | 0— | 0— | 7 | 0— | 7 | |||||||||||||||||||||
| Total | ¥ | (319 | ) | ¥ | 18,343 | ¥ | 2,819 | ¥ | 7,616 | ¥ | 6,073 | ¥ | 1,835 | ¥ | 14,121 | |||||||||||||
| (1) | Carrying value amounts are shown on a gross basis prior to cash collateral or counterparty netting. Asset balances represent positive fair value amounts caused by tightening of credit spreads of underlyings since inception of the credit derivative contracts. |
F-50
Notes to the Interim Consolidated Financial Statements—(Continued) (UNAUDITED)
The following tables present information about Nomura’s written credit derivatives by external credit rating of the underlying asset. Ratings are based on S&P Global Ratings (“S&P”), or if not rated by S&P, based on Moody’s Investors Service. If ratings from either of these agencies are not available, the ratings are based on Fitch Ratings Ltd. or Japan Credit Rating Agency, Ltd. For credit default indices, the rating is determined by taking the weighted average of the external credit ratings given for each of the underlying reference entities comprising the portfolio or index.
Billions of yen | ||||||||||||||||||||||||||||
March 31, 2021 | ||||||||||||||||||||||||||||
Maximum potential payout/Notional | ||||||||||||||||||||||||||||
AAA | AA | A | BBB | BB | Other (1) | Total | ||||||||||||||||||||||
| Single-name credit default swaps | ¥ | 198 | ¥ | 1,218 | ¥ | 1,887 | ¥ | 2,098 | ¥ | 753 | ¥ | 881 | ¥ | 7,035 | ||||||||||||||
| Credit default indices | 114 | 128 | 1,880 | 6,294 | 1,415 | 404 | 10,235 | |||||||||||||||||||||
| Other credit risk related portfolio products | 0— | 0— | 4 | 237 | 58 | 97 | 396 | |||||||||||||||||||||
| Credit-risk related options and swaptions | 0— | 0— | 0— | 32 | 7 | 0— | 39 | |||||||||||||||||||||
| Total | ¥ | 312 | ¥ | 1,346 | ¥ | 3,771 | ¥ | 8,661 | ¥ | 2,233 | ¥ | 1,382 | ¥ | 17,705 | ||||||||||||||
Billions of yen | ||||||||||||||||||||||||||||
September 30, 2021 | ||||||||||||||||||||||||||||
Maximum potential payout/Notional | ||||||||||||||||||||||||||||
AAA | AA | A | BBB | BB | Other (1) | Total | ||||||||||||||||||||||
| Single-name credit default swaps | ¥ | 200 | ¥ | 1,226 | ¥ | 1,920 | ¥ | 2,153 | ¥ | 738 | ¥ | 800 | ¥ | 7,037 | ||||||||||||||
| Credit default indices | 96 | 193 | 2,982 | 5,719 | 1,431 | 405 | 10,826 | |||||||||||||||||||||
| Other credit risk related portfolio products | 0— | 0— | 3 | 309 | 58 | 103 | 473 | |||||||||||||||||||||
| Credit-risk related options and swaptions | 0— | 0— | 0— | 0— | 7 | 0— | 7 | |||||||||||||||||||||
| Total | ¥ | 296 | ¥ | 1,419 | ¥ | 4,905 | ¥ | 8,181 | ¥ | 2,234 | ¥ | 1,308 | ¥ | 18,343 | ||||||||||||||
| (1) | “Other” includes credit derivatives where the credit rating of the underlying reference asset is below investment grade or where a rating is unavailable. |
Derivatives entered into in contemplation of sales of financial assets
Nomura enters into transactions which involve both the transfer of financial assets to a counterparty and contemporaneously enters into a separate agreement with the same counterparty through which Nomura retains substantially all of the exposure to the economic return on the transferred financial assets throughout the term of the transaction. These transactions primarily include sales of securities with bilateral OTC total return swaps or other derivative agreements which are
in-substance
total return swaps.These transactions are accounted for as sales of the securities with the derivative accounted for separately if the criteria for derecognition of the securities under ASC 860 are met. Where the derecognition criteria are not met, the transfer and separate derivative are accounted for as a single collateralized financing transaction which is reported withinin the consolidated balance sheets.
Long-term borrowings
For the year ended March 31, 2021, certain transactions which involve sales of securities and total return swaps were accounted for as sales. As of the date of transfer, the carrying amount of the securities and the amount of gross cash proceeds from the sales were ¥69,405 million and ¥69,535 million, respectively. As of March 31, 2021, the fair value of the securities derecognized by Nomura and the gross liability balances of the derivatives arising from the transactions were ¥67,773 million and ¥1,539 million respectively.
For the six months ended September 30, 2021, certain transactions which involve primarily sales of securities and total return swaps were accounted for as sales. As of the date of transfer, the carrying amount of the securities and the amount of gross cash proceeds from the sales were ¥69,737 million and ¥69,868 million, respectively. As of September 30, 2021, the fair value of the securities derecognized by Nomura and the gross liability balances of the derivatives arising from the transactions were ¥68,423 million and ¥1,214 million, respectively.
F-51
Notes to the Interim Consolidated Financial Statements—(Continued) (UNAUDITED)
4. Revenue from services provided to customers
Revenues by types of service
The following table presents revenue earned by Nomura from providing services to customers by relevant line item in Nomura’s consolidated statement of income for the six and three months ended September 30, 2020 and September 30, 2021.
Millions of yen | ||||||||
Six months ended September 30 | ||||||||
2020 | 2021 | |||||||
| Commissions | ¥ | 177,765 | ¥ | 174,522 | ||||
| Fees from investment banking | 37,859 | 69,604 | ||||||
| Asset management and portfolio service fees | 111,073 | 131,237 | ||||||
| Other revenue | 22,493 | 17,641 | ||||||
| Total | ¥ | 349,190 | ¥ | 393,004 | ||||
Millions of yen | ||||||||
Three months ended September 30 | ||||||||
2020 | 2021 | |||||||
| Commissions | ¥ | 92,253 | ¥ | 91,636 | ||||
| Fees from investment banking | 27,031 | 33,901 | ||||||
| Asset management and portfolio service fees | 57,417 | 67,193 | ||||||
| Other revenue | 10,689 | 9,278 | ||||||
| Total | ¥ | 187,390 | ¥ | 202,008 | ||||
Commissions represent revenue principally from trade execution, clearing services and distribution of fund units provided by both the Retail and Wholesale Divisions approximately equally across the divisions.
The following table shows the breakdown offor the six and three months ended September 30, 2020 and 2021.
Commissions
Millions of yen | ||||||||
Six months ended September 30 | ||||||||
2020 | 2021 | |||||||
| Stock Brokerage Commissions | ¥ | 123,938 | ¥ | 125,958 | ||||
| Commissions for distributing of investment trusts | 33,352 | 25,573 | ||||||
| Other | 20,475 | 22,991 | ||||||
| Total | ¥ | 177,765 | ¥ | 174,522 | ||||
Millions of yen | ||||||||
Three months ended September 30 | ||||||||
2020 | 2021 | |||||||
| Stock Brokerage Commissions | ¥ | 60,989 | ¥ | 67,725 | ||||
| Commissions for distributing of investment trusts | 19,275 | 11,166 | ||||||
| Other | 11,989 | 12,745 | ||||||
| Total | ¥ | 92,253 | ¥ | 91,636 | ||||
F-52
Fees from investment banking represent revenues from financial advisory, underwriting and distribution primarily from Wholesale followed by Retail.
The following table shows the breakdown offor the six and three months ended September 30, 2020 and 2021.
Fees from investment banking
Millions of yen | ||||||||
Six months ended September 30 | ||||||||
2020 | 2021 | |||||||
| Equity underwriting and distribution | ¥ | 12,089 | ¥ | 20,231 | ||||
| Bond underwriting and distribution | 9,007 | 13,445 | ||||||
| Financial advisory fees | 11,435 | 26,776 | ||||||
| Other | 5,328 | 9,152 | ||||||
| Total | ¥ | 37,859 | ¥ | 69,604 | ||||
Millions of yen | ||||||||
Three months ended September 30 | ||||||||
2020 | 2021 | |||||||
| Equity underwriting and distribution | ¥ | 10,539 | ¥ | 10,276 | ||||
| Bond underwriting and distribution | 5,677 | 6,123 | ||||||
| Financial advisory fees | 6,724 | 13,661 | ||||||
| Other | 4,091 | 3,841 | ||||||
| Total | ¥ | 27,031 | ¥ | 33,901 | ||||
Asset management and portfolio service fees represent revenues from asset management services primarily from the Investment Management Division followed by Retail.
The following table shows the breakdown offor the six and three months ended September 30, 2020 and 2021.
Asset management and portfolio service fees
Millions of yen | ||||||||
Six months ended September 30 | ||||||||
2020 | 2021 | |||||||
| Asset management fees | ¥ | 72,836 | ¥ | 82,579 | ||||
| Administration fees | 30,208 | 39,266 | ||||||
| Custodial fees | 8,029 | 9,392 | ||||||
| Total | ¥ | 111,073 | ¥ | 131,237 | ||||
Millions of yen | ||||||||
Three months ended September 30 | ||||||||
2020 | 2021 | |||||||
| Asset management fees | ¥ | 37,598 | ¥ | 41,994 | ||||
| Administration fees | 15,684 | 20,361 | ||||||
| Custodial fees | 4,135 | 4,838 | ||||||
| Total | ¥ | 57,417 | ¥ | 67,193 | ||||
F-53
Notes to the Interim Consolidated Financial Statements—(Continued) (UNAUDITED)
The following table presents summary information regarding the key methodologies, assumptions and judgments used in recognizing revenue for each of the primary types of service provided to customers, including the nature of underlying performance obligations within each type of service and whether those performance obligations are satisfied at a point in time or over a period of time. For performance obligations recognized over time, information is also provided to explain the nature of the input or output method used to recognize revenue over time.
Type of service provided to customers | Overview of key services provided | Key revenue recognition policies, assumptions and judgments | ||
| Trade execution, clearing services and distribution of fund units | • Buying and selling of securities on behalf of customers • Distribution of fund units • Clearing of securities and derivatives on behalf of customers | • Trade execution and clearing commissions recognized at a point in time, namely trade date. • Distribution fees are recognized at a point in time when the fund units have been sold to third party investors. • Commissions recognized net of soft dollar credits provided to customers where Nomura is acting as agent in providing investment research and similar services to the customer. | ||
| Financial advisory services | • Provision of financial advice to customers in connection with a specific forecasted transaction or transactions such as mergers and acquisitions • Provision of financial advice not in connection with a specific forecasted transaction or transactions such as general corporate intelligence and similar research • Issuance of fairness opinions • Structuring complex financial instruments for customers | • Fees contingent on the success of an underlying transaction are variable consideration recognized when the underlying transaction has been completed since only at such point is it probable that a significant reversal of revenue will not occur. • Retainer and milestone fees are recognized either over the period to which they relate or are deferred until consummation of the underlying transaction depending on whether the underlying performance obligation is satisfied at a point in time or over time. • Judgment is required to make this determination with factors influencing this determination including, but not limited to, whether the fee is in connection with an engagement designed to achieve a specific transaction or outcome for the customer (such as the purchase or sale of a business), the nature and extent of benefit to be provided to the customer prior to, and in addition to such specific transaction or outcome and the fee structure for the engagement. • Retainer and milestone fees recognized over time are normally recognized on a straight-line basis over the term of the contract based on time elapsed. | ||
| Underwriting and syndication services | • Underwriting of debt, equity and other financial instruments on behalf of customers • Distributing securities on behalf of issuers • Arranging loan financing for customers • Syndicating loan financing on behalf of customer | • Underwriting and syndication revenues recognized at a point in time when the underlying transaction is complete. • Commitment fees where drawn down of the facility is deemed remote recognized on a straight-line basis over the life of the facility based on time elapsed. • Underwriting and syndication costs recognized either as a reduction of revenue or on a gross basis depending on whether Nomura is acting as principal or agent for such amounts. | ||
F-54
Notes to the Interim Consolidated Financial Statements—(Continued) (UNAUDITED)
Type of service provided to customers | Overview of key services provided | Key revenue recognition policies, assumptions and significant judgments | ||
| Asset management services | • Management of funds, investment trusts and other investment vehicles • Provision of investment advisory services • Providing custodial and administrative services to customers | • Management fees earned by Nomura in connection with managing a fund, investment trust or other vehicle generally recognized on a straight-line basis based on time elapsed. • Performance-based fees are variable consideration recognized when the performance metric has been determined since only at such point is it probable that a significant reversal of revenue will not occur. • Custodial and administrative fees recognized on a straightline basis over time based on time elapsed. |
Where revenue is recognized at a point on time, payments of fees are typically received at the same time as when the performance obligation is satisfied, or within several days or months after satisfying a performance obligation. In relation to revenue recognized over time, payments of fees are typically received every month, three months or six months.
The underlying contracts entered into by Nomura in order to provide the services described above typically do not have significant financing components within the contracts either provided to or from Nomura. If such components did exist in a contract, Nomura has made an accounting policy permitted by ASC 606 “” (“ASC 606”) not to adjust for the effects of a significant financing component where the financing is effectively for a period of one year or less. Such contracts also typically do not contain rights of return or similar features for the customer.
Revenue from Contracts with Customers
F-55
Notes to the Interim Consolidated Financial Statements—(Continued) (UNAUDITED)
Customer contract balances
When Nomura or the customer performs in accordance with the terms of a customer contract, a contract asset, customer contract receivable or contract liability is recognized in Nomura’s consolidated balance sheet.
A contract asset represents accrued revenue recognized by Nomura for completing or partially completing a performance obligation, namely a right of Nomura to receive consideration for providing the service to the customer, which is conditioned on something other than the passage of time. A customer contract receivable is an unconditional right of Nomura to receive consideration in exchange for providing the service. Both contract assets and customer contract receivables are reported inwithin Nomura’s consolidated balance sheet. A contract liability is any liability recognized in connection with a customer contract, including obligations to provide refunds and obligations to provide a service in the future for which consideration has already been received or is due to be received. Contract liabilities are reported inwithin Nomura’s consolidated balance sheet.
Receivables from Customers
Payables to Customers
The following table presents the balances of customer contract receivables and contract liabilities in scope of ASC 606. The amount of contract assets as of March 31, 2021 and September 30, 2021 was immaterial.
Millions of yen | ||||||||
March 31, 2021 | September 30, 2021 | |||||||
| Customer contract receivables | ¥ | 85,205 | ¥ | 83,424 | ||||
Contract liabilities (1) | 3,497 | 3,391 | ||||||
| (1) | Contract liabilities primarily rise from investment advisory services and recognized in connection with the term of the contract based on time elapsed. |
The balance of contract liabilities as of March 31, 2020 and 2021 were recognized as revenue for the six months ended September 30, 2020 and 2021, respectively.
Nomura recognized ¥538 million and ¥458 million of revenue from performance obligations satisfied in previous periods for the six months ended September 30, 2020 and the three months ended September 30, 2020, respectively. Nomura recognized ¥5,930 million and ¥1,817 million of revenue from performance obligations satisfied in previous periods for the six months ended September 30, 2021 and the three months ended September 30, 2021, respectively.
Transaction price allocated to the remaining performance obligations
Nomura retains significant transactions for which individual estimated contract period exceeds
one year. Transaction price allocated to the remaining performance obligations is ¥1,187 million as of March 31, 2021 and ¥1,657 million as of September 30, 2021.As permitted by ASC 606, Nomura has chosen not to disclose information about remaining performance obligations that have original expected durations of one year or less as of March 31, 2021 and September 30, 2021. These amounts are not included in the above. In addition, considerations arising from contracts with customers do not comprise any significant amount that is not included in transaction price.
Customer contract costs
As permitted by ASC 340, Nomura has elected to expense all costs to obtain customer contracts where such amounts would be otherwise expensed within one year or less. As a result, the amount of deferred costs to obtain or fulfill customer contracts as of March 31, 2021 and September 30, 2021 were not significant.
“Other Assets and Deferred Costs”
F-56
Notes to the Interim Consolidated Financial Statements—(Continued) (UNAUDITED)
5. Collateralized transactions:
Nomura enters into collateralized transactions, including reverse repurchase agreements, repurchase agreements, securities borrowing transactions, securities lending transactions, other secured borrowings and similar transactions mainly to meet clients’ needs, finance trading inventory positions and obtain securities for settlements.
Reverse repurchase agreements, repurchase agreements, securities borrowing transactions and securities lending transactions are typically documented under industry standard master netting agreements which reduce Nomura’s credit exposure to counterparties as they permit the
close-out
and offset of transactions and collateral amounts in the event of default of the counterparty. For certain centrally-cleared reverse repurchase and repurchase agreements, the clearing or membership agreements entered into by Nomura provide similar rights to Nomura in the event of default of the relevant central clearing counterparty. In order to support the enforceability of theclose-out
and offsetting rights within these agreements, Nomura generally seeks to obtain an external legal opinion.For certain types of counterparty and in certain jurisdictions, Nomura may enter into reverse repurchase agreements, repurchase agreements, securities borrowing and securities lending transactions which are not documented under a master netting agreement. Similarly, even when these transactions are documented under such agreements, Nomura may not have yet sought evidence, or may not be able to obtain evidence to determine with sufficient certainty that the
close-out
and offsetting rights are legally enforceable. This may be the case where relevant local laws specifically prohibit suchclose-out
and offsetting rights, or where local laws are complex, ambiguous or silent on the enforceability of such rights. This may include reverse repurchase agreements, repurchase agreements, securities borrowing and securities lending transactions executed with certain foreign governments, agencies, municipalities, central clearing counterparties, agent banks and pension funds.Nomura considers the enforceability of a master netting agreement in determining how credit risk arising from transactions with a specific counterparty is hedged, how counterparty credit exposures are calculated and applied to credit limits and the extent and nature of collateral requirements from the counterparty.
In all of these transactions, Nomura either receives or provides collateral, including Japanese and
non-Japanese
government, agency, mortgage-backed, bank and corporate debt securities and equities. In most cases, Nomura is permitted to use the securities received to enter into repurchase agreements, enter into securities lending transactions or to cover short positions with counterparties. In repurchase and reverse repurchase agreements, the value of collateral typically exceeds the amount of cash transferred. Collateral is generally in the form of securities. Securities borrowing transactions generally require Nomura to provide the counterparty with collateral in the form of cash or other securities. For securities lending transactions, Nomura generally receives collateral in the form of cash or other securities. Nomura monitors the market value of the securities either received from or provided to the counterparty. Additional cash or securities are exchanged as necessary, to ensure that such transactions are adequately collateralized throughout the life of the transactions.Offsetting of certain collateralized transactions
Reverse repurchase agreements and repurchase agreements, securities borrowing and lending transactions with the same counterparty documented under a master netting agreement are offset in the consolidated balance sheets where the specific criteria defined by ASC
210-20
are met. These criteria include requirements around the maturity of the transactions, the underlying systems on which the collateral is settled, associated banking arrangements and the legal enforceability ofclose-out
and offsetting rights under the master netting agreement.The following tables present information about offsetting of these transactions in the consolidated balance sheets as of March 31, 2020 and September 30, 2021, together with the extent to which master netting agreements entered into with counterparties and central clearing parties permit additional offsetting in the event of counterparty default. Transactions which are not documented under a master netting agreement or are documented under a master netting agreement for which Nomura does not have sufficient evidence of enforceability are not offset in the following tables.
F-57
Notes to the Interim Consolidated Financial Statements—(Continued) (UNAUDITED)
Billions of yen | ||||||||||||||||
March 31, 2021 | ||||||||||||||||
Assets | Liabilities | |||||||||||||||
Reverse repurchase agreements | Securities borrowing transactions | Repurchase agreements | Securities lending transactions | |||||||||||||
Total gross balance (1) | ¥ | 31,568 | ¥ | 5,241 | ¥ | 34,154 | ¥ | 1,781 | ||||||||
Less: Amounts offset in the consolidated balance sheets (2) | (20,793 | ) | 0— | (20,794 | ) | 0— | ||||||||||
Total net amounts of reported on the face of the consolidated balance sheets (3) | ¥ | 10,775 | ¥ | 5,241 | ¥ | 13,360 | ¥ | 1,781 | ||||||||
Less: Additional amounts not offset in the consolidated balance sheets (4) | ||||||||||||||||
Financial instruments and non-cash collateral | (9,390 | ) | (3,211 | ) | (9,448 | ) | (1,488 | ) | ||||||||
| Cash collateral | (1 | ) | 0— | (1 | ) | 0— | ||||||||||
| Net amount | ¥ | 1,384 | ¥ | 2,030 | ¥ | 3,911 | ¥ | 293 | ||||||||
Billions of yen | ||||||||||||||||
September 30, 2021 | ||||||||||||||||
Assets | Liabilities | |||||||||||||||
Reverse repurchase agreements | Securities borrowing transactions | Repurchase agreements | Securities lending transactions | |||||||||||||
Total gross balance (1) | ¥ | 31,691 | ¥ | 4,652 | ¥ | 33,881 | ¥ | 1,687 | ||||||||
Less: Amounts offset in the consolidated balance sheets (2) | (20,418 | ) | 0— | (20,418 | ) | 0— | ||||||||||
Total net amounts of reported on the face of the consolidated balance sheets (3) | ¥ | 11,273 | ¥ | 4,652 | ¥ | 13,463 | ¥ | 1,687 | ||||||||
Less: Additional amounts not offset in the consolidated balance sheets (4) | ||||||||||||||||
Financial instruments and non-cash collateral | (9,592 | ) | (3,148 | ) | (9,405 | ) | (1,426 | ) | ||||||||
| Cash collateral | (5 | ) | 0— | (2 | ) | 0— | ||||||||||
| Net amount | ¥ | 1,676 | ¥ | 1,504 | ¥ | 4,056 | ¥ | 261 | ||||||||
| (1) | Includes all recognized balances irrespective of whether they are transacted under a master netting agreement or whether Nomura has obtained sufficient evidence of enforceability of the master netting agreement. Amounts include transactions carried at fair value through election of the fair value option. As of March 31, 2021, the gross balance of reverse repurchase agreements and repurchase agreements which were not transacted under master netting agreements or are documented under master netting agreements for which Nomura has not yet obtained sufficient evidence of enforceability was ¥480 billion and ¥2,653 billion, respectively. As of March 31, 2021, the gross balance of securities borrowing transactions and securities lending transactions which were not transacted under master netting agreements or are documented under master netting agreements for which Nomura has not yet obtained sufficient evidence of enforceability was ¥1,947 billion and ¥213 billion, respectively. As of September 30, 202 1 , the gross balance of reverse repurchase agreements and repurchase agreements which were not transacted under master netting agreements or are documented under master netting agreements for which Nomura has not yet obtained sufficient evidence of enforceability was ¥311 billion and ¥2,316 billion, respectively. As of September 30, 2021, the gross balance of securities borrowing transactions and securities lending transactions which were not transacted under master netting agreements or are documented under master netting agreements for which Nomura has not yet obtained sufficient evidence of enforceability was ¥1,407 billion and ¥191 billion, respectively. |
| (2) | Represents amounts offset through counterparty netting under master netting and similar agreements for which Nomura has obtained sufficient evidence of enforceability in accordance with ASC 210-20. Amounts offset include transactions carried at fair value through election of the fair value option. |
F-58
Notes to the Interim Consolidated Financial Statements—(Continued) (UNAUDITED)
| (3) | Reverse repurchase agreements and securities borrowing transactions are reported within Collateralized agreements—Securities purchased under agreements to resell Collateralized agreements—Securities borrowed Collateralized financing—Securities sold under agreements to repurchase Collateralized financing—Securities loaned Other liabilities |
| (4) | Represents amounts which are not permitted to be offset on the face of the balance sheet in accordance with ASC 210-20 but which provide Nomura with the right of offset in the event of counterparty default. Amounts relating to agreements where Nomura has not yet obtained sufficient evidence of enforceability of such offsetting rights are excluded. |
Maturity analysis of repurchase agreements and securities lending transactions
The following table presents an analysis of the total carrying value of liabilities recognized in the consolidated balance sheets for repurchase agreements and securities lending transactions by remaining contractual maturity of the agreement as of March 31, 2021 and September 30, 2021. Amounts reported are shown prior to counterparty netting in accordance with ASC
210-20.
Billions of yen | ||||||||||||||||||||||||
March 31, 2021 | ||||||||||||||||||||||||
Overnight and open (1) | Up to 30 days | 30 – 90 days | 90 days – 1 year | Greater than 1 year | Total | |||||||||||||||||||
| Repurchase agreements | ¥ | 13,837 | ¥ | 16,452 | ¥ | 1,991 | ¥ | 1,590 | ¥ | 284 | ¥ | 34,154 | ||||||||||||
| Securities lending transactions | 872 | 351 | 291 | 266 | 1 | 1,781 | ||||||||||||||||||
Total gross recognized liabilities (2) | ¥ | 14,709 | ¥ | 16,803 | ¥ | 2,282 | ¥ | 1,856 | ¥ | 285 | ¥ | 35,935 | ||||||||||||
Billions of yen | ||||||||||||||||||||||||
September 30, 2021 | ||||||||||||||||||||||||
Overnight and open (1) | Up to 30 days | 30 – 90 days | 90 days – 1 year | Greater than 1 year | Total | |||||||||||||||||||
| Repurchase agreements | ¥ | 13,432 | ¥ | 16,648 | ¥ | 1,966 | ¥ | 1,448 | ¥ | 387 | ¥ | 33,881 | ||||||||||||
| Securities lending transactions | 971 | 259 | 159 | 280 | 18 | 1,687 | ||||||||||||||||||
Total gross recognized liabilities (2) | ¥ | 14,403 | ¥ | 16,907 | ¥ | 2,125 | ¥ | 1,728 | ¥ | 405 | ¥ | 35,568 | ||||||||||||
| (1) | Open transactions do not have an explicit contractual maturity date and are terminable on demand by Nomura or the counterparty. |
| (2) | Repurchase agreements and securities lending transactions are reported within Collateralized financing—Securities sold under agreements to repurchase Collateralized financing—Securities loaned Other liabilities |
F-59
Notes to the Interim Consolidated Financial Statements—(Continued) (UNAUDITED)
Securities transferred in repurchase agreements and securities lending transactions
The following table presents an analysis of the total carrying value of liabilities recognized in the consolidated balance sheets for repurchase agreements and securities lending transactions by class of securities transferred by Nomura to counterparties as of March 31, 2021 and September 30, 2021. Amounts reported are shown prior to counterparty netting in accordance with ASC
210-20.
Billions of yen | ||||||||||||
March 31, 2021 | ||||||||||||
Repurchase agreements | Securities lending transactions | Total | ||||||||||
| Equities and convertible securities | ¥ | 724 | ¥ | 1,600 | ¥ | 2,324 | ||||||
| Japanese government, agency and municipal securities | 1,168 | 0 | 1,168 | |||||||||
| Foreign government, agency and municipal securities | 27,531 | 8 | 27,539 | |||||||||
| Bank and corporate debt securities | 1,926 | 117 | 2,043 | |||||||||
| Commercial mortgage-backed securities (“CMBS”) | 6 | 0— | 6 | |||||||||
Residential mortgage-backed securities (“RMBS”) (1) | 2,532 | 0— | 2,532 | |||||||||
| Collateralized debt obligations (“CDOs”) and other | 223 | 0— | 223 | |||||||||
| Investment trust funds and other | 44 | 56 | 100 | |||||||||
Total gross recognized liabilities (2) | �� | ¥ | 34,154 | ¥ | 1,781 | ¥ | 35,935 | |||||
Billions of yen | ||||||||||||
September 30, 2021 | ||||||||||||
Repurchase agreements | Securities lending transactions | Total | ||||||||||
| Equities and convertible securities | ¥ | 429 | ¥ | 1,466 | ¥ | 1,895 | ||||||
| Japanese government, agency and municipal securities | 895 | 0 | 895 | |||||||||
| Foreign government, agency and municipal securities | 28,204 | 27 | 28,231 | |||||||||
| Bank and corporate debt securities | 2,092 | 125 | 2,217 | |||||||||
| Commercial mortgage-backed securities (“CMBS”) | 2 | 0— | 2 | |||||||||
Residential mortgage-backed securities (“RMBS”) (1) | 2,069 | 0— | 2,069 | |||||||||
| Collateralized debt obligations (“CDOs”) and other | 148 | 0— | 148 | |||||||||
| Investment trust funds and other | 42 | 69 | 111 | |||||||||
Total gross recognized liabilities (2) | ¥ | 33,881 | ¥ | 1,687 | ¥ | 35,568 | ||||||
| (1) | Includes ¥2,170 billion as of March 31, 2021 and ¥1,717 billion as of September 30, 2021 of U.S. government sponsored agency mortgage pass-through securities and collateralized mortgage obligations . |
| (2) | Repurchase agreements and securities lending transactions are reported within Collateralized financing—Securities sold under agreements to repurchase Collateralized financing—Securities loaned Other liabilities |
Collateral received by Nomura
The following table presents the fair value of securities received as collateral, securities borrowed with collateral and securities borrowed without collateral, which Nomura is permitted to sell or repledge, and the portion that has been sold or repledged as of March 31, 2021 and September 30, 2021.
F-60
Notes to the Interim Consolidated Financial Statements—(Continued) (UNAUDITED)
Billions of yen | ||||||||
March 31, 2021 | September 30, 2021 | |||||||
| The fair value of securities received as collateral, securities borrowed as collateral and securities borrowed without collateral where Nomura is permitted by contract or custom to sell or repledge the securities | ¥ | 50,466 | ¥ | 54,613 | ||||
The portion of the above that has been sold (reported within Trading liabilities | 38,342 | 36,493 | ||||||
Collateral pledged by Nomura
Nomura pledges firm-owned securities to collateralize repurchase transactions, other secured financings and derivative transactions. Pledged securities that can be sold or repledged by the transferee, including Gensaki Repo transactions, are reported in parentheses aswithinandin the consolidated balance sheets.
Securities pledged as collateral
Trading assets
Non-trading
debt securitiesThe following table presents the carrying amounts of financial assets recognized in the consolidated balance sheets which have been pledged as collateral, primarily to stock exchanges and clearing organizations, without allowing the secured party the right to sell or repledge them by type of asset as of March 31, 2021 and September 30, 2021.
Millions of yen | ||||||||
March 31, 2021 | September 30, 2021 | |||||||
| Trading assets: | ||||||||
| Equities and convertible securities | ¥ | 239,393 | ¥ | 396,002 | ||||
| Government and government agency securities | 1,064,164 | 1,044,019 | ||||||
| Bank and corporate debt securities | 32,262 | 45,649 | ||||||
| Residential mortgage-backed securities (“RMBS”) | 1,790,395 | 1,386,562 | ||||||
Collateralized debt obligations (“CDOs”) and other (1) | 32,081 | 10,394 | ||||||
| Investment trust funds and other | 43,805 | 34,991 | ||||||
| ¥ | 3,202,100 | ¥ | 2,917,617 | |||||
Non-trading debt securities | ¥ | 115,659 | ¥ | 130,423 | ||||
| Investments in and advances to affiliated companies | ¥ | 4,136 | ¥ | 1,274 | ||||
| (1) | Includes CLOs and ABS such as those secured on credit card loans, auto loans and student loans. |
The following table presents the carrying amount of financial and
non-financial
assets recognized in the consolidated balance sheets, other than those disclosed above, which are subject to lien as of March 31, 2021 and September 30, 2021.Millions of yen | ||||||||
March 31, 2021 | September 30, 2021 | |||||||
| Loans and receivables | ¥ | 114,051 | ¥ | 202,436 | ||||
| Trading assets and private equity and debt | 1,344,361 | 1,428,598 | ||||||
| Office buildings, land, equipment and facilities | 5,076 | 4,962 | ||||||
Non-trading debt securities | 1,047 | 204 | ||||||
| Other | 5,823 | 450 | ||||||
| ¥ | 1,470,358 | ¥ | 1,636,650 | |||||
Assets in the above table were primarily pledged for secured borrowings, including other secured borrowings, collateralized borrowings of consolidated VIEs, trading balances of secured borrowings, and derivative transactions.
F-61
Notes to the Interim Consolidated Financial Statements—(Continued) (UNAUDITED)
6. Securitizations and Variable Interest Entities:
Securitizations
Nomura utilizes special purpose entities (“SPEs”) to securitize commercial and residential mortgage loans, government agency and corporate securities and other types of financial assets. Those SPEs are incorporated as stock companies, Tokumei kumiai (silent partnerships), Cayman special purpose companies (“SPCs”) or trust accounts. Nomura’s involvement with SPEs includes structuring SPEs, underwriting, distributing and selling debt instruments and beneficial interests issued by SPEs to investors. Nomura accounts for the transfer of financial assets in accordance with ASC 860. This statement requires that Nomura accounts for the transfer of financial assets as a sale when Nomura relinquishes control over the assets. ASC 860 deems control to be relinquished when the following conditions are met: (a) the assets have been isolated from the transferor (even in bankruptcy or other receivership), (b) the transferee has the right to pledge or exchange the assets received, or if the transferee is an entity whose sole purpose is to engage in securitization or asset-backed financing activities, the holders of its beneficial interests have the right to pledge or exchange the beneficial interests, and (c) the transferor has not maintained effective control over the transferred assets. Nomura may retain an interest in the financial assets, including residual interests in the SPEs. Any such interests are accounted for at fair value and reported withinin Nomura’s consolidated balance sheets, with the change in fair value reported within—. Fair value for retained interests in securitized financial assets is determined by using observable prices; or in cases where observable prices are not available for certain retained interests, Nomura estimates fair value based on the present value of expected future cash flows using its best estimates of the key assumptions, including forecasted credit losses, prepayment rates, forward yield curves and discount rates commensurate with the risks involved. Nomura may also enter into derivative transactions in relation to the assets transferred to an SPE.
Trading assets
Revenue
Net gain on trading
As noted above, Nomura may have continuing involvement with SPEs to which Nomura transferred assets. For the six and three months ended September 30, 2020, Nomura received cash proceeds from SPEs in new securitizations of ¥184 billion and ¥61 billion, respectively, and the associated gain on sale was ¥11 billion and ¥8 billion, respectively. For the six and three months ended September 30, 2021, Nomura received cash proceeds from SPEs in new securitizations of ¥196 billion
and
¥141 billion, respectively, and the associated gain on sale was ¥9 billion and ¥2 billion, respectively. For the six and three months ended September 30, 2020, Nomura received debt securities issued by these SPEs with an initial fair value of ¥1,270 billion and ¥744 billion, respectively, and cash inflows from third parties on the sale of those debt securities of ¥1,208 billion and ¥723 billion, respectively. For the six and three months ended September 30, 2021, Nomura received debt securities issued by these SPEs with an initial fair value of ¥1,171 billion and ¥489 billion, respectively, and cash inflows from third parties on the sale of those debt securities of ¥1,100 billion and ¥519 billion, respectively. The cumulative balance of financial assets transferred to SPEs with which Nomura has continuing involvement was ¥5,323 billion and ¥5,445 billion as of March 31, 2021 and September 30, 2021, respectively. Nomura’s retained interests were ¥160 billion and ¥126 billion, as of March 31, 2021 and September 30, 2021, respectively. For the six and three months ended September 30, 2020, Nomura received cash flows of ¥10 billion and ¥5 billion, respectively, from the SPEs on the retained interests held in the SPEs. For the six and three months ended September 30, 2021, Nomura received cash flows of ¥19 billion and ¥10 billion, respectively, from the SPEs on the retained interests held in the SPEs.Nomura did not provide financial support to SPEs beyond its contractual obligations as of March 31, 2021 and September 30, 2021.
F-62
Notes to the Interim Consolidated Financial Statements—(Continued) (UNAUDITED)
The following tables present the fair value of retained interests which Nomura has continuing involvement in SPEs and their classification in the fair value hierarchy, categorized by the type of transferred assets.
Billions of yen | ||||||||||||||||||||||||
March 31, 2021 | ||||||||||||||||||||||||
Level 1 | Level 2 | Level 3 | Total | Investment grade | Other | |||||||||||||||||||
| Government, agency and municipal securities | ¥ | 0— | ¥ | 154 | ¥ | 0— | ¥ | 154 | ¥ | 154 | ¥ | 0— | ||||||||||||
| Bank and corporate debt securities | 0— | 0— | 0— | 0— | 0— | 0— | ||||||||||||||||||
| CMBS and RMBS | 0— | 0— | 6 | 6 | 0 | 6 | ||||||||||||||||||
| Total | ¥ | 0— | ¥ | 154 | ¥ | 6 | ¥ | 160 | ¥ | 154 | ¥ | 6 | ||||||||||||
Billions of yen | ||||||||||||||||||||||||
September 30, 2021 | ||||||||||||||||||||||||
Level 1 | Level 2 | Level 3 | Total | Investment grade | Other | |||||||||||||||||||
| Government, agency and municipal securities | ¥ | 0— | ¥ | 118 | ¥ | 0— | ¥ | 118 | ¥ | 118 | ¥ | 0— | ||||||||||||
| Bank and corporate debt securities | 0— | 0— | 0— | 0— | 0— | 0— | ||||||||||||||||||
| CMBS and RMBS | 0— | 0— | 8 | 8 | 2 | 6 | ||||||||||||||||||
| Total | ¥ | 0— | ¥ | 118 | ¥ | 8 | ¥ | 126 | ¥ | 120 | ¥ | 6 | ||||||||||||
As of September 30, 2021, predominantly all of the retained interests held by Nomura were valued using observable prices. The initial fair value of these retained interests are mostly level 2 in the fair value hierarchy
.
The following table presents the type and carrying value of financial assets included withinandwhich have been transferred to SPEs but which do not meet the criteria for derecognition under ASC 860. These transfers are accounted for as secured financing transactions and generally reported withinThe assets are pledged as collateral of the associated liabilities and cannot be removed unilaterally by Nomura and the liabilities are
Trading assets
Loans receivable
Long-term borrowings.
non-recourse
to Nomura.Billions of yen | ||||||||
March 31, 2021 | September 30, 2021 | |||||||
| Assets | ||||||||
| Trading assets | ||||||||
| Foreign government, agency and municipal securities | ¥ | 0— | ¥ | 7 | ||||
| Loans for trading purposes | 106 | 9 | ||||||
| Loans receivable | 0— | 157 | ||||||
| Total | ¥ | 106 | ¥ | 173 | ||||
| Liabilities | ||||||||
| Long-term borrowings | ¥ | 106 | ¥ | 173 | ||||
F-63
Notes to the Interim Consolidated Financial Statements—(Continued) (UNAUDITED)
Variable Interest Entities
In the normal course of business, Nomura acts as a transferor of financial assets to VIEs, and underwriter, distributor, and seller of repackaged financial instruments issued by VIEs in connection with its securitization and equity derivative activities. Nomura retains, purchases and sells variable interests in VIEs in connection with its market-making, investing and structuring activities.
If Nomura has an interest in a VIE that provides Nomura with control over the most significant activities of the VIE and the right to receive benefits or the obligation to absorb losses that could be significant to the VIE, Nomura is the primary beneficiary of the VIE and must consolidate the entity, provided that Nomura does not meet separate tests confirming that it is acting as a fiduciary for other interest holders. Nomura’s consolidated VIEs include those that were created to market structured securities to investors by repackaging corporate convertible securities, mortgages and mortgage-backed securities. Certain VIEs used in connection with Nomura’s aircraft leasing business as well as other purposes are consolidated. Nomura also consolidates certain investment funds, which are VIEs, and for which Nomura is the primary beneficiary.
The power to make the most significant decisions may take a number of different forms in different types of VIEs. For transactions such as securitizations, investment funds, and CDOs, Nomura considers collateral management and servicing to represent the power to make the most significant decisions. Accordingly, Nomura does not consolidate such types of VIEs for which it does not act as collateral manager or servicer unless Nomura has the right to replace the collateral manager or servicer or to require liquidation of the entity.
For many transactions, such as where VIEs are used for
re-securitizations
of residential mortgage-backed securities, there are no significant economic decisions made on an ongoing basis and no single investor has the unilateral ability to liquidate the VIE. In these cases, Nomura focuses its analysis on decisions made prior to the initial closing of the transaction, and considers factors such as the nature of the underlying assets held by the VIE, the involvement of third party investors in the design of the VIE, the size of initial third party investment and the amount and level of any subordination of beneficial interests issued by the VIE which will be held by Nomura and third party investors. Nomura has sponsored numerousre-securitization
transactions and in many cases has determined that it is not the primary beneficiary on the basis that control over the most significant decisions relating to these entities are shared with third party investors. In some cases, however, Nomura has consolidated such VIEs, for example, where it was determined that third party investors were not involved in the design of the VIEs, including where the size of third party investment was not significant at inception of the transaction.F-64
Notes to the Interim Consolidated Financial Statements—(Continued) (UNAUDITED)
The following table presents the classification of consolidated VIEs’ assets and liabilities in these consolidated financial statements. Most of these assets and liabilities are related to consolidated SPEs which securitize corporate convertible securities, mortgages and mortgage-backed securities. The assets of a consolidated VIE may only be used to settle obligations of that VIE. Creditors do not typically have any recourse to Nomura beyond the assets held in the VIEs.
Billions of yen | ||||||||
March 31, 2021 | September 30, 2021 | |||||||
| Consolidated VIE assets | ||||||||
| Cash and cash equivalents | ¥ | 13 | ¥ | 9 | ||||
| Trading assets | ||||||||
| Equities | 524 | 584 | ||||||
| Debt securities | 414 | 462 | ||||||
| CMBS and RMBS | 20 | 20 | ||||||
| Investment trust funds and other | 4 | 0— | ||||||
| Derivatives | 1 | 1 | ||||||
| Private equity and debt investments | 21 | 21 | ||||||
| Office buildings, land, equipment and facilities | 51 | 56 | ||||||
| Other | 26 | 163 | ||||||
| Total | ¥ | 1,074 | ¥ | 1,316 | ||||
| Consolidated VIE liabilities | ||||||||
| Trading liabilities | ||||||||
| Derivatives | ¥ | 2 | ¥ | 2 | ||||
| Borrowings | ||||||||
| Short-term borrowings | 74 | 122 | ||||||
| Long-term borrowings | 763 | 808 | ||||||
| Other | 2 | 2 | ||||||
| Total | ¥ | 841 | ¥ | 934 | ||||
Nomura continuously reassesses its initial evaluation of whether it is the primary beneficiary of a VIE based on current facts and circumstances as long as it has any continuing involvement with the VIE. This determination is based upon an analysis of the design of the VIE, including the VIE’s structure and activities, the power to make significant economic decisions held by Nomura and by other parties, and the variable interests owned by Nomura and other parties.
Nomura also holds variable interests in VIEs where Nomura is not the primary beneficiary. Nomura’s variable interests in such VIEs include senior and subordinated debt, residual interests, and equity interests associated with commercial and residential mortgage-backed and other asset-backed securitizations and structured financings, equity interests in VIEs which were formed primarily to acquire high yield leveraged loans and other lower investment grade debt obligations, residual interests in operating leases for aircraft held by VIEs, and loans and investments in VIEs that acquire operating businesses.
F-65
Notes to the Interim Consolidated Financial Statements—(Continued) (UNAUDITED)
The following tables present the carrying amount of variable interests of unconsolidated VIEs and maximum exposure to loss associated with these variable interests. Maximum exposure to loss does not reflect Nomura’s estimate of the actual losses that could result from adverse changes, nor does it reflect the economic hedges Nomura enters into to reduce its exposure. The risks associated with VIEs in which Nomura is involved are limited to the amount recorded in the consolidated balance sheets and the amount of commitments and financial guarantees.
Billions of yen | ||||||||||||
March 31, 2021 | ||||||||||||
Carrying amount of variable interests | Maximum exposure to loss to unconsolidated VIEs | |||||||||||
Assets | Liabilities | |||||||||||
| Trading assets and liabilities | ||||||||||||
| Equities | ¥ | 30 | ¥ | — | ¥ | 30 | ||||||
| Debt securities | 60 | — | 60 | |||||||||
| CMBS and RMBS | 2,362 | — | 2,362 | |||||||||
| Investment trust funds and other | 195 | — | 195 | |||||||||
| Private equity and debt investments | 3 | — | 3 | |||||||||
| Loans | 556 | — | 556 | |||||||||
| Other | 19 | — | 19 | |||||||||
| Commitments to extend credit and other guarantees | — | — | 110 | |||||||||
| Total | ¥ | 3,225 | ¥ | — | ¥ | 3,335 | ||||||
Billions of yen | ||||||||||||
September 30, 2021 | ||||||||||||
Carrying amount of variable interests | Maximum exposure to loss to unconsolidated VIEs | |||||||||||
Assets | Liabilities | |||||||||||
| Trading assets and liabilities | ||||||||||||
| Equities | ¥ | 37 | ¥ | 0— | ¥ | 37 | ||||||
| Debt securities | 50 | 0— | 50 | |||||||||
| CMBS and RMBS | 2,015 | 0— | 2,015 | |||||||||
| Investment trust funds and other | 149 | 0— | 149 | |||||||||
| Private equity and debt investments | 15 | 0— | 15 | |||||||||
| Loans | 721 | 0— | 721 | |||||||||
| Other | 18 | 0— | 18 | |||||||||
| Commitments to extend credit and other guarantees | 0— | 0— | 111 | |||||||||
| Total | ¥ | 3,005 | ¥ | 0— | ¥ | 3,116 | ||||||
F-66
Notes to the Interim Consolidated Financial Statements—(Continued) (UNAUDITED)
7. Financing receivables:
In the normal course of business, Nomura extends financing to clients primarily in the form of loan receivables, loan commitments and collateralized agreements such as reverse repurchase agreements and securities borrowing transactions. These financing receivables are recognized as assets on Nomura’s consolidated balance sheets at fair value or on amortized cost basis and provide a contractual right to receive money either on demand or on future fixed or determinable dates.
The carrying value of financing receivables measured on an amortized cost basis as of September 30, 2021 is adjusted for an allowance for current expected credit losses (“CECL”) defined by ASC 326 “” (“ASC 326”). Allowances for CECL against recognized financial instruments are reported in the consolidated balance sheets within
Financial Instruments—Credit Losses
Allowance for credit losses.
Collateralized agreements
Collateralized agreements consist of reverse repurchase agreements reported asand securities borrowing transactions reported asin the consolidated balance sheets, including those executed under Gensaki Repo agreements. Reverse repurchase agreements and securities borrowing transactions principally involve the buying of government and government agency securities from customers under agreements that also require Nomura to resell these securities to those customers, or borrowing these securities with cash and
Securities purchased under agreements to resell
Securities borrowed
non-cash
collateral. Nomura monitors the value of the underlying securities on a daily basis to the related receivables, including accrued interest, and requests or returns additional collateral when appropriate. Except for those where we apply fair value options, reverse repurchase agreements are generally recognized in the consolidated balance sheets at the amount for which the securities were originally acquired with applicable accrued interest. Securities borrowing transactions are generally recognized in the consolidated balance sheets at the amount of cash collateral advanced. Allowances for current expected credit losses against collateralized agreements are not significant because of our application of practical expedients permitted by ASC 326 based on the collateralization requirements and ongoing monitoring of the collateral levels and the short expected life of the financial instruments.Loans receivable
The key types of loans receivable recognized by Nomura are loans at banks, short-term secured margin loans, inter-bank money market loans and corporate loans.
Loans at banks include both retail and commercial secured and traditional unsecured loans mainly extended by Nomura Trust & Banking Co., Ltd. For both retail and commercial loans secured by real estate or securities, Nomura is exposed to the risk of a decline in the value of the underlying collateral. Loans at banks also include unsecured commercial loans provided to investment banking clients for relationship purposes. For unsecured commercial loans, Nomura is exposed to risk of default of the counterparty, although these counterparties usually have high or good credit ratings. Where loans are secured by guarantees, Nomura is also exposed to the risk of default by the guarantor.
Short-term secured margin loans are margin loans provided to clients in connection with securities brokerage business in retail and wealth management services. These loans provide funding for clients in order to purchase securities. Nomura requests initial margin in the form of acceptable collateral securities or deposits against these loans and holds the purchased securities as collateral through the life of the loans. If the value of the securities declines by more than specified amounts, Nomura can make additional margin calls in order to maintain a specified ratio of(“LTV”) ratio. These clients are required and reasonably expected to continue to replenish the amount of collateral. For these reasons, the risk to Nomura of providing these loans is limited.
loan-to-value
Inter-bank money market loans are loans to financial institutions in the inter-bank money market, where overnight and
intra-day
financings are traded through money market dealers. The risk to Nomura of making these loans is limited as only qualified financial institutions can participate in these markets and these loans are usually overnight or short-term in nature.Corporate loans are primarily commercial loans provided to corporate clients except loan at banks. Corporate loans include loans secured by real estate or securities, unsecured commercial loans provided to investment banking clients for relationship purposes. The risk to Nomura of making these loans is similar to those risks arising from commercial loans reported in loans at banks.
F-67
Notes to the Interim Consolidated Financial Statements—(Continued) (UNAUDITED)
The following tables present a summary of loans receivable reported withinorin the consolidated balance sheets by portfolio segment.
Loans receivable
Investments in and advances to affiliated companies
Millions of yen | ||||||||||||
March 31, 2021 | ||||||||||||
Carried at amortized cost | Carried at fair value (1) | Total | ||||||||||
| Loans receivable | ||||||||||||
| Loans at banks | ¥ | 605,200 | ¥ | 0— | ¥ | 605,200 | ||||||
| Short-term secured margin loans | 436,221 | 0— | 436,221 | |||||||||
| Inter-bank money market loans | 1,289 | 0— | 1,289 | |||||||||
| Corporate loans | 1,082,239 | 818,523 | 1,900,762 | |||||||||
| Total loans receivable | ¥ | 2,124,949 | ¥ | 818,523 | ¥ | 2,943,472 | ||||||
| Advances to affiliated companies | 1,000 | 0— | 1,000 | |||||||||
| Total | ¥ | 2,125,949 | ¥ | 818,523 | ¥ | 2,944,472 | ||||||
Millions of yen | ||||||||||||
September 30, 2021 | ||||||||||||
Carried at amortized cost | Carried at fair value (1) | Total | ||||||||||
| Loans receivable | ||||||||||||
| Loans at banks | ¥ | 646,698 | ¥ | 0— | ¥ | 646,698 | ||||||
| Short-term secured margin loans | 440,239 | 0— | 440,239 | |||||||||
| Inter-bank money market loans | 1,476 | 0— | 1,476 | |||||||||
| Corporate loans | 1,137,996 | 916,938 | 2,054,934 | |||||||||
| Total loans receivable | ¥ | 2,226,409 | ¥ | 916,938 | ¥ | 3,143,347 | ||||||
| Advances to affiliated companies | 1,000 | 0— | 1,000 | |||||||||
| Total | ¥ | 2,227,409 | ¥ | 916,938 | ¥ | 3,144,347 | ||||||
| (1) | Includes loans receivable and loan commitments carried at fair value through election of the fair value option. |
There were no significant purchases nor sales of loans receivable during the six months ended September 30, 2020. There were no significant reclassifications of loans receivable to trading assets during the same period.
There were no significant purchases nor sales of loans receivable during the six months ended September 30, 2021. There were no significant reclassifications of loans receivable to trading assets during the same period.
Allowance for current expected credit losses
Management has established an allowance for current expected credit losses using the CECL impairment model against the following types of financial instruments, including financing receivables, which are not measured at fair value on a recurring basis, to reflect the net amount Nomura expects to collect:
| • | Loans and written unfunded loan commitments; |
| • | Deposits; |
| • | Collateralized agreements such as reverse repos and securities borrowing transactions; |
| • | Customer contract assets and receivables; and |
| • | Other receivables including margin receivables, security deposits, default fund contributions to central clearing counterparties reinsurance and net investments in finance leases. |
Current expected credit losses for an individual or portfolio of financial instrument are measured at each Nomura reporting date based on expected credit losses over the remaining expected life of the financial instruments that consider forecast of future economic conditions in addition to information about past events and current conditions. Key macroeconomic inputs to our weighted average forecasts of three years include GDP and credit spreads.
The risk of loss is considered, even when that risk of loss is remote. While management has based its estimate of the allowance for current expected credit losses on the best information available, future adjustments to the allowance may be necessary as a result of changes in the economic environment or variances between actual results and original assumptions.
Nomura has elected to exclude accrued interest receivable from the amortized cost basis of financial instruments used to measure expected credit losses. The amount of accrued interest receivable as of September 30, 2021 was not significant.
F-68
Notes to the Interim Consolidated Financial Statements—(Continued) (UNAUDITED)
The methodology used by Nomura to determine allowances for current expected credit losses in accordance with the CECL impairment model primarily depends on the nature of the financial instrument and whether certain practical expedients permitted by ASC 326 are applied by Nomura.
Financial instruments subject to the CECL impairment model are charged off when Nomura has deemed the loan or receivable as uncollectible, namely management believes there is no reasonable expectation of collecting future contractual cash flows and all commercially reasonable means of recovering outstanding principle and interest balances have been exhausted.
The following table summarizes the methodology used for each significant type of financial instrument subject to the CECL impairment model and the key assumptions used which have impacted the measurement of current expected credit losses during the year ended September 30, 2021.
Financial instrument | Methodology to determine current expected credit losses | |
| Loans, written loan commitments and certain deposits | • Full loss rate model developed by Nomura’s Risk department • Measures expected credit losses based on probability of default (PD), Loss Given Default (LGD) and Exposure at Default (EAD) inputs. • PD inputs incorporate forward-looking scenarios used by Nomura for internal risk management and capital purposes. • Immediate reversion method used for periods beyond which reasonable and supportable forecast is not available. • For financial instruments which have defaulted or are probable of defaulting, expected credit losses measured using discounted cash flow analyses or, where the financial instrument is collateral dependent, based on any shortfall of fair value of the underlying collateral. | |
| Collateralized agreements, short-term secured margin loans and cash prime brokerage loans | • For reverse repos and short-term secured margin loans and cash prime brokerage loans where frequent margining is required and the counterparty has ability to replenish margin, as permitted by a practical expedient provided by ASC 326 expected credit losses are limited to difference between carrying value of the reverse repo or margin loan and fair value of underlying collateral. • Securities borrowing transactions typically have very short expected lives and are collateralized and therefore expected credit losses are generally determined qualitatively to be insignificant based on historical experience and consistent monitoring of collateral. | |
| Customer contract assets and receivables | • Expected credit losses typically based on ageing analysis where loss rates are applied to the carrying value based on historical experience, the current economic climate and specific information about the ability of the client to pay. | |
F-69
Notes to the Interim Consolidated Financial Statements—(Continued) (UNAUDITED)
The following table presents changes in the allowance for current expected credit losses for the six and three months ended September 30, 2020 and 2021 as determined using the CECL impairment model defined by ASC 326.
Millions of yen | ||||||||||||||||||||||||
Six months ended September 30, 2020 | ||||||||||||||||||||||||
Allowance for current expected credit losses | Allowance for receivables other than loans (2) | Total allowance for current expected credit losses | ||||||||||||||||||||||
Loans at banks | Short-term secured margin loans | Corporate loans | Subtotal | |||||||||||||||||||||
| Opening balance prior to CECL adoption | ¥ | 1,564 | ¥ | 352 | ¥ | 7,944 | ¥ | 9,860 | ¥ | 3,152 | ¥ | 13,012 | ||||||||||||
Impact of CECL adoption (1) | 232 | 0— | 1,738 | 1,970 | 2 | 1,972 | ||||||||||||||||||
| Opening balance after CECL adoption | 1,796 | 352 | 9,682 | 11,830 | 3,154 | 14,984 | ||||||||||||||||||
| Provision for credit losses | (232 | ) | 0— | (2,244 | ) | (2,476 | ) | 1,075 | (1,401 | ) | ||||||||||||||
| Charge-offs | (318 | ) | (359 | ) | 0 | (677 | ) | (1,315 | ) | (1,992 | ) | |||||||||||||
Other (4) | 0— | 7 | (225 | ) | (218 | ) | (17 | ) | (235 | ) | ||||||||||||||
| Ending balance | ¥ | 1,246 | ¥ | 0— | ¥ | 7,213 | ¥ | 8,459 | ¥ | 2,897 | ¥ | 11,356 | ||||||||||||
Millions of yen | ||||||||||||||||||||||||
Six months ended September 30, 2021 | ||||||||||||||||||||||||
Allowance for current expected credit losses | Allowance for receivables other than loans (2) | Total allowance for current expected credit losses | ||||||||||||||||||||||
Loans at banks | Short-term secured margin loans | Corporate loans | Subtotal | |||||||||||||||||||||
| Opening balance | ¥ | 1,282 | ¥ | 0— | ¥ | 47,985 | ¥ | 49,267 | ¥ | 4,517 | ¥ | 53,784 | ||||||||||||
Provision for credit losses (3) | 0— | 0— | 8,924 | 8,924 | 78 | 9,002 | ||||||||||||||||||
| Charge-offs | 0— | 0— | (17 | ) | (17 | ) | (62 | ) | (79 | ) | ||||||||||||||
Other (4) | 161 | 0— | 718 | 879 | (1,875 | ) | (996 | ) | ||||||||||||||||
| Ending balance | ¥ | 1,443 | ¥ | 0— | ¥ | 57,610 | ¥ | 59,053 | ¥ | 2,658 | ¥ | 61,711 | ||||||||||||
Millions of yen | ||||||||||||||||||||||||
Three months ended September 30, 2020 | ||||||||||||||||||||||||
Allowance for current expected credit losses | Allowance for receivables other than loans (2) | Total allowance for current expected credit losses | ||||||||||||||||||||||
Loans at banks | Short-term secured margin loans | Corporate loans | Subtotal | |||||||||||||||||||||
| Opening balance | ¥ | 1,454 | ¥ | 292 | ¥ | 7,727 | ¥ | 9,473 | ¥ | 2,881 | ¥ | 12,354 | ||||||||||||
| Provision for credit losses | 110 | 76 | (392 | ) | (206 | ) | 31 | (175 | ) | |||||||||||||||
| Charge-offs | (318 | ) | (359 | ) | 0 | (677 | ) | 7 | (670 | ) | ||||||||||||||
Other (4) | 0— | (9 | ) | (122 | ) | (131 | ) | (22 | ) | (153 | ) | |||||||||||||
| Ending balance | ¥ | 1,246 | ¥ | 0— | ¥ | 7,213 | ¥ | 8,459 | ¥ | 2,897 | ¥ | 11,356 | ||||||||||||
F-70
Millions of yen | ||||||||||||||||||||||||
Three months ended September 30, 2021 | ||||||||||||||||||||||||
Allowance for current expected credit losses | Allowance for receivables other than loans (2) | Total allowance for current expected credit losses | ||||||||||||||||||||||
Loans at banks | Short-term secured margin loans | Corporate loans | Subtotal | |||||||||||||||||||||
| Opening balance | ¥ | 1,273 | ¥ | 0— | ¥ | 57,559 | ¥ | 58,832 | ¥ | 2,587 | ¥ | 61,419 | ||||||||||||
| Provision for credit losses | 0— | 0— | (273 | ) | (273 | ) | 75 | (198 | ) | |||||||||||||||
| Charge-offs | 0— | 0— | (10 | ) | (10 | ) | (5 | ) | (15 | ) | ||||||||||||||
Other (4) | 170 | 0— | 334 | 504 | 1 | 505 | ||||||||||||||||||
| Ending balance | ¥ | 1,443 | ¥ | 0— | ¥ | 57,610 | ¥ | 59,053 | ¥ | 2,658 | ¥ | 61,711 | ||||||||||||
| (1) | The balance recognized on April 1, 2020 on adoption of ASC 326. |
| (2) | Includes collateralized agreements, customer contract assets and receivables and other receivables. |
| (3) | As of September 30, 2021, following the default of a client arising from the U.S. Prime Brokerage Event, an additional allowance for current expected credit losses of ¥9,289 million was taken on the loans with the client. |
| (4) | Includes recoveries collected and the effect of foreign exchange movements. |
Troubled debt restructurings
In the ordinary course of business, Nomura may choose to restructure a loan classified as held for investment either because of financial difficulties of the borrower, or simply as a result of market conditions or relationship reasons. A troubled debt restructuring (“TDR”) occurs when Nomura (as lender) for economic or legal reasons related to the borrower’s financial difficulties grants a concession to the borrower that Nomura would not otherwise consider.
Expected credit losses for a loan being restructured under a TDR which only involve modification of the loan’s terms (rather than receipt of assets in full or partial settlement) is typically determined using a discounted cash flow analysis. Assets received in full or partial satisfaction of a loan in a TDR are recognized at fair value.
Discussions continue with various borrowers to modify the existing contractual terms of certain loans. These modifications where the borrower is deemed to be in financial difficulty and Nomura has, or expects to, grant a financial concession would typically be accounted for and reported as a TDR.
The amounts of TDRs which occurred during the six months ended September 30, 2020 and 2021 were not significant.
F-71
Notes to the Interim Consolidated Financial Statements—(Continued) (UNAUDITED)
Nonaccrual and past due loans
Loans are placed on a nonaccrual status if interest is deemed uncollectible. Nomura policy is to define interest as being uncollectible if the borrower is determined to be in financial difficulty or an interest or principal payment on the loans is 90 days or more past due.
Where a loan is placed on a nonaccrual status, any accrued but unpaid interest receivable reversed and no further accrual of interest is permitted. Interest income is subsequent recognized when a cash payment is received from the borrower using the cash basis method.
Loans are generally only returned to an accrual status if the loan is brought contractually current, i.e. all overdue principal and interest amounts are paid. In limited circumstances, a loan which has not been brought contractually current will also be returned to an accrual status if all principal and interest amounts contractually due are reasonably assured of repayment within a reasonable period of time or there has been a sustained period of repayment performance by the borrower.
As of March 31, 2021, there were ¥204,404¥41,561 million to be recorded. The amount of loans which were 90 days past due was not significant.
million of loans which were placed on a nonaccrual status, primarily secured corporate loans. Nomura uses, as a practical expedient, the fair value of the collateral when determining the allowance for current expected credit losses, for which repayment is expected to be provided substantially through the operation or sale of the collateral. Of the corporate loans on nonaccrual status, these loans relate to the U.S. Prime Brokerage Event as of March 31, 2021 causing an increase of an allowance for current expected credit losses of
As of September 30, 2021, there were ¥57,658¥9,289 million to be recorded. The amount of loans which were 90 days past due was ¥57,708 million.
million of loans which were placed on a nonaccrual status, primarily secured corporate loans. Of the corporate loans on nonaccrual status, these loans relate to the U.S. Prime Brokerage Event as of September 30, 2021 causing an increase of an allowance for current expected credit losses of
Credit quality indicators
Nomura is exposed to credit risks deriving from a decline in the value of loans or a default caused by deterioration of creditworthiness or bankruptcy of the obligor. Nomura’s risk management framework for such credit risks is based on a risk assessment through an internal rating process, in depth
pre-financing
credit analysis of each individual loan and continuous post-financing monitoring of obligor’s creditworthiness.F-72
Notes to the Interim Consolidated Financial Statements—(Continued) (UNAUDITED)
The following tables present an analysis of each class of loans not carried at fair value using Nomura’s internal ratings or equivalent credit quality indicators applied by subsidiaries by years of origination as of March 31 and September 30, 2021.
Millions of yen | ||||||||||||||||||||||||||||||||
March 31, 2021 | ||||||||||||||||||||||||||||||||
2021 | 2020 | 2019 | 2018 | 2017 | 2016 or earlier | Revolving | Total | |||||||||||||||||||||||||
| Secured loans at banks: | ||||||||||||||||||||||||||||||||
AAA-BBB | ¥ | 54,179 | ¥ | 115,003 | ¥ | 17,106 | ¥ | 12,450 | ¥ | 4,240 | ¥ | 17,634 | ¥ | 0— | ¥ | 220,612 | ||||||||||||||||
BB-CCC | 75,680 | 115,131 | 3,864 | 2,324 | 0— | 5,484 | 0— | 202,483 | ||||||||||||||||||||||||
CC-D | 0— | 0— | 0— | 0— | 0— | 0— | 0— | 0— | ||||||||||||||||||||||||
| Others(1) | 0— | 61,185 | 0— | 0— | 0— | 0— | 0— | 61,185 | ||||||||||||||||||||||||
| Total secured loans at banks | ¥ | 129,859 | ¥ | 291,319 | ¥ | 20,970 | ¥ | 14,774 | ¥ | 4,240 | ¥ | 23,118 | ¥ | 0— | ¥ | 484,280 | ||||||||||||||||
| Unsecured loans at banks: | ||||||||||||||||||||||||||||||||
AAA-BBB | ¥ | 9,101 | ¥ | 22,955 | ¥ | 27,863 | ¥ | 17,563 | ¥ | 8,484 | ¥ | 34,719 | ¥ | 0— | ¥ | 120,685 | ||||||||||||||||
BB-CCC | 0— | 0— | 235 | 0— | 0— | 0— | 0— | 235 | ||||||||||||||||||||||||
CC-D | 0— | 0— | 0— | 0— | 0— | 0— | 0— | 0— | ||||||||||||||||||||||||
| Others(1) | 0— | 0— | 0— | 0— | 0— | 0— | 0— | 0— | ||||||||||||||||||||||||
| Total unsecured loans at banks | ¥ | 9,101 | ¥ | 22,955 | ¥ | 28,098 | ¥ | 17,563 | ¥ | 8,484 | ¥ | 34,719 | ¥ | 0— | ¥ | 120,920 | ||||||||||||||||
| Short-term secured margin loans: | ||||||||||||||||||||||||||||||||
AAA-BBB | ¥ | 0— | ¥ | 0— | ¥ | 0— | ¥ | 0— | ¥ | 0— | ¥ | 0— | ¥ | 0— | ¥ | 0— | ||||||||||||||||
BB-CCC | 0— | 0— | 0— | 0— | 0— | 0— | 0— | 0— | ||||||||||||||||||||||||
CC-D | 0— | 0— | 0— | 0— | 0— | 0— | 0— | 0— | ||||||||||||||||||||||||
| Others(1) | 170,514 | 141 | 0— | 0— | 0— | 0— | 265,566 | 436,221 | ||||||||||||||||||||||||
| Total short-term secured margin loans | ¥ | 170,514 | ¥ | 141 | ¥ | 0— | ¥ | 0— | ¥ | 0— | ¥ | 0— | ¥ | 265,566 | ¥ | 436,221 | ||||||||||||||||
| Unsecured inter-bank money market loans: | ||||||||||||||||||||||||||||||||
AAA-BBB | ¥ | 1,289 | ¥ | 0— | ¥ | 0— | ¥ | 0— | ¥ | 0— | ¥ | 0— | ¥ | 0— | ¥ | 1,289 | ||||||||||||||||
BB-CCC | 0— | 0— | 0— | 0— | 0— | 0— | 0— | 0— | ||||||||||||||||||||||||
CC-D | 0— | 0— | 0— | 0— | 0— | 0— | 0— | 0— | ||||||||||||||||||||||||
| Others(1) | 0— | 0— | 0— | 0— | 0— | 0— | 0— | 0— | ||||||||||||||||||||||||
| Total unsecured inter-bank money market loans | ¥ | 1,289 | ¥ | 0— | ¥ | 0— | ¥ | 0— | ¥ | 0— | ¥ | 0— | ¥ | 0— | ¥ | 1,289 | ||||||||||||||||
| Secured corporate loans: | ||||||||||||||||||||||||||||||||
AAA-BBB | ¥ | 33,965 | ¥ | 261,182 | ¥ | 45,880 | ¥ | 9,817 | ¥ | 6,406 | ¥ | 27,672 | ¥ | 97 | ¥ | 385,019 | ||||||||||||||||
BB-CCC | 20,093 | 102,941 | 34,435 | 29,869 | 13,067 | 17,573 | 173,178 | 391,156 | ||||||||||||||||||||||||
CC-D(2) | 197,859 | 0— | 0— | 0— | 0— | 0— | 0— | 197,859 | ||||||||||||||||||||||||
| Others(1) | 0— | 39 | 40 | 11 | 30 | 4,697 | 428 | 5,245 | ||||||||||||||||||||||||
| Total secured corporate loans | ¥ | 251,917 | ¥ | 364,162 | ¥ | 80,355 | ¥ | 39,697 | ¥ | 19,503 | ¥ | 49,942 | ¥ | 173,703 | ¥ | 979,279 | ||||||||||||||||
| Unsecured corporate loans: | ||||||||||||||||||||||||||||||||
AAA-BBB | ¥ | 0— | ¥ | 0— | ¥ | 0— | ¥ | 0— | ¥ | 0— | ¥ | 0— | ¥ | 0— | ¥ | 0— | ||||||||||||||||
BB-CCC | 84 | 0— | 450 | 0— | 0— | 0— | 0— | 534 | ||||||||||||||||||||||||
CC-D | 0— | 0— | 0— | 0— | 0— | 0— | 0— | 0— | ||||||||||||||||||||||||
| Others(1) | 1 | 191 | 8 | 97,212 | 0— | 5,014 | 0— | 102,426 | ||||||||||||||||||||||||
| Total unsecured corporate loans | ¥ | 85 | ¥ | 191 | ¥ | 458 | ¥ | 97,212 | ¥ | 0— | ¥ | 5,014 | ¥ | 0— | ¥ | 102,960 | ||||||||||||||||
| Advances to affiliated companies | ||||||||||||||||||||||||||||||||
AAA-BBB | ¥ | 1,000 | ¥ | 0— | ¥ | 0— | ¥ | 0— | ¥ | 0— | ¥ | 0— | ¥ | 0— | ¥ | 1,000 | ||||||||||||||||
BB-CCC | 0— | 0— | 0— | 0— | 0— | 0— | 0— | 0— | ||||||||||||||||||||||||
CC-D | 0— | 0— | 0— | 0— | 0— | 0— | 0— | 0— | ||||||||||||||||||||||||
| Others(1) | 0— | 0— | 0— | 0— | 0— | 0— | 0— | 0— | ||||||||||||||||||||||||
| Total advances to affiliated companies | ¥ | 1,000 | ¥ | 0— | ¥ | 0— | ¥ | 0— | ¥ | 0— | ¥ | 0— | ¥ | 0— | ¥ | 1,000 | ||||||||||||||||
| Total | ¥ | 563,765 | ¥ | 678,768 | ¥ | 129,881 | ¥ | 169,246 | ¥ | 32,227 | ¥ | 112,793 | ¥ | 439,269 | ¥ | 2,125,949 | ||||||||||||||||
| (1) | Relate to collateralized exposures where a specified ratio of LTV is maintained. |
| (2) | Includes loans of ¥197,859 million in relation to the U.S. Prime Brokerage Event. |
F-73
Millions of yen | ||||||||||||||||||||||||||||||||
September 30, 2021 | ||||||||||||||||||||||||||||||||
2021 | 2020 | 2019 | 2018 | 2017 | 2016 or earlier | Revolving | Total | |||||||||||||||||||||||||
| Secured loans at banks: | ||||||||||||||||||||||||||||||||
AAA-BBB | ¥ | 151,255 | ¥ | 58,432 | ¥ | 17,059 | ¥ | 9,465 | ¥ | 4,070 | ¥ | 15,612 | ¥ | 0— | ¥ | 255,893 | ||||||||||||||||
BB-CCC | 177,829 | 29,544 | 3,136 | 2,236 | 0— | 4,370 | 0— | 217,115 | ||||||||||||||||||||||||
CC-D | 0— | 0— | 0— | 0— | 0— | 0— | 0— | 0— | ||||||||||||||||||||||||
| Others(1) | 71,377 | 0— | 0— | 0— | 0— | 0— | 0— | 71,377 | ||||||||||||||||||||||||
| Total secured loans at banks | ¥ | 400,461 | ¥ | 87,976 | ¥ | 20,195 | ¥ | 11,701 | ¥ | 4,070 | ¥ | 19,982 | ¥ | 0— | ¥ | 544,385 | ||||||||||||||||
| Unsecured loans at banks: | ||||||||||||||||||||||||||||||||
AAA-BBB | ¥ | 15,136 | ¥ | 18,681 | ¥ | 22,350 | ¥ | 14,798 | ¥ | 4,903 | ¥ | 26,445 | ¥ | 0— | ¥ | 102,313 | ||||||||||||||||
BB-CCC | 0— | 0— | 0— | 0— | 0— | 0— | 0— | 0— | ||||||||||||||||||||||||
CC-D | 0— | 0— | 0— | 0— | 0— | 0 | 0— | 0 | ||||||||||||||||||||||||
| Others(1) | 0— | 0— | 0— | 0— | 0— | 0— | 0— | 0— | ||||||||||||||||||||||||
| Total unsecured loans at banks | ¥ | 15,136 | ¥ | 18,681 | ¥ | 22,350 | ¥ | 14,798 | ¥ | 4,903 | ¥ | 26,445 | ¥ | 0— | ¥ | 102,313 | ||||||||||||||||
| Short-term secured margin loans: | ||||||||||||||||||||||||||||||||
AAA-BBB | ¥ | 0— | ¥ | 0— | ¥ | 0— | ¥ | 0— | ¥ | 0— | ¥ | 0— | ¥ | 0— | ¥ | 0— | ||||||||||||||||
BB-CCC | 0— | 0— | 0— | 0— | 0— | 0— | 0— | 0— | ||||||||||||||||||||||||
CC-D | 0— | 0— | 0— | 0— | 0— | 0— | 0— | 0— | ||||||||||||||||||||||||
| Others(1) | 164,405 | 0— | 0— | 0— | 0— | 0— | 275,834 | 440,239 | ||||||||||||||||||||||||
| Total short-term secured margin loans | ¥ | 164,405 | ¥ | 0— | ¥ | 0— | ¥ | 0— | ¥ | 0— | ¥ | 0— | ¥ | 275,834 | ¥ | 440,239 | ||||||||||||||||
| Unsecured inter-bank money market loans: | ||||||||||||||||||||||||||||||||
AAA-BBB | ¥ | 1,476 | ¥ | 0— | ¥ | 0— | ¥ | 0— | ¥ | 0— | ¥ | 0— | ¥ | 0— | ¥ | 1,476 | ||||||||||||||||
BB-CCC | 0— | 0— | 0— | 0— | 0— | 0— | 0— | 0— | ||||||||||||||||||||||||
CC-D | 0— | 0— | 0— | 0— | 0— | 0— | 0— | 0— | ||||||||||||||||||||||||
| Others(1) | 0— | 0— | 0— | 0— | 0— | 0— | 0— | 0— | ||||||||||||||||||||||||
| Total unsecured inter-bank money market loans | ¥ | 1,476 | ¥ | 0— | ¥ | 0— | ¥ | 0— | ¥ | 0— | ¥ | 0— | ¥ | 0— | ¥ | 1,476 | ||||||||||||||||
| Secured corporate loans: | ||||||||||||||||||||||||||||||||
AAA-BBB | ¥ | 43,117 | ¥ | 205,431 | ¥ | 78,930 | ¥ | 12,067 | ¥ | 235 | ¥ | 17,958 | ¥ | 9,089 | ¥ | 366,827 | ||||||||||||||||
BB-CCC | 166,917 | 17,740 | 44,837 | 76,746 | 10,179 | 26,886 | 274,120 | 617,425 | ||||||||||||||||||||||||
CC-D(2) | 53,276 | 0— | 0— | 0— | 0— | 0— | 0— | 53,276 | ||||||||||||||||||||||||
| Others(1) | 19 | 36 | 27 | 10 | 26 | 73 | 82 | 273 | ||||||||||||||||||||||||
| Total secured corporate loans | ¥ | 263,329 | ¥ | 223,207 | ¥ | 123,794 | ¥ | 88,823 | ¥ | 10,440 | ¥ | 44,917 | ¥ | 283,291 | ¥ | 1,037,801 | ||||||||||||||||
| Unsecured corporate loans: | ||||||||||||||||||||||||||||||||
AAA-BBB | ¥ | 0— | ¥ | 0— | ¥ | 0— | ¥ | 0— | ¥ | 0— | ¥ | 0— | ¥ | 0— | ¥ | 0— | ||||||||||||||||
BB-CCC | 299 | 0— | 2,651 | 0— | 0— | 0— | 0— | 2,950 | ||||||||||||||||||||||||
CC-D | 0— | 0— | 0— | 0— | 0— | 0— | 0— | 0— | ||||||||||||||||||||||||
| Others(1) | 400 | 196 | 0— | 96,646 | 0— | 3 | 0— | 97,245 | ||||||||||||||||||||||||
| Total unsecured corporate loans | ¥ | 699 | ¥ | 196 | ¥ | 2,651 | ¥ | 96,646 | ¥ | 0— | ¥ | 3 | ¥ | 0— | ¥ | 100,195 | ||||||||||||||||
| Advances to affiliated companies | ||||||||||||||||||||||||||||||||
AAA-BBB | ¥ | 1,000 | ¥ | 0— | ¥ | 0— | ¥ | 0— | ¥ | 0— | ¥ | 0— | ¥ | 0— | ¥ | 1,000 | ||||||||||||||||
BB-CCC | 0— | 0— | 0— | 0— | 0— | 0— | 0— | 0— | ||||||||||||||||||||||||
CC-D | 0— | 0— | 0— | 0— | 0— | 0— | 0— | 0— | ||||||||||||||||||||||||
| Others(1) | 0— | 0— | 0— | 0— | 0— | 0— | 0— | 0— | ||||||||||||||||||||||||
| Total advances to affiliated companies | ¥ | 1,000 | ¥ | 0— | ¥ | 0— | ¥ | 0— | ¥ | 0— | ¥ | 0— | ¥ | 0— | ¥ | 1,000 | ||||||||||||||||
| Total | ¥ | 846,506 | ¥ | 330,060 | ¥ | 168,990 | ¥ | 211,968 | ¥ | 19,413 | ¥ | 91,347 | ¥ | 559,125 | ¥ | 2,227,409 | ||||||||||||||||
| (1) | Relate to collateralized exposures where a specified ratio of LTV is maintained. |
| (2) | Includes loans of ¥53,276 million in relation to the U.S. Prime Brokerage Event. |
F-74
Notes to the Interim Consolidated Financial Statements—(Continued) (UNAUDITED)
The following table presents a definition of each of the internal ratings used in the Nomura Group.
Rating Range | Definition | |
| AAA | Highest credit quality. An obligor or facility has extremely strong capacity to meet its financial commitments. ‘AAA range’ is the highest credit rating assigned by Nomura. Extremely low probability of default. | |
| AA | Very high credit quality category. An obligor or facility has very strong capacity to meet its financial commitments. Very low probability of default but above that of ‘AAA range.’ | |
| A | High credit quality category. An obligor or facility has strong capacity to meet its financial commitments but is somewhat more susceptible to the adverse effects of changes in circumstances and economic conditions than those in higher-rated categories. Low probability of default but higher than that of ‘AA range.’ | |
| BBB | Good credit quality category. An obligor or facility has adequate capacity to meet its financial commitments. However, adverse economic conditions or changing circumstances are more likely to lead to a weakened capacity to meet its financial commitments. Medium probability of default but higher than that of ‘A range.’ | |
| BB | Speculative credit quality category. An obligor or facility is less vulnerable in the near term than other lower-ratings. However, it faces major ongoing uncertainties and exposure to adverse business, financial, or economic conditions which could lead to the inadequate capacity to meet its financial commitments. Medium to high probability of default but higher than that of ‘BBB range.’ | |
| B | Highly speculative credit quality category. An obligor or facility is more vulnerable than those rated ‘BB range’, but the obligor currently has the capacity to meet its financial commitments. Adverse business, financial, or economic conditions will likely impair the issuer’s or obligor’s capacity or willingness to meet its financial commitments. High probability of default - more than that of ‘BB range.’ | |
| CCC | Substantial credit risk. An obligor or facility is currently vulnerable, and is dependent upon favorable business, financial, and economic conditions to meet its financial commitments. Strong probability of default – more than that of ‘B range.’ | |
| CC | An obligor or facility is currently highly vulnerable to nonpayment (default category). | |
| C | An obligor or facility is currently extremely vulnerable to nonpayment (default category). | |
| D | Failure of an obligor to make payments in full and on time of any financial obligations, markedly disadvantageous modification to a contractual term compared with the existing obligation, bankruptcy filings, administration, receivership, liquidation or other winding-up or cessation of business of an obligor or other similar situations. | |
Nomura reviews internal ratings at least once a year by using available credit information of obligors including financial statements and other information. Internal ratings are also reviewed more frequently for high-risk obligors or problematic exposures and any significant credit event of obligors will trigger an immediate credit review process.
F-75
Notes to the Interim Consolidated Financial Statements—(Continued) (UNAUDITED)
8. Leases:
Nomura as lessor
Nomura leases office buildings and aircrafts in Japan and overseas either as head lessor or through subleases. These leases and subleases are primarily classified as operating leases. The related assets are stated at cost, net of accumulated depreciation, except for land, which is stated at cost in the consolidated balance sheets and reported within
Other assets—Office buildings, land, equipment and facilities.
The following table presents the types of assets which Nomura leases under operating leases as of March 31, 2021 and September 30, 2021.
Millions of yen | ||||||||||||||||||||||||
March 31, 2021 | September 30, 2021 | |||||||||||||||||||||||
Cost | Accumulated depreciation | Net carrying amount | Cost | Accumulated depreciation | Net carrying amount | |||||||||||||||||||
Real estate (1) | ¥ | 354 | ¥ | (288 | ) | ¥ | 66 | ¥ | 354 | ¥ | (290 | ) | ¥ | 64 | ||||||||||
| Aircraft | 39,736 | (1,382 | ) | 38,354 | 58,622 | (2,340 | ) | 56,282 | ||||||||||||||||
| Total | ¥ | 40,090 | ¥ | (1,670 | ) | ¥ | 38,420 | ¥ | 58,976 | ¥ | (2,630 | ) | ¥ | 56,346 | ||||||||||
| (1) | Cost, accumulated depreciation and net carrying amounts include amounts relating to real estate utilized by Nomura. |
Nomura recognized lease income of ¥726 million and ¥401 million for the six and three months ended September 30, 2020, respectively, and ¥1,927 million and ¥1,090 million for the six and three months ended September 30, 2021, respectively. These are included in the consolidated statements of income within
Revenue—Other.
The following table presents an analysis of future undiscounted lease payments to be received in connection with noncancellable operating leases entered into by Nomura as lessor over the remaining lease term as of September 30, 2021. Amounts in connection with finance leases were not significant.
Millions of yen | ||||
September 30, 2021 | ||||
Minimum lease payments to be received | ||||
Years of receipt | ||||
| Less than 1 year | ¥ | 4,411 | ||
| 1 to 2 years | 4,352 | |||
| 2 to 3 years | 4,352 | |||
| 3 to 4 years | 4,352 | |||
| 4 to 5 years | 4,352 | |||
| More than 5 years | 27,161 | |||
Total | ¥ | 48,980 | ||
F-76
Notes to the Interim Consolidated Financial Statements—(Continued) (UNAUDITED)
9. Business combinations:
On April 1, 2020, Nomura acquired 100% of Greentech Capital, LLC (“Greentech”), a leading M&A advisory boutique in sustainable technology and infrastructure in the United States. The acquisition of Greentech comprises an initial cash payment and additional contingent payments based on future performance of the company. The transaction has been accounted for as a business combination under ASC 805 “Business combinations” and consideration for the purchase as used to determine goodwill was ¥12,389 million which includes the estimated fair value of contingent payments accounted for as contingent consideration on acquisition date. Changes in the fair value of contingent consideration are recognized in the consolidated statements of income until the contingency is resolved. Contingent payments linked to future employment of employees of Greentech are recognized in the consolidated statements of income as compensation expense over the relevant service period and when payment of those amounts becomes probable. The operating results and cash flows of Greentech have been reflected to Nomura’s consolidated financial statements since April 1, 2020. The assets acquired and liabilities assumed as of the acquisition date were not material to Nomura’s consolidated balance sheet.
F-77
Notes to the Interim Consolidated Financial Statements—(Continued) (UNAUDITED)
10. Other assets—Other / Other liabilities:
The following table presents components ofin the consolidated balance sheets as of March 31, 2021 and as of September 30, 2021.
Other assets—Other and Other liabilities
Millions of yen | ||||||||
March 31, 2021 | September 30, 2021 | |||||||
| Other assets—Other: | ||||||||
| Securities received as collateral | ¥ | 399,975 | ¥ | 171,503 | ||||
Goodwill and other intangible assets (1) | 29,040 | 28,407 | ||||||
| Deferred tax assets | 30,433 | 28,615 | ||||||
Investments in equity securities for other than operating purposes (2) | 270,246 | 259,995 | ||||||
| Prepaid expenses | 18,741 | 19,324 | ||||||
| Other | 300,997 | 276,018 | ||||||
| Total | ¥ | 1,049,432 | ¥ | 783,862 | ||||
| Other liabilities: | ||||||||
| Obligation to return securities received as collateral | ¥ | 399,975 | ¥ | 171,503 | ||||
| Accrued income taxes | 60,275 | 15,987 | ||||||
| Other accrued expenses | 424,961 | 392,391 | ||||||
Other (3) | 353,956 | 348,073 | ||||||
| Total | ¥ | 1,239,167 | ¥ | 927,954 | ||||
| (1) | For the year ended March 31, 2021, Nomura recognized goodwill attributable to the Wholesale segment as a result of acquiring 100% of the ownership interests in Greentech Capital, LLC. See Note.9 “ Business combination“ |
| (2) | Includes equity securities without readily determinable fair value of ¥65,365 million as of March 31, 2021 and as of September 30, 2021 respectively. |
| (3) | Includes operating lease liabilities. |
F-78
Notes to the Interim Consolidated Financial Statements—(Continued) (UNAUDITED)
11. Earnings per share:
A reconciliation of the amounts and the numbers used in the calculation of net income attributable to NHI shareholders per share (basic and diluted) is as follows:
Millions of yen except per share data presented in yen | ||||||||
Six months ended September 30 | ||||||||
2020 | 2021 | |||||||
| Basic— | ||||||||
| Net income attributable to NHI shareholders | ¥ | 210,158 | ¥ | 51,700 | ||||
| Weighted average number of shares outstanding | 3,051,543,718 | 3,085,218,332 | ||||||
| Net income attributable to NHI shareholders per share | ¥ | 68.87 | ¥ | 16.76 | ||||
| Diluted— | ||||||||
| Net income attributable to NHI shareholders | ¥ | 210,117 | ¥ | 51,645 | ||||
| Weighted average number of shares outstanding | 3,131,423,608 | 3,177,220,033 | ||||||
| Net income attributable to NHI shareholders per share | ¥ | 67.10 | ¥ | 16.25 | ||||
Millions of yen except per share data presented in yen | ||||||||
Three months ended September 30 | ||||||||
2020 | 2021 | |||||||
| Basic— | ||||||||
| Net income attributable to NHI shareholders | ¥ | 67,642 | ¥ | 3,213 | ||||
| Weighted average number of shares outstanding | 3,056,897,704 | 3,094,089,105 | ||||||
| Net income attributable to NHI shareholders per share | ¥ | 22.13 | ¥ | 1.04 | ||||
| Diluted— | ||||||||
| Net income attributable to NHI shareholders | ¥ | 67,625 | ¥ | 3,202 | ||||
| Weighted average number of shares outstanding | 3,143,092,237 | 3,179,898,312 | ||||||
| Net income attributable to NHI shareholders per share | ¥ | 21.52 | ¥ | 1.01 | ||||
Net income attributable to NHI shareholders is adjusted to reflect the decline in Nomura’s equity share of earnings of subsidiaries and affiliates for the six and the three months ended September 30, 2020 and 2021, arising from options to purchase common shares issued by subsidiaries and affiliates.
The weighted average number of shares used in the calculation of diluted earnings per share (“EPS”) reflects the increase in potential issuance of common shares arising from stock-based compensation plans issued by the Company and affiliates, which would have minimal impact on EPS for the six and the three months ended September 30, 2020.
The weighted average number of shares used in the calculation of diluted EPS reflects the increase in potential issuance of common shares arising from stock-based compensation plans issued by the Company and affiliates, which would have minimal impact on EPS for the six and the three months ended September 30, 2021.
Antidilutive stock options and other stock-based compensation plans to purchase 15,450,900 and 12,387,500 common shares were not included in the computation of diluted EPS for the six and the three months ended September 30, 2020 and 2021 respectively.
F-79
Notes to the Interim Consolidated Financial Statements—(Continued) (UNAUDITED)
12. Employee benefit plans:
Nomura provides various pension plans and other post-employment benefits which cover certain employees worldwide. In addition, Nomura provides health care benefits to certain active and retired employees through its Nomura Securities Health Insurance Society.
Net periodic benefit cost
The net periodic benefit cost of the defined benefit plans of Japanese entities includes the following components.
Millions of yen | ||||||||
Six months ended September 30 | ||||||||
2020 | 2021 | |||||||
| Service cost | ¥ | 3,361 | ¥ | 3,226 | ||||
| Interest cost | 893 | 1,021 | ||||||
| Expected return on plan assets | (2,913 | ) | (3,028 | ) | ||||
| Amortization of net actuarial losses | 2,759 | 1,978 | ||||||
| Amortization of prior service cost | (761 | ) | (800 | ) | ||||
| Net periodic benefit cost | ¥ | 3,339 | ¥ | 2,397 | ||||
Millions of yen | ||||||||
Three months ended September 30 | ||||||||
2020 | 2021 | |||||||
| Service cost | ¥ | 1,681 | ¥ | 1,613 | ||||
| Interest cost | 447 | 510 | ||||||
| Expected return on plan assets | (1,457 | ) | (1,514 | ) | ||||
| Amortization of net actuarial losses | 1,379 | 989 | ||||||
| Amortization of prior service cost | (381 | ) | (400 | ) | ||||
| Net periodic benefit cost | ¥ | 1,669 | ¥ | 1,198 | ||||
Nomura also recognized net periodic benefit cost of plans other than Japanese entities’ plans, which are not significant.
F-80
Notes to the Interim Consolidated Financial Statements—(Continued) (UNAUDITED)
13. Income taxes:
For the six months ended September 30, 2020, the difference between the effective statutory tax rate of 31% and the effective tax rate of 19.7% was mainly
due to
decrease in valuation allowance of foreign subsidiaries, whereasa
non-deductible
expenses increased the effective tax rate.For the three months ended September 30, 2020, the difference between the effective statutory tax rate of 31% and the effective tax rate of 17.6% was mainly
due to
decrease in valuation allowance of foreign subsidiaries, whereasa
non-deductible
expenses increased the effective tax rate.For the six months ended September 30, 2021, the difference between the effective statutory tax rate of 31% and the effective tax rate of 42.8% was mainly due to a decrease ofallowance of foreign subsidiaries increased the effective tax rate.
non-taxable
revenues, whereas an increase of thevaluation
For the three months ended September 30, 2021, the difference between the effective statutory tax rate of 31% and the effective tax rate of 70.3% was mainly due to a decrease of
non-taxable
revenues, whereasnon-deductible
expenses increased the effective tax rate. F-81
Notes to the Interim Consolidated Financial Statements—(Continued) (UNAUDITED)
14. Other comprehensive income (loss):
Changes in accumulated other comprehensive income (loss) are as follows:
Millions of yen | ||||||||||||||||||||
Six months ended September 30, 2020 | ||||||||||||||||||||
Balance at beginning of year | Other comprehensive income (loss) before reclassifications | Reclassifications out of accumulated other comprehensive income (loss) (1) | Net change during the period | Balance at end of period | ||||||||||||||||
| Cumulative translation adjustments | ¥ | (26,274 | ) | ¥ | (18,395 | ) | ¥ | (1,812 | ) | ¥ | (20,207 | ) | ¥ | (46,481 | ) | |||||
| Pension liability adjustment | (62,571 | ) | 1,051 | 2,339 | 3,390 | (59,181 | ) | |||||||||||||
| Own credit adjustments | 62,740 | (35,083 | ) | (10,701 | ) | (45,784 | ) | 16,956 | ||||||||||||
| Total | ¥ | (26,105 | ) | ¥ | (52,427 | ) | ¥ | (10,174 | ) | ¥ | (62,601 | ) | ¥ | (88,706 | ) | |||||
| (1) | Change in own credit adjustments, net of tax in other comprehensive income (loss) for six months ended September 30, 2020 includes reclassification adjustment of ¥12,846 million recognized in Revenue—Net gain on trading Income tax expense Fair value measurements |
Millions of yen | ||||||||||||||||||||
Six months ended September 30, 2021 | ||||||||||||||||||||
Balance at beginning of year | Other comprehensive income (loss) before reclassifications | Reclassifications out of accumulated other comprehensive income (loss) (1) | Net change during the period | Balance at end of period | ||||||||||||||||
| Cumulative translation adjustments | ¥ | 18,316 | ¥ | 5,268 | ¥ | 61 | ¥ | 5,329 | ¥ | 23,645 | ||||||||||
| Pension liability adjustment | (43,477 | ) | (358 | ) | 842 | 484 | (42,993 | ) | ||||||||||||
| Own credit adjustments | (12,983 | ) | 3,117 | 708 | 3,825 | (9,158 | ) | |||||||||||||
| Total | ¥ | (38,144 | ) | ¥ | 8,027 | ¥ | 1,611 | ¥ | 9,638 | ¥ | (28,506 | ) | ||||||||
| (1) | Reclassifications out of accumulated other comprehensive income were not significant. |
Millions of yen | ||||||||||||||||||||
Three months ended September 30, 2020 | ||||||||||||||||||||
Balance at beginning of period | Other comprehensive income (loss) before reclassifications | Reclassifications out of accumulated other comprehensive income (loss) (1) | Net change during the period | Balance at end of period | ||||||||||||||||
| Cumulative translation adjustments | ¥ | (26,958 | ) | ¥ | (17,731 | ) | ¥ | (1,792 | ) | ¥ | (19,523 | ) | ¥ | (46,481 | ) | |||||
| Pension liability adjustment | (60,263 | ) | (277 | ) | 1,359 | 1,082 | (59,181 | ) | ||||||||||||
| Own credit adjustments | 61,248 | (42,841 | ) | (1,451 | ) | (44,292 | ) | 16,956 | ||||||||||||
| Total | ¥ | (25,973 | ) | ¥ | (60,849 | ) | ¥ | (1,884 | ) | ¥ | (62,733 | ) | ¥ | (88,706 | ) | |||||
| (1) | Reclassifications out of accumulated other comprehensive income (loss) were not significant. |
Millions of yen | ||||||||||||||||||||
Three months ended September 30, 2021 | ||||||||||||||||||||
Balance at beginning of period | Other comprehensive income (loss) before reclassifications | Reclassifications out of accumulated other comprehensive income (loss) (1) | Net change during the period | Balance at end of period | ||||||||||||||||
| Cumulative translation adjustments | ¥ | 14,982 | ¥ | 8,663 | ¥ | 0— | ¥ | 8,663 | ¥ | 23,645 | ||||||||||
| Pension liability adjustment | (43,468 | ) | 176 | 299 | 475 | (42,993 | ) | |||||||||||||
| Own credit adjustments | (8,690 | ) | (775 | ) | 307 | (468 | ) | (9,158 | ) | |||||||||||
| Total | ¥ | (37,176 | ) | ¥ | 8,064 | ¥ | 606 | ¥ | 8,670 | ¥ | (28,506 | ) | ||||||||
| (1) | Reclassifications out of accumulated other comprehensive income were not significant. |
F-82
Notes to the Interim Consolidated Financial Statements—(Continued) (UNAUDITED)
15. Commitments, contingencies and guarantees:
Commitments—
Credit and investment commitments
In connection with its banking and financing activities, Nomura provides commitments to extend credit which generally have fixed expiration dates. In connection with its investment banking activities, Nomura enters into agreements with clients under which Nomura commits to underwrite securities that may be issued by the clients. As a member of certain central clearing counterparties, Nomura is committed to provide liquidity facilities through entering into reverse repo transactions backed by government and government agency debt securities with those counterparties in a situation where a default of another clearing member occurs. The outstanding commitments under these agreements are included below in commitments to extend credit.
Nomura has commitments to invest in various partnerships and other entities and also has commitments to provide financing for investments related to these partnerships. The outstanding commitments under these agreements are included below in commitments to invest.
The following table presents a summary of the key types of outstanding commitments provided by Nomura.
Millions of yen | ||||||||
March 31, 2021 | September 30, 2021 | |||||||
| Commitments to extend credit | ||||||||
| Liquidity facilities to central clearing counterparties | ¥ | 1,400,076 | ¥ | 1,214,587 | ||||
| Other commitments to extend credit | 901,867 | 1,056,581 | ||||||
| Total | ¥ | 2,301,943 | ¥ | 2,271,168 | ||||
| Commitments to invest | ¥ | 136,367 | ¥ | 26,511 | ||||
As of September 30, 2021, these commitments had the following maturities:
Millions of yen | ||||||||||||||||||||
Years to Maturity | ||||||||||||||||||||
Total contractual amount | Less than 1 year | 1 to 3 years | 3 to 5 years | More than 5 years | ||||||||||||||||
| Commitments to extend credit | ||||||||||||||||||||
| Liquidity facilities to central clearing counterparties | ¥ | 1,214,587 | ¥ | 1,214,587 | ¥ | 0— | ¥ | 0— | ¥ | 0— | ||||||||||
| Other commitments to extend credit | 1,056,581 | 305,693 | 226,516 | 188,982 | 335,390 | |||||||||||||||
| Total | ¥ | 2,271,168 | ¥ | 1,520,280 | ¥ | 226,516 | ¥ | 188,982 | ¥ | 335,390 | ||||||||||
| Commitments to invest | ¥ | 26,511 | ¥ | 136 | ¥ | 2,038 | ¥ | 4,239 | ¥ | 20,099 | ||||||||||
The contractual amounts of these commitments to extend credit represent the amounts at risk but only if the contracts are fully drawn upon, should the counterparties default, and assuming the value of any existing collateral becomes worthless. The total contractual amount of these commitments may not represent future cash requirements since the commitments may expire without being drawn upon. The credit risk associated with these commitments varies depending on the clients’ creditworthiness and the value of collateral held. Nomura evaluates each client’s creditworthiness on abasis. The amount of collateral obtained, if deemed necessary by Nomura upon extension of credit, is based on credit evaluation of the counterparty.
case-by-case
Contingencies—
Investigations, lawsuits and other legal proceedings
In the normal course of business as a global financial services entity, Nomura is involved in investigations, lawsuits and other legal proceedings and, as a result, may suffer loss from any fines, penalties or damages awarded against Nomura, any settlements Nomura chooses to make to resolve a matter, and legal and other advisory costs incurred to support and formulate a defense.
The ability to predict the outcome of these actions and proceedings is inherently difficult, particularly where claimants are seeking substantial or indeterminate damages, where investigations and legal proceedings are at an early stage, where the matters present novel legal theories or involve a large number of parties, or which take place in foreign jurisdictions with complex or unclear laws.
F-83
The Company regularly evaluates each legal proceeding and claim on abasis in consultation with external legal counsel to assess whether an estimate of possible loss or range of loss can be made, if recognition of a liability is not appropriate. In accordance with ASC 450 “” (“ASC 450”), the Company recognizes a liability for this risk of loss arising on each individual matter when a loss is probable and the amount of such loss or range of loss can be reasonably estimated. The amount recognized as a liability is reviewed at least quarterly and is revised when further information becomes available. If these criteria are not met for an individual matter, such as if an estimated loss is only reasonably possible rather than probable, no liability is recognized. However, where a material loss is reasonably possible, the Company will disclose details of the legal proceeding or claim below. Under ASC 450 an event is defined as reasonably possible if the chance of the loss to the Company is more than remote but less than probable. As of March 31, 2021 and September 30, 2021, the total liability of ¥62,889 million and ¥102,835 million have been recognized respectively, and reported withinin respect of outstanding and unsettled investigations, lawsuits and other legal proceedings where loss is considered probable and the loss can be reasonably estimated. Total expenses recognized through earnings during the six months ended September 30, 2021 in connection with these matters was ¥40,084 million, which has been reported within.
case-by-case
Contingencies
Other liabilities
Non-interest
expenses—OtherThe most significant actions and proceedings against Nomura are summarized below. The Company believes that, based on current information available as of the date of these consolidated financial statements, the ultimate resolution of these actions and proceedings will not be material to the Company’s financial condition. However, an adverse outcome in certain of these matters could have a material adverse effect on the consolidated statements of income or cash flows in a particular quarter or annual period.
For certain of the significant actions and proceedings, the Company is currently able to estimate the amount of reasonably possible loss, or range of reasonably possible losses, in excess of amounts recognized as a liability (if any) against such cases. These estimates are based on current information available as of the date of these consolidated financial statements and include, but are not limited to, the specific amount of damages or claims against Nomura in each case. As of
December 17
, 2021, for those cases where an estimate of the range of reasonably possible losses can be made, the Company estimates that the total aggregate reasonably possible maximum loss in excess of amounts recognized as a liability (if any) against these cases is approximately ¥93 billion.For certain other significant actions and proceedings, the Company is unable to provide an estimate of the reasonably possible loss or range of reasonably possible losses because, among other reasons, (i) the proceedings are at such an early stage there is not enough information available to assess whether the stated grounds for the claim are viable; (ii) damages have not been identified by the claimant; (iii) damages are unsupported and/or exaggerated; (iv) there is uncertainty as to the outcome of pending appeals or motions; (v) there are significant legal issues to be resolved that may be dispositive, such as the applicability of statutes of limitations; (vi) there are novel or unsettled legal theories underlying the claims and/or (vii) a judgment has been made against Nomura but detailed reasons for the basis for the judgment and how the amount of the judgment has been determined have not yet been received.
Nomura will continue to cooperate with regulatory investigations and to vigorously defend its position in the ongoing actions and proceedings set out below, as appropriate.
In January 2008, Nomura International plc (“NIP”) was served with a tax notice issued by the tax authorities in Pescara, Italy alleging breaches by NIP of the U.K.-Italy Double Taxation Treaty of 1998 (“Tax Notice”). The alleged breaches relate to payments to NIP of tax credits on dividends on Italian shares. The Tax Notice not only denies certain payments to which NIP claims to be entitled but also seeks reimbursement of approximately EUR 33.8 million, plus interest, already refunded. NIP has exhausted all avenues of appeal following a judgment of the Italian Supreme Court dismissing NIP’s appeal in July 2021.
Similar claims have been made by the tax authorities against IBJ Nomura Financial Products (UK) PLC (“IBJN”) a group company which has been in members’ voluntary liquidation since 2000. An Italian Supreme Court judgment in June 2019 confirmed that tax credit refunds of approximately EUR 38 million, plus interest, were payable by IBJN to the Italian tax authorities.
In October 2010 and June 2012, two actions were brought against NIP, seeking recovery of payments allegedly made to NIP by Fairfield Sentry Ltd. and Fairfield Sigma Ltd. (collectively, “Fairfield Funds”), which are now in liquidation and were feeder funds to Bernard L. Madoff Investment Securities LLC (in liquidation pursuant to the Securities Investor Protection Act in the U.S. since December 2008) (“BLMIS”). The first suit was brought by the liquidators of the Fairfield Funds. It was filed on October 5, 2010 in the Supreme Court of the State of New York, but was subsequently removed to the United States Bankruptcy Court for the Southern District of New York. The second suit was brought by the Trustee for the liquidation of BLMIS (“Madoff Trustee”). NIP was added as a defendant in June 2012 when the Madoff Trustee filed an amended complaint in the United States Bankruptcy Court for the Southern District of New York. Both actions seek to recover approximately $35 million.
F-84
Certain of the Company’s subsidiaries in the U.S. securitized residential mortgage loans in the form of residential mortgage-backed securities (“RMBS”). These subsidiaries did not generally originate mortgage loans, but purchased mortgage loans from third-party loan originators (“originators”). In connection with such purchases, these subsidiaries received loan level representations from the originators. In connection with the securitizations, the relevant subsidiaries provided loan level representations and warranties of the type generally described below, which mirror the representations the subsidiaries received from the originators.
The loan level representations made in connection with the securitization of mortgage loans were generally detailed representations applicable to each loan and addressed characteristics of the borrowers and properties. The representations included, but were not limited to, information concerning the borrower’s credit status, theratio, the owner occupancy status of the property, the lien position, the fact that the loan was originated in accordance with the originator’s guidelines, and the fact that the loan was originated in compliance with applicable laws. Certain of the RMBS issued by the subsidiaries were structured with credit protection provided to specified classes of certificates by monoline insurers.
loan-to-value
With respect to certain of the RMBS issued from 2005 to 2007, the relevant subsidiaries received claims demanding the repurchase of certain loans from trustees of various securitization trusts, made at the instance of one or more investors, or from certificate insurers. The total original principal amount of loans for which repurchase claims were received by the relevant subsidiaries within six years of each securitization is $3,203 million. The relevant subsidiaries summarily rejected any demand for repurchase received after the expiration of the statute of limitations applicable to breach of representation claims. For those claims received within six years, the relevant subsidiaries reviewed each claim received, and rejected those claims believed to be without merit or agreed to repurchase certain loans for those claims that the relevant subsidiaries determined to have merit. In several instances, following the rejection of repurchase demands, investors instituted actions through the trustee alleging breach of contract from 2011 to 2014. The breach of contract claims that were brought within the
six-year
statute of limitations for breach of contract actions have survived motions to dismiss and discovery has now been completed in the Supreme Court of the State of New York.A monoline insurer, Ambac Assurance Corp (“Ambac”), brought an action in April 2013 against Nomura Credit & Capital, Inc. (“NCCI”) and Nomura Holding America Inc. (“NHA”) alleging breach of contract with respect to representations concerning specific loan characteristics and fraud in the inducement of the insurance contract based on misrepresentations concerning the loans for two trusts insured by Ambac. The court dismissed all claims against NHA, and the claims against NCCI are continuing in the Supreme Court of the State of New York and discovery has now been completed.
In November 2011, NIP was served with a claim filed by the Madoff Trustee in the United States Bankruptcy Court for the Southern District of New York. This is a clawback action similar to claims filed by the Madoff Trustee against numerous other institutions. The Madoff Trustee alleges that NIP received redemptions from the BLMIS feeder fund, Harley International (Cayman) Limited in the six years prior to December 11, 2008 (the date proceedings were commenced against BLMIS) and that these are avoidable and recoverable under the U.S. Bankruptcy Code and New York law. The amount that the Madoff Trustee is currently seeking to recover from NIP is approximately $21 million.
In March 2013, Banca Monte dei Paschi di Siena SpA (“MPS”) issued a claim in the Italian Courts against (1) two former directors of MPS and (2) NIP. MPS alleged that the former directors improperly caused MPS to enter into certain structured financial transactions with NIP in 2009 (“Transactions”) and that NIP acted fraudulently and was jointly liable for the unlawful conduct of MPS’s former directors. MPS claimed damages of not less than EUR 1.1 billion.
In March 2013, NIP commenced a claim against MPS in the English Courts. The claim was for declaratory relief confirming that the Transactions remained valid and contractually binding. MPS filed and served its defence and counterclaim to these proceedings in March 2014. MPS alleged in its counterclaim that NIP was liable to make restitution of a net amount of approximately EUR 1.5 billion, and sought declarations regarding the illegality and invalidity of the Transactions.
On September 23, 2015, NIP entered into a settlement agreement with MPS to terminate the Transactions. NIP believes that the Transactions were conducted legally and appropriately, and does not accept the allegations made against it or admit any wrongdoing. Taking into account the views of relevant European financial authorities and the advice provided by external experts, NIP considered it to be in its best interests to reach a settlement in relation to this matter. As part of the agreement, the Transactions were unwound at a discount of EUR 440 million in favour of MPS and the civil proceedings between MPS and NIP in Italy and England, respectively, will no longer be pursued. Pursuant to the settlement agreement MPS and NIP applied to the Italian Courts to discontinue the proceedings brought by MPS against NIP. These proceedings have since been discontinued.
In April 2013, an investigation was commenced by the Public Prosecutor’s office in Siena, Italy, into various allegations against MPS and certain of its former directors, including in relation to the Transactions. The investigation was subsequently transferred to the Public Prosecutor of Milan. On April 3, 2015, the Public Prosecutor’s office in Milan issued a notice concluding its preliminary investigation. The Public Prosecutor was seeking to indict MPS, three individuals from MPS’s former management, NIP and two former NIP employees for, among others, the offences of false accounting and market manipulation in relation to MPS’s previous accounts. The preliminary hearing at which the Milan criminal court considered whether or not to grant the indictment concluded on October 1, 2016, the Judge ordering the trial of all individuals and banks involved except for MPS (which entered into a plea bargaining agreement with the Public Prosecutor). The trial commenced in December 2016. As part of these proceedings, a number of civil claimants have been permitted to bring damages claims against a number of entities and individuals, including NIP.
F-85
On November
8,
2019, the court delivered its oral verdict, finding two former employees of NIP guilty of false accounting, market manipulation and obstructing the supervisory activities of CONSOB and that NIP had breached Italian corporate liability legislation. In so doing, it imposed a fine of EUR
3.45 million on NIP as well as ordering confiscation of EUR
88 million. On May
12,
2020, the court issued the detailed reasoning for the verdict (including the rationale for the penalties imposed). NIP has appealed the decision to the Milan Court of Appeal. The penalties will not be enforceable until all appeals have been concluded.
In addition, NIP is involved in a number of separate civil or administrative matters relating to the Transactions including those described further below.
In July 2013, a claim was issued against former directors of MPS, and NIP, by the shareholder group Fondazione Monte dei Paschi di Siena (“FMPS”). The grounds of the FMPS claim were similar to those on which the MPS claim was founded and the level of damages sought by FMPS was not less than EUR 315.2 million. In September 2020, NIP, without admitting any wrongdoing, entered into a settlement agreement with FMPS pursuant to which FMPS waived its claim against NIP.
The
proceedingshave since been discontinued
.In January 2018, a claim before the Italian Courts brought by two claimants, Alken Fund Sicav (on behalf of two Luxembourg investment funds Alken Fund European Opportunities and Alken Fund Absolute Return Europe) and Alken Luxembourg S.A (the funds’ management company) (collectively referred to as “Alken”) was served on NIP. The claim was made against NIP, MPS, four MPS former directors and a member of MPS’s internal audit board, and sought monetary damages of approximately EUR 434 million on the basis of allegations similar to those made in the MPS and FMPS claims, as well as
non-monetary
damages in an amount left to be quantified by the Judge. In July 2021, the court rejected all of Alken’s claims.In May 2019, a claim before the Italian Courts brought by York Global Finance Offshore BDH (Luxembourg) Sàrl and a number of seemingly related funds was served on NIP. The claim is made against NIP, MPS, two MPS former directors and a member of MPS’s internal audit board, and seeks monetary damages of approximately EUR 186.7 million on grounds similar to those in the MPS and FMPS claims, as well as
non-monetary
damages in an amount left to be quantified by the Judge.Additionally, NIP was served by the Commissione Nazionale per le Società e la Borsa (“CONSOB”, the Italian financial regulatory authority) with a notice commencing administrative sanction proceedings for market manipulation in connection with the Transactions. In relation to the Transactions, the notice named MPS, three individuals from MPS’s former management and two former NIP employees as defendants, whereas NIP was named only in its capacity as vicariously liable to pay any fines imposed on the former NIP employees. On May 22, 2018
,
CONSOB issued its decision in which it levied EUR 100,000 fines in relation to each of the two former NIP employees. In addition, CONSOB decided that the two employees did not meet the necessary Italian law integrity requirements to perform certain senior corporate functions, for a period of three months and six months respectively. NIP was vicariously liable to pay the fines imposed on its former employees. NIP paid the fines and appealed the decision to the Milan Court of Appeal. In December 2020, the Court of Appeal annulled the CONSOB decision against NIP. CONSOB has appealed the Court of Appeal’s decision to the Italian Supreme Court.In June 2016 and August 2016, Nomura International (Hong Kong) Limited (“NIHK”) and Nomura Special Investments Singapore Pte Limited (“NSIS”) were respectively served with a complaint filed in the Taipei District Court against NIHK, NSIS and certain individuals by Cathay United Bank, Co., Ltd., Taiwan Cooperative Bank Ltd., Chang Hwa Commercial Bank Ltd., Taiwan Business Bank Ltd., KGI Bank and Hwatai Bank Ltd. (collectively, “Syndicate Banks”). The Syndicate Banks’ complaint relates to a $60 million syndicated term loan to a subsidiary of Ultrasonic AG that was arranged by NIHK, and made by the Syndicate Banks together with NSIS. The Syndicate Banks’ allegations in the complaint include allegations that NIHK failed to comply with its fiduciary duties to the lenders as the arranger of the loan and the Syndicate Banks seek to recover approximately $48 million in damages and interest.
In March 2017, certain subsidiaries of American International Group, Inc. (“AIG”) commenced proceedings in the District Court of Harris County, Texas against certain entities and individuals, including Nomura Securities International, Inc. (“NSI”), in connection with a 2012 offering of $750 million of certain project finance notes, of which $92 million allegedly were purchased by AIG. AIG alleges violations of the Texas Securities Act based on material misrepresentations and omissions in connection with the marketing, offering, issuance and sale of the notes and seeks rescission of the purchases or compensatory damages.
F-86
On May 20, 2021, NIP and the Company were named as addressees in a decision issued by the European Commission in which NIP, the Company and various other third party banks have been found to have infringed EU competition law in connection with their activity in the primary and secondary markets for European Government Bonds (“EGB”). The European Commission found that the infringement consisted of anticompetitive agreements and/or concerted practices in the EGB sector in breach of EU competition law and fined NIP and the Company approximately EUR 129.6 million. In August 2021, NIP and the Company appealed the decision.
NIP and NSI have been served with a class action complaint filed in the United States District Court for the Southern District of New York alleging violations of U.S. antitrust law in relation to the alleged manipulation of the primary and secondary markets for EGB.
A
dditionally, NIP and NSI are defendants in a separate class action complaint filed in the Toronto Registry Office of the Federal Court of Canada alleging violations of Canadian competition law relating to the alleged manipulation of the secondary trading market for supranational, sub-sovereign and agency bonds.Nomura is responding to requests from governmental authorities in relation to swap trading related to bond issuances. On February 1, 2021, the U.S. Commodity Futures Trading Commission filed a civil enforcement action against a Nomura employee and charged him with violating the anti-fraud, price manipulation and false statements provisions of the Commodity Exchange Act in relation to a 2015 interest rate swap transaction.
In September 2017 and November 2017, NIHK and NSIS were respectively served with a complaint filed in the Taipei District Court against NIHK, NSIS, China Firstextile (Holdings) Limited (“FT”) and certain individuals by First Commercial Bank, Ltd., Land Bank of Taiwan Co., Ltd., Chang Hwa Commercial Bank Ltd., Taishin International Bank, E.Sun Commercial Bank, Ltd., CTBC Bank Co., Ltd., Hwatai Bank, Ltd. and Bank of Taiwan (collectively, “FT Syndicate Banks”). The FT Syndicate Banks’ complaint relates to a $100 million syndicated term loan facility to borrower FT that was arranged by NIHK, and made by the FT Syndicate Banks together with NSIS. The FT Syndicate Banks’ allegations in the complaint include tort claims under Taiwan law against the defendants. The FT Syndicate Banks seek to recover approximately $68 million in damages and interest.
In August 2017, the Cologne public prosecutor in Germany notified NIP that it is investigating possible tax fraud by individuals who worked for the Nomura Group in relation to the historic planning and execution of trading strategies around dividend record dates in certain German equities (known as “cum/ex” trading) and in relation to filings of tax reclaims in 2007 to 2012. During the fiscal year ended March 31, 2020, Nomura Group became aware that certain of those individuals would be the subject of investigative proceedings in Germany. NIP and another entity in the Nomura Group are cooperating with the investigation, including by disclosing to the public prosecutor certain documents and trading data. If the investigation involving Nomura Group entities and former individuals proceeds to trial, the individuals could face criminal sanctions and Nomura Group entities could face administrative sanctions such as administrative fines or profit confiscation orders.
In June 2020, NIP issued a claim against a current Italian counterparty in the courts of England and Wales. The claim sought declarations that the terms of a derivative transaction entered into in 2005 are binding. The counterparty filed and served its defense and counterclaim to these proceedings in January 2021 which sought, amongst other things, restitution of sums paid under the transaction. Separately, in June 2020, the counterparty filed an interim injunction application against NIP in the Tribunal of Palermo relating to payments due by it in relation to the same transaction. This application was dismissed at first instance but the counterparty appealed that decision. In October 2021, NIP, without admitting any wrongdoing, entered into a settlement agreement with the counterparty pursuant to which the proceedings in both jurisdictions are being discontinued.
A former counterparty has asserted a claim against NIP relating to derivative transactions entered into between the counterparty and NIP between 2009 and 2011. The counterparty alleges that it lacked the authority and the capacity to enter into the transactions. To date, no legal proceedings have been issued in respect of the claim
F-87
Notes to the Interim Consolidated Financial Statements—(Continued) (UNAUDITED)
Guarantees—
In the normal course of business, Nomura enters into various guarantee arrangements with counterparties in the form of standby letters of credit and other guarantees, which generally have a fixed expiration date.
In addition, Nomura enters into certain derivative contracts that meet the accounting definition of a guarantee, namely derivative contracts that contingently require a guarantor to make payment to a guaranteed party based on changes in an underlying that relate to an asset, liability or equity security held by a guaranteed party. Since Nomura does not track whether its clients enter into these derivative contracts for speculative or hedging purposes, Nomura has disclosed below information about derivative contracts that could meet the accounting definition of guarantees.
For information about the maximum potential amount of future payments that Nomura could be required to make under certain derivatives, the notional amount of contracts has been disclosed. However, the maximum potential payout for certain derivative contracts, such as written interest rate caps and written currency options, cannot be estimated, as increases in interest or foreign exchange rates in the future could be theoretically unlimited.
Nomura records all derivative contracts at fair value on its consolidated balance sheets. Nomura believes the notional amounts generally overstate its risk exposure. Since the derivative contracts are accounted for at fair value, carrying value is considered the best indication of payment and performance risk for individual contracts.
The following table presents information on Nomura’s derivative contracts that could meet the accounting definition of a guarantee and standby letters of credit and other guarantees.
Millions of yen | ||||||||||||||||
March 31, 2021 | September 30, 2021 | |||||||||||||||
Carrying value | Maximum Potential Payout/ Notional Total | Carrying value | Maximum Potential Payout/ Notional Total | |||||||||||||
Derivative contracts (1)(2) | ¥ | 5,207,911 | ¥ | 322,635,226 | ¥ | 4,192,556 | ¥ | 335,257,050 | ||||||||
Standby letters of credit and other guarantees (3) | 0— | 206,072 | 0— | 592,318 | ||||||||||||
| (1) | Credit derivatives are disclosed in Note 3. “ Derivative instruments and hedging activities |
| (2) | Derivative contracts primarily consist of equity, interest rate and foreign exchange contracts. |
| (3) | As of March 31, 2021 and September 30, 2021, primarily related to a certain sponsored repo program where Nomura guarantees to a 3rd party clearing house the payment of its clients’ obligations. Our exposure under this guarantee is minimized through effectively obtaining collaterals whose amount is approximately equal to the maximum potential payout of the guarantee. |
The following table presents maturity information on Nomura’s derivative contracts that could meet the accounting definition of a guarantee and standby letters of credit and other guarantees as of September 30, 2021.
Millions of yen | ||||||||||||||||||||||||
Carrying value | Maximum Potential Payout/Notional | |||||||||||||||||||||||
Total | Years to Maturity | |||||||||||||||||||||||
Less than 1 year | 1 to 3 years | 3 to 5 years | More than 5 years | |||||||||||||||||||||
| Derivative contracts | ¥ | 4,192,556 | ¥ | 335,257,050 | ¥ | 74,966,306 | ¥ | 88,589,281 | ¥ | 49,474,447 | ¥ | 122,227,016 | ||||||||||||
| Standby letters of credit and other guarantees | 0— | 592,318 | 574,803 | 14,028 | 283 | 3,204 | ||||||||||||||||||
F-88
Notes to the Interim Consolidated Financial Statements—(Continued) (UNAUDITED)
16. Segment and geographic information:
Operating segments—
In April 2021, the Investment Management Division was newly established by replacing the Asset Management Division and the Merchant Banking Division. Accordingly, Nomura’s operating management and management reporting are prepared based on the Retail, the Investment Management, and the Wholesale segments. Nomura structures its business segments based upon the nature of its main products and services, its client base and its management structure.
The accounting policies for segment information follow U.S. GAAP, except for the impact of unrealized gains/losses on certain investments in equity securities held for operating purposes, which under U.S. GAAP are included inbut excluded from segment information.
Income (loss) before income taxes,
Revenues and expenses directly associated with each business segment are included in the operating results of each respective segment. Revenues and expenses that are not directly attributable to a particular segment are allocated to each respective business segment or included in “”, based upon Nomura’s allocation methodologies as used by management to assess each segment’s performance.
Other
Business segments’ results are shown in the following tables.is disclosed because management views interest revenue net of interest expense for its operating decisions. Business segments’ information on total assets is not disclosed because management does not utilize such information for its operating decisions and therefore, it is not reported to management.
Net interest revenue
The prior period amounts have been reclassified to conform to the current year presentation, in accordance with the realignment in April 2021.
F-89
Millions of yen | ||||||||||||||||||||
Retail | Investment Management | Wholesale (1) | Other (Incl. elimination) | Total | ||||||||||||||||
Six months ended September 30, 2020 | ||||||||||||||||||||
Non-interest revenue | ¥ | 172,676 | ¥ | 69,888 | ¥ | 376,148 | ¥ | 121,385 | ¥ | 740,097 | ||||||||||
| Net interest revenue | 1,197 | (146 | ) | 92,826 | (8,486 | ) | 85,391 | |||||||||||||
| Net revenue | 173,873 | 69,742 | 468,974 | 112,899 | 825,488 | |||||||||||||||
Non-interest expenses | 135,979 | 35,521 | 315,628 | 77,179 | 564,307 | |||||||||||||||
| Income before income taxes | ¥ | 37,894 | ¥ | 34,221 | ¥ | ¥ | 35,720 | ¥ | 261,181 | |||||||||||
| Six months ended September 30, 2021 | ||||||||||||||||||||
Non-interest revenue | ¥ | 168,475 | ¥ | 97,944 | ¥ | 255,957 | ¥ | 122,305 | ¥ | 644,681 | ||||||||||
| Net interest revenue | 1,702 | (133 | ) | 49,489 | (28,837 | ) | 22,221 | |||||||||||||
| Net revenue | 170,177 | 97,811 | 305,446 | 93,468 | 666,902 | |||||||||||||||
Non-interest expenses | 134,171 | 37,869 | 308,834 | 94,267 | 575,141 | |||||||||||||||
| Income (loss) before income taxes | ¥ | 36,006 | ¥ | 59,942 | ¥ | (3,388 | ) | ¥ | (799 | ) | ¥ | 91,761 | ||||||||
Millions of yen | ||||||||||||||||||||
Retail | Investment Management | Wholesale | Other (Incl. elimination) | Total | ||||||||||||||||
Three months ended September 30, 2020 | ||||||||||||||||||||
Non-interest revenue | ¥ | 92,331 | ¥ | 29,731 | ¥ | 185,601 | ¥ | 27,230 | ¥ | 334,893 | ||||||||||
| Net interest revenue | 464 | 337 | 34,704 | (3,354 | ) | 32,151 | ||||||||||||||
| Net revenue | 92,795 | 30,068 | 220,305 | 23,876 | 367,044 | |||||||||||||||
Non-interest expenses | 69,970 | 18,018 | 154,828 | 42,555 | 285,371 | |||||||||||||||
| Income (loss) before income taxes | ¥ | 22,825 | ¥ | 12,050 | ¥ | 65,477 | ¥ | (18,679 | ) | ¥ | 81,673 | |||||||||
| Three months ended September 30, 2021 | ||||||||||||||||||||
Non-interest revenue | ¥ | ¥ | ¥ | ¥ | 43,590 | ¥ | 307,416 | |||||||||||||
| Net interest revenue | 796 | 85 | 27,482 | (18,781 | ) | 9,582 | ||||||||||||||
| Net revenue | 85,191 | 34,329 | 172,669 | 24,809 | 316,998 | |||||||||||||||
Non-interest expenses | 68,207 | 19,300 | 147,700 | 65,192 | 300,399 | |||||||||||||||
| Income (loss) before income taxes | ¥ | 16,984 | ¥ | 15,029 | ¥ | 24,969 | ¥ | (40,383 | ) | ¥ | 16,599 | |||||||||
| (1) | Non-interest revenueNon-interest expense million arising from the U.S. Prime Brokerage Event. The losses are reported within ¥(56,073) million and inNet gain on trading in the amount of Non-interest expenses—Other |
Transactions between operating segments are recorded within segment results on commercial terms and conditions and are eliminated in “”
Other.
F-90
Notes to the Interim Consolidated Financial Statements—(Continued) (UNAUDITED)
The following table presents the major components ofin “.”
Income (loss) before income taxes
Other
Millions of yen | ||||||||
Six months ended September 30 | ||||||||
2020 | 2021 | |||||||
| Net gain (loss) related to economic hedging transactions | ¥ | 612 | ¥ | (381 | ) | |||
| Realized gain on investments in equity securities held for operating purposes | 809 | 196 | ||||||
| Equity in earnings of affiliates | 11,860 | 15,188 | ||||||
Corporate items (1)(2) | 29,085 | (54,838 | ) | |||||
Other (3)(4) | (6,646 | ) | 39,036 | |||||
| Total | ¥ | 35,720 | ¥ | (799 | ) | |||
Millions of yen | ||||||||
Three months ended September 30 | ||||||||
2020 | 2021 | |||||||
| Net gain (loss) related to economic hedging transactions | ¥ | (4,965 | ) | ¥ | (3,825 | ) | ||
| Realized gain on investments in equity securities held for operating purposes | 124 | 23 | ||||||
| Equity in earnings of affiliates | 5,251 | 5,571 | ||||||
| Corporate items | (16,005 | ) | (45,566 | ) | ||||
Other (4) | (3,084 | ) | 3,414 | |||||
| Total | ¥ | (18,679 | ) | ¥ | (40,383 | ) | ||
| (1) | The income before income taxes for the six months ended September 30, 2020 includes a gain of ¥71,075 million which represents the difference between the fair value of the assets acquired and the carrying value of the assets transferred by Nomura as a result of the rights conversion of the Tokyo Nihonbashi district redevelopment project. |
| (2) | The loss before income taxes for the six months ended September 30, 2021 includes losses of approximately ¥40 billion related to legacy transactions. |
| (3) | The income before income taxes for the six months ended September 30, 2021 includes a gain of ¥36,249 million from the sale of Nomura Research Institute, Ltd. ordinary shares. |
| (4) | Includes the impact of Nomura’s own creditworthiness. |
The table below presents reconciliations of the combined business segments’ results included in the preceding table to Nomura’s reportedandin the consolidated statements of income.
Net revenue,
Non-interest
expensesIncome before income taxes
Millions of yen | ||||||||
Six months ended September 30 | ||||||||
2020 | 2021 | |||||||
| Net revenue | ¥ | 825,488 | ¥ | 666,902 | ||||
| Unrealized gain on investments in equity securities held for operating purposes | 4,257 | 5,239 | ||||||
| Consolidated net revenue | ¥ | 829,745 | ¥ | 672,141 | ||||
Non-interest expenses | ¥ | 564,307 | ¥ | 575,141 | ||||
| Unrealized gain (loss) on investments in equity securities held for operating purposes | 0— | 0— | ||||||
Consolidated non-interest expenses | ¥ | 564,307 | ¥ | 575,141 | ||||
| Income before income taxes | ¥ | 261,181 | ¥ | 91,761 | ||||
| Unrealized gain on investments in equity securities held for operating purposes | 4,257 | 5,239 | ||||||
| Consolidated income before income taxes | ¥ | 265,438 | ¥ | 97,000 | ||||
Millions of yen | ||||||||
Three months ended September 30 | ||||||||
2020 | 2021 | |||||||
| Net revenue | ¥ | 367,044 | ¥ | 316,998 | ||||
| Unrealized gain on investments in equity securities held for operating purposes | 1,954 | 1,868 | ||||||
| Consolidated net revenue | ¥ | 368,998 | ¥ | 318,866 | ||||
Non-interest expenses | ¥ | 285,371 | ¥ | 300,399 | ||||
| Unrealized gain (loss) on investments in equity securities held for operating purposes | 0— | 0— | ||||||
Consolidated non-interest expenses | ¥ | 285,371 | ¥ | 300,399 | ||||
| Income before income taxes | ¥ | 81,673 | ¥ | 16,599 | ||||
| Unrealized gain on investments in equity securities held for operating purposes | 1,954 | 1,868 | ||||||
| Consolidated income before income taxes | ¥ | 83,627 | ¥ | 18,467 | ||||
F-91
Notes to the Interim Consolidated Financial Statements—(Continued) (UNAUDITED)
Geographic information—
Nomura’s identifiable assets, revenues and expenses are generally allocated based on the country of domicile of the legal en
t
ity providing the service. However, because of the integration of the global capital markets and the corresponding global nature of Nomura’s activities and services, it is not always possible to make a precise separation by location. As a result, various assumptions, which are consistent among years, have been made in presenting the following geographic data.The table below presents a geographic allocation ofandfrom operations by geographic areas, andassociated with Nomura’s operations. Net revenue in “Americas” and “Europe” substantially represents Nomura’s operations in the U.S. and the U.K., respectively.andhave been allocated based on transactions with external customers whilehave been allocated based on the inclusion of intersegment transactions.
Net revenue
Income (loss) before income taxes
long-lived assets
Net revenue
Long-lived assets
Income (loss) before income taxes
Millions of yen | ||||||||
Six months ended September 30 | ||||||||
2020 | 2021 | |||||||
Net revenue (1)(2) : | ||||||||
| Americas | ¥ | 222,091 | ¥ | 122,906 | ||||
| Europe | 59,681 | 66,997 | ||||||
| Asia and Oceania | 27,605 | 43,876 | ||||||
| Subtotal | 309,377 | 233,779 | ||||||
| Japan | 520,368 | 438,362 | ||||||
| Consolidated | ¥ | 829,745 | ¥ | 672,141 | ||||
Income (loss) before income taxes (2) : | ||||||||
| Americas | ¥ | 79,157 | ¥ | (53,824 | ) | |||
| Europe | 6,580 | (14,150 | ) | |||||
| Asia and Oceania | 21,915 | 13,724 | ||||||
| Subtotal | 107,652 | (54,250 | ) | |||||
| Japan | 157,786 | 151,250 | ||||||
| Consolidated | ¥ | 265,438 | ¥ | 97,000 | ||||
Millions of yen | ||||||||
Three months ended September 30 | ||||||||
2020 | 2021 | |||||||
Net revenue (1) : | ||||||||
| Americas | ¥ | 112,903 | ¥ | 84,602 | ||||
| Europe | 39,510 | 33,629 | ||||||
| Asia and Oceania | 17,369 | 22,715 | ||||||
| Subtotal | 169,782 | 140,946 | ||||||
| Japan | 199,216 | 177,920 | ||||||
| Consolidated | ¥ | 368,998 | ¥ | 318,866 | ||||
| Income (loss) before income taxes: | ||||||||
| Americas | ¥ | 39,159 | ¥ | (17,225 | ) | |||
| Europe | (8,437 | ) | (8,863 | ) | ||||
| Asia and Oceania | 12,720 | 7,103 | ||||||
| Subtotal | 43,442 | (18,985 | ) | |||||
| Japan | 40,185 | 37,452 | ||||||
| Consolidated | ¥ | 83,627 | ¥ | 18,467 | ||||
| (1) | There is no revenue derived from transactions with a single major external customer. |
| (2) | Includes losses arising from the U.S. Prime Brokerage Event. |
Notes to the Interim Consolidated Financial Statements—(Continued) (UNAUDITED)
Millions of yen | ||||||||
March 31, 2021 | September 30, 2021 | |||||||
| Long-lived assets: | ||||||||
| Americas | ¥ | 98,611 | ¥ | 96,974 | ||||
| Europe | 65,165 | 52,134 | ||||||
| Asia and Oceania | 26,690 | 25,685 | ||||||
| Subtotal | 190,466 | 174,793 | ||||||
| Japan | 303,355 | 313,968 | ||||||
| Consolidated | ¥ | 493,821 | ¥ | 488,761 | ||||
17. Supplementary subsidiary guarantee information required under SEC rules:
The Company provides several guarantees of debts of its subsidiaries.
The Company has fully and unconditionally guaranteed the securities issued by Nomura America Finance LLC (“NAFL”), which is an indirect, wholly owned finance subsidiary of the Company. NAFL operates as a special purpose entity. It was formed for the purpose of issuing debt securities to repay existing credit facilities, refinance indebtedness, and for acquisition purposes. The guarantee will remain in effect until the entire principal, if any, of, and interest and premium, if any, on, the securities has been paid in full or discharged in accordance with the provisions of the indenture, or otherwise fully defeased by the Company.
18. Subsequent events:
On October 29, 2021, the board of directors approved a resolution to set up a share buyback program, pursuant to the Company’s articles of incorporation set out in accordance with Article
459-1
of the Companies Act as follows: (a) total number of shares authorized for repurchase is up to 80,000,000 shares, (b) total value of shares authorized for repurchase is up to ¥50,000 million and (c) the share buyback program will run from November 16, 2021 to March 31, 2022 (excluding the ten business days following the announcement of quarterly operating results). F-93
Report of Independent Registered Public Accounting Firm
To the Shareholders and Board of Directors of
Nomura Holdings, Inc.
Results of Review of Interim Financial Statements
We have reviewed the accompanying consolidated balance sheet of Nomura Holdings, Inc. (the “Company”) as of September 30, 2021, the related consolidated statements of income, comprehensive income and changes in equity for the three and
six-month
periods ended September 30, 2021 and 2020, the related consolidated statements of cash flows for thesix-month
periods ended September 30, 2021 and 2020, and the related notes (collectively referred to as the “consolidated interim financial statements”). Based on our reviews, we are not aware of any material modifications that should be made to the consolidated interim financial statements for them to be in conformity with U.S. generally accepted accounting principles.We have previously audited, in accordance with the standards of the Public Company Accounting Oversight Board (United States) (“PCAOB”), the consolidated balance sheet of the Company as of March 31, 2021, the related consolidated statements of income, comprehensive income, changes in equity and cash flows for the year then ended, and the related notes (not presented herein); and in our report dated June 25, 2021, we expressed an unqualified audit opinion on those consolidated financial statements. In our opinion, the information set forth in the accompanying consolidated balance sheet as of March 31, 2021, is fairly stated, in all material respects, in relation to the consolidated balance sheet from which it has been derived.
Basis for Review Results
These financial statements are the responsibility of the Company’s management. We are a public accounting firm registered with the PCAOB and are required to be independent with respect to the Company in accordance with the U.S. federal securities laws and the applicable rules and regulations of the SEC and the PCAOB. We conducted our review in accordance with the standards of the PCAOB. A review of interim financial statements consists principally of applying analytical procedures and making inquiries of persons responsible for financial and accounting matters. It is substantially less in scope than an audit conducted in accordance with the standards of the PCAOB, the objective of which is the expression of an opinion regarding the financial statements taken as a whole. Accordingly, we do not express such an opinion.
/s/ Ernst & Young ShinNihon LLC
Tokyo, Japan
December 17, 2021
F-94
Exhibit 15
December 17, 2021
The Shareholders and Board of Directors of
Nomura Holdings, Inc.
We are aware of the incorporation by reference in the Registration Statements (Form
F-3
No. 333-229191
and FormS-8
No. 333-210471,
No. 333-214267,
No. 333-221128,
No. 333-228585,
No. 333-228586,
No. 333-231683,
No. 333-239996
andNo. 333-256408)
and related Prospectus of Nomura Holdings, Inc. of our report dated December 17, 2021 relating to the unaudited consolidated interim financial statements of Nomura Holdings, Inc. as of and for the quarter ended September 30, 2021 that are included in its Form6-K
dated December 17, 2021./s/ Ernst & Young ShinNihon LLC
Exhibit 17
Subsidiary Issuer of Registered Guaranteed Securities
Nomura Holdings, Inc. (“NHI”) fully and unconditionally guarantees certain securities issued by its indirect, wholly owned finance subsidiary, Nomura America Finance LLC (“NAFL”). The securities issued by NAFL and guaranteed by NHI that are subject to Section 13(a) or 15(d) of the Securities Exchange Act of 1934 are as follows:
| • | Senior Global Medium-Term Notes, Series A, Callable Leveraged Steepener Notes due November 24, 2025 |
| • | Senior Global Medium-Term Notes, Series A, Callable Leveraged Steepener Notes due December 31, 2033 |
| • | Senior Global Medium-Term Notes, Series A, Callable Leveraged Steepener Notes due February 28, 2034 |
| • | Senior Global Medium-Term Notes, Series A, Callable Leveraged Steepener Notes due May 30, 2034 |
| • | Senior Global Medium-Term Notes, Series A, Callable Contingent Coupon Trigger Notes Linked to Russell 2000 ® Index due July 16, 2024 |
| • | Senior Global Medium-Term Notes, Series A, Callable Leveraged Steepener Notes due July 29, 2034 |
| • | Senior Global Medium-Term Notes, Series A, CPI-Linked Notes due December 24, 2024 |
| • | Senior Global Medium-Term Notes, Series A, Callable Leveraged Steepener Notes due December 24, 2034 |
| • | Senior Global Medium-Term Notes, Series A, Contingent Coupon Trigger Notes Linked to Russell 2000 ® Index due February 18, 2025 |
| • | Senior Global Medium-Term Notes, Series A, 3.00% Fixed to Floating Rate Notes due August 21, 2025 |