FORM 6-K
U.S. SECURITIES AND EXCHANGE COMMISSION
Washington, D.C. 20549
Report of Foreign Private Issuer
Pursuant to Rule 13a-16 or 15d-16 of
the Securities Exchange Act of 1934
Commission File Number: 1-15270
For the month of February 2025
NOMURA HOLDINGS, INC.
(Translation of registrant’s name into English)
13-1, Nihonbashi 1-chome
Chuo-ku, Tokyo 103-8645
Japan
(Address of principal executive offices)
Indicate by check mark whether the registrant files or will file annual reports under cover Form 20-F or Form 40-F.
Form 20-F X Form 40-F
Indicate by check mark if the registrant is submitting the Form 6-K in paper as permitted by Regulation S-T Rule 101(b)(1):
Indicate by check mark if the registrant is submitting the Form 6-K in paper as permitted by Regulation S-T Rule 101(b)(7):
Information furnished on this form:
Exhibit Number
| 1. | Consolidated Results of Operations (US GAAP), Third quarter, year ending March 2025 |
SIGNATURES
Pursuant to the requirements of the Securities Exchange Act of 1934, the registrant has duly caused this report to be signed on its behalf by the undersigned, thereunto duly authorized.
| NOMURA HOLDINGS, INC. | ||||
Date: February 10, 2025 | By: | /s/ Yoshifumi Kishida | ||
| Yoshifumi Kishida | ||||
| Senior Managing Director | ||||
|

Consolidated Results of Operations Third quarter, year ending March 2025 (US GAAP) February 2025 Nomura Holdings, Inc. © Nomura We aspire to create a better world by harnessing the power of financial markets
 |
Outline 1 Presentation Financial Supplement Consolidated balance sheet (p. 17) Value at risk (p. 18) Consolidated financial highlights (p. 19) Consolidated income (p. 20) Main revenue items (p. 21) Consolidated results: Income (loss) before income taxes by segment and region (p. 22) Segment “Other” (p. 23) Wealth Management related data (p. 24-27) Investment Management related data (p. 28-29) Wholesale related data (p. 30) Number of employees (p. 31) Executive summary (p. 2-3) Overview of results (p. 4) Business segment results (p. 5) Wealth Management (p. 6-8) Investment Management (p. 9-10) Wholesale (p. 11-13) Non-interest expenses (p. 14) Robust financial position (p. 15)
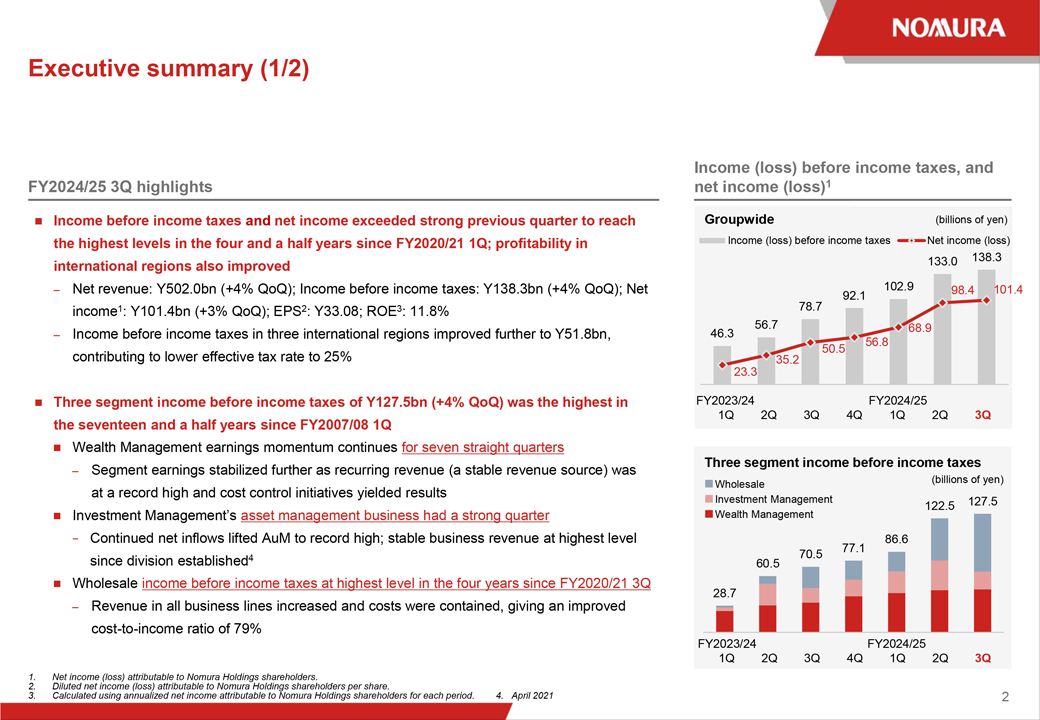 |
2 FY2024/25 3Q highlights Income (loss) before income taxes, and net income (loss)1 1Q 2Q 3Q 4Q 1Q 2Q 3Q FY2023/24 FY2024/25 1Q 2Q 3Q 4Q 1Q 2Q 3Q Income before income taxes and net income exceeded strong previous quarter to reach the highest levels in the four and a half years since FY2020/21 1Q; profitability in international regions also improved – Net revenue: Y502.0bn (+4% QoQ); Income before income taxes: Y138.3bn (+4% QoQ); Net income1: Y101.4bn (+3% QoQ); EPS2: Y33.08; ROE3: 11.8% – Income before income taxes in three international regions improved further to Y51.8bn, contributing to lower effective tax rate to 25% Three segment income before income taxes of Y127.5bn (+4% QoQ) was the highest in the seventeen and a half years since FY2007/08 1Q Wealth Management earnings momentum continues for seven straight quarters – Segment earnings stabilized further as recurring revenue (a stable revenue source) was at a record high and cost control initiatives yielded results Investment Management’s asset management business had a strong quarter—Continued net inflows lifted AuM to record high; stable business revenue at highest level since division established4 Wholesale income before income taxes at highest level in the four years since FY2020/21 3Q – Revenue in all business lines increased and costs were contained, giving an improved cost-to-income ratio of 79% Executive summary (1/2) Groupwide (billions of yen) Three segment income before income taxes (billions of yen) Wealth Management Investment Management Wholesale FY2023/24 FY2024/25 46.3 56.7 78.7 92.1 102.9 133.0 138.3 23.3 35.2 50.5 56.8 68.9 98.4 101.4 Income (loss) before income taxes Net income (loss) 28.7 60.5 70.5 77.1 86.6 122.5 127.5 1. Net income (loss) attributable to Nomura Holdings shareholders. 2. Diluted net income (loss) attributable to Nomura Holdings shareholders per share. 3. Calculated using annualized net income attributable to Nomura Holdings shareholders for each period. 4. April 2021
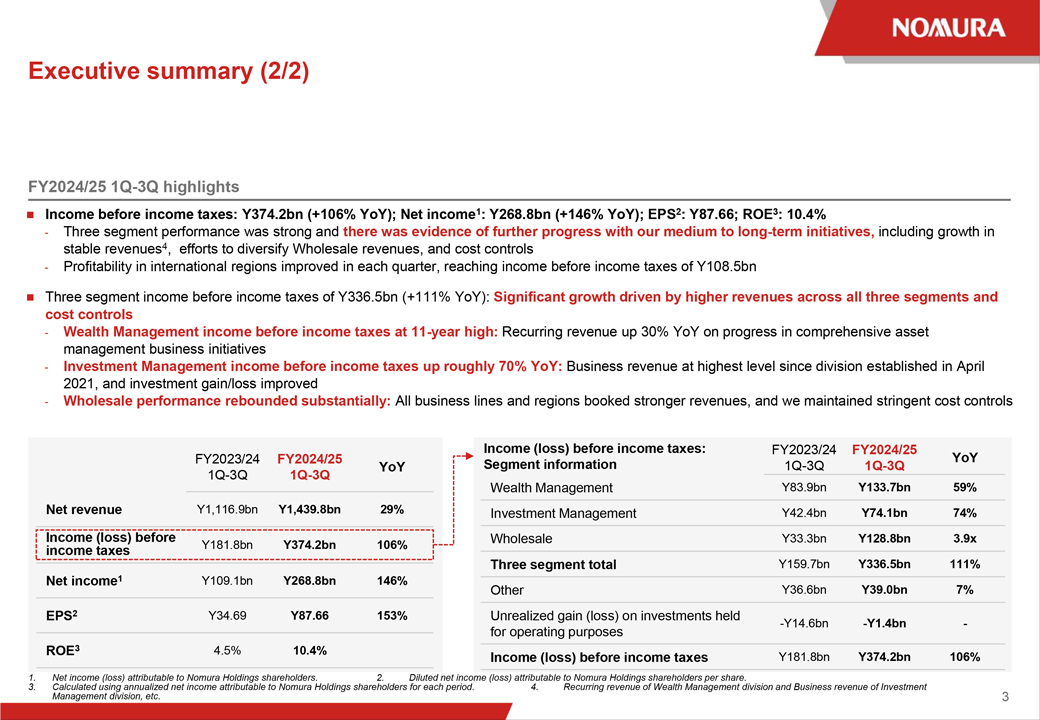 |
FY2024/25 1Q-3Q highlights Executive summary (2/2) 1. Net income (loss) attributable to Nomura Holdings shareholders. 2. Diluted net income (loss) attributable to Nomura Holdings shareholders per share. 3. Calculated using annualized net income attributable to Nomura Holdings shareholders for each period. 4. Recurring revenue of Wealth Management division and Business revenue of Investment Management division, etc. 3 Income before income taxes: Y374.2bn (+106% YoY); Net income1: Y268.8bn (+146% YoY); EPS2: Y87.66; ROE3: 10.4%—Three segment performance was strong and there was evidence of further progress with our medium to long-term initiatives, including growth in stable revenues4, efforts to diversify Wholesale revenues, and cost controls—Profitability in international regions improved in each quarter, reaching income before income taxes of Y108.5bn Three segment income before income taxes of Y336.5bn (+111% YoY): Significant growth driven by higher revenues across all three segments and cost controls—Wealth Management income before income taxes at 11-year high: Recurring revenue up 30% YoY on progress in comprehensive asset management business initiatives—Investment Management income before income taxes up roughly 70% YoY: Business revenue at highest level since division established in April 2021, and investment gain/loss improved—Wholesale performance rebounded substantially: All business lines and regions booked stronger revenues, and we maintained stringent cost controls FY2023/24 1Q-3Q FY2024/25 1Q-3Q YoY Net revenue Y1,116.9bn Y1,439.8bn 29% Income (loss) before income taxes Y181.8bn Y374.2bn 106% Net income1 Y109.1bn Y268.8bn 146% EPS2 Y34.69 Y87.66 153% ROE3 4.5% 10.4% FY2023/24 1Q-3Q FY2024/25 1Q-3Q YoY Wealth Management Y83.9bn Y133.7bn 59% Investment Management Y42.4bn Y74.1bn 74% Wholesale Y33.3bn Y128.8bn 3.9x Three segment total Y159.7bn Y336.5bn 111% Other Y36.6bn Y39.0bn 7% Unrealized gain (loss) on investments held for operating purposes -Y14.6bn -Y1.4bn—Income (loss) before income taxes Y181.8bn Y374.2bn 106% Income (loss) before income taxes: Segment information
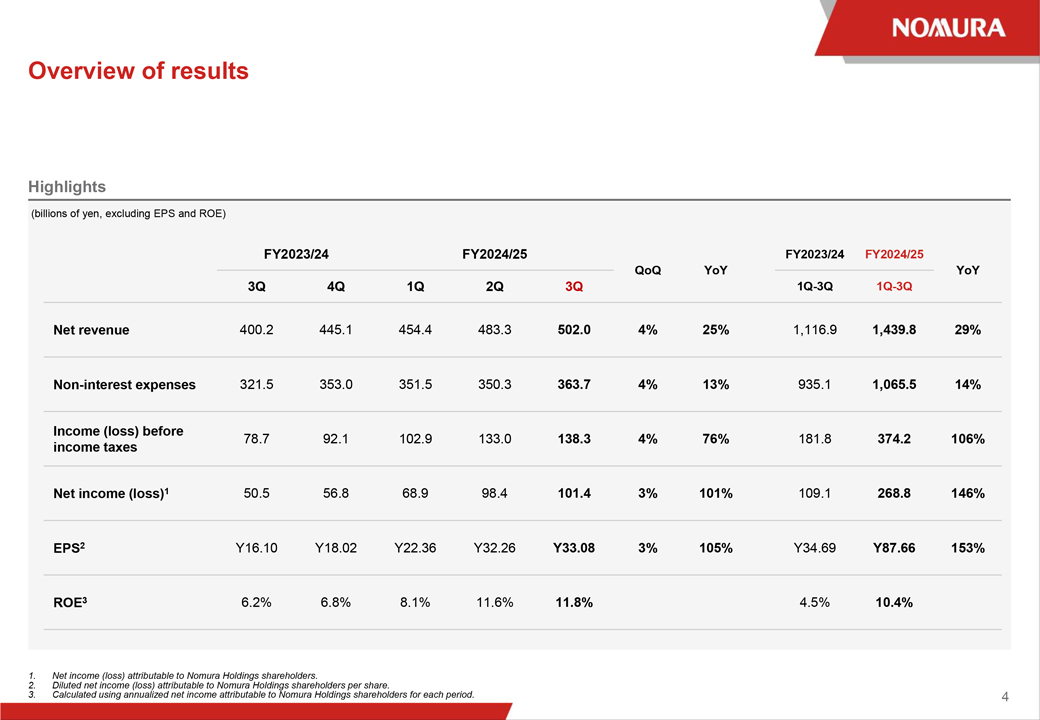 |
Highlights Overview of results 1. Net income (loss) attributable to Nomura Holdings shareholders. 2. Diluted net income (loss) attributable to Nomura Holdings shareholders per share. 3. Calculated using annualized net income attributable to Nomura Holdings shareholders for each period. 4 (billions of yen, excluding EPS and ROE) FY2023/24 FY2024/25 QoQ YoY FY2023/24 FY2024/25 YoY 3Q 4Q 1Q 2Q 3Q 1Q-3Q 1Q-3Q Net revenue 400.2 445.1 454.4 483.3 502.0 4% 25% 1,116.9 1,439.8 29% Non-interest expenses 321.5 353.0 351.5 350.3 363.7 4% 13% 935.1 1,065.5 14% Income (loss) before income taxes 78.7 92.1 102.9 133.0 138.3 4% 76% 181.8 374.2 106% Net income (loss)1 50.5 56.8 68.9 98.4 101.4 3% 101% 109.1 268.8 146% EPS2 Y16.10 Y18.02 Y22.36 Y32.26 Y33.08 3% 105% Y34.69 Y87.66 153% ROE3 6.2% 6.8% 8.1% 11.6% 11.8% 4.5% 10.4%
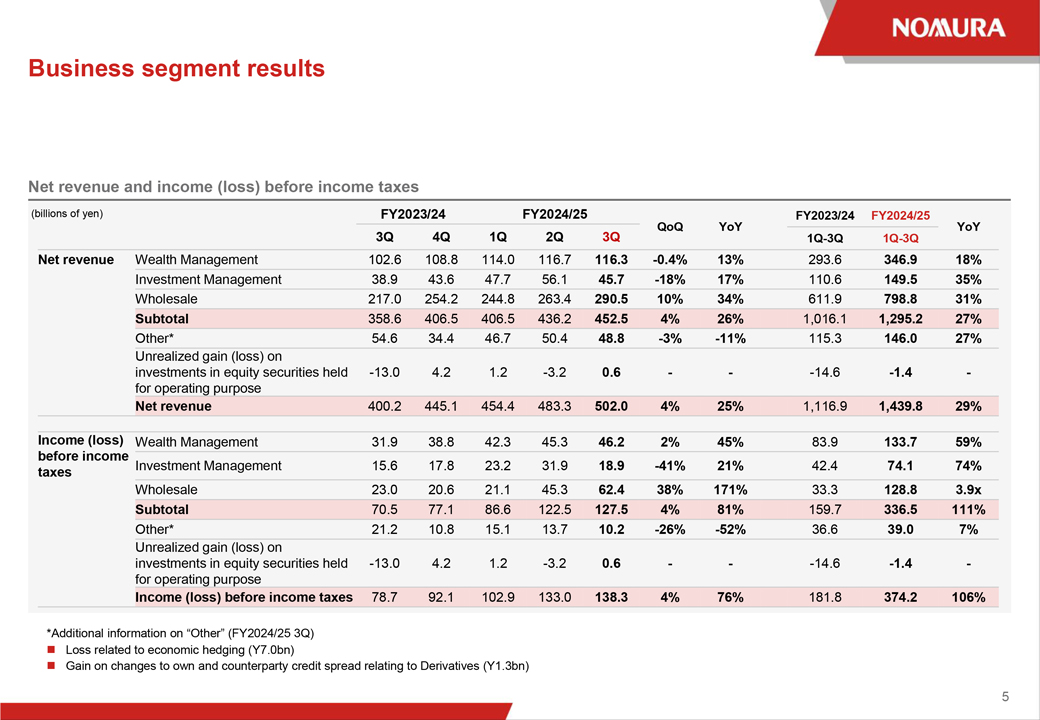 |
Business segment results 5 Net revenue and income (loss) before income taxes *Additional information on “Other” (FY2024/25 3Q) Loss related to economic hedging (Y7.0bn) Gain on changes to own and counterparty credit spread relating to Derivatives (Y1.3bn) FY2023/24 FY2024/25 QoQ YoY FY2023/24 FY2024/25 YoY 3Q 4Q 1Q 2Q 3Q 1Q-3Q 1Q-3Q Net revenue Wealth Management 102.6 108.8 114.0 116.7 116.3 -0.4% 13% 293.6 346.9 18% Investment Management 38.9 43.6 47.7 56.1 45.7 -18% 17% 110.6 149.5 35% Wholesale 217.0 254.2 244.8 263.4 290.5 10% 34% 611.9 798.8 31% Subtotal 358.6 406.5 406.5 436.2 452.5 4% 26% 1,016.1 1,295.2 27% Other* 54.6 34.4 46.7 50.4 48.8 -3% -11% 115.3 146.0 27% Unrealized gain (loss) on investments in equity securities held for operating purpose -13.0 4.2 1.2 -3.2 0.6 — -14.6 -1.4—Net revenue 400.2 445.1 454.4 483.3 502.0 4% 25% 1,116.9 1,439.8 29% Income (loss) before income taxes Wealth Management 31.9 38.8 42.3 45.3 46.2 2% 45% 83.9 133.7 59% Investment Management 15.6 17.8 23.2 31.9 18.9 -41% 21% 42.4 74.1 74% Wholesale 23.0 20.6 21.1 45.3 62.4 38% 171% 33.3 128.8 3.9x Subtotal 70.5 77.1 86.6 122.5 127.5 4% 81% 159.7 336.5 111% Other* 21.2 10.8 15.1 13.7 10.2 -26% -52% 36.6 39.0 7% Unrealized gain (loss) on investments in equity securities held for operating purpose -13.0 4.2 1.2 -3.2 0.6 — -14.6 -1.4—Income (loss) before income taxes 78.7 92.1 102.9 133.0 138.3 4% 76% 181.8 374.2 106% (billions of yen)
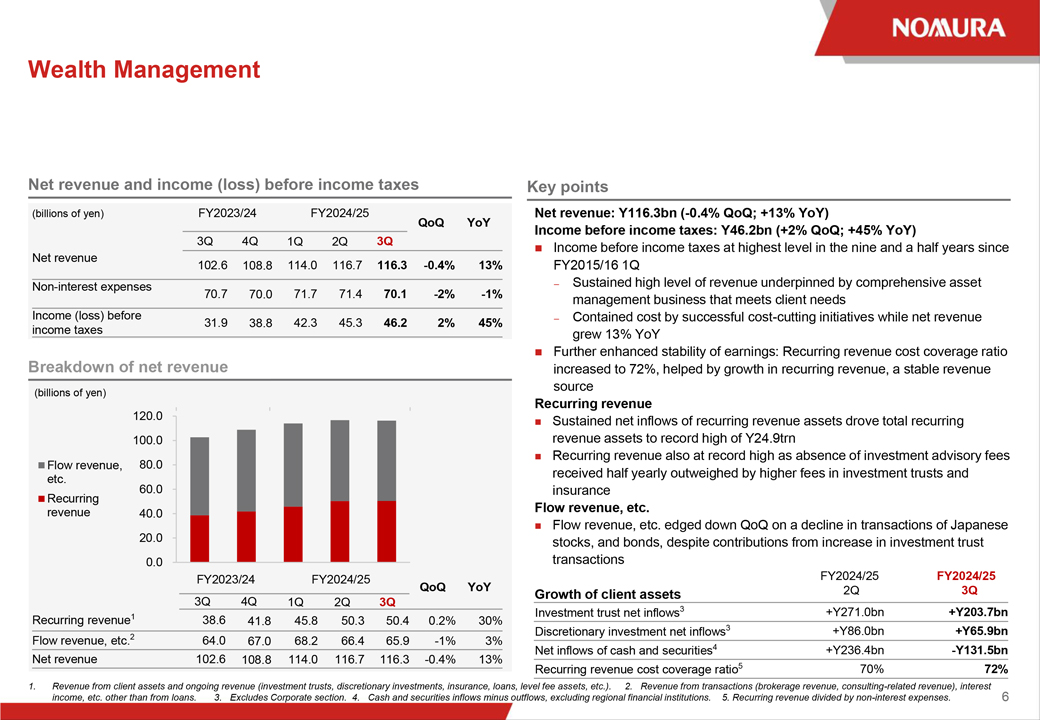 |
Wealth Management 1. Revenue from client assets and ongoing revenue (investment trusts, discretionary investments, insurance, loans, level fee assets, etc.). 2. Revenue from transactions (brokerage revenue, consulting-related revenue), interest income, etc. other than from loans. 3. Excludes Corporate section. 4. Cash and securities inflows minus outflows, excluding regional financial institutions. 5. Recurring revenue divided by non-interest expenses. Net revenue: Y116.3bn (-0.4% QoQ; +13% YoY) Income before income taxes: Y46.2bn (+2% QoQ; +45% YoY) Income before income taxes at highest level in the nine and a half years since FY2015/16 1Q – Sustained high level of revenue underpinned by comprehensive asset management business that meets client needs – Contained cost by successful cost-cutting initiatives while net revenue grew 13% YoY Further enhanced stability of earnings: Recurring revenue cost coverage ratio increased to 72%, helped by growth in recurring revenue, a stable revenue source Recurring revenue Sustained net inflows of recurring revenue assets drove total recurring revenue assets to record high of Y24.9trn Recurring revenue also at record high as absence of investment advisory fees received half yearly outweighed by higher fees in investment trusts and insurance Flow revenue, etc. Flow revenue, etc. edged down QoQ on a decline in transactions of Japanese stocks, and bonds, despite contributions from increase in investment trust transactions Growth of client assets 6 Key points Breakdown of net revenue (billions of yen) (billions of yen) FY2024/25 2Q FY2024/25 3Q Investment trust net inflows3 +Y271.0bn +Y203.7bn Discretionary investment net inflows3 +Y86.0bn +Y65.9bn Net inflows of cash and securities4 +Y236.4bn -Y131.5bn Recurring revenue cost coverage ratio5 70% 72% FY2023/24 FY2024/25 QoQ YoY 3Q 4Q 1Q 2Q 3Q Net revenue 102.6 108.8 114.0 116.7 116.3 -0.4% 13% Non-interest expenses 70.7 70.0 71.7 71.4 70.1 -2% -1% Income (loss) before income taxes 31.9 38.8 42.3 45.3 46.2 2% 45% FY2023/24 FY2024/25 QoQ YoY 3Q 4Q 1Q 2Q 3Q Recurring revenue1 38.6 41.8 45.8 50.3 50.4 0.2% 30% Flow revenue, etc.2 64.0 67.0 68.2 66.4 65.9 -1% 3% Net revenue 102.6 108.8 114.0 116.7 116.3 -0.4% 13% Net revenue and income (loss) before income taxes 0.0 20.0 40.0 60.0 80.0 100.0 120.0 Flow revenue, etc. Recurring revenue
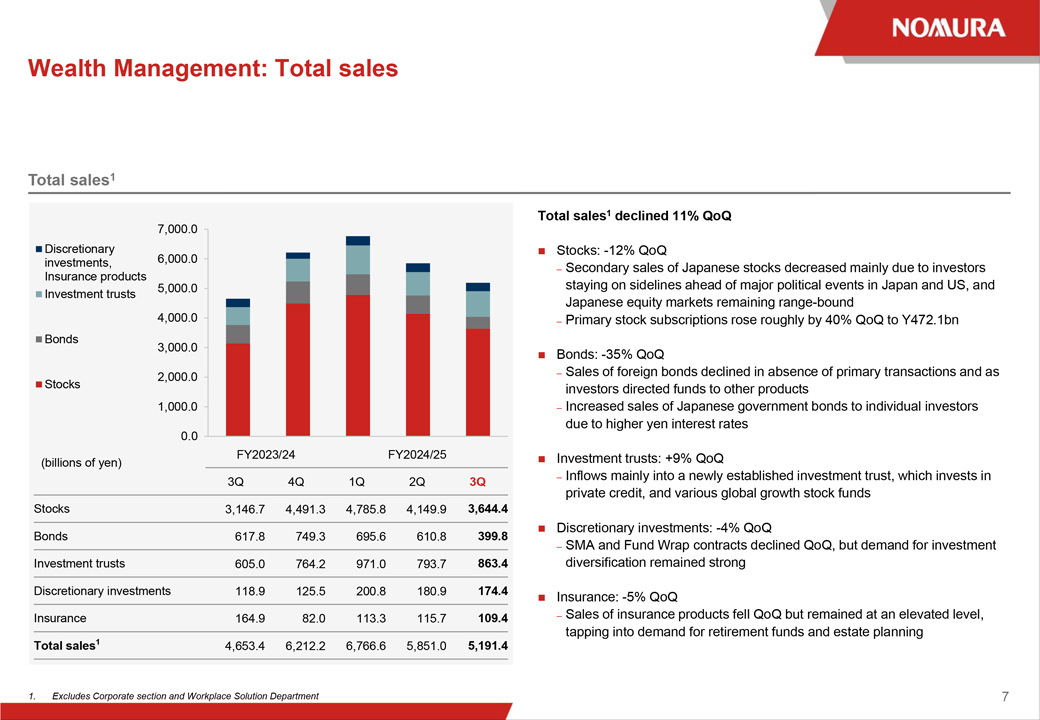 |
Wealth Management: Total sales 1. Excludes Corporate section and Workplace Solution Department 7 Total sales1 FY2023/24 FY2024/25 3Q 4Q 1Q 2Q 3Q Stocks 3,146.7 4,491.3 4,785.8 4,149.9 3,644.4 Bonds 617.8 749.3 695.6 610.8 399.8 Investment trusts 605.0 764.2 971.0 793.7 863.4 Discretionary investments 118.9 125.5 200.8 180.9 174.4 Insurance 164.9 82.0 113.3 115.7 109.4 Total sales1 4,653.4 6,212.2 6,766.6 5,851.0 5,191.4 Total sales1 declined 11% QoQ Stocks: -12% QoQ – Secondary sales of Japanese stocks decreased mainly due to investors staying on sidelines ahead of major political events in Japan and US, and Japanese equity markets remaining range-bound – Primary stock subscriptions rose roughly by 40% QoQ to Y472.1bn Bonds: -35% QoQ – Sales of foreign bonds declined in absence of primary transactions and as investors directed funds to other products – Increased sales of Japanese government bonds to individual investors due to higher yen interest rates Investment trusts: +9% QoQ – Inflows mainly into a newly established investment trust, which invests in private credit, and various global growth stock funds Discretionary investments: -4% QoQ – SMA and Fund Wrap contracts declined QoQ, but demand for investment diversification remained strong Insurance: -5% QoQ – Sales of insurance products fell QoQ but remained at an elevated level, tapping into demand for retirement funds and estate planning (billions of yen) 0.0 1,000.0 2,000.0 3,000.0 4,000.0 5,000.0 6,000.0 7,000.0 Discretionary investments, Insurance products Investment trusts Bonds Stocks
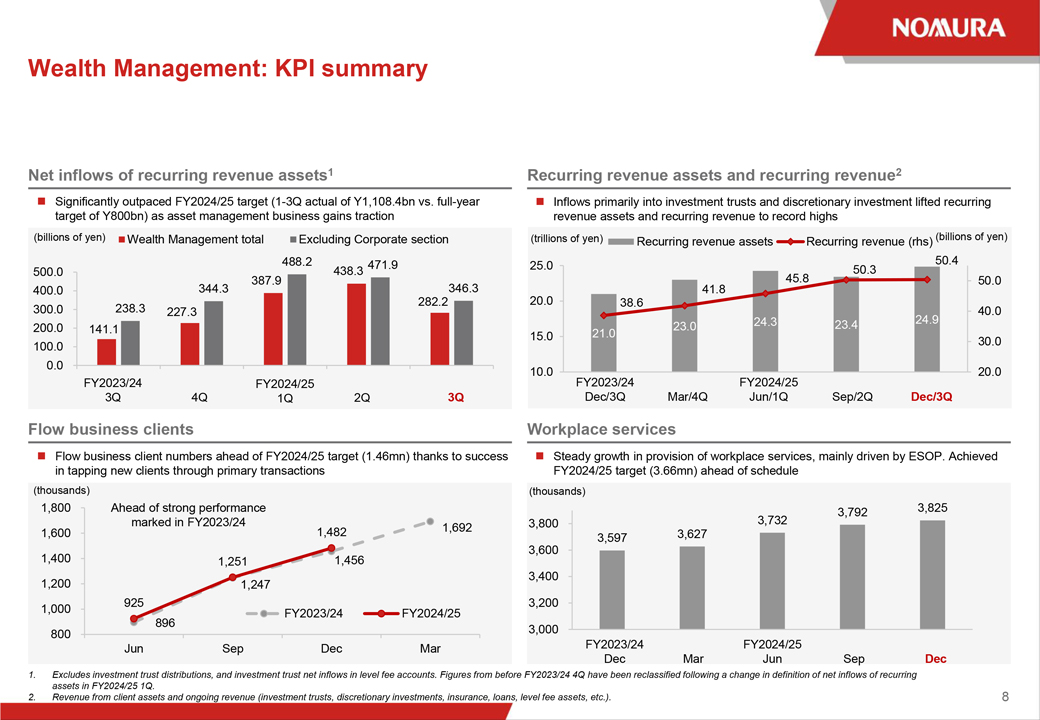 |
Wealth Management: KPI summary 1. Excludes investment trust distributions, and investment trust net inflows in level fee accounts. Figures from before FY2023/24 4Q have been reclassified following a change in definition of net inflows of recurring assets in FY2024/25 1Q. 2. Revenue from client assets and ongoing revenue (investment trusts, discretionary investments, insurance, loans, level fee assets, etc.). 8 Net inflows of recurring revenue assets1 Flow business clients Workplace services (trillions of yen) (thousands) (billions of yen) (thousands) Recurring revenue assets and recurring revenue2 (billions of yen) Flow business client numbers ahead of FY2024/25 target (1.46mn) thanks to success in tapping new clients through primary transactions Steady growth in provision of workplace services, mainly driven by ESOP. Achieved FY2024/25 target (3.66mn) ahead of schedule Significantly outpaced FY2024/25 target (1-3Q actual of Y1,108.4bn vs. full-year target of Y800bn) as asset management business gains traction FY2023/24 3Q 4Q FY2024/25 1Q 3Q FY2023/24 Dec Mar Dec FY2024/25 Jun Sep 3,597 3,627 3,732 3,792 3,825 3,000 3,200 3,400 3,600 3,800 Inflows primarily into investment trusts and discretionary investment lifted recurring revenue assets and recurring revenue to record highs 2Q FY2023/24 Dec/3Q Mar/4Q Dec/3Q FY2024/25 Jun/1Q Sep/2Q 896 1,247 1,456 1,692 925 1,251 1,482 800 1,000 1,200 1,400 1,600 1,800 Jun Sep Dec Mar FY2023/24 FY2024/25 Ahead of strong performance marked in FY2023/24 21.0 23.0 24.3 23.4 24.9 38.6 41.8 45.8 50.3 50.4 20.0 30.0 40.0 50.0 10.0 15.0 20.0 25.0 Recurring revenue assets Recurring revenue (rhs) 141.1 227.3 387.9 438.3 238.3 282.2 344.3 488.2 471.9 346.3 0.0 100.0 200.0 300.0 400.0 500.0 Wealth Management total Excluding Corporate section
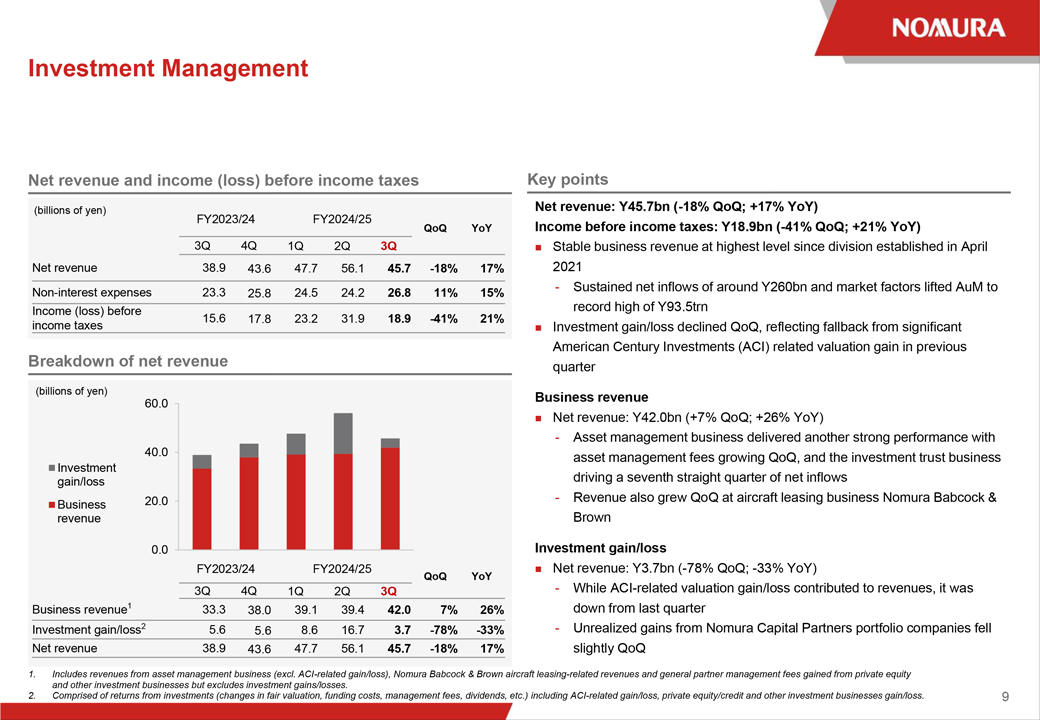 |
Investment Management 1. Includes revenues from asset management business (excl. ACI-related gain/loss), Nomura Babcock & Brown aircraft leasing-related revenues and general partner management fees gained from private equity and other investment businesses but excludes investment gains/losses. 2. Comprised of returns from investments (changes in fair valuation, funding costs, management fees, dividends, etc.) including ACI-related gain/loss, private equity/credit and other investment businesses gain/loss. 9 Net revenue: Y45.7bn (-18% QoQ; +17% YoY) Income before income taxes: Y18.9bn (-41% QoQ; +21% YoY) Stable business revenue at highest level since division established in April 2021—Sustained net inflows of around Y260bn and market factors lifted AuM to record high of Y93.5trn Investment gain/loss declined QoQ, reflecting fallback from significant American Century Investments (ACI) related valuation gain in previous quarter Business revenue Net revenue: Y42.0bn (+7% QoQ; +26% YoY)—Asset management business delivered another strong performance with asset management fees growing QoQ, and the investment trust business driving a seventh straight quarter of net inflows—Revenue also grew QoQ at aircraft leasing business Nomura Babcock & Brown Investment gain/loss Net revenue: Y3.7bn (-78% QoQ; -33% YoY)—While ACI-related valuation gain/loss contributed to revenues, it was down from last quarter—Unrealized gains from Nomura Capital Partners portfolio companies fell slightly QoQ Net revenue and income (loss) before income taxes Breakdown of net revenue Key points FY2023/24 FY2024/25 QoQ YoY 3Q 4Q 1Q 2Q 3Q Net revenue 38.9 43.6 47.7 56.1 45.7 -18% 17% Non-interest expenses 23.3 25.8 24.5 24.2 26.8 11% 15% Income (loss) before income taxes 15.6 17.8 23.2 31.9 18.9 -41% 21% FY2023/24 FY2024/25 QoQ YoY 3Q 4Q 1Q 2Q 3Q Business revenue1 33.3 38.0 39.1 39.4 42.0 7% 26% Investment gain/loss2 5.6 5.6 8.6 16.7 3.7 -78% -33% Net revenue 38.9 43.6 47.7 56.1 45.7 -18% 17% (billions of yen) (billions of yen) 0.0 20.0 40.0 60.0 Investment gain/loss Business revenue
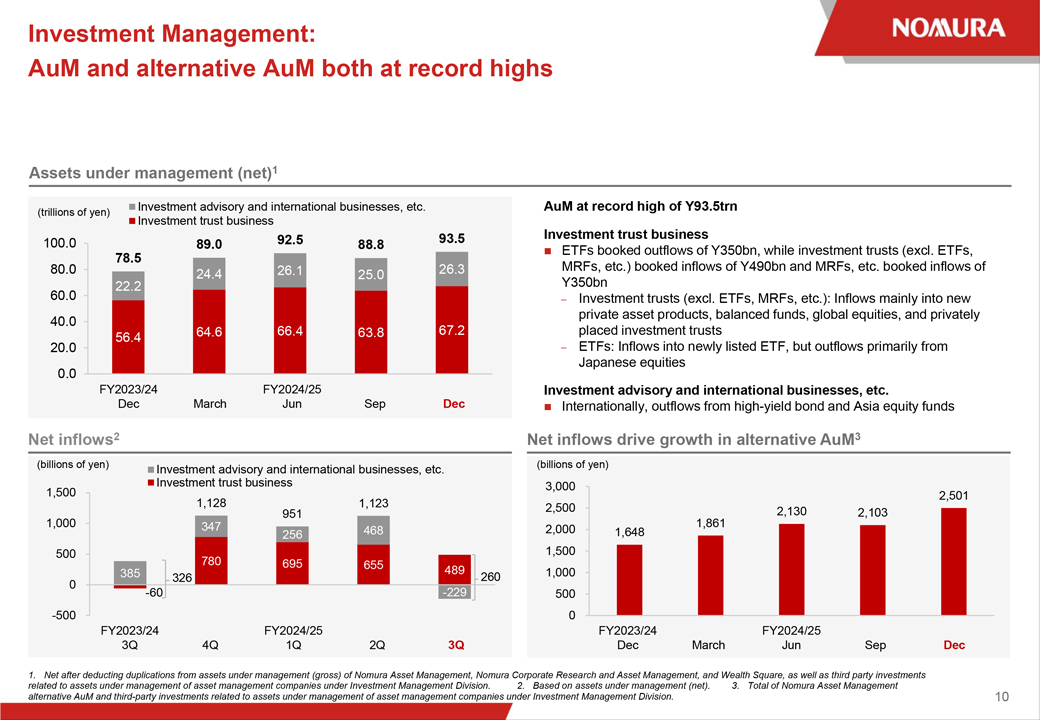 |
Investment Management: AuM and alternative AuM both at record highs 1. Net after deducting duplications from assets under management (gross) of Nomura Asset Management, Nomura Corporate Research and Asset Management, and Wealth Square, as well as third party investments related to assets under management of asset management companies under Investment Management Division. 2. Based on assets under management (net). 3. Total of Nomura Asset Management alternative AuM and third-party investments related to assets under management of asset management companies under Investment Management Division. 10 Assets under management (net)1 Net inflows2 Net inflows drive growth in alternative AuM3 AuM at record high of Y93.5trn Investment trust business ETFs booked outflows of Y350bn, while investment trusts (excl. ETFs, MRFs, etc.) booked inflows of Y490bn and MRFs, etc. booked inflows of Y350bn—Investment trusts (excl. ETFs, MRFs, etc.): Inflows mainly into new private asset products, balanced funds, global equities, and privately placed investment trusts—ETFs: Inflows into newly listed ETF, but outflows primarily from Japanese equities Investment advisory and international businesses, etc. Internationally, outflows from high-yield bond and Asia equity funds FY2023/24 Dec March Dec FY2024/25 Jun Sep FY2023/24 3Q 4Q 3Q FY2024/25 1Q 2Q FY2023/24 Dec March Dec FY2024/25 Jun Sep 1,648 1,861 2,130 2,103 2,501 0 500 1,000 1,500 2,000 2,500 3,000 (trillions of yen) (billions of yen) (billions of yen) 56.4 64.6 66.4 63.8 67.2 22.2 24.4 26.1 25.0 26.3 78.5 89.0 92.5 88.8 93.5 0.0 20.0 40.0 60.0 80.0 100.0 Investment advisory and international businesses, etc. Investment trust business -60 780 695 655 385 489 347 256 468 -229 326 1,128 951 1,123 260 -500 0 500 1,000 1,500 Investment advisory and international businesses, etc. Investment trust business
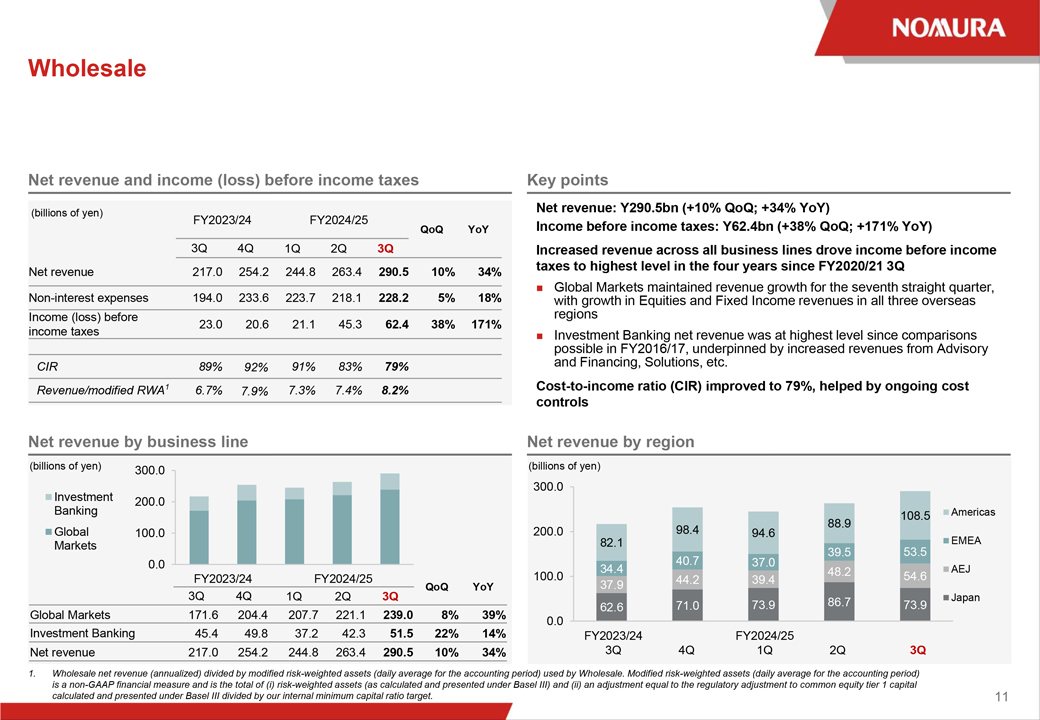 |
Wholesale 1. Wholesale net revenue (annualized) divided by modified risk-weighted assets (daily average for the accounting period) used by Wholesale. Modified risk-weighted assets (daily average for the accounting period) is a non-GAAP financial measure and is the total of (i) risk-weighted assets (as calculated and presented under Basel III) and (ii) an adjustment equal to the regulatory adjustment to common equity tier 1 capital calculated and presented under Basel III divided by our internal minimum capital ratio target. Net revenue: Y290.5bn (+10% QoQ; +34% YoY) Income before income taxes: Y62.4bn (+38% QoQ; +171% YoY) Increased revenue across all business lines drove income before income taxes to highest level in the four years since FY2020/21 3Q Global Markets maintained revenue growth for the seventh straight quarter, with growth in Equities and Fixed Income revenues in all three overseas regions Investment Banking net revenue was at highest level since comparisons possible in FY2016/17, underpinned by increased revenues from Advisory and Financing, Solutions, etc. Cost-to-income ratio (CIR) improved to 79%, helped by ongoing cost controls 11 Net revenue and income (loss) before income taxes Key points Net revenue by business line Net revenue by region FY2023/24 FY2024/25 QoQ YoY 3Q 4Q 1Q 2Q 3Q Net revenue 217.0 254.2 244.8 263.4 290.5 10% 34% Non-interest expenses 194.0 233.6 223.7 218.1 228.2 5% 18% Income (loss) before income taxes 23.0 20.6 21.1 45.3 62.4 38% 171% CIR 89% 92% 91% 83% 79% Revenue/modified RWA1 6.7% 7.9% 7.3% 7.4% 8.2% FY2023/24 FY2024/25 QoQ YoY 3Q 4Q 1Q 2Q 3Q Global Markets 171.6 204.4 207.7 221.1 239.0 8% 39% Investment Banking 45.4 49.8 37.2 42.3 51.5 22% 14% Net revenue 217.0 254.2 244.8 263.4 290.5 10% 34% FY2023/24 3Q 4Q FY2024/25 1Q 2Q 3Q (billions of yen) (billions of yen) (billions of yen) 62.6 71.0 73.9 86.7 73.9 37.9 44.2 39.4 48.2 54.6 34.4 40.7 37.0 39.5 53.5 82.1 98.4 94.6 88.9 108.5 0.0 100.0 200.0 300.0 Americas EMEA AEJ Japan 0.0 100.0 200.0 300.0 Investment Banking Global Markets
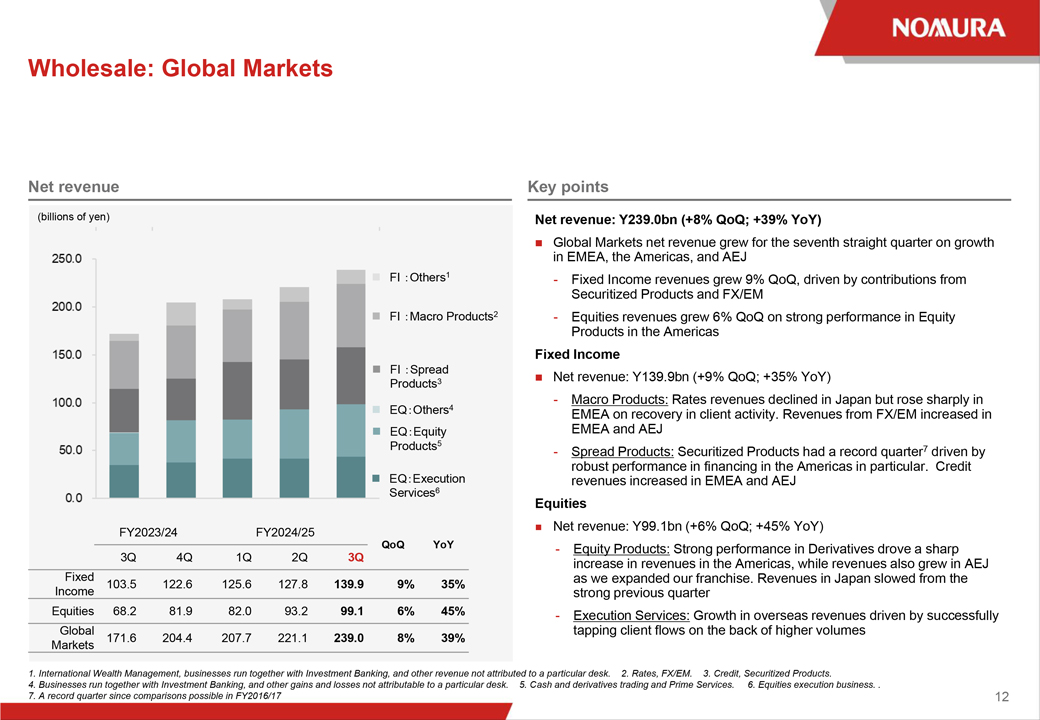 |
Net revenue: Y239.0bn (+8% QoQ; +39% YoY) Global Markets net revenue grew for the seventh straight quarter on growth in EMEA, the Americas, and AEJ—Fixed Income revenues grew 9% QoQ, driven by contributions from Securitized Products and FX/EM—Equities revenues grew 6% QoQ on strong performance in Equity Products in the Americas Fixed Income Net revenue: Y139.9bn (+9% QoQ; +35% YoY)—Macro Products: Rates revenues declined in Japan but rose sharply in EMEA on recovery in client activity. Revenues from FX/EM increased in EMEA and AEJ—Spread Products: Securitized Products had a record quarter7 driven by robust performance in financing in the Americas in particular. Credit revenues increased in EMEA and AEJ Equities Net revenue: Y99.1bn (+6% QoQ; +45% YoY)—Equity Products: Strong performance in Derivatives drove a sharp increase in revenues in the Americas, while revenues also grew in AEJ as we expanded our franchise. Revenues in Japan slowed from the strong previous quarter—Execution Services: Growth in overseas revenues driven by successfully tapping client flows on the back of higher volumes Wholesale: Global Markets 12 Net revenue Key points FY2023/24 FY2024/25 QoQ YoY 3Q 4Q 1Q 2Q 3Q Fixed Income 103.5 122.6 125.6 127.8 139.9 9% 35% Equities 68.2 81.9 82.0 93.2 99.1 6% 45% Global Markets 171.6 204.4 207.7 221.1 239.0 8% 39% FI Others1 EQ Others4 FI Spread Products3 EQ Equity Products5 EQ Execution Services6 FI Macro Products2 1. International Wealth Management, businesses run together with Investment Banking, and other revenue not attributed to a particular desk. 2. Rates, FX/EM. 3. Credit, Securitized Products. 4. Businesses run together with Investment Banking, and other gains and losses not attributable to a particular desk. 5. Cash and derivatives trading and Prime Services. 6. Equities execution business. . 7. A record quarter since comparisons possible in FY2016/17 (billions of yen)
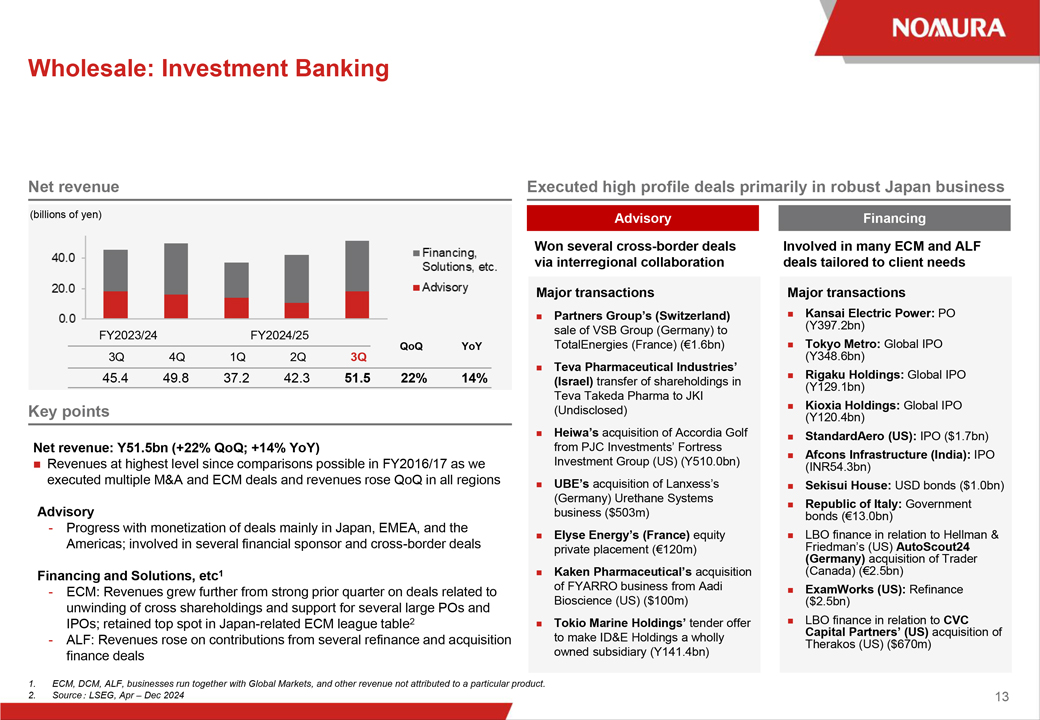 |
Wholesale: Investment Banking 1. ECM, DCM, ALF, businesses run together with Global Markets, and other revenue not attributed to a particular product. 2. Source LSEG, Apr – Dec 2024 Net revenue: Y51.5bn (+22% QoQ; +14% YoY) Revenues at highest level since comparisons possible in FY2016/17 as we executed multiple M&A and ECM deals and revenues rose QoQ in all regions Advisory—Progress with monetization of deals mainly in Japan, EMEA, and the Americas; involved in several financial sponsor and cross-border deals Financing and Solutions, etc1—ECM: Revenues grew further from strong prior quarter on deals related to unwinding of cross shareholdings and support for several large POs and IPOs; retained top spot in Japan-related ECM league table2—ALF: Revenues rose on contributions from several refinance and acquisition finance deals 13 Net revenue Key points (billions of yen) FY2023/24 FY2024/25 QoQ YoY 3Q 4Q 1Q 2Q 3Q 45.4 49.8 37.2 42.3 51.5 22% 14% Executed high profile deals primarily in robust Japan business Advisory Financing Major transactions Partners Group’s (Switzerland) sale of VSB Group (Germany) to TotalEnergies (France) (€1.6bn) Teva Pharmaceutical Industries’ (Israel) transfer of shareholdings in Teva Takeda Pharma to JKI (Undisclosed) Heiwa’s acquisition of Accordia Golf from PJC Investments’ Fortress Investment Group (US) (Y510.0bn) UBE’s acquisition of Lanxess’s (Germany) Urethane Systems business ($503m) Elyse Energy’s (France) equity private placement (€120m) Kaken Pharmaceutical’s acquisition of FYARRO business from Aadi Bioscience (US) ($100m) Tokio Marine Holdings’ tender offer to make ID&E Holdings a wholly owned subsidiary (Y141.4bn) Major transactions Kansai Electric Power: PO (Y397.2bn) Tokyo Metro: Global IPO (Y348.6bn) Rigaku Holdings: Global IPO (Y129.1bn) Kioxia Holdings: Global IPO (Y120.4bn) StandardAero (US): IPO ($1.7bn) Afcons Infrastructure (India): IPO (INR54.3bn) Sekisui House: USD bonds ($1.0bn) Republic of Italy: Government bonds (€13.0bn) LBO finance in relation to Hellman & Friedman’s (US) AutoScout24 (Germany) acquisition of Trader (Canada) (€2.5bn) ExamWorks (US): Refinance ($2.5bn) LBO finance in relation to CVC Capital Partners’ (US) acquisition of Therakos (US) ($670m) Involved in many ECM and ALF deals tailored to client needs Won several cross-border deals via interregional collaboration
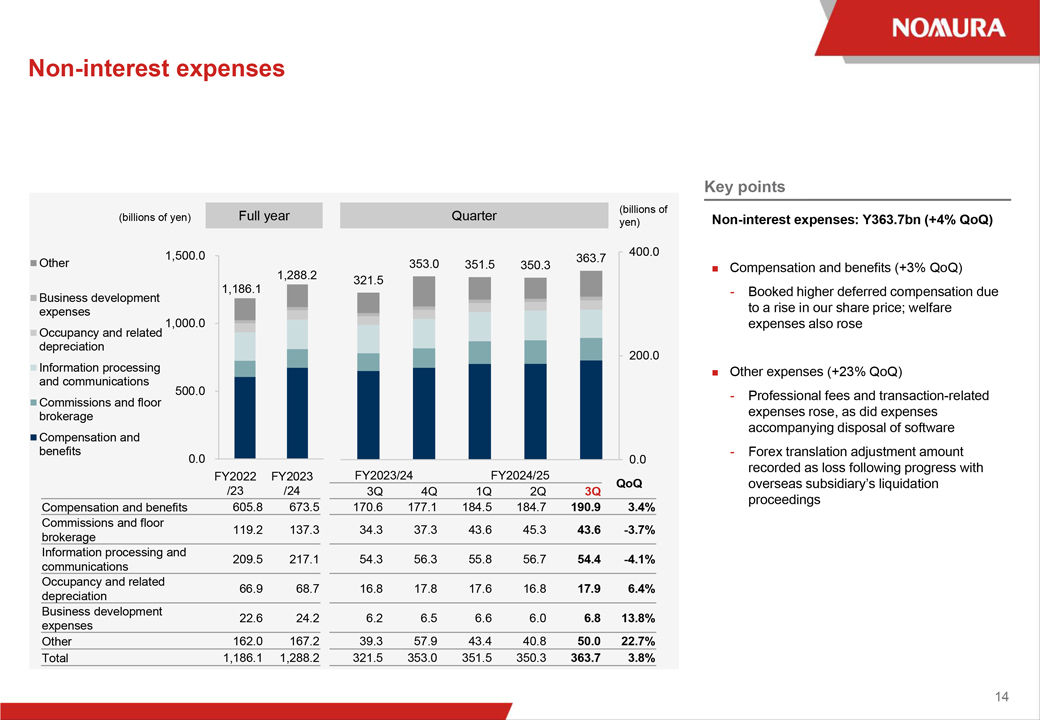 |
Non-interest expenses: Y363.7bn (+4% QoQ) Compensation and benefits (+3% QoQ)—Booked higher deferred compensation due to a rise in our share price; welfare expenses also rose Other expenses (+23% QoQ)—Professional fees and transaction-related expenses rose, as did expenses accompanying disposal of software—Forex translation adjustment amount recorded as loss following progress with overseas subsidiary’s liquidation proceedings Non-interest expenses 14 Key points FY2022 /23 FY2023 /24 FY2023/24 FY2024/25 3Q 4Q 1Q 2Q 3Q QoQ Compensation and benefits 605.8 673.5 170.6 177.1 184.5 184.7 190.9 3.4% Commissions and floor brokerage 119.2 137.3 34.3 37.3 43.6 45.3 43.6 -3.7% Information processing and communications 209.5 217.1 54.3 56.3 55.8 56.7 54.4 -4.1% Occupancy and related depreciation 66.9 68.7 16.8 17.8 17.6 16.8 17.9 6.4% Business development expenses 22.6 24.2 6.2 6.5 6.6 6.0 6.8 13.8% Other 162.0 167.2 39.3 57.9 43.4 40.8 50.0 22.7% Total 1,186.1 1,288.2 321.5 353.0 351.5 350.3 363.7 3.8% Full year Quarter 321.5 353.0 351.5 350.3 363.7 0.0 200.0 400.0 (billions of yen) (billions of yen) 1,186.1 1,288.2 0.0 500.0 1,000.0 Other 1,500.0 Business development expenses Occupancy and related depreciation Information processing and communications Commissions and floor brokerage Compensation and benefits
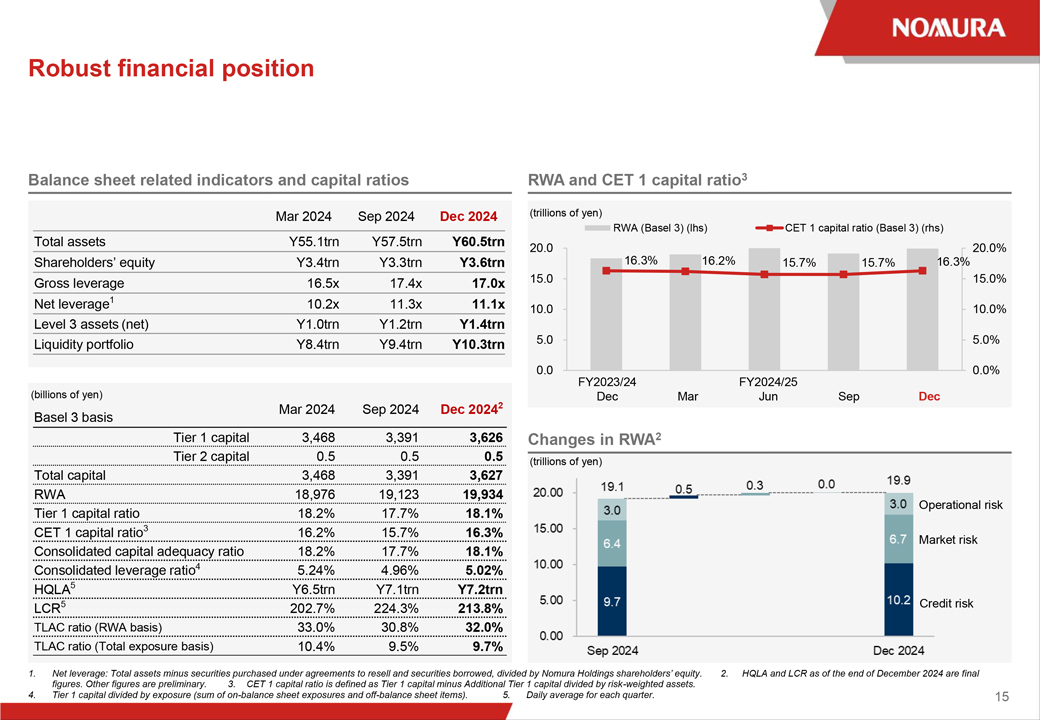 |
Robust financial position 1. Net leverage: Total assets minus securities purchased under agreements to resell and securities borrowed, divided by Nomura Holdings shareholders’ equity. 2. HQLA and LCR as of the end of December 2024 are final figures. Other figures are preliminary. 3. CET 1 capital ratio is defined as Tier 1 capital minus Additional Tier 1 capital divided by risk-weighted assets. 4. Tier 1 capital divided by exposure (sum of on-balance sheet exposures and off-balance sheet items). 5. Daily average for each quarter. 15 Balance sheet related indicators and capital ratios RWA and CET 1 capital ratio3 Changes in RWA2 Mar 2024 Sep 2024 Dec 2024 Total assets Y55.1trn Y57.5trn Y60.5trn Shareholders’ equity Y3.4trn Y3.3trn Y3.6trn Gross leverage 16.5x 17.4x 17.0x Net leverage1 10.2x 11.3x 11.1x Level 3 assets (net) Y1.0trn Y1.2trn Y1.4trn Liquidity portfolio Y8.4trn Y9.4trn Y10.3trn Basel 3 basis Mar 2024 Sep 2024 Dec 20242 Tier 1 capital 3,468 3,391 3,626 Tier 2 capital 0.5 0.5 0.5 Total capital 3,468 3,391 3,627 RWA 18,976 19,123 19,934 Tier 1 capital ratio 18.2% 17.7% 18.1% CET 1 capital ratio3 16.2% 15.7% 16.3% Consolidated capital adequacy ratio 18.2% 17.7% 18.1% Consolidated leverage ratio4 5.24% 4.96% 5.02% HQLA5 Y6.5trn Y7.1trn Y7.2trn LCR5 202.7% 224.3% 213.8% TLAC ratio (RWA basis) 33.0% 30.8% 32.0% TLAC ratio (Total exposure basis) 10.4% 9.5% 9.7% (billions of yen) (trillions of yen) (trillions of yen) Credit risk Operational risk FY2023/24 Dec Mar FY2024/25 Jun Sep Dec Market risk 16.3% 16.2% 15.7% 15.7% 16.3% 0.0% 5.0% 10.0% 15.0% 20.0% 0.0 5.0 10.0 15.0 20.0 RWA (Basel 3) (lhs) CET 1 capital ratio (Basel 3) (rhs)
 |
Financial Supplement
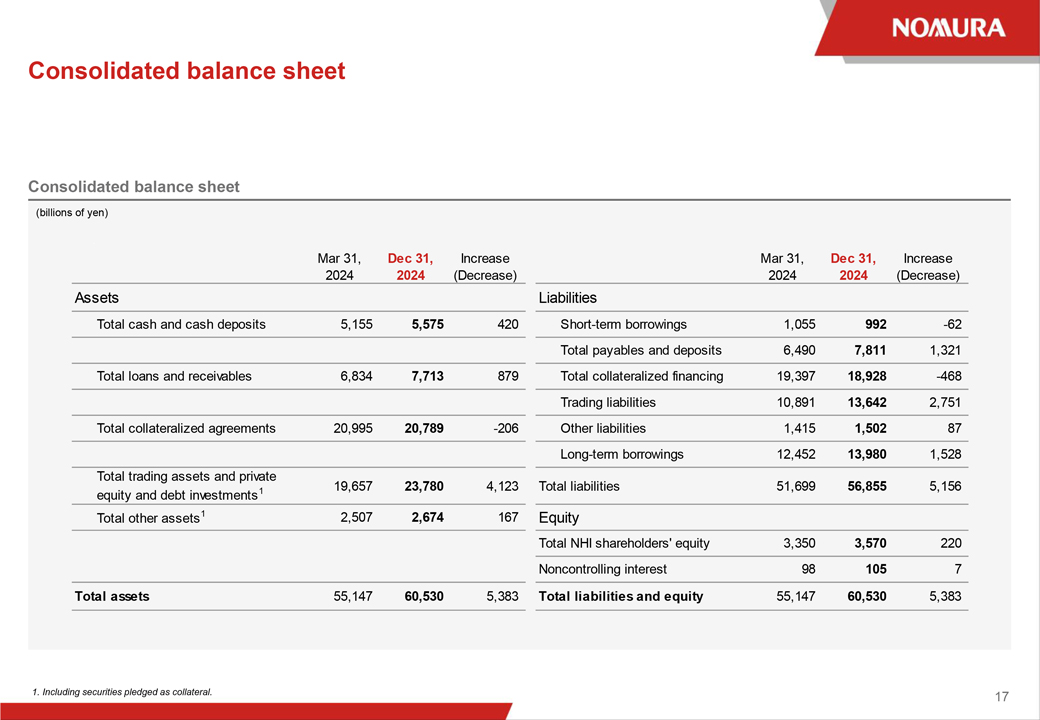 |
Consolidated balance sheet Consolidated balance sheet 1. Including securities pledged as collateral. 17 (billions of yen) Mar 31, 2024 Dec 31, 2024 Increase (Decrease) Mar 31, 2024 Dec 31, 2024 Increase (Decrease) Assets Total cash and cash deposits 5,155 5,575 420 Short-term borrowings 1,055 992 -62 Total payables and deposits 6,490 7,811 1,321 Total loans and receivables 6,834 7,713 879 Total collateralized financing 19,397 18,928 -468 Trading liabilities 10,891 13,642 2,751 Total collateralized agreements 20,995 20,789 -206 Other liabilities 1,415 1,502 87 Long-term borrowings 12,452 13,980 1,528 19,657 23,780 4,123 Total liabilities 51,699 56,855 5,156 Total other assets1 2,507 2,674 167 Equity Total NHI shareholders’ equity 3,350 3,570 220 Noncontrolling interest 98 105 7 Total assets 55,147 60,530 5,383 55,147 60,530 5,383 Total trading assets and private equity and debt investments1 Total liabilities and equity Liabilities
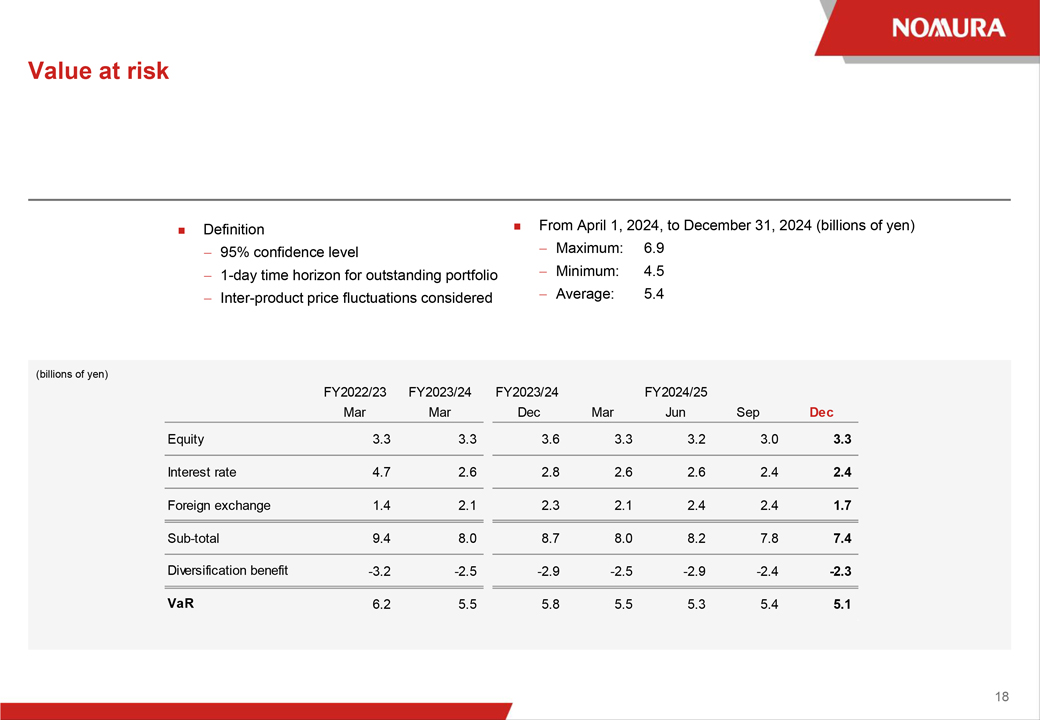 |
Value at risk 18 (billions of yen) Definition—95% confidence level—1-day time horizon for outstanding portfolio—Inter-product price fluctuations considered From April 1, 2024, to December 31, 2024 (billions of yen)—Maximum: 6.9—Minimum: 4.5—Average: 5.4 FY2022/23 FY2023/24 FY2024/25 Mar Mar Dec Mar Jun Sep Dec Equity 3.3 3.3 3.6 3.3 3.2 3.0 3.3 Interest rate 4.7 2.6 2.8 2.6 2.6 2.4 2.4 Foreign exchange 1.4 2.1 2.3 2.1 2.4 2.4 1.7 Sub-total 9.4 8.0 8.7 8.0 8.2 7.8 7.4 -3.2 -2.5 -2.9 -2.5 -2.9 -2.4 -2.3 6.2 5.5 5.8 5.5 5.3 5.4 5.1 FY2023/24 VaR Diversification benefit
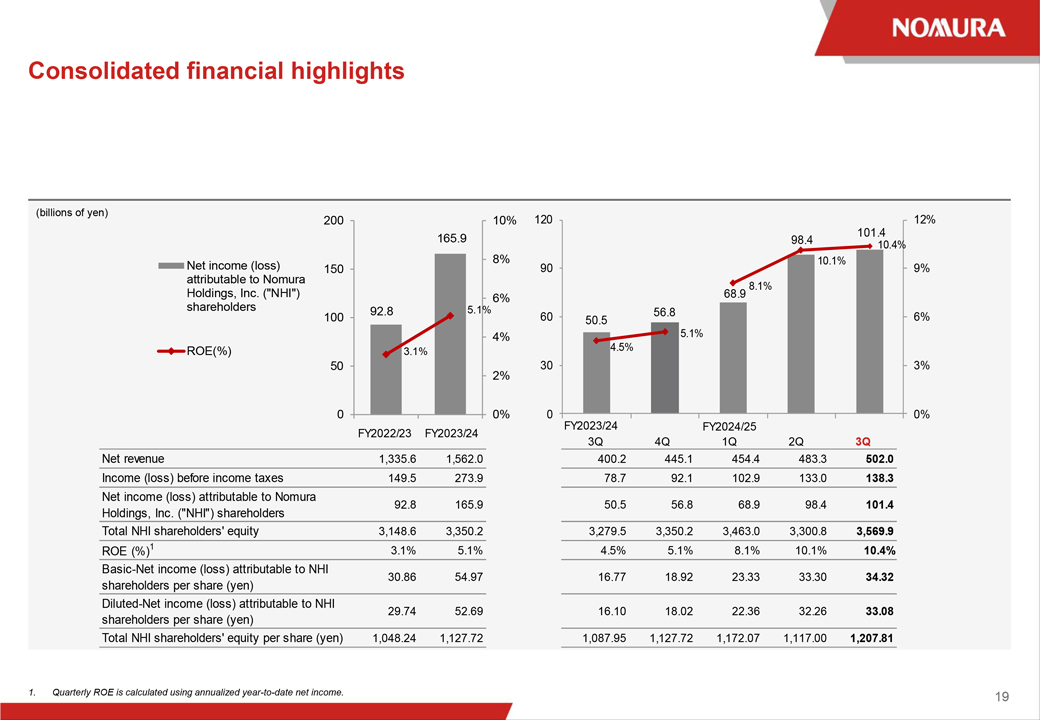 |
Consolidated financial highlights 1. Quarterly ROE is calculated using annualized year-to-date net income. 19 (billions of yen) 50.5 56.8 68.9 98.4 101.4 4.5% 5.1% 8.1% 10.1% 10.4% 0% 3% 6% 9% 12% 0 30 60 90 120 92.8 165.9 3.1% 5.1% 0% 2% 4% 6% 8% 10% 0 50 100 150 200 Net income (loss) attributable to Nomura Holdings, Inc. (“NHI”) shareholders ROE(%) FY2024/25 3Q 4Q 1Q 2Q 3Q Net revenue 1,335.6 1,562.0 400.2 445.1 454.4 483.3 502.0 Income (loss) before income taxes 149.5 273.9 78.7 92.1 102.9 133.0 138.3 Net income (loss) attributable to Nomura Holdings, Inc. (“NHI”) shareholders 92.8 165.9 50.5 56.8 68.9 98.4 101.4 Total NHI shareholders’ equity 3,148.6 3,350.2 3,279.5 3,350.2 3,463.0 3,300.8 3,569.9 ROE (%)1 3.1% 5.1% 4.5% 5.1% 8.1% 10.1% 10.4% Basic-Net income (loss) attributable to NHI shareholders per share (yen) 30.86 54.97 16.77 18.92 23.33 33.30 34.32 Diluted-Net income (loss) attributable to NHI shareholders per share (yen) 29.74 52.69 16.10 18.02 22.36 32.26 33.08 Total NHI shareholders’ equity per share (yen) 1,048.24 1,127.72 1,087.95 1,127.72 1,172.07 1,117.00 1,207.81 FY2022/23 FY2023/24 FY2023/24
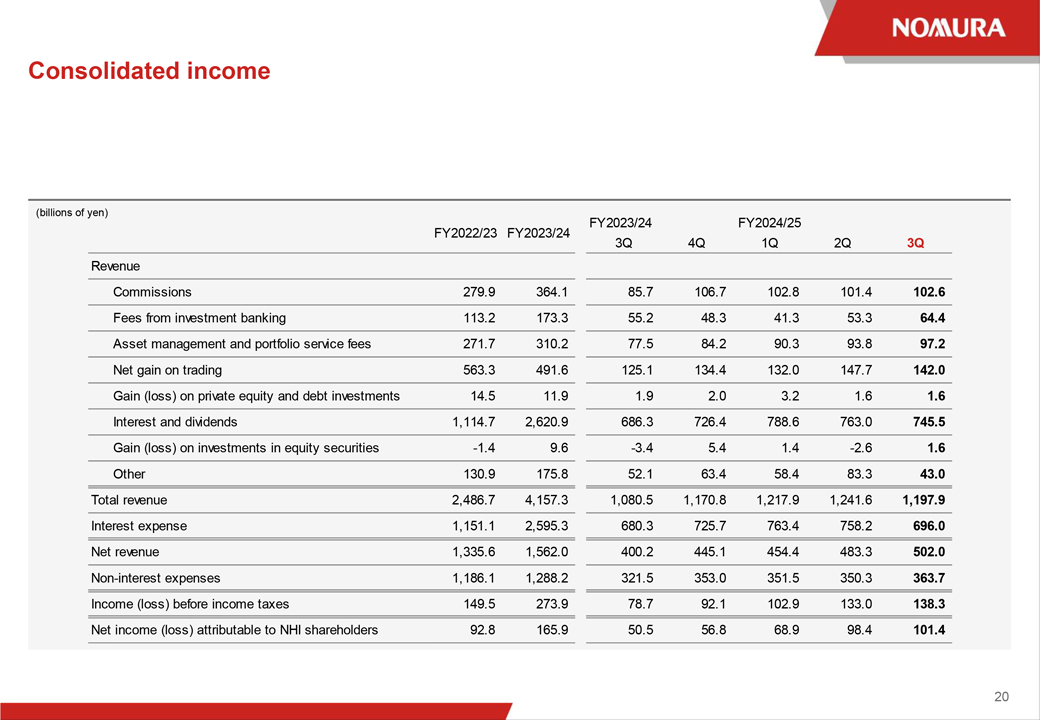 |
Consolidated income 20 (billions of yen) FY2024/25 3Q 4Q 1Q 2Q 3Q Commissions 279.9 364.1 85.7 106.7 102.8 101.4 102.6 Fees from investment banking 113.2 173.3 55.2 48.3 41.3 53.3 64.4 Asset management and portfolio service fees 271.7 310.2 77.5 84.2 90.3 93.8 97.2 Net gain on trading 563.3 491.6 125.1 134.4 132.0 147.7 142.0 Gain (loss) on private equity and debt investments 14.5 11.9 1.9 2.0 3.2 1.6 1.6 Interest and dividends 1,114.7 2,620.9 686.3 726.4 788.6 763.0 745.5 Gain (loss) on investments in equity securities -1.4 9.6 -3.4 5.4 1.4 -2.6 1.6 Other 130.9 175.8 52.1 63.4 58.4 83.3 43.0 2,486.7 4,157.3 1,080.5 1,170.8 1,217.9 1,241.6 1,197.9 1,151.1 2,595.3 680.3 725.7 763.4 758.2 696.0 1,335.6 1,562.0 400.2 445.1 454.4 483.3 502.0 1,186.1 1,288.2 321.5 353.0 351.5 350.3 363.7 149.5 273.9 78.7 92.1 102.9 133.0 138.3 Net income (loss) attributable to NHI shareholders 92.8 165.9 50.5 56.8 68.9 98.4 101.4 FY2022/23 Non-interest expenses FY2023/24 FY2023/24 Income (loss) before income taxes Interest expense Total revenue Revenue Net revenue
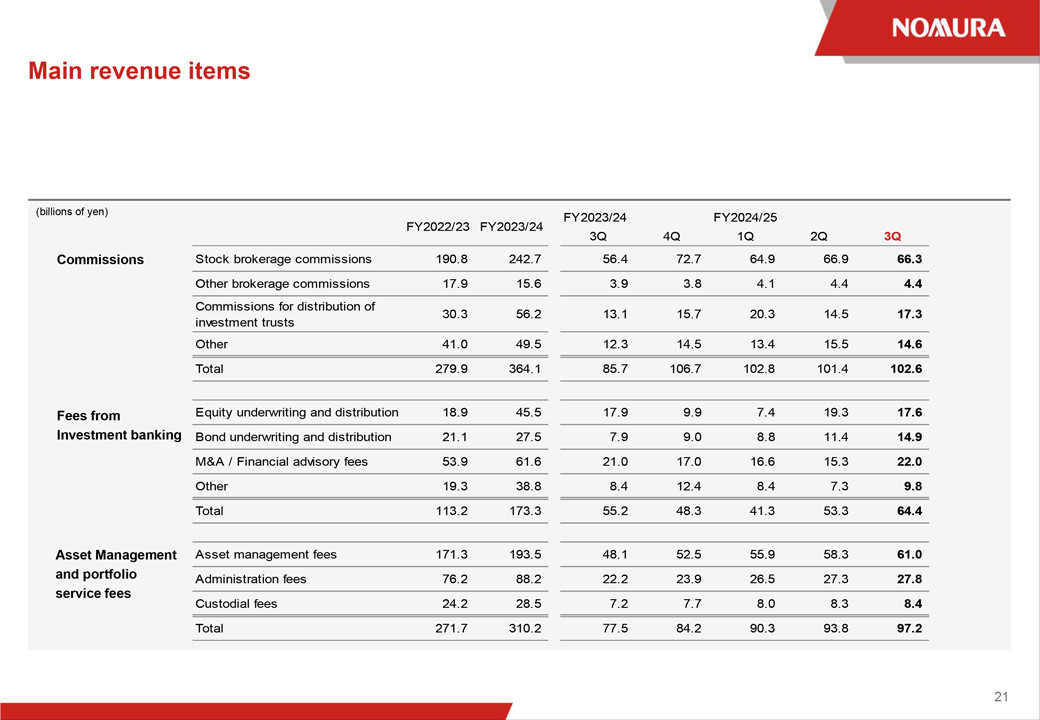 |
Asset Management and portfolio service fees Fees from Investment banking Commissions Main revenue items 21 (billions of yen) FY2024/25 3Q 4Q 1Q 2Q 3Q Stock brokerage commissions 190.8 242.7 56.4 72.7 64.9 66.9 66.3 Other brokerage commissions 17.9 15.6 3.9 3.8 4.1 4.4 4.4 Commissions for distribution of investment trusts 30.3 56.2 13.1 15.7 20.3 14.5 17.3 Other 41.0 49.5 12.3 14.5 13.4 15.5 14.6 Total 279.9 364.1 85.7 106.7 102.8 101.4 102.6 Equity underwriting and distribution 18.9 45.5 17.9 9.9 7.4 19.3 17.6 Bond underwriting and distribution 21.1 27.5 7.9 9.0 8.8 11.4 14.9 M&A / Financial advisory fees 53.9 61.6 21.0 17.0 16.6 15.3 22.0 Other 19.3 38.8 8.4 12.4 8.4 7.3 9.8 Total 113.2 173.3 55.2 48.3 41.3 53.3 64.4 Asset management fees 171.3 193.5 48.1 52.5 55.9 58.3 61.0 Administration fees 76.2 88.2 22.2 23.9 26.5 27.3 27.8 Custodial fees 24.2 28.5 7.2 7.7 8.0 8.3 8.4 Total 271.7 310.2 77.5 84.2 90.3 93.8 97.2 FY2023/24 FY2022/23 FY2023/24
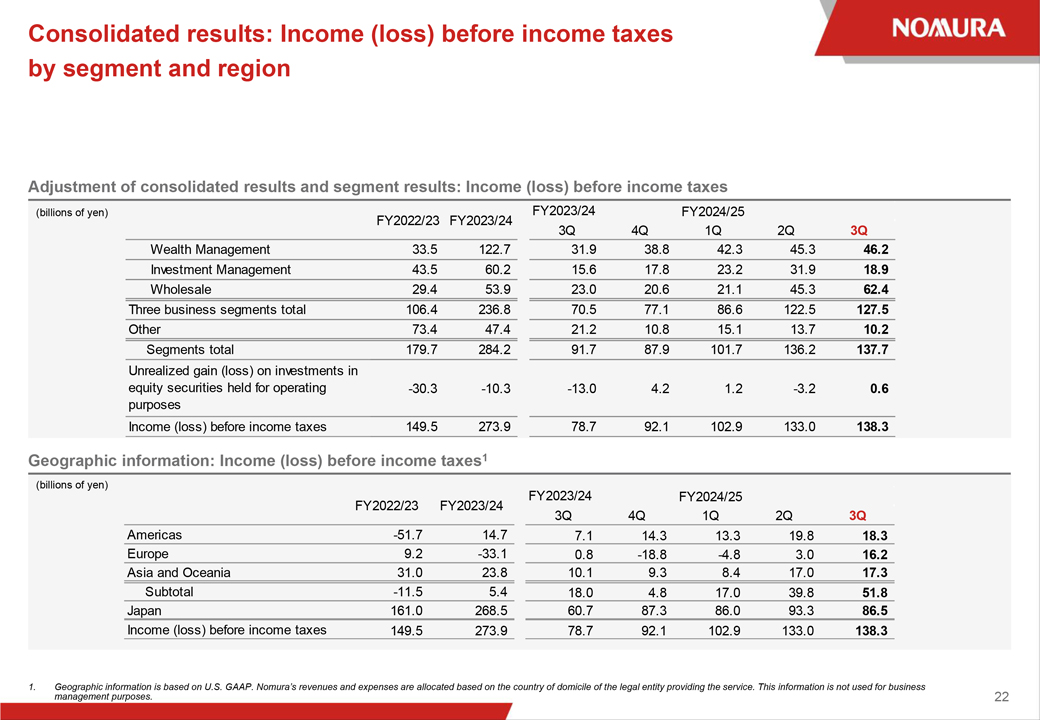 |
Consolidated results: Income (loss) before income taxes by segment and region 1. Geographic information is based on U.S. GAAP. Nomura’s revenues and expenses are allocated based on the country of domicile of the legal entity providing the service. This information is not used for business management purposes. 22 Adjustment of consolidated results and segment results: Income (loss) before income taxes Geographic information: Income (loss) before income taxes1 (billions of yen) (billions of yen) FY2024/25 3Q 4Q 1Q 2Q 3Q Wealth Management 33.5 122.7 31.9 38.8 42.3 45.3 46.2 Investment Management 43.5 60.2 15.6 17.8 23.2 31.9 18.9 Wholesale 29.4 53.9 23.0 20.6 21.1 45.3 62.4 106.4 236.8 70.5 77.1 86.6 122.5 127.5 73.4 47.4 21.2 10.8 15.1 13.7 10.2 179.7 284.2 91.7 87.9 101.7 136.2 137.7 -30.3 -10.3 -13.0 4.2 1.2 -3.2 0.6 Income (loss) before income taxes 149.5 273.9 78.7 92.1 102.9 133.0 138.3 FY2023/24 FY2023/24 Unrealized gain (loss) on investments in equity securities held for operating purposes Three business segments total Segments total Other FY2022/23 FY2024/25 3Q 4Q 1Q 2Q 3Q Americas -51.7 14.7 7.1 14.3 13.3 19.8 18.3 Europe 9.2 -33.1 0.8 -18.8 -4.8 3.0 16.2 Asia and Oceania 31.0 23.8 10.1 9.3 8.4 17.0 17.3 Subtotal -11.5 5.4 18.0 4.8 17.0 39.8 51.8 Japan 161.0 268.5 60.7 87.3 86.0 93.3 86.5 Income (loss) before income taxes 149.5 273.9 78.7 92.1 102.9 133.0 138.3 FY2023/24 FY2022/23 FY2023/24
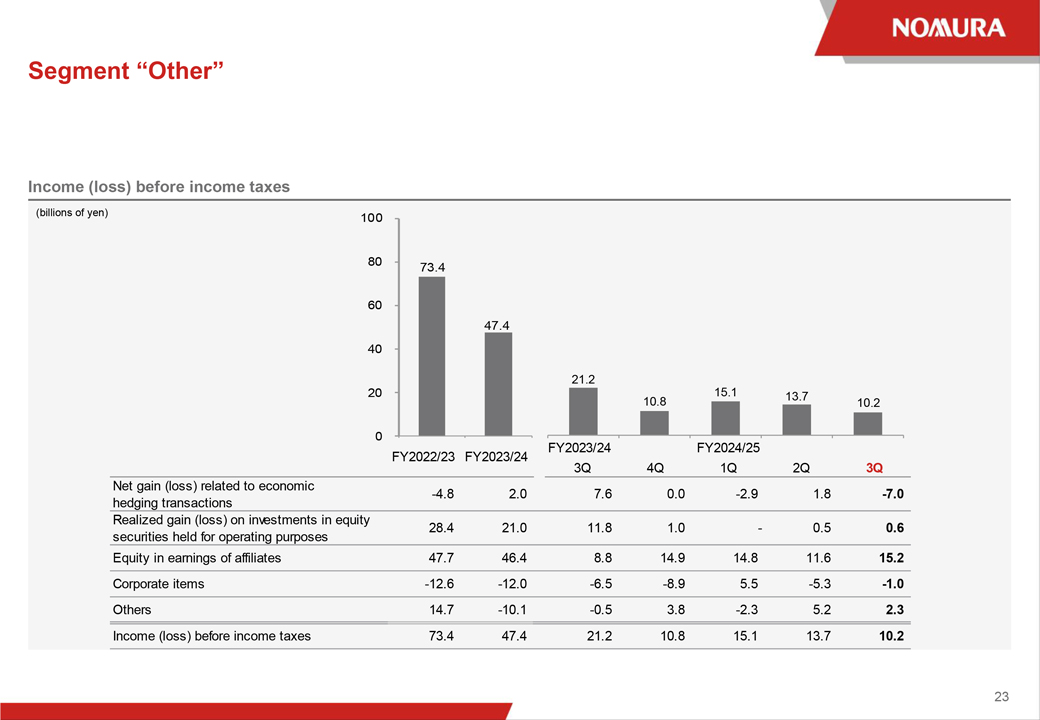 |
Income (loss) before income taxes Segment “Other” 23 (billions of yen) 73.4 47.4 0 20 40 60 80 100 1 2 21.2 10.8 15.1 13.7 10.2 1 2 FY20324/25 4 5 3Q 4Q 1Q 2Q 3Q Net gain (loss) related to economic hedging transactions -4.8 2.0 7.6 0.0 -2.9 1.8 -7.0 Realized gain (loss) on investments in equity securities held for operating purposes 28.4 21.0 11.8 1.0—0.5 0.6 Equity in earnings of affiliates 47.7 46.4 8.8 14.9 14.8 11.6 15.2 Corporate items -12.6 -12.0 -6.5 -8.9 5.5 -5.3 -1.0 Others 14.7 -10.1 -0.5 3.8 -2.3 5.2 2.3 Income (loss) before income taxes 73.4 47.4 21.2 10.8 15.1 13.7 10.2 FY2023/24 FY2022/23 FY2023/24
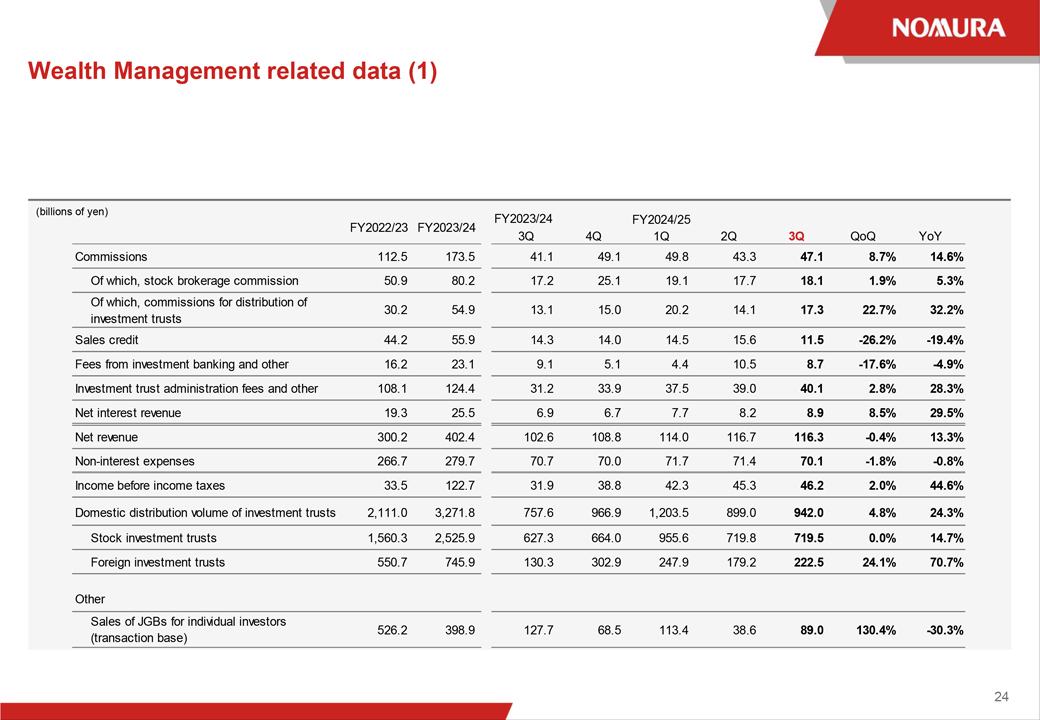 |
Wealth Management related data (1) 24 (billions of yen) FY2024/25 3Q 4Q 1Q 2Q 3Q QoQ YoY Commissions 112.5 173.5 41.1 49.1 49.8 43.3 47.1 8.7% 14.6% Of which, stock brokerage commission 50.9 80.2 17.2 25.1 19.1 17.7 18.1 1.9% 5.3% Of which, commissions for distribution of investment trusts 30.2 54.9 13.1 15.0 20.2 14.1 17.3 22.7% 32.2% Sales credit 44.2 55.9 14.3 14.0 14.5 15.6 11.5 -26.2% -19.4% Fees from investment banking and other 16.2 23.1 9.1 5.1 4.4 10.5 8.7 -17.6% -4.9% Investment trust administration fees and other 108.1 124.4 31.2 33.9 37.5 39.0 40.1 2.8% 28.3% Net interest revenue 19.3 25.5 6.9 6.7 7.7 8.2 8.9 8.5% 29.5% Net revenue 300.2 402.4 102.6 108.8 114.0 116.7 116.3 -0.4% 13.3% Non-interest expenses 266.7 279.7 70.7 70.0 71.7 71.4 70.1 -1.8% -0.8% Income before income taxes 33.5 122.7 31.9 38.8 42.3 45.3 46.2 2.0% 44.6% 2,111.0 3,271.8 757.6 966.9 1,203.5 899.0 942.0 4.8% 24.3% Stock investment trusts 1,560.3 2,525.9 627.3 664.0 955.6 719.8 719.5 0.0% 14.7% Foreign investment trusts 550.7 745.9 130.3 302.9 247.9 179.2 222.5 24.1% 70.7% Sales of JGBs for individual investors (transaction base) 526.2 398.9 127.7 68.5 113.4 38.6 89.0 130.4% -30.3% FY2023/24 FY2022/23 FY2023/24 Other Domestic distribution volume of investment trusts
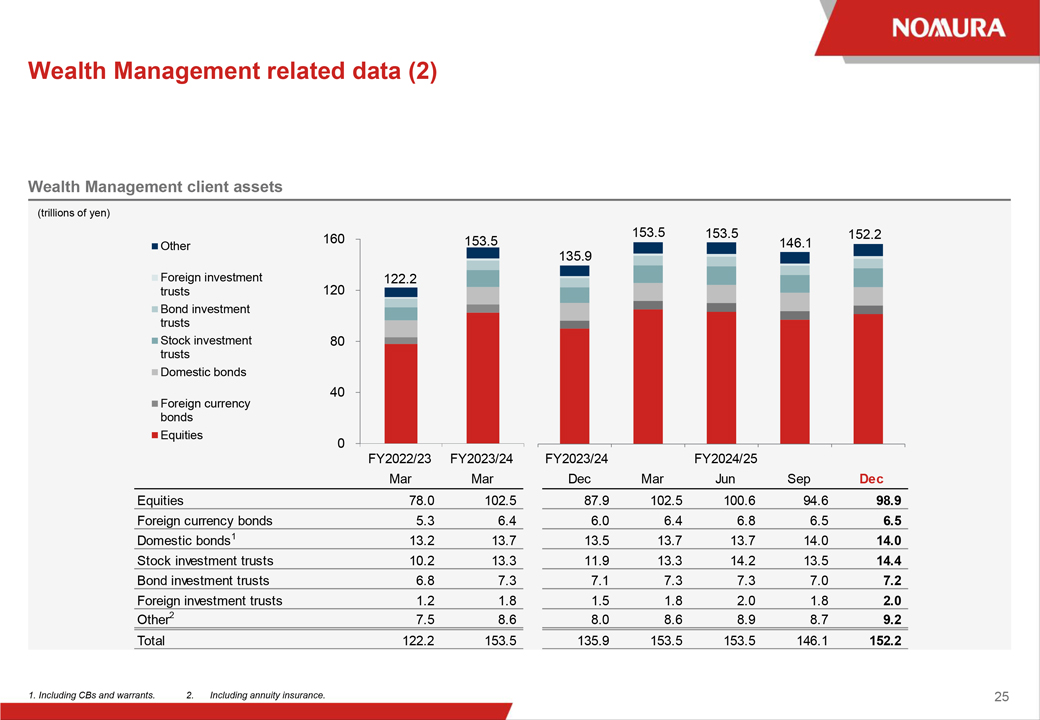 |
Wealth Management client assets Wealth Management related data (2) 1. Including CBs and warrants. 2. Including annuity insurance. 25 (trillions of yen) 122.2 153.5 0 40 80 120 Other 160 Foreign investment trusts Bond investment trusts Stock investment trusts Domestic bonds Foreign currency bonds Equities FY2022/23 FY2023/24 FY2024/25 Mar Mar Dec Mar Jun Sep Dec Equities 78.0 102.5 87.9 102.5 100.6 94.6 98.9 Foreign currency bonds 5.3 6.4 6.0 6.4 6.8 6.5 6.5 Domestic bonds1 13.2 13.7 13.5 13.7 13.7 14.0 14.0 Stock investment trusts 10.2 13.3 11.9 13.3 14.2 13.5 14.4 Bond investment trusts 6.8 7.3 7.1 7.3 7.3 7.0 7.2 Foreign investment trusts 1.2 1.8 1.5 1.8 2.0 1.8 2.0 Other2 7.5 8.6 8.0 8.6 8.9 8.7 9.2 Total 122.2 153.5 135.9 153.5 153.5 146.1 152.2 FY2023/24 135.9 153.5 153.5 146.1 152.2
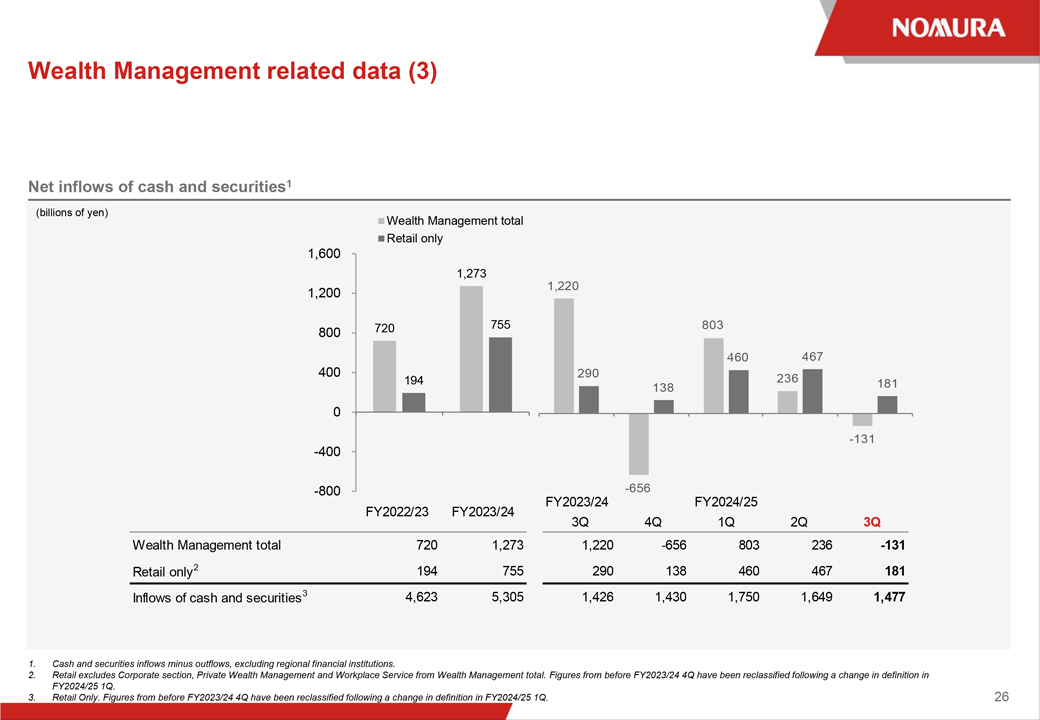 |
Net inflows of cash and securities1 Wealth Management related data (3) 1. Cash and securities inflows minus outflows, excluding regional financial institutions. 2. Retail excludes Corporate section, Private Wealth Management and Workplace Service from Wealth Management total. Figures from before FY2023/24 4Q have been reclassified following a change in definition in FY2024/25 1Q. 3. Retail Only. Figures from before FY2023/24 4Q have been reclassified following a change in definition in FY2024/25 1Q. 26 (billions of yen) 720 1,273 194 755 -800 -400 0 400 800 1,200 1,600 Wealth Management total Retail only FY2023/24 FY2024/25 3Q 4Q 1Q 2Q 3Q Wealth Management total 720 1,273 1,220 -656 803 236 -131 Retail only2 194 755 290 138 460 467 181 Inflows of cash and securities3 4,623 5,305 1,426 1,430 1,750 1,649 1,477 FY2022/23 FY2023/24 1,220 -656 803 236 -131 290 138 460 467 181
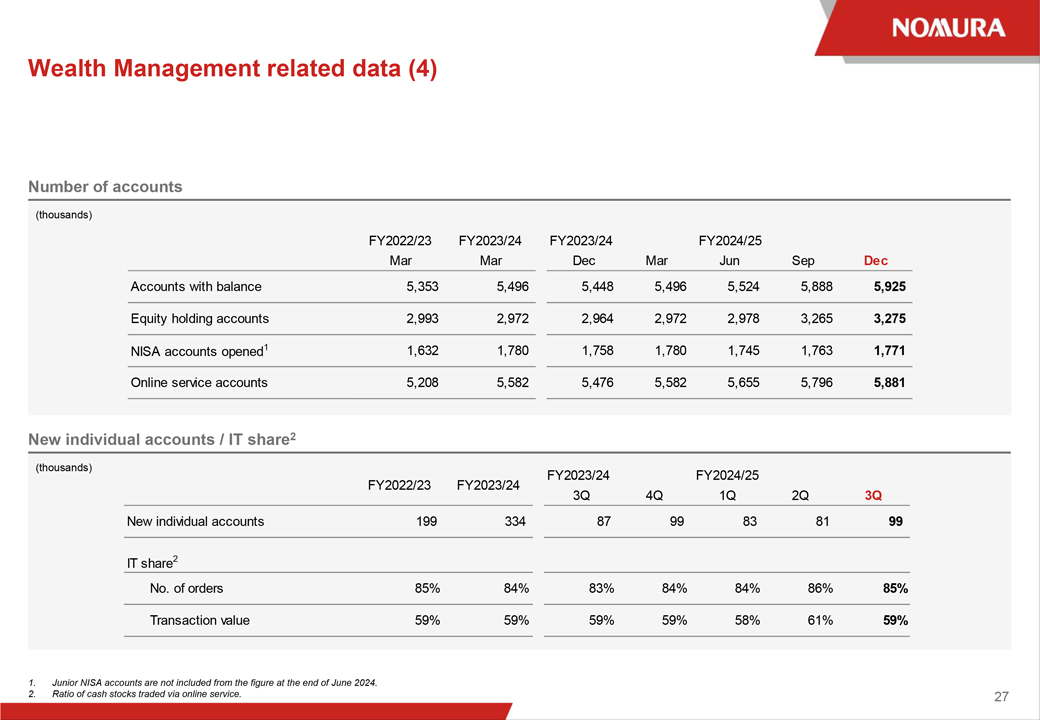 |
Wealth Management related data (4) 1. Junior NISA accounts are not included from the figure at the end of June 2024. 2. Ratio of cash stocks traded via online service. 27 Number of accounts New individual accounts / IT share2 (thousands) (thousands) FY2024/25 3Q 4Q 1Q 2Q 3Q New individual accounts 199 334 87 99 83 81 99 IT share2 No. of orders 85% 84% 83% 84% 84% 86% 85% Transaction value 59% 59% 59% 59% 58% 61% 59% FY2022/23 FY2023/24 FY2023/24 FY2022/23 FY2023/24 FY2024/25 Mar Mar Dec Mar Jun Sep Dec Accounts with balance 5,353 5,496 5,448 5,496 5,524 5,888 5,925 Equity holding accounts 2,993 2,972 2,964 2,972 2,978 3,265 3,275 NISA accounts opened1 1,632 1,780 1,758 1,780 1,745 1,763 1,771 Online service accounts 5,208 5,582 5,476 5,582 5,655 5,796 5,881 FY2023/24
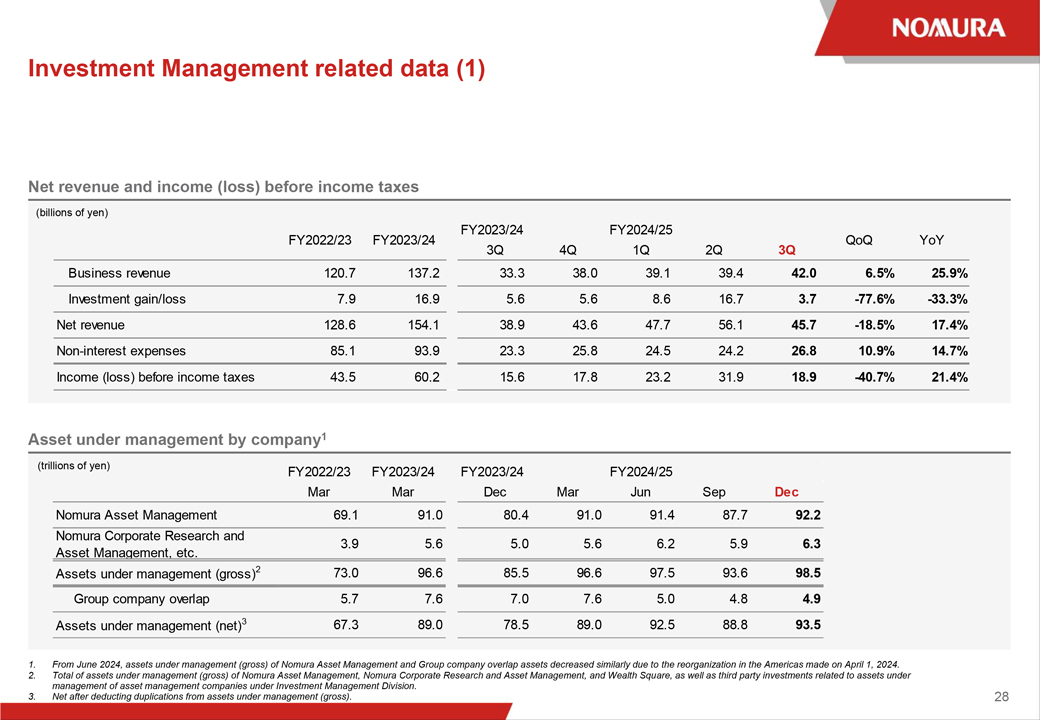 |
Investment Management related data (1) 1. From June 2024, assets under management (gross) of Nomura Asset Management and Group company overlap assets decreased similarly due to the reorganization in the Americas made on April 1, 2024. 2. Total of assets under management (gross) of Nomura Asset Management, Nomura Corporate Research and Asset Management, and Wealth Square, as well as third party investments related to assets under management of asset management companies under Investment Management Division. 3. Net after deducting duplications from assets under management (gross). 28 Net revenue and income (loss) before income taxes Asset under management by company1 (trillions of yen) (billions of yen) FY2024/25 3Q 4Q 1Q 2Q 3Q Business revenue 120.7 137.2 33.3 38.0 39.1 39.4 42.0 6.5% 25.9% Investment gain/loss 7.9 16.9 5.6 5.6 8.6 16.7 3.7 -77.6% -33.3% Net revenue 128.6 154.1 38.9 43.6 47.7 56.1 45.7 -18.5% 17.4% Non-interest expenses 85.1 93.9 23.3 25.8 24.5 24.2 26.8 10.9% 14.7% Income (loss) before income taxes 43.5 60.2 15.6 17.8 23.2 31.9 18.9 -40.7% 21.4% QoQ YoY FY2023/24 FY2022/23 FY2023/24 FY2022/23 FY2023/24 FY2024/25 Mar Mar Dec Mar Jun Sep Dec Nomura Asset Management 69.1 91.0 80.4 91.0 91.4 87.7 92.2 Nomura Corporate Research and Asset Management, etc. 3.9 5.6 5.0 5.6 6.2 5.9 6.3 Assets under management (gross)2 73.0 96.6 85.5 96.6 97.5 93.6 98.5 Group company overlap 5.7 7.6 7.0 7.6 5.0 4.8 4.9 Assets under management (net)3 67.3 89.0 78.5 89.0 92.5 88.8 93.5 FY2023/24
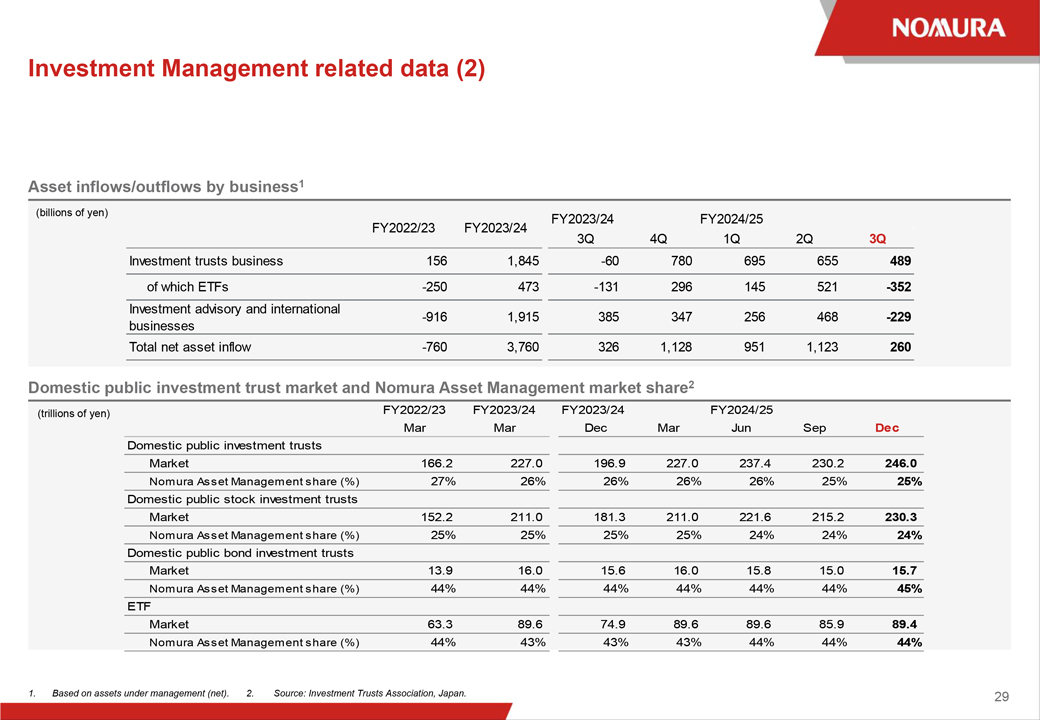 |
Investment Management related data (2) 1. Based on assets under management (net). 2. Source: Investment Trusts Association, Japan. 29 Asset inflows/outflows by business1 Domestic public investment trust market and Nomura Asset Management market share2 (billions of yen) (trillions of yen) FY2024/25 3Q 4Q 1Q 2Q 3Q Investment trusts business 156 1,845 -60 780 695 655 489 of which ETFs -250 473 -131 296 145 521 -352 Investment advisory and international businesses -916 1,915 385 347 256 468 -229 Total net asset inflow -760 3,760 326 1,128 951 1,123 260 FY2023/24 FY2022/23 FY2023/24 FY2022/23 FY2023/24 FY2024/25 Mar Mar Dec Mar Jun Sep Dec Market 166.2 227.0 196.9 227.0 237.4 230.2 246.0 Nomura Asset Management share (%) 27% 26% 26% 26% 26% 25% 25% Market 152.2 211.0 181.3 211.0 221.6 215.2 230.3 Nomura Asset Management share (%) 25% 25% 25% 25% 24% 24% 24% Market 13.9 16.0 15.6 16.0 15.8 15.0 15.7 Nomura Asset Management share (%) 44% 44% 44% 44% 44% 44% 45% Market 63.3 89.6 74.9 89.6 89.6 85.9 89.4 Nomura Asset Management share (%) 44% 43% 43% 43% 44% 44% 44% ETF Domestic public bond investment trusts Domestic public stock investment trusts Domestic public investment trusts FY2023/24
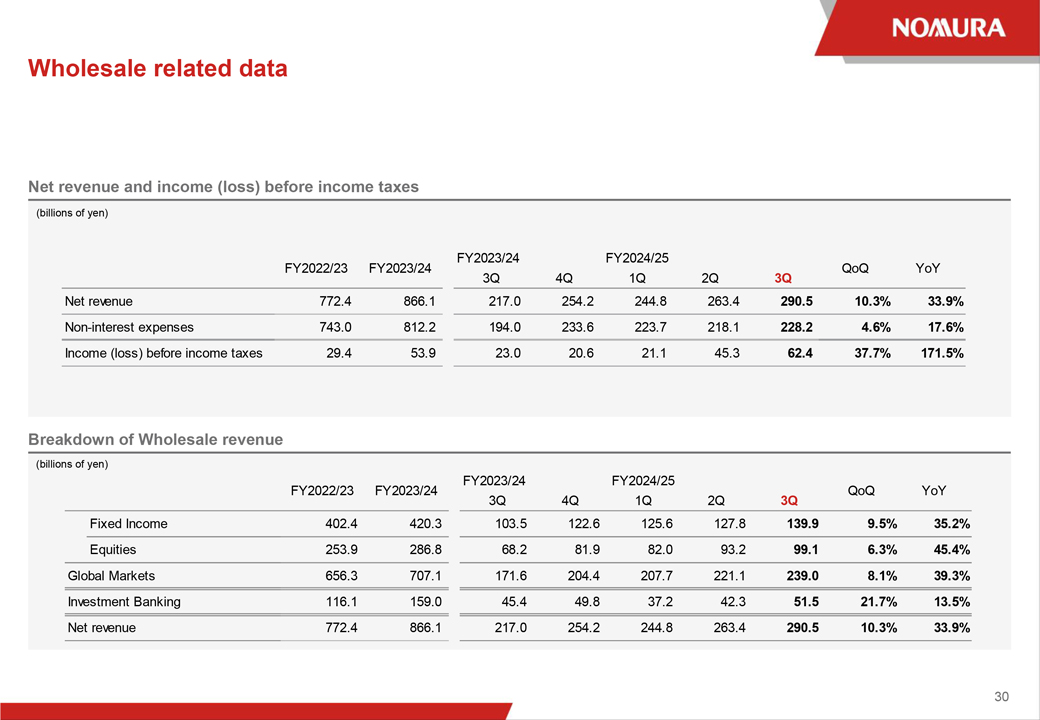 |
Wholesale related data 30 Net revenue and income (loss) before income taxes Breakdown of Wholesale revenue (billions of yen) (billions of yen) FY2024/25 3Q 4Q 1Q 2Q 3Q Net revenue 772.4 866.1 217.0 254.2 244.8 263.4 290.5 10.3% 33.9% Non-interest expenses 743.0 812.2 194.0 233.6 223.7 218.1 228.2 4.6% 17.6% Income (loss) before income taxes 29.4 53.9 23.0 20.6 21.1 45.3 62.4 37.7% 171.5% FY2022/23 FY2023/24 QoQ YoY FY2023/24 FY2024/25 3Q 4Q 1Q 2Q 3Q Fixed Income 402.4 420.3 103.5 122.6 125.6 127.8 139.9 9.5% 35.2% Equities 253.9 286.8 68.2 81.9 82.0 93.2 99.1 6.3% 45.4% 656.3 707.1 171.6 204.4 207.7 221.1 239.0 8.1% 39.3% 116.1 159.0 45.4 49.8 37.2 42.3 51.5 21.7% 13.5% 772.4 866.1 217.0 254.2 244.8 263.4 290.5 10.3% 33.9% FY2023/24 FY2022/23 FY2023/24 QoQ YoY Net revenue Global Markets Investment Banking
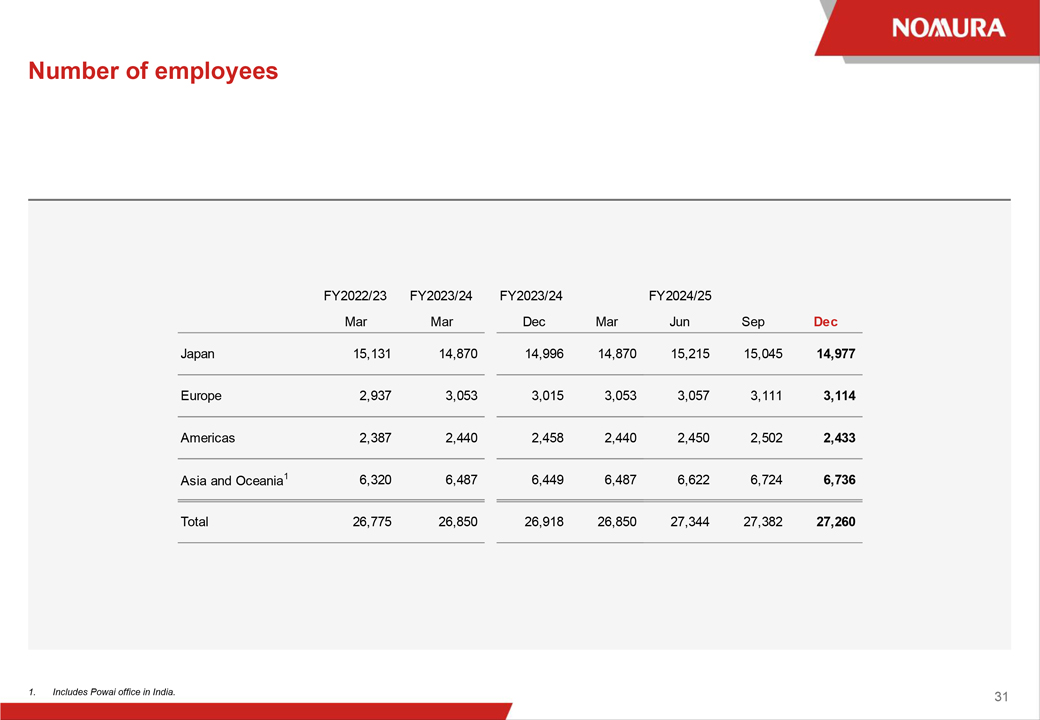 |
Number of employees 1. Includes Powai office in India. 31 FY2022/23 FY2023/24 FY2024/25 Mar Mar Dec Mar Jun Sep Dec Japan 15,131 14,870 14,996 14,870 15,215 15,045 14,977 Europe 2,937 3,053 3,015 3,053 3,057 3,111 3,114 Americas 2,387 2,440 2,458 2,440 2,450 2,502 2,433 Asia and Oceania1 6,320 6,487 6,449 6,487 6,622 6,724 6,736 Total 26,775 26,850 26,918 26,850 27,344 27,382 27,260 FY2023/24
 |
Disclaimer This document is produced by Nomura Holdings, Inc. (“Nomura”). Nothing in this document shall be considered as an offer to sell or solicitation of an offer to buy any security, commodity or other instrument, including securities issued by Nomura or any affiliate thereof. Offers to sell, sales, solicitations to buy, or purchases of any securities issued by Nomura or any affiliate thereof may only be made or entered into pursuant to appropriate offering materials or a prospectus prepared and distributed according to the laws, regulations, rules and market practices of the jurisdictions in which such offers or sales may be made. The information and opinions contained in this document have been obtained from sources believed to be reliable, but no representations or warranty, express or implied, are made that such information is accurate or complete and no responsibility or liability can be accepted by Nomura for errors or omissions or for any losses arising from the use of this information. All rights regarding this document are reserved by Nomura unless otherwise indicated. No part of this document shall be reproduced, stored in a retrieval system or transmitted in any form or by any means, electronic, mechanical, photocopying, recording or otherwise, without the prior written permission of Nomura. This document contains statements that may constitute, and from time to time our management may make “forward-looking statements” within the meaning of the safe harbor provisions of The Private Securities Litigation Reform Act of 1995. Any such statements must be read in the context of the offering materials pursuant to which any securities may be offered or sold in the United States. These forward-looking statements are not historical facts but instead represent only our belief regarding future events, many of which, by their nature, are inherently uncertain and outside our control. Actual results and financial condition may differ, possibly materially, from what is indicated in those forward-looking statements. You should not place undue reliance on any forward-looking statement and should consider all of the following uncertainties and risk factors, as well as those more fully discussed under Nomura’s most recent Annual Report on Form 20-F and other reports filed with the U.S. Securities and Exchange Commission (“SEC”) that are available on Nomura’s website (https://www.nomura.com) and on the SEC‘s website (https://www.sec.gov); Important risk factors that could cause actual results to differ from those in specific forward-looking statements include, without limitation, economic and market conditions, political events and investor sentiments, liquidity of secondary markets, level and volatility of interest rates, currency exchange rates, security valuations, competitive conditions and size, and the number and timing of transactions. Forward-looking statements speak only as of the date they are made, and Nomura undertakes no obligation to update any forward-looking statement to reflect the impact of circumstances or events that arise after the date the forward-looking statement was made. The consolidated financial information in this document is unaudited.
 |
Nomura Holdings, Inc. www.nomura.com