Free signup for more
- Track your favorite companies
- Receive email alerts for new filings
- Personalized dashboard of news and more
- Access all data and search results
Filing tables
Filing exhibits
Related financial report
SPFI similar filings
- 15 Dec 23 Other Events
- 24 Oct 23 South Plains Financial, Inc. Reports Third Quarter 2023 Financial Results
- 19 Oct 23 South Plains Financial, Inc. Declares Quarterly Cash Dividend
- 25 Jul 23 South Plains Financial, Inc. Reports Second Quarter 2023 Financial Results
- 20 Jul 23 South Plains Financial, Inc. Declares Quarterly Cash Dividend
- 22 May 23 Submission of Matters to a Vote of Security Holders
- 5 May 23 South Plains Financial, Inc. Announces Stock Repurchase Program
Filing view
External links
Exhibit 99.2

South Plains Financial Second Quarter 2023 Earnings Presentation July 25, 2023
Safe Harbor Statement and Other Disclosures FORWARD-LOOKING STATEMENTS This presentation contains, and future oral and written statements of South Plains Financial, Inc. (“South Plains” or the “Company” or “SPFI”) and City Bank (“City Bank” or the “Bank”) may contain, statements about future events that constitute forward-looking statements within the meaning of the Private Securities Litigation Reform Act of 1995. These forward-looking statements reflect South Plains’ current views with respect to future events and South Plains’ financial performance. Any statements about South Plains’ expectations, beliefs, plans, predictions, forecasts, objectives, assumptions or future events or performance are not historical facts and may be forward-looking. These statements are often, but not always, made through the use of words or phrases such as “anticipate,” “believes,” “can,” “could,” “may,” “predicts,” “potential,” “should,” “will,” “estimate,” “plans,” “projects,” “continuing,” “ongoing,” “expects,” “intends” and similar words or phrases. Forward-looking statements include, but are not limited to: (i) projections and estimates of revenues, expenses, income or loss, earnings or loss per share, and other financial items, (ii) statements of plans, objectives and expectations of South Plains or its management, (iii) statements of future economic performance, and (iv) statements of assumptions underlying such statements. Forward-looking statements should not be relied on because they involve known and unknown risks, uncertainties and other factors, some of which are beyond the control of South Plains and City Bank. These risks, uncertainties and other factors may cause the actual results, performance, and achievements of South Plains and City Bank to be materially different from the anticipated future results, performance or achievements expressed in, or implied by, the forward-looking statements. Factors that could cause such differences include, but are not limited to, general economic conditions, potential recession in the United States and our market areas, the impacts related to or resulting from recent bank failures and any continuation of the recent uncertainty in the banking industry, including the associated impact to the Company and other financial institutions of any regulatory changes or other mitigation efforts taken by government agencies in response thereto, increased competition for deposits and related changes in deposit customer behavior, changes in market interest rates, the persistence of the current inflationary environment in the United States and our market areas, the uncertain impacts of ongoing quantitative tightening and current and future monetary policies of the Board of Governors of the Federal Reserve System, the effects of declines in housing prices in the Unites States and our market areas, increases in unemployment rates in the United States and our market areas, declines in commercial real estate prices, uncertainty regarding United States fiscal debt and budget matters, severe weather, natural disasters, acts of war or terrorism or other external events, regulatory considerations, competition and market expansion opportunities, changes in non-interest expenditures or in the anticipated benefits of such expenditures, the receipt of required regulatory approvals, changes in non-performing assets and charge-offs, adequacy of loan loss reserves, changes in tax laws, current or future litigation, regulatory examinations or other legal and/or regulatory actions, the impact of any tariffs, terrorist threats and attacks, acts of war or threats thereof or other pandemics. Due to these and other possible uncertainties and risks, South Plains can give no assurance that the results contemplated in the forward-looking statements will be realized and readers are cautioned not to place undue reliance on the forward-looking statements contained in this presentation. For more information about these factors, please see South Plains’ reports filed with or furnished to the U.S. Securities and Exchange Commission (the “SEC”), including South Plains’ most recent Annual Report on Form 10-K and Quarterly Reports on Form 10-Q on file with the SEC, including the sections entitled "Risk Factors" and "Management's Discussion and Analysis of Financial Condition and Results of Operations." Further, any forward-looking statement speaks only as of the date on which it is made and South Plains undertakes no obligation to update or revise any forward-looking statement to reflect events or circumstances after the date on which the statement is made or to reflect the occurrence of unanticipated events, except as required by law. All forward-looking statements, express or implied, herein are qualified in their entirety by this cautionary statement. NON-GAAP FINANCIAL MEASURES Management believes that certain non-GAAP performance measures used in this presentation provide meaningful information about underlying trends in its business and operations and provide both management and investors a more complete understanding of the Company’s financial position and performance. Non-GAAP financial measures should be viewed in addition to, and not as an alternative for, SPFI’s reported results prepared in accordance with GAAP. Numbers in this presentation may not sum due to rounding. 2

Today’s Speakers Curtis C. Griffith Chairman & Chief Executive Officer Elected to the board of directors of First State Bank of Morton, Texas, in 1972 and employed by it in 1979 Elected Chairman of the First State Bank of Morton board in 1984 Chairman of the Board of City Bank and the Company since 1993 Steven B. Crockett Chief Financial Officer & Treasurer Appointed Chief Financial Officer in 2015 Previously Controller of City Bank and the Company for 14 and 5 years respectively Began career in public accounting in 1994 by serving for seven years with a local firm in Lubbock, Texas Cory T. Newsom President Entire banking career with the Company focused on lending and operations Appointed President and Chief Executive Officer of the Bank in 2008 Joined the Board in 2008 3

Second Quarter 2023 Highlights Diluted earnings per share for the second quarter was $1.71, compared to $0.53 for the first quarter of 2023 Excluding one-time gains and charges related to the sale of Windmark Insurance Agency, Inc. (“Windmark”) and the repositioning of the securities portfolio, second quarter diluted earnings per share was $0.55 Loans grew $190.4 million, or 6.8%, during the second quarter as compared to the first quarter of 2023 Deposits grew $66.5 million, or 1.9%, during the second quarter as compared to the first quarter of 2023 Net Interest Margin held steady from March 2023 levels at 3.65% as higher loan yields offset the rise in deposit costs Completed the sale of Windmark for $35.5 million on April 1, 2023 Offset a portion of the Windmark gain through the strategic sale of $56 million of our investment securities resulting in a realized loss of $3.4 million. Reinvested those proceeds in higher yielding loans which will be accretive in subsequent quarters Recorded a $3.7 million provision for credit losses in the second quarter due to strong organic loan growth and $1.3 million in specific reserves for a previously-classified credit relationship totaling $13.3 million that was placed on nonaccrual in May 2023 Classified loans declined $3.5 million during the second quarter to $67.4 million from $70.9 million at March 31, 2023 Deposit Growth 1.9% Uninsured / Uncollaterized Deposits 16% Net Income $29.7 M EPS - Diluted $1.71 Net Interest Margin (1) (“NIM”) 3.65% Average Yield on Loans 5.94% 4 Source: Company documents Net interest margin is calculated on a tax-equivalent basis Organic Loan Growth 6.8% Loans Held for Investment (“HFI”) $2.98 B
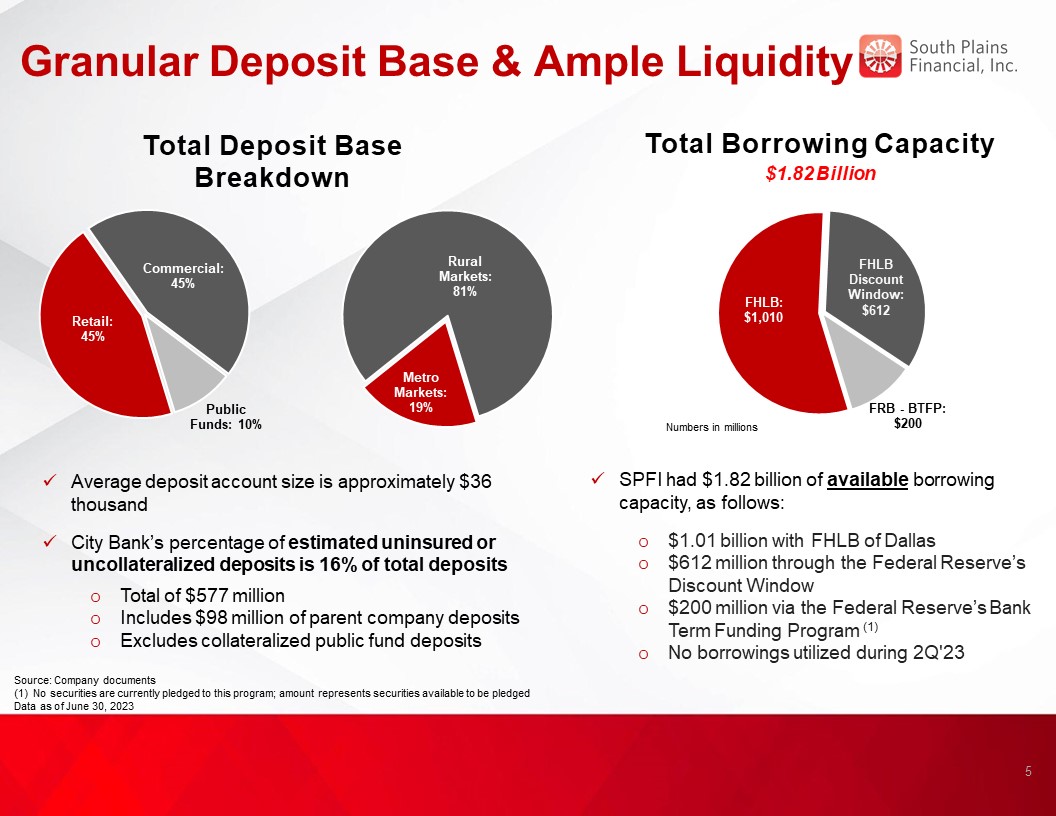
Granular Deposit Base & Ample Liquidity Total Borrowing Capacity $1.82 Billion Source: Company documents (1) No securities are currently pledged to this program; amount represents securities available to be pledged Data as of June 30, 2023 5 Total Deposit Base Breakdown Average deposit account size is approximately $36 thousand City Bank’s percentage of estimated uninsured or uncollateralized deposits is 16% of total deposits Total of $577 million Includes $98 million of parent company deposits Excludes collateralized public fund deposits SPFI had $1.82 billion of available borrowing capacity, as follows: $1.01 billion with FHLB of Dallas $612 million through the Federal Reserve’s Discount Window $200 million via the Federal Reserve’s Bank Term Funding Program (1) No borrowings utilized during 2Q'23

Loan Portfolio 2Q'23 Highlights Loans HFI increased $190.4 million from 1Q'23, primarily due to organic net loan growth Organic net loan growth was primarily driven by increases in commercial real estate, residential mortgage and energy loans Loans HFI increased $398.2 million from 2Q’22 2Q'23 yield on loans of 5.94%, an increase of 16 bps compared to 1Q'23 Total Loans HFI $ in Millions Source: Company documents 6

Attractive Markets Poised for Organic Growth El Paso Basin Dallas / Ft. Worth Population of 865,000+ Adjacent in proximity to Juarez, Mexico’s growing industrial center and an estimated population of 1.5 million people Home to four universities including The University of Texas at El Paso Focus on commercial real estate lending Largest MSA in Texas and fourth largest in the nation Steadily expanding population that accounts for over 26% of the state’s population MSA with the largest job growth in 2022 (+5.9%) Attractive location for companies interested in relocating to more efficient economic environments Focus on commercial real estate lending Houston Second largest MSA in Texas and fifth largest in the nation Total Non-Farm Employment was up 5.6% in 2022 compared to 2021 Called the “Energy Capital of the World,” the area also boasts the world’s largest medical center and second busiest port in the U.S Focus on commercial real estate lending Lubbock Basin Population in excess of 320,000 with major industries in agribusiness, education, and trade among others Home of Texas Tech University – enrollment of 40,000 students Focus on community bank approach and expanding local relationships 7

Metropolitan Loan Growth 2Q'23 Highlights Loans HFI in our Dallas, Houston and El Paso metro markets increased 7.3% in 2Q'23 as compared to 1Q’23 Major metropolitan market loan portfolio represents 32% of Bank’s total loans at June 30, 2023 Total Metropolitan Loans $ in Millions 8 5.00% Source: Company documents Source: Company documents The Bank defines its “major metropolitan markets” to include Dallas, Houston and El Paso, Texas
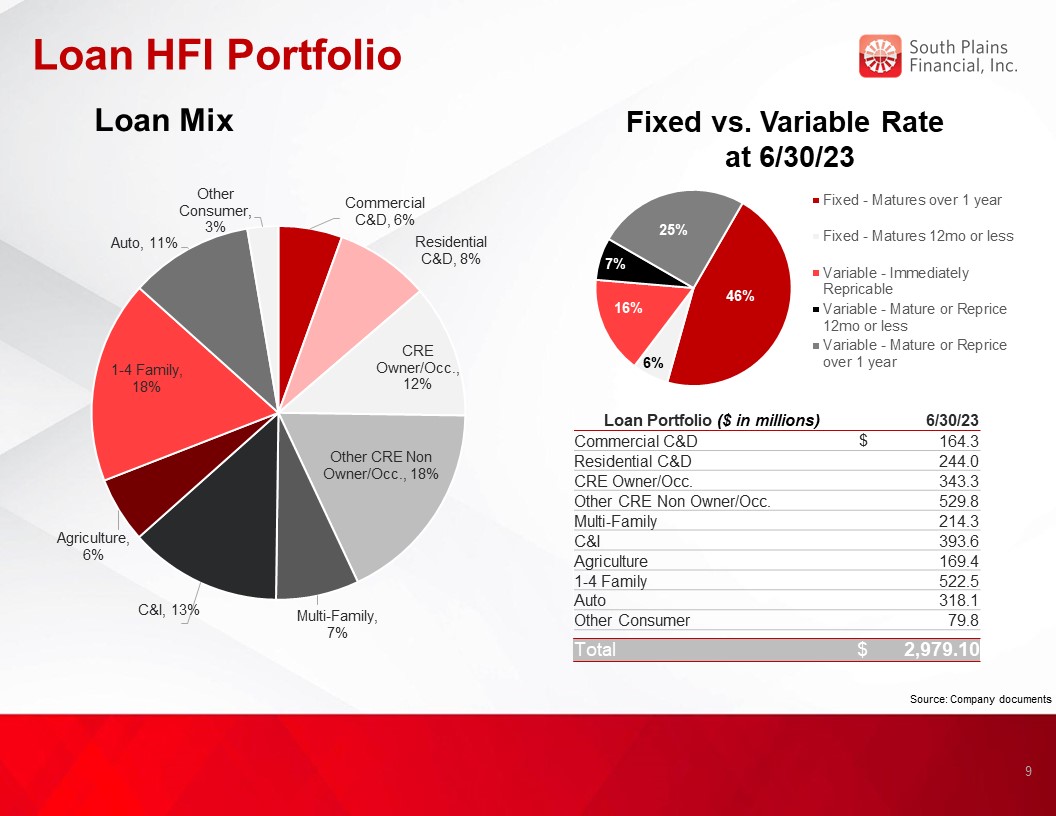
Loan HFI Portfolio Loan Mix Loan Portfolio ($ in millions) 6/30/23 Commercial C&D $ 164.3 Residential C&D 244.0 CRE Owner/Occ. 343.3 Other CRE Non Owner/Occ. 529.8 Multi-Family 214.3 C&I 393.6 Agriculture 169.4 1-4 Family 522.5 Auto 318.1 Other Consumer 79.8 Total $ 2,979.10 Fixed vs. Variable Rate at 6/30/23 9 Source: Company documents
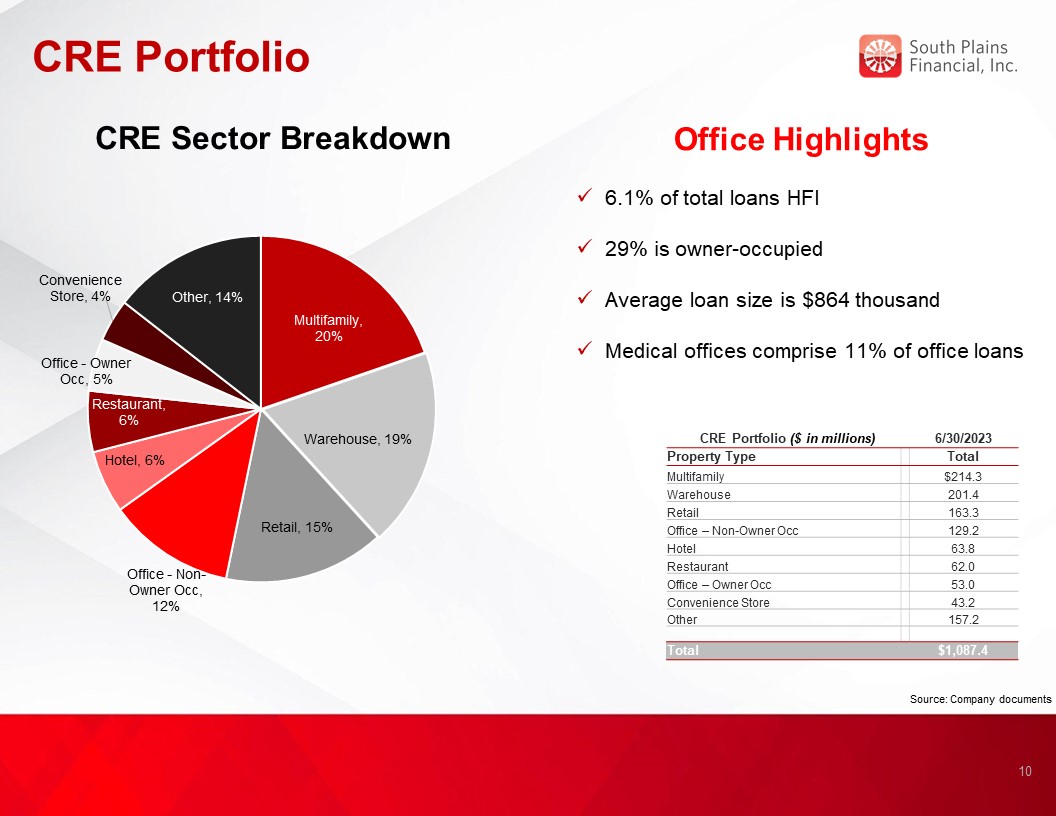
CRE Portfolio 10 Office Highlights 6.1% of total loans HFI 29% is owner-occupied Average loan size is $864 thousand Medical offices comprise 11% of office loans CRE Portfolio ($ in millions) 6/30/2023 Property Type Total Multifamily $214.3 Warehouse 201.4 Retail 163.3 Office – Non-Owner Occ 129.2 Hotel 63.8 Restaurant 62.0 Office – Owner Occ 53.0 Convenience Store 43.2 Other 157.2 Total $1,087.4 CRE Sector Breakdown Source: Company documents
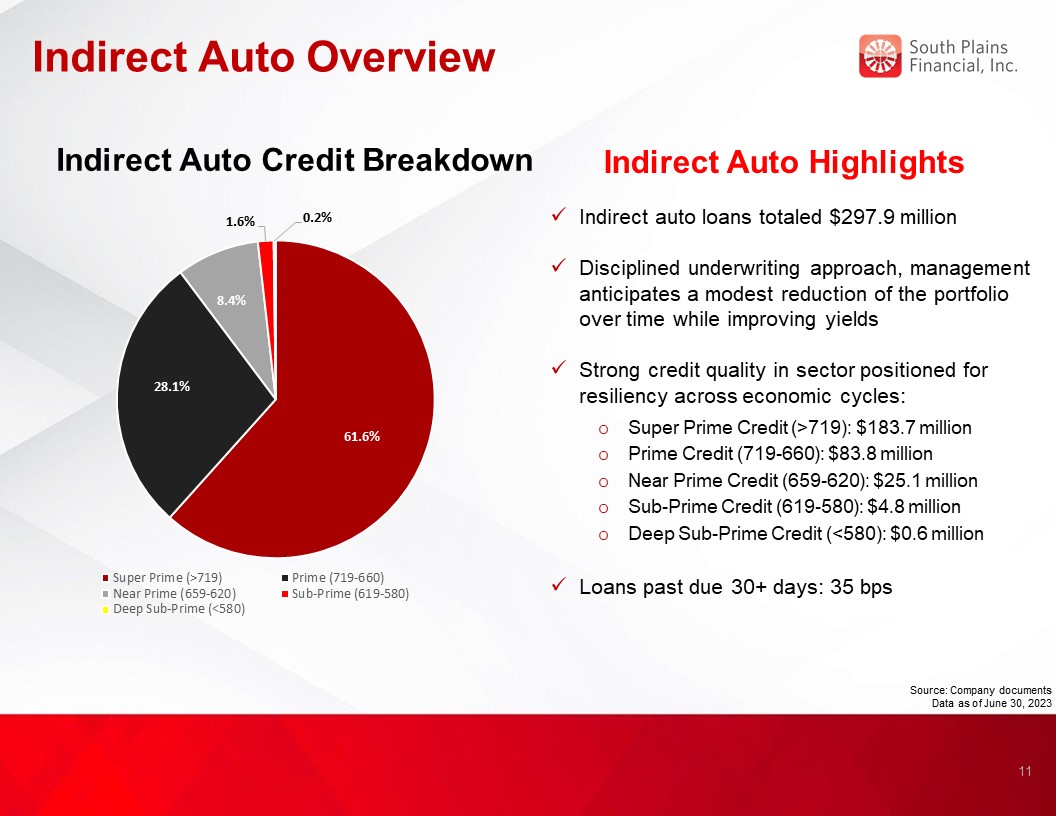
Indirect Auto Overview Indirect Auto Highlights Indirect auto loans totaled $297.9 million Disciplined underwriting approach, management anticipates a modest reduction of the portfolio over time while improving yields Strong credit quality in sector positioned for resiliency across economic cycles: Super Prime Credit (>719): $183.7 million Prime Credit (719-660): $83.8 million Near Prime Credit (659-620): $25.1 million Sub-Prime Credit (619-580): $4.8 million Deep Sub-Prime Credit (<580): $0.6 million Loans past due 30+ days: 35 bps Indirect Auto Credit Breakdown 11 Source: Company documents Data as of June 30, 2023
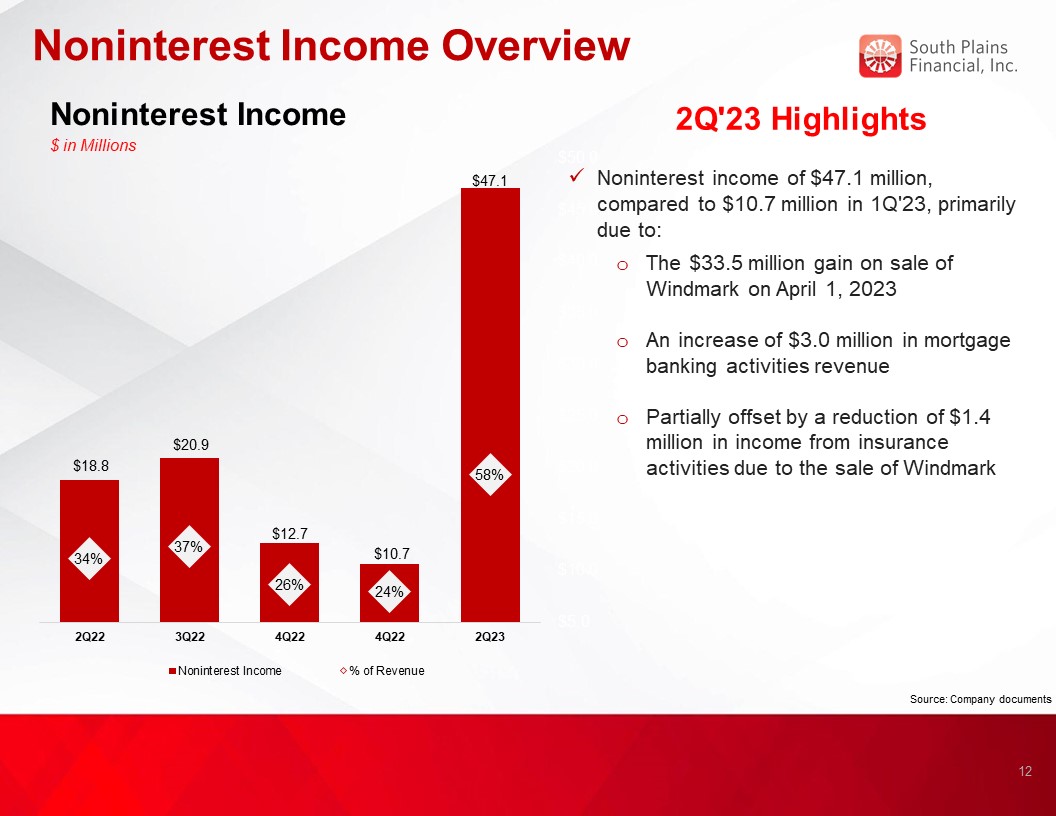
Noninterest Income Overview Noninterest Income $ in Millions 2Q'23 Highlights Noninterest income of $47.1 million, compared to $10.7 million in 1Q'23, primarily due to: The $33.5 million gain on sale of Windmark on April 1, 2023 An increase of $3.0 million in mortgage banking activities revenue Partially offset by a reduction of $1.4 million in income from insurance activities due to the sale of Windmark 12 Source: Company documents

Diversified Revenue Stream Six Months Ended June 30, 2023 Total Revenues $81.7 million Noninterest Income $47.1 million 13 Source: Company documents
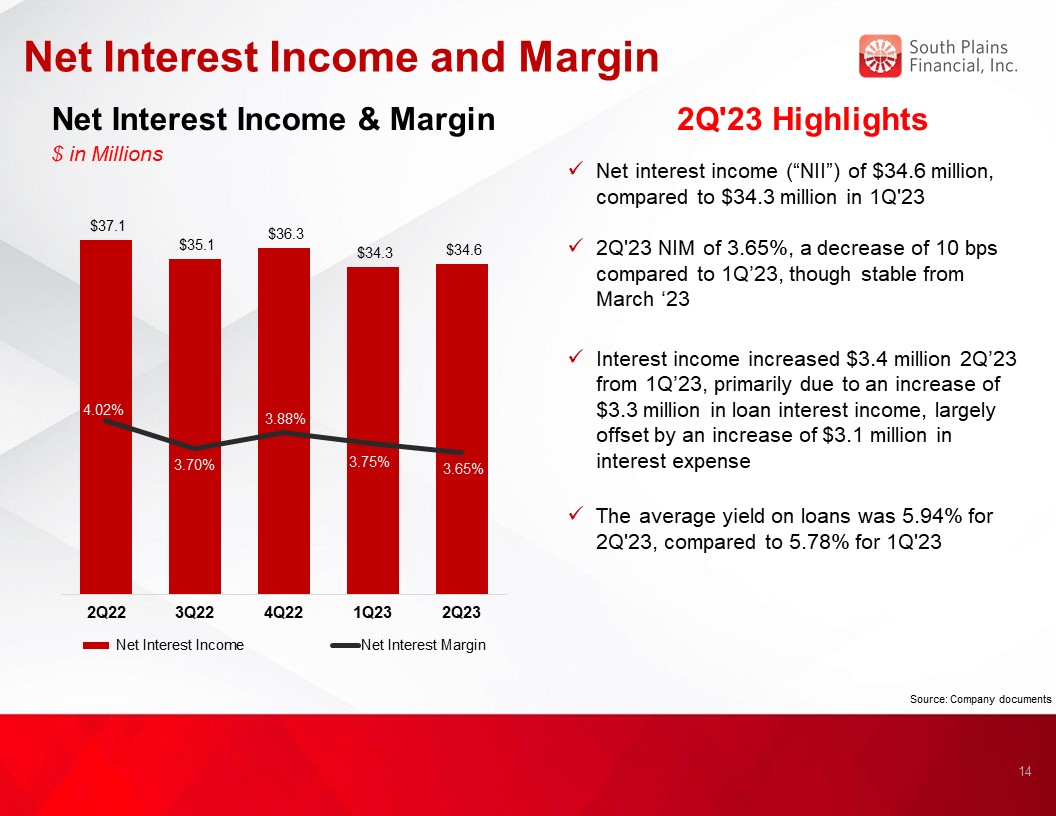
Net Interest Income and Margin Net Interest Income & Margin $ in Millions 2Q'23 Highlights Net interest income (“NII”) of $34.6 million, compared to $34.3 million in 1Q'23 2Q'23 NIM of 3.65%, a decrease of 10 bps compared to 1Q’23, though stable from March ‘23 Interest income increased $3.4 million 2Q’23 from 1Q’23, primarily due to an increase of $3.3 million in loan interest income, largely offset by an increase of $3.1 million in interest expense The average yield on loans was 5.94% for 2Q'23, compared to 5.78% for 1Q'23 14 3.54% Source: Company documents

Deposit Portfolio Total Deposits $ in Millions 2Q'23 Highlights Total deposits of $3.57 billion at 2Q'23, an increase of $66.5 million from 1Q'23 Growth in deposits was driven by an $81 million increase in brokered deposits Partially offset by a $67 million decline in public funds Cost of interest-bearing deposits increased to 2.45% in 2Q'23 from 2.03% in 1Q'23 Average cost of deposits was 169 bps as compared to 136 bps in 1Q'23 Noninterest-bearing deposits to total deposits was 30.8% in 2Q'23, compared to 31.7% in 1Q'23 15 Source: Company documents
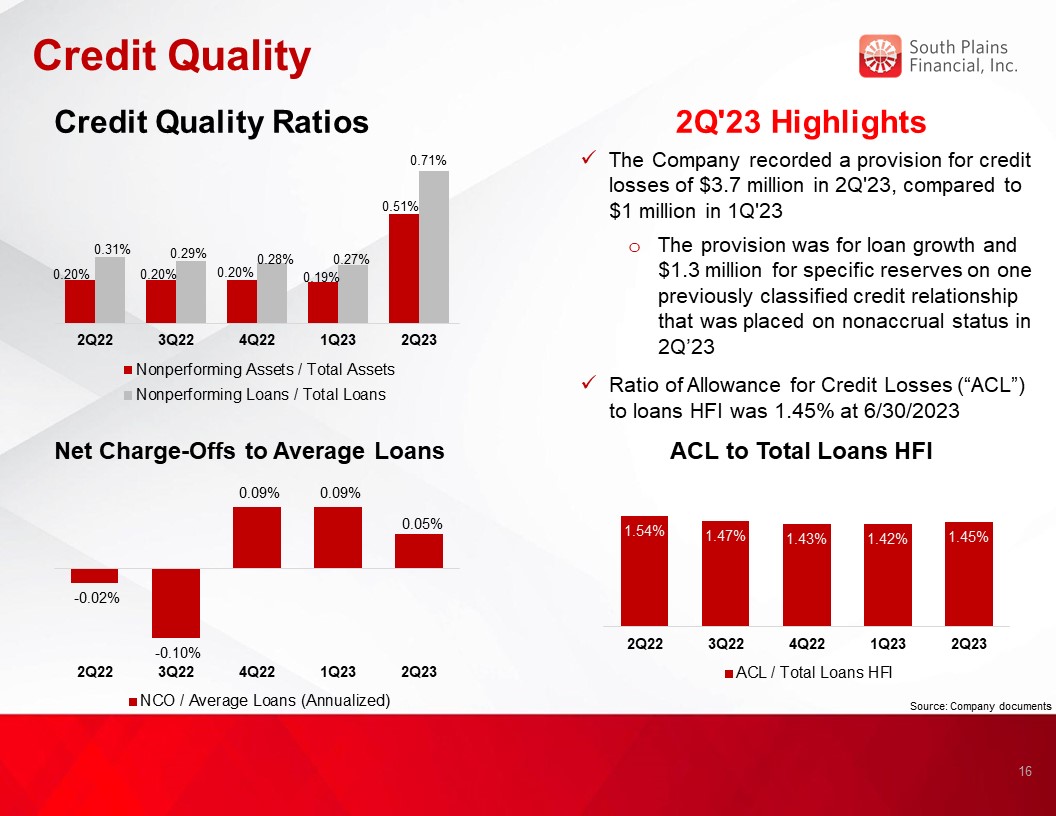
Credit Quality 2Q'23 Highlights Credit Quality Ratios Net Charge-Offs to Average Loans ACL to Total Loans HFI 16 The Company recorded a provision for credit losses of $3.7 million in 2Q'23, compared to $1 million in 1Q'23 The provision was for loan growth and $1.3 million for specific reserves on one previously classified credit relationship that was placed on nonaccrual status in 2Q’23 Ratio of Allowance for Credit Losses (“ACL”) to loans HFI was 1.45% at 6/30/2023 Source: Company documents

Investment Securities 2Q'23 Highlights Investment securities totaled $628 million at June 30, 2023, a decrease of $70.5 million from March 31, 2023 The decrease was largely the result of a strategic sale of $56 million of investment securities during the period All municipal bonds are in Texas All MBS, CMO, and Asset Backed securities are U.S. Government or GSE Duration of the securities portfolio was 6.92 years at quarter end 2Q'23 Securities Composition $698.6 million Securities & Cash $ in Millions 17 Source: Company documents
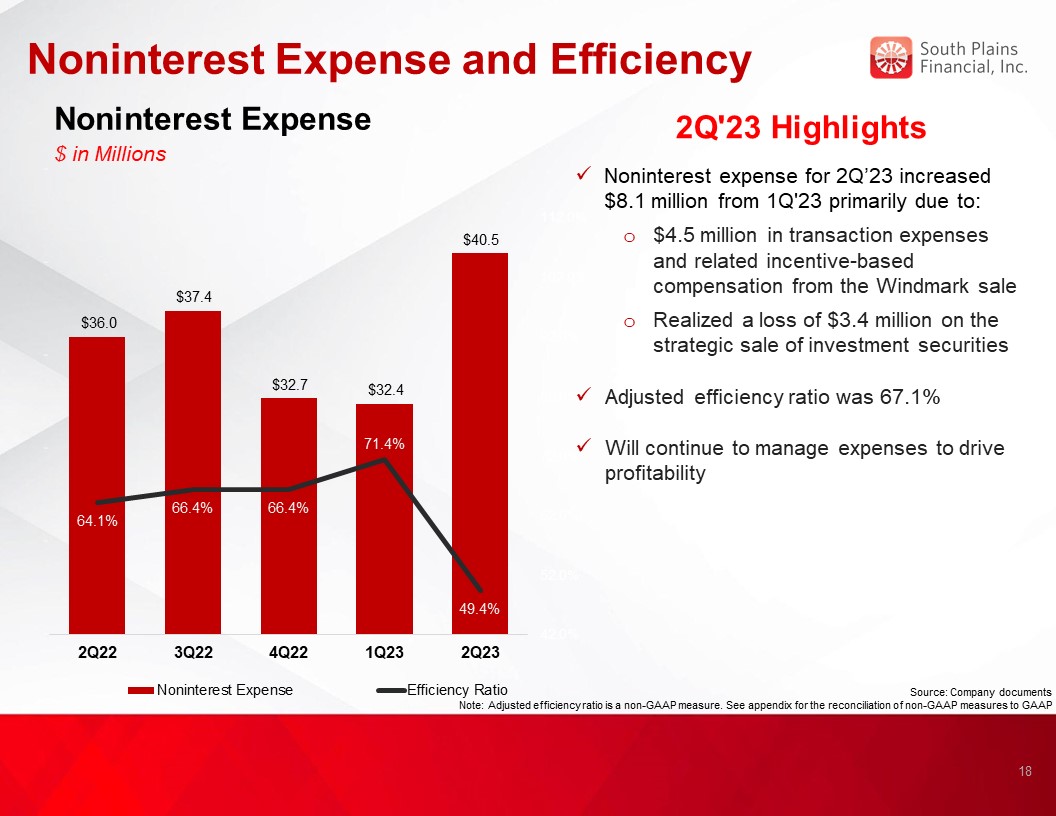
Noninterest Expense and Efficiency Noninterest Expense $ in Millions 2Q'23 Highlights Noninterest expense for 2Q’23 increased $8.1 million from 1Q'23 primarily due to: $4.5 million in transaction expenses and related incentive-based compensation from the Windmark sale Realized a loss of $3.4 million on the strategic sale of investment securities Adjusted efficiency ratio was 67.1% Will continue to manage expenses to drive profitability 18 Source: Company documents Note: Adjusted efficiency ratio is a non-GAAP measure. See appendix for the reconciliation of non-GAAP measures to GAAP
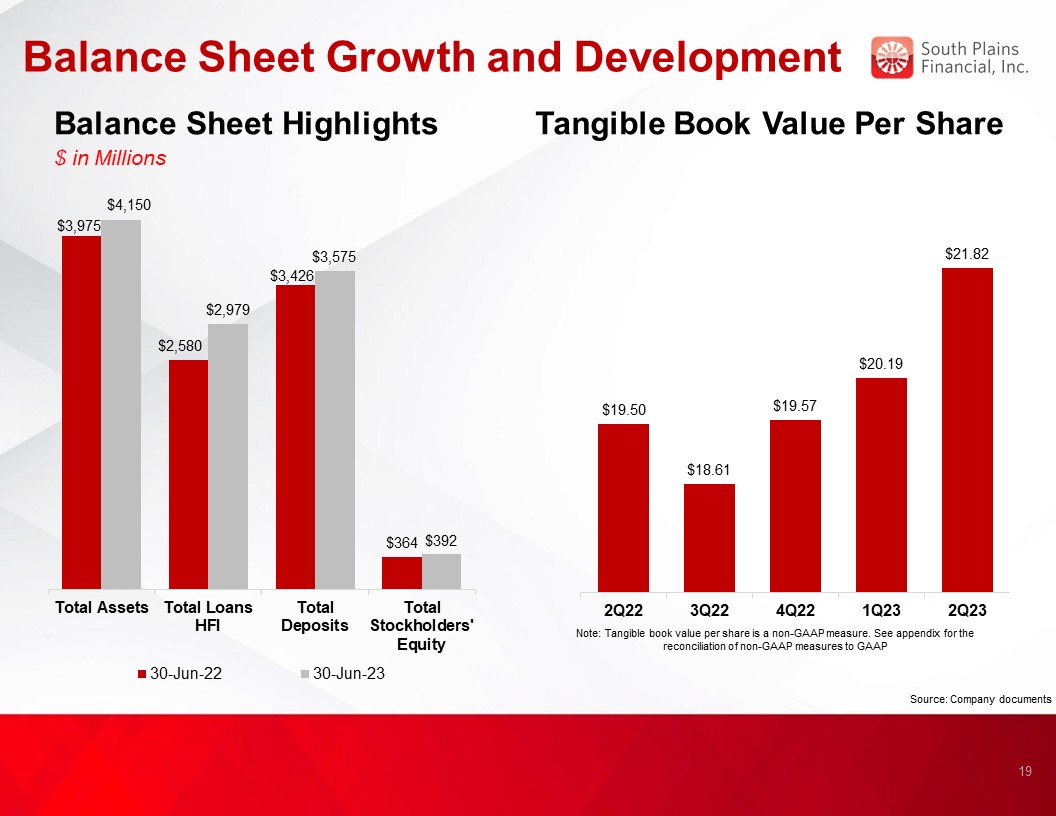
Balance Sheet Growth and Development Balance Sheet Highlights $ in Millions Tangible Book Value Per Share Note: Tangible book value per share is a non-GAAP measure. See appendix for the reconciliation of non-GAAP measures to GAAP 19 Source: Company documents
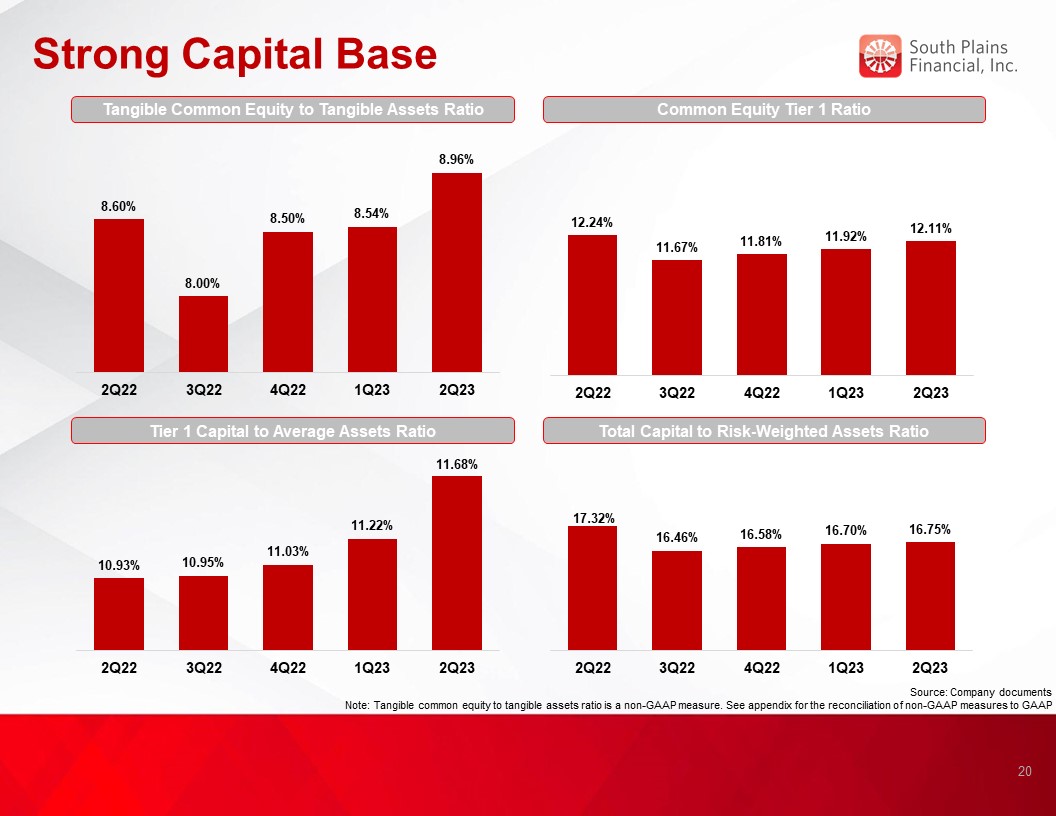
Strong Capital Base Tangible Common Equity to Tangible Assets Ratio Common Equity Tier 1 Ratio Tier 1 Capital to Average Assets Ratio Total Capital to Risk-Weighted Assets Ratio 20 Source: Company documents Note: Tangible common equity to tangible assets ratio is a non-GAAP measure. See appendix for the reconciliation of non-GAAP measures to GAAP
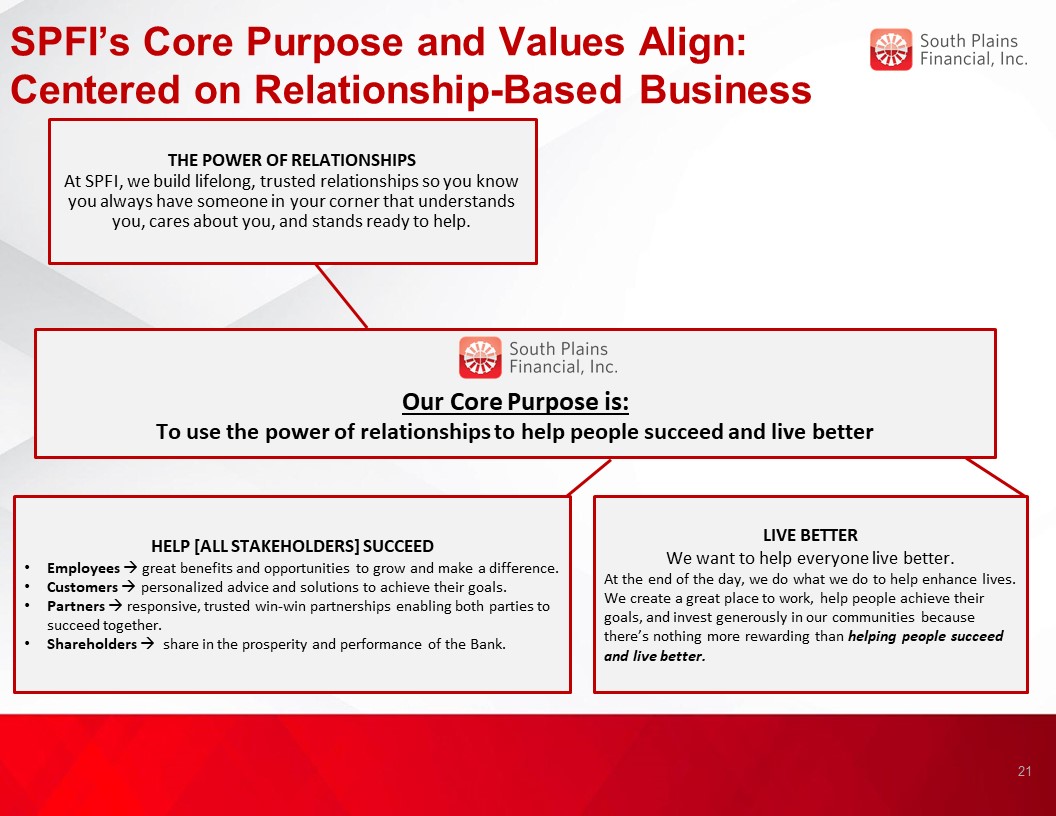
SPFI’s Core Purpose and Values Align: Centered on Relationship-Based Business Our Core Purpose is: To use the power of relationships to help people succeed and live better HELP [ALL STAKEHOLDERS] SUCCEED Employees great benefits and opportunities to grow and make a difference. Customers personalized advice and solutions to achieve their goals. Partners responsive, trusted win-win partnerships enabling both parties to succeed together. Shareholders share in the prosperity and performance of the Bank. THE POWER OF RELATIONSHIPS At SPFI, we build lifelong, trusted relationships so you know you always have someone in your corner that understands you, cares about you, and stands ready to help. LIVE BETTER We want to help everyone live better. At the end of the day, we do what we do to help enhance lives. We create a great place to work, help people achieve their goals, and invest generously in our communities because there’s nothing more rewarding than helping people succeed and live better. 21

Appendix 22
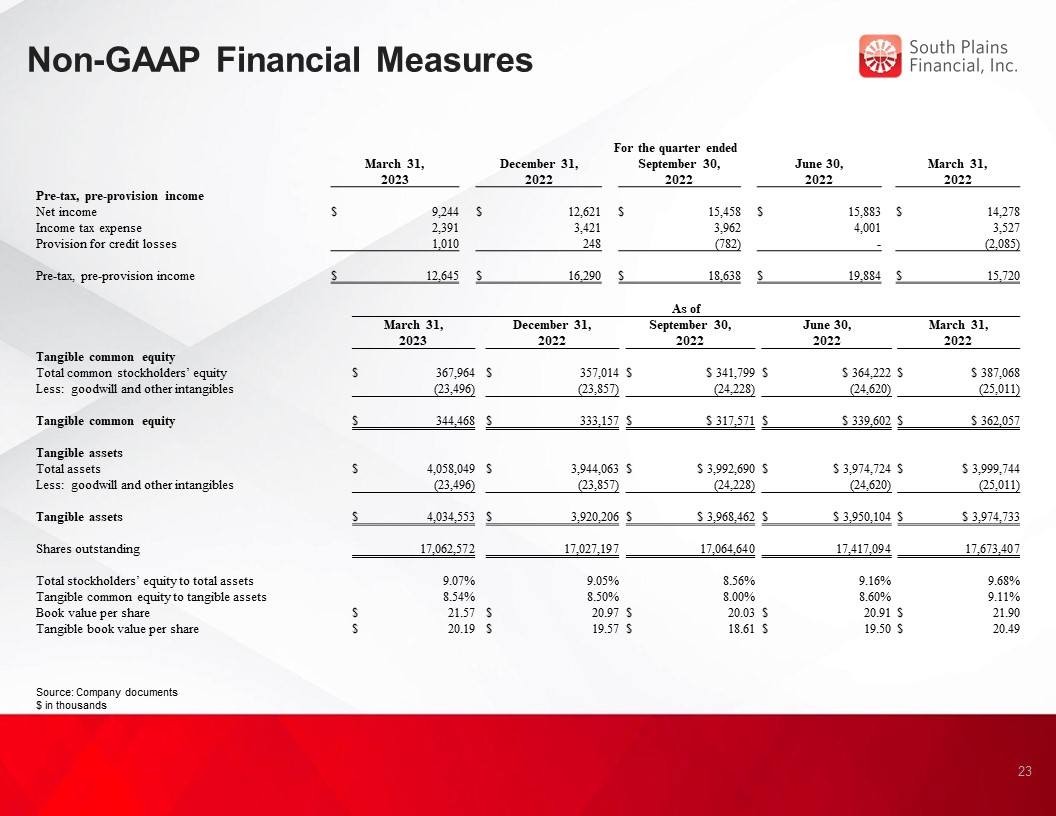
Non-GAAP Financial Measures Source: Company documents $ in thousands 23 For the quarter ended March 31, 2023 December 31, 2022 September 30, 2022 June 30, 2022 March 31, 2022 Pre-tax, pre-provision income Net income $ 9,244 $ 12,621 $ 15,458 $ 15,883 $ 14,278 Income tax expense 2,391 3,421 3,962 4,001 3,527 Provision for credit losses 1,010 248 (782) - (2,085) Pre-tax, pre-provision income $ 12,645 $ 16,290 $ 18,638 $ 19,884 $ 15,720 As of March 31, 2023 December 31, 2022 September 30, 2022 June 30, 2022 March 31, 2022 Tangible common equity Total common stockholders’ equity $ 367,964 $ 357,014 $ $ 341,799 $ $ 364,222 $ $ 387,068 Less: goodwill and other intangibles (23,496) (23,857) (24,228) (24,620) (25,011) Tangible common equity $ 344,468 $ 333,157 $ $ 317,571 $ $ 339,602 $ $ 362,057 Tangible assets Total assets $ 4,058,049 $ 3,944,063 $ $ 3,992,690 $ $ 3,974,724 $ $ 3,999,744 Less: goodwill and other intangibles (23,496) (23,857) (24,228) (24,620) (25,011) Tangible assets $ 4,034,553 $ 3,920,206 $ $ 3,968,462 $ $ 3,950,104 $ $ 3,974,733 Shares outstanding 17,062,572 17,027,197 17,064,640 17,417,094 17,673,407 Total stockholders’ equity to total assets 9.07% 9.05% 8.56% 9.16% 9.68% Tangible common equity to tangible assets 8.54% 8.50% 8.00% 8.60% 9.11% Book value per share $ 21.57 $ 20.97 $ 20.03 $ 20.91 $ 21.90 Tangible book value per share $ 20.19 $ 19.57 $ 18.61 $ 19.50 $ 20.49
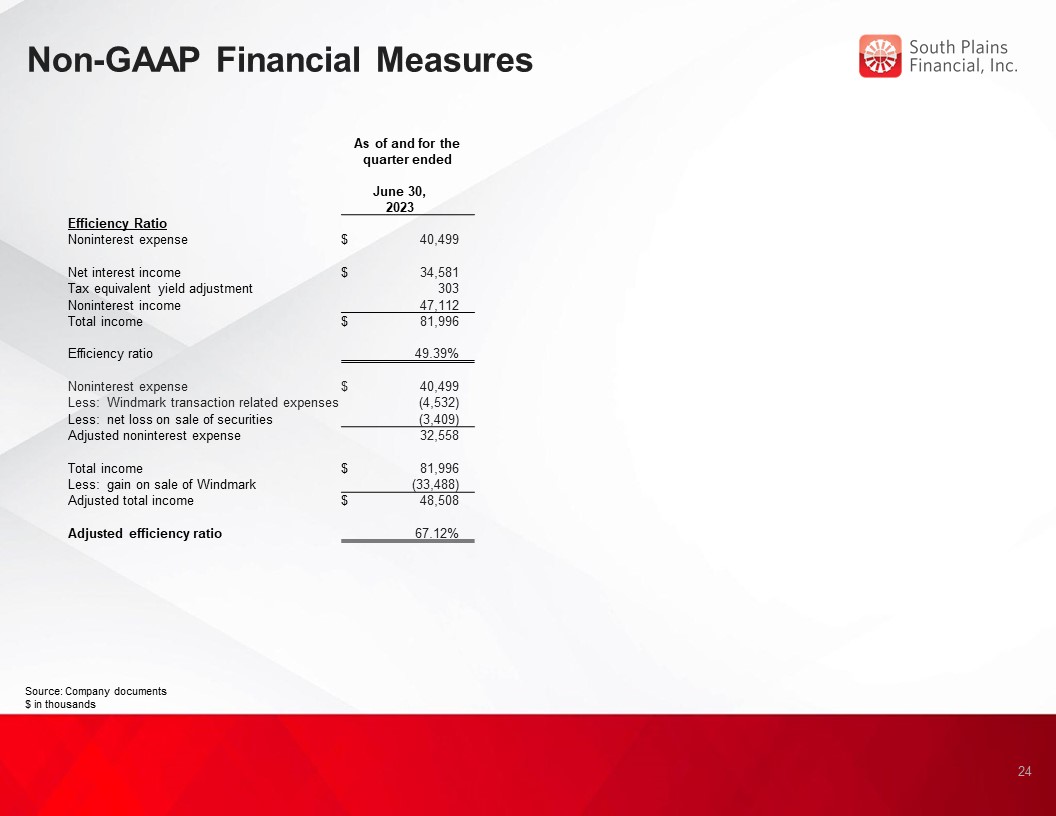
Non-GAAP Financial Measures Source: Company documents $ in thousands 24 As of and for the quarter ended June 30, 2023 Efficiency Ratio Noninterest expense $ 40,499 Net interest income $ 34,581 Tax equivalent yield adjustment 303 Noninterest income 47,112 Total income $ 81,996 Efficiency ratio 49.39% Noninterest expense $ 40,499 Less: Windmark transaction related expenses (4,532) Less: net loss on sale of securities (3,409) Adjusted noninterest expense 32,558 Total income $ 81,996 Less: gain on sale of Windmark (33,488) Adjusted total income $ 48,508 Adjusted efficiency ratio 67.12%