Exhibit 99.2
3Q13 Earnings Presentation October 23, 2013 Presenter: Anthony G. Petrello Chairman, President & Chief Executive Officer |
Forward-Looking Statements 2 We often discuss expectations regarding our markets, demand for our products and services, and our future performance in our annual and quarterly reports, press releases, and other written and oral statements. Such statements, including statements in this document incorporated by reference that relate to matters that are not historical facts are “forward-looking statements” within the meaning of the safe harbor provisions of Section 27A of the Securities Act of 1933 and Section 21E of the Securities Exchange Act of 1934. These “forward-looking statements” are based on our analysis of currently available competitive, financial and economic data and our operating plans. They are inherently uncertain, and investors must recognize that events and actual results could turn out to be significantly different from our expectations. You should consider the following key factors when evaluating these forward-looking statements: • fluctuations in worldwide prices and demand for natural gas, natural gas liquids and crude oil; • fluctuations in levels of natural gas, natural gas liquids and crude oil exploration and development activities; • fluctuations in the demand for our services; • the existence of competitors, technological changes and developments in the oilfield services industry; • the existence of operating risks inherent in the oilfield services industry; • the existence of regulatory and legislative uncertainties; • the possibility of changes in tax laws; • the possibility of political instability, war or acts of terrorism in any of the countries in which we do business; and • general economic conditions including the capital and credit markets. Our businesses depend, to a large degree, on the level of spending by oil and gas companies for exploration, development and production activities. Therefore, a sustained increase or decrease in the price of natural gas, natural gas liquids or crude oil, which could have a material impact on exploration and production activities, could also materially affect our financial position, results of operations and cash flows. The above description of risks and uncertainties is by no means all inclusive, but is designed to highlight what we believe are important factors to consider. |
Recent Highlights |
Significant Rig Awards 4 Date Country/Type Awards 2012 U.S. PACE®-X 17 1Q13 U.S. PACE®-X 2 2Q13 U.S. PACE®-X 2 Argentina 6 Kurdistan 2 Kazakhstan 1 3Q13 U.S. PACE®-X 8 Saudi Arabia 11 Mexico 2 2013 Total Awards 34 Total PACE®-X Rig Awards 29 |
Refinancing for Improved Debt Outlook 5 >Took advantage of current low rates to refinance $785mm (~70%) of 2019, 9.25% notes; annual interest payments decreased by ~$45mm (3.51% weighted avg. interest rate) – Blended interest rate is now 4.56%, down from 5.48% (1) Capitalization defined as Net Debt plus Shareholders’ Equity Note: Subtotals may not total due to rounding High 3/31/12 Current 9/30/13 ($MM's) Total Debt $4,773 $4,047 Cash and ST Investments 494 492 Net Debt $4,279 $3,556 Net Debt to Capitalization(1) 42.4% 40.9% Coverage 7.9x 6.9x Leverage 2.5x 2.5x 0 200 400 600 800 1,000 1,200 2016 2017 2018 2019 2020 2021 2023 Thousands Debt Tranches Prior to Refinancing Post Refinancing |
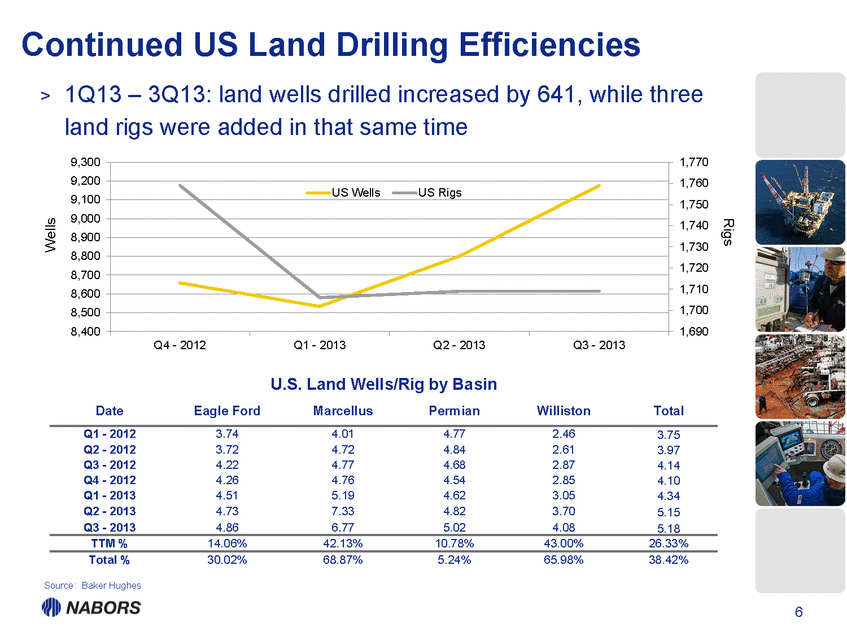
Continued US Land Drilling Efficiencies 6 >1Q13 – 3Q13: land wells drilled increased by 641, while three land rigs were added in that same time Source: Baker Hughes Wells Rigs 1,690 1,700 1,710 1,720 1,730 1,740 1,750 1,760 1,770 8,400 8,500 8,600 8,700 8,800 8,900 9,000 9,100 9,200 9,300 Q4 - 2012 Q1 - 2013 Q2 - 2013 Q3 - 2013 US Wells US Rigs U.S. Land Wells/Rig by Basin Date Eagle Ford Marcellus Permian Williston Total Q1 - 2012 3.74 4.01 4.77 2.46 3.75 Q2 - 2012 3.72 4.72 4.84 2.61 3.97 Q3 - 2012 4.22 4.77 4.68 2.87 4.14 Q4 - 2012 4.26 4.76 4.54 2.85 4.10 Q1 - 2013 4.51 5.19 4.62 3.05 4.34 Q2 - 2013 4.73 7.33 4.82 3.70 5.15 Q3 - 2013 4.86 6.77 5.02 4.08 5.18 TTM % 14.06% 42.13% 10.78% 43.00% 26.33% Total % 30.02% 68.87% 5.24% 65.98% 38.42% |
Stimulation Market Remains Challenging Improving efficiency exacerbates excess capacity 7 > Nabors’ performance has improved by over 20% year-to-date, but market capacity continues to exceed demand Source: PacWest 10% 16% 24% 30% 28% 25% 25% 27% 0% 5% 10% 15% 20% 25% 30% 35% 0.0 2.0 4.0 6.0 8.0 10.0 12.0 14.0 16.0 18.0 1Q2012 2Q2012 3Q2012 4Q2012 1Q2013 2Q2013E 3Q2013E 4Q2013E Working (MM HHP) Excess Capacity (MM HHP) % Excess Capacity |
Financial Summary ($000 except EPS) 3Q12 4Q12 1Q13 2Q13 3Q13 Revenue $1,630,380 $1,571,745 $1,538,373 $1,459,326 $1,548,191 EBITDA 491,472 427,144 412,503 355,814 439,337 Operating Income 225,835 153,662 143,138 89,604 165,893 Diluted EPS(1) $0.22 $0.45 $0.31 $0.08 ($0.30) (1) Diluted EPS for continuing operations Financials reflect reclassification of Peak to discontinued operations |
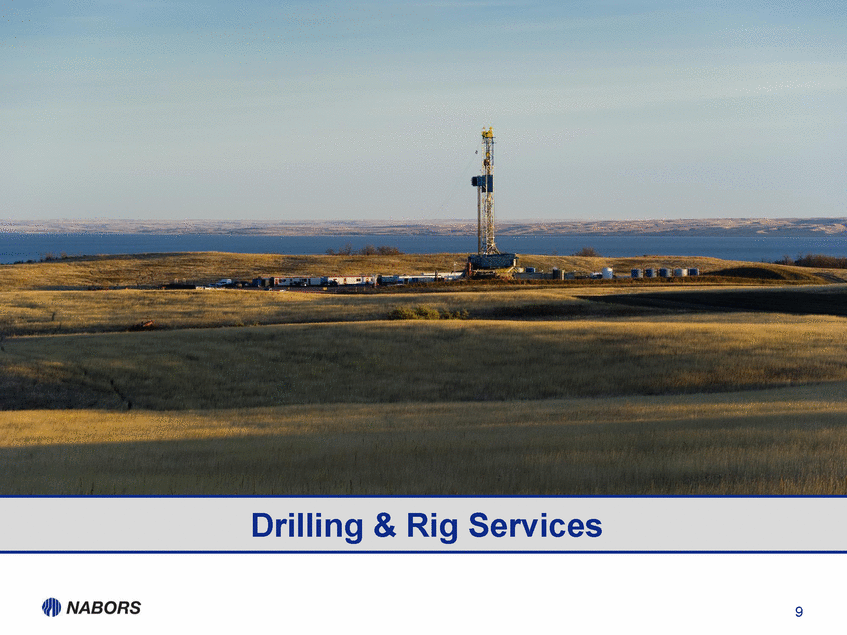
Drilling & Rig Services |
10 Drilling & Rig Services Adjusted Income (Loss) Derived from Operating Activities ($M’s) 3Q12 4Q12 1Q13 2Q13 3Q13 Drilling & Rig Services: U.S. $115,207 $82,603 $77,595 $69,813 $92,710 Canada 21,679 27,064 30,518 3,895 12,244 International 30,299 23,388 21,469 32,481 54,271 Rig Services 14,027 8,740 1,287 (5,383) 2,357 Total $181,212 $141,795 $130,869 $100,806 $161,582 |
Global Rig Fleet Details 11 AC SCR Mech Total Moving Systems Alaska Land 5 12 2 19 13 Lower 48 164 88 26 278 151 Canada 17 20 29 66 20 International Land 36 73 28 137 60 Offshore 9 40 2 51 n/a Total 231 233 87 551 244 Rig Counts include contracted rigs scheduled to be delivered and transferred, and moving systems scheduled to be installed 49% 51% Global Rigs with Moving Systems Moving Systems Non-Moving 42% 42% 16% Rigs by Power Type AC SCR Mech |
Q13 Rig Utilization & Availability 12 Rig Fleet(1) 3Q13 Rig Years Utilization U.S. Lower 48 AC 142 132 94% Legacy 122 47 39% U.S. Lower 48 Total 264 179 68% U.S. Offshore 22 12 55% Alaska 19 5 26% Canada 66 30 45% International 154 124 81% Subtotal 525 350 PACE®-X Construction(2) 23 Offshore Newbuilds 3 Total Fleet 551 (1) As of 9/30/13 (2) Includes announced new build commitments and rigs to be delivered |
Canada Working Rigs by Play 13 Play Target AC SCR Mechanical Total Pad Capable Deep Basin Oil/Gas 1 5 3 9 3 Cardium Oil 3 3 Duvernay Gas 1 1 1 Horn River/Ft. Liard Oil/Gas 1 2 3 1 Mannville Group (Oil Sands) Oil 1 1 2 2 Montney Oil/Gas 4 3 3 10 4 Other Oil/Gas 2 2 3 7 3 Total 9 14 12 35 14 As of 9/30/13 |
International Working Rigs 14 Algeria 9 Ecuador 6 Kurdistan 2 Romania 1 Angola 1 India 5 Kuwait 2 Russia 5 Argentina 16 Iraq 3 Malaysia 2 Saudi Arabia 32 Colombia 7 Italy 1 Mexico 13 UAE 1 Congo 2 Jordan 1 Oman 4 Venezuela 5 Kazakhstan 1 PNG 2 Yemen 2 Total 123 As of 9/30/13 |
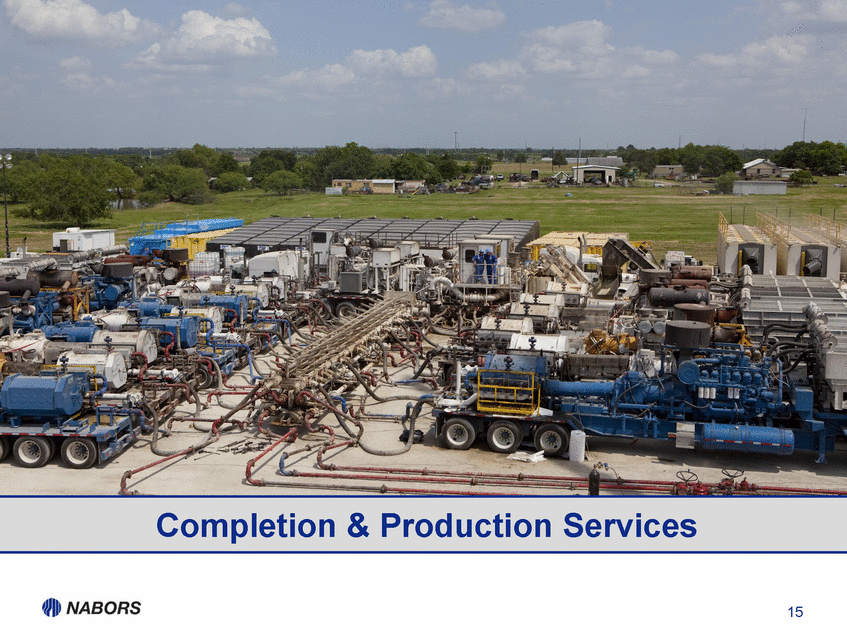
Completion & Production Services 15 |
Completion & Production Services Adjusted Income Derived from Operating Activities 16 ($M’s) 3Q12 4Q12 1Q13 2Q13 3Q13 Completion & Production Services: Completion Services $47,218 $30,296 $17,756 $6,870 $13,024 Production Services 34,035 21,374 26,014 23,471 25,909 Total $81,253 $51,670 $43,770 $30,341 $38,933
|
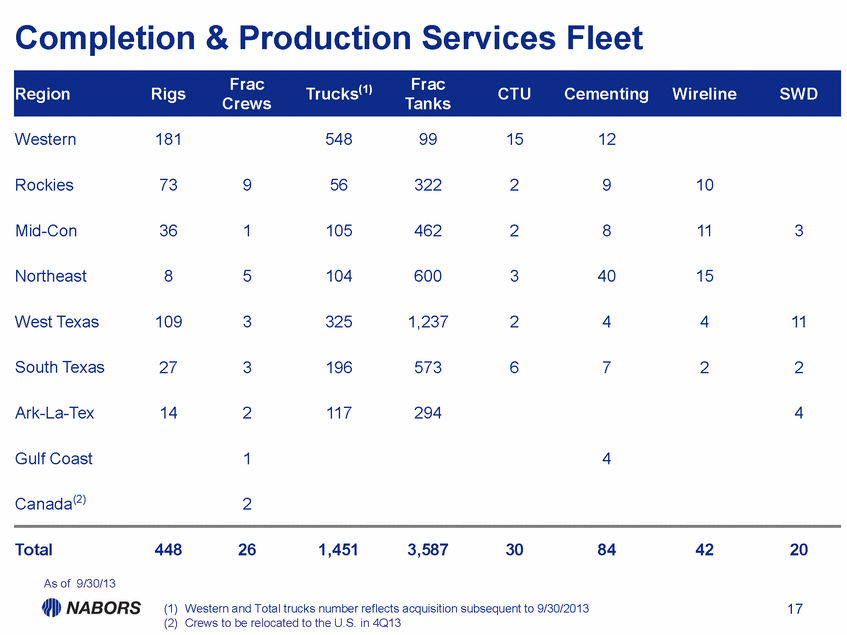
Completion & Production Services Fleet Region Rigs Frac Crews Trucks(1) Frac Tanks CTU Cementing Wireline SWD Western 181 548 99 15 12 Rockies 73 9 56 322 2 9 10 Mid-Con 36 1 105 462 2 8 11 3 Northeast 8 5 104 600 3 40 15 West Texas 109 3 325 1,237 2 4 4 11 South Texas 27 3 196 573 6 7 2 2 Ark-La-Tex 14 2 117 294 4 Gulf Coast 1 4 Canada(2) 2 Total 448 26 1,451 3,587 30 84 42 20 17 As of 9/30/13 (1) Western and Total trucks number reflects acquisition subsequent to 9/30/2013 (2) Crews to be relocated to the U.S. in 4Q13 |
18 Outlook and Summary |
Key Takeaways 19 > International and U.S. Drilling turning the corner > Global optionality relative to North America-centric peers > Opportunities for additional high-impact investments > Completion Services remains challenging with limited visibility > Focus on matters within our control to improve profitability |
20 Appendix |
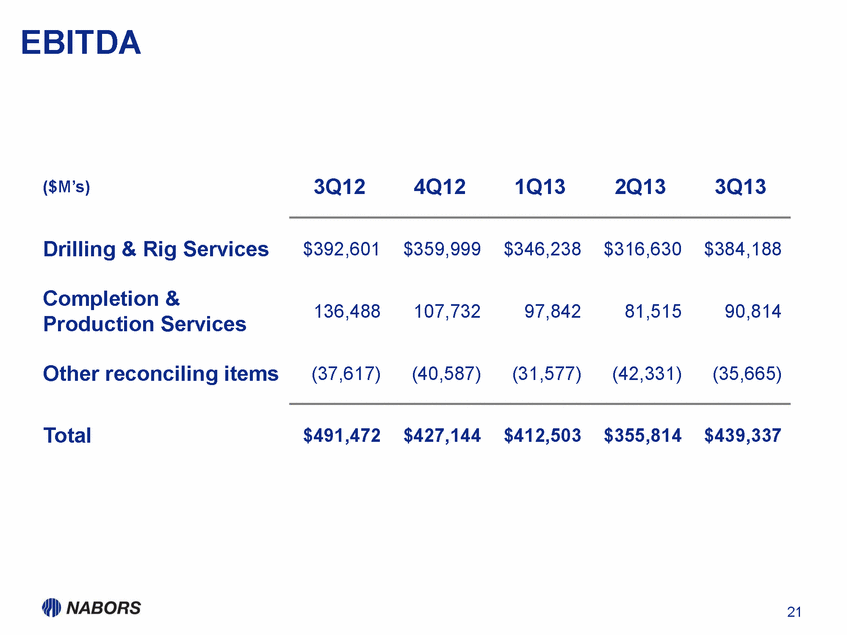
EBITDA 21 ($M’s) 3Q12 4Q12 1Q13 2Q13 3Q13 Drilling & Rig Services $392,601 $359,999 $346,238 $316,630 $384,188 Completion & Production Services 136,488 107,732 97,842 81,515 90,814 Other reconciling items (37,617) (40,587) (31,577) (42,331) (35,665) Total $491,472 $427,144 $412,503 $355,814 $439,337 |
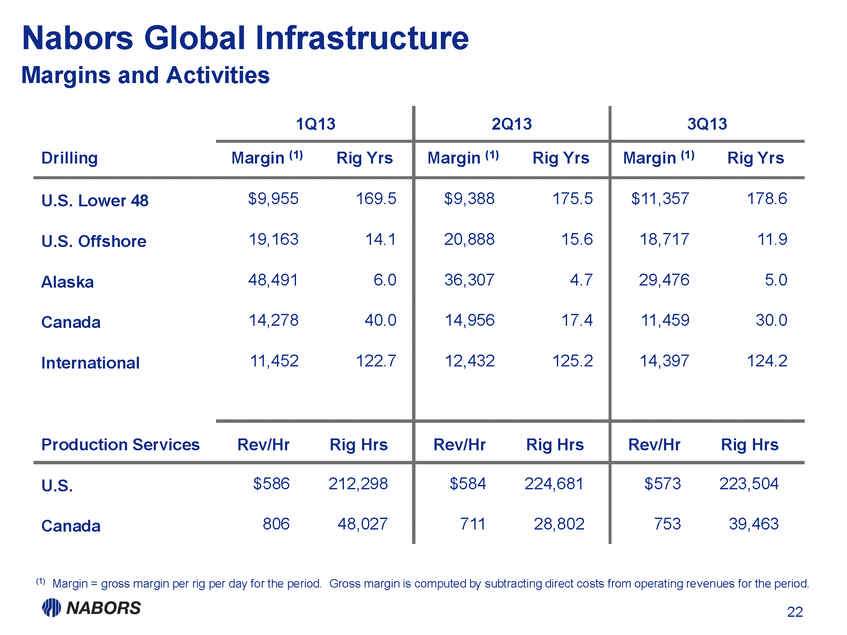
Nabors Global Infrastructure Margins and Activities 1Q13 2Q13 3Q13 Drilling Margin (1) Rig Yrs Margin (1) Rig Yrs Margin (1) Rig Yrs U.S. Lower 48 $9,955 169.5 $9,388 175.5 $11,357 178.6 U.S. Offshore 19,163 14.1 20,888 15.6 18,717 11.9 Alaska 48,491 6.0 36,307 4.7 29,476 5.0 Canada 14,278 40.0 14,956 17.4 11,459 30.0 International 11,452 122.7 12,432 125.2 14,397 124.2 Production Services Rev/Hr Rig Hrs Rev/Hr Rig Hrs Rev/Hr Rig Hrs U.S. $586 212,298 $584 224,681 $573 223,504 Canada 806 48,027 711 28,802 753 39,463 (1) Margin = gross margin per rig per day for the period. Gross margin is computed by subtracting direct costs from operating revenues for the period. |