Exhibit 99.2
| 4Q14 Earnings Presentation March 3, 2015 Presenters: Anthony G. Petrello Chairman, President & Chief Executive Officer William Restrepo Chief Financial Officer |
| Forward-Looking Statements We often discuss expectations regarding our markets, demand for our products and services, and our future performance in our annual and quarterly reports, press releases, and other written and oral statements. Such statements, including statements in this document incorporated by reference that relate to matters that are not historical facts are forward-looking statement within the meaning of the safe harbor provisions of Section 27A of the U.S. Securities Act of 1933, as amended (the “Securities Act”) and Section 21E of the U.S. Securities Exchange Act of 1934. These forward-looking statement are based on our analysis of currently available competitive, financial and economic data and our operating plans. They are inherently uncertain, and investors must recognize that events and actual results could turn out to be significantly different from our expectations. Factors to consider when evaluating these forward-looking statements include, but are not limited to: fluctuations in worldwide prices and demand for natural gas, natural gas liquids and crude oil; fluctuations in levels of natural gas, natural gas liquids and crude oil exploration and development activities; fluctuations in the demand for our services; the existence of competitors, technological changes and developments in the oilfield services industry; the existence of operating risks inherent in the oilfield services industry; the existence of regulatory and legislative uncertainties; the possibility of changes in tax laws; the possibility of political instability, war or acts of terrorism in any of the countries in which we do business; and general economic conditions including the capital and credit markets. Our businesses depend, to a large degree, on the level of spending by oil and gas companies for exploration, development and production activities. Therefore, a sustained increase or decrease in the price of natural gas, natural gas liquids or crude oil, which could have a material impact on exploration and production activities, could also materially affect our financial position, results of operations and cash flows. The above description of risks and uncertainties is by no means all inclusive, but is designed to highlight what we believe are important factors to consider. Statements made in this presentation include non-GAAP financial measures. The required reconciliation to GAAP financial measures are included on our website. 2 |
| Important Additional Information 3 In connection with the proposed transactions, Nabors Red Lion Limited (which will be renamed C&J Energy Services Ltd. as of the closing of the proposed transaction) (“Red Lion”) has filed with the SEC a registration statement on Form S-4 that includes a proxy statement of C&J Energy Services, Inc. (“C&J”) that also constitutes a prospectus of Red Lion. On February 13, 2015, the registration statement was declared effective by the SEC, C&J filed a definitive proxy statement with the SEC, and Red Lion filed a definitive prospectus with the SEC. Each of Red Lion and C&J also plans to file other relevant documents with the SEC regarding the proposed transactions. This material is not a substitute for the final prospectus/proxy statement or any other documents the parties will file with the SEC. Mailing of the definitive proxy statement/prospectus to the stockholders of C&J commenced on February 13, 2015. INVESTORS ARE URGED TO READ THE DEFINITIVE PROXY STATEMENT/PROSPECTUS (INCLUDING ALL AMENDMENTS AND SUPPLEMENTS THERETO) AND OTHER RELEVANT DOCUMENTS FILED WITH THE SEC IF AND WHEN THEY BECOME AVAILABLE BECAUSE THEY WILL CONTAIN IMPORTANT INFORMATION. You may obtain a free copy of the registration statement, the definitive joint proxy statement/prospectus and other relevant documents filed by Red Lion and C&J with the SEC at the SEC’s website at www.sec.gov. You may also obtain copies of the documents filed by Red Lion with the SEC free of charge on C&J’s website at www.cjenergy.com C Participants in the Solicitation Red Lion, C&J and Nabors and their respective directors and executive officers and other members of management and employees may be deemed to be participants in the solicitation of proxies in respect of the proposed transactions. Information about Cs 30, 2014, for its 2014 annual meeting of shareholders. Other information regarding the participants in the proxy solicitations and a description of their direct and indirect interests, by security holdings or otherwise, will be contained in the proxy statement/prospectus and other relevant materials to be filed with the SEC regarding the proposed transactions when they become available. Investors should read the proxy statement/prospectus carefully before making any voting or investment decisions. You may obtain free copies of these documents from C&J and Nabors using the sources indicated above. This document shall not constitute an offer to sell or the solicitation of an offer to buy any securities, nor shall there be any sale of securities in any jurisdiction in which such offer, solicitation or sale would be unlawful prior to registration or qualification under the securities laws of any such jurisdiction. No offering of securities shall be made except by means of a prospectus meeting the requirements of Section 10 of the U.S. Securities Act of 1933, as amended. |
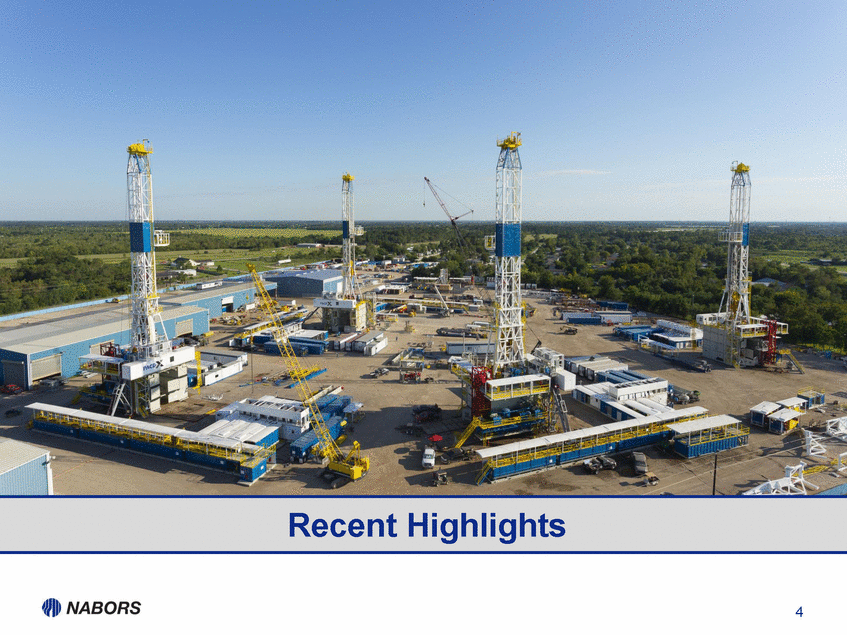
| 4 Recent Highlights |
| 5 Financial Summary ($000’s except EPS) 4Q13 1Q14 2Q14 3Q14 4Q14 Revenue $1,605,390 $1,587,173 $1,616,405 $1,810,911 $1,783,407 Adjusted EBITDA 437,242 391,168 416,280 489,958 445,692 Operating Income 159,584 109,041 133,460 203,377 152,120 Diluted EPS(1) $0.42 $0.16 $0.21(2) $0.34(3) ($3.06)(4) (1) Diluted EPS from continuing operations (2) Includes several charges related to businesses in the process of being disposed and the redemption of SWSI preferred stock, which net to a loss of approximately 3¢ per share (3) Includes charges of 5¢ per share for income tax and merger-related fees, net of early termination payment, gain on sale of Alaska E&P and other items (4) Includes charges and impairments of $3.39 per share related to asset impairments and transaction costs Financials reflect reclassification of Peak to discontinued operations |
| Combination of Nabors Completion & Production Services with C&J Energy Services 6 > Update S-4 Filed, became effective Febuary 13, 2015 C&J shareholder special meeting to approve transaction set for March 20, 2015 Expected to close the week of March 23, 2015 > Combination creates: 5th largest stimulation fleet in North America Largest fluids management fleet in North America 2nd largest workover/well-servicing fleet in North America Enhanced prospects for international expansion through a global alliance agreement > Nearly 1.2 MM HHP of pressure pumping capacity across the US 543 workover rigs in the US and Canada ~1,500 fluid management trucks |
| High 3/31/12 3Q14 9/30/14 Liquidity 12/31/14 Change 4Q14 from High Change 3Q14 to 4Q14 ($MM's) Total Debt $4,773 $4,255 $4,355 ($418) $100 Cash and ST Investments 494 465 536 42 71 Net Debt $4,279 $3,791 $3,819 ($460) $28 Net Debt to Capitalization(1) 42.4% 39.3% 43.8% 1.4% 4.5% Coverage(2) 7.8x 9.6x 9.8x 2.0x 0.2x Leverage(3) 2.5x 2.5x 2.5x 0.0 0.0 Improving Financial Flexibility 7 (1) Capitalization defined as Net Debt plus Shareholders’ Equity (2) Coverage defined as LTM Adjusted EBITDA / LTM Interest Expense (3) Leverage defined as Total Debt / LTM Adjusted EBITDA (4) Post C&J transaction and assumes additional revolver capacity (5) C&J stock price as of 12/31/14 subject to six month lockup Note: Subtotals may not foot due to rounding Liquidity (as of December 31, 2014) Cash & Available Capacity: $1,053 Liquidity Pro Forma C&J Transaction (at December 31, 2014) Cash & Available Capacity(4): $1,966 C&J stock(5): $825 |
| 8 Drilling & Rig Services |
| 4Q14 Rig Utilization & Availability 9 Rig Fleet(1) 4Q14 Rig Years Average Utilization U.S. Lower 48 AC 165 154 93% Legacy(2) 88 45 51% U.S. Lower 48 Total 253 198 78% U.S. Offshore 16 8 50% Alaska 19 6 32% Canada 57 37 65% International 153 121 79% Subtotal 498 370 74% PACE®-X Construction(3) 17 Intl. Newbuilds & Upgrades(3) 8 U.S. & Intl. Offshore Newbuilds(3) 3 Total Fleet 526 (1) As of 12/31/14 (2) After impairment (3) Includes announced newbuild commitments and rigs to be completed in 2015 |
| 4Q14 U.S. Rig Utilization Power Type and Pad Capability 10 As of 12/31/14 Walking Skidding Pad Capable Not Pad Capable Total Working Total Util. Working Total Util. Total Working Total Util. AC 99 109 91% 17 18 94% 91% 30 38 79% 88% SCR 4 6 67% 7 11 64% 65% 27 71 38% 43% Mech 1 26 4% 4% Grand Total 103 115 90% 24 29 83% 88% 58 135 43% 66% |
| 0 5 10 15 20 25 30 35 1Q13 2Q13 3Q13 4Q13 1Q14 2Q14 3Q14 4Q14 Deployments Cumulative Deployments Cumulative Rig Years PACE-X Rig Deployments & Rig Years 11 > 30 PACE®-X Rig Years through 4Q14 |
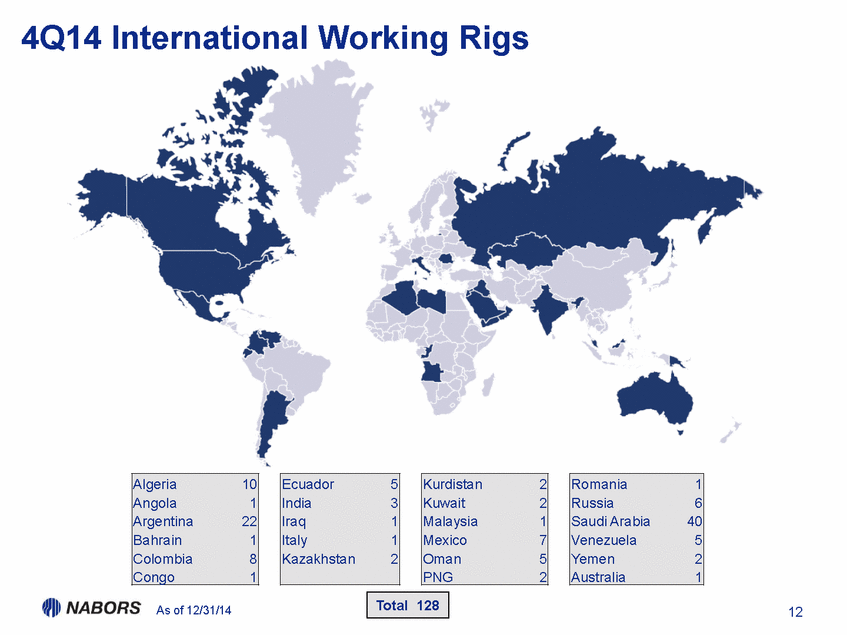
| 4Q14 International Working Rigs 12 Algeria 10 Ecuador 5 Kurdistan 2 Romania 1 Angola 1 India 3 Kuwait 2 Russia 6 Argentina 22 Iraq 1 Malaysia 1 Saudi Arabia 40 Bahrain 1 Italy 1 Mexico 7 Venezuela 5 Colombia 8 Kazakhstan 2 Oman 5 Yemen 2 Congo 1 PNG 2 Australia 1 Total 128 As of 12/31/14 |
| 13 Completion & Production Services |
| U.S. Completion & Production Services Fleet Region Rigs Frac Crews Trucks Frac Tanks CTU Cementing Wireline SWD Western 181 538 1,924 15 12 2 Rockies 76 7 61 322 2 9 10 2 Mid-Con 35 1 96 447 8 11 5 Northeast 7 4 100 597 38 13 West Texas 106 5 328 1,271 3 4 6 12 South Texas 25 2 218 492 7 3 Ark-La-Tex 15 119 274 7 Gulf Coast 4 San Angelo 10 Total 445 19 1,460 5,327 30 82 42 29 14 As of 12/31/14 |
| 15 Outlook and Summary |
| Key Takeaways 16 > Focus efforts to balance current market pricing and utilization, while adjusting our cost structure and capital spending as necessary. > Pursue opportunities to add rigs in high-spec drilling markets around the globe at attractive risk-adjusted rates of return > Invest in technology that advances our position as a high performance driller > Pending merger restores pure-play drilling focus, enhances financial flexibility while preserving upside from improving stimulation market |
| 17 Appendix |
| 18 4Q14 Margins & Rig Activities 1Q14 2Q14 3Q14 4Q14 Drilling Margin (1) Rig Yrs Margin (1) Rig Yrs Margin (1) Rig Yrs Margin (1) Rig Yrs U.S. Drilling $11,073 206.6 $11,380 215.3 $12,756(2) 216.0 $11,525 212.2 Canada 11,452 43.8 10,034 21.6 9,663 34.3 9,889 36.9 International 13,811 129.8 14,124 127.3 15,490 130.1 17,803 121.2 Production Services Rev/Hr Rig Hrs Rev/Hr Rig Hrs Rev/Hr Rig Hrs Rev/Hr Rig Hrs U.S. $576 209,982 $582 210,750 $584 205,604 $593 183,102 Canada 860 41,540 660 28,671 749 36,509 770 33,218 (1) Margin = gross margin per rig per day for the period. Gross margin is computed by subtracting direct costs from operating revenues for the period. (2) Includes early termination payment of $30 million |


