4Q18 Earnings Presentation February 26, 2019 Presented by: Anthony G. Petrello Chairman, President, & Chief Executive Officer William J. Restrepo Chief Financial Officer

2 We often discuss expectations regarding our future markets, demand for our products and services, and our performance in our annual, quarterly, and current reports, press releases, and other written and oral statements. Such statements, including statements in this document that relate to matters that are not historical facts, are “forward-looking statements” within the meaning of the safe harbor provisions of Section 27A of the U.S. Securities Act of 1933 and Section 21E of the U.S. Securities Exchange Act of 1934. These “forward-looking statements” are based on our analysis of currently available competitive, financial and economic data and our operating plans. They are inherently uncertain, and investors should recognize that events and actual results could turn out to be significantly different from our expectations. Factors to consider when evaluating these forward-looking statements include, but are not limited to: fluctuations and volatility in worldwide prices of and demand for oil and natural gas; fluctuations in levels of oil and natural gas exploration and development activities; fluctuations in the demand for our services; competitive and technological changes and other developments in the oil and gas and oilfield services industries; our ability to renew customer contracts in in order to maintain competitiveness; the existence of operating risks inherent in the oil and gas and oilfield services industries; the possibility of the loss of one or a number of our large customers; the impact of long-term indebtedness and other financial commitments on our financial and operating flexibility; our access to and the cost of capital, including the impact of a downgrade in our credit rating, covenants restrictions, availability under our unsecured revolving credit facilities, and future issuances of debt or equity securities; our dependence on our operating subsidiaries and investments to meet our financial obligations; our ability to retain skilled employees; our ability to complete, and realize the expected benefits of strategic transactions; the recent changes in U.S. tax laws and the possibility of changes in other tax laws and other laws and regulation; the possibility of political or economic instability, civil disturbance, war or acts of terrorism in any of the countries in which we do business; and general economic conditions, including the capital and credit markets. Our businesses depend, to a large degree, on the level of spending by oil and gas companies for exploration, development and production activities. Therefore, sustained lower oil or natural gas prices that have a material impact on exploration, development or production activities could also materially affect our financial position, results of operations and cash flows. The above description of risks and uncertainties is by no means all-inclusive, but is designed to highlight what we believe are important factors to consider. For a discussion of these factors and other risks and uncertainties, please refer to our filings with the Securities and Exchange Commission ("SEC"), including those contained in our Annual Reports on Form 10-K and Quarterly Reports on Form 10-Q, which are available at the SEC's website at www.sec.gov. Non-GAAP Financial Measures This presentation refers to certain “non-GAAP” financial measures, such as adjusted EBITDA, adjusted operating income (loss) and net debt. The components of these non-GAAP measures are computed by using amounts that are determined in accordance with accounting principles generally accepted in the United States of America (“GAAP”). A reconciliation of adjusted EBITDA and adjusted operating income (loss) to income (loss) from continuing operations before income taxes and net debt to total debt, which are their nearest comparable GAAP financial measures, is provided in the Appendix at the end of this presentation. Forward-Looking Statements and Non-GAAP Financial Measures
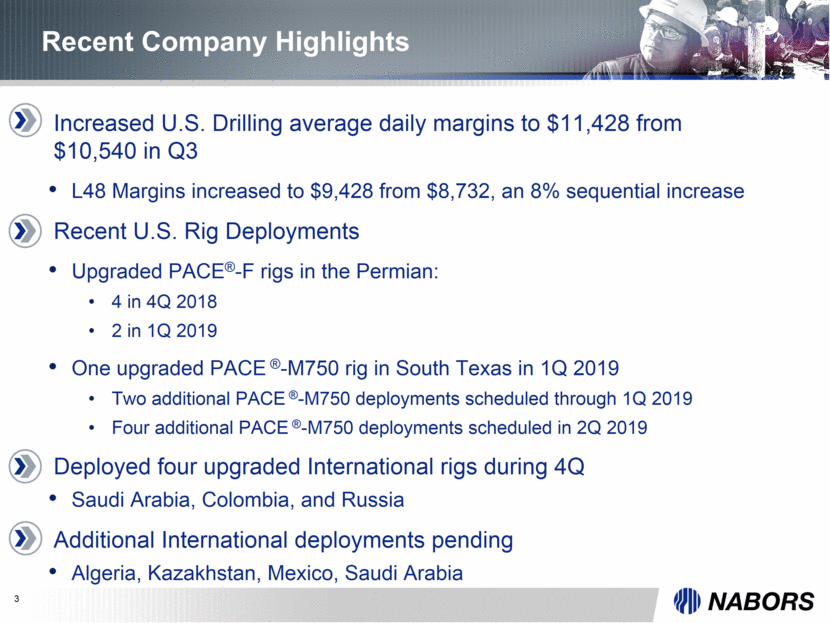
3 Recent Company Highlights Increased U.S. Drilling average daily margins to $11,428 from $10,540 in Q3 L48 Margins increased to $9,428 from $8,732, an 8% sequential increase Recent U.S. Rig Deployments Upgraded PACE®-F rigs in the Permian: 4 in 4Q 2018 2 in 1Q 2019 One upgraded PACE ®-M750 rig in South Texas in 1Q 2019 Two additional PACE ®-M750 deployments scheduled through 1Q 2019 Four additional PACE ®-M750 deployments scheduled in 2Q 2019 Deployed four upgraded International rigs during 4Q Saudi Arabia, Colombia, and Russia Additional International deployments pending Algeria, Kazakhstan, Mexico, Saudi Arabia
4 Financial Overview

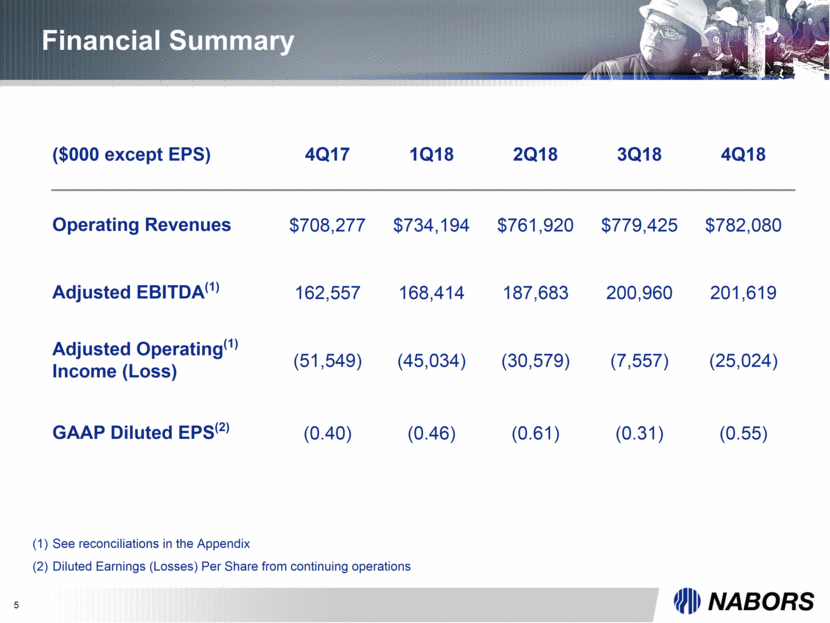
5 Financial Summary See reconciliations in the Appendix Diluted Earnings (Losses) Per Share from continuing operations ($000 except EPS) 4Q17 1Q18 2Q18 3Q18 4Q18 Operating Revenues $708,277 $734,194 $761,920 $779,425 $782,080 Adjusted EBITDA(1) 162,557 168,414 187,683 200,960 201,619 Adjusted Operating(1) Income (Loss) (51,549) (45,034) (30,579) (7,557) (25,024) GAAP Diluted EPS(2) (0.40) (0.46) (0.61) (0.31) (0.55)
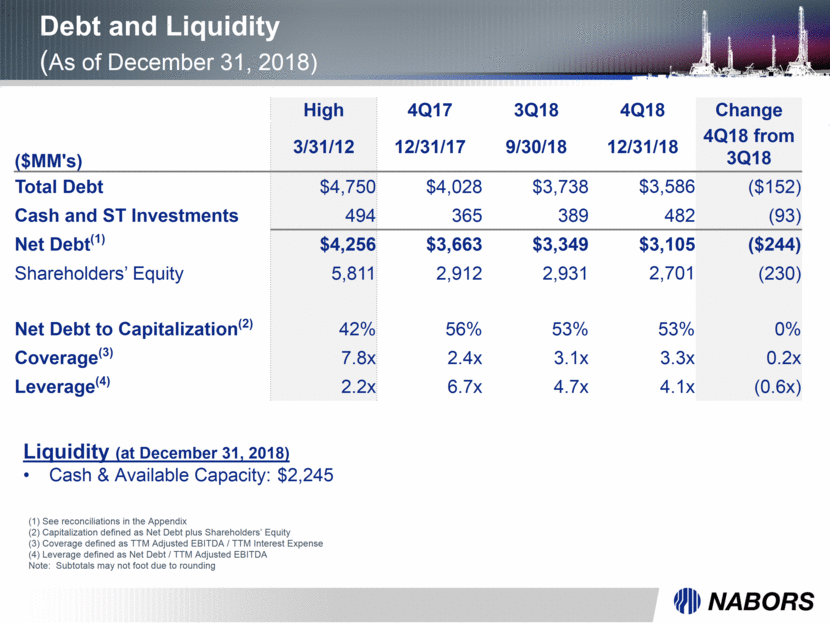
Debt and Liquidity (As of December 31, 2018) (1) See reconciliations in the Appendix (2) Capitalization defined as Net Debt plus Shareholders’ Equity (3) Coverage defined as TTM Adjusted EBITDA / TTM Interest Expense (4) Leverage defined as Net Debt / TTM Adjusted EBITDA Note: Subtotals may not foot due to rounding Liquidity (at December 31, 2018) Cash & Available Capacity: $2,245 High 4Q17 3Q18 4Q18 Change ($MM's) 3/31/12 12/31/17 9/30/18 12/31/18 4Q18 from 3Q18 Total Debt $4,750 $4,028 $3,738 $3,586 ($152) Cash and ST Investments 494 365 389 482 (93) Net Debt(1) $4,256 $3,663 $3,349 $3,105 ($244) Shareholders’ Equity 5,811 2,912 2,931 2,701 (230) Net Debt to Capitalization(2) 42% 56% 53% 53% 0% Coverage(3) 7.8x 2.4x 3.1x 3.3x 0.2x Leverage(4) 2.2x 6.7x 4.7x 4.1x (0.6x)
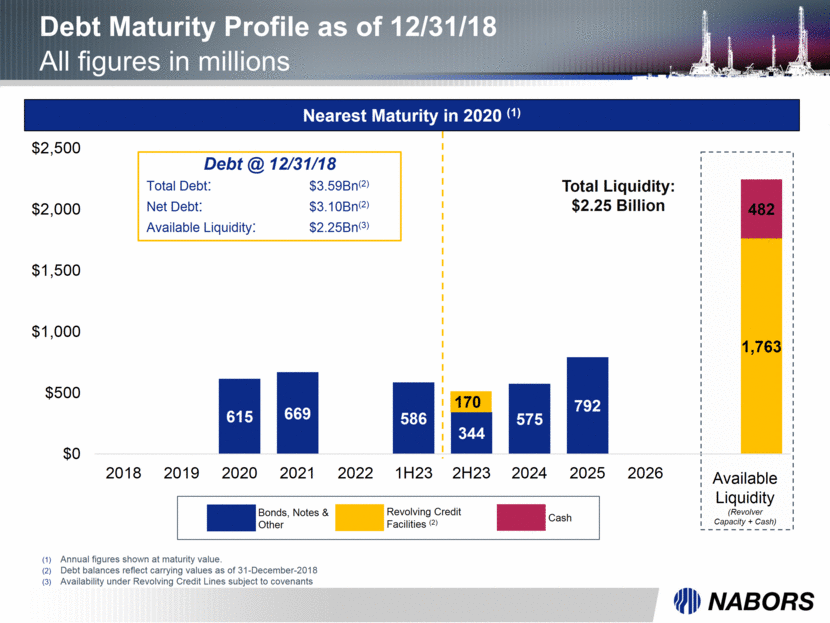
Debt Maturity Profile as of 12/31/18 All figures in millions Annual figures shown at maturity value. Debt balances reflect carrying values as of 31-December-2018 Availability under Revolving Credit Lines subject to covenants Nearest Maturity in 2020 (1) Debt @ 12/31/18 Total Debt: $3.59Bn(2) Net Debt: $3.10Bn(2) Available Liquidity: $2.25Bn(3) Available Liquidity (Revolver Capacity + Cash) Bonds, Notes & Other Revolving Credit Facilities (2) Cash Total Liquidity: $2.25 Billion 170 615 669 586 344 575 792 1,763 482 $0 $500 $1,000 $1,500 $2,000 $2,500 2018 2019 2020 2021 2022 1H23 2H23 2024 2025 2026
8 Business Segments
Rig Fleet(1) 4Q18 Average Rigs Working Average Utilization U.S. Lower 48 AC > 1500HP 112 99 88% AC Others 70 10 14% SCR Rigs 12 2 17% U.S. Lower 48 Total 194 111 57% U.S. Offshore 12 3 25% Alaska 16 3 19% Canada 41 18 44% International 133 88 66% Total Fleet 396 224 56% 9 4Q18 Rig Utilization & Availability As of December 31st, 2018 Note: Subtotals may not foot due to rounding

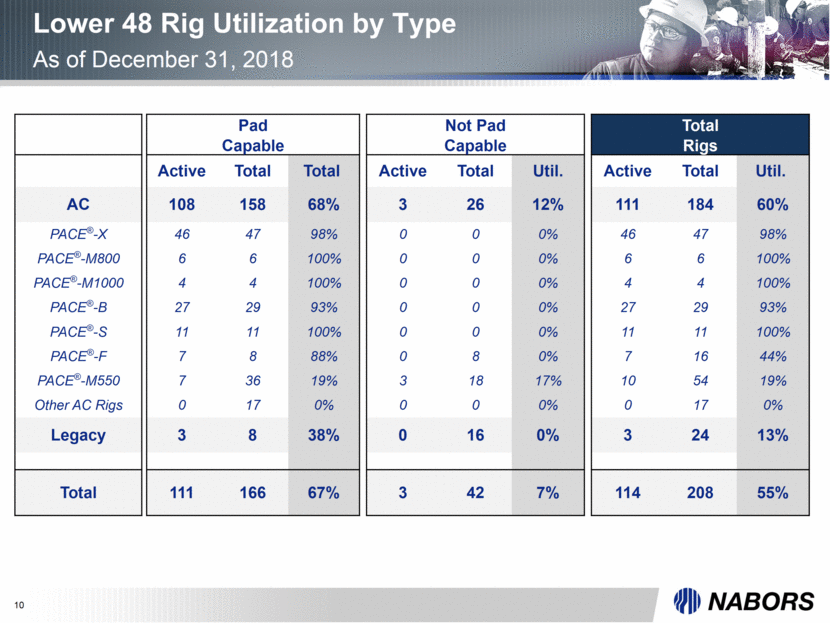
10 Lower 48 Rig Utilization by Type As of December 31, 2018 Pad Not Pad Total Capable Capable Rigs Active Total Total Active Total Util. Active Total Util. AC 108 158 68% 3 26 12% 111 184 60% PACE®-X 46 47 98% 0 0 0% 46 47 98% PACE®-M800 6 6 100% 0 0 0% 6 6 100% PACE®-M1000 4 4 100% 0 0 0% 4 4 100% PACE®-B 27 29 93% 0 0 0% 27 29 93% PACE®-S 11 11 100% 0 0 0% 11 11 100% PACE®-F 7 8 88% 0 8 0% 7 16 44% PACE®-M550 7 36 19% 3 18 17% 10 54 19% Other AC Rigs 0 17 0% 0 0 0% 0 17 0% Legacy 3 8 38% 0 16 0% 3 24 13% Total 111 166 67% 3 42 7% 114 208 55%
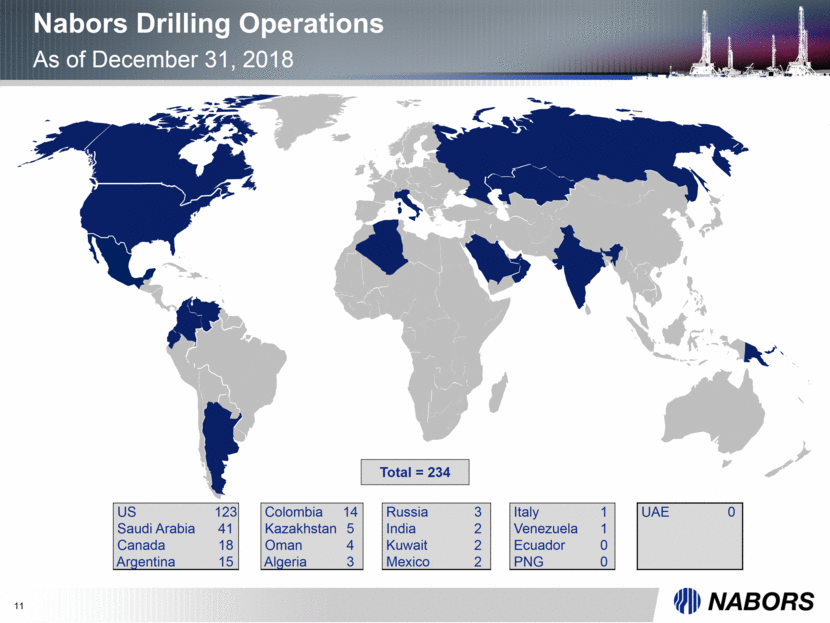
11 116 US 123 Colombia 14 Russia 3 Italy 1 UAE 0 Saudi Arabia 41 Kazakhstan 5 India 2 Venezuela 1 Canada 18 Oman 4 Kuwait 2 Ecuador 0 Argentina 15 Algeria 3 Mexico 2 PNG 0 Total = 234 Nabors Drilling Operations As of December 31, 2018
12 Appendix
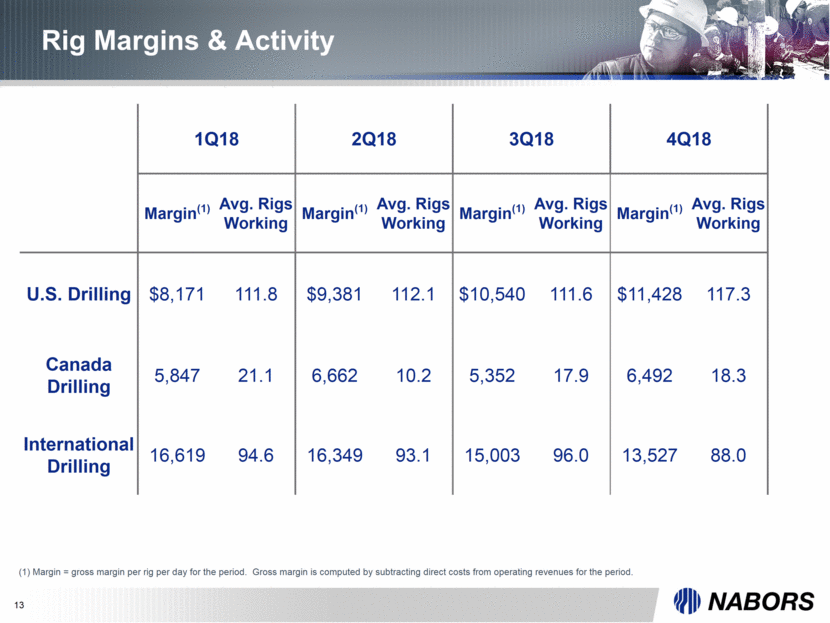
13 Rig Margins & Activity (1) Margin = gross margin per rig per day for the period. Gross margin is computed by subtracting direct costs from operating revenues for the period. 1Q18 2Q18 3Q18 4Q18 Margin(1) Avg. Rigs Working Margin(1) Avg. Rigs Working Margin(1) Avg. Rigs Working Margin(1) Avg. Rigs Working U.S. Drilling $8,171 111.8 $9,381 112.1 $10,540 111.6 $11,428 117.3 Canada Drilling 5,847 21.1 6,662 10.2 5,352 17.9 6,492 18.3 International Drilling 16,619 94.6 16,349 93.1 15,003 96.0 13,527 88.0
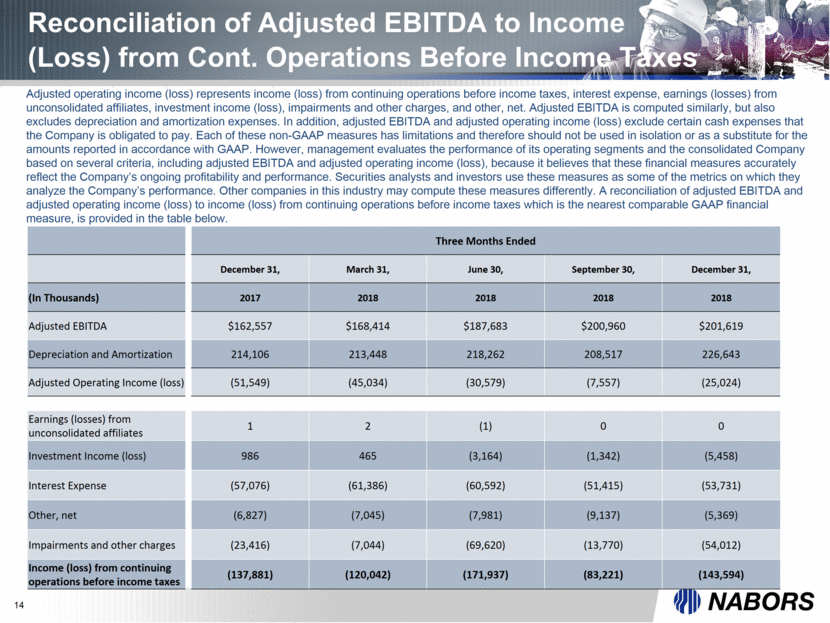
14 Reconciliation of Adjusted EBITDA to Income (Loss) from Cont. Operations Before Income Taxes Adjusted operating income (loss) represents income (loss) from continuing operations before income taxes, interest expense, earnings (losses) from unconsolidated affiliates, investment income (loss), impairments and other charges, and other, net. Adjusted EBITDA is computed similarly, but also excludes depreciation and amortization expenses. In addition, adjusted EBITDA and adjusted operating income (loss) exclude certain cash expenses that the Company is obligated to pay. Each of these non-GAAP measures has limitations and therefore should not be used in isolation or as a substitute for the amounts reported in accordance with GAAP. However, management evaluates the performance of its operating segments and the consolidated Company based on several criteria, including adjusted EBITDA and adjusted operating income (loss), because it believes that these financial measures accurately reflect the Company’s ongoing profitability and performance. Securities analysts and investors use these measures as some of the metrics on which they analyze the Company’s performance. Other companies in this industry may compute these measures differently. A reconciliation of adjusted EBITDA and adjusted operating income (loss) to income (loss) from continuing operations before income taxes which is the nearest comparable GAAP financial measure, is provided in the table below. Three Months Ended December 31, March 31, June 30, September 30, December 31, (In Thousands) 2017 2018 2018 2018 2018 Adjusted EBITDA $162,557 $168,414 $187,683 $200,960 $201,619 Depreciation and Amortization 214,106 213,448 218,262 208,517 226,643 Adjusted Operating Income (loss) (51,549) (45,034) (30,579) (7,557) (25,024) Earnings (losses) from unconsolidated affiliates 1 2 (1) 0 0 Investment Income (loss) 986 465 (3,164) (1,342) (5,458) Interest Expense (57,076) (61,386) (60,592) (51,415) (53,731) Other, net (6,827) (7,045) (7,981) (9,137) (5,369) Impairments and other charges (23,416) (7,044) (69,620) (13,770) (54,012) Income (loss) from continuing operations before income taxes (137,881) (120,042) (171,937) (83,221) (143,594)
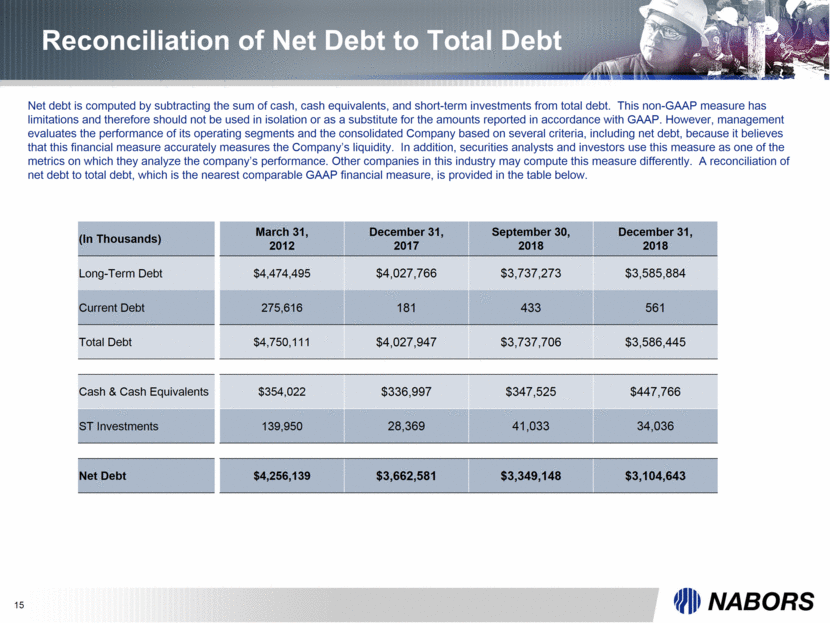
15 Reconciliation of Net Debt to Total Debt Net debt is computed by subtracting the sum of cash, cash equivalents, and short-term investments from total debt. This non-GAAP measure has limitations and therefore should not be used in isolation or as a substitute for the amounts reported in accordance with GAAP. However, management evaluates the performance of its operating segments and the consolidated Company based on several criteria, including net debt, because it believes that this financial measure accurately measures the Company’s liquidity. In addition, securities analysts and investors use this measure as one of the metrics on which they analyze the company’s performance. Other companies in this industry may compute this measure differently. A reconciliation of net debt to total debt, which is the nearest comparable GAAP financial measure, is provided in the table below. (In Thousands) March 31, 2012 December 31, 2017 September 30, 2018 December 31, 2018 Long-Term Debt $4,474,495 $4,027,766 $3,737,273 $3,585,884 Current Debt 275,616 181 433 561 Total Debt $4,750,111 $4,027,947 $3,737,706 $3,586,445 Cash & Cash Equivalents $354,022 $336,997 $347,525 $447,766 ST Investments 139,950 28,369 41,033 34,036 Net Debt $4,256,139 $3,662,581 $3,349,148 $3,104,643