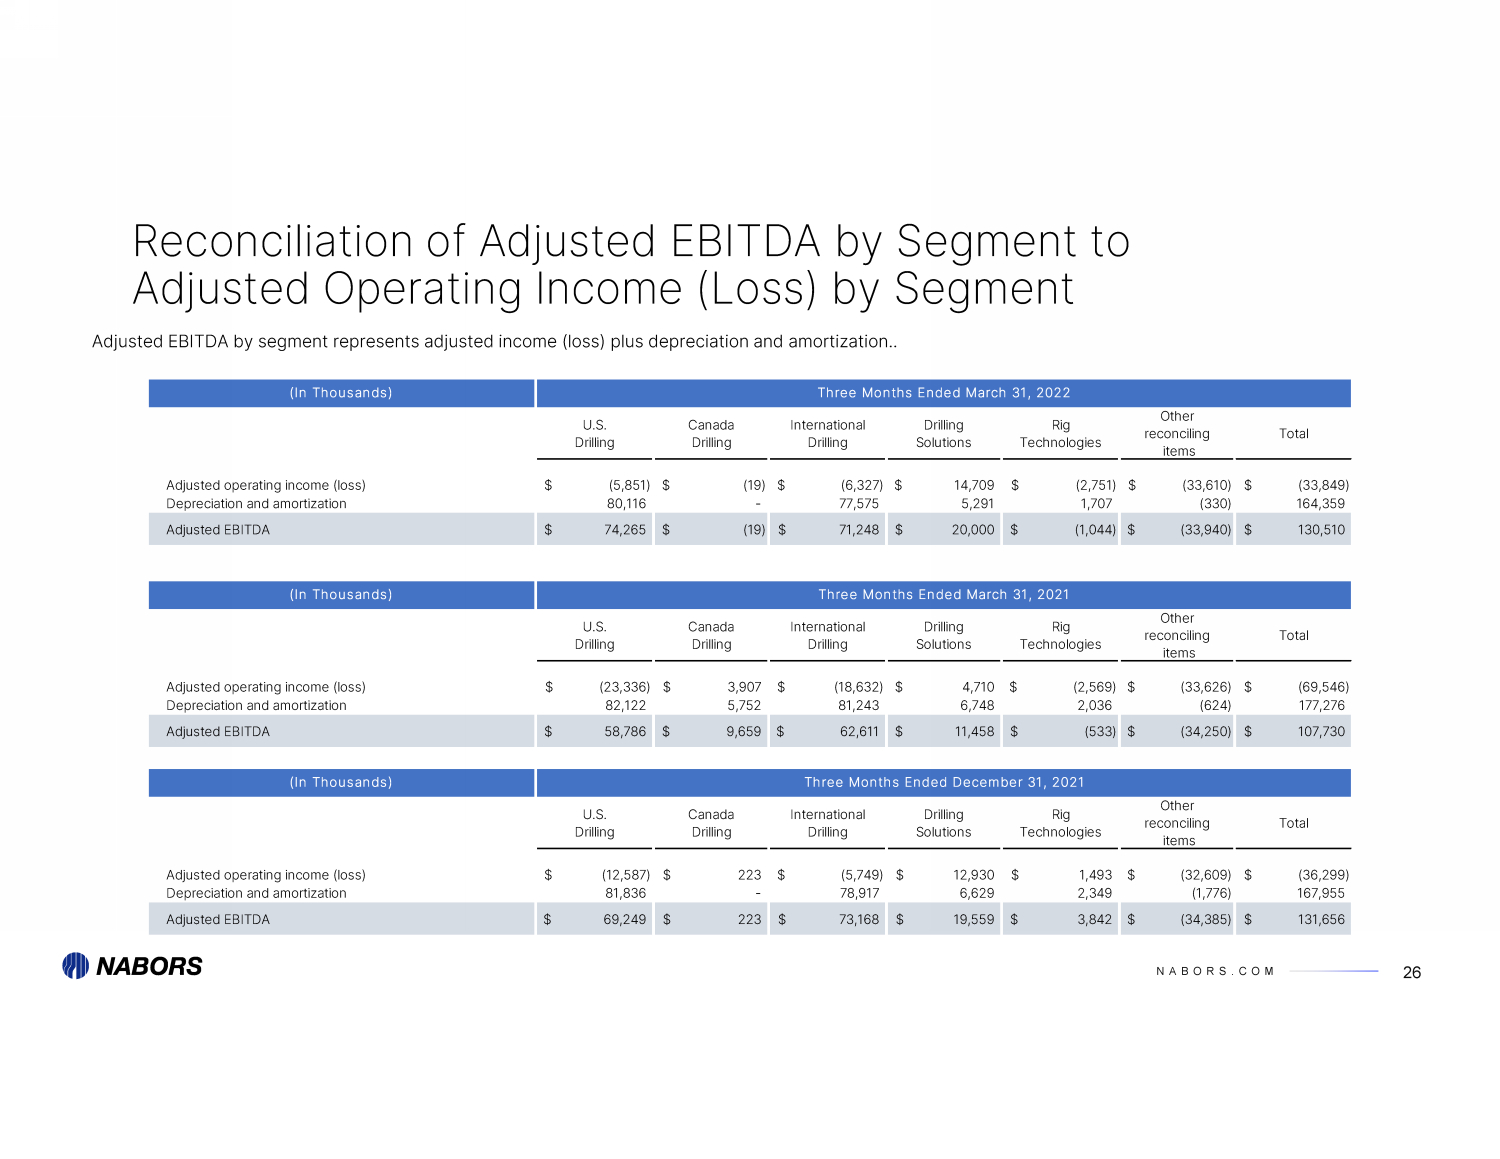
| NABORS.COM 26 Reconciliation of Adjusted EBITDA by Segment to Adjusted Operating Income (Loss) by Segment Adjusted EBITDA by segment represents adjusted income (loss) plus depreciation and amortization.. (In Thousands) Three Months Ended March 31, 2022 U.S. Drilling Canada Drilling International Drilling Drilling Solutions Rig Technologies Other reconciling items Total Adjusted operating income (loss) (5,851) $ (19) $ (6,327) $ 14,709 $ (2,751) $ (33,610) $ (33,849) $ Depreciation and amortization 80,116 - 77,575 5,291 1,707 (330) 164,359 Adjusted EBITDA 74,265 $ (19) $ 71,248 $ 20,000 $ (1,044) $ (33,940) $ 130,510 $ (In Thousands) Three Months Ended March 31, 2021 U.S. Drilling Canada Drilling International Drilling Drilling Solutions Rig Technologies Other reconciling items Total Adjusted operating income (loss) (23,336) $ 3,907 $ (18,632) $ 4,710 $ (2,569) $ (33,626) $ (69,546) $ Depreciation and amortization 82,122 5,752 81,243 6,748 2,036 (624) 177,276 Adjusted EBITDA 58,786 $ 9,659 $ 62,611 $ 11,458 $ (533) $ (34,250) $ 107,730 $ (In Thousands) Three Months Ended December 31, 2021 U.S. Drilling Canada Drilling International Drilling Drilling Solutions Rig Technologies Other reconciling items Total Adjusted operating income (loss) (12,587) $ 223 $ (5,749) $ 12,930 $ 1,493 $ (32,609) $ (36,299) $ Depreciation and amortization 81,836 - 78,917 6,629 2,349 (1,776) 167,955 Adjusted EBITDA 69,249 $ 223 $ 73,168 $ 19,559 $ 3,842 $ (34,385) $ 131,656 $ |