Exhibit 99.2

NABORS INDUSTRIES LTD. August 4, 2022 2Q 2022 Earnings Presentation

NABORS.COM We often discuss expectations regarding our future markets, demand for our products and services, and our performance in our annual, quarterly, and current reports, press releases, and other written and oral statements . Such statements, including statements in this document that relate to matters that are not historical facts, are “forward - looking statements” within the meaning of the safe harbor provisions of Section 27 A of the U . S . Securities Act of 1933 and Section 21 E of the U . S . Securities Exchange Act of 1934 . These “forward - looking statements” are based on our analysis of currently available competitive, financial and economic data and our operating plans . They are inherently uncertain, and investors should recognize that events and actual results could turn out to be significantly different from our expectations . Factors to consider when evaluating these forward - looking statements include, but are not limited to: • actual and potential political or economic instability, civil disturbance, war or acts of terrorism involving any of the countries in which we do business; • the Covid - 19 pandemic and its impact on oil and gas markets and prices; • fluctuations and volatility in worldwide prices of and demand for oil and natural gas; • fluctuations in levels of oil and natural gas exploration and development activities; • fluctuations in the demand for our services; • competitive and technological changes and other developments in the oil and gas and oilfield services industries; • our ability to renew customer contracts in order to maintain competitiveness; • the existence of operating risks inherent in the oil and gas and oilfield services industries; • the possibility of the loss of one or a number of our large customers; • the impact of long - term indebtedness and other financial commitments on our financial and operating flexibility; • our access to and the cost of capital, including the impact of a further downgrade in our credit rating, covenant restrictions, availability under our revolving credit facility, and future issuances of debt or equity securities; 2 Forward Looking Statements • our dependence on our operating subsidiaries and investments to meet our financial obligations; • our ability to retain skilled employees; • our ability to complete, and realize the expected benefits of, strategic transactions; • changes in tax laws and the possibility of changes in other laws and regulation; • the possibility of changes to U.S. trade policies and regulations including the imposition of trade embargoes or sanctions; and • general economic conditions, including inflation and the capital and credit markets. Our businesses depend, to a large degree, on the level of spending by oil and gas companies for exploration, development and production activities . Therefore, sustained lower oil or natural gas prices that have a material impact on exploration, development or production activities could also materially affect our financial position, results of operations and cash flows . The above description of risks and uncertainties is by no means all - inclusive but is designed to highlight what we believe are important factors to consider . For a discussion of these factors and other risks and uncertainties, please refer to our filings with the Securities and Exchange Commission ("SEC"), including those contained in our Annual Reports on Form 10 - K and Quarterly Reports on Form 10 - Q, which are available at the SEC's website at www . sec . gov . Non - GAAP Financial Measures This presentation refers to certain “non - GAAP” financial measures, such as adjusted EBITDA, net debt and adjusted free cash flow . The components of these non - GAAP measures are computed by using amounts that are determined in accordance with accounting principles generally accepted in the United States of America (“GAAP”) . Reconciliations of adjusted EBITDA to net income (loss), net debt to total debt, and adjusted margin to operating income (loss), which are their nearest comparable GAAP financial measures, are provided in the Appendix at the end of this presentation .
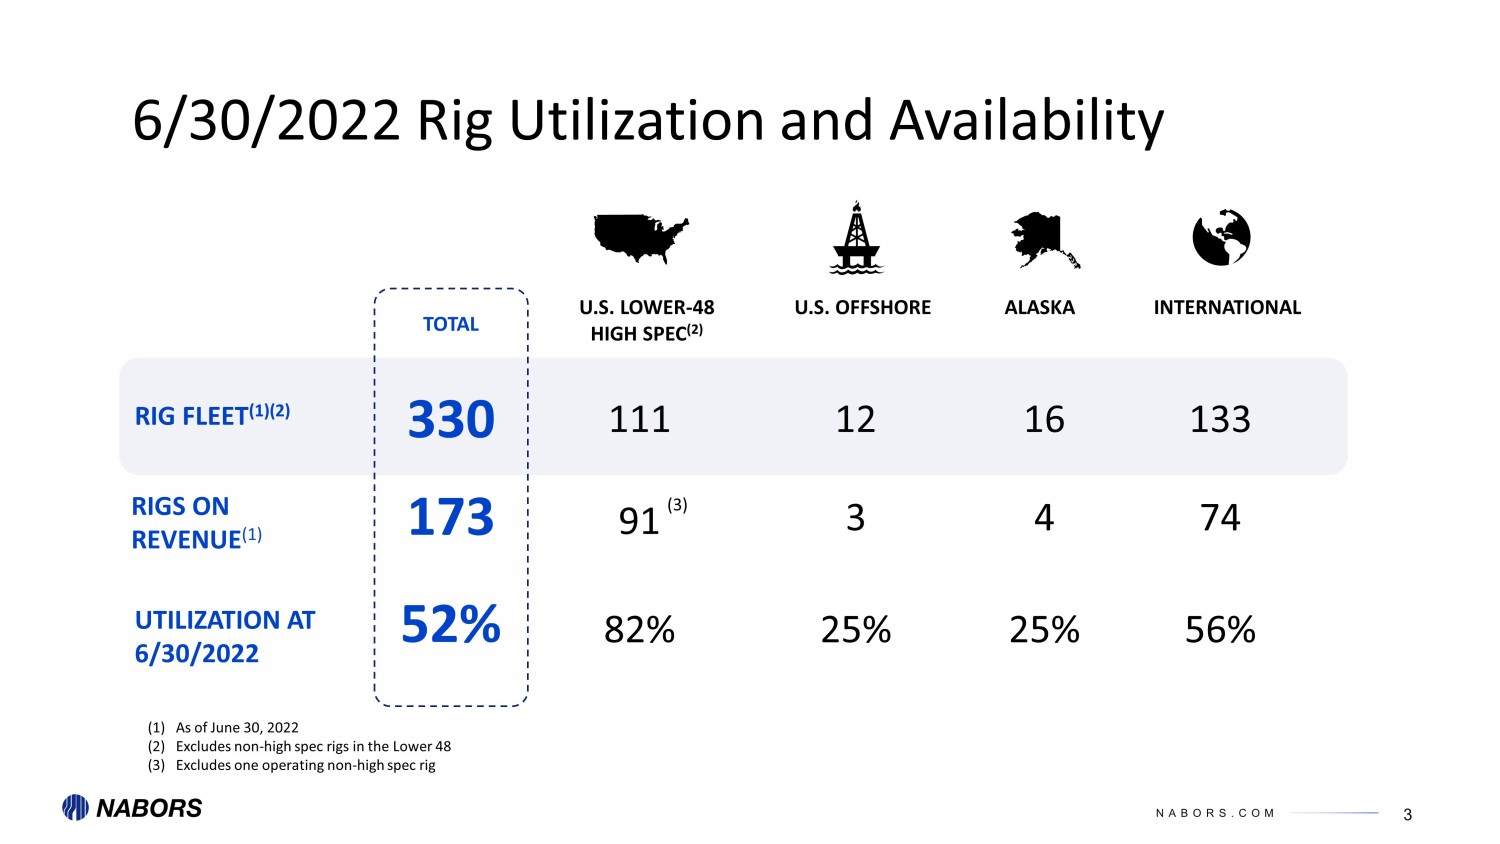
NABORS.COM 3 6/30/2022 Rig Utilization and Availability RIG FLEET (1)(2) 330 RIGS ON REVENUE (1) 173 UTILIZATION AT 6/30/2022 52% TOTAL U.S. OFFSHORE 12 3 25% 16 4 25% ALASKA INTERNATIONAL 133 74 56% 111 91 82% U.S. LOWER - 48 HIGH SPEC (2) (1) As of June 30, 2022 (2) Excludes non - high spec rigs in the Lower 48 (3) Excludes one operating non - high spec rig (3)

NABORS.COM Improving liquidity and leverage • Reduced net debt by $ 33 M in 2Q’22 • Adjusted free cash flow of $57M • Over $100M targeted for 2022 2 Q 2022 adjusted EBITDA of $158M Strong improvement in all segments Revenue growth of 11% Adjusted EBITDA margin (1) of 25% Drilling Solutions growth and market penetration • 2Q’22 adjusted EBITDA of $22.8M, 13.8% growth vs 1Q’22 • Adjusted gross margin % reached an all - time high of 52% in 2Q’22 • Our high margin Performance Software revenue grew by 18% Activity improving for U.S. Drilling • Average rig count up by almost 6 • Customer survey suggests 10% growth in 2H’22 • Customers initiating discussions for 2023 ESG Focus • Environmental ISS score improved from 2 in 1Q’22 to 1 in 2Q’22, placing Nabors first among our peers • Invested in 3 Energy Transition companies: • Emissions monitoring • Battery storage • Ultra - capacitors Recent Highlights Note: For adjusted EBITDA, adjusted gross margin and Net Debt see non - GAAP reconciliations in the Appendix Continued improvement in L48 profitability • L48 Drilling adjusted daily gross margin increased by over $1,000 to $8,706 (2) • We expect 3Q’22 Drilling gross margin of $10,400 to $10,600 per day • L48 NDS daily margins per rig continue to improve (1) Adjusted EBITDA margin represents adjusted EBITDA divided by operating revenues (2) A djusted daily gross margin represents adjusted gross margin (operating revenue less direct costs), divided by the total number of rig revenue days during the quarter. Rig revenue days represents the number of days the Company’s rigs are contracted and performing under a contract during the period.

NABORS.COM Performance excellence in the Lower - 48 Resilience leading to growth in our International segment Technology & innovation rapidly taking hold in the market Progress on our commitment to de - lever Leading in Sustainability and the Energy Transition Five Keys to Excellence 2 3 4 5 1

NABORS.COM 0 10 20 30 40 50 60 70 80 90 100 4Q 1Q 2Q 3Q 4Q 1Q 2Q 2020 2021 2022 L48 Drilling Average Rig Count $0 $50 $100 $150 $200 $250 4Q 1Q 2Q 3Q 4Q 1Q 2Q 2020 2021 2022 L48 Drilling Revenue and Adjusted Gross Margin Operating Revenue Adjusted Gross Margin 6 Improving revenue and margins on growing rig activity 1 Performance Excellence In The Lower - 48 Scaling up in a Robust Market

NABORS.COM Performance excellence in the Lower - 48 Resilience leading to growth in our International segment Technology & innovation rapidly taking hold in the market Progress on our commitment to de - lever Leading in Sustainability and the Energy Transition 2 3 4 5 1 Five Keys to Excellence

NABORS.COM Increases in rig activity driving margin expansion 8 Results Bolstered by Strong International Margins and Growing Rig Counts Resilience Leading to Growth in Our International Segment 2 50 55 60 65 70 75 80 4Q 1Q 2Q 3Q 4Q 1Q 2Q 2020 2021 2022 International Drilling Average Rig Count $0 $50 $100 $150 $200 $250 $300 4Q 1Q 2Q 3Q 4Q 1Q 2Q 2020 2021 2022 International Drilling Revenue and Adjusted Gross Margin Operating Revenue Adjusted Gross Margin

NABORS.COM 65 70 75 80 85 1QA 2QA 3QF 4QF 1Q 2Q 3Q 4Q 2022 2023 F International average rig count potential growth* from SANAD newbuilds 9 Significant International Opportunity Resilience Leading to Growth in Our International Segment • 50 rigs over 10 years, awarded 5 rigs to - date • First startup in early July, and second expected in late 3Q • $150M capital expense expected in 2022, funded organically by SANAD • 6 - year initial contracts, payout within 5 years, plus 4 - year renewal at market Embarking on Newbuild Program • These estimates are based on current market conditions and the projections are based on information received from third parties, which are subject to change. The estimates exclude potential growth from markets outside Saudi Arabia. 2

NABORS.COM Performance excellence in the Lower - 48 Resilience leading to growth in our International segment Technology & innovation rapidly taking hold in the market Progress on our commitment to de - lever Leading in Sustainability and the Energy Transition 2 3 4 5 1 Five Keys to Excellence

NABORS.COM 30% 35% 40% 45% 50% 55% 60% $- $10 $20 $30 $40 $50 $60 4Q 1Q 2Q 3Q Q4 Q1 2Q 2020 2021 2022 NDS Revenue and Adjusted Gross Margin Revenue Gross Margin % GM 11 NDS Capitalizing on Growing Rig Count and Higher Penetration Improving Outlook For Our Technology & Innovation Revenue Up 75% Adjusted GM Up 97% Expanding our high - value / high - margin low - capital technology services “Nabors currently realizing what they dreamed the future should look like (digitization, etc.)…the collaborative approach in developing new technologies has truncated traditional timelines that have allowed us to surpass our peers into consistent Top Quartile performance .” Bakken customer December 2021 3 Gross margin % of ~ 52% in 2Q 2022, an all time high

NABORS.COM 0 20 40 60 80 100 120 140 160 180 ROCKit SmartDRILL U.S. Performance Software Installs 2020 4Q 2021 1Q 2021 2Q 2021 3Q 2021 4Q 2022 1Q 2022 2Q 45 52 58 64 71 83 87 0 10 20 30 40 50 60 70 80 90 4Q 1Q 2Q 3Q 4Q 1Q 2Q 2020 2021 2022 U.S. RigCLOUD® Services Installs Nabors 3rd Party 12 Customer Adoption Fueling Rapid NDS Footprint Expansion Improving Outlook For Our Technology & Innovation NDS technology consistently adds value on both Nabors’ and Third - party rigs ® Œ 3
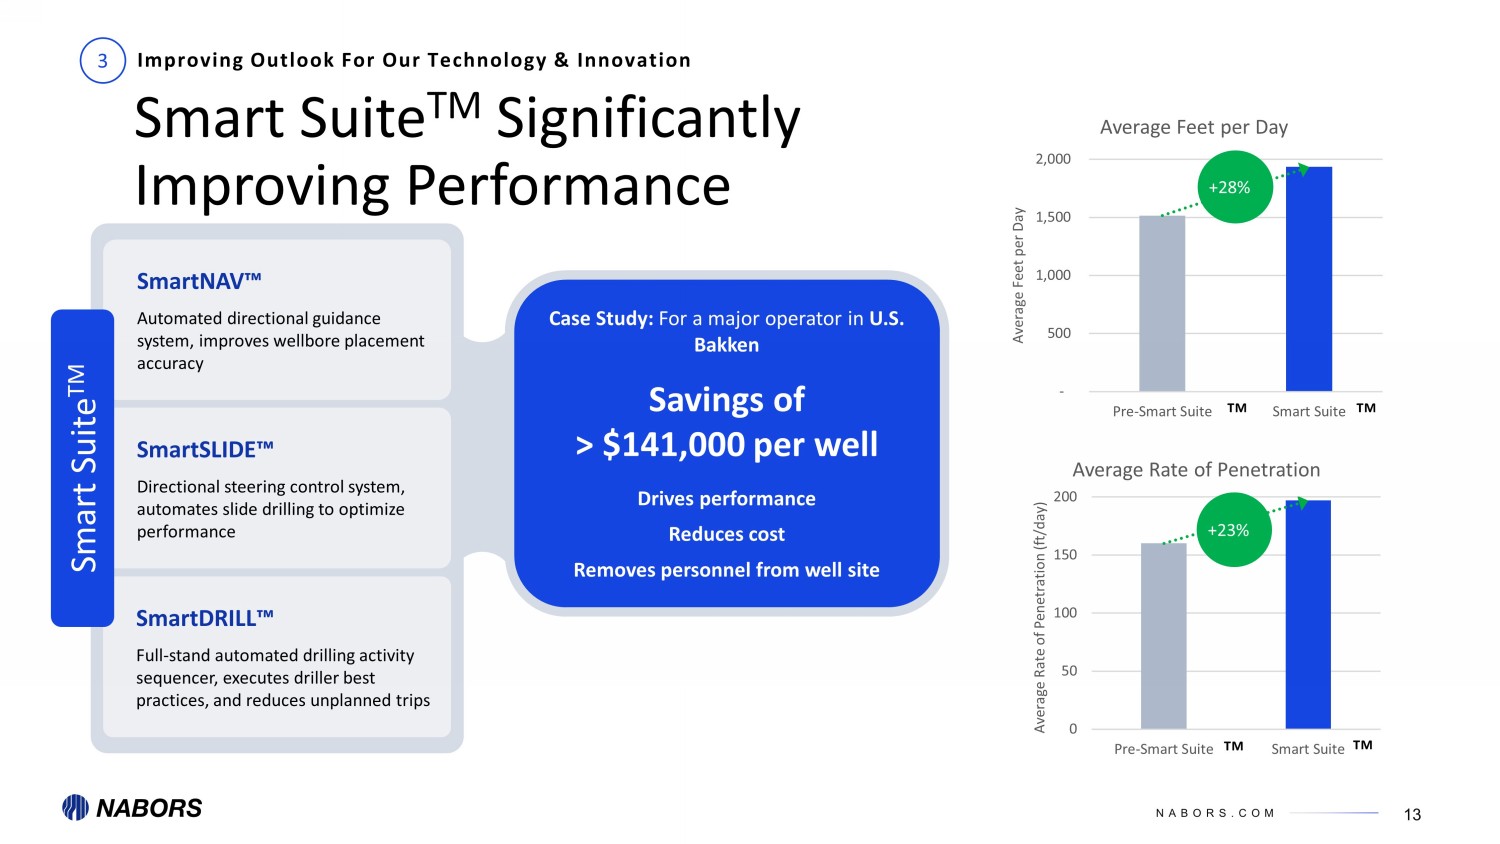
NABORS.COM Case Study: F or a major operator in U.S. Bakken Savings of > $141,000 per well D rives performance R educes cost Removes personnel from well site 13 Smart Suite TM Significantly Improving Performance - 500 1,000 1,500 2,000 Pre-Smart Suite Smart Suite Average Feet per Day Average Feet per Day +28% 0 50 100 150 200 Pre-Smart Suite Smart Suite Average Rate of Penetration (ft/day) Average Rate of Penetration +23% SmartNAV Ρ Automated directional guidance system, improves wellbore placement accuracy SmartSLIDE Ρ Directional steering control system, automates slide drilling to optimize performance SmartDRILL Ρ Full - stand automated drilling activity sequencer, executes driller best practices, and reduces unplanned trips Smart Suite TM Improving Outlook For Our Technology & Innovation 3 Ρ Ρ Ρ Ρ

NABORS.COM 0 200 400 600 800 1000 1200 1400 1600 1800 2000 Q2'17 Q4'17 Q2'18 Q4'18 Q2'19 Q4'19 Q2'20 Q4'20 Q1'21 Q2'21 Q3'21 Q4'21 Q1'22 Q2'22 Cumulative Number of Wells Drilled 14 Smart Suite TM Growth Trajectory Validates Customer Acceptance Improving Outlook For Our Technology & Innovation • 90% Customer Retention Rate* • 1,800+ Wells Drilled • International Deployment in KSA SmartDRILL TM Automation Commercialization SmartNAV TM & SmartSLIDE TM Solutions Commercialization Third - Party SmartDRILL TM Deployment *The number of active users at 2Q’22 quarter - end continuing use of the service divided by the total number of active users 12 months prior 3

NABORS.COM Performance excellence in the Lower - 48 Resilience leading to growth in our International segment Technology & innovation rapidly taking hold in the market Progress on our commitment to de - lever Leading in Sustainability and the Energy Transition 2 3 4 5 1 Five Keys to Excellence

NABORS.COM $- $0.5 $1.0 $1.5 $2.0 $2.5 $3.0 $3.5 $4.0 1Q 2Q 3Q 4Q 1Q 2Q 3Q 4Q 1Q 2Q 3Q 4Q 1Q 2Q 3Q 4Q 1Q 2Q 2018 2019 2020 2021 2022 Billions Net Debt 16 Significant Headway toward Financial Goals Progress on Our Commitment to De - lever 4 ~ $1.7B Net Debt (1) reduction from previous high in 1Q 2018 $1.7B (1) Net Debt: see non - GAAP reconciliations in the Appendix

NABORS.COM 75 177 728 558 700 390 $0 $200 $400 $600 $800 $1,000 2022 2023 2024 2025 2026 2027 2028 Million Notes Outstanding 17 Debt Maturity Profile as of 6/30/22 Progress on Our Commitment to De - lever In 2Q 2022: • Reduced outstanding notes by $25M in face value • Undrawn $350M credit facility; cash and STI of $418M • $251M in maturities through 2024 (1) 4 (1) Face value of debt outstanding

NABORS.COM Performance excellence in the Lower - 48 Resilience leading to growth in our International segment Technology & innovation rapidly taking hold in the market Progress on our commitment to de - lever Leading in Sustainability and the Energy Transition 2 3 4 5 1 Five Keys to Excellence
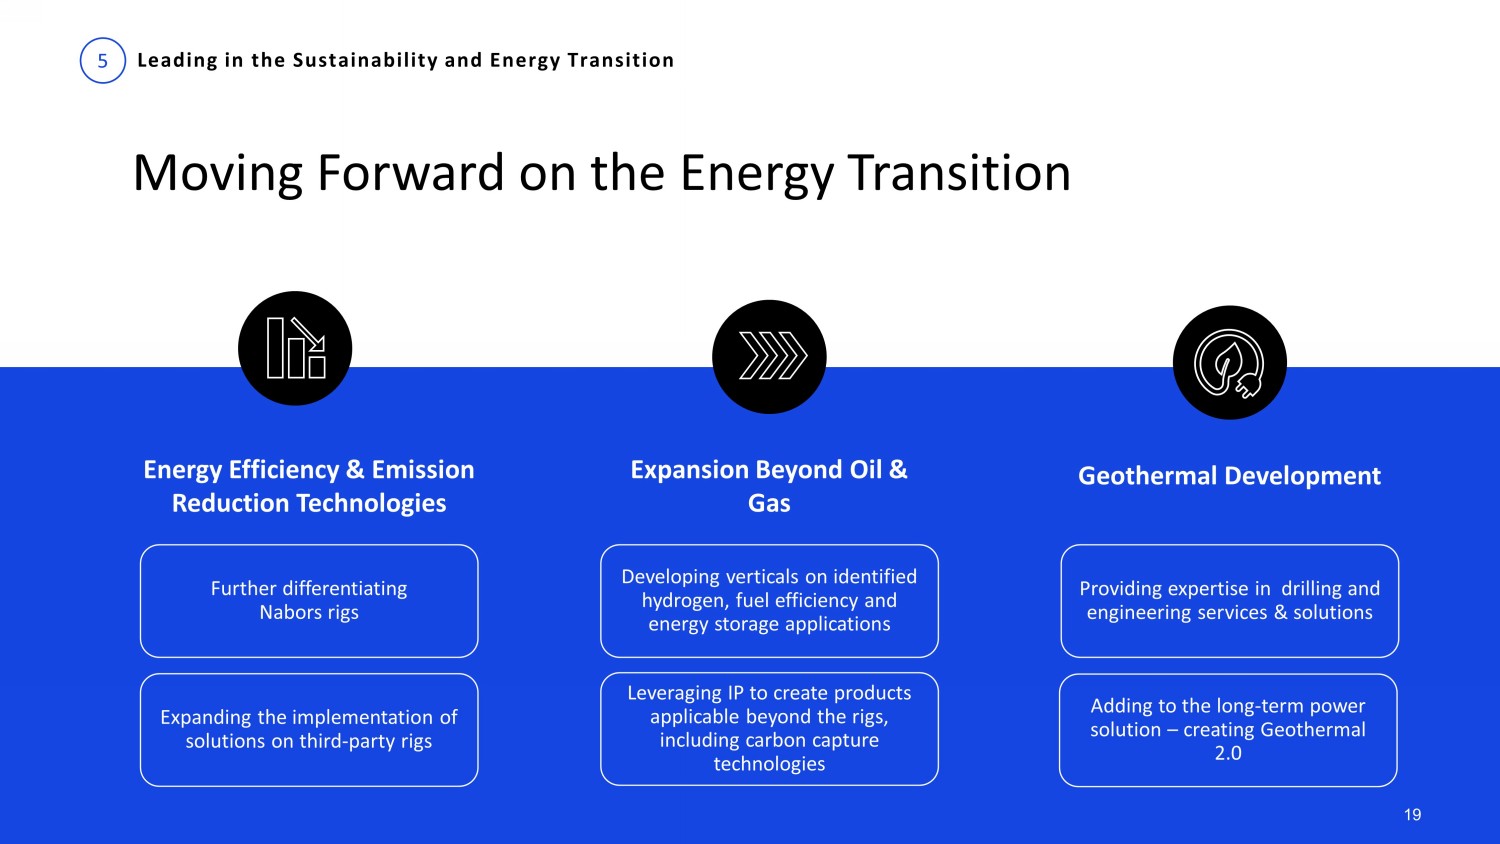
NABORS.COM Expanding the implementation of solutions on third - party rigs Energy Efficiency & Emission Reduction Technologies Geothermal Development Leveraging IP to create products applicable beyond the rigs, including carbon capture technologies Expansion Beyond Oil & Gas Further differentiating Nabors rigs Developing verticals on identified hydrogen, fuel efficiency and energy storage applications Providing expertise in drilling and engineering services & solutions Adding to the long - term power solution – creating Geothermal 2.0 19 Moving Forward on the Energy Transition Leading in the Sustainability and Energy Transition 5

NABORS.COM 20 Leading in the Sustainability and Energy Transition • Advanced control system optimizes the efficiency of fuel consumption • Deploying energy storage systems on multiple rigs • Introducing innovative fuel enhancer to reduce fuel consumption and GHG emissions • Achieved approximately a 10% reduction in carbon emissions intensity in the Lower 48 in 2021 Operating rigs with the environment as a stakeholder Investing in carbon capture, emissions monitoring/reduction, energy storage, power management technologies and geothermal energy Dedicated to improving the environmental footprint of OFS 5 Growing Commitment to Operational and Environmental Stewardship PowerTAP Ρ highline power transformer module

NABORS.COM Geothermal Market Technology Advancements Ubiquitous Ability to create heat reservoirs by drilling into deep rock formations Technological advancements are enabling wide - scale commercial geothermal development Innovative Drilling Technologies Reducing cost per energy - unit produced by using and combining new technologies Baseload Reliable and available 24/7 Renewable Subsurface heat replenished naturally Nabors and its predecessor entities have been continuously innovating in the energy sector for over 100 years 21 Leading in the Sustainability and Energy Transition 5

NABORS.COM Appendix 22

NABORS.COM 23 Reconciliation of Non - GAAP Financial Measures to Net Income (Loss) Adjusted EBITDA represents net income (loss) before income (loss) from discontinued operations, net of tax, income taxes, inv est ment income (loss), interest expense, other, net and depreciation and amortization. Adjusted EBITDA is a non - GAAP financial measure and should not be used in isolation or as a subst itute for the amounts reported in accordance with GAAP. In addition, adjusted EBITDA excludes certain cash expenses that the Company is obligated to make. However, management evalua tes the performance of its operating segments and the consolidated Company based on several criteria, including adjusted EBITDA and adjusted operating income (loss), because it be lie ves that these financial measures accurately reflect the Company’s ongoing profitability and performance. Securities analysts and investors use this measure as one of the metrics on wh ich they analyze the Company’s performance. Other companies in this industry may compute these measures differently. A reconciliation of this non - GAAP measure to net income (los s), which is the most closely comparable GAAP measure, is provided in the table below. Three Months Ended June 30, March 31, June 30, 2021 2022 2022 Net income (loss) ($190,395) ($174,668) ($69,935) (Income) loss from discontinued operations, net of tax ($8) $0 $0 Income (loss) from continuing operations, net of tax ($190,403) ($174,668) ($69,935) Income tax expense (benefit) $24,719 $13,671 $9,353 Income (loss) from continuing operations before income taxes ($165,684) ($160,997) ($60,582) Investment (income) loss 62 (163) (822) Interest Expense 41,714 46,910 42,899 Other, net 66,455 80,401 14,528 Adjusted Operating Income (loss) (57,453) (33,849) (3,977) Depreciation and Amortization 174,775 164,359 162,015 Adjusted EBITDA $117,322 $130,510 $158,038 (In Thousands)

NABORS.COM Three Months Ended June 30, March 31, June 30, 2021 2022 2022 Lower 48 - U.S. - Drilling Adjusted operating income (31,721)$ (14,596)$ (937)$ Plus: General and administrative costs 4,396 4,447 4,740 Plus: Research and engineering 732 1,638 1,611 GAAP Gross Margin (26,593) (8,511) 5,414 Plus: Depreciation and amortization 67,119 66,243 65,312 Adjusted gross margin 40,526$ 57,732$ 70,726$ Other - U.S. - Drilling Adjusted operating income 10,852$ 8,745$ 9,225$ Plus: General and administrative costs 550 383 307 Plus: Research and engineering 100 132 139 GAAP Gross Margin 11,502 9,260 9,671 Plus: Depreciation and amortization 13,534 13,873 13,771 Adjusted gross margin 25,036$ 23,133$ 23,442$ U.S. - Drilling Adjusted operating income (20,869)$ (5,851)$ 8,288$ Plus: General and administrative costs 4,946 4,830 5,047 Plus: Research and engineering 832 1,770 1,750 GAAP Gross Margin (15,091) 749 15,085 Plus: Depreciation and amortization 80,653 80,116 79,083 Adjusted gross margin 65,562$ 80,865$ 94,168$ (In Thousands) 24 Reconciliation of U.S. Drilling Segment Adjusted Gross Margin to U.S. Drilling Segment Adjusted Operating Income Adjusted gross margin by segment represents Adjusted operating income (loss) plus General and administrative costs, Research an d engineering costs and Depreciation and amortization.

NABORS.COM 25 Reconciliation of Net Debt to Total Debt Net debt is computed by subtracting the sum of cash, cash equivalents and short - term investments from total debt. This non - GAAP measure has limitations and therefore should not be used in isolation or as a substitute for the amounts reported in accordance with GAAP. However, management evaluates the perf orm ance of its operating segments and the consolidated Company based on several criteria, including net debt, because it believes that this financial measure accurately measures th e C ompany’s liquidity. In addition, securities analysts and investors use this measure as one of the metrics on which they analyze the company’s performance. Other companies in this ind ust ry may compute this measure differently. A reconciliation of net debt to total debt, which is the nearest comparable GAAP financial measure, is provided in the table be low . June 30, March 31, June 30, 2021 2022 2022 Long-Term Debt $2,823,125 $2,610,092 $2,601,510 Current Debt - - - Total Debt $2,823,125 $2,610,092 $2,601,510 Cash & Short-term Investments $399,897 $394,039 $417,978 Net Debt $2,423,228 $2,216,053 $2,183,532 (In Thousands)

NABORS.COM (In Thousands) Three Months Ended June 30, 2022 U.S. Drilling Canada Drilling International Drilling Drilling Solutions Rig Technologies Other reconciling items Total Adjusted operating income (loss) 8,288$ (15)$ 4,605$ 18,260$ 2,127$ (37,242)$ (3,977)$ Depreciation and amortization 79,083 - 77,841 4,491 1,237 (637) 162,015 Adjusted EBITDA 87,371$ (15)$ 82,446$ 22,751$ 3,364$ (37,879)$ 158,038$ (In Thousands) Three Months Ended June 30, 2021 U.S. Drilling Canada Drilling International Drilling Drilling Solutions Rig Technologies Other reconciling items Total Adjusted operating income (loss) (20,869)$ (2,608)$ (8,439)$ 6,524$ (692)$ (31,369)$ (57,453)$ Depreciation and amortization 80,653 5,616 79,761 6,272 2,727 (254) 174,775 Adjusted EBITDA 59,784$ 3,008$ 71,322$ 12,796$ 2,035$ (31,623)$ 117,322$ (In Thousands) Three Months Ended March 31, 2022 U.S. Drilling Canada Drilling International Drilling Drilling Solutions Rig Technologies Other reconciling items Total Adjusted operating income (loss) (5,851)$ (19)$ (6,327)$ 14,709$ (2,751)$ (33,610)$ (33,849)$ Depreciation and amortization 80,116 - 77,575 5,291 1,707 (330) 164,359 Adjusted EBITDA 74,265$ (19)$ 71,248$ 20,000$ (1,044)$ (33,940)$ 130,510$ 26 Reconciliation of Adjusted EBITDA by Segment to Adjusted Operating Income (Loss) by Segment Adjusted EBITDA by segment represents adjusted income (loss) plus depreciation and amortization.

NABORS.COM 27 Reconciliation of Adjusted Free Cash Flow to Net Cash Provided by Operating Activities Adjusted free cash flow represents net cash provided by operating activities less cash used for capital expenditures, net of pro ceeds from sales of assets. Management believes that adjusted free cash flow is an important liquidity measure for the company and that it is useful to investors and management a s a measure of the company’s ability to generate cash flow, after reinvesting in the company for future growth, that could be available for paying down debt or to return to shareholders th rough dividend payments or share repurchases. Adjusted free cash flow does not represent the residual cash flow available for discretionary expenditures. Adjusted free cash flow i s a non - GAAP financial measure that should be considered in addition to, not as a substitute for or superior to, cash flow from operations reported in accordance with GAAP. Three Months Ended June 30 2022 Net cash provided by operating activities $120,796 Capital expenditures ($76,632) Proceeds from sales of assets $12,760 Adjusted free cash flow $56,924 (In Thousands)

NABORS INDUSTRIES LTD. NABORS.COM NABORS CORPORATE SERVICES 515 W. Greens Road Suite 1200 Houston, TX 77067 - 4525 @naborsglobal Contact Us: William C. Conroy, CFA VP - Corporate Development and Investor Relations William.Conroy@nabors.com Kara K. Peak Director - Corporate Development and Investor Relations Kara.Peak@nabors.com