UNITED STATES
SECURITIES AND EXCHANGE COMMISSION
Washington, D.C. 20549
FORM N-CSR
CERTIFIED SHAREHOLDER REPORT OF REGISTERED
MANAGEMENT INVESTMENT COMPANIES
Investment Company Act file number
811-10603
Western Asset Premier Bond Fund
(Exact name of registrant as specified in charter)
620 Eighth Avenue, 47th Floor, New York, NY 10018
(Address of principal executive offices) (Zip code)
Marc A. De Oliveira.
Franklin Templeton
100 First Stamford Place
Stamford, CT 06902
(Name and address of agent for service)
Registrant’s telephone number, including area code:
1-888-777-0102
Date of fiscal year end: December 31
Date of reporting period: June 30, 2024
| ITEM 1. | REPORT TO STOCKHOLDERS. |
The Semi-Annual Report to Stockholders is filed herewith.
Semi-Annual ReportJune 30, 2024
WESTERN ASSET
PREMIER BOND FUND (WEA)
Fund objective
The Fund’s investment objective is to provide current income and capital appreciation by investing primarily in a diversified portfolio of investment grade bonds.
Under normal market conditions, the Fund expects to invest substantially all (but at least 80%) of its total managed assets in bonds, including corporate bonds, U.S. government and agency securities and mortgage-related securities, and at least 65% of its total managed assets in bonds that, at the time of purchase, are of investment grade quality. The Fund may invest up to 35% of its total managed assets in bonds of below investment grade quality (commonly referred to as “junk bonds”) at the time of purchase. The Fund may invest in securities or instruments other than bonds (including preferred stock) and may invest up to 10% of its total managed assets in instruments denominated in currencies other than the U.S. dollar. The Fund may invest in a variety of derivative instruments for investment or risk management purposes. The Fund expects that the average effective duration of its portfolio will range between 3.5 and seven years, although this target duration may change from time to time. Trust preferred interests and capital securities are considered bonds and not preferred stock for purposes of the foregoing guidelines.
Western Asset Premier Bond Fund
Letter from the president
Dear Shareholder,
We are pleased to provide the semi-annual report of Western Asset Premier Bond Fund for the six-month reporting period ended June 30, 2024. Please read on for Fund performance information during the Fund’s reporting period.
Special shareholder notice
Effective March 1, 2024, the named portfolio management team responsible for the day-to-day oversight of the Fund is as follows: Michael Buchanan, Ryan Brist, Blanton Keh and Christopher Kilpatrick.
As always, we remain committed to providing you with excellent service and a full spectrum of investment choices. We also remain committed to supplementing the support you receive from your financial advisor. One way we accomplish this is through our website, www.franklintempleton.com. Here you can gain immediate access to market and investment information, including:
•
Fund prices and performance,
•
Market insights and commentaries from our portfolio managers, and
•
A host of educational resources.
We look forward to helping you meet your financial goals.
Jane Trust, CFA
President and Chief Executive Officer
Western Asset Premier Bond Fund
(This page intentionally left blank.)
For the six months ended June 30, 2024, Western Asset Premier Bond Fund returned 0.92% based on its net asset value (“NAV”)i and 0.98% based on its New York Stock Exchange (“NYSE”) market price per share. The Fund’s unmanaged benchmarks, the Bloomberg U.S. Corporate High Yield Indexii and the Bloomberg U.S. Credit Indexiii, returned 2.58% and -0.46%, respectively, for the same period.
The Fund has a practice of seeking to maintain a relatively stable level of distributions to shareholders. This practice has no impact on the Fund’s investment strategy and may reduce the Fund’s NAV. The Fund’s manager believes the practice helps maintain the Fund’s competitiveness and may benefit the Fund’s market price and premium/discount to the Fund’s NAV.
During the six-month period, the Fund made distributions to shareholders totaling $0.42 per share. As of June 30, 2024, the Fund estimates that all of the distributions were sourced from net investment income.* The performance table shows the Fund’s six-month total return based on its NAV and market price as of June 30, 2024. Past performance is no guarantee of future results.
Performance Snapshot as of June 30, 2024 (unaudited) |
| |
| |
| |
All figures represent past performance and are not a guarantee of future results. Performance figures for periods shorter than one year represent cumulative figures and are not annualized.
** Total returns are based on changes in NAV or market price, respectively. Returns reflect the deduction of all Fund expenses, including management fees, operating expenses, and other Fund expenses. Returns do not reflect the deduction of brokerage commissions or taxes that investors may pay on distributions or the sale of shares.
† Total return assumes the reinvestment of all distributions, including returns of capital, if any, at NAV.
‡ Total return assumes the reinvestment of all distributions, including returns of capital, if any, in additional shares in accordance with the Fund’s Dividend Reinvestment Plan.
Looking for additional information?
The Fund is traded under the symbol “WEA” and its closing market price is available in most newspapers under the NYSE listings. The daily NAV is available online under the symbol “XWEAX” on most financial websites. Barron’s and The Wall Street Journal’s Monday edition both carry closed-end fund tables that provide additional information. In
*
This estimate is not for tax purposes. The Fund will issue a Form 1099 with final composition of the distributions for tax purposes after year-end. A return of capital is not taxable and results in a reduction in the tax basis of a shareholder’s investment. For more information about a distribution’s composition, please refer to the Fund’s distribution press release or, if applicable, the Section 19 notice located in the press release section of our website, www.franklintempleton.com.
Western Asset Premier Bond Fund Semi-Annual Report
Performance review (cont’d)
addition, the Fund issues a quarterly press release that can be found on most major financial websites as well as www.franklintempleton.com.
In a continuing effort to provide information concerning the Fund, shareholders may call 1-888-777-0102 (toll free), Monday through Friday from 8:00 a.m. to 5:30 p.m. Eastern Time, for the Fund’s current NAV, market price and other information.
Thank you for your investment in the Western Asset Premier Bond Fund. As always, we appreciate that you have chosen us to manage your assets and we remain focused on achieving the Fund’s investment goals.
Sincerely,
Jane Trust, CFA
President and Chief Executive Officer
RISKS: The Fund is a diversified closed-end management investment company designed primarily as a long-term investment and not as a trading vehicle. The Fund is not intended to be a complete investment program and, due to the uncertainty inherent in all investments, there can be no assurance that the Fund will achieve its investment objective. The Fund’s common shares are traded on the NYSE. Similar to stocks, the Fund’s share price will fluctuate with market conditions and, at the time of sale, may be worth more or less than the original investment. Shares of closed-end funds often trade at a discount to their net asset value. Diversification does not assure against market loss. The Fund’s investments are subject to a number of risks, including credit, inflation and interest rate risks. As interest rates rise, bond prices fall, reducing the value of a fixed income investment’s price. The Fund may invest in high-yield bonds (commonly referred to as “junk” bonds), which are rated below investment grade and carry more risk than higher-rated securities. To the extent that the Fund invests in asset-backed, mortgage-backed or mortgage-related securities, its exposure to prepayment and extension risks may be greater than if it invested in other fixed income securities. Leverage may result in greater volatility of NAV and the market price of common shares and increases a shareholder’s risk of loss. Investing in foreign securities is subject to certain risks not associated with domestic investing, such as currency fluctuations and social, political, and economic uncertainties which could result in significant volatility. These risks are magnified in emerging or developing markets. Emerging market and developing market countries tend to have economic, political, and legal systems that are less developed and are less stable than those of more developed countries. The Fund may make significant investments in derivative instruments. Derivative instruments can be illiquid, may disproportionately increase losses, and have a potentially large impact on Fund performance. The market values of securities or other assets will fluctuate, sometimes sharply and unpredictably, due to changes in general market conditions, overall economic trends or events, governmental actions or intervention, actions taken by the U.S. Federal Reserve or
Western Asset Premier Bond Fund Semi-Annual Report
foreign central banks, market disruptions caused by trade disputes or other factors, political developments, armed conflicts, economic sanctions and countermeasures in response to sanctions, major cybersecurity events, investor sentiment, the global and domestic effects of a pandemic, and other factors that may or may not be related to the issuer of the security or other asset. The Fund may also invest in money market funds, including funds affiliated with the Fund’s investment advisers.
This material is not intended as a recommendation or as investment advice of any kind, including in connection with rollovers, transfers, and distributions. Such material is not provided in a fiduciary capacity, may not be relied upon for or in connection with the making of investment decisions, and does not constitute a solicitation of an offer to buy or sell securities. All content has been provided for informational or educational purposes only and is not intended to be and should not be construed as legal or tax advice and/or a legal opinion. Always consult a financial, tax and/or legal professional regarding your specific situation.
All investments are subject to risk including the possible loss of principal. Past performance is no guarantee of future results. All index performance reflects no deduction for fees, expenses or taxes. Please note that an investor cannot invest directly in an index.
i
Net asset value (NAV) is calculated by subtracting total liabilities, including liabilities associated with financial leverage (if any), from the closing value of all securities held by the Fund (plus all other assets) and dividing the result (total net assets) by the total number of the common shares outstanding. The NAV fluctuates with changes in the market prices of securities in which the Fund has invested. However, the price at which an investor may buy or sell shares of the Fund is the Fund’s market price as determined by supply of and demand for the Fund’s shares.
ii
The Bloomberg U.S. Corporate High Yield Index covers the universe of fixed-rate, non-investment grade debt, including corporate and non-corporate sectors. Pay-in-kind (“PIK”) bonds, Eurobonds and debt issues from countries designated as emerging markets are excluded, but Canadian and global bonds (SEC registered) of issuers in non-emerging market countries are included. Original issue zero coupon bonds, step-up coupon structures and 144A securities are also included.
iii
The Bloomberg U.S. Credit Index is an index composed of corporate and non-corporate debt issues that are investment grade (rated Baa3/BBB or higher).
Important data provider notices and terms available at www.franklintempletondatasources.com.
Western Asset Premier Bond Fund Semi-Annual Report
(This page intentionally left blank.)
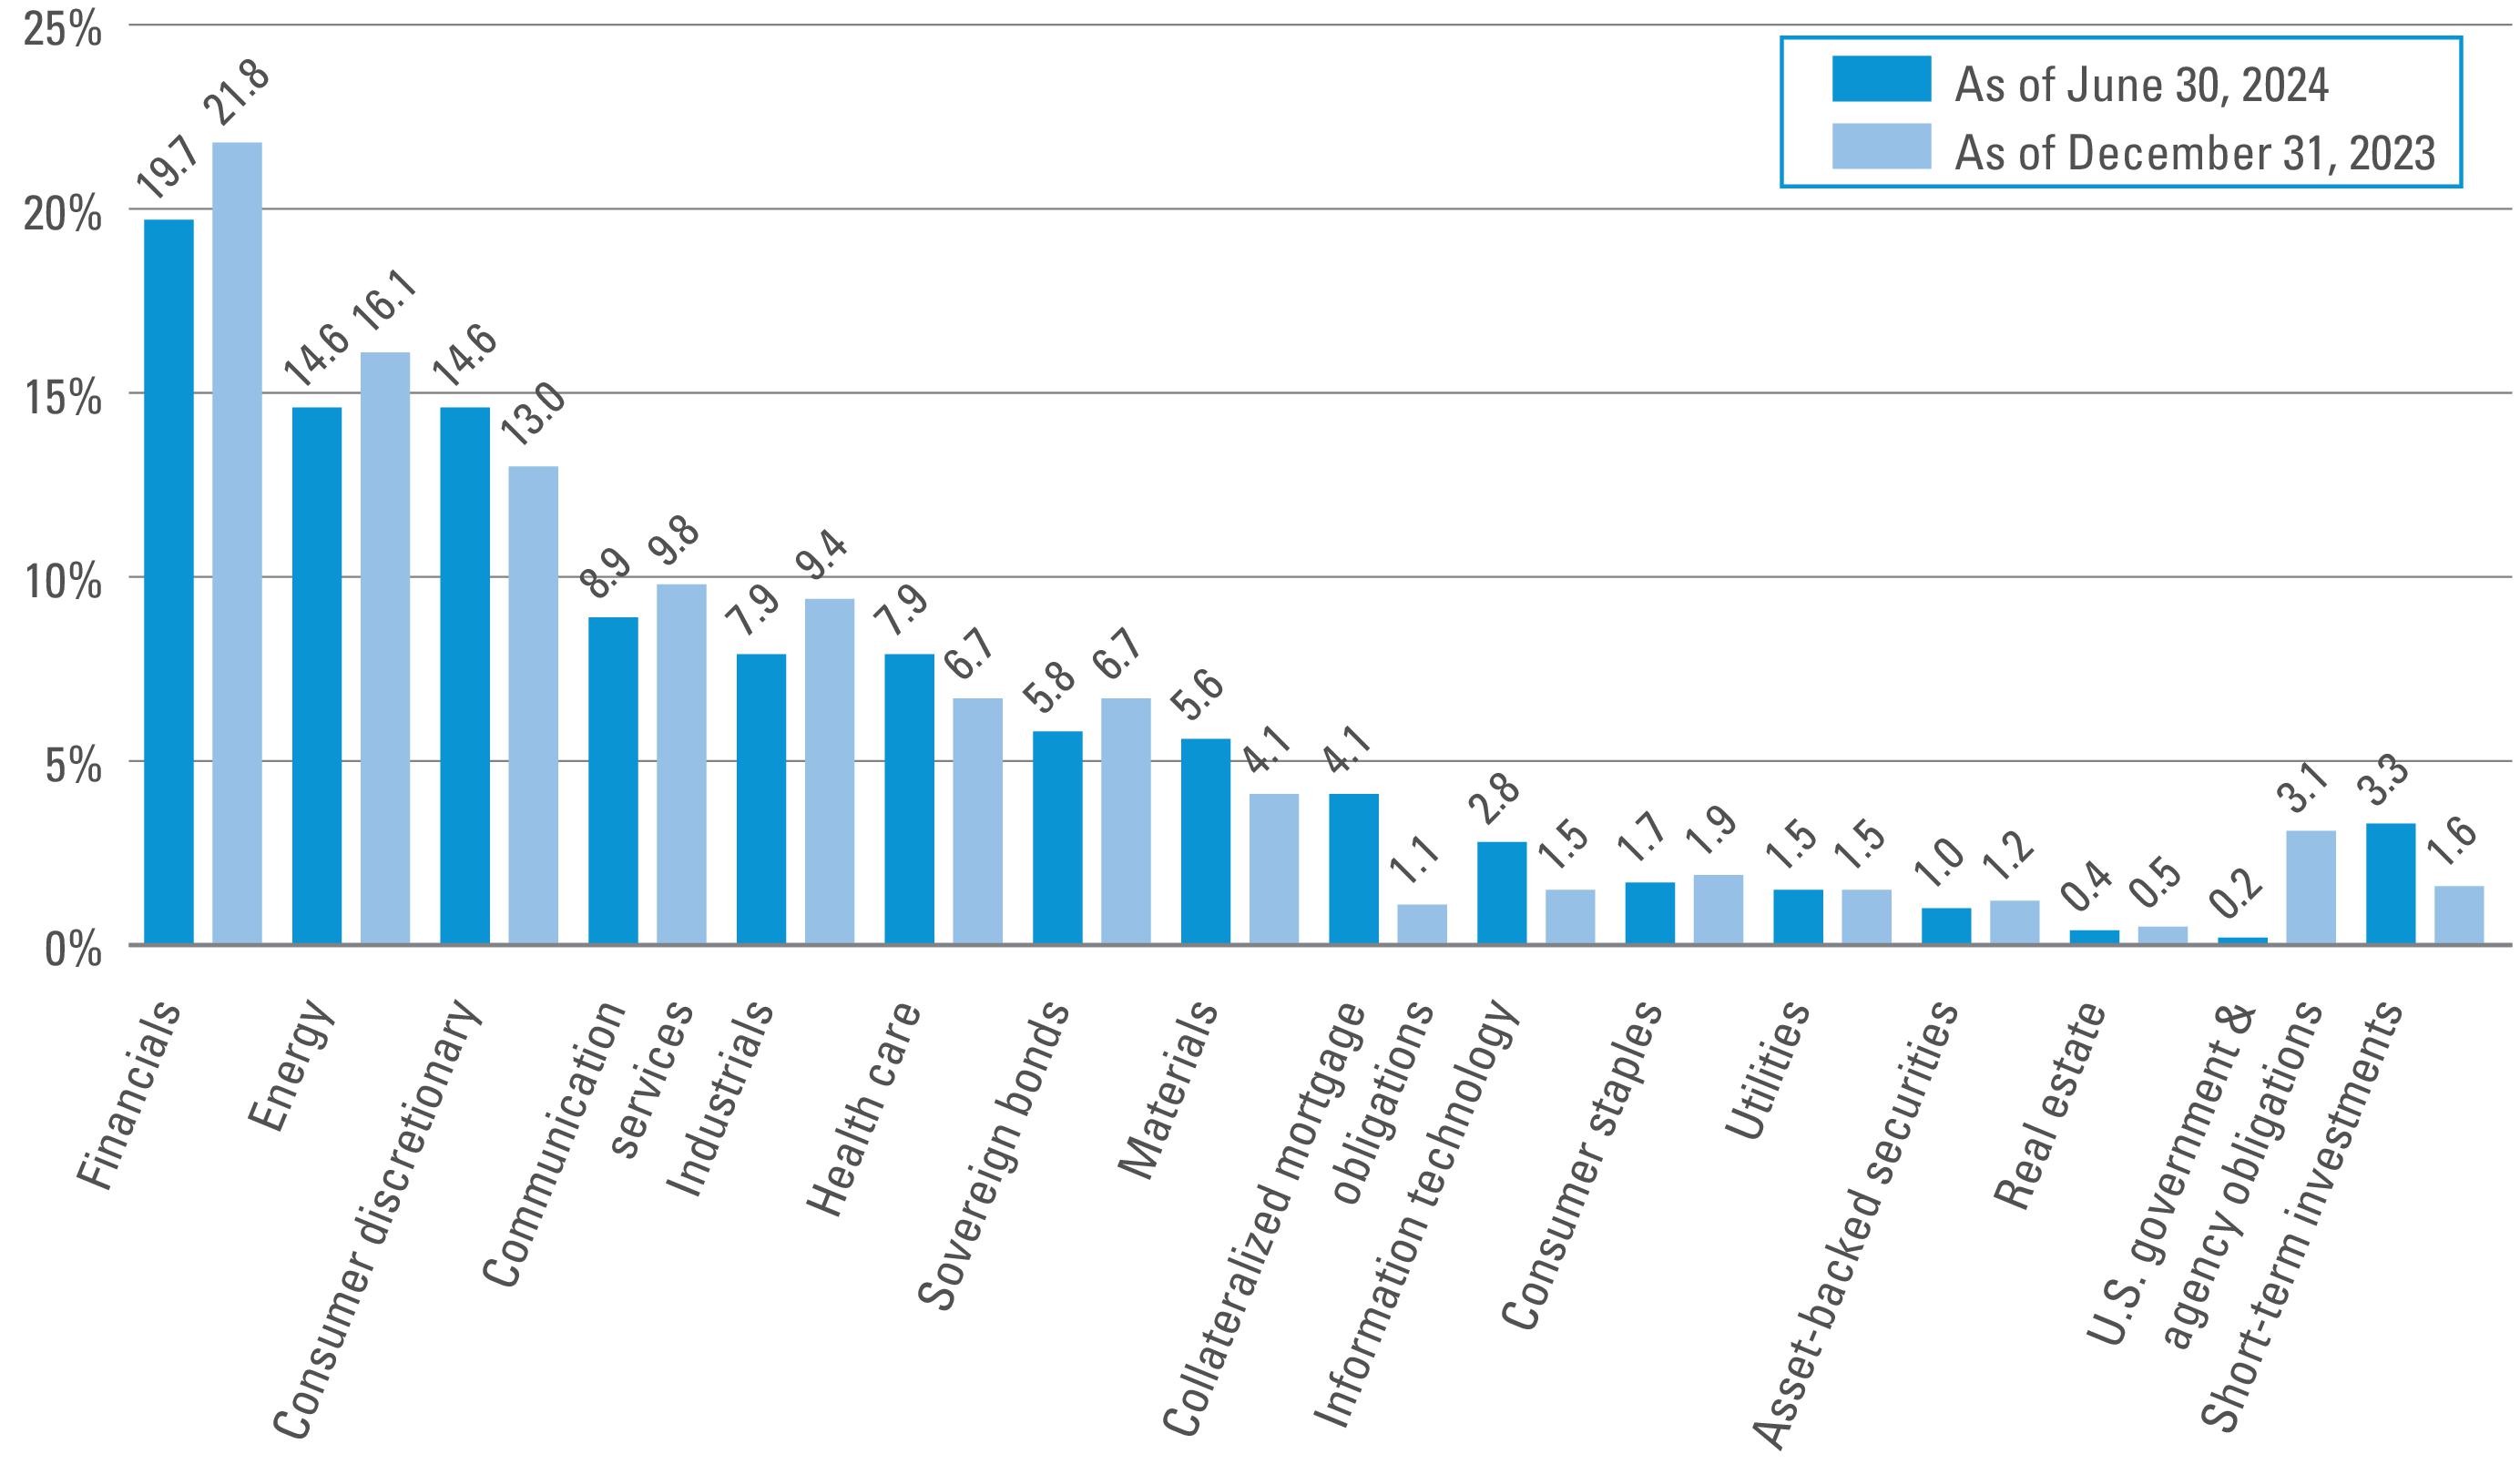
Fund at a glance† (unaudited)
Investment breakdown (%) as a percent of total investments
†
The bar graph above represents the Fund’s portfolio as of June 30, 2024, and December 31, 2023, and does not include derivatives, such as forward foreign currency contracts. The Fund is actively managed. As a result, the composition of the Fund’s investments is subject to change at any time.
Western Asset Premier Bond Fund 2024 Semi-Annual Report
Schedule of investments (unaudited)June 30, 2024 Western Asset Premier Bond Fund
(Percentages shown based on Fund net assets)
| | | | | |
Corporate Bonds & Notes — 113.5% |
Communication Services — 12.6% |
Diversified Telecommunication Services — 3.9% |
Altice Financing SA, Senior Secured Notes | | | | |
Altice Financing SA, Senior Secured Notes | | | | |
Altice France Holding SA, Senior Secured Notes | | | | |
Altice France SA, Senior Secured Notes | | | | |
British Telecommunications PLC, Senior Notes | | | | |
Lumen Technologies Inc., Senior Notes | | | | |
Orange SA, Junior Subordinated Notes (2.375% to 4/15/25 then EUR 5 year Swap Rate + 2.359%) | | | | |
| | | | |
Verizon Communications Inc., Senior Notes | | | | |
Verizon Communications Inc., Senior Notes | | | | |
Total Diversified Telecommunication Services | |
|
Banijay Entertainment SASU, Senior Secured Notes | | | | |
Netflix Inc., Senior Notes | | | | |
Walt Disney Co., Senior Notes | | | | |
Walt Disney Co., Senior Notes | | | | |
Warnermedia Holdings Inc., Senior Notes | | | | |
| |
Interactive Media & Services — 0.1% |
Match Group Holdings II LLC, Senior Notes | | | | |
|
Charter Communications Operating LLC/ Charter Communications Operating Capital Corp., Senior Secured Notes | | | | |
Comcast Corp., Senior Notes | | | | |
Comcast Corp., Senior Notes | | | | |
DirecTV Financing LLC/DirecTV Financing Co-Obligor Inc., Senior Secured Notes | | | | |
DISH DBS Corp., Senior Notes | | | | |
DISH DBS Corp., Senior Notes | | | | |
DISH DBS Corp., Senior Notes | | | | |
See Notes to Financial Statements.
Western Asset Premier Bond Fund 2024 Semi-Annual Report
Western Asset Premier Bond Fund
(Percentages shown based on Fund net assets)
| | | | | |
|
| | | | |
Time Warner Cable LLC, Senior Secured Notes | | | | |
| |
Wireless Telecommunication Services — 3.0% |
CSC Holdings LLC, Senior Notes | | | | |
CSC Holdings LLC, Senior Notes | | | | |
CSC Holdings LLC, Senior Notes | | | | |
Millicom International Cellular SA, Senior Notes | | | | |
Sprint Capital Corp., Senior Notes | | | | |
Sprint Capital Corp., Senior Notes | | | | |
T-Mobile USA Inc., Senior Notes | | | | |
Vmed O2 UK Financing I PLC, Senior Secured Notes | | | | |
Vmed O2 UK Financing I PLC, Senior Secured Notes | | | | |
Total Wireless Telecommunication Services | |
|
Total Communication Services | |
Consumer Discretionary — 18.2% |
Automobile Components — 2.7% |
Adient Global Holdings Ltd., Senior Notes | | | | |
American Axle & Manufacturing Inc., Senior Notes | | | | |
American Axle & Manufacturing Inc., Senior Notes | | | | |
Garrett Motion Holdings Inc./Garrett LX I Sarl, Senior Notes | | | | |
JB Poindexter & Co. Inc., Senior Notes | | | | |
ZF North America Capital Inc., Senior Notes | | | | |
ZF North America Capital Inc., Senior Notes | | | | |
Total Automobile Components | |
|
Ford Motor Co., Senior Notes | | | | |
General Motors Co., Senior Notes | | | | |
General Motors Co., Senior Notes | | | | |
General Motors Co., Senior Notes | | | | |
Mercedes-Benz Finance North America LLC, Senior Notes | | | | |
See Notes to Financial Statements.
Western Asset Premier Bond Fund 2024 Semi-Annual Report
Schedule of investments (unaudited) (cont’d)June 30, 2024 Western Asset Premier Bond Fund
(Percentages shown based on Fund net assets)
| | | | | |
|
|
Nissan Motor Acceptance Co. LLC, Senior Notes | | | | |
Volkswagen Group of America Finance LLC, Senior Notes | | | | |
| |
|
Amazon.com Inc., Senior Notes | | | | |
Marks & Spencer PLC, Senior Notes | | | | |
| | | | |
| |
|
Ritchie Bros Holdings Inc., Senior Notes | | | | |
Diversified Consumer Services — 1.1% |
APCOA Parking Holdings GmbH, Senior Secured Notes | | | | |
APCOA Parking Holdings GmbH, Senior Secured Notes | | | | |
Carriage Services Inc., Senior Notes | | | | |
WW International Inc., Senior Secured Notes | | | | |
Total Diversified Consumer Services | |
Hotels, Restaurants & Leisure — 7.2% |
888 Acquisitions Ltd., Senior Secured Notes | | | | |
Carnival PLC, Senior Notes | | | | |
IRB Holding Corp., Senior Secured Notes | | | | |
Las Vegas Sands Corp., Senior Notes | | | | |
Marston’s Issuer PLC, Secured Notes (SONIA + 2.669%) | | | | |
NCL Corp. Ltd., Senior Notes | | | | |
NCL Corp. Ltd., Senior Notes | | | | |
NCL Corp. Ltd., Senior Secured Notes | | | | |
NCL Finance Ltd., Senior Notes | | | | |
Royal Caribbean Cruises Ltd., Senior Notes | | | | |
Royal Caribbean Cruises Ltd., Senior Notes | | | | |
| | | | |
Sands China Ltd., Senior Notes | | | | |
Wheel Bidco Ltd., Senior Secured Notes | | | | |
See Notes to Financial Statements.
Western Asset Premier Bond Fund 2024 Semi-Annual Report
Western Asset Premier Bond Fund
(Percentages shown based on Fund net assets)
| | | | | |
|
Hotels, Restaurants & Leisure — continued |
Wynn Macau Ltd., Senior Notes | | | | |
Wynn Macau Ltd., Senior Notes | | | | |
Total Hotels, Restaurants & Leisure | |
Household Durables — 0.5% |
Lennar Corp., Senior Notes | | | | |
Lennar Corp., Senior Notes | | | | |
| |
|
Global Auto Holdings Ltd./AAG FH UK Ltd., Senior Notes | | | | |
Michaels Cos. Inc., Senior Secured Notes | | | | |
Sally Holdings LLC/Sally Capital Inc., Senior Notes | | | | |
| |
|
Total Consumer Discretionary | |
|
|
Anheuser-Busch Cos. LLC/Anheuser-Busch InBev Worldwide Inc., Senior Notes | | | | |
|
JBS USA Holding Lux Sarl/JBS USA Food Co./JBS Lux Co. Sarl, Senior Notes | | | | |
Kraft Heinz Foods Co., Senior Notes | | | | |
| |
|
Altria Group Inc., Senior Notes | | | | |
Reynolds American Inc., Senior Notes | | | | |
| |
|
| |
|
Energy Equipment & Services — 0.2% |
Noble Finance II LLC, Senior Notes | | | | |
Oil, Gas & Consumable Fuels — 21.2% |
Anadarko Finance Co., Senior Notes | | | | |
Burlington Resources LLC, Senior Notes | | | | |
Cheniere Energy Partners LP, Senior Notes | | | | |
Columbia Pipeline Group Inc., Senior Notes | | | | |
Continental Resources Inc., Senior Notes | | | | |
Continental Resources Inc., Senior Notes | | | | |
See Notes to Financial Statements.
Western Asset Premier Bond Fund 2024 Semi-Annual Report
Schedule of investments (unaudited) (cont’d)June 30, 2024 Western Asset Premier Bond Fund
(Percentages shown based on Fund net assets)
| | | | | |
|
Oil, Gas & Consumable Fuels — continued |
Crescent Energy Finance LLC, Senior Notes | | | | |
Devon Energy Corp., Senior Notes | | | | |
Diamondback Energy Inc., Senior Notes | | | | |
Ecopetrol SA, Senior Notes | | | | |
Ecopetrol SA, Senior Notes | | | | |
Energy Transfer LP, Junior Subordinated Notes (6.625% to 2/15/28 then 3 mo. USD LIBOR + 4.155%) | | | | |
EOG Resources Inc., Senior Notes | | | | |
EQM Midstream Partners LP, Senior Notes | | | | |
EQM Midstream Partners LP, Senior Notes | | | | |
| | | | |
| | | | |
Hilcorp Energy I LP/Hilcorp Finance Co., Senior Notes | | | | |
KazMunayGas National Co. JSC, Senior Notes | | | | |
Kinder Morgan Inc., Senior Notes | | | | |
Kinder Morgan Inc., Senior Notes | | | | |
NGPL PipeCo LLC, Senior Notes | | | | |
Occidental Petroleum Corp., Senior Notes | | | | |
| | | | |
Pan American Energy LLC, Senior Notes | | | | |
Petrobras Global Finance BV, Senior Notes | | | | |
Petroleos del Peru SA, Senior Notes | | | | |
Petroleos Mexicanos, Senior Notes | | | | |
Puma International Financing SA, Senior Notes | | | | |
Range Resources Corp., Senior Notes | | | | |
Range Resources Corp., Senior Notes | | | | |
Rockies Express Pipeline LLC, Senior Notes | | | | |
Sabine Pass Liquefaction LLC, Senior Secured Notes | | | | |
SilverBow Resources Inc., Secured Notes (3 mo. Term SOFR + 7.750%) | | | | |
Southern Natural Gas Co. LLC, Senior Notes | | | | |
Summit Midstream Holdings LLC/Summit Midstream Finance Corp., Secured Notes | | | | |
See Notes to Financial Statements.
Western Asset Premier Bond Fund 2024 Semi-Annual Report
Western Asset Premier Bond Fund
(Percentages shown based on Fund net assets)
| | | | | |
|
Oil, Gas & Consumable Fuels — continued |
Targa Resources Partners LP/Targa Resources Partners Finance Corp., Senior Notes | | | | |
Targa Resources Partners LP/Targa Resources Partners Finance Corp., Senior Notes | | | | |
Tengizchevroil Finance Co. International Ltd., Senior Secured Notes | | | | |
Transcontinental Gas Pipe Line Co. LLC, Senior Notes | | | | |
Transportadora de Gas del Peru SA, Senior Notes | | | | |
Venture Global LNG Inc., Senior Secured Notes | | | | |
Western Midstream Operating LP, Senior Notes | | | | |
Western Midstream Operating LP, Senior Notes | | | | |
Western Midstream Operating LP, Senior Notes | | | | |
Williams Cos. Inc., Senior Notes | | | | |
Williams Cos. Inc., Senior Notes | | | | |
| | | | |
Total Oil, Gas & Consumable Fuels | |
|
| |
|
|
Banco Mercantil del Norte SA, Junior Subordinated Notes (6.625% to 1/24/32 then 10 year Treasury Constant Maturity Rate + 5.034%) | | | | |
Bank of America Corp., Subordinated Notes | | | | |
Bank of Nova Scotia, Senior Notes | | | | |
Barclays PLC, Subordinated Notes | | | | |
BBVA Bancomer SA, Subordinated Notes (5.125% to 1/17/28 then 5 year Treasury Constant Maturity Rate + 2.650%) | | | | |
BNP Paribas SA, Junior Subordinated Notes (7.375% to 8/19/25 then USD 5 year ICE Swap Rate + 5.150%) | | | | |
See Notes to Financial Statements.
Western Asset Premier Bond Fund 2024 Semi-Annual Report
Schedule of investments (unaudited) (cont’d)June 30, 2024 Western Asset Premier Bond Fund
(Percentages shown based on Fund net assets)
| | | | | |
|
|
BPCE SA, Subordinated Notes | | | | |
Citigroup Inc., Junior Subordinated Notes (5.950% to 5/15/25 then 3 mo. Term SOFR + 4.167%) | | | | |
Citigroup Inc., Subordinated Notes | | | | |
Citigroup Inc., Subordinated Notes | | | | |
Comerica Bank, Senior Notes | | | | |
Credit Agricole SA, Junior Subordinated Notes (8.125% to 12/23/25 then USD 5 year ICE Swap Rate + 6.185%) | | | | |
HSBC Holdings PLC, Junior Subordinated Notes (6.000% to 5/22/27 then USD 5 year ICE Swap Rate + 3.746%) | | | | |
HSBC Holdings PLC, Senior Notes (3.973% to 5/22/29 then 3 mo. Term SOFR + 1.872%) | | | | |
HSBC Holdings PLC, Subordinated Notes (8.113% to 11/3/32 then SOFR + 4.250%) | | | | |
Intesa Sanpaolo SpA, Subordinated Notes | | | | |
JPMorgan Chase & Co., Junior Subordinated Notes (6.100% to 10/1/24 then 3 mo. Term SOFR + 3.592%) | | | | |
JPMorgan Chase & Co., Subordinated Notes | | | | |
Lloyds Banking Group PLC, Junior Subordinated Notes (7.500% to 9/27/25 then USD 5 year ICE Swap Rate + 4.496%) | | | | |
Lloyds Banking Group PLC, Subordinated Notes | | | | |
PNC Financial Services Group Inc., Senior Notes | | | | |
PNC Financial Services Group Inc., Senior Notes (5.812% to 6/12/25 then SOFR + 1.322%) | | | | |
Santander UK Group Holdings PLC, Subordinated Notes | | | | |
Truist Financial Corp., Senior Notes (5.711% to 1/24/34 then SOFR + 1.922%) | | | | |
UniCredit SpA, Subordinated Notes (7.296% to 4/2/29 then USD 5 year ICE Swap Rate + 4.914%) | | | | |
| |
See Notes to Financial Statements.
Western Asset Premier Bond Fund 2024 Semi-Annual Report
Western Asset Premier Bond Fund
(Percentages shown based on Fund net assets)
| | | | | |
|
|
Charles Schwab Corp., Junior Subordinated Notes (4.000% to 12/1/30 then 10 year Treasury Constant Maturity Rate + 3.079%) | | | | |
CME Group Inc., Senior Notes | | | | |
Credit Suisse AG AT1 Claim | | | | |
UBS AG/Stamford CT, Senior Notes | | | | |
Daimler Truck Finance North America LLC, Senior Notes | | | | |
Goldman Sachs Group Inc., Senior Notes (2.640% to 2/24/27 then SOFR + 1.114%) | | | | |
KKR Group Finance Co. VI LLC, Senior Notes | | | | |
Morgan Stanley, Senior Notes (2.699% to 1/22/30 then SOFR + 1.143%) | | | | |
UBS Group AG, Junior Subordinated Notes (6.875% to 8/7/25 then USD 5 year ICE Swap Rate + 4.590%) | | | | |
UBS Group AG, Senior Notes (6.537% to 8/12/32 then SOFR + 3.920%) | | | | |
| |
Financial Services — 3.3% |
AerCap Ireland Capital DAC/AerCap Global Aviation Trust, Senior Notes | | | | |
Ahold Lease USA Inc. Pass-Through-Trust, Senior Secured Notes | | | | |
Global Aircraft Leasing Co. Ltd., Senior Notes (6.500% Cash or 7.250% PIK) | | | | |
GTCR W Dutch Finance Sub BV, Senior Secured Notes | | | | |
Jane Street Group/JSG Finance Inc., Senior Secured Notes | | | | |
VFH Parent LLC/Valor Co-Issuer Inc., Senior Secured Notes | | | | |
VistaJet Malta Finance PLC/Vista Management Holding Inc., Senior Notes | | | | |
| |
|
MetLife Inc., Junior Subordinated Notes | | | | |
Nuveen Finance LLC, Senior Notes | | | | |
| |
See Notes to Financial Statements.
Western Asset Premier Bond Fund 2024 Semi-Annual Report
Schedule of investments (unaudited) (cont’d)June 30, 2024 Western Asset Premier Bond Fund
(Percentages shown based on Fund net assets)
| | | | | |
|
Mortgage Real Estate Investment Trusts (REITs) — 0.3% |
Starwood Property Trust Inc., Senior Notes | | | | |
|
| |
|
|
AbbVie Inc., Senior Notes | | | | |
| | | | |
| |
Health Care Equipment & Supplies — 0.8% |
Becton Dickinson and Co., Senior Notes | | | | |
Solventum Corp., Senior Notes | | | | |
Total Health Care Equipment & Supplies | |
Health Care Providers & Services — 7.2% |
Centene Corp., Senior Notes | | | | |
CHS/Community Health Systems Inc., Senior Secured Notes | | | | |
CVS Health Corp., Senior Notes | | | | |
CVS Health Corp., Senior Notes | | | | |
CVS Health Corp., Senior Notes | | | | |
| | | | |
| | | | |
CVS Pass-Through Trust, Secured Trust | | | | |
CVS Pass-Through Trust, Secured Trust | | | | |
CVS Pass-Through Trust, Senior Secured Trust | | | | |
| | | | |
| | | | |
Humana Inc., Senior Notes | | | | |
Legacy LifePoint Health LLC, Senior Secured Notes | | | | |
Sotera Health Holdings LLC, Senior Secured Notes | | | | |
Tenet Healthcare Corp., Secured Notes | | | | |
UnitedHealth Group Inc., Senior Notes | | | | |
Total Health Care Providers & Services | |
|
Endo Finance Holdings Inc., Senior Secured Notes | | | | |
Par Pharmaceutical Inc., Escrow | | | | |
Pfizer Inc., Senior Notes | | | | |
See Notes to Financial Statements.
Western Asset Premier Bond Fund 2024 Semi-Annual Report
Western Asset Premier Bond Fund
(Percentages shown based on Fund net assets)
| | | | | |
|
Pharmaceuticals — continued |
Pfizer Investment Enterprises Pte Ltd., Senior Notes | | | | |
Teva Pharmaceutical Finance Netherlands III BV, Senior Notes | | | | |
Teva Pharmaceutical Finance Netherlands III BV, Senior Notes | | | | |
Teva Pharmaceutical Finance Netherlands III BV, Senior Notes | | | | |
| |
|
| |
|
Aerospace & Defense — 2.4% |
Avolon Holdings Funding Ltd., Senior Notes | | | | |
Avolon Holdings Funding Ltd., Senior Notes | | | | |
| | | | |
Bombardier Inc., Senior Notes | | | | |
TransDigm Inc., Senior Secured Notes | | | | |
Total Aerospace & Defense | |
|
Masterbrand Inc., Senior Notes | | | | |
Standard Industries Inc., Senior Notes | | | | |
| |
Commercial Services & Supplies — 1.4% |
CoreCivic Inc., Senior Notes | | | | |
GEO Group Inc., Senior Notes | | | | |
GEO Group Inc., Senior Secured Notes | | | | |
GFL Environmental Inc., Senior Secured Notes | | | | |
Total Commercial Services & Supplies | |
|
Cellnex Finance Co. SA, Senior Notes | | | | |
Titan International Inc., Senior Secured Notes | | | | |
| |
Passenger Airlines — 3.2% |
American Airlines Group Inc., Senior Notes | | | | |
American Airlines Inc., Senior Secured Notes | | | | |
Delta Air Lines Inc., Senior Notes | | | | |
See Notes to Financial Statements.
Western Asset Premier Bond Fund 2024 Semi-Annual Report
Schedule of investments (unaudited) (cont’d)June 30, 2024 Western Asset Premier Bond Fund
(Percentages shown based on Fund net assets)
| | | | | |
|
Passenger Airlines — continued |
Delta Air Lines Inc., Senior Notes | | | | |
Delta Air Lines Inc., Senior Secured Notes | | | | |
Spirit Loyalty Cayman Ltd./Spirit IP Cayman Ltd., Senior Secured Notes | | | | |
Spirit Loyalty Cayman Ltd./Spirit IP Cayman Ltd., Senior Secured Notes | | | | |
United Airlines Pass-Through Trust | | | | |
| |
Trading Companies & Distributors — 2.7% |
Air Lease Corp., Senior Notes | | | | |
Ashtead Capital Inc., Senior Notes | | | | |
H&E Equipment Services Inc., Senior Notes | | | | |
United Rentals North America Inc., Secured Notes | | | | |
United Rentals North America Inc., Senior Notes | | | | |
Total Trading Companies & Distributors | |
|
| |
Information Technology — 2.9% |
Communications Equipment — 0.3% |
Viasat Inc., Senior Notes | | | | |
Viasat Inc., Senior Secured Notes | | | | |
Total Communications Equipment | |
Electronic Equipment, Instruments & Components — 0.2% |
EquipmentShare.com Inc., Secured Notes | | | | |
Semiconductors & Semiconductor Equipment — 1.1% |
Broadcom Corp./Broadcom Cayman Finance Ltd., Senior Notes | | | | |
Foundry JV Holdco LLC, Senior Secured Notes | | | | |
Texas Instruments Inc., Senior Notes | | | | |
Total Semiconductors & Semiconductor Equipment | |
|
Cloud Software Group Inc., Senior Secured Notes | | | | |
Technology Hardware, Storage & Peripherals — 0.9% |
Seagate HDD Cayman, Senior Notes | | | | |
See Notes to Financial Statements.
Western Asset Premier Bond Fund 2024 Semi-Annual Report
Western Asset Premier Bond Fund
(Percentages shown based on Fund net assets)
| | | | | |
|
Technology Hardware, Storage & Peripherals — continued |
Seagate HDD Cayman, Senior Notes | | | | |
Western Digital Corp., Senior Notes | | | | |
Total Technology Hardware, Storage & Peripherals | |
|
Total Information Technology | |
|
|
Braskem Netherlands Finance BV, Senior Notes | | | | |
| | | | |
Orbia Advance Corp. SAB de CV, Senior Notes | | | | |
Sasol Financing USA LLC, Senior Notes | | | | |
| |
Construction Materials — 0.4% |
Smyrna Ready Mix Concrete LLC, Senior Secured Notes | | | | |
Containers & Packaging — 0.0%†† |
| | | | |
|
ArcelorMittal SA, Senior Notes | | | | |
First Quantum Minerals Ltd., Secured Notes | | | | |
Freeport Indonesia PT, Senior Notes | | | | |
Freeport-McMoRan Inc., Senior Notes | | | | |
Freeport-McMoRan Inc., Senior Notes | | | | |
Glencore Funding LLC, Senior Notes | | | | |
Teck Resources Ltd., Senior Notes | | | | |
Vale Overseas Ltd., Senior Notes | | | | |
| |
Paper & Forest Products — 1.4% |
Suzano Austria GmbH, Senior Notes | | | | |
Suzano Austria GmbH, Senior Notes | | | | |
Total Paper & Forest Products | |
|
| |
|
|
Vornado Realty LP, Senior Notes | | | | |
Hotel & Resort REITs — 0.1% |
Service Properties Trust, Senior Notes | | | | |
See Notes to Financial Statements.
Western Asset Premier Bond Fund 2024 Semi-Annual Report
Schedule of investments (unaudited) (cont’d)June 30, 2024 Western Asset Premier Bond Fund
(Percentages shown based on Fund net assets)
| | | | | |
|
Real Estate Management & Development — 0.1% |
Cushman & Wakefield US Borrower LLC, Senior Secured Notes | | | | |
|
| |
|
Electric Utilities — 1.1% |
Comision Federal de Electricidad, Senior Notes | | | | |
Pacific Gas and Electric Co., First Mortgage Bonds | | | | |
Vistra Operations Co. LLC, Senior Notes | | | | |
| |
Independent Power and Renewable Electricity Producers — 0.5% |
Minejesa Capital BV, Senior Secured Notes | | | | |
|
| |
Total Corporate Bonds & Notes (Cost — $146,572,093) | |
|
Consumer Discretionary — 3.5% |
Diversified Consumer Services — 0.1% |
WW International Inc., Initial Term Loan (1 mo. Term SOFR + 3.614%) | | | | |
Hotels, Restaurants & Leisure — 3.4% |
Caesars Entertainment Inc., Incremental Term Loan B1 (3 mo. Term SOFR + 2.750%) | | | | |
Flutter Entertainment Public Ltd. Co., Term Loan B (3 mo. Term SOFR + 2.250%) | | | | |
Four Seasons Hotels Ltd., 2024 Repricing Term Loan (1 mo. Term SOFR + 2.000%) | | | | |
Hilton Worldwide Finance LLC, Term Loan B4 (1 mo. Term SOFR + 1.750%) | | | | |
Scientific Games International Inc., Term Loan B1 (1 mo. Term SOFR + 2.750%) | | | | |
Total Hotels, Restaurants & Leisure | |
|
Total Consumer Discretionary | |
|
Oil, Gas & Consumable Fuels — 0.4% |
Buckeye Partners LP, Term Loan B2 | | | | |
See Notes to Financial Statements.
Western Asset Premier Bond Fund 2024 Semi-Annual Report
Western Asset Premier Bond Fund
(Percentages shown based on Fund net assets)
| | | | | |
|
|
|
Blackhawk Network Holdings Inc., Term Loan B (1 mo. Term SOFR + 5.000%) | | | | |
TransUnion Intermediate Holdings Inc., Term Loan B7 (1 mo. Term SOFR + 2.000%) | | | | |
| |
Financial Services — 2.7% |
Boost Newco Borrower LLC, Initial USD Term Loan (3 mo. Term SOFR + 3.000%) | | | | |
Citadel Securities LP, 2024 Term Loan B (1 mo. Term SOFR + 2.250%) | | | | |
Nexus Buyer LLC, Amendment No. 5 Term Loan (1 mo. Term SOFR + 4.500%) | | | | |
| |
|
Asurion LLC, New Term Loan B10 (1 mo. Term SOFR + 4.100%) | | | | |
Mortgage Real Estate Investment Trusts (REITs) — 0.3% |
Starwood Property Mortgage LLC, Term Loan B (1 mo. Term SOFR + 3.250%) | | | | |
|
| |
|
Life Sciences Tools & Services — 0.4% |
IQVIA Inc., Term Loan B4 (3 mo. Term SOFR + 2.000%) | | | | |
|
|
Passenger Airlines — 0.9% |
Delta Air Lines Inc., Initial Term Loan (3 mo. Term SOFR + 3.750%) | | | | |
United Airlines Inc., Term Loan B (1 mo. Term SOFR + 2.750%) | | | | |
| |
Trading Companies & Distributors — 0.2% |
United Rentals North America Inc., Restatement Term Loan (1 mo. Term SOFR + 1.750%) | | | | |
|
| |
See Notes to Financial Statements.
Western Asset Premier Bond Fund 2024 Semi-Annual Report
Schedule of investments (unaudited) (cont’d)June 30, 2024 Western Asset Premier Bond Fund
(Percentages shown based on Fund net assets)
| | | | | |
|
Information Technology — 1.3% |
Electronic Equipment, Instruments & Components — 0.5% |
Coherent Corp., Term Loan B1 (1 mo. Term SOFR + 2.500%) | | | | |
Semiconductors & Semiconductor Equipment — 0.4% |
MKS Instruments Inc., 2023 Dollar Term Loan B (1 mo. Term SOFR + 2.500%) | | | | |
|
DCert Buyer Inc., First Lien Initial Term Loan (1 mo. Term SOFR + 4.000%) | | | | |
Modena Buyer LLC, Term Loan | | | | |
| |
|
Total Information Technology | |
|
Construction Materials — 0.5% |
Summit Materials LLC, Term Loan B2 (3 mo. Term SOFR + 2.500%) | | | | |
Containers & Packaging — 0.6% |
Berry Global Inc., Term Loan AA (1 mo. Term SOFR + 1.864%) | | | | |
Paper & Forest Products — 0.7% |
Asplundh Tree Expert LLC, 2021 Refinancing Term Loan (1 mo. Term SOFR + 1.850%) | | | | |
|
| |
|
Electric Utilities — 0.6% |
Vistra Operations Co. LLC, 2018 Incremental Term Loan (1 mo. Term SOFR + 2.000%) | | | | |
|
Total Senior Loans (Cost — $17,415,248) | |
|
|
Angolan Government International Bond, Senior Notes | | | | |
|
Argentine Republic Government International Bond, Senior Notes | | | | |
Provincia de Buenos Aires, Senior Notes, Step bond (6.375% to 9/1/24 then 6.625%) | | | | |
Provincia de Cordoba, Senior Notes | | | | |
| |
See Notes to Financial Statements.
Western Asset Premier Bond Fund 2024 Semi-Annual Report
Western Asset Premier Bond Fund
(Percentages shown based on Fund net assets)
| | | | | |
|
|
Colombia Government International Bond, Senior Notes | | | | |
Dominican Republic — 0.3% |
Dominican Republic International Bond, Senior Notes | | | | |
|
Indonesia Government International Bond, Senior Notes | | | | |
Indonesia Government International Bond, Senior Notes | | | | |
| |
|
| | | | |
Mexico Government International Bond, Senior Notes | | | | |
Mexico Government International Bond, Senior Notes | | | | |
Mexico Government International Bond, Senior Notes | | | | |
| |
|
Panama Government International Bond, Senior Notes | | | | |
|
Peruvian Government International Bond, Senior Notes | | | | |
|
Saudi Government International Bond, Senior Notes | | | | |
|
Total Sovereign Bonds (Cost — $11,578,871) | |
Collateralized Mortgage Obligations(n) — 6.1% |
280 Park Avenue Mortgage Trust, 2017-280P F (1 mo. Term SOFR + 3.127%) | | | | |
Bear Stearns ALT-A Trust, 2004-3 A1 (1 mo. Term SOFR + 0.754%) | | | | |
CHL Mortgage Pass-Through Trust, 2005-7 1A1 (1 mo. Term SOFR + 0.384%) | | | | |
Citigroup Commercial Mortgage Trust, 2015- GC29 D | | | | |
See Notes to Financial Statements.
Western Asset Premier Bond Fund 2024 Semi-Annual Report
Schedule of investments (unaudited) (cont’d)June 30, 2024 Western Asset Premier Bond Fund
(Percentages shown based on Fund net assets)
| | | | | |
Collateralized Mortgage Obligations(n) — continued |
Citigroup Commercial Mortgage Trust, 2015-P1 D | | | | |
Citigroup Commercial Mortgage Trust, 2015-P1 E | | | | |
CSAIL Commercial Mortgage Trust, 2015-C3 C | | | | |
Federal Home Loan Mortgage Corp. (FHLMC) REMIC, Structured Agency Credit Risk Debt Notes, 2020-DNA6 B1 (30 Day Average SOFR + 3.000%) | | | | |
Federal Home Loan Mortgage Corp. (FHLMC) REMIC, Structured Agency Credit Risk Debt Notes, 2021-DNA7 B2 (30 Day Average SOFR + 7.800%) | | | | |
Federal Home Loan Mortgage Corp. (FHLMC) REMIC, Structured Agency Credit Risk Debt Notes, 2022-DNA2 M2 (30 Day Average SOFR + 3.750%) | | | | |
Federal Home Loan Mortgage Corp. (FHLMC) REMIC, Structured Agency Credit Risk Debt Notes, 2022-DNA6 M2 (30 Day Average SOFR + 5.750%) | | | | |
Federal National Mortgage Association (FNMA), 2004-W15 1A2 | | | | |
Federal National Mortgage Association (FNMA) — CAS, 2023-R06 1M2 (30 Day Average SOFR + 2.700%) | | | | |
Federal National Mortgage Association (FNMA) — CAS, 2024-R02 1M2 (30 Day Average SOFR + 1.800%) | | | | |
GS Mortgage Securities Corp. Trust, 2024- 70P E | | | | |
Hawaii Hotel Trust, 2019-MAUI F (1 mo. Term SOFR + 3.047%) | | | | |
Impac CMB Trust, 2004-10 2A (1 mo. Term SOFR + 0.754%) | | | | |
Impac CMB Trust, 2005-2 2A2 (1 mo. Term SOFR + 0.914%) | | | | |
MAFI II Remic Trust, 1998-BI B1 | | | | |
MERIT Securities Corp., 2011-PA B3 (1 mo. USD LIBOR + 2.250%) | | | | |
See Notes to Financial Statements.
Western Asset Premier Bond Fund 2024 Semi-Annual Report
Western Asset Premier Bond Fund
(Percentages shown based on Fund net assets)
| | | | | |
Collateralized Mortgage Obligations(n) — continued |
Morgan Stanley Capital Trust, 2015-UBS8 C | | | | |
Morgan Stanley Capital Trust, 2016-BNK2 B | | | | |
Prime Mortgage Trust, 2005-2 2XB, IO | | | | |
Prime Mortgage Trust, 2005-5 1X, IO | | | | |
RAMP Trust, 2005-SL2 APO, STRIPS, PO | | | | |
Sequoia Mortgage Trust, 2003-2 A2 (6 mo. Term SOFR + 1.108%) | | | | |
Structured Asset Securities Corp., 1998-RF2 A | | | | |
Structured Asset Securities Corp. Mortgage Pass-Through Certificates, 2003-9A 2A2 | | | | |
UBS Commercial Mortgage Trust, 2018-C15 C | | | | |
|
Total Collateralized Mortgage Obligations (Cost — $7,697,103) | |
Asset-Backed Securities — 1.6% |
American Home Mortgage Investment Trust, 2007-A 4A (1 mo. Term SOFR + 1.014%) | | | | |
Bayview Financial Asset Trust, 2007-SR1A M1 (1 mo. Term SOFR + 0.914%) | | | | |
Bayview Financial Asset Trust, 2007-SR1A M4 (1 mo. Term SOFR + 1.614%) | | | | |
Financial Asset Securities Corp. Trust, 2005-1A 1A3B (1 mo. Term SOFR + 0.524%) | | | | |
GSAMP Trust, 2003-SEA2 A1 | | | | |
Indymac Manufactured Housing Contract Pass-Through Certificates, 1997-1 A5 | | | | |
Morgan Stanley ABS Capital Inc. Trust, 2003-SD1 A1 (1 mo. Term SOFR + 1.114%) | | | | |
Morgan Stanley ABS Capital Inc. Trust, 2004-HE7 M1 (1 mo. Term SOFR + 1.014%) | | | | |
Origen Manufactured Housing Contract Trust, 2006-A A2 | | | | |
Origen Manufactured Housing Contract Trust, 2007-A A2 | | | | |
|
Total Asset-Backed Securities (Cost — $1,953,345) | |
See Notes to Financial Statements.
Western Asset Premier Bond Fund 2024 Semi-Annual Report
Schedule of investments (unaudited) (cont’d)June 30, 2024 Western Asset Premier Bond Fund
(Percentages shown based on Fund net assets)
| | | | | |
|
Convertible Bonds & Notes — 0.7% |
Communication Services — 0.7% |
|
DISH Network Corp., Senior Notes | | | | |
DISH Network Corp., Senior Notes | | | | |
|
Total Convertible Bonds & Notes (Cost — $1,075,174) | |
U.S. Government & Agency Obligations — 0.3% |
U.S. Government Obligations — 0.3% |
| | | | |
| | | | |
|
Total U.S. Government & Agency Obligations (Cost — $433,585) | |
| | | | | |
|
|
|
| | | |
| | | |
|
Total Common Stocks (Cost — $51,926) | |
| | | | | |
|
|
Passenger Airlines — 0.0%†† |
flyExclusive Inc. (Cost — $8,421) | | | | |
Total Investments before Short-Term Investments (Cost — $186,785,766) | |
| | | | | |
Short-Term Investments — 4.9% |
U.S. Treasury Bills — 4.5% |
| | | | |
| | | | |
| | | | |
|
Total U.S. Treasury Bills (Cost — $5,993,210) | |
See Notes to Financial Statements.
Western Asset Premier Bond Fund 2024 Semi-Annual Report
Western Asset Premier Bond Fund
(Percentages shown based on Fund net assets)
| | | | | |
Money Market Funds — 0.4% |
Western Asset Premier Institutional Government Reserves, Premium Shares (Cost — $540,780) | | | | |
|
Total Short-Term Investments (Cost — $6,533,990) | |
Total Investments — 149.0% (Cost — $193,319,756) | |
Liabilities in Excess of Other Assets — (49.0)% | |
Total Net Assets — 100.0% | |
See Notes to Financial Statements.
Western Asset Premier Bond Fund 2024 Semi-Annual Report
Schedule of investments (unaudited) (cont’d)June 30, 2024 Western Asset Premier Bond Fund
| Face amount denominated in U.S. dollars, unless otherwise noted. |
| Represents less than 0.1%. |
| Non-income producing security. |
| Security is exempt from registration under Rule 144A of the Securities Act of 1933. This security may be resold in transactions that are exempt from registration, normally to qualified institutional buyers. This security has been deemed liquid pursuant to guidelines approved by the Board of Trustees. |
| All or a portion of this security is pledged as collateral pursuant to the loan agreement (Note 5). |
| Security has no maturity date. The date shown represents the next call date. |
| Security is exempt from registration under Regulation S of the Securities Act of 1933. Regulation S applies to securities offerings that are made outside of the United States and do not involve direct selling efforts in the United States. This security has been deemed liquid pursuant to guidelines approved by the Board of Trustees. |
| Variable rate security. Interest rate disclosed is as of the most recent information available. Certain variable rate securities are not based on a published reference rate and spread but are determined by the issuer or agent and are based on current market conditions. These securities do not indicate a reference rate and spread in their description above. |
| All or a portion of this security is held by the counterparty as collateral for open reverse repurchase agreements. |
| Security is fair valued in accordance with procedures approved by the Board of Trustees (Note 1). |
| Security is valued using significant unobservable inputs (Note 1). |
| Payment-in-kind security for which the issuer has the option at each interest payment date of making interest payments in cash or additional securities. |
| |
| Interest rates disclosed represent the effective rates on senior loans. Ranges in interest rates are attributable to multiple contracts under the same loan. |
| Senior loans may be considered restricted in that the Fund ordinarily is contractually obligated to receive approval from the agent bank and/or borrower prior to the disposition of a senior loan. |
| All or a portion of this loan has not settled as of June 30, 2024. Interest rates are not effective until settlement date. Interest rates shown, if any, are for the settled portion of the loan. |
| Collateralized mortgage obligations are secured by an underlying pool of mortgages or mortgage pass-through certificates that are structured to direct payments on underlying collateral to different series or classes of the obligations. The interest rate may change positively or inversely in relation to one or more interest rates, financial indices or other financial indicators and may be subject to an upper and/or lower limit. |
| Rate shown represents yield-to-maturity. |
| Rate shown is one-day yield as of the end of the reporting period. |
| In this instance, as defined in the Investment Company Act of 1940, an “Affiliated Company” represents Fund ownership of at least 5% of the outstanding voting securities of an issuer, or a company which is under common ownership or control with the Fund. At June 30, 2024, the total market value of investments in Affiliated Companies was $540,780 and the cost was $540,780 (Note 8). |
See Notes to Financial Statements.
Western Asset Premier Bond Fund 2024 Semi-Annual Report
Western Asset Premier Bond Fund
Abbreviation(s) used in this schedule: |
| | Connecticut Avenue Securities |
| | |
| | |
| | Intercontinental Exchange |
| | |
| | |
| | London Interbank Offered Rate |
| | |
| | |
| | |
| | Real Estate Mortgage Investment Conduit |
| | Secured Overnight Financing Rate |
| | Sterling Overnight Index Average |
| | Separate Trading of Registered Interest and Principal Securities |
| | |
At June 30, 2024, the Fund had the following open reverse repurchase agreements:
| | | | Face Amount
of Reverse
Repurchase
Agreements | Asset Class
of Collateral* | |
| | | | | | |
| | | | | | |
| | | | | | |
| Refer to the Schedule of Investments for positions held at the counterparty as collateral for reverse repurchase agreements. |
| Including accrued interest. |
At June 30, 2024, the Fund had the following open forward foreign currency contracts:
| | | | Unrealized
Appreciation
(Depreciation) |
| | | | | | |
| | | | | | |
| | | | | | |
| | | | | | |
| | | | | | |
| | | | Morgan Stanley & Co. Inc. | | |
Net unrealized appreciation on open forward foreign currency contracts | |
See Notes to Financial Statements.
Western Asset Premier Bond Fund 2024 Semi-Annual Report
Schedule of investments (unaudited) (cont’d)June 30, 2024 Western Asset Premier Bond Fund
Abbreviation(s) used in this table: |
| | |
| | |
| | |
| | |
See Notes to Financial Statements.
Western Asset Premier Bond Fund 2024 Semi-Annual Report
Statement of assets and liabilities (unaudited)June 30, 2024
| |
Investments in unaffiliated securities, at value (Cost — $192,778,976) | |
Investments in affiliated securities, at value (Cost — $540,780) | |
Foreign currency, at value (Cost — $263,129) | |
| |
| |
Receivable for securities sold | |
Unrealized appreciation on forward foreign currency contracts | |
Principal paydown receivable | |
Dividends receivable from affiliated investments | |
| |
| |
| |
| |
Payable for open reverse repurchase agreements (Note 3) | |
| |
Payable for securities purchased | |
Interest and commitment fees payable | |
Investment management fee payable | |
Administration fee payable | |
Unrealized depreciation on forward foreign currency contracts | |
| |
| |
| |
| |
Common shares, no par value, unlimited number of shares authorized, 11,865,600 shares issued and outstanding | |
Total distributable earnings (loss) | |
| |
| |
| |
See Notes to Financial Statements.
Western Asset Premier Bond Fund 2024 Semi-Annual Report
Statement of operations (unaudited)For the Six Months Ended June 30, 2024
| |
| |
Dividends from affiliated investments | |
Dividends from unaffiliated investments | |
Less: Foreign taxes withheld | |
| |
| |
Interest expense (Notes 3 and 5) | |
Investment management fee (Note 2) | |
| |
| |
| |
| |
| |
Stock exchange listing fees | |
| |
| |
| |
| |
| |
| |
Less: Fee waivers and/or expense reimbursements (Note 2) | |
| |
| |
Realized and Unrealized Gain (Loss) on Investments, Forward Foreign Currency Contracts and Foreign Currency Transactions (Notes 1, 3 and 4): |
| |
Investment transactions in unaffiliated securities | |
Forward foreign currency contracts | |
Foreign currency transactions | |
| |
Change in Net Unrealized Appreciation (Depreciation) From: | |
Investments in unaffiliated securities | |
Forward foreign currency contracts | |
| |
Change in Net Unrealized Appreciation (Depreciation) | |
Net Loss on Investments, Forward Foreign Currency Contracts and Foreign Currency Transactions | |
Increase in Net Assets From Operations | |
See Notes to Financial Statements.
Western Asset Premier Bond Fund 2024 Semi-Annual Report
Statements of changes in net assets
For the Six Months Ended June 30, 2024 (unaudited)
and the Year Ended December 31, 2023 | | |
| | |
| | |
| | |
Change in net unrealized appreciation (depreciation) | | |
Increase in Net Assets From Operations | | |
Distributions to Shareholders From (Note 1): | | |
Total distributable earnings | | |
Decrease in Net Assets From Distributions to Shareholders | | |
Increase (Decrease) in Net Assets | | |
| | |
| | |
| | |
See Notes to Financial Statements.
Western Asset Premier Bond Fund 2024 Semi-Annual Report
Statement of cash flows (unaudited)For the Six Months Ended June 30, 2024
Increase (Decrease) in Cash: | |
Cash Flows from Operating Activities: | |
Net increase in net assets resulting from operations | |
Adjustments to reconcile net increase in net assets resulting from operations to net cash provided (used) by operating activities: | |
Purchases of portfolio securities | |
Sales of portfolio securities | |
Net purchases, sales and maturities of short-term investments | |
Net amortization of premium (accretion of discount) | |
Decrease in receivable for securities sold | |
Increase in interest receivable | |
Increase in prepaid expenses | |
Decrease in dividends receivable from affiliated investments | |
Increase in principal paydown receivable | |
Increase in payable for securities purchased | |
Increase in investment management fee payable | |
Decrease in Trustees’ fees payable | |
Increase in administration fee payable | |
Increase in interest and commitment fees payable | |
Decrease in accrued expenses | |
Net realized loss on investments | |
Change in net unrealized appreciation (depreciation) of investments and forward foreign currency contracts | |
Net Cash Used in Operating Activities* | |
Cash Flows from Financing Activities: | |
Distributions paid on common stock (net of distributions payable) | |
Proceeds from loan facility borrowings | |
Increase in payable for open reverse repurchase agreements | |
Net Cash Provided by Financing Activities | |
Net Increase in Cash and Restricted Cash | |
Cash and restricted cash at beginning of period | |
Cash and restricted cash at end of period | |
| Included in operating expenses is $1,699,227 paid for interest and commitment fees on borrowings. |
The following table provides a reconciliation of cash (including foreign currency) and restricted cash reported within the Statement of Assets and Liabilities that sums to the total of such amounts shown on the Statement of
Cash Flows.
| |
| |
| |
Total cash and restricted cash shown in the Statement of Cash Flows | |
See Notes to Financial Statements.
Western Asset Premier Bond Fund 2024 Semi-Annual Report
For a common share outstanding throughout each year ended December 31, unless otherwise noted: |
| | | | | | |
Net asset value, beginning of period | | | | | | |
Income (loss) from operations: |
| | | | | | |
Net realized and unrealized gain (loss) | | | | | | |
Total income (loss) from operations | | | | | | |
| | | | | | |
| | | | | | |
| | | | | | |
Anti-dilutive impact of repurchase plan | | | | | | |
Net asset value, end of period | | | | | | |
Market price, end of period | | | | | | |
Total return, based on NAV5,6 | | | | | | |
Total return, based on Market Price7 | | | | | | |
Net assets, end of period (millions) | | | | | | |
Ratios to average net assets: |
| | | | | | |
| | | | | | |
| | | | | | |
| | | | | | |
| | | | | | |
Loan Outstanding, End of Period (000s) | | | | | | |
Asset Coverage Ratio for Loan | | | | | | |
Asset Coverage, per $1,000 Principal Amount of Loan Outstanding11 | | | | | | |
Weighted Average Loan (000s) | | | | | | |
Weighted Average Interest Rate on Loan | | | | | | |
See Notes to Financial Statements.
Western Asset Premier Bond Fund 2024 Semi-Annual Report
Financial highlights (cont’d)
| Per share amounts have been calculated using the average shares method. |
| For the six months ended June 30, 2024 (unaudited). |
| The actual source of the Fund’s current fiscal year distributions may be from net investment income, realized capital gains, return of capital or a combination thereof. Shareholders will be informed of the tax characteristics of the distributions after the close of the fiscal year. |
| The repurchase plan was completed at an average repurchase price of $10.38 for 44,671 shares and $462,743 for the year ended December 31, 2020. |
| Performance figures may reflect compensating balance arrangements, fee waivers and/or expense reimbursements. In the absence of compensating balance arrangements, fee waivers and/or expense reimbursements, the total return would have been lower. Past performance is no guarantee of future results. Total returns for periods of less than one year are not annualized. |
| The total return calculation assumes that distributions are reinvested at NAV. Past performance is no guarantee of future results. Total returns for periods of less than one year are not annualized. |
| The total return calculation assumes that distributions are reinvested in accordance with the Fund’s dividend reinvestment plan. Past performance is no guarantee of future results. Total returns for periods of less than one year are not annualized. |
| |
| The investment adviser has agreed to waive the Fund’s management fee to an extent sufficient to offset the net management fee payable in connection with any investment in an affiliated money market fund. |
| Reflects fee waivers and/or expense reimbursements. |
| Represents value of net assets plus the loan outstanding at the end of the period divided by the loan outstanding at the end of the period. |
See Notes to Financial Statements.
Western Asset Premier Bond Fund 2024 Semi-Annual Report
Notes to financial statements (unaudited)
1. Organization and significant accounting policies
Western Asset Premier Bond Fund (the “Fund”) is registered under the Investment Company Act of 1940, as amended (the “1940 Act”), as a diversified, closed-end management investment company. The Fund commenced investment operations on March 28, 2002. The Fund’s investment objective is to provide current income and capital appreciation by investing primarily in a diversified portfolio of investment grade bonds.
The Fund follows the accounting and reporting guidance in Financial Accounting Standards Board (“FASB”) Accounting Standards Codification Topic 946, Financial Services – Investment Companies (“ASC 946”). The following are significant accounting policies consistently followed by the Fund and are in conformity with U.S. generally accepted accounting principles (“GAAP”), including, but not limited to, ASC 946. Estimates and assumptions are required to be made regarding assets, liabilities and changes in net assets resulting from operations when financial statements are prepared. Changes in the economic environment, financial markets and any other parameters used in determining these estimates could cause actual results to differ. Subsequent events have been evaluated through the date the financial statements were issued.
(a) Investment valuation. The valuations for fixed income securities (which may include, but are not limited to, corporate, government, municipal, mortgage-backed, collateralized mortgage obligations and asset-backed securities) and certain derivative instruments are typically the prices supplied by independent third party pricing services, which may use market prices or broker/dealer quotations or a variety of valuation techniques and methodologies. The independent third party pricing services typically use inputs that are observable such as issuer details, interest rates, yield curves, prepayment speeds, credit risks/spreads, default rates and quoted prices for similar securities. Investments in open-end funds are valued at the closing net asset value per share of each fund on the day of valuation. Equity securities for which market quotations are available are valued at the last reported sales price or official closing price on the primary market or exchange on which they trade. When the Fund holds securities or other assets that are denominated in a foreign currency, the Fund will normally use the currency exchange rates as of 4:00 p.m. (Eastern Time). If independent third party pricing services are unable to supply prices for a portfolio investment, or if the prices supplied are deemed by the adviser to be unreliable, the market price may be determined by the adviser using quotations from one or more broker/dealers or at the transaction price if the security has recently been purchased and no value has yet been obtained from a pricing service or pricing broker. When reliable prices are not readily available, such as when the value of a security has been significantly affected by events after the close of the exchange or market on which the security is principally traded, but before the Fund calculates its net asset value, the Fund values these securities as determined in accordance with procedures approved by the Fund’s Board of Trustees.
Pursuant to policies adopted by the Board of Trustees, the Fund’s adviser has been designated as the valuation designee and is responsible for the oversight of the daily valuation process. The Fund’s adviser is assisted by the Global Fund Valuation Committee (the “Valuation Committee”). The Valuation Committee is responsible for making fair value determinations, evaluating the effectiveness of the Fund’s pricing policies, and reporting to
Western Asset Premier Bond Fund 2024 Semi-Annual Report
Notes to financial statements (unaudited) (cont’d)
the Fund’s adviser and the Board of Trustees. When determining the reliability of third party pricing information for investments owned by the Fund, the Valuation Committee, among other things, conducts due diligence reviews of pricing vendors, monitors the daily change in prices and reviews transactions among market participants.
The Valuation Committee will consider pricing methodologies it deems relevant and appropriate when making fair value determinations. Examples of possible methodologies include, but are not limited to, multiple of earnings; discount from market of a similar freely traded security; discounted cash-flow analysis; book value or a multiple thereof; risk premium/yield analysis; yield to maturity; and/or fundamental investment analysis. The Valuation Committee will also consider factors it deems relevant and appropriate in light of the facts and circumstances. Examples of possible factors include, but are not limited to, the type of security; the issuer’s financial statements; the purchase price of the security; the discount from market value of unrestricted securities of the same class at the time of purchase; analysts’ research and observations from financial institutions; information regarding any transactions or offers with respect to the security; the existence of merger proposals or tender offers affecting the security; the price and extent of public trading in similar securities of the issuer or comparable companies; and the existence of a shelf registration for restricted securities.
For each portfolio security that has been fair valued pursuant to the policies adopted by the Board of Trustees, the fair value price is compared against the last available and next available market quotations. The Valuation Committee reviews the results of such back testing monthly and fair valuation occurrences are reported to the Board of Trustees quarterly.
The Fund uses valuation techniques to measure fair value that are consistent with the market approach and/or income approach, depending on the type of security and the particular circumstance. The market approach uses prices and other relevant information generated by market transactions involving identical or comparable securities. The income approach uses valuation techniques to discount estimated future cash flows to present value.
GAAP establishes a disclosure hierarchy that categorizes the inputs to valuation techniques used to value assets and liabilities at measurement date. These inputs are summarized in the three broad levels listed below:
•
Level 1 — unadjusted quoted prices in active markets for identical investments
•
Level 2 — other significant observable inputs (including quoted prices for similar investments, interest rates, prepayment speeds, credit risk, etc.)
•
Level 3 — significant unobservable inputs (including the Fund’s own assumptions in determining the fair value of investments)
The inputs or methodologies used to value securities are not necessarily an indication of the risk associated with investing in those securities.
Western Asset Premier Bond Fund 2024 Semi-Annual Report
The following is a summary of the inputs used in valuing the Fund’s assets and liabilities carried at fair value:
|
| | Other Significant
Observable Inputs
(Level 2) | Significant
Unobservable
Inputs
(Level 3) | |
| | | | |
| | | | |
| | | | |
| | | | |
Other Corporate Bonds & Notes | | | | |
| | | | |
| | | | |
| | | | |
| | | | |
Collateralized Mortgage Obligations | | | | |
| | | | |
Convertible Bonds & Notes | | | | |
U.S. Government & Agency Obligations | | | | |
| | | | |
| | | | |
| | | | |
Total Long-Term Investments | | | | |
| | | | |
| | | | |
| | | | |
Total Short-Term Investments | | | | |
| | | | |
Other Financial Instruments: | | | | |
Forward Foreign Currency Contracts†† | | | | |
| | | | |
|
| | Other Significant
Observable Inputs
(Level 2) | Significant
Unobservable
Inputs
(Level 3) | |
Other Financial Instruments: | | | | |
Forward Foreign Currency Contracts†† | | | | |
Western Asset Premier Bond Fund 2024 Semi-Annual Report
Notes to financial statements (unaudited) (cont’d)
| See Schedule of Investments for additional detailed categorizations. |
| Amount represents less than $1. |
| Reflects the unrealized appreciation (depreciation) of the instruments. |
(b) Forward foreign currency contracts. The Fund enters into a forward foreign currency contract to hedge exposure of bond positions or in an attempt to increase the Fund’s return. A forward foreign currency contract is an agreement between two parties to buy and sell a currency at a set price with delivery and settlement at a future date. The contract is marked-to-market daily and the change in value is recorded by the Fund as an unrealized gain or loss. When a forward foreign currency contract is closed, through either delivery or offset by entering into another forward foreign currency contract, the Fund recognizes a realized gain or loss equal to the difference between the value of the contract at the time it was opened and the value of the contract at the time it is closed.
Forward foreign currency contracts involve elements of market risk in excess of the amounts reflected on the Statement of Assets and Liabilities. The Fund bears the risk of an unfavorable change in the foreign exchange rate underlying the forward foreign currency contract. Risks may also arise upon entering into these contracts from the potential inability of the counterparties to meet the terms of their contracts.
(c) Loan participations. The Fund may invest in loans arranged through private negotiation between one or more financial institutions. The Fund’s investment in any such loan may be in the form of a participation in or an assignment of the loan. In connection with purchasing participations, the Fund generally will have no right to enforce compliance by the borrower with the terms of the loan agreement related to the loan, or any rights of offset against the borrower and the Fund may not benefit directly from any collateral supporting the loan in which it has purchased the participation.
The Fund assumes the credit risk of the borrower, the lender that is selling the participation and any other persons interpositioned between the Fund and the borrower. In the event of the insolvency of the lender selling the participation, the Fund may be treated as a general creditor of the lender and may not benefit from any offset between the lender and the borrower.
(d) Stripped securities. The Fund may invest in ‘‘Stripped Securities,’’ a term used collectively for components, or strips, of fixed income securities. Stripped Securities can be principal only securities (“PO”), which are debt obligations that have been stripped of unmatured interest coupons, or interest only securities (“IO”), which are unmatured interest coupons that have been stripped from debt obligations. The market value of Stripped Securities will fluctuate in response to changes in economic conditions, rates of pre-payment, interest rates and the market’s perception of the securities. However, fluctuations in response to interest rates may be greater in Stripped Securities than for debt obligations of comparable maturities that pay interest currently. The amount of fluctuation may increase with a longer period of maturity.
The yield to maturity on IO’s is sensitive to the rate of principal repayments (including prepayments) on the related underlying debt obligation and principal payments may have a
Western Asset Premier Bond Fund 2024 Semi-Annual Report
material effect on yield to maturity. If the underlying debt obligation experiences greater than anticipated prepayments of principal, the Fund may not fully recoup its initial investment in IO’s.
(e) Reverse repurchase agreements. The Fund may enter into reverse repurchase agreements. Under the terms of a typical reverse repurchase agreement, a fund sells a security subject to an obligation to repurchase the security from the buyer at an agreed upon time and price. In the event the buyer of securities under a reverse repurchase agreement files for bankruptcy or becomes insolvent, the Fund’s use of the proceeds of the agreement may be restricted pending a determination by the counterparty, or its trustee or receiver, whether to enforce the Fund’s obligation to repurchase the securities. In entering into reverse repurchase agreements, the Fund will pledge cash, U.S. government securities or other liquid debt obligations at least equal in value to its obligations with respect to reverse repurchase agreements or will take other actions permitted by law to cover its obligations. If the market value of the collateral declines during the period, the Fund may be required to post additional collateral to cover its obligation. Cash collateral that has been pledged to cover obligations of the Fund under reverse repurchase agreements, if any, will be reported separately in the Statement of Assets and Liabilities. Securities pledged as collateral are noted in the Schedule of Investments. Interest payments made on reverse repurchase agreements are recognized as a component of “Interest expense” on the Statement of Operations. In periods of increased demand for the security, the Fund may receive a fee for use of the security by the counterparty, which may result in interest income to the Fund.
(f) Cash flow information. The Fund invests in securities and distributes dividends from net investment income and net realized gains, which are paid in cash and may be reinvested at the discretion of shareholders. These activities are reported in the Statements of Changes in Net Assets and additional information on cash receipts and cash payments is presented in the Statement of Cash Flows.
(g) Foreign currency translation. Investment securities and other assets and liabilities denominated in foreign currencies are translated into U.S. dollar amounts based upon prevailing exchange rates on the date of valuation. Purchases and sales of investment securities and income and expense items denominated in foreign currencies are translated into U.S. dollar amounts based upon prevailing exchange rates on the respective dates of such transactions.
The Fund does not isolate that portion of the results of operations resulting from fluctuations in foreign exchange rates on investments from the fluctuations arising from changes in market prices of securities held. Such fluctuations are included with the net realized and unrealized gain or loss on investments.
Net realized foreign exchange gains or losses arise from sales of foreign currencies, including gains and losses on forward foreign currency contracts, currency gains or losses realized between the trade and settlement dates on securities transactions, and the difference between the amounts of dividends, interest, and foreign withholding taxes recorded on the Fund’s books and the U.S. dollar equivalent of the amounts actually
Western Asset Premier Bond Fund 2024 Semi-Annual Report
Notes to financial statements (unaudited) (cont’d)
received or paid. Net unrealized foreign exchange gains and losses arise from changes in the values of assets and liabilities, other than investments in securities, on the date of valuation, resulting from changes in exchange rates.
Foreign security and currency transactions may involve certain considerations and risks not typically associated with those of U.S. dollar denominated transactions as a result of, among other factors, the possibility of lower levels of governmental supervision and regulation of foreign securities markets and the possibility of political or economic instability.
(h) Credit and market risk. The Fund invests in high-yield and emerging market instruments that are subject to certain credit and market risks. The yields of high-yield and emerging market debt obligations reflect, among other things, perceived credit and market risks. The Fund’s investments in securities rated below investment grade typically involve risks not associated with higher rated securities including, among others, greater risk related to timely and ultimate payment of interest and principal, greater market price volatility and less liquid secondary market trading. The consequences of political, social, economic or diplomatic changes may have disruptive effects on the market prices of investments held by the Fund. The Fund’s investments in non-U.S. dollar denominated securities may also result in foreign currency losses caused by devaluations and exchange rate fluctuations.
Investments in securities that are collateralized by real estate mortgages are subject to certain credit and liquidity risks. When market conditions result in an increase in default rates of the underlying mortgages and the foreclosure values of underlying real estate properties are materially below the outstanding amount of these underlying mortgages, collection of the full amount of accrued interest and principal on these investments may be doubtful. Such market conditions may significantly impair the value and liquidity of these investments and may result in a lack of correlation between their credit ratings and values.
(i) Foreign investment risks. The Fund’s investments in foreign securities may involve risks not present in domestic investments. Since securities may be denominated in foreign currencies, may require settlement in foreign currencies or may pay interest or dividends in foreign currencies, changes in the relationship of these foreign currencies to the U.S. dollar can significantly affect the value of the investments and earnings of the Fund. Foreign investments may also subject the Fund to foreign government exchange restrictions, expropriation, taxation or other political, social or economic developments, all of which affect the market and/or credit risk of the investments.
(j) Counterparty risk and credit-risk-related contingent features of derivative instruments. The Fund may invest in certain securities or engage in other transactions where the Fund is exposed to counterparty credit risk in addition to broader market risks. The Fund may invest in securities of issuers, which may also be considered counterparties as trading partners in other transactions. This may increase the risk of loss in the event of default or bankruptcy by the counterparty or if the counterparty otherwise fails to meet its contractual obligations. The Fund’s investment adviser attempts to mitigate counterparty risk by (i) periodically assessing the creditworthiness of its trading partners, (ii) monitoring
Western Asset Premier Bond Fund 2024 Semi-Annual Report
and/or limiting the amount of its net exposure to each individual counterparty based on its assessment and (iii) requiring collateral from the counterparty for certain transactions. Market events and changes in overall economic conditions may impact the assessment of such counterparty risk by the investment adviser. In addition, declines in the values of underlying collateral received may expose the Fund to increased risk of loss.
With exchange traded and centrally cleared derivatives, there is less counterparty risk to the Fund since the exchange or clearinghouse, as counterparty to such instruments, guarantees against a possible default. The clearinghouse stands between the buyer and the seller of the contract; therefore, the credit risk is limited to failure of the clearinghouse. While offset rights may exist under applicable law, the Fund does not have a contractual right of offset against a clearing broker or clearinghouse in the event of a default of the clearing broker or clearinghouse.
The Fund has entered into master agreements, such as an International Swaps and Derivatives Association, Inc. Master Agreement (“ISDA Master Agreement”) or similar agreement, with certain of its derivative counterparties that govern over-the-counter (“OTC”) derivatives and provide for general obligations, representations, agreements, collateral posting terms, netting provisions in the event of default or termination and credit related contingent features. The credit related contingent features include, but are not limited to, a percentage decrease in the Fund’s net assets or net asset value per share over a specified period of time. If these credit related contingent features were triggered, the derivatives counterparty could terminate the positions and demand payment or require additional collateral.
Under an ISDA Master Agreement, the Fund may, under certain circumstances, offset with the counterparty certain derivative financial instruments’ payables and/or receivables with collateral held and/or posted and create one single net payment. However, absent an event of default by the counterparty or a termination of the agreement, the terms of the ISDA Master Agreements do not result in an offset of reported amounts of financial assets and financial liabilities in the Statement of Assets and Liabilities across transactions between the Fund and the applicable counterparty. The enforceability of the right to offset may vary by jurisdiction.
Collateral requirements differ by type of derivative. Collateral or margin requirements are set by the broker or exchange clearinghouse for exchange traded derivatives while collateral terms are contract specific for OTC traded derivatives. Cash collateral that has been pledged to cover obligations of the Fund under derivative contracts, if any, will be reported separately in the Statement of Assets and Liabilities. Securities pledged as collateral, if any, for the same purpose are noted in the Schedule of Investments.
As of June 30, 2024, the Fund held forward foreign currency contracts with credit related contingent features which had a liability position of $19,068. If a contingent feature in the master agreements would have been triggered, the Fund would have been required to pay this amount to its derivatives counterparties.
Western Asset Premier Bond Fund 2024 Semi-Annual Report
Notes to financial statements (unaudited) (cont’d)
(k) Security transactions and investment income. Security transactions are accounted for on a trade date basis. Interest income (including interest income from payment-in-kind securities) is recorded on the accrual basis. Amortization of premiums and accretion of discounts on debt securities are recorded to interest income over the lives of the respective securities, except for premiums on certain callable debt securities, which are amortized to the earliest call date. Paydown gains and losses on mortgage- and asset-backed securities are recorded as adjustments to interest income. Dividend income is recorded on the ex-dividend date for dividends received in cash and/or securities. The cost of investments sold is determined by use of the specific identification method. To the extent any issuer defaults or a credit event occurs that impacts the issuer, the Fund may halt any additional interest income accruals and consider the realizability of interest accrued up to the date of default or credit event.
(l) Distributions to shareholders. Distributions from net investment income of the Fund, if any, are declared quarterly and paid on a monthly basis. The actual source of the Fund’s monthly distributions may be from net investment income, return of capital or a combination of both. Shareholders will be informed of the tax characteristics of the distributions after the close of the fiscal year. Distributions of net realized gains, if any, are declared at least annually. Distributions to shareholders of the Fund are recorded on the ex-dividend date and are determined in accordance with income tax regulations, which may differ from GAAP.
(m) Compensating balance arrangements. The Fund has an arrangement with its custodian bank whereby a portion of the custodian’s fees is paid indirectly by credits earned on the Fund’s cash on deposit with the bank.
(n) Federal and other taxes. It is the Fund’s policy to comply with the federal income and excise tax requirements of the Internal Revenue Code of 1986 (the “Code”), as amended, applicable to regulated investment companies. Accordingly, the Fund intends to distribute its taxable income and net realized gains, if any, to shareholders in accordance with timing requirements imposed by the Code. Therefore, no federal or state income tax provision is required in the Fund’s financial statements.
Management has analyzed the Fund’s tax positions taken on income tax returns for all open tax years and has concluded that as of December 31, 2023, no provision for income tax is required in the Fund’s financial statements. The Fund’s federal and state income and federal excise tax returns for tax years for which the applicable statutes of limitations have not expired are subject to examination by the Internal Revenue Service and state departments of revenue.
Under the applicable foreign tax laws, a withholding tax may be imposed on interest, dividends and capital gains at various rates.
(o) Reclassification. GAAP requires that certain components of net assets be reclassified to reflect permanent differences between financial and tax reporting. These reclassifications have no effect on net assets or net asset value per share.
Western Asset Premier Bond Fund 2024 Semi-Annual Report
2. Investment management agreement and other transactions with affiliates
The Fund has a management agreement with Western Asset Management Company, LLC (“Western Asset”). Pursuant to the terms of the management agreement, the Fund pays Western Asset an annual fee, payable monthly, in an amount equal to 0.55% of the average weekly value of the Fund’s total managed assets. “Total managed assets” means the total assets of the Fund (including any assets attributable to leverage) minus accrued liabilities (other than liabilities representing leverage). Pursuant to a Portfolio Management Agreement between Western Asset and Western Asset Management Company Limited (“Western London”), Western Asset pays monthly a portion of the fees it receives from the Fund to Western London at an annual rate of 0.425% of the average weekly value of the Fund’s total managed assets that Western London manages. Western Asset Management Company Pte. Ltd. (“Western Asset Singapore”) and Western Asset Management Company Ltd (“Western Asset Japan”) are additional investment advisers to the Fund under portfolio management agreements between Western Asset and Western Asset Singapore and Western Asset and Western Asset Japan, respectively. Western Asset pays monthly a portion of the fees it receives from the Fund to each Western Asset Singapore and Western Asset Japan at an annual rate of 0.425% of the average weekly value of the Fund’s total managed assets that each Western Asset Singapore and Western Asset Japan manages.
Western Asset Singapore and Western Asset Japan provide certain advisory services to the Fund relating to currency transactions and investments in non-U.S. dollar-denominated securities and related foreign currency instruments in Asia (excluding Japan) and Japan, respectively.
Under the terms of the administration services agreement between Western Asset and Franklin Templeton Fund Adviser, LLC (“FTFA”), Western Asset pays FTFA a monthly fee at an annual rate of 0.125% of the Fund’s average weekly total managed assets, subject to a monthly minimum fee of $12,500.
Western Asset has agreed to waive the Fund’s management fee to an extent sufficient to offset the net management fee payable in connection with any investment in an affiliated money market fund (the “affiliated money market fund waiver”).
During the six months ended June 30, 2024, fees waived and/or expenses reimbursed amounted to $652, all of which was an affiliated money market fund waiver.
FTFA, Western Asset, Western London, Western Asset Singapore and Western Asset Japan are indirect, wholly-owned subsidiaries of Franklin Resources, Inc. (“Franklin Resources”).
During periods in which the Fund utilizes financial leverage, the fees paid to the investment adviser will be higher than if the Fund did not utilize leverage because the fees are calculated as a percentage of the Fund’s assets, including those investments purchased with leverage.
All officers and one Trustee of the Fund are employees of Franklin Resources or its affiliates and do not receive compensation from the Fund.
Western Asset Premier Bond Fund 2024 Semi-Annual Report
Notes to financial statements (unaudited) (cont’d)
3. Investments
During the six months ended June 30, 2024, the aggregate cost of purchases and proceeds from sales of investments (excluding short-term investments) and U.S. Government & Agency Obligations were as follows:
| | U.S. Government &
Agency Obligations |
| | |
| | |
At June 30, 2024, the aggregate cost of investments and the aggregate gross unrealized appreciation and depreciation of investments for federal income tax purposes were substantially as follows:
| | Gross
Unrealized
Appreciation | Gross
Unrealized
Depreciation | Net
Unrealized
Appreciation |
| | | | |
Forward foreign currency contracts | | | | |
Transactions in reverse repurchase agreements for the Fund during the six months ended June 30, 2024 were as follows:
| Weighted Average
Interest Rate* | Maximum Amount
Outstanding |
| | |
* Averages based on the number of days that the Fund had reverse repurchase agreements outstanding. |
Interest rates on reverse repurchase agreements ranged from 5.700% to 5.800% during the six months ended June 30, 2024. Interest expense incurred on reverse repurchase agreements totaled $149,701.
4. Derivative instruments and hedging activities
Below is a table, grouped by derivative type, that provides information about the fair value and the location of derivatives within the Statement of Assets and Liabilities at June 30, 2024.
|
| |
Forward foreign currency contracts | |
|
| |
Forward foreign currency contracts | |
| Generally, the balance sheet location for asset derivatives is receivables/net unrealized appreciation and for liability derivatives is payables/net unrealized depreciation. |
Western Asset Premier Bond Fund 2024 Semi-Annual Report
The following tables provide information about the effect of derivatives and hedging activities on the Fund’s Statement of Operations for the six months ended June 30, 2024. The first table provides additional detail about the amounts and sources of gains (losses) realized on derivatives during the period. The second table provides additional information about the change in net unrealized appreciation (depreciation) resulting from the Fund’s derivatives and hedging activities during the period.
AMOUNT OF NET REALIZED GAIN (LOSS) ON DERIVATIVES RECOGNIZED |
| |
Forward foreign currency contracts | |
CHANGE IN NET UNREALIZED APPRECIATION (DEPRECIATION) ON DERIVATIVES RECOGNIZED |
| |
Forward foreign currency contracts | |
During the six months ended June 30, 2024, the volume of derivative activity for the Fund was as follows:
| |
Forward foreign currency contracts (to buy) | |
Forward foreign currency contracts (to sell) | |
The following table presents the Fund’s OTC derivative assets and liabilities by counterparty net of amounts available for offset under an ISDA Master Agreement and net of the related collateral pledged (received) by the Fund as of June 30, 2024.
| Gross Assets
Subject to
Master
| Gross
Liabilities
Subject to
Master
| Net Assets
(Liabilities)
Subject to
Master
Agreements | Collateral
Pledged
(Received) | |
| | | | | |
| | | | | |
| | | | | |
Morgan Stanley & Co. Inc. | | | | | |
| | | | | |
| Absent an event of default or early termination, derivative assets and liabilities are presented gross and not offset in the Statement of Assets and Liabilities. |
| Represents the net amount receivable (payable) from (to) the counterparty in the event of default. |
The Fund has a Margin Loan and Security Agreement (the “Credit Agreement”) with Bank of America, N.A. (“BofA”) that allows the Fund to borrow up to an aggregate amount of $72,000,000 and renews daily for a 179-day term unless notice to the contrary is given to the Fund. The Fund pays interest on borrowings calculated based on the Secured
Western Asset Premier Bond Fund 2024 Semi-Annual Report
Notes to financial statements (unaudited) (cont’d)
Overnight Financing Rate plus applicable margin. The Fund pays a commitment fee on the unutilized portion of the loan commitment amount at an annual rate of 0.20% except that the commitment fee is 0.15% when the aggregate outstanding balance of the loan is equal to or greater than 50% of the maximum commitment amount. To the extent of the borrowing outstanding, the Fund is required to maintain collateral in a special custody account at the Fund’s custodian on behalf of BofA. The Credit Agreement contains customary covenants that, among other things, may limit the Fund’s ability to pay distributions in certain circumstances, incur additional debt, change its fundamental investment policies and engage in certain transactions, including mergers and consolidations, and require asset coverage ratios in addition to those required by the 1940 Act. In addition, the Credit Agreement may be subject to early termination under certain conditions and may contain other provisions that could limit the Fund’s ability to utilize borrowing under the agreement. Interest expense related to the Credit Agreement for the six months ended June 30, 2024 was $1,567,287. For the six months ended June 30, 2024, the Fund incurred commitment fees of $16,785. For the six months ended June 30, 2024, based on the number of days during the reporting period that the Fund had a loan balance outstanding, the average daily loan balance was $49,865,385 and the weighted average interest rate was 6.22%. At June 30, 2024, the Fund had $59,000,000 of borrowings outstanding.
6. Distributions subsequent to June 30, 2024
The following distributions have been declared by the Fund’s Board of Directors and are payable subsequent to the period end of this report:
7. Share repurchase program
On November 20, 2015, the Fund announced that the Fund’s Board of Trustees (the “Board”) had authorized the Fund to repurchase in the open market up to approximately 10% of the Fund’s outstanding common shares when the Fund’s shares are trading at a discount to net asset value. The Board has directed management of the Fund to repurchase its common shares at such times and in such amounts as management reasonably believes may enhance shareholder value. The Fund is under no obligation to purchase shares at any specific discount levels or in any specific amounts. During the six months ended June 30, 2024, and the year ended December 31, 2023, the Fund did not repurchase any shares.
Since the commencement of the share repurchase program through June 30, 2024, the Fund repurchased 44,671 shares or 0.38% of its common shares outstanding for a total amount of $462,743.
8. Transactions with affiliated company
As defined by the 1940 Act, an affiliated company is one in which the Fund owns 5% or more of the outstanding voting securities, or a company which is under common ownership or control with the Fund. The following company was considered an affiliated company for
Western Asset Premier Bond Fund 2024 Semi-Annual Report
all or some portion of the six months ended June 30, 2024. The following transactions were effected in such company for the six months ended June 30, 2024.
| Affiliate
Value at
December 31,
2023 | | |
| | | |
Western Asset Premier Institutional Government Reserves, Premium Shares | | | | | |
| | | Net Increase
(Decrease) in
Unrealized
Appreciation
(Depreciation) | Affiliate
Value at
June 30,
2024 |
Western Asset Premier Institutional Government Reserves, Premium Shares | | | | |
9. Deferred capital losses
As of December 31, 2023, the Fund had deferred capital losses of $27,109,247, which have no expiration date, that will be available to offset future taxable capital gains.
10. Recent accounting pronouncement
In March 2020, the FASB issued Accounting Standards Update (ASU) No. 2020-04, Reference Rate Reform (Topic 848) – Facilitation of the Effects of Reference Rate Reform on Financial Reporting. In January 2021 and December 2022, the FASB issued ASU No. 2021-01 and ASU No. 2022-06, with further amendments to Topic 848. The amendments in the ASUs provide optional temporary accounting recognition and financial reporting relief from the effect of certain types of contract modifications due to the planned discontinuation of the London Interbank Offered Rate (LIBOR) and other interbank-offered based reference rates as of the end of 2021 for certain LIBOR settings and 2023 for the remainder. The ASUs are effective for certain reference rate-related contract modifications that occur during the period March 12, 2020, through December 31, 2024. Management has reviewed the requirements and believes the adoption of these ASUs will not have a material impact on the financial statements.
Western Asset Premier Bond Fund 2024 Semi-Annual Report
Board approval of management andsubadvisory agreements (unaudited) The Executive and Contracts Committee of the Board of Trustees (the “Executive and Contracts Committee”) considered the Investment Management Agreement between the Fund and Western Asset Management Company, LLC (“Western Asset”) and the following subadvisory agreements with respect to the Fund (collectively, the “Agreements”) (i) a subadvisory agreement between Western Asset and Western Asset Management Company Limited (“WAML”) with respect to the Fund, (ii) a subadvisory agreement between Western Asset and Western Asset Management Company Pte. Ltd. in Singapore (“Western Singapore”) with respect to the Fund, and (iii) a subadvisory agreement between Western Asset and Western Asset Management Company Ltd in Japan (“Western Japan,” and together with Western Singapore and WAML, the “Non-U.S. Advisers,” and together with Western Asset, the “Advisers”) with respect to the Fund at a meeting held on April 30, 2024. At an in-person meeting held on May 16, 2024, the Executive and Contracts Committee reported to the full Board of Trustees their considerations and recommendation with respect to the Agreements, and the Board of Trustees, including a majority of the Independent Trustees, considered and approved renewal of the Agreements.
The Trustees noted that although Western Asset’s business is operated through separate legal entities, such as the Non-U.S. Advisers, senior investment personnel at Western Asset have supervisory oversight responsibility over the investment decisions made by the Non-U.S. Advisers. Therefore, in connection with their deliberations noted below, the Trustees primarily focused on the information provided by Western Asset when considering the approval of the Agreements between Western Asset and the Non-U.S. Advisers.
In arriving at their decision to approve the renewal of the Agreements, the Trustees met with representatives of the Advisers, including relevant investment advisory personnel; considered a variety of information prepared by the Advisers, materials provided by Broadridge and advice and materials provided by counsel to the Independent Trustees; reviewed performance and expense information for peer groups of comparable funds and certain other comparable products available from Western Asset or affiliates of Western Asset, including separate accounts managed by Western Asset; and requested and reviewed additional information as necessary. These reviews were in addition to information obtained by the Trustees at their regular quarterly meetings (and various committee meetings) with respect to the Fund’s performance and other relevant matters, such as information on public trading in the Fund’s shares and differences between the Fund’s share price and net asset value per share, and related discussions with the Advisers’ personnel. The information received and considered by the Board both in conjunction with the May meeting and at prior meetings was both written and oral.
As part of their review, the Trustees examined the Advisers’ ability to provide high quality investment management services to the Fund. The Trustees considered the investment philosophy and research and decision-making processes of the Advisers; the experience of
Western Asset Premier Bond Fund
their key advisory personnel responsible for management of the Fund; the ability of the Advisers to attract and retain capable research and advisory personnel; the risks to the Advisers associated with sponsoring the Fund (such as entrepreneurial, operational, reputational, litigation and regulatory risk), as well as the Advisers’ risk management processes); the capability and integrity of the Advisers’ senior management and staff; and the level of skill required to manage the Fund. In addition, the Trustees reviewed the quality of the Advisers’ services with respect to regulatory compliance and compliance with the investment policies of the Fund, and conditions that might affect the Advisers’ ability to provide high quality services to the Fund in the future, including their business reputations, financial conditions and operational stabilities. Based on the foregoing, the Trustees concluded that the Advisers’ investment process, research capabilities and philosophy were well suited to the Fund given its investment objectives and policies, and that the Advisers would be able to meet any reasonably foreseeable obligations under the Agreements.
The Board reviewed the qualifications, backgrounds and responsibilities of the Advisers’ senior personnel and the team of investment professionals primarily responsible for the day-to-day portfolio management of the Fund. The Board also considered, based on its knowledge of the Advisers and their affiliates, the financial resources of Franklin Resources, Inc., the parent organization of the Advisers. The Board recognized the importance of having a fund manager with significant resources.
In reviewing the quality of the services provided to the Fund, the Trustees also reviewed comparisons of the performance of the Fund to the performance of a group consisting of all (including the Fund) closed-end leveraged, BBB-rated corporate debt (leveraged) funds (the “Performance Universe”) and the Bloomberg U.S. Corporate High Yield Index (the “Index”). The Directors noted that the performance of the Fund exceeded the performance of the median of the Performance Universe for the 1-, 3-, 5-, and 10-year periods ended December 31, 2023. The Board further noted that the Fund’s performance trailed that of the Index for the 1-, 3-, 5-, and 10- year periods ended December 31, 2023. The Trustees considered the factors involved in the Fund’s performance relative to the performance of the Index and the Performance Universe and discussed the reasons for the Fund’s underperformance relative to the performance of the Index. The Trustees concluded that the Advisers’ management of the Fund would continue to be in the best interests of the shareholders.
The Trustees also considered the management fee and total expenses payable by the Fund. They reviewed information concerning management fees paid to investment advisers of similarly managed funds as well as fees paid by Western Asset’s other clients, including separate accounts managed by Western Asset. The Trustees also noted that the Fund does not pay any management fees directly to any of the Non-U.S. Advisers because Western Asset pays the Non-U.S. Advisers for services provided to the Fund out of the management
Western Asset Premier Bond Fund
Board approval of management andsubadvisory agreements (unaudited) (cont’d) fee Western Asset receives from the Fund. The Trustees noted that the Fund’s expense peer group consisted of the Fund and a group of BBB-rated corporate debt (leveraged) funds. The Trustees noted that, when measured as a percentage of net assets (including assets attributable to leverage) for its most recently completed fiscal year, the Fund’s advisory fee paid to Western Asset was above the median of the advisory fees paid by funds in its peer group and that the Fund’s total expenses were above the median in its peer group. The Trustees also noted that, when measured as a percentage of net assets (net of leverage) for its most recently completed fiscal year, the Fund’s advisory fee paid to Western Asset was below the median of the advisory fees paid by the funds in its peer group and that the Fund’s total expenses were below the median of the total expenses of the funds in its peer group. They also noted that the Fund’s contractual advisory fee payable to Western Asset was below the median in the Fund’s peer group. They noted that Western Asset did not manage other directly comparable accounts, however the management fee paid by the Fund was generally higher than the fees paid by other clients of the Non-U.S. Advisers with the most similar investment strategies to the Fund. They considered that Western Asset was responsible for payment of the management fee to the Non-U.S. Advisers and that the administrative and operational responsibilities for the Non-U.S. Advisers with respect to the Fund were also relatively higher. In light of these differences, the Trustees concluded that the management fee paid by the Fund relative to the fees paid by the Non-U.S. Advisers’ other clients was reasonable.
The Trustees further evaluated the benefits of the advisory relationship to the Advisers, including, among others, the profitability of the relationship to the Advisers; the direct and indirect benefits that the Advisers may receive from their relationships with the Fund, including the “fallout benefits,” such as reputational value derived from serving as investment adviser to the Fund; and the affiliation between the Advisers and Franklin Templeton Fund Adviser, LLC (formerly known as Legg Mason Partners Funds Advisor, LLC), the Fund’s administrator, and certain other service providers for the Fund. In that connection, the Board considered that the ancillary benefits that the Advisers receive were reasonable. The Trustees noted that Western Asset does not have soft dollar arrangements.
Finally, the Trustees considered, in light of the profitability information provided by Western Asset, the extent to which economies of scale would be realized by the Advisers as the assets of the Fund grow. The Trustees concluded that because the Fund is a closed-end fund and does not make a continuous offer of its securities, the Fund’s size was relatively fixed and it would be unlikely that the Advisers would realize economies of scale from the Fund’s growth.
In their deliberations with respect to these matters, the Independent Trustees were advised by their independent counsel, who is independent, within the meaning of the Securities and Exchange Commission rules regarding the independence of counsel, of the Advisers. The
Western Asset Premier Bond Fund
Independent Trustees weighed the foregoing matters in light of the advice given to them by their independent counsel as to the law applicable to the review of investment advisory contracts. In arriving at a decision, the Trustees, including the Independent Trustees, did not identify any single matter as all-important or controlling, and each Trustee may have attributed different weight to the various factors in evaluating the Agreements. The foregoing summary does not detail all the matters considered. The Trustees judged the terms and conditions of the Agreements, including the investment advisory fees, in light of all of the surrounding circumstances.
Based upon their review, the Trustees, including all of the Independent Trustees, determined, in the exercise of their business judgment, that they were satisfied with the quality of investment advisory services being provided by the Advisers; that the fees to be paid to the Advisers under the Agreements were fair and reasonable given the scope and quality of the services rendered by the Advisers; and that approval of the Agreements was in the best interest of the Fund and its shareholders.
Western Asset Premier Bond Fund
Additional shareholder information (unaudited)
Results of annual meeting of shareholders
The Annual Meeting of Shareholders (the “Meeting”) of Western Asset Premier Bond Fund was held on May 22, 2024 for the purpose of considering and voting upon the proposal presented at the Meeting. The following table provides information concerning the matters voted upon at the Meeting:
At June 30, 2024, the Trustees of the Fund were Robert Abeles, Jr., Jane F. Dasher, Anita L. DeFrantz, Susan B. Kerley, Michael Larson, Ronald L. Olson, Avedick B. Poladian, William E.B. Siart, Jaynie Miller Studenmund, Peter J. Taylor and Jane E. Trust.
Western Asset Premier Bond Fund
Dividend reinvestment plan (unaudited)
The Fund and Computershare Inc. (“Agent”), as the Transfer Agent and Registrar of the Fund, offer a convenient way to add shares of the Fund to your account. The Fund offers to all common shareholders a Dividend Reinvestment Plan (“Plan”). Under the Plan, cash distributions (e.g., dividends and capital gains) of registered shareholders (those who own shares in their own name on the Fund’s records) on the common shares are automatically invested in shares of the Fund unless the shareholder elects otherwise by contacting the Agent at the address set forth below. Shareholders who own shares in a brokerage, bank or other financial institution account must contact the company where their account is held in order to participate in the Plan.
As a participant in the Dividend Reinvestment Plan you will automatically receive your dividend or net capital gains distribution in newly issued shares of the Fund if the market price of a share on the date of the distribution is at or above the NAV of a Fund share, minus estimated brokerage commissions that would be incurred upon the purchase of common shares on the open market. The number of shares to be issued to you will be determined by dividing the amount of the cash distribution to which you are entitled (net of any applicable withholding taxes) by the greater of the NAV per share on such date or 95% of the market price of a share on such date. If the market price of a share on such distribution date is below the NAV, minus estimated brokerage commissions that would be incurred upon the purchase of common shares on the open market, the Agent will, as agent for the participants, buy shares of the Fund through a broker on the open market. The price per share of shares purchased for each participant’s account with respect to a particular dividend or other distribution will be the average price (including brokerage commissions, transfer taxes and any other costs of purchase) of all shares purchased with respect to that dividend or other distribution. All common shares acquired on your behalf through the Plan will be automatically credited to an account maintained on the books of the Agent. Full and fractional shares will be voted by the Agent in accordance with your instructions.
Additional information regarding the plan
The Fund will pay all costs applicable to the Plan, except for brokerage commissions for open market purchases by the Agent under the Plan, which will be charged to participants. All shares acquired through the Plan receive voting rights and are eligible for any share split, share dividend, or other rights accruing to shareholders that the Board of Trustees may declare. Registered shareholder may terminate participation in the Plan at any time by giving notice to the Agent. Such termination will be effective prior to the record date next succeeding the receipt of such instructions or by a later date of termination specified in such instructions. Upon termination, a participant will receive a certificate for the full shares credited to his or her account or may request the sale of all or part of such shares. Fractional shares credited to a terminating account will be paid for in cash at the current market price at the time of termination. Shareholders who own shares in a brokerage, bank or other financial institution account must contact the company where their account is held in order to terminate participation in the Plan.
Western Asset Premier Bond Fund
Dividend reinvestment plan (unaudited) (cont’d)
Dividends and other distributions invested in additional shares under the Plan are subject to income tax just as if they had been received in cash. After year end, dividends paid on the accumulated shares will be included in the Form 1099-DIV information return to the Internal Revenue Service (IRS) and only one Form 1099-DIV will be sent to participants each year. Inquiries regarding the Plan, as well as notices of termination, should be directed to Computershare Inc., P.O. Box 43006 Providence, RI 02940-3078. Investor Relations Telephone number 1-888-888-0151.
Western Asset Premier Bond Fund
(This page intentionally left blank.)
(This page intentionally left blank.)
Western Asset
Premier Bond Fund
Trustees
William E.B. Siart
Chairman
Jane Trust
President and Chief Executive Officer
Christopher Berarducci
Treasurer and Principal Financial
Officer
Ted P. Becker
Chief Compliance Officer
Marc A. De Oliveira
Secretary and Chief Legal
Officer
Thomas C. Mandia
Senior Vice President
Jeanne M. Kelly
Senior Vice President
Western Asset Premier Bond Fund
620 Eighth Avenue
47th Floor
New York, NY 10018
Western Asset Management Company, LLC
Western Asset Management Company Limited
Western Asset Management Company Pte. Ltd.
Western Asset Management Company Ltd
The Bank of New York Mellon
Independent registered
public accounting firm
PricewaterhouseCoopers LLP
100 East Pratt Street
Baltimore, MD 21202
Legal counsel
Ropes & Gray LLP
1211 Avenue of the Americas
New York, NY 10036
Computershare Inc.
P.O. Box 43006
Providence, RI 02940-3078
New York Stock
Exchange Symbol
Franklin Templeton Funds Privacy and Security Notice
Your Privacy and the Security of Your Personal Information is Very Important to Us
This Privacy and Security Notice (the “Privacy Notice”) addresses the Funds’ privacy and data protection practices with respect to nonpublic personal information the Fund receives. The Legg Mason Funds include the Western Asset Money Market Funds (Funds) sold by the Funds’ distributor, Franklin Distributors, LLC, as well as Legg Mason-sponsored closed-end funds. The provisions of this Privacy Notice apply to your information both while you are a shareholder and after you are no longer invested with the Funds.
The Type of Nonpublic Personal Information the Funds Collect About You
The Funds collect and maintain nonpublic personal information about you in connection with your shareholder account. Such information may include, but is not limited to:
•
Personal information included on applications or other forms;
•
Account balances, transactions, and mutual fund holdings and positions;
•
Bank account information, legal documents, and identity verification documentation; and
•
Online account access user IDs, passwords, security challenge question responses.
How the Funds Use Nonpublic Personal Information About You
The Funds do not sell or share your nonpublic personal information with third parties or with affiliates for their marketing purposes, unless you have authorized the Funds to do so. The Funds do not disclose any nonpublic personal information about you except as may be required to perform transactions or services you have authorized or as permitted or required by law. The Funds may disclose information about you to:
•
Employees, agents, and affiliates on a “need to know” basis to enable the Funds to conduct ordinary business or to comply with obligations to government regulators;
•
Service providers, including the Funds’ affiliates, who assist the Funds as part of the ordinary course of business (such as printing, mailing services, or processing or servicing your account with us) or otherwise perform services on the Funds’ behalf, including companies that may perform statistical analysis, market research and marketing services solely for the Funds;
•
Permit access to transfer, whether in the United States or countries outside of the United States to such Funds’ employees, agents and affiliates and service providers as required to enable the Funds to conduct ordinary business, or to comply with obligations to government regulators;
•
The Funds’ representatives such as legal counsel, accountants and auditors to enable the Funds to conduct ordinary business, or to comply with obligations to government regulators;
•
Fiduciaries or representatives acting on your behalf, such as an IRA custodian or trustee of a grantor trust.
NOT PART OF THE SEMI-ANNUAL REPORT
Franklin Templeton Funds Privacy and Security Notice (cont’d) Except as otherwise permitted by applicable law, companies acting on the Funds’ behalf, including those outside the United States, are contractually obligated to keep nonpublic personal information the Funds provide to them confidential and to use the information the Funds share only to provide the services the Funds ask them to perform.
The Funds may disclose nonpublic personal information about you when necessary to enforce their rights or protect against fraud, or as permitted or required by applicable law, such as in connection with a law enforcement or regulatory request, subpoena, or similar legal process. In the event of a corporate action or in the event a Fund service provider changes, the Funds may be required to disclose your nonpublic personal information to third parties. While it is the Funds’ practice to obtain protections for disclosed information in these types of transactions, the Funds cannot guarantee their privacy policy will remain unchanged.
Keeping You Informed of the Funds’ Privacy and Security Practices
The Funds will notify you annually of their privacy policy as required by federal law. While the Funds reserve the right to modify this policy at any time, they will notify you promptly if this privacy policy changes.
The Funds’ Security Practices
The Funds maintain appropriate physical, electronic and procedural safeguards designed to guard your nonpublic personal information. The Funds’ internal data security policies restrict access to your nonpublic personal information to authorized employees, who may use your nonpublic personal information for Fund business purposes only.
Although the Funds strive to protect your nonpublic personal information, they cannot ensure or warrant the security of any information you provide or transmit to them, and you do so at your own risk. In the event of a breach of the confidentiality or security of your nonpublic personal information, the Funds will attempt to notify you as necessary so you can take appropriate protective steps. If you have consented to the Funds using electronic communications or electronic delivery of statements, they may notify you under such circumstances using the most current email address you have on record with them.
In order for the Funds to provide effective service to you, keeping your account information accurate is very important. If you believe that your account information is incomplete, not accurate or not current, if you have questions about the Funds’ privacy practices, or our use of your nonpublic personal information, write the Funds using the contact information on your account statements, email the Funds by clicking on the Contact Us section of the Funds’ website at www.franklintempleton.com, or contact the Funds at 1-877-721-1926 for the Western Asset Money Market Funds or 1-888-777-0102 for the Legg Mason-sponsored closed-end funds. For additional information related to certain state privacy rights, please visit https://www.franklintempleton.com/help/privacy-policy.
NOT PART OF THE SEMI-ANNUAL REPORT
Western Asset Premier Bond Fund
Western Asset Premier Bond Fund
620 Eighth Avenue
47th Floor
New York, NY 10018
Notice is hereby given in accordance with Section 23(c) of the Investment Company Act of 1940, as amended, that from time to time the Fund may purchase, at market prices, its common shares.
The Fund files its complete schedule of portfolio holdings with the Securities and Exchange Commission (“SEC”) for the first and third quarters of each fiscal year as an exhibit to its reports on Form N-PORT. The Fund’s Forms N-PORT are available on the SEC’s website at www.sec.gov. To obtain information on Form N-PORT, shareholders can call the Fund at 1-888-777-0102 or visit the Fund’s website at www.franklintempleton.com.
Information on how the Fund voted proxies relating to portfolio securities during the prior 12-month period ended June 30th of each year and a description of the policies and procedures that the Fund uses to determine how to vote proxies related to portfolio transactions are available (1) without charge, upon request, by calling 1-888-777-0102, (2) at www.franklintempleton.com and (3) on the SEC’s website at www.sec.gov.
Quarterly performance, semi-annual and annual reports, current net asset value and other information regarding the Fund may be found on Franklin Templeton’s website, which can be accessed at www.franklintempleton.com. Any reference to Franklin Templeton’s website in this report is intended to allow investors public access to information regarding the Fund and does not, and is not intended to, incorporate Franklin Templeton’s website in this report.
This report is transmitted to the shareholders of Western Asset Premier Bond Fund for their information. This is not a prospectus, circular or representation intended for use in the purchase of shares of the Fund or any securities mentioned in this report.
Computershare Inc.
P.O. Box 43006
Providence, RI 02940-3078
Not applicable.
| ITEM 3. | AUDIT COMMITTEE FINANCIAL EXPERT. |
Not applicable.
| ITEM 4. | PRINCIPAL ACCOUNTANT FEES AND SERVICES. |
Not applicable.
| ITEM 5. | AUDIT COMMITTEE OF LISTED REGISTRANTS. |
Not applicable.
| ITEM 6. | SCHEDULE OF INVESTMENTS. |
Included herein under Item 1.
| ITEM 7. | FINANCIAL STATEMENTS AND FINANCIAL HIGHLIGHTS FOR OPEN-END MANAGEMENT INVESTMENT COMPANIES. |
Not applicable.
| ITEM 8. | CHANGES IN AND DISAGREEMENTS WITH ACCOUNTANTS FOR OPEN-END MANAGEMENT INVESTMENT COMPANIES. |
Not applicable.
| ITEM 9. | PROXY DISCLOSURES FOR OPEN-END MANAGEMENT INVESTMENT COMPANIES. |
Not applicable.
| ITEM 10. | REMUNERATION PAID TO DIRECTORS, OFFICERS, AND OTHERS OF OPEN-END MANAGEMENT INVESTMENT COMPANIES. |
Not applicable.
| ITEM 11. | STATEMENT REGARDING BASIS FOR APPROVAL OF INVESTMENT ADVISORY CONTRACT. |
Included herein under Item 1
| ITEM 12. | DISCLOSURE OF PROXY VOTING POLICIES AND PROCEDURES FOR CLOSED-END MANAGEMENT INVESTMENT COMPANIES. |
Not applicable.
| ITEM 13. | INVESTMENT PROFESSIONALS OF CLOSED-END MANAGEMENT INVESTMENT COMPANIES. |
On March 1, 2024, Blanton Keh and Ryan Brist became part of the portfolio management team of the Fund.
| NAME AND | | LENGTH OF | | PRINCIPAL OCCUPATION(S) DURING |
| ADDRESS | | TIME SERVED | | PAST 5 YEARS |
Blanton Keh Western Asset 385 East Colorado Blvd. Pasadena, CA 91101 | | Since March 1, 2024 | | Responsible for the day-to-day management with other members of the Fund’s portfolio management team; employed by Western Asset Management as an investment professional for at least the past five years; prior to joining Western Asset, he served as a Portfolio Manager with Banc of America Capital Management, and, prior to that, as a Market Risk Manager with Bank of America. |
Ryan Brist Western Asset 385 East Colorado Blvd. Pasadena, CA 91101 | | Since March 1, 2024 | | Responsible for the day-to-day management with other members of the Fund’s portfolio management team; Head of Investment-Grade Credit of Western Asset and has oversight of US credit research as well as of the Municipal Team; employed by Western Asset Management as an investment professional for at least the past five years. |
The following tables set forth certain additional information with respect to the above named fund’s investment professional responsible for the day-to-day management with other members of the Fund’s portfolio management team for the fund. Unless noted otherwise, all information is provided as of June 30, 2024.
Other Accounts Managed by Investment Professional
The table below identifies the number of accounts (other than the fund) for which the below named fund’s investment professional has day-to-day management responsibilities and the total assets in such accounts, within each of the following categories: registered investment companies, other pooled investment vehicles, and other accounts. For each category, the number of accounts and total assets in the accounts where fees are based on performance is also indicated.
| Name of PM | Type of Account | Number of Accounts Managed | Total Assets Managed | Number of Accounts Managed for which Advisory Fee is Performance-Based | Assets Managed for which Advisory Fee is Performance-Based |
| Blanton Keh ‡ | Other Registered Investment Companies | 8 | $2.34 billion | None | None |
| Other Pooled Vehicles | 16 | $9.20 billion | None | None |
| Other Accounts | 130 | $52.37 billion | 5 | $1.33 billion |
| Ryan Brist ‡ | Other Registered Investment Companies | 30 | $15.23 billion | None | None |
| Other Pooled Vehicles | 30 | $14.27 billion | None | None |
| Other Accounts | 167 | $72.48 billion | 5 | $1.33 billion |
‡ The numbers above reflect the overall number of portfolios managed by employees of Western Asset Management Company (“Western Asset”). Western Asset’s investment discipline emphasizes a team approach that combines the efforts of groups of specialists working in different market sectors. They are responsible for overseeing implementation of Western Asset’s overall investment ideas and coordinating the work of the various sector teams. This structure ensures that client portfolios benefit from a consensus that draws on the expertise of all team members.
(a)(3): Investment Professional Compensation
Conflicts of Interest
The Subadviser has adopted compliance policies and procedures to address a wide range of potential conflicts of interest that could directly impact client portfolios. For example, potential conflicts of interest may arise in connection with the management of multiple portfolios (including portfolios managed in a personal capacity). These could include potential conflicts of interest related to the knowledge and timing of a portfolio’s trades, investment opportunities and broker selection. Portfolio managers are privy to the size, timing, and possible market impact of a portfolio’s trades.
It is possible that an investment opportunity may be suitable for both a portfolio and other accounts managed by a portfolio manager, but may not be available in sufficient quantities for both the portfolio and the other accounts to participate fully. Similarly, there may be limited opportunity to sell an investment held by a portfolio and another account. A conflict may arise where the portfolio manager may have an incentive to treat an account preferentially as compared to a portfolio because the account pays a performance-based fee or the portfolio manager, the Subadviser or an affiliate has an interest in the account. The Subadviser has adopted procedures for allocation of portfolio transactions and investment opportunities across multiple client accounts on a fair and equitable basis over time. Eligible accounts that can participate in a trade generally share the same price on a pro-rata allocation basis, taking into account differences based on factors such as cash availability, investment restrictions and guidelines, and portfolio composition versus strategy.
With respect to securities transactions, the Subadviser determines which broker or dealer to use to execute each order, consistent with their duty to seek best execution of the transaction. However, with respect to certain other accounts (such as pooled investment vehicles that are not registered investment companies and other accounts managed for organizations and individuals), the Subadviser may be limited by the client with respect to the selection of brokers or dealers or may be instructed to direct trades through a particular broker or dealer. In these cases, trades for a portfolio in a particular security may be placed separately from, rather than aggregated with, such other accounts. Having separate transactions with respect to a security may temporarily affect the market price of the security or the execution of the transaction, or both, to the possible detriment of a portfolio or the other account(s) involved. Additionally, the management of multiple portfolios and/or other accounts may result in a portfolio manager devoting unequal time and attention to the management of each portfolio and/or other account. The Subadviser’s team approach to portfolio management and block trading approach seeks to limit this potential risk.
The Subadviser also maintains a gift and entertainment policy to address the potential for a business contact to give gifts or host entertainment events that may influence the business judgment of an employee.
Employees are permitted to retain gifts of only a nominal value and are required to make reimbursement for entertainment events above a certain value. All gifts (except those of a de minimis value) and entertainment events that are given or sponsored by a business contact are required to be reported in a gift and entertainment log which is reviewed on a regular basis for possible issues.
Employees of the Subadviser have access to transactions and holdings information regarding client accounts and the Subadviser’s overall trading activities. This information represents a potential conflict of interest because employees may take advantage of this information as they trade in their personal accounts. Accordingly, the Subadviser maintains a Code of Ethics that is compliant with Rule 17j-1 under the 1940 Act and Rule 204A-1 under the Advisers Act to address personal trading. In addition, the Code of Ethics seeks to establish broader principles of good conduct and fiduciary responsibility in all aspects of the Subadviser’s business. The Code of Ethics is administered by the Legal and Compliance Department and monitored through the Subadviser’s compliance monitoring program.
The Subadviser may also face other potential conflicts of interest with respect to managing client assets, and the description above is not a complete description of every conflict of interest that could be deemed to exist. The Subadviser also maintains a compliance monitoring program and engages independent auditors to conduct a SOC1/ISAE 3402 audit on an annual basis. These steps help to ensure that potential conflicts of interest have been addressed.
Investment Professional Compensation
With respect to the compensation of the Fund’s investment professionals, the Subadviser’s compensation system assigns each employee a total compensation range, which is derived from annual market surveys that benchmark each role with its job function and peer universe. This method is designed to reward employees with total compensation reflective of the external market value of their skills, experience and ability to produce desired results. Standard compensation includes competitive base salaries, generous employee benefits and a retirement plan.
In addition, the Subadviser’s employees are eligible for bonuses. These are structured to closely align the interests of employees with those of the Subadviser, and are determined by the professional’s job function and pre-tax performance as measured by a formal review process. All bonuses are completely discretionary. The principal factor considered is an investment professional’s investment performance versus appropriate peer groups and benchmarks (e.g., a securities index and with respect to the Fund, the benchmark set forth in the Fund’s Prospectus to which the Fund’s average annual total returns are compared or, if none, the benchmark set forth in the Fund’s annual report). Performance is reviewed on a 1, 3 and 5 year basis for compensation—with 3 and 5 years having a larger emphasis. The Subadviser may also measure an investment professional’s pre-tax investment performance against other benchmarks, as it determines appropriate. Because investment professionals are generally responsible for multiple accounts (including the Fund) with similar investment strategies, they are generally compensated on the performance of the aggregate group of similar accounts, rather than a specific account. Other factors that may be considered when making bonus decisions include client service, business development, length of service to the Subadviser, management or supervisory responsibilities, contributions to developing business strategy and overall contributions to the Subadviser’s business.
Finally, in order to attract and retain top talent, all investment professionals are eligible for additional incentives in recognition of outstanding performance. These are determined based upon the factors described above and include long-term incentives that vest over a set period of time past the award date.
Investment Professional Securities Ownership
The table below identifies the dollar range of securities beneficially owned by the named investment professional as of June 30, 2024.
Investment Professional
| | Dollar Range of
Portfolio Securities Beneficially Owned
|
| Blanton Keh | | A |
| Ryan Brist | | A |
Dollar Range ownership is as follows:
A: none
B: $1 - $10,000
C: 10,001 - $50,000
D: $50,001 - $100,000
E: $100,001 - $500,000
F: $500,001 - $1 million
G: over $1 million
| ITEM 14. | PURCHASES OF EQUITY SECURITIES BY CLOSED-END MANAGEMENT INVESTMENT COMPANY AND AFFILIATED PURCHASERS. |
Not applicable.
| ITEM 15. | SUBMISSION OF MATTERS TO A VOTE OF SECURITY HOLDERS. |
Not applicable.
| ITEM 16. | CONTROLS AND PROCEDURES. |
| (a) | The registrant’s principal executive officer and principal financial officer have concluded that the registrant’s disclosure controls and procedures (as defined in Rule 30a- 3(c) under the Investment Company Act of 1940, as amended (the “1940 Act”)) are effective as of a date within 90 days of the filing date of this report that includes the disclosure required by this paragraph, based on their evaluation of the disclosure controls and procedures required by Rule 30a-3(b) under the 1940 Act and 15d-15(b) under the Securities Exchange Act of 1934. |
| (b) | There were no changes in the registrant’s internal control over financial reporting (as defined in Rule 30a-3(d) under the 1940 Act) that occurred during the period covered by this report that have materially affected, or are likely to materially affect the registrant’s internal control over financial reporting. |
| ITEM 17. | DISCLOSURE OF SECURITIES LENDING ACTIVITIES FOR CLOSED-END MANAGEMENT INVESTMENT COMPANIES. |
Not applicable
| ITEM 18. | RECOVERY OF ERRONEOUSLY AWARDED COMPENSATION. |
SIGNATURES
Pursuant to the requirements of the Securities Exchange Act of 1934 and the Investment Company Act of 1940, the registrant has duly caused this Report to be signed on its behalf by the undersigned, there unto duly authorized.
Western Asset Premier Bond Fund
| By: | /s/ Jane Trust | |
| | Jane Trust | |
| | Chief Executive Officer | |
| | | |
| Date: | August 26, 2024 |
Pursuant to the requirements of the Securities Exchange Act of 1934 and the Investment Company Act of 1940, this report has been signed below by the following persons on behalf of the registrant and in the capacities and on the dates indicated.
| By: | /s/ Jane Trust | |
| | Jane Trust | |
| | Chief Executive Officer | |
| | | |
| Date: | August 26, 2024 | |
| By: | /s/ Christopher Berarducci | |
| | Christopher Berarducci | |
| | Principal Financial Officer | |
| | | |
| Date: | August 26, 2024 | |