Management's Discussion and Analysis
The following Management's Discussion and Analysis (“MD&A”) of the financial results of Besra Gold Inc. (the “Company” or “Besra”) and its subsidiaries (together, the “Group”) has been prepared for the three and nine-month periods ended March 31, 2014 and should be read in conjunction with the unaudited interim condensed consolidated financial statements and related notes, prepared in accordance with IAS 34 Interim Financial Reporting, and the annual financial statements for the financial year ended June 30, 2013. This discussion covers the three and nine-month periods ended March 31, 2014 and the subsequent period to May 14, 2014.
Other pertinent information on the Company is available on SEDAR at www.sedar.com and on EDGAR at www.sec.gov/edgar as well as on the Company's web site at www.besra.com. Besra is listed on the Toronto Stock Exchange under the symbol BEZ and on the Australian Securities Exchange under the symbol BEZ and trades on the OTCQX Bulletin Board ("OTCQX"), an over-the-counter market in the United States under the symbol BSRAF. For the purpose of preparing our MD&A, the Company considers the materiality of information. Information is considered material if: (i) such information results in, or would reasonably be expected to result in, a significant change in the market price or value of our shares; (ii) there is a substantial likelihood that a reasonable investor would consider it important in making an investment decision; or (iii) it would significantly alter the total mix of information available to investors. We evaluate materiality with reference to all relevant circumstances. All dollar amounts are stated in United States (“US”) dollars unless otherwise indicated.
|
| |
| |
| | |
| | |
| Introduction | |
| Third Quarter Highlights | |
| Outlook to June 30, 2014 | |
| 2014 Production guidance | 2 |
| Summary of Operations | 3 |
| Results of Operations and Exploration Update - Phuoc Son | |
| Results of Operations and Exploration Update - Bong Mieu | |
| Exploration Update and Development Activities - Bau | |
| Summary of Quarterly Results | 8 |
| Earnings Summary | 9 |
| Liquidity and Capital Resources | 13 |
| Related Party Transactions | |
| Other Financial Matters and Non-IFRS Measures | 19 |
| Risk Factors and Uncertainties | 21 |
| Forward-Looking Information | 22 |
| Technical Information and Qualified Person | 22 |
| | |
Management's Discussion & Analysis
Quarter ended March 31, 2014
Introduction
Q3 2014 sees us announcing another round of what can only be described as miserable results due to our on-going struggle to maintain our business in the incredibly difficult environment of Vietnam. At times it seemed that for every hurdle we cleared, another was being thrown up to slow our recovery.
Notwithstanding this, the government of Vietnam has assured us that we have their full support - support that exists from the Office of the Prime Minister to the Provincial Peoples’ Committee. This was evident in the recent repeal of the $12 million export tax assessment against our operating companies there. Common sense prevailed, but only after a year of extremely difficult operating conditions, the negative effects of which are still being felt. We are still sometimes confounded by determinations by mid-level bureaucrats with little or no understanding of our business that end up costing us significant time and money.
As a result of another difficult quarter, we are again revising down our production forecast for the year from 40-45,000 ozs to 31-34,000 ozs.
It is worth noting that this quarter spanned the Tet (Vietnamese New Year) holiday period, which meant we lost two weeks of production, and despite significant and ongoing cost reductions, all-in sustaining cost per ounce increased due to fixed costs being spread over fewer ounces.
On more than one occasion we have been asked whether it would not have been better to close up shop in Vietnam until the situation improved, but we made the decision that is was better to maintain a production base, albeit a small one. Not producing gold and maintaining assets would have had its own costs which we would have had difficulty funding and would inevitably have led to the loss of those assets.
As you’ll see from the attached report, some things have been going our way. We’ve been able to raise some funds to maintain operations, had our export licenses renewed, and of course secured the aforementioned repeal of the export tax assessment. We are also progressing with our insurance and tax relief claims on Bong Mieu and Phuoc Son damage and business interruption.
Importantly, we are in advanced negotiations on a range of capital raising options, both for easing the current liquidity issues and also the funding of our Bau project in Malaysia.
Bau continues to be the shining light at the end of the tunnel, and we are very hopeful of making an announcement soon on the commencement of development there, once project financing is complete.
John A. G. Seton
Chief Executive Officer
Management's Discussion & Analysis
Quarter ended March 31, 2014
Q3 2014 Highlights
The following are a selection of highlights for the quarter ended March 31, 2014. Further information about Besra can be found on the Company's website and/or at www.sedar.com
| |
| • | Issued secured promissory notes in the amount of US$444,889 |
| |
| • | Continued severe liquidity issues, and related legal actions |
| |
| • | Ongoing discussions for new financings |
| |
| • | Received Notice to Cure from 9% Note holders |
| |
| • | Granted a renewal of its annual license to export gold from Vietnam |
| |
| • | Released an updated Feasibility Study for Stage 1 of its Bau Gold Project which details significantly improved financial data from an already promising project |
| |
| • | Secured a repeal of all export tax assessments totaling $12 million against Bong Mieu Gold Mining Company and Phuoc Son Gold Company |
2014 Outlook
| |
| • | Raise additional capital to ease the Company's liquidity problems |
| |
| • | Commence development of Bau when financing complete |
| |
| • | Recommence production at Bong Mieu |
| |
| • | Settlement of insurance claim on Bong Mieu and Phuoc Son damage & Bong Mieu business interruption |
| |
| • | Obtain tax relief at Bong Mieu and Phuoc Son pursuant to typhoon-relief measure. |
2014 Production Guidance |
| | | |
| | Phuoc Son | Bong Mieu | Total |
| Gold (oz) - revised (Q3) | 24,000-26,000 | 7,000-8,000 | 31,000-34,000 |
| |
| • | Production guidance was revised again in Q3 2014 due to lower production at Phuoc Son plant and continued halt of operations at Bong Mieu due to typhoon damage |
| |
| • | Gold price is assumed to remain volatile |
Material Uncertainty as to Going Concern
During the three and nine-month periods ended March 31, 2014, the Group incurred a net loss of $8,542,046 and $47,358,233. As at March 31, 2014 the Group's current liabilities exceeded its current assets by $43,312,194 and contractual commitments amounted to $14,569,361. As a result, there is a substantial doubt regarding the ability of the Company to continue as a going concern. The ability of the Company to continue as a going concern depends upon its ability to resume profitable operations, dispose assets and to access public debt or equity capital in the ordinary course. No assurance can be given that such capital will be available at all or on terms acceptable to the Company. These Interim Financial Statements were prepared on a going concern basis, under the historical cost basis, less impairment charges and some fair value adjustments, which assumes the Company will continue its operations for the foreseeable future and will be able to realize its assets and discharge its liabilities and commitments in the ordinary course of business. Refer to Note 3 of the Interim Financial Statements as at March 31, 2014 for further details.
Management's Discussion & Analysis
Quarter ended March 31, 2014
Summary of Operations
|
| | | | | | | | | | |
| | Three months ended | Diff | Nine months ended | Diff |
| | Mar 31, 2014 |
| Mar 31, 2013 |
| (%) | Mar 31, 2014 |
| Mar 31, 2013 |
| (%) |
| Financial data ($) | | | | | | |
| Sales | 4,860,507 |
| 19,812,500 |
| (75) | 38,869,318 |
| 60,528,213 |
| (36) |
| Costs of sales | 5,643,429 |
| 10,747,697 |
| (47) | 36,979,575 |
| 30,385,987 |
| 22 |
| Gross margin | (782,922 | ) | 9,064,803 |
| (109) | 1,889,743 |
| 30,142,226 |
| (94) |
| | | | | | | |
| (Losses) earnings before finance costs, income tax, depreciation, amortization and impairment | (3,277,155 | ) | 3,428,536 |
| (196) | (10,345,530 | ) | 12,446,922 |
| (183) |
| | | | | | | |
| Non-IFRS Measures | | | | | | |
| Costs of sales (IFRS) | 5,643,429 |
| 10,747,697 |
| (47) | 36,979,575 |
| 30,385,987 |
| 22 |
| Gold sold (oz) | 4,020 |
| 12,200 |
| (67) | 30,604 |
| 36,395 |
| (16) |
Operating cash cost per ounce sold(1) | 1,404 |
| 881 |
| 59 | 1,208 |
| 835 |
| 45 |
| | | | | | | |
| Total production costs | 5,725,103 |
| 13,053,149 |
| (56) | 30,936,059 |
| 36,287,702 |
| (15) |
| Gold produced (oz) | 3,943 |
| 13,589 |
| (71) | 25,918 |
| 41,706 |
| (38) |
Operating cash costs per ounce produced(2) | 1,452 |
| 961 |
| 51 | 1,194 |
| 870 |
| 37 |
| | | | | | | |
All-in sustaining costs(3) | 2,085 |
| 1,453 |
| 43 | 1,728 |
| 1,359 |
| 27 |
| | | | | | | |
| Operating data | | | | | | |
| Ore milled (tonnes) | 43,430 |
| 151,390 |
| (71) | 302,814 |
| 367,836 |
| (18) |
| Recovery (%) | 91 | % | 92 | % | (1) | 89 | % | 91 | % | (2) |
| Grade (g/t Au) | 3.10 |
| 3.05 |
| 2 | 2.99 |
| 3.87 |
| (23) |
| Average realized price | 1,209 |
| 1,624 |
| (26) | 1,270 |
| 1,663 |
| (24) |
| |
1. | Operating cash cost per ounce sold includes mine site operating costs including mining, processing and refining, and inventory adjustments, but is exclusive of royalties, environmental fees, amortization and exploration costs. Refer to the Non-IFRS Measures section of the Company's MD&A. |
| |
2. | Operating cash cost per ounce produced includes mine site operating costs including mining, processing and refining, but is exclusive of inventory adjustments, royalties, environmental fees, export tax, amortization and exploration costs. Refer to the Non-IFRS Measures section of the Company's MD&A. |
| |
3. | All-in sustaining sustaining costs include all cash operating costs per ounce sold including a portion of corporate administration, sales based taxes and government fees and levies. It includes an annualized estimate of sustaining capital and exploration expenditure. It excludes corporate income tax, reclamation and remediation costs. Refer to the Non-IFRS Measures section of the Company's MD&A. |
Management's Discussion & Analysis
Quarter ended March 31, 2014
PHUOC SON GOLD PROJECT
Results of Operations
|
| | | | | | | | | | | | | | | | |
| | 3 months | Diff |
| 3 months |
| Diff |
| Nine months ended | Diff |
|
| Dec 31, 2013 |
| Mar 31, 2014 |
| (%) |
| Mar 31, 2013 |
| (%) |
| Mar 31, 2014 |
| Mar 31, 2013 |
| (%) |
|
| Financial Data ($) | | | | | | | | |
| Gold sales | 7,373,514 |
| 4,860,507 |
| (34 | ) | 13,869,750 |
| (65 | ) | 26,926,358 |
| 43,319,059 |
| (38 | ) |
| Cost of sales | 9,763,795 |
| 5,643,429 |
| (42 | ) | 6,392,812 |
| (12 | ) | 27,146,801 |
| 20,167,300 |
| 35 |
|
| Royalties | 1,538,045 |
| 734,343 |
| (52 | ) | 1,782,582 |
| (59 | ) | 4,576,005 |
| 6,416,424 |
| (29 | ) |
| Environment fees | 665,177 |
| 373,147 |
| (44 | ) | 866,376 |
| (57 | ) | 2,029,163 |
| 2,035,817 |
| n/a |
|
| Depreciation and amortization | 2,707,316 |
| 964,076 |
| (64 | ) | 3,411,892 |
| (72 | ) | 6,970,181 |
| 10,136,576 |
| (31 | ) |
| (Losses) earnings from mine operations | (7,300,819 | ) | (2,854,488 | ) | (61 | ) | 1,416,088 |
| (302 | ) | (13,795,792 | ) | 4,562,942 |
| (402 | ) |
| | | | | |
| | | |
| Operating Data | | | | | | | | |
| Ore milled (tonnes) | 80,171 |
| 43,430 |
| (46 | ) | 97,907 |
| (56 | ) | 221,238 |
| 239,421 |
| (8 | ) |
| Grade (g/t Au) | 2.68 |
| 3.11 |
| 16 |
| 3.3 |
| (6 | ) | 2.98 |
| 4.11 |
| (27 | ) |
| Mill recoveries (%) | 86 |
| 91 |
| 6 |
| 94 |
| (3 | ) | 89 |
| 94 |
| (5 | ) |
| Realized gold price | 1,301 |
| 1,209 |
| (7 | ) | 1,622 |
| (25 | ) | 1,187 |
| 1,666 |
| (29 | ) |
| Gold produced (oz) | 5,605 |
| 3,943 |
| (30 | ) | 9,717 |
| (59 | ) | 18,942 |
| 29,723 |
| (36 | ) |
Cash operating cost per ounce produced(1) | 1,506 |
| 1,452 |
| (4 | ) | 911 |
| 59 |
| 1,273 |
| 822 |
| 55 |
|
| Ounces sold (oz) | 5,667 |
| 4,020 |
| (29 | ) | 8,550 |
| (53 | ) | 22,685 |
| 26,003 |
| (13 | ) |
Cash operating cost per ounce sold(2) | 1,723 |
| 1,404 |
| (19 | ) | 748 |
| 88 |
| 1,197 |
| 776 |
| 54 |
|
Total all-in sustaining costs per ounce sold(3) | 2,208 |
| 2,085 |
| (6 | ) | 1,448 |
| 44 |
| 1,872 |
| 1,357 |
| 38 |
|
| | | | | | | | | |
| Cost of sales (IFRS) | 9,763,795 |
| 5,643,429 |
| (42 | ) | 6,392,812 |
| (12 | ) | 27,146,801 |
| 20,167,300 |
| 35 |
|
| Inventory adjustment | (1,321,414 | ) | 81,674 |
| n/a |
| 2,458,099 |
| n/a |
| (3,035,465 | ) | 4,265,206 |
| n/a |
|
| Total costs of ore produced | 8,442,381 |
| 5,725,103 |
| (32 | ) | 8,850,911 |
| (35 | ) | 24,111,336 |
| 24,432,506 |
| (1 | ) |
| | | | | | | | | |
| Costs per Tonne of Ore | | | | | | | | |
| Mining | 38.90 |
| 53.16 |
| 37 |
| 40.02 |
| 33 |
| 41.30 |
| 41.90 |
| (1 | ) |
| Processing | 43.77 |
| 49.31 |
| 13 |
| 32.83 |
| 50 |
| 43.22 |
| 36.23 |
| 19 |
|
| Mine Overheads | 19.08 |
| 21.10 |
| 11 |
| 16.11 |
| 31 |
| 17.54 |
| 19.24 |
| (9 | ) |
| Total cost per tonne of ore | 101.75 |
| 123.57 |
| 21 |
| 88.96 |
| 39 |
| 102.06 |
| 97.37 |
| 5 |
|
| |
1. | Operating cash cost per ounce sold includes mine site operating costs including mining, processing and refining, and inventory adjustments, but is exclusive of royalties, environmental fees, amortization and exploration costs. Refer to the Non-IFRS Measures section of the Company's MD&A. |
| |
2. | Operating cash cost per ounce produced includes mine site operating costs including mining, processing and refining, but is exclusive of inventory adjustments, royalties, environmental fees, export tax, amortization and exploration costs. Refer to the Non-IFRS Measures section of the Company's MD&A. |
| |
3. | All-in sustaining sustaining costs include all cash operating costs per ounce sold including a portion of corporate administration, sales based taxes and government fees and levies. It includes an annualized estimate of sustaining capital and exploration expenditure. It excludes corporate income tax, reclamation and remediation costs. Refer to the Non-IFRS Measures section of the Company's MD&A. |
|
| | | | |
| ($) As at | Mar 31, 2014 |
| Jun 30, 2013 |
|
| Net deferred exploration and development | — |
| 8,243,659 |
|
| Property, plant and equipment | 4,836,275 |
| 15,635,904 |
|
|
| | | | | | | | |
| | Three months ended | Nine months ended |
| ($) | Mar 31, 2014 |
| Mar 31, 2013 |
| Mar 31, 2014 |
| Mar 31, 2013 |
|
| Spending on exploration and development activities | 251,499 |
| 1,278,622 |
| 1,415,467 |
| 3,466,547 |
|
| Expenditure on property, plant and equipment | — |
| 319,369 |
| 1,743,224 |
| 607,276 |
|
Production and Operating Statistical Results
Phuoc Son Process Plant
Vein continuity and grade distribution are fluctuating significantly at Levels 4 and 5. This is dictating a mining method change to more manual labor intensive methods and production is suffering as a result. As well, the deferment of capital development for the past 9 months
Management's Discussion & Analysis
Quarter ended March 31, 2014
has reduced open stopes to those with a lower than planned grade. In January we commenced limited back filling again for pillar recovery and this has resulted in improving performance from the mine in March 2014.
A hiring and training & development program for local drillers and miners is underway as well. The mine maintenance contractor has been replaced with our own national employees and approximately 85% of the expatriate work force has been laid off as a part of a larger cost cutting strategy.
Management has assessed indicators of impairment related to the Phuoc Son project and its associated assets and used a discounted cash flow model to calculate the value in use. The impairment charge in the amount of $15.4m and $1.7m was recognized during the quarters ended December 31, 2013 and March 31, 2014, respectively, on assets associated with the Bai Dat and Bai Go projects at Phuoc Son. The assessment of an exact terminal value of property, plant and equipment amount related to Phuoc Son assets will be finalised during the next quarter ending June 30, 2014 and an adjustment to the above impairment charge if material will be recorded.
During the quarter ended March 31, 2014 the plant milled 43,430 tonnes at 3.11 g/t Au, with 91 percent recovery (three months ended March 31, 2013 - 97,907 tonnes at 3.30 g/t Au, with 94 percent recovery). The 59% decrease in gold production compared to the same quarter last year was mainly due to the 56% decrease in milled tonnes, 6% decrease in grade and 3% decrease of mill recovery. The milled tonnes in this reporting quarter were affected by the reduction in open stopes and a two-week plant shutdown over the Tet holiday period in early February 2014. The year to date 36% decrease in gold production compared to the same period last year was mainly due to the 27% decrease in feed grade attributed to grade achieved from the Bai Go mine being lower than anticipated, as well as 8% decrease in tonnes milled and 5% decrease of mill recovery.
During the quarter ended March 31, 2014 costs per tonne mined and milled have increased to $123.57 compared with $101.75 in the quarter ended December 31, 2013 and $88.96 in the same comparative period ended March 31, 2013. Mining cost per tonne was $53.16 in the third quarter of 2014, a 33% increase from $40.02 in the same quarter last year, as a result of reduced tonnes mined, and the increase in cost of explosives utilising in mining already imported and more expensive powergel instead of Anfo. Processing costs per tonne of ore were $49.31 in the third quarter of 2014, a 50% increase compared to the same quarter last year. A large portion of processing costs are fixed costs regardless of the plant not producing at its full capacity. The increase in processing costs per tonne of ore this quarter was a result of lower tonnages carrying the same fixed processing cost. Overhead costs per tonne of ore in the third quarter ended March 31, 2014 increased 11% and 31% relative to last quarter and the same comparable quarter last year, respectively, as a result of larger portion of shared service costs are allocated to Phuoc Son due to temporary closure of Bong Mieu, and due to lower tonnages applied to a largely fixed overhead costs.
During the nine months ended March 31, 2014 costs per tonne mined and milled have been increased to $102.06 compared with $97.37 in the same period ended March 31, 2013. Mining cost per tonne reduced by 1% as a result of decrease in fuel consumed and more efficient maintenance of the underground fleet. Processing costs per tonne of ore increased by 19% attributable to high costs for equipment parts and steel balls. These increases were principally due to the import restrictions from the first quarter which necessitated sourcing of inferior quality materials locally at a higher overall cost. Overhead costs per tonne of ore in the nine months ended March 31, 2014 decreased by 9% relative to the same comparable period last year as a result of significant cost savings achieved on transportation, catering and housekeeping in the reporting period.
Work continued on renegotiating all supply contracts.
Exploration Report
Phuoc Son Gold Project
Bai Dat
No current exploration.
Dak Sa Peripheral
No current exploration.
Outlook to June 30, 2014
| |
| • | Increase tonnage to planned levels |
| |
| • | Develop Bai Dat to Level 7 |
| |
| • | Construction to increase capacity of Dam 2A and 2B |
Management's Discussion & Analysis
Quarter ended March 31, 2014
| |
| • | Commence application for new tailings dam in Phuoc Son |
| |
| • | Continue cost reduction plans |
| |
| • | Obtain exploration licenses for the Dak Sa and peripheral prospect areas |
| |
| • | Continue knowledge transfer from expatriate to local staff through training and development |
BONG MIEU GOLD PROJECT
Results of Operations and Exploration Update
|
| | | | | | | | | | | | |
| | 3 months | 3 months | Nine months ended | Diff |
|
| Dec 31, 2013 | Mar 31, 2014 | Mar 31, 2013 | Mar 31, 2014 | Mar 31, 2013 | (%) |
|
| Financial Data ($) | | | | | | |
| Gold sales | 6,418,388 |
| — |
| 5,942,750 |
| 11,942,960 |
| 17,209,154 |
| (31 | ) |
| Cost of sales | 6,198,257 |
| — |
| 4,354,885 |
| 9,832,774 |
| 10,218,687 |
| (4 | ) |
| Royalties | 157,308 |
| — |
| 167,847 |
| 310,537 |
| 528,758 |
| (41 | ) |
| Environment fees | 203,140 |
| — |
| 294,652 |
| 512,310 |
| 861,735 |
| (41 | ) |
| Depreciation and amortization | 385,659 |
| — |
| 1,626,073 |
| 874,909 |
| 4,462,109 |
| (80 | ) |
| Earnings from mine operations | (525,976 | ) | — |
| (500,707 | ) | 412,430 |
| 1,137,865 |
| (64 | ) |
| | | | | | | |
| Operating Data | | | | | | |
| Ore milled (tonnes) | 22,626 |
| — |
| 53,483 |
| 81,576 |
| 128,415 |
| (36 | ) |
| Grade (g/t Au) | 3.07 |
| n/a |
| 2.58 |
| 3.03 |
| 3.36 |
| (10 | ) |
| Mill recoveries (%) | 87 |
| — |
| 87 |
| 88 |
| 86 |
| 2 |
|
| Realized gold price | 1,214 |
| n/a |
| 1,628 |
| 1,508 |
| 1,656 |
| 10 |
|
| Gold produced (oz) | 1,945 |
| — |
| 3,872 |
| 6,976 |
| 11,983 |
| (42 | ) |
Cash operating cost per ounce produced(1) | 1,410 |
| n/a |
| 1,085 |
| 978 |
| 989 |
| (1 | ) |
| Ounces sold (oz) | 5,286 |
| — |
| 3,650 |
| 7,919 |
| 10,392 |
| (24 | ) |
Cash operating cost per ounce sold(2) | 1,173 |
| n/a |
| 1,193 |
| 1,242 |
| 983 |
| 26 |
|
Total all-in sustaining costs per ounce sold(3) | 1,788 |
| n/a |
| 1,481 |
| 1,360 |
| 1,382 |
| (2 | ) |
| | | | | | | |
| Cost of sales (IFRS) | 6,198,257 |
| — |
| 4,354,885 |
| 9,832,774 |
| 10,218,687 |
| (4 | ) |
| Inventory adjustment | (3,455,999 | ) | — |
| (152,647 | ) | (3,008,051 | ) | 1,636,509 |
| n/a |
|
| Total cost of ore produced | 2,742,258 |
| — |
| 4,202,238 |
| 6,824,723 |
| 11,855,196 |
| (42 | ) |
| | | | | | | |
| Costs per Tonne of Ore | | | | | | |
| Mining | 57.20 |
| n/a |
| 54.66 |
| 46.59 |
| 55.78 |
| (16 | ) |
| Processing | 33.66 |
| n/a |
| 22.86 |
| 24.10 |
| 24.76 |
| (3 | ) |
| Mine Overheads | 36.85 |
| n/a |
| 24.69 |
| 24.16 |
| 28.58 |
| (15 | ) |
| Total cost per tonne of ore | 127.71 |
| — |
| 102.21 |
| 94.85 |
| 109.12 |
| (13 | ) |
| |
1. | Operating cash cost per ounce sold includes mine site operating costs including mining, processing and refining, and inventory adjustments, but is exclusive of royalties, environmental fees, amortization and exploration costs. Refer to the Non-IFRS Measures section of the Company's MD&A. |
| |
2. | Operating cash cost per ounce produced includes mine site operating costs including mining, processing and refining, but is exclusive of inventory adjustments, royalties, environmental fees, export tax, amortization and exploration costs. Refer to the Non-IFRS Measures section of the Company's MD&A. |
| |
3. | All-in sustaining sustaining costs include all cash operating costs per ounce sold including a portion of corporate administration, sales based taxes and government fees and levies. It includes an annualized estimate of sustaining capital and exploration expenditure. It excludes corporate income tax, reclamation and remediation costs. Refer to the Non-IFRS Measures section of the Company's MD&A. |
|
| | | | |
| ($) As at | Mar 31, 2014 |
| Jun 30, 2013 |
|
| Net deferred exploration and development | 3,682,143 |
| 5,248,718 |
|
| Property, plant and equipment | 654,289 |
| 406,499 |
|
Management's Discussion & Analysis
Quarter ended March 31, 2014
|
| | | | | | | | |
| | Three months ended | Nine months ended |
| ($) | Mar 31, 2014 |
| Mar 31, 2013 |
| Mar 31, 2014 |
| Mar 31, 2013 |
|
| Spending on exploration and development activities | — |
| 175,316 |
| 391,263 |
| 882,935 |
|
| Expenditure on property, plant and equipment | — |
| 294,531 |
| 123,059 |
| 961,644 |
|
Production and Operating Statistical Results
Bong Mieu Process Plant
Bong Mieu is currently under care and maintenance, and rehabilitation, following shut-down of operations due to typhoon related damage. Dewatering of the flooded mine began in March immediately after the road repairs were finished. To date approximately 75% of the volume and 50% of the height of the flood has been pumped out. Mining of Level 21 is to commence in early May.
Management has assessed indicators of impairment related to the Bong Mieu project and its associated assets and used a discounted cash flow model to calculate the value in use. A preliminary impairment charge in the amount of $1.1 m and $0.6m was recognized during the quarter ended December 31, 2013 and March 31, 2014, respectively, on assets associated with the Nui Kem project at Bong Mieu. The assessment of an exact terminal value amount related to Bong Mieu assets will be finalised during the next quarter ending June 30, 2014 and an adjustment to the above impairment charge if material will be recorded.
During the nine month period ended March 31, 2014 the Company has been mining an area based on historical information, over which a 43-101 reserve has never been established.
Exploration Report
Nui Kem
No current exploration.
Bong Mieu
No current exploration.
Outlook to June 30, 2014
| |
| • | Finalise dewatering to resume operations at Nui Kem. |
| |
| • | Finalise documentation on strategic alliance with a Vietnamese contract mining company. |
| |
| • | Continue to explore and develop the Nui Kem upper vein at Level 23. |
| |
| • | Continue operations cost reduction plans. |
| |
| • | Continue knowledge transfer from expatriate staff to local staff through training and development. |
BAU GOLD PROJECT
Exploration Update
|
| | | | |
| ($) As at | Mar 31, 2014 |
| Jun 30, 2013 |
|
| Net deferred exploration and development | 15,925,047 |
| 14,618,741 |
|
| Property, plant and equipment | 201,936 |
| 120,916 |
|
|
| | | | | | | | |
| | Three months ended | Nine months ended |
| ($) | Mar 31, 2014 |
| Mar 31, 2013 |
| Mar 31, 2014 |
| Mar 31, 2013 |
|
| Spending on exploration and development activities | 212,242 |
| 846,510 |
| 1,189,680 |
| 2,949,137 |
|
| Expenditure on property, plant and equipment | — |
| 11,099 |
| 134,724 |
| 37,874 |
|
Jugan Sector
Exploration during the quarter included geochemical soil survey follow-up, IP Survey follow-up and geological modeling.
Management's Discussion & Analysis
Quarter ended March 31, 2014
Other Bau Sectors
Exploration during the quarter included 3D modeling and interpretation of regional fault structures, development and expansion of 3D surface geology model, Jugan West geology modeling, tailings deposits modeling and resource determination in areas surrounding Jugan, plus continued update of the GDMS with recent and historical exploration data. Work also included an analysis of the antimony (Sb) potential in Bau.
Bau Tenure
Applications for four separate Mining Certificates have been submitted to the relevant authorities in order to maintain tenure over ground within three separate areas (that are currently covered by one existing Pejiru Mining Certificate, which will expire during CY2014), plus one adjacent area (that was previously a General Prospecting License application renewal).
Serian Project
A general site visit was undertaken at a number of sites.
Rawan Project
A general site visit was undertaken at a number of sites.
Outlook to June 30, 2014
| |
| • | Complete financing options for development of Bau |
| |
| • | Prioritise and plan drill programs for drill targets following IP survey and soil sampling program |
| |
| • | Further detailed design work on a number of project development aspects |
| |
| • | Company is seeking farm-out partners to advance certain projects |
Summary of Quarterly Results
The following table sets forth selected unaudited quarterly results for the past eight quarters.
|
| | | | | | | | | | | | | | | | |
| | Q3 FY2014 |
| Q2 FY2014 |
| Q1 FY2014 |
| Q4 FY2013 |
| Q3 FY2013 |
| Q2 FY2013 |
| Q1 FY2013 |
| Q2 2012 |
|
| Gold production (oz) | 3,943 |
| 7,550 |
| 14,425 |
| 18,482 |
| 13,589 |
| 16,204 |
| 11,912 |
| 7,839 |
|
| Gold sales (oz) | 4,020 |
| 10,953 |
| 15,631 |
| 15,800 |
| 12,200 |
| 12,570 |
| 11,625 |
| 4,211 |
|
| Gold sales | 4,860,507 |
| 13,791,902 |
| 20,216,909 |
| 22,244,500 |
| 19,812,500 |
| 21,546,213 |
| 19,169,500 |
| 6,725,015 |
|
| Net loss | (8,542,046 | ) | (30,744,507 | ) | (8,071,681 | ) | (16,475,831 | ) | (560,641 | ) | (4,600,605 | ) | (3,665,952 | ) | (14,502,571 | ) |
| Loss per share-basic | (0.019 | ) | (0.069 | ) | (0.020 | ) | (0.037 | ) | (0.002 | ) | (0.012 | ) | (0.01 | ) | (0.029 | ) |
| Loss per share-diluted | (0.019 | ) | (0.069 | ) | (0.020 | ) | (0.037 | ) | (0.002 | ) | (0.012 | ) | (0.01 | ) | (0.029 | ) |
Quarterly sales are predominantly influenced by the number of ounces of gold sold and by the realized price per ounce.
During the quarter ended March 31, 2014, the Company produced 3,943 ounces of gold and sold 4,020 ounces of gold, the difference being decreased holding of gold inventory at the end of March 31, 2014.
During the quarter ended March 31, 2014, the average realised gold price decreased by 26% to $1,209 from $1,624 in the same quarter last year.
The loss in the quarter ended March 31, 2014 is a result of continued lower than expected production at Phuoc Son and the temporary suspension of operations at Bong Mieu.
Management's Discussion & Analysis
Quarter ended March 31, 2014
Earnings Summary
|
| | | | | | | | | | |
| | 3 months | Diff | Nine months ended | Diff |
| ($) | Mar 31, 2014 |
| Mar 31, 2013 |
| (%) | Mar 31, 2014 |
| Mar 31, 2013 |
| (%) |
| Sales | 4,860,507 |
| 19,812,500 |
| (75) | 38,869,318 |
| 60,528,213 |
| (36) |
| | | | | | | |
| Costs of sales | 5,643,429 |
| 10,747,697 |
| (47) | 36,979,575 |
| 30,385,987 |
| 22 |
| Royalty expense | 734,343 |
| 1,950,429 |
| (62) | 4,886,542 |
| 6,945,182 |
| (30) |
| Environmental fees | 373,147 |
| 1,161,028 |
| (68) | 2,541,473 |
| 2,897,552 |
| (12) |
| Corporate and administrative expenses | 716,799 |
| 1,866,729 |
| (62) | 3,208,860 |
| 5,300,082 |
| (39) |
| Share-based compensation | 89,266 |
| 468,578 |
| (81) | 425,462 |
| 1,734,118 |
| (75) |
| Exploration costs | (12,454 | ) | 189,503 |
| (107) | 301,021 |
| 818,370 |
| (63) |
| Depreciation and amortization | 1,020,335 |
| 4,162,299 |
| (75) | 8,032,346 |
| 14,487,628 |
| (45) |
| Care and maintenance costs | 593,132 |
| — |
| n/a | 871,915 |
| — |
| n/a |
| Impairment charges | 2,264,145 |
| — |
| n/a | 21,486,198 |
| — |
| n/a |
| Finance charges | 2,319,697 |
| (410,857 | ) | (665) | 7,295,211 |
| 5,657,314 |
| 29 |
| | 13,741,839 |
| 20,135,406 |
| (32) | 86,028,603 |
| 68,226,233 |
| 26 |
| |
|
|
|
| |
|
|
|
| |
| Loss for the period before income tax | (8,881,332 | ) | (322,906 | ) | 2,650 | (47,159,285 | ) | (7,698,020 | ) | 513 |
| Income tax expense | (339,286 | ) | 237,735 |
| (243) | 198,948 |
| 1,129,179 |
| (82) |
| Total comprehensive loss for the period | (8,542,046 | ) | (560,641 | ) | 1,424 | (47,358,233 | ) | (8,827,199 | ) | 437 |
Sales
During the quarter ended March 31, 2014 gold sales decreased to $4,860,507 from $19,812,500 in the same period of 2013 based on a 67% decrease in ounces sold and a 26% decrease in realized gold price per ounce. Gold production decreased to 3,943 ounces from 13,589 ounces in the same period of 2013 due to the decrease in milled tonnes by Phuoc Son which were affected by a reduction in open stopes, a two-week plant shutdown over the Tet holiday period in early February, and absence of production at the Bong Mieu plant during the reporting quarter. Bong Mieu operations were suspended on November 16, 2013 as a result of typhoon damage and have not yet recommenced. Sale price was affected by lower realised gold prices compared to the same period last year and more local in-country sales in Vietnam which are subject to 10% VAT as a result of export license restrictions.
During the nine months ended ended March 31, 2014 gold sales decreased to $38,869,318 from $60,528,213 in the same period of 2013 based on a 24% decrease in realized price per ounce and a 16% decrease in ounces sold. Gold production decreased by 38% compared to the same period in 2013 due to the decrease in feed grade from 3.87 g/t to 2.99g/t.
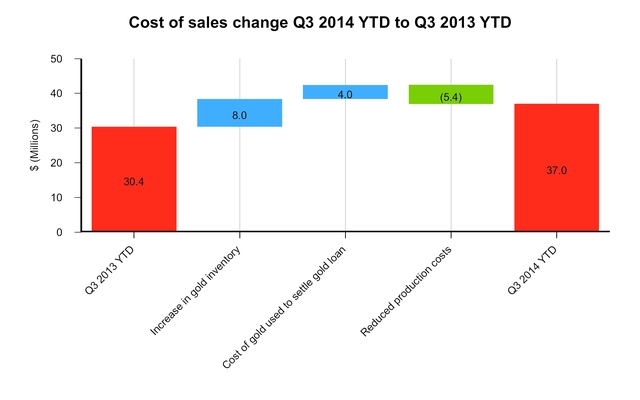
Cost of sales
Cost of sales consists of production costs adjusted for a change in inventory balances, cost of gold used to settle gold loan and export taxes.
|
| | | | | | | | | | |
| Three months ended |
| Nine months ended |
|
| $ | Mar 31, 2014 |
| Mar 31, 2013 |
| Diff | Mar 31, 2014 |
| Mar 31, 2013 |
| Diff |
| Costs of sales (IFRS) | 5,643,429 |
| 10,747,697 |
| (47) | 36,979,575 |
| 30,385,987 |
| 22 |
| Inventory adjustment | 81,674 |
| 2,305,452 |
| (96) | (6,043,516 | ) | 5,901,715 |
| (202) |
| Total production costs | 5,725,103 |
| 13,053,149 |
| (56) | 30,936,059 |
| 36,287,702 |
| (15) |
|
|
|
|
|
|
|
|
|
|
|
| Inventory adjustment |
|
|
|
|
|
|
|
|
|
|
| Inventory adjustment due to change in gold inventory (net of depreciation, royalties, export tax and environmental fees) | 81,674 |
| 2,305,452 |
| (96) | (6,043,516 | ) | 1,933,981 |
| n/a |
| Cost of gold used to settle gold loan | — |
| — |
| n/a | — |
| 3,967,734 |
| n/a |
| Total Inventory Adjustment | 81,674 |
| 2,305,452 |
| (96) | (6,043,516 | ) | 5,901,715 |
| (202) |
During the quarter ended March 31, 2014 cost of sales decreased to $5,643,429 from $10,747,697 in the comparative period ended March 31, 2013, based on a 67% decrease in ounces sold offset by a 59% increase in operating cost per ounce sold. Operating cash costs per ounce produced for the quarter ended March 31, 2014 were $1,452 compared to $961 for the same period in 2013 mainly due to lower gold production resulting in higher unit cost. The production issues at Phuoc Son and a temporary closure of Nui Kem resulted in this quarter's all-in sustaining costs per gold ounce sold of $2,085 which is above our previous guidance of $1,150 to $1,200 for the full year of 2014. This has significantly affected production costs and as a result cost of sales.
Management's Discussion & Analysis
Quarter ended March 31, 2014
During the nine months ended ended March 31, 2014 cost of sales increased by 22% to $36,979,575 from $30,385,987 in the same period ended March 31, 2013, The below chart illustrates the key drivers affecting the movement in the cost of sales:
During the nine months ended March 31, 2014 production costs decreased by $5,351,643 to $30,936,059 from $36,287,702 in the same period last year due to a series of restructures implemented in Q1 and Q3 of FY2014 which resulted in operational efficiencies and significant savings in mining and overhead costs.The negative variance is explained by the movement in gold inventory balances resulting in a $7,977,494 increase in cost of sale during the nine months ended March 31, 2014 compared to the same period last year. The settlement of the gold loan in November 2012 also resulted in the reduction of cost of sales in the comparative period ended March 31, 2013 by $3,967,734.
During the nine months ended ended March 31, 2014 cost of sales increased due to a 37% increase in operating cash costs per ounce produced offset by a 16% decrease in ounces sold compared to the same period last year. During the nine months ended ended March 31, 2014 the group's operating cash costs per ounce produced increased to $1,194 from $870 in the same comparable period last year. This has significantly affected cost of sales.
Royalty Expenses
The Phuoc Son and Bong Mieu companies are taxed with 15% and 3% royalty rates, respectively, calculated based on gross sales. The rates have been established by the Vietnamese government. During the three and nine-month periods ended March 31, 2014 royalty expenses decreased to $734,343 and $4,886,542 from $1,950,429 and $6,945,182 in the same comparative periods ended March 31, 2013 due to a decrease in gold sales. We have made application for royalty and tax deferrals pursuant to typhoon disaster relief legislation.
Environmental Fees
Environmental fees are established by the Ministry of Natural Resources of Vietnam and are based on tonnes of ore mined during the month. The current rate is VND 180,000 per tonne. During the quarter ended March 31, 2014 environmental fees decreased to $373,147 from $1,161,028 in the comparative period ended March 31, 2013 due to the decrease in volume of ore mined to 43,430 tonnes from 151,390 tonnes in the same period last year. During the nine months ended March 31, 2014 environmental fees decreased to $2,541,473 from $2,897,552 in the comparative period ended March 31, 2013 due to the decrease in volume of ore mined to 302,814 tonnes from 367,836 tonnes in the same period last year. The Company is negotiating to apply a revised method of calculation which would result in a lower environmental fee.
Management's Discussion & Analysis
Quarter ended March 31, 2014
Care and Maintenance Costs
During the shutdown of the Bong Mieu plant the Company had to maintain a minimum level of operations and incur certain unavoidable costs such as security, force majeure labor and utility costs. During the quarter ended March 31, 2014 such operating and maintenance costs amounted to $593,132.
Depreciation and Amortization
During the three and nine-month periods ended March 31, 2014 depreciation and amortization expense decreased to $1,020,335 and $8,032,346 from $4,162,299 and $14,487,628 in the same comparative periods ended March 31, 2013 mainly due to the decrease in production to 3,943 oz and 25,918 oz from 13,589 oz and 41,706 oz, respectively, and impairment charges incurred in FY2013, the quarter ended December 31, 2013 and March 31, 2014 for Phuoc Son and Bong Mieu projects that reduced the value of property plant and equipment, deferred development and exploration costs and consequently the depreciation and amortization charge going forward.
Impairment Charges
The impairment charge incurred during the quarter ended March 31, 2014 related to the following projects:
|
| | | | | | | | | | |
| | Phuoc Son |
| Bong Mieu |
| Binh Dinh
NZ Gold |
| GR Enmore |
| TOTAL |
|
| Property plant and equipment | 9,929,312 |
| 576,563 |
| 9,488 |
| — |
| 10,515,363 |
|
| Deferred exploration expenditure | 1,870,396 |
| — |
| 780,777 |
| — |
| 2,651,173 |
|
| Deferred development expenditure | 2,425,792 |
| 535,708 |
| — |
| — |
| 2,961,500 |
|
| Mine properties | 1,163,322 |
| 47,362 |
| 1,333,333 |
| 550,000 |
| 3,094,017 |
|
| Total impairment recognised in Q2 ended Dec 31, 2013 | 15,388,822 |
| 1,159,633 |
| 2,123,598 |
| 550,000 |
| 19,222,053 |
|
| Deferred development expenditure | 1,146,612 |
| 589,661 |
| — |
| — |
| 1,736,273 |
|
| Mine properties | 527,872 |
| — |
| — |
| — |
| 527,872 |
|
| Total impairment recognised in Q3 ended Mar 31, 2014 | 1,674,484 |
| 589,661 |
| — |
| — |
| 2,264,145 |
|
| Total impairment charges YTD | 17,063,306 |
| 1,749,294 |
| 2,123,598 |
| 550,000 |
| 21,486,198 |
|
Management has assessed indicators of impairment related to the Company's mine projects and its associated assets and used a discounted cash flow model to calculate the value in use. The assessment of an exact terminal value with regard to property, plant and equipment related to Phuoc Son and Bong Mieu assets will be finalised during the next quarter ending June 30, 2014 and an adjustment to the above impairment charges where material will be recorded.
Corporate and Administrative Expenses
During the three and nine-month periods ended March 31, 2014 corporate and administrative expenses decreased to $716,799 and $3,208,860 from $1,866,729 and $5,300,082, respectively, in the comparative period ended March 31, 2013 mainly due to the reduction in number of officers, restructuring of remaining officers' remuneration packages, reduction in use of external contractors, and reduction in travel and related costs.
Share-based Compensation Expense
Share-based payment expense recognized for stock options that vested during the three and nine-month periods ended March 31, 2014 amounted to $89,266 and $425,462 (three and nine-month periods ended March 31, 2013 - $468,578 and $1,734,118). No new options were issued during the nine months ended March 31, 2014 and the decreased share-based payment expense mainly relates to fewer options vesting during the reporting periods compared to the same periods last year.
Exploration Costs
During the three and nine-month periods ended March 31, 2014, exploration costs were $12,454 (credit) and $301,021 compared with $189,503 and $818,370 in the same comparative periods ended March 31, 2013. The credit of $12,454 relates to a change in provision estimate of exploration consulting costs related to KMC subsidiary. Furthermore, the Company had to cut most of its exploration programs until funding is arranged.
Management's Discussion & Analysis
Quarter ended March 31, 2014
Finance Expenses
|
| | | | | | | | |
| | Three months ended | Nine months ended |
| ($) | Mar 31, 2014 |
| Mar 31, 2013 |
| Mar 31, 2014 |
| Mar 31, 2013 |
|
| Interest on convertible notes and gold-linked loans | 921,941 |
| 955,633 |
| 2,711,602 |
| 3,032,563 |
|
| Accretion on convertible notes and gold- linked notes | 1,535,223 |
| 1,389,739 |
| 4,467,909 |
| 4,302,857 |
|
| Interest expense (income), net | 576,453 |
| 357,228 |
| 1,455,865 |
| 847,086 |
|
| Derivative - fair value revaluations | (53,000 | ) | (2,694,750 | ) | (110,850 | ) | (7,573,815 | ) |
| Foreign exchange (gain) loss, net | (691,382 | ) | (418,707 | ) | (1,367,813 | ) | (203,949 | ) |
| Financing costs | 30,462 |
| — |
| 138,498 |
| 4,051,065 |
|
| Gain on gold loan principal repayment | — |
| — |
| — |
| 1,201,507 |
|
| Total | 2,319,697 |
| (410,857 | ) | 7,295,211 |
| 5,657,314 |
|
During the three and nine-month periods ended March 31, 2014, interest on the convertible notes and gold-linked notes decreased compared to same periods ended March 31, 2013 due to interest related to gold loan fully repaid in May 2013 which was offset by the default interest accrued from the beginning of December 2013, triggered when the company went in arrears on its interest obligations. The accretion expense has increased mainly due to an effective interest method of accounting for notes where more accretion costs are allocated closer to the end of the note period due in May 2015. The interest expense amounted to $576,453 and $1,455,865 during the three and nine-month periods ended March 31, 2014 compared with $357,228 and $847,086 during the same comparative periods last year due to penalties incurred on unpaid tax and government fees in Vietnam and a higher interest rate charged on the Phuoc Son secured borrowings.
During the three and nine-month periods ended March 31, 2014, derivatives revaluation gain amounted to $53,000 and $110,850 compared with $2,694,750 and $7,573,815 in the same comparative periods last year. The credit related to the convertible notes derivatives was mainly due to a decrease in value of the conversion options on the notes that are linked to Besra’s stock. This was offset but the gold-linked notes all had an increase due to the increase in the gold price. During the quarter ended March 31, 2013, derivative revaluation gains amounted to $2,694,750. $2,192,209 of revaluation gain for the three month period ended March 31, 2013 relates to revaluation of Company's vested warrants and conversion features of convertible notes outstanding at balance date. The change in estimated future gold prices during the three and nine-month periods ended March 31, 2013 explains the rest of the revaluation gain in the respective periods.
During the three and nine-month periods ended March 31, 2014 foreign exchange unrealised gain amounted to $691,382 and $1,367,813, respectively (three and nine-month periods ended March 31, 2013: $418,707 and $203,949 gain, respectively). Foreign exchange fluctuations are the result of a CAD-USD exchange rate change, weaker CAD and the impact on Company's CAD denominated convertible notes and gold-linked notes revalued to USD during the reporting periods.
Management's Discussion & Analysis
Quarter ended March 31, 2014
Liquidity, Capital Resources and Material Uncertainty as to Going Concern
During the three and nine-month periods ended March 31, 2014, the Group incurred a net loss of $8,542,046 and $47,358,233, respectively. As at March 31, 2014 the Group's current liabilities exceeded its current assets by $43,312,194 and contractual commitments amounted to $14,569,361. As a result, there is a substantial doubt regarding the ability of the Company to continue as a going concern. The ability of the Company to continue as a going concern depends upon its ability to resume profitable operations and to access public debt or equity capital in the ordinary course. No assurance can be given that such capital will be available at all or on terms acceptable to the Company.
These Interim Financial Statements were prepared on a going concern basis, under the historical cost basis, which assumes the Company will continue its operations for the foreseeable future and will be able to realize its assets and discharge its liabilities and commitments in the ordinary course of business. In assessing whether the going concern assumption is appropriate, management takes into account all available information about the future, which is at least, but not limited to, twelve months from the end of the reporting period. A going concern basis was assessed using a cashflow forecast for the next 12 months from the date of these financial statements. The forecast includes the following key assumptions and strategies:
| |
| • | Renegotiate the agreement with the 9% CAD convertible note holders where the company is in default for payment of principal of CAD$6.3m which was due in March 2014 and the related interest which was due in November 2013 and on maturity in March 2014 in order to extend the settlement date of the notes. |
| |
| • | Renegotiate the agreement with other convertible note and gold-linked loan holders where the company is in default for payment of interest which was due in November 2013. |
| |
| • | Restoring production from Vietnam to above 45,000 oz per annum. |
| |
| • | The Group being able to successfully negotiate a deferment of royalty and tax payments due to the Vietnam tax department. |
| |
| • | Receiving settlement of the proceeds from the Vietnam business interruption insurance claim related to the November typhoons. |
| |
| • | Receiving confirmation of a revised basis of calculating environment fees in Vietnam. |
| |
| • | The renewal of the existing overdraft facilities with Vietcom Bank and Vietabank in Vietnam. |
| |
| • | Realizing a gold sale price above US$1,200 per ounce. |
| |
| • | The need to secure sufficient funds either through debt, equity or asset sales in order to maintain sufficient levels of working capital and to meet its obligations to creditors. |
The company is actively pursuing a range of financing and refinancing options. If the fund raising is not completed during June 2014 Besra’s board may reevaluate continuing operations. No allowance for such circumstances has been made in these Interim Financial Statements.
As at March 31, 2014, the cash and cash equivalents' balance decreased to $485,738 from $4,062,045 at June 30, 2013.
After balance date the Company received a notice to cure from Euro Pacific Capital Inc (“ Euro Pacific” ) on behalf of holders of its 9% unsecured convertible redeemable notes due 26 March 2014 (the “ Notes” ). Pursuant to the notice to cure, Euro Pacific has noted the Company in default for failure to pay the principal of CAD6,356,499 ($5,746,275 at March 31, 2014) plus outstanding interest of CAD476,716 ($430,951 at March 31, 2014) due on the Notes and has given 30 days for the Company to cure the default. The cure period as set out in the notice to cure Euro Pacific delivered to the Company expired on 7 May 2014 and the Company was unable to cure the default. The Company has not received notice of any legal action nor is not aware of any pending legal action in this respect..
Interest payments with regard Convertible notes and Gold-linked notes of $1,577,132 due in November 2013 and March 2014 are currently in default for payment. During the quarter ended March 31, 2014 the default interest on unpaid interest amounted to $64,952 and unpaid principal related to 9% CAD Convertible notes - $11,021.
Besra is currently in discussions with the Investor Representative, Euro Pacific, over potential restructuring of the notes. If the note holders do not agree to a restructuring or extension, the Directors may consider pursuing a formal restructuring under statutory protection from creditors.
The Company is obligated to pay interest on its debt facilities twice per year at the end of May and November which causes fluctuations in cash needs beyond the ordinary operating cash flow requirements. If funding is not raised by the end of May the interest payment related to gold-linked notes and convertible notes due in May 31, 2014 will be in default.
Management's Discussion & Analysis
Quarter ended March 31, 2014
The liquidity constraints have affected the Company's ability to operate, and have resulted in payments to suppliers and other creditor payments being delayed. As a result it may be difficult to source supplies.
Besra has financed its operations to date primarily from sale of gold and through the raising of short term debt. The Company will depend on outside capital to complete the exploration and development of the resource properties. There can be no assurance that capital will be available as necessary to meet these continuing exploration and development costs or, if the capital is available, that it will be on terms acceptable to the Company.
The issuance of additional equity securities by the Company may result in a significant dilution in the equity interests of its current shareholders. If the Company is unable to obtain financing in the amounts and on terms deemed acceptable, the business and future success may be adversely affected.
The table below summarizes the maturity profile of the Group’s financial liabilities based on contractual undiscounted payments and including estimated interest as at March 31, 2014:
|
| | | | | | | | | | | | |
| | Carrying |
| Group's undiscounted financial liabilities due in |
| ($) | Amount |
| Total |
| Overdue |
| 1-3 months |
| 4-12 months |
| 1-2 years |
|
| 9% CAD Convertible Notes | 6,200,264 |
| 6,200,264 |
| 6,200,264 |
| — |
| — |
| — |
|
| Other Convertible notes | 12,282,656 |
| 16,746,240 |
| 628,785 |
| 599,513 |
| 602,807 |
| 14,915,135 |
|
| Gold-linked notes | 19,480,232 |
| 23,834,796 |
| 948,347 |
| 904,403 |
| 909,373 |
| 21,072,673 |
|
| Secured bank loans | 6,395,582 |
| 6,523,494 |
| 4,750,000 |
| 1,773,494 |
| — |
| — |
|
| Short term loan | 449,031 |
| 449,031 |
| — |
| 449,031 |
| — |
| — |
|
| Trade and other payables | 34,062,209 |
| 34,062,209 |
| 8,797,536 |
| 25,264,673 |
| — |
| — |
|
| Financial derivatives | 772,000 |
| 772,000 |
| — |
| — |
| — |
| 772,000 |
|
| Total | 79,641,974 |
| 88,588,034 |
| 21,324,932 |
| 28,991,114 |
| 1,512,180 |
| 36,759,808 |
|
Working Capital
As at March 31, 2014, the working capital deficit amounted to $26,812,669.
|
| | | | |
| ($) As at | Mar 31, 2014 |
| Jun 30, 2013 |
|
| Inventories | 4,433,631 |
| 12,224,852 |
|
| Tax and other receivables | 2,009,314 |
| 1,714,355 |
|
| Prepaid expenses | 806,595 |
| 1,614,240 |
|
| Tax and trade payables | (34,062,209 | ) | (27,429,290 | ) |
| Net Working Capital | (26,812,669 | ) | (11,875,843 | ) |
Tax and trade payables at March 31, 2014 were as follows:
|
| | | | |
| ($) As at | Mar 31, 2014 |
| Jun 30, 2013 |
|
| Taxes and government fees payable | 17,197,991 |
| 12,685,228 |
|
| Trade payables | 12,624,700 |
| 10,832,636 |
|
| Accruals and other payables | 4,239,518 |
| 3,911,426 |
|
| Total | 34,062,209 |
| 27,429,290 |
|
Cash Flows
The following table summarizes the Company's consolidated cash flows and cash on hand.
|
| | | | | | | | |
| | Three months ended | Nine months ended |
| ($) 3 months ended | Mar 31, 2014 |
| Mar 31, 2013 |
| Mar 31, 2014 |
| Mar 31, 2013 |
|
| Net cash provided by operating activities | (113,348 | ) | 57,955 |
| 1,996,747 |
| 7,580,979 |
|
| Net cash used in investing activities | (463,741 | ) | (4,693,200 | ) | (5,647,417 | ) | (11,361,126 | ) |
| Net cash provided from financing activities | 119,579 |
| 3,683,850 |
| 69,561 |
| 4,137,919 |
|
| Increase (decrease) in cash and cash equivalents | (457,510 | ) | (951,395 | ) | (3,581,109 | ) | 357,772 |
|
| Net foreign exchange difference | 3,549 |
| (7,411 | ) | 4,802 |
| 9,251 |
|
| Beginning cash and cash equivalents | 939,699 |
| 4,723,557 |
| 4,062,045 |
| 3,397,728 |
|
| Ending cash and cash equivalents | 485,738 |
| 3,764,751 |
| 485,738 |
| 3,764,751 |
|
Management's Discussion & Analysis
Quarter ended March 31, 2014
Cash from Operating Activities
Cash flow provided by operating activities for the three and nine-month periods ended March 31, 2014 was outflow of US$113,348 and inflow of $1,996,747 (three and nine-month periods ended March 31, 2013: inflow of US$57,955 and $7,580,979, respectively) as a result of producing gold at costs that exceed gold revenues. The capital investments decreased to $463,741 and $5,647,417 (three and nine-month periods ended March 31, 2014: $4,693,200 and $11,361,126, respectively) as a result of liquidity issues and capital expenditure cuts implemented by the Company's management. The above cash flow variance required the Company to raise more short-term debt and use most of its cash balances.
Investing Activities
During the three and nine-month periods ended March 31, 2014, Besra invested a total of US$463,741and $2,996,410 (three and nine-month periods ended March 31, 2013: US$2,300,448 and $7,298,619) in deferred exploration and development expenses, $0 and $2,001,007 acquiring property, plant and equipment (three and nine-month periods ended March 31, 2013: $992,752 and $2,062,507), as follows:
|
| | | | | | | | |
| | Deferred Exploration & Development Expenditure | Property Plant & Equipment |
| ($) 3 months ended | Mar 31, 2014 |
| Mar 31, 2013 |
| Mar 31, 2014 |
| Mar 31, 2013 |
|
| Bong Mieu | — |
| 175,316 |
| — |
| 294,531 |
|
| Phuoc Son | 251,499 |
| 1,278,622 |
| — |
| 319,369 |
|
| Bau | 212,242 |
| 846,510 |
| — |
| 11,099 |
|
| Other | — |
| — |
| — |
| 367,753 |
|
| Total | 463,741 |
| 2,300,448 |
| — |
| 992,752 |
|
|
| | | | | | | | |
| | Deferred Exploration & Development Expenditure | Property Plant & Equipment |
| ($) 9 months ended | Mar 31, 2014 |
| Mar 31, 2013 |
| Mar 31, 2014 |
| Mar 31, 2013 |
|
| Bong Mieu | 391,263 |
| 882,935 |
| 123,059 |
| 961,644 |
|
| Phuoc Son | 1,415,467 |
| 3,466,547 |
| 1,743,224 |
| 607,276 |
|
| Bau | 1,189,680 |
| 2,949,137 |
| 134,724 |
| 37,874 |
|
| Other | — |
| — |
| — |
| 455,713 |
|
| Total | 2,996,410 |
| 7,298,619 |
| 2,001,007 |
| 2,062,507 |
|
During the three and nine-month periods ended March 31, 2014, Besra invested nil and $650,000, respectively, in increasing its interest in North Borneo Gold Sdn Bhd (three and nine-month periods ended March 31, 2013: $600,000).
Financing Activities
Short Term Loan
During the quarter ended March 31, 2014, the Company issued three-month secured promissory notes in an aggregate amount of US$444,889 to three lenders, one of whom is a director of the company. The issuance was approved by the board of directors with one director having declared his conflict of interest and having abstained from voting. 4,448,890 warrants are to be issued to the lending group to acquire common shares at an exercise price of US$0.05 expiring one year from the date of issuance, subject to all necessary regulatory and shareholders approvals, including the TSX. The loan is secured with a general security interest over the company's assets. Interest is payable at 12%. The carrying amount of the loan was $449,031 as at March 31, 2014 (nil as at June 30, 2013).
Secured Bank Loan
In December 2012, Phuoc Son Gold Company Limited entered into a loan agreement with a Vietnamese bank for a maximum borrowing of $4,750,000, to be drawn down as required. The loan term is twelve months from the date of principal drawdown to the date of repayment for each drawdown. The loan was due for repayment on February 8, 2014. In December 2013, Phuoc Son management filed an application with the bank to renew the loan. In March 2014, the application was rejected by the bank. At balance date the loan was in default and negotiations between the local management and the bank are under way. The bank has filed a lawsuit with Phuoc Son district court which is currently pending. The interest rate for the original drawdown before February 8, 2014 was 8 percent per annum. An additional 4% of an overdue interest rate was applied on the overdue principal. The carrying amount of the loan was $4,750,000 as at March 31, 2014 ($5,000,000 as at June 30, 2013). The bank loan is secured over plant and equipment of Phuoc Son Gold Mining Company with a net carrying value $4.2m (Note 9).
On June 21, 2013, Phuoc Son Gold Company Limited entered into a new loan agreement with a Vietnamese bank for a maximum borrowing of $2,000,000. The new loan term is six months from the date of principal drawdown to the date of repayment for each drawdown. The
Management's Discussion & Analysis
Quarter ended March 31, 2014
drawdown could be exercised as required until June 30, 2014. The interest rate currently is 4.5% per annum and may be adjusted upon the notification of the bank. The carrying amount of the loan was $1,645,582 as at March 31, 2014 ($1,775,051 as at June 30, 2013). As at March 31, 2014 the earliest repayment date of the drawdowns is May 14, 2014 with an amount of $124,319.77. The bank loan is secured over plant and equipment of certain assets of Phuoc Son Gold Mining Company (Note 9).
Commitments, Contingencies and Contractual Obligations
|
| | | | | | | | | | | | |
| Balance at March 31, 2014 | | | | | | |
| Payment Due ($) | Total |
| Less than one year |
| Year 2 |
| Year 3 |
| Year 4 |
| Year 5 and thereafter |
|
| Operating leases | 472,338 |
| 223,102 |
| 118,009 |
| 58,323 |
| 58,323 |
| 14,581 |
|
| Purchase obligations - supplies & services | 3,478,794 |
| 3,478,794 |
| — |
| — |
| — |
| — |
|
| Purchase obligations - capital | 331,294 |
| 331,294 |
| — |
| — |
| — |
| — |
|
| Acquisition of interest in North Borneo Gold Sdn Bhd | 7,750,000 |
| 2,750,000 |
| 4,000,000 |
| 1,000,000 |
| — |
| — |
|
| Asset retirement obligations | 2,536,935 |
| 596,248 |
| 1,085,630 |
| 724,141 |
| 130,916 |
| — |
|
| Total | 14,569,361 |
| 7,379,438 |
| 5,203,639 |
| 1,782,464 |
| 189,239 |
| 14,581 |
|
In the normal course of business, the Group is subject to various legal claims. Provisions are recorded where claims are likely and estimable.
Acquisition of Interest in NBG
In 2010 the Company entered into an agreement with Gladioli Enterprises SDN BHD, as amended on May 20, 2011 and January 20, 2012 and amended and restated on May 12, 2013, to acquire up to a 93.55% interest in North Borneo Gold Sdn Bhd (NBG) by September 2015, subject to payments to be made in several tranches of $7,750,000 in total. The tranche 4a and 4b (first part) of the total amount of $1,850,000 which were due on December 2, 2013 and March 3, 2014 have not been paid.
Contingencies
Legal Actions
At balance date Besra faced various legal proceedings and claims with respect to failure in paying suppliers. There can be no assurance that the company will be able to successfully resolve these actions. If the company is unable to raise funds to settle these claims, there exists the possibility of an adverse impact on the company's future cash flows, results of financial performance and to continue as a going concern. Where possible the company has entered into negotiations regarding settlement of these matters.
Tax Disputes
In 2013 the Company disputed tax claims by the Vietnam General Department of Customs ("GDC") against Phuoc Son Gold Company ("PSGC") and Bong Mieu Gold Mining Company ("BMGMC"), Besra’s two operating gold companies in Vietnam. The GDC had made an assessment that PSGC and BMGMC should pay a total of approximately 250 billion Vietnamese dong (approximately $12,000,000) in export duties. In April 2014, Besra received formal notification from Vietnam Ministry of Finance that the export tax assessments against Bong Mieu Gold Mining Company and Phuoc Son Gold Mining Company has been repealed.
Capcapo Gold Property
The Company entered a formal joint venture agreement on September 30, 2011 with Abra Mining & Industrial Corporation (“AMIC”), Jabel Corporation (“Jabel”), Kadabra Mining Corporation (a wholly-owned subsidiary of the Company) (“KMC”) and PhilEarth Mining Corporation (“PhilEarth”) (a Philippine company in the process of incorporation in which the Company will hold a 40% interest) in respect of the Capcapo Gold Property in the Northern Philippines.
Pursuant to the terms of the joint venture agreement, the Company, in consortium with PhilEarth, has an option to acquire up to a 60% interest in the Capcapo Gold Project, Northern Philippines, subject to compliance with Philippine foreign ownership laws. The Company paid to AMIC $300,000 upon the signing of the joint venture agreement, is required to pay a further $400,000 upon gaining unencumbered access to the property and may fully exercise its option over three stages of expenditure as follows:
|
| | | | |
| Stage | Expected Expenditures |
| Payment Due Upon Completion of The Stage |
|
| Stage 1 | 1,000,000 |
| 400,000 |
|
| Stage 2 | 2,000,000 |
| 400,000 |
|
| Stage 3 | 4,000,000 |
| n/a |
|
In addition, Jabel will be paid a royalty based on the calculation that yields the highest payment; either 3% of the gross value of production from the Capcapo Gold Project or 6% of the annual profit of the joint venture corporation.
Management's Discussion & Analysis
Quarter ended March 31, 2014
Finally, the Company is also obligated to make milestone payments each time a specified milestone is achieved in respect of the property. The specified milestone occurs at the earlier of defining a cumulative mineral reserve of 2,000,000 ounces of gold and gold equivalents for the property, or upon achievement of a consistent production rate of 2,000 tonnes per day. Accordingly, achieving one milestone does not trigger the obligation to make a subsequent milestone payment if the alternative milestone has been achieved. The milestone payment to AMIC consists of a $2,000,000 payment and the issuance of 2,000,000 common shares of the Company or common shares having a market value of $5,000,000, whichever is of lesser value.
Related Party Transactions
The Interim Financial Statements include the financial statements of Besra Gold Inc. and the subsidiaries listed in the following table:
|
| | | | | |
| | | % equity held as at |
| Name | Country of Incorporation | Mar 31, 2014 |
| Jun 30, 2013 |
|
| Formwell Holdings Ltd | British Virgin Islands | 100 |
| 100 |
|
| Bong Mieu Holdings Ltd | Thailand | 100 |
| 100 |
|
| Bong Mieu Gold Mining Company Limited | Vietnam | 80 |
| 80 |
|
| New Vietnam Mining Corporation | British Virgin Islands | 100 |
| 100 |
|
| Phuoc Son Gold Company Limited | Vietnam | 85 |
| 85 |
|
| Kadabra Mining Corp. | Philippines | 100 |
| 100 |
|
| Besra Vietnam Ltd (formerly Olympus Pacific Minerals Vietnam Ltd) | Vietnam | 100 |
| 100 |
|
| Besra NZ Limited (formerly OYMNZ Ltd) | New Zealand | 100 |
| 100 |
|
| Besra Labuan Ltd (formerly Olympus Pacific Minerals Labuan Ltd) | Malaysia | 100 |
| 100 |
|
| Parnell Cracroft Ltd | British Virgin Islands | 100 |
| 100 |
|
| GR Enmore Pty Ltd | Australia | 100 |
| 100 |
|
| Binh Dinh NZ Gold Company Ltd | Vietnam | 75 |
| 75 |
|
| North Borneo Gold Sdn Bhd | Malaysia | 85.61 |
| 85.61 |
|
| Bau Mining Co Ltd | Samoa | 91 |
| 91 |
|
| KS Mining Ltd | Samoa | 100 |
| 100 |
|
Compensation of the key management personnel of the Group was as follows:
|
| | | | | | | | |
| Three months ended | Nine months ended |
| ($) 3 months ended | Mar 31, 2014 |
| Mar 31, 2013 |
| Mar 31, 2014 |
| Mar 31, 2013 |
|
| Management fees and salary | 435,669 |
| 820,689 |
| 1,454,729 |
| 2,196,269 |
|
| Share based compensation | 58,110 |
| 364,416 |
| 285,114 |
| 1,230,344 |
|
| Total compensation of key management | 493,779 |
| 1,185,105 |
| 1,739,843 |
| 3,426,613 |
|
The amounts disclosed in the table are the amounts recognized as an expense during the reporting period related to the key management personnel.
Directors' Interest in the Stock Option Plan
Stock options held by members of the Board of Directors under the stock option plan to purchase ordinary shares have the following expiry dates and exercises prices:
|
| | | | | | |
| | | | Number of Options Outstanding |
| Issue Date | Expiry Date | Exercise Price CAD$ | Mar 31, 2014 |
| Jun 30, 2013 |
|
| Jan-10 | Dec-14 | 0.40 | 2,073,618 |
| 2,073,618 |
|
| Jun-10 | Apr-15 | 0.42 | 1,500,000 |
| 1,500,000 |
|
| Jun-10 | Apr-15 | 0.60 | 1,500,000 |
| 1,500,000 |
|
| Jan-11 | Dec-15 | 0.72 | 1,068,378 |
| 1,068,378 |
|
| Sept-11 | Sept-16 | 0.53 | 751,599 |
| 751,599 |
|
| Jan-12 | Jan-17 | 0.42 | 1,250,000 |
| 1,250,000 |
|
| Feb-12 | Feb-17 | 0.52 | 3,472,872 |
| 3,472,872 |
|
| Mar-12 | Mar-17 | 0.33 | 3,015,000 |
| 3,015,000 |
|
| May-12 | May-17 | 0.32 | 150,000 |
| 150,000 |
|
| Mar-13 | Mar-18 | 0.24 | 2,425,000 |
| 2,425,000 |
|
| Total | | | 17,206,467 |
| 17,206,467 |
|
Management's Discussion & Analysis
Quarter ended March 31, 2014
Directors' Interest in the Deferred Share Units Plan
Deferred share units are held by non-executive members of the Board of Directors. Under this plan, fees are paid as deferred share units (“DSUs”) whose value is based on the market value of the common shares.
|
| | | | | | |
| | | Value of Units Outstanding ($) |
| Award year | Units |
| Mar 31, 2014 |
| Jun 30, 2013 |
|
| 2008 | 116,667 |
| 5,454 |
| 5,542 |
|
| 2009 | 120,690 |
| 5,642 |
| 5,733 |
|
| Total of deferred share units outstanding | 237,357 |
| 11,096 |
| 11,275 |
|
In 2008 the Company set up a deferred share unit plan for the non-executive members of the Board. Under this plan, fees are paid as DSUs whose value is based on the market value of the common shares. Under terms of the plan, the DSU plan will be an unfunded and unsecured plan. The deferred share units are paid out in cash upon retirement/resignation. Compensation expense for this plan is recorded in the year the payment is earned and changes in the amount of the deferred share unit payments as a result of share price movements are recorded in directors fees in the period of the change. Total DSUs outstanding as at March 31, 2014 were 237,357 units. Liabilities related to this plan are recorded in accrued liabilities and totaled $11,096 as at March 31, 2014 (as at June 30, 2013 - $11,275). The DSU plan was discontinued for new grants in 2010.
Short-Term Loan
During the quarter ended March 31, 2014, the Company issued three-month secured promissory notes in an aggregate amount of US$444,889 to three lenders, one of whom is a director of the company. As at March 31, 2014, the loan from a director including the unpaid interest amounted to $135,755 (nil as at June 30, 2013). 1,357,550 warrants are to be issued to a director to acquire common shares at an exercise price of US$0.05 expiring one year from the date of issuance, subject to all necessary regulatory and shareholders approvals, including the TSX.
Companies Controlled by Management
Management compensation incurred on behalf of the Company was paid to companies controlled by officers of the Company. The companies that were paid for management compensation include the following:
|
| | |
| Company name | Name | Position |
| Orangue Holdings Limited | David Seton | Executive Chairman |
| Dason Investments Limited | David Seton | Executive Chairman |
| Bolt Solutions Corporation | Darin Lee | Chief Operating Officer |
| Jura Trust Limited | John Seton | Chief Executive Officer |
| Whakapai Consulting Ltd | Jane Bell | Chief Financial Officer (resigned April 30, 2014) |
| Lloyd Beaumont No. 2 Trust | Paul Seton | Chief Commercial Officer |
Events After Balance Date
In 2013 the Company disputed tax claims by the Vietnam General Department of Customs ("GDC") against Phuoc Son Gold Company ("PSGC") and Bong Mieu Gold Mining Company ("BMGMC"), Besra’s two operating gold companies in Vietnam. The GDC had made an assessment that PSGC and BMGMC should pay a total of approximately $12 million in export duties. In April 2014, Besra received formal notification from Vietnam Ministry of Finance that the export tax assessments against Bong Mieu Gold Mining Company and Phuoc Son Gold Mining Company has been repealed.
After balance date the Company received a notice to cure from Euro Pacific on behalf of holders of its 9% unsecured convertible redeemable notes due 26 March 2014. Pursuant to the notice to cure, Euro Pacific has noted the Company in default for failure to pay the principal of CAD6,356,499 ($5,720,849 at March 31, 2014) plus outstanding interest of CAD476,716 ($429,044 at March 31, 2014) due on the Notes and has given 30 days for the Company to cure the default. The cure period as set out in the notice to cure Euro Pacific delivered to the Company expired on 7 May 2014 and the Company was unable to cure the default. The Company has not received notice of any legal action nor is not aware of any pending legal action in this respect. Besra is currently in discussions with the Investor Representative, Euro Pacific, over potential restructuring of the notes. If the note holders do not agree to a restructuring or extension, the Directors may consider pursuing a formal restructuring under statutory protection from creditors.
In Vietnam, the company is expecting to shortly receive formal approval from the Quang Nam taxation department for a two year deferral of Bong Mieu tax payments, owing to hardship caused by typhoon damage late last year. A similar separate application has also been made on behalf of Phuoc Son, although a response on that matter is expected at a later date.
Management's Discussion & Analysis
Quarter ended March 31, 2014
Other Financial Matters
Off-Balance Sheet Arrangements
The Company has no off-balance sheet arrangements.
Use of Financial Instruments
The Company has not entered into any financial agreements to minimize its investment, currency or commodity market risk. The principal financial instruments affecting the Company's financial condition and results of operations are currently its cash and cash equivalents, accounts receivable, accounts payable and accrued liabilities. The excess cash is deposited in interest bearing bank deposit accounts with maturities of three months or less from the date of deposit. The gold produced in Vietnam is refined in Vietnam and certified in Switzerland. From June 28, 2010 gold was sold on the spot market in US dollars via Auramet Trading, LLC Fort Lee, New Jersey (previously sold at the London Bullion Market a.m. Fixing).
Common Shares
As of March 31, 2014, the Company had issued and outstanding 378,781,274 common shares. Subsequent to March 31, 2014, the Company did not buy back or cancel any further shares.
Regulatory Update
Internal Controls over Financial Reporting
Management is responsible for establishing and maintaining adequate internal control over financial reporting. A company's internal control over financial reporting is a process designed to provide reasonable assurance regarding the reliability of financial reporting and the preparation of financial statements for external purposes in accordance with generally accepted accounting principles.
A company's internal control over financial reporting includes those policies and procedures that:
| |
| (i) | pertain to the maintenance of records that, in reasonable detail, accurately and fairly reflect the transactions and dispositions of the assets of the company; |
| |
| (ii) | provide reasonable assurance that transactions are recorded as necessary to permit preparation of financial statements in accordance with generally accepted accounting principles, and that receipts and expenditures of the company are being made only in accordance with authorizations of management and directors of the company; and |
| |
| (iii) | provide reasonable assurance regarding prevention or timely detection of unauthorized acquisition, use, or disposition of the company's assets that could have a material effect on the financial statements. |
It should be noted that a control system, no matter how well conceived or operated, can only provide reasonable assurance, not absolute assurance, that the objectives of the control system are met. Also, projections of any evaluation of effectiveness to future periods are subject to the risk that controls may become inadequate because of changes in conditions, or that the degree of compliance with policies and procedures may deteriorate.
Management, including our Chief Executive Officer, assessed the effectiveness of our internal control over financial reporting as of March 31, 2014. In making this assessment, management used the criteria set forth in the Internal Control Integrated Framework issued by the Committee of Sponsoring Organizations of the Treadway Commission. Based on its assessment, management has concluded that, as of March 31, 2014, the Company has sufficient personnel with the required experience and capabilities to complete all necessary control procedures associated with financial reporting and that the Company's internal controls over financial reporting were considered effective in terms of National Instrument 52-109 of the Canadian Securities Administrators.
Evaluation of Disclosure Controls and Procedures
The Company's management, with the participation of our Chief Executive Officer, as of the end of the period covered in this report, evaluated the effectiveness of our disclosure controls and procedures and determined that as of March 31, 2014, the general design and operation of our disclosure controls were satisfactory.
Regulatory Reporting in the United States
The Company's common shares are listed and posted for trading on the over-the-counter market in the United States. This allows US residents to trade the Company's common shares efficiently.
Management's Discussion & Analysis
Quarter ended March 31, 2014
Cautionary Note to US Investors Concerning Estimates of Measured, Indicated and Inferred Resources
This MD&A uses the term “measured and indicated resources”. We advise US investors that while those terms are recognized and required by Canadian regulations, the US Securities and Exchange Commission does not recognize them. US investors are cautioned not to assume that any part or all of the mineral deposits in these categories will ever be converted into reserves.
This MD&A uses the term “inferred resources”. We advise US investors that while this term is recognized and required by Canadian regulations, the US Securities and Exchange Commission does not recognize it. “Inferred resources” have a great uncertainty as to their existence, and great uncertainty as to their economic and legal feasibility. It cannot be assumed that all or any part of an Inferred Mineral Resource will ever be upgraded to a higher category. Under Canadian rules, estimates of Inferred Mineral Resources may not form the basis of feasibility or prefeasibility studies, except in rare cases. US investors are cautioned not to assume that part or all of an inferred resource exists, or is economically and legally mineable.
Critical Accounting Estimates
Information about significant areas of estimation uncertainty considered by management in preparing the Interim Financial Statements is described in the annual financial statements for the year ended June 30, 2013.
Accounting Policies
The accounting policies and methods of computation are consistent with those of the annual financial statements for the year ended June 30, 2013 as described in those annual financial statements.
Changes in Accounting Standards
The Company has reviewed new and revised accounting pronouncements that have been issued. There have been no new or amended International Financing Reporting Standards (“IFRS”) or interpretations applicable to the Company which were issued and were effective at July 1, 2013.
NON-IFRS MEASURES
The Company has included non-IFRS measures for “Operating cash cost per gold ounce sold”, "Operating cash cost per gold ounce produced" and “All-In Sustaining Costs” in this MD&A to supplement its financial statements which are presented in accordance with IFRS.
The Company believes that these measures provide investors with an improved ability to evaluate the performance of the Company. Non-IFRS measures do not have any standardized meaning prescribed under IFRS. Therefore they may not be comparable to similar measures employed by other companies. The data is intended to provide additional information and should not be considered in isolation or as a substitute for measures of performance prepared in accordance with IFRS.
The Company adopted the World Gold Council guidance regarding the non-GAAP measures “All-In Sustaining Costs” with the exceptions of calculation of sustaining capital and exploration expenditure where the management has decided to use estimated (budgeted) costs of tailings dams, cost of development meters and costs of additional property plant and equipment instead of recommended by the Council cash flow figures.
Operating cash costs per ounce produced (sold) is calculated by total production costs (cost of sales) by gold ounces produced (sold) for the relevant period.
All-in sustaining costs per ounce produced includes operating cash costs, plus a share of corporate administration costs and share-based payment expenses related to Company's operations in Vietnam, plus sales based taxes and government fees, plus an annualized estimate of sustaining capital and exploration expenditure, divided by gold ounces produced for the relevant period. It excludes corporate income tax, reclamation and remediation costs.
Management's Discussion & Analysis
Quarter ended March 31, 2014
Reconciliation of total All-in-costs from continuing operations, as a non-IFRS measure, to the nearest comparable IFRS measure, cost of sales from continuing operations
|
| | | | | | | | | | |
| Three months ended |
| Nine months ended |
|
| $ | Mar 31, 2014 |
| Mar 31, 2013 |
| Diff | Mar 31, 2014 |
| Mar 31, 2013 |
| Diff |
| Costs of sales (IFRS) | 5,643,429 |
| 10,747,697 |
| (47) | 36,979,575 |
| 30,385,987 |
| 22 |
| Inventory adjustment | 81,674 |
| 2,305,452 |
| (96) | (6,043,516 | ) | 5,901,715 |
| (202) |
| Total production costs | 5,725,103 |
| 13,053,149 |
| (56) | 30,936,059 |
| 36,287,702 |
| (15) |
| Gold produced (oz) | 3,943 |
| 13,589 |
| (71) | 25,918 |
| 41,706 |
| (38) |
| Operating cash costs per ounces produced | 1,452 |
| 961 |
| 51 | 1,194 |
| 870 |
| 37 |
| Add costs to calculate All-in Sustaining Costs (per oz): |
|
|
|
|
|
|
|
|
|
| - Royalties | 183 |
| 169 |
| 8 | 153 |
| 175 |
| (13) |
| - Environmental fees | 95 |
| 83 |
| 14 | 93 |
| 70 |
| 33 |
| - Export tax | 7 |
| — |
| n/a | 30 |
| — |
| n/a |
| - Allocated corporate general and administrative expenses | 169 |
| 71 |
| 138 | 83 |
| 71 |
| 17 |
| - Allocated share-based compensation | 15 |
| 22 |
| (32) | 11 |
| 26 |
| (58) |
| - Sustaining capital and exploration | 164 |
| 147 |
| 12 | 164 |
| 147 |
| 12 |
| All-in sustaining costs | 2,085 |
| 1,453 |
| 43 | 1,728 |
| 1,359 |
| 27 |
|
|
|
|
|
|
|
|
|
|
|
| Inventory adjustment |
|
|
|
|
|
|
|
|
|
|
| Inventory adjustment due to change in gold inventory (net of depreciation, royalties, export tax and environmental fees) | 81,674 |
| 2,305,452 |
| (96) | (6,043,516 | ) | 1,933,981 |
| n/a |
| Cost of gold used to settle gold loan | — |
| — |
| n/a | — |
| 3,967,734 |
| n/a |
| Total Inventory Adjustment | 81,674 |
| 2,305,452 |
| (96) | (6,043,516 | ) | 5,901,715 |
| (202) |
During the quarter ended March 31, 2014 All-in sustaining costs increased to $2,085 from $1,453 in the comparative period ended March 31, 2013. Operating cash costs per gold ounce produced for the quarter ended March 31, 2014 were $1,452 compared to $961 for the same period in 2013 mainly due to lower gold production. Export restrictions forced the Company in to exporting dore bars or selling gold in Vietnam, each attributing a 10% export tax and VAT, respectively. Environmental fees (per ounce of gold produced) increased by 14% mainly due to a decrease in denominator of gold production that decreased by 71%. During the quarter ended March 31, 2014 environmental fees decreased to $373,147 from $1,161,028 in the comparative period ended March 31, 2013 due to the decrease in volume of ore mined to 43,430 tonnes from 151,390 tonnes in the same period last year. Allocated corporate and administrative expenses decreased in nominal amounts but increased on per ounce of gold produced basis due to a 71% decrease in production compared to the same quarter last year.
During the nine months ended ended March 31, 2014 All-in sustaining costs increased by 27% to $1,728 from $1,359 in the comparative period ended March 31, 2013 mainly due to a 38% decrease in gold production. Lower share-based compensation costs are due to fewer options being vested during the reporting periods and expiry of options not being exercised. All-in sustaining costs increased mainly due to a revision of annual production estimate at Phuoc Son and Bong Mieu from 70,000 oz to 34,000 oz offset by the reduction in capital expenditure in Vietnam to align budgeted capital expenditure with new production plans.
Risk Factors and Uncertainties
Readers of this MD&A are encouraged to read the “Risk Factors and Uncertainties” as more fully described in the Company’s filings with the Canadian Securities Administrators, including its Annual Report for the period ended June 30, 2013, available on SEDAR at www.sedar.com.
Important risk factors to consider, among others, are
| |
| ▪ | Ability of the Company to continue as a going concern |
| |
| ▪ | Ability of the Company to raise funds in order to carry out the business |
| |
| ▪ | Commodity Price Volatility |
| |
| ▪ | Uncertainty in the Estimation of Mineral Reserves and Mineral Resources |
| |
| ▪ | Uncertainty of Exploration and Development |
| |
| ▪ | The Company May Not Achieve its Production Estimates |
Management's Discussion & Analysis
Quarter ended March 31, 2014
| |
| ▪ | Environmental Risks and Hazards |
Forward-Looking Statements
This report contains certain forward-looking statements relating to, but not limited to, management's expectations, estimates, intentions, plans and beliefs. Forward-looking information can often be identified by forward-looking words such as “anticipate”, “believe”, “expect”, “project”, “goal”, “plan”, “intend”, “budget”, “estimate”, “may” and “will” or similar words suggesting future outcomes, or other expectations, beliefs, plans, objectives, assumptions, intentions or statements about future events or performance. Forward-looking information may include, but is not limited to, statements regarding: reserve and resource estimates; estimates of future production; unit costs, costs of capital projects and timing of commencement of operations; production and recovery rates; financing needs, the availability of financing on acceptable terms or other sources of funding, if needed; and the timing of additional tests, feasibility studies and environmental or other permitting.
Forward-looking statements should not be construed as guarantees of future performance. The forward-looking statements contained herein are based on our management's current expectations, estimates, assumptions, opinion and analysis in light of its experience that, while considered reasonable at the time, may turn out to be incorrect or involve known and unknown risks, uncertainties and other factors inherently subject to a number of business and economic risks and uncertainties and contingencies that could cause actual results to differ materially from any forward-looking statement. These risks, uncertainties and other factors include, but are not limited to, the following: failure to establish estimated resources and reserves; the grade and recovery of ore which is mined varying from estimates; capital and operating costs varying significantly from estimates; delays in obtaining or failures to obtain required governmental, environmental or other project approvals; changes in national and local government legislation, taxation or regulations, political or economic developments; the ability to obtain financing on favorable terms or at all; inflation; changes in currency exchange rates; fluctuations in commodity prices; delays in the development of projects; and other risks that we set forth in our filings with applicable securities regulatory authorities from time to time and available at www.sedar.com or www.sec.gov/edgar.
Due to the inherent risks associated with our business, readers are cautioned not to place undue reliance on forward-looking information. By its nature, forward-looking information involves numerous assumptions, inherent risks and uncertainties, both general and specific, that contribute to the possibility that the predictions, forecasts, projections and various future events will not occur. We disclaim any intention or obligation to update publicly or otherwise revise any forward-looking information whether as a result of new information, future events or other such factors which affect this information, except as required by applicable laws.
Technical Information and Qualified Person
The technical information in this MD&A that relates to Exploration Results, Mineral Resources or Ore Reserves is based on information complied by Mr. Graeme Fulton, who is a Member of The Australasian Institute of Mining and Metallurgy. Mr. Fulton has sufficient experience, which is relevant to the style of mineralization and type of deposit under consideration and to the activity which he is undertaking to qualify as a “Competent Person”, as defined in the 2012 Edition of the “Australasian Code for Reporting of Exploration Results, Mineral Resources and Ore Reserve” and to qualify as a “Qualified Person” as defined in National Instrument 43-101 Standards of Disclosure for Mineral Projects of the Canadian Securities Administrators. Mr. Fulton is a full-time consultant to the Company and is not “independent” within the meaning of National Instrument 43-101. Mr. Fulton consents to the inclusion in this report of the technical information in the form and context in which it appears.
Mr. Fulton verified the data disclosed, including sampling, analytical and test data underlying the information contained herein. For a description of Besra's data verification process, quality assurance program and quality control measure applied, the type of analytical or testing procedures utilized, sample size, name and location of testing laboratories, the effective date of the mineral resource and ore reserve estimates contained herein, details of the key assumptions, parameters and methods used to estimate the mineral resources and ore reserves set out in this report, any known environmental, political, legal, title, or other risks that could materially affect the potential development of the mineral resources or ore reserves, readers are directed to the technical reports entitled “A Technical Review of the Bong Mieu Gold Project in Quang Nam Province, Vietnam” in September 2004, “Technical Review of the Bong Mieu Gold Project in Quang Nam Province, Vietnam” in August 2007 and “Updated Technical Review of Bong Mieu Gold Project in Quang Nam Province, Vietnam” dated April 2009 in relation to the Bong Mieu Gold Project, and the technical reports entitled “A Technical Review of the Phuoc Son Gold Project in Quang Name Province, Vietnam” dated January 2004 and “Technical Report on the Phuoc Son Project in Quang Nam Province, Vietnam” dated March 2008 in relation to the Phuoc Son Gold Project, and the technical report entitled “Technical Report on Bau Project in Bau, Sarawak, East Malaysia” dated August 2010 in relation to the Bau Gold Project.