UNITED STATES
SECURITIES AND EXCHANGE COMMISSION
WASHINGTON, D.C. 20549
FORM 20-F/A
Amendment No. 1
| [ ] | REGISTRATION STATEMENT PURSUANT TO SECTION 12(b) OR (g) OF THE SECURITIES EXCHANGE ACT OF 1934 |
OR
| [ ] | ANNUAL REPORT PURSUANT TO SECTION 13 OR 15(d) OF THE SECURITIES EXCHANGE ACT OF 1934 |
OR
| [X ] | TRANSITION REPORT PURSUANT TO SECTION 13 OR 15(d) OF THE SECURITIESEXCHANGE ACT OF 1934 |
For the six-month transitional year ended June 30, 2012
OR
| [ ] | SHELL COMPANY REPORT PURSUANT TO SECTION 13 OR 15(d) OF THE SECURITIES EXCHANGE ACT OF 1934 |
Date of event requiring this shell company report
For the transition period from ____________ to __________
Commission file number 0-52324
Olympus Pacific Minerals Inc.
(Exact name of Registrant as specified in its charter)
n/a.
(Translation of Registrant’s name into English)
Canada
(Jurisdiction of incorporation or organization)
Suite 500 –10 King Street East, Toronto, Ontario, Canada, M5C 1C3
(Address of principal executive offices)
Securities to be registered pursuant to Section 12(b) of the Act:
Title of each class Name of each exchange on which registered
None N/A
Securities to be registered pursuant to Section 12(g) of the Act: common shares
(Title of Class)
Securities for which there is a reporting obligation pursuant to Section 15(d) of the Act:None
Number of outstanding shares of each of the issuer’s classes of capital or common stock as of the close of the period covered by the annual report: 378, 781, 186
Indicate by check mark if the registrant is a well-known seasoned issuer, as defined in Rule 405 of the Securities Act.
Yes [] No [X]
If this report is an annual or transition report, indicate by check mark if the registrant is not required to file reports pursuant to Section 13 or 15 (d) of the Securities Exchange Act of 1934.
Yes [X] No [ ]
Note – Checking the box above will not relieve any registrant required to file reports pursuant to Section 13 or 15 (d) of the Securities Exchange Act of 1934 from their obligations under those Sections.
Indicate by check mark whether the registrant (1) has filed all reports required to be filed by Section 13 or 15 (d) of the Securities Exchange Act of 1934 during the preceding 12 months (or for such shorter period that the registrants was required to file such reports). And (2) has been subject to such filing requirements for the past 90 days.
Yes [X] No [ ]
Indicate by check mark whether the registrant has submitted electronically and posted on its corporate Web site, if any, every Interactive Data File required to be submitted and posted pursuant to Rule 405 of Regulation S-T (§232.405 of this chapter) during the preceding 12 months (or for such shorter period that the registrant was required to submit and post such files).
Yes [ ] No [ ]
Indicate by check mark whether the registrant is a large accelerated filer, an accelerated filer, or a non-accelerated filer. See definition of “accelerated filer and large accelerated filer” in Rule 12b-2 of the Exchange Act (Check one):
Large accelerated file [ ] Accelerated file [ ] Non-accelerated file [X]
Indicate by check mark which basis of accounting the registrant has used to prepare the financial statements included in this filling:
U.S. GAAP [ ] International Financial Reporting Standards as issued Other []
By the International Accounting Standards Board [ X]
If “Other” has been checked in response to the previous question, indicate by check mark which financial statement item the registrant has elected to follow.
[] Item 17 [ ] Item 18
If this is an annual report, indicate by check mark whether the registrant is a shell company (as defined in Rule 12b-2 of the Exchange Act)
Yes [] No [X ]
Table of Contents
| GLOSSARY | iii |
| Cautionary Note Regarding Forward-Looking Information | vii |
| ITEM 1: Identity of Directors, Senior Management and Advisers | 1 |
| ITEM 2: Offer Statistics and Expected Timetable | 1 |
| ITEM 3: Key Information | 1 |
| 3A. Selected Financial Data | 1 |
| 3B. Capitalization and Indebtedness | 3 |
| 3C. Reasons for the Offer and Use of Proceeds | 3 |
| 3D. Risk Factors | 3 |
| ITEM 4: Information on the Company | 14 |
| 4A. History and Development of the Company | 14 |
| 4B. Business Overview | 21 |
| 4C. Organizational Structure | 25 |
| 4D. Property, Plant and Equipment | 26 |
| ITEM 4A: Unresolved Staff Comments | 73 |
| ITEM 5: Operating and Financial Review and Prospects | 74 |
| 5A. Operating Results | 74 |
| 5B. Liquidity and Capital Resources | 80 |
| 5C. Research and development, patents and licenses, etc. | 81 |
| 5D. Trend Information | 81 |
| 5E. Off-Balance Sheet Arrangements | 82 |
| 5F. Tabular Disclosure of Contractual Obligations as at December 31, 2011 | 82 |
| ITEM 6: Directors, Senior Management, and Employees | 82 |
| 6A. Directors and Senior Management | 82 |
| 6B. Compensation | 86 |
| 6C. Board Practices | 92 |
| 6D. Employees | 94 |
| 6E. Share Ownership | 94 |
| ITEM 7: Major Shareholders and Related Party Transactions | 96 |
| 7A. Major Shareholders | 96 |
| 7B. Related Party Transactions | 97 |
| 7C. Interests of Experts and Counsel | 98 |
| ITEM 8: Financial Information | 98 |
| 8A. Consolidated Statements and Other Financial Information | 98 |
| 8B. Significant Changes | 98 |
| ITEM 9: The Offer and Listing | 98 |
| 9A. Offer and Listing Details | 98 |
| 9B. Plan of Distribution | 101 |
| 9C. Markets | 101 |
| 9D. Selling Shareholders | 101 |
| 9E. Dilution | 101 |
| 9F. Expenses of the Issue | 101 |
| ITEM 10: Additional Information | 101 |
| 10A. Share Capital | 101 |
| 10B. Memorandum and Articles of Association | 101 |
| 10C. Material Contracts | 101 |
| 10D. Exchange Controls | 103 |
- i -
| 10E. Taxation | 104 |
| 10E.1. Certain Canadian Federal Income Tax Consequences – General | 104 |
| 10E.2. Dividends | 104 |
| 10E.3. Disposition of Common Shares | 104 |
| 10E.4. United States Taxation | 105 |
| 10F. Dividends and Paying Agents | 110 |
| 10G. Statements by Experts | 110 |
| 10H. Documents on Display | 110 |
| 10I. Subsidiary Information | 110 |
| ITEM 11: Quantitative and Qualitative Disclosures about Market Risk | 110 |
| ITEM 12: Description of Securities other than Equity Securities | 110 |
| ITEM 13: Defaults, Dividend Arrearages and Delinquencies | 111 |
| ITEM 14: Material Modifications to the Rights of Security Holders and Use of Proceeds | 111 |
| ITEM 15: Controls and Procedures | 111 |
| ITEM 16: [RESERVED] | 113 |
| ITEM 16A. Audit Committee Financial Expert | 113 |
| ITEM 16B. Code of Ethics | 113 |
| ITEM 16C. Principal Accountant Fees and Services | 113 |
| ITEM 16D. Exemptions From the Listing Standards for Audit Committees | 114 |
| ITEM 16E. Purchases of Equity Securities by the Issuer and Affiliated Purchasers | 114 |
| ITEM 16F. Change in Registrant’s Certifying Accountant | 115 |
| ITEM 17: Financial Statements | 116 |
| ITEM 18: Financial Statements | 116 |
| ITEM 19: Exhibits | 116 |
| 19A. Financial Statements | 116 |
| 19B. Exhibits | 116 |
| SIGNATURES | 1 |
- ii -
GLOSSARY
Following is a glossary of terms used throughout this Annual Report.
| artisanal mining | mining at small-scale mines (and to a lesser extent quarries) that are labor intensive, with mechanization being at a low level and basic. Artisanal mining can encompass all small, medium, large, informal, legal and illegal miners who use rudimentary processes to extract valuable rocks and minerals from ore bodies. |
| bitumen | known as asphalt or tar, bitumen is the brown or black viscous residue from the vacuum distillation of crude petroleum. |
| breccia | a rock in which angular fragments are surrounded by a mass of finer-grained material. |
| C-horizon soil | the soil parent material, either created in situ or transported into its present location. Beneath the C horizon lies bedrock. |
| concentrate | a concentrate of minerals produced by crushing, grinding and processing methods such as gravity, flotation or leaching. |
| exploration stage | the search for mineral deposits which are not in either the development or production stage. |
| Form 43-101F1 | technical report issued pursuant to Canadian securities rules, the objective of which is to provide a summary of scientific and technical information concerning mineral exploration, development and production activities on a mineral property that is material to an issuer. Form 43-101F1is prepared in accordance with NI 43-101. Form 43-101F1 sets out specific requirements for the preparation and contents of a technical report. |
| feasibility study | a comprehensive study of a mineral deposit in which all geological, engineering, legal, operating, economic, social, environmental and other relevant factors are considered in sufficient detail that it could reasonably serve as the basis for a final decision by a financial institution to finance the development of the deposit for mineral production. |
| gneiss | a coarse-grained, foliated rock produced by regional metamorphism. The mineral grains within gneiss are elongated due to pressure and the rock has a compositional banding due to chemical activity. |
| grade | the metal content of rock with precious metals. Grade can be expressed as troy ounces or grams per tonne of rock. |
| granodiorite | a medium to coarse-grained intrusive igneous rock, intermediate in composition between quartz diorite and quartz monzonite. |
| gold deposit | a mineral deposit mineralized with gold. |
- iii -
| hydrothermal | the products or the actions of heated waters in a rock mass such as a mineral deposit precipitating from a hot solution. |
| igneous | a primary type of rock formed by the cooling of molten material. |
| inferred mineral resource | that part of a mineral resource for which quantity and grade or quality can be estimated on the basis of geological evidence and reasonably assumed, but not verified, geological and grade continuity. The estimate is based on limited information and sampling gathered through appropriate techniques from locations such as outcrops, trenches, pits, workings, and drill holes. |
| intrusion | intrusive-molten rock which is intruded (injected) into spaces that are created by a combination of melting and displacement. |
| mafic | igneous rocks composed mostly of dark, iron- and magnesium-rich minerals. |
| metallurgical tests | scientific examinations of rock/material to determine the optimum extraction of metal contained. Core samples from diamond drill holes are used as representative samples of the mineralization for this test work. |
| mineral resource | a concentration or occurrence of diamonds, natural solid inorganic material, or natural solid fossilized organic material including base and precious metals, coal, and industrial minerals in or on the Earth’s crust in such form and quantity and of such a grade or quality that it has reasonable prospects for economic extraction. The location, quantity, grade, geological characteristics and continuity of a mineral resource are known, estimated or interpreted from specific geological evidence and knowledge. Mineral Resources are sub-divided, in order of increasing geological confidence, into Inferred, Indicated and Measured categories. |
| NI 43-101 | National Instrument 43-101 Standards of Disclosure for Mineral Projects of the Canadian Securities Administrators |
| ore | a naturally occurring rock or material from which minerals, such as gold, can be extracted at a profit; a determination of whether a mineral deposit contains ore is often made by a feasibility study. |
| open pit | a mining method whereby the mineral reserves are accessed from surface by the successive removal of layers of material usually creating a large pit at the surface of the earth. |
| ounce or oz. | a troy ounce or 20 pennyweights or 480 grains or 31.103 grams. |
| petrology | a field of geology which focuses on the study of rocks and the conditions by which they form. There are three branches of petrology, corresponding to the three types of rocks: igneous, metamorphic, and sedimentary. |
| pre-feasibility study | a comprehensive study of the viability of a mineral project that has advanced to a stage where the mining methods, in the case of underground mining, or the pit configurations, in the case of an open pit, has been established, where effective methods of mineral processing has been determined, and includes a financial analysis based on reasonable assumptions of technical, engineering, legal, operating, and economic factors and evaluation of other relevant factors which are sufficient for a Qualified Person, acting reasonably, to determine if all or part of the Mineral Resource may be classified as a Mineral Reserve. |
- iv -
| probable reserve (Canadian definition) | the economically mineable part of an indicated and, in some circumstances, a measured mineral resource demonstrated by at least a preliminary feasibility study. This study must include adequate information on mining, processing, metallurgical, economic and other relevant factors that demonstrate, at the time of reporting, that economic extraction can be justified. |
probable reserve (U.S. definition) | reserves for which quantity and grade and/or quality are computed from information similar to that used for proven (measured) reserves, but the sites for inspection, sampling, and measurement are farther apart or are otherwise less adequately spaced. The degree of assurance, although lower than that for proven (measured) reserves, is high enough to assume continuity between points of observation. |
| prospect | an area prospective for economic minerals based on geological, geophysical, geochemical and other criteria. |
| production stage | all companies engaged in the exploitation of a mineral deposit (reserve). |
proven reserve (Canadian definition) | the economically mineable part of a measured mineral resource demonstrated by at least a preliminary feasibility study. This study must include adequate information on mining, processing, metallurgical, economic and other relevant factors that demonstrate, at the time of reporting, that economic extraction can be justified. |
proven reserve (U.S. definition) | reserves for which (a) quantity is computed from dimensions revealed in outcrops, trenches, workings or drill holes; grade and/or quantity are computed from the results of detailed sampling and (b) the sites for inspection, sampling and measurement are spaced so closely and the geologic character is so well defined that size, shape, depth and mineral contents of reserves are well established. |
| qualified person | Has the meaning ascribed thereto in NI 43-101. |
| reserve | that part of a mineral deposit, which could be economically and legally extracted or produced at the time of the reserve determination. Reserves are customarily stated in terms of “ore” when dealing with metalliferous minerals such as gold or silver. |
| schists | a metamorphic rock containing abundant particles of mica, characterized by strong foliation, and originating from a metamorphism in which directed pressure plays a significant role. |
- v -
| shaft | a vertical or inclined tunnel in an underground mine driven downward from surface. |
| shear | a tabular zone of faulting within which the rocks are crushed and flattened. |
| skarn | a lime-bearing silicate derived from nearly pure limestone and dolomite with the introduction of large amounts of silicon, aluminum, iron, and magnesium. |
| stoping | the act of mining in a confined space. |
| stratigraphic units | sequences of bedded rocks in specific areas. |
| strike | the direction of line formed by intersection of a rock surface with a horizontal plane. Strike is always perpendicular to direction of dip. |
thrust fault | a particular type of fault, or break in the fabric of the Earth’s crust with resulting movement of each side against the other, in which a lower stratigraphic position is pushed up and over another. This is the result of compressional forces. |
| toll treatment | processing or treatment of ore at an offsite processing facility. |
| trenching | the surface excavation of a linear trench to expose mineralization for sampling. |
| vein | a tabular body of rock typically of narrow thickness and mineralized occupying a fault, shear, fissure or fracture crosscutting another pre-existing rock. |
For ease of reference, the following conversion factors are provided:
| 1 mile (mi) | = 1.609 kilometres (km) | 2,204 pounds (lbs) | = 1 tonne |
| 1 yard (yd) | = 0.9144 meter (m) | 2,000 pounds/1 short ton | = 0.907 tonne |
| 1 acre | = 0.405 hectare (ha) | 1 troy ounce | = 31.103 grams |
| 1 kilometre (km) | = 1,000 meters |
- vi -
Cautionary Note Regarding Forward-Looking Information
This report contains certain forward-looking statements relating to, but not limited to, management’s expectations, estimates, intentions, plans and beliefs. Forward-looking information can often be identified by forward-looking words such as “anticipate”, “believe”, “expect”, “anticipate”, “project”, “goal”, “plan”, “intend”, “budget”, “estimate”, “may” and “will” or similar words suggesting future outcomes, or other expectations, beliefs, plans, objectives, assumptions, intentions or statements about future events or performance. Forward-looking information may include, but is not limited to, statements regarding:
• reserve and resource estimates;
• estimates of future production;
• unit costs, costs of capital projects and timing of commencement of operations;
• production and recovery rates;
• financing needs, the availability of financing on acceptable terms or other sources of funding, if needed; and
• the timing of additional tests, feasibility studies and environmental or other permitting
Forward-looking statements should not be construed as guarantees of future performance. The forward-looking statements contained herein are based on our management’s current expectations, estimates, assumptions, opinion and analysis in light of its experience that, while considered reasonable at the time, may turn out to be incorrect or involve known and unknown risks, uncertainties and other factors that are inherently subject to a number of business and economic risks and uncertainties and contingencies that could cause actual results to differ materially from any forward-looking statement. Forward-looking statements involve significant known and unknown risks, uncertainties and other factors that could cause actual results to differ materially from any forward-looking statement. These risks, uncertainties and other factors include, but are not limited to, the following:
• failure to establish estimated resources and reserves;
• the grade and recovery of ore which is mined varying from estimates;
• capital and operating costs varying significantly from estimates;
• delays in obtaining or failures to obtain required governmental, environmental or other project approvals;
• changes in national and local government legislation, taxation or regulations, political or economic developments;
• the ability to obtain financing on favourable terms or at all;
• inflation;
• changes in currency exchange rates;
• fluctuations in commodity prices;
- vii -
• delays in the development of projects; and
• other risks that we set forth in our filings with the SEC and other applicable securities regulatory authorities from time to time and available at www.sedar.com or www.sec.gov/edgar.
Due to the inherent risks associated with our business, readers are cautioned not to place undue reliance on forward-looking information. By its nature, forward-looking information involves numerous assumptions, inherent risks and uncertainties, both general and specific, that contribute to the possibility that the predictions, forecasts, projections and various future events will not occur. We disclaim any intention or obligation to update publicly or otherwise revise any forward-looking information whether as a result of new information, future events or other such factors which affect this information, except as required by applicable laws.
- viii -
PART I
| ITEM 1: | IDENTITY OF DIRECTORS, SENIOR MANAGEMENT AND ADVISERS |
Not applicable
| ITEM 2: | OFFER STATISTICS AND EXPECTED TIMETABLE |
Not Applicable.
| ITEM 3: | KEY INFORMATION |
| 3A. | Selected Financial Data |
The following is selected financial data of Olympus Pacific Minerals Inc. (together with its consolidated subsidiaries, the “Company”, “Olympus” or “we”, “us”, “our” or similar identifying terminology), expressed in United States dollars, for the six-month transitional fiscal year ended June 30, 2012 and the fiscal years ended December 31, 2011 and 2010, prepared in accordance with International Financial Reporting Standards (“IFRS”) as issued by the International Accounting Standards Board (“IASB”) and prepared in accordance with Canadian generally accepted accounting principles (“Canadian GAAP”) for fiscal years ended December 31, 2009 and 2008, which differ substantially from United States generally accepted accounting principles (“US GAAP”). The Consolidated Financial Statements for the six-month transitional fiscal year ended June 30, 2012 and the fiscal years ended December 31, 2011 and 2010 comply with IFRS as published by the IASB. Prior to the adoption by the Company of IFRS, for a description of the differences between Canadian GAAP and US GAAP, and how these differences could affect the Company’s financial statements, please see Note 19 to the audited financial statements for the years ended December 31, 2010, 2009 and 2008 which are included in Item 19 of the Company’s 2010 20-F Annual Report dated June 7, 2011. Note 19 to the audited financial statements for the years ended December 31, 2010, 2009 and 2008 is incorporated by reference herein. This reconciliation is not required for financial statements prepared under IFRS, and accordingly has not been prepared for the six-month transitional fiscal year ended June 30, 2012 and fiscal years ended December 31, 2011 and 2010.
The selected financial data should be read in conjunction with the financial statements and other financial information included elsewhere in this Annual Report on Form 20-F.
| Table No. 1: | Selected Financial Data |
Six-month Transitional Fiscal Year Ended June 30, 2012 Audited | Year Ended December 31, 2011 Audited | Year Ended December 31, 2010 Audited | ||||||||||
| AMOUNTS IN ACCORDANCE WITH IFRS | ||||||||||||
| Revenue | 34,552,265 | 47,976,630 | 35,986,013 | |||||||||
| Income (Loss) for the Period | -18,326,891 | 1,644,898 | -12,773,072 | |||||||||
| Basic Earnings (Loss) Per Share | -0.040 | 0.003 | -0.042 | |||||||||
| Diluted (Loss) Per Share | -0.040 | 0.003 | -0.042 | |||||||||
| Dividends Per Share | Nil | Nil | Nil | |||||||||
| Period-End Shares | 378,781,186 | 380,593,907 | 365,510,797 | |||||||||
| Cash | 3,397,728 | 8,730,248 | 4,105,325 | |||||||||
| Working Capital | -12,878,781 | 3,210,632 | 3,618,445 | |||||||||
| Mine Properties | 37,165,314 | 37,896,565 | 39,197,779 | |||||||||
| Deferred Exploration Expenditure | 21,428,562 | 19,516,555 | 13,621,774 | |||||||||
| Deferred Development Expenditure | 10,636,534 | 20,276,490 | 18,103,858 | |||||||||
| Long-Term Liabilities | 38,763,749 | 47,257,310 | 41,325,266 | |||||||||
| Capital Stock | 135,134,697 | 135,846,955 | 129,903,856 | |||||||||
| Non-Controlling Interest | 2,169,412 | 5,920,409 | 5,682,771 | |||||||||
| Shareholders’ Equity | 50,562,061 | 71,524,794 | 65,227,594 | |||||||||
| Total Assets | 121,117,149 | 145,252,174 | 123,192,405 | |||||||||
1
| (US$) | Year Ended December 31, 2009 | Year Ended December 31, 2008 | ||||||
| Audited | Audited | |||||||
| AMOUNTS IN ACCORDANCE WITH CANADIAN GAAP | ||||||||
| Revenue | 16,400,740 | 7,275,324 | ||||||
| Income (Loss) for the Period | -9,346,892 | -20,200,995 | ||||||
| Basic & Diluted Earnings (Loss) Per Share | -0.038 | -0.087 | ||||||
| Dividends Per Share | Nil | Nil | ||||||
| Period-End Shares | 268,458,779 | 232,423,101 | ||||||
| Cash | 5,718,725 | 4,161,735 | ||||||
| Working Capital | 7,400,950 | 5,424,272 | ||||||
| Mineral Properties | 7,203,352 | 7,810,307 | ||||||
| Deferred Development and Exploration | 25,049,053 | 26,067,847 | ||||||
| Long-Term Liabilities | 770,010 | 1,046,883 | ||||||
| Capital Stock | 97,318,003 | 88,904,501 | ||||||
| Non-Controlling Interest | -444,043 | Nil | ||||||
| Shareholders’ Equity | 48,314,083 | 48,940,283 | ||||||
| Total Assets | 54,024,268 | 54,282,352 | ||||||
| AMOUNTS IN ACCORDANCE WITH US GAAP | Year Ended December 31, 2009 Audited | Year Ended December 31, 2008 Audited | ||||||
| Net Comprehensive (Loss) | -8,056,464 | -20,957,186 | ||||||
| Income (Loss) Per Share – Basic & Diluted | -0.03 | -0.05 | ||||||
| Mineral Properties | 7,172,729 | 7,779,684 | ||||||
| Deferred Development and Exploration | 4,797,776 | 3,545,531 | ||||||
| Non-controlling Interest | -339,358 | Nil | ||||||
| Shareholders’ Equity | 27,967,401 | 26,313,898 | ||||||
| Total Assets | 33,677,586 | 32,655,967 | ||||||
2
In this Transition Report on Form 20-F, unless otherwise specified, all dollar amounts are expressed in United States dollars.
| 3B. | Capitalization and Indebtedness |
Not applicable
| 3C. | Reasons for the Offer and Use of Proceeds |
Not Applicable.
| 3D. | Risk Factors |
The Company faces significant risk factors and uncertainties associated with its business and its industry, similar to those faced by other exploration and development companies in Southeast Asia, including the following general description of material risk factors:
There is a significant doubt regarding the ability of the Company to continue as a going concern. The Company’s audited annual consolidated financial statements as at and for the period ended June 30, 2012 were prepared on a going concern basis, under the historical cost basis, which assumes the Company will continue its operations for the foreseeable future and will be able to realize its assets and discharge its liabilities and commitments in the ordinary course of business.
During the six-month period ended June 30, 2012, the Company had a significant disruption to its operations at the Phuoc Son Mine which negatively impacted the cash-flows and the Company incurred a net loss of $18.3 million for the period. As at June 30, 2012, the Company’s current liabilities exceeded its current assets by $12.9 million and the Company has high debt levels. Further the Corporation currently has limited cash on hand and, since it is experiencing negative cash flow, its cash reserves are being depleted.
3
The Phuoc Son Mine has now resumed normal operations and management expects that net cash flows from operations will be positive in fiscal 2013. If the Company is able to increase production to targeted levels and the market price for gold remains robust through fiscal 2013, the Company’s liquidity position may improve.
The ability of the Company to continue as a going concern depends upon its ability to resume profitable operations or to continue to access debt or equity capital in the ordinary course. No assurance can be given that such capital will be available at all or on terms acceptable to the Company. Management is considering various alternatives, including a number of initiatives to raise additional capital or to restructure its existing debt. However, as at the date of this report the Company has not secured such further financing. Although the Company has been successful in securing the funds necessary to execute its business plan in the past, it is not possible to determine with certainty the success or adequacy of its financing initiatives.
Not all of the Company’s mineral properties contain a known commercially mineable mineral deposit. The business of mineral exploration and extraction involves a high degree of risk and few properties that are explored are ultimately developed into producing mines. Major expenses may be required to locate, establish or expand mineral reserves, to develop metallurgical processes and to construct mining and processing facilities at a particular site. The long-term profitability of the Company’s operations will be in part directly related to the cost and success of its ability to develop the extraction and processing facilities and infrastructure at any site chosen for extraction. It is impossible to ensure that the exploration or development programs planned by the Company will result in a profitable commercial mining operation nor enable a continuation of those operations when established. Whether a mineral deposit is commercially viable depends on a number of factors, including, but not limited to the following: particular attributes of the deposit, such as ground conditions, depth, grade, size and proximity to infrastructure; the ability of the Company to maximize the recovery rate of ore extracted; cost of supplies; metal prices, which are volatile; and government regulations, including regulations relating to investment, mining, prices, taxes, royalties, land use and tenure, importing and exporting of minerals and environmental protection.
The Company’s resources and reserves estimates are subject to uncertainty. The Company’s mineral resources and mineral reserves are estimates based on a number of assumptions, any adverse changes in which could require the Company to lower its mineral resource and mineral reserve estimates. There is no certainty that any of the mineral resources or mineral reserves disclosed by the Company will be realized or that the anticipated tonnages and grades will be achieved, that the indicated level of recovery will be realized or that reserves can be mined or processed profitably. Until a deposit is actually mined and processed, the quantity and grades of mineral resources and mineral reserves must be considered as estimates only. Valid estimates made at a given time may significantly change when new information becomes available. Any material change in the quantity of mineral resources or mineral reserves, grade or stripping ratio may affect the economic viability of the Company’s properties. There can also be no assurance that any discoveries of new or additional reserves will be made. Any material reductions in estimates of mineral resources or mineral reserves could have a material adverse effect on the Company’s results of operations and financial condition. This risk may be particularly acute with respect to the Bong Mieu Central Gold Mine where the Company conducted a limited amount of drilling before making its decision to commence production.
The Company may not meet key production or other cost estimates. A decrease in the amount of or a change in the timing of the mineral production outlook for the Company may impact the amount and timing of cash flow from operations. The actual impact of such a decrease of cash flow from operations would depend on the timing of any changes in production and on actual prices. Any change in the timing of these projected cash flows resulting from production shortfalls or labor disruptions would, in turn, result in delays in receipt of such cash flows and in using such cash to, as applicable, reduce debt levels and fund operating and exploration activities. Should such production shortfalls or labor disruptions occur, the Company may require additional financing to fund capital expenditures in the future. The level of capital and operating cost estimates which are used for determining and obtaining financing and other purposes are based on certain assumptions and are inherently subject to significant uncertainties. It is very likely that actual results for the Company’s projects will differ from its current estimates and assumptions, and these differences may be material. In addition, experience from actual mining or processing operations may identify new or unexpected conditions that could reduce production below, and/or increase capital and/or operating costs above, the current estimates. In particular, the Bong Mieu Central Gold Mine was put into production without a full feasibility study. Instead, the Company prepared a pre-feasibility study, which can underestimate a project’s capital and operating costs, while at the same time overestimating the amount of reserves, grade recovery from processing and mineralization. Accordingly, production estimates in respect of the Bong Mieu Central Gold Mine may be even less reliable. If actual results are less favorable than the Company currently estimates, the Company’s business, results of operations, financial condition and liquidity could be materially adversely impacted.
4
The Company is subject to various risk associated with its mining operations. By its nature, the business of mineral exploration, project development, mining and processing, contains elements of significant risks and hazards. The continuous success of the Company’s business is dependent on many factors including, but not limited to:
| · | discovery and/or acquisition of new ore reserves; |
| · | securing and maintaining title to tenements and obtaining necessary consents, permits or authorizations for exploration and mining; |
| · | successful design and construction of mining and processing facilities; |
| · | successful commissioning and operating of mining and processing facilities; |
| · | ongoing supplies of essentials goods and services; and |
| · | the performance of the technology incorporated into the processing facility. |
Specifically, the Company placed the Bong Mieu Central Gold Mine into production based on a pilot plant and bench scale testing. There can be no assurance that mineral or other metal recoveries in small scale laboratory tests will be duplicated in a larger scale test under on-site conditions or during production and the volume and grade of reserves mined and processed and recovery rates may not be the same as currently anticipated.
The Company is largely dependent upon its mining and milling operations at its Phuoc Son mine and any adverse condition affecting that operation may have a material adverse impact on the Company. The Company’s operations at the Phuoc Son property accounted for approximately 70% of the Company’s gold production for the six month transition year ended June 30, 2012 and is expected to account for approximately 82% of the Company’s gold production in 2012 (based on the Company’s production guidance of 60,000 ounces). During the six month transition year ended June 30, 2012, gold production at the Phuoc Son mine was below the Company’s expectation as a result of diminished tonnage output during engineering remediation of the Southern Deposit, compounded by higher than expected grade dilution during initial development of the Northern Deposit. Any adverse condition affecting mining or milling conditions at the Phuoc Son property could be expected to have a material adverse effect on the Company’s financial performance and results of operations. The Company also anticipates using revenue generated by its operations at Phuoc Son to finance a substantial portion of its capital expenditures during the Company’s 2013 fiscal year, including at the Company’s Bau Gold Property in East Malaysia. The Company likely will continue to be dependent on operations at the Phuoc Son property for a substantial portion of its gold production until the Bau Gold Property achieves commercial production or production is increased at the Bong Mieu Gold Property.
5
The Company is dependent upon its ability to raise funds in order to carry out its business. Mining operations, exploration and development involve significant financial risk and capital investment. The operations and expansion plans for the Company may also result in increases in capital expenditures and commitments. The Company may require additional funding to expand its business and may require additional capital in the future for, among other things, the development of the Bau Gold Project which is currently the subject of a feasibility study targeting production commencing in 2015, or the development of other deposits or additional processing capacity at the Company’s Phuoc Son or Bong Mieu projects. No assurance can be given that such capital will be available at all or available on terms acceptable to the Company. The Company may be required to seek funding from third parties if internally generated cash resources and available credit facilities are insufficient to finance these activities. In the event that the Company was unable to obtain adequate financing on acceptable terms, or at all, to satisfy its operating, development and expansion plans, its business and results of operations may be materially and adversely affected. The success and the pricing of any such capital raising and/or debt financing will be dependent upon the prevailing market conditions at that time, the availability of funds from lenders and other factors relating to the Company’s properties and operations.
The Company has debt and may be unable to service or refinance its debt, which could have negative consequences on the Company’s business, could adversely affect its ability to fulfill its obligations under its debt and may place the Company at a competitive disadvantage in its industry. In the first half of 2010 and 2011, the Company incurred indebtedness by way of convertible unsecured notes (“Convertible Notes”) and by way of secured redeemable gold delivery promissory notes (“Gold Loan Notes”). The existence of this debt could have negative consequences for the Company. For example, it could:
| · | increase the Company’s vulnerability to adverse industry and general economic conditions; |
| · | require the Company to dedicate a material portion of cash flow from operations to make scheduled principal or interest payments on the debt, thereby reducing the availability of its cash flow for working capital, capital investments and other business activities; |
| · | limit the Company’s ability to obtain additional financing to fund future working capital, capital investments and other business activities; |
| · | limit the Company’s flexibility to plan for, and react to, changes in its business and industry; and |
| · | place the Company at a competitive disadvantage relative to less leveraged competitors. |
Servicing the Company’s debt requires an allocation of cash and the Company’s ability to generate cash flow may be adversely affected by factors beyond its control. The Company’s business may not generate cash flow in an amount sufficient to enable it to pay the principal of, or interest on, its indebtedness or to fund other liquidity needs, including working capital, capital expenditures, project development efforts, strategic acquisitions, investments and alliances and other general corporate requirements. The Company’s ability to generate cash is subject to general economic, financial, competitive, legislative, regulatory and other factors that are beyond its control. As such, the Company is faced with the risk that (i) the Company’s business will generate insufficient cash flow from operations or (ii) future sources of funding will not be available to the Company in amounts sufficient to enable it to fund its capital needs.
6
If the Company cannot fund its capital needs, it will have to take actions such as reducing or delaying capital expenditures, project development efforts, strategic acquisitions, investments and alliances; selling assets; restructuring or refinancing its debt; or seeking additional equity capital. The Company cannot provide assurance that any of these measures could, if necessary, be effected on commercially reasonable terms, or at all, or that they would permit the Company to meet its scheduled debt service obligations.
Restrictive covenants in the agreements governing the Company’s indebtedness restrict its ability to operate its business. The documentation governing the Convertible Notes and the Gold Loan Notes contain covenants that restrict the Company’s ability to, among other things, incur additional debt, pay dividends, make investments, enter into transactions with affiliates, merge or consolidate with other entities or sell all or substantially all of the Company’s assets. A breach of any of these covenants could result in a default thereunder, which could allow the noteholders or their representative to increase the interest rate payable and/or declare all amounts outstanding thereunder immediately due and payable. If the Company is unable to repay outstanding borrowings when due, the lenders and the collateral agent under the Gold Loan Notes and related agreements have the right to proceed against the collateral granted thereunder, including the shares in the Company’s subsidiary holding companies which control the Bong Mieu and Phuoc Son projects and the loans owed to the Company by BMGMC and PSGC. The Company may also be prevented from taking advantage of business opportunities that arise because of the limitations imposed on it by the restrictive covenants under its indebtedness.
The Company has entered into certain derivative arrangements which may not obtain their intended result. The Company’s Convertible Notes and Gold Loan Notes contain embedded derivative instruments. The use of such instruments involves certain inherent risks including credit risk, market liquidity risk and unrealized mark-to-market risk. Initially, the Company does not have any other hedging agreements in place but may enter into additional contracts from time to time. While hedging activities may protect the Company in certain circumstances, they may also cause it to be unable to take advantage of fluctuating market prices, and no assurances are given as to the effectiveness of the Company’s current or future hedging policies.
The Company will not be able to insure against all possible risks. Exploration for natural resources involves many risks, which even a combination of experience, knowledge and careful evaluation may not be able to overcome. The Company’s business is subject to a number of risks and hazards generally, including adverse environmental conditions, industrial accidents, labor disputes, unusual or unexpected geological conditions, ground or slope failures, cave-ins, changes in the regulatory environment and natural phenomena such as inclement weather conditions, floods and earthquakes. Such occurrences could result in damage to mineral properties or production facilities, personal injury or death, environmental damage to the Company’s properties or the properties of others, delays, monetary losses and possible legal liability. If any such catastrophic event occurs, investors could lose their entire investment. Obtained insurance will not cover all the potential risks associated with the activities of the Company. Moreover, the Company may also be unable to maintain insurance to cover these risks at economically feasible premiums. Insurance coverage may not continue to be available or may not be adequate to cover any resulting liability. Moreover, insurance against risks such as environmental pollution, political risk or other hazards as a result of exploration and production is not generally available to the Company or to other companies in the mining industry on acceptable terms. The Company might also become subject to liability for pollution or other hazards which may not be insured against or which the Company may elect not to insure against because of premium costs or other reasons. Losses from these events may cause the Company to incur significant costs that could have a material adverse effect upon its financial performance and results of operations. Should a catastrophic event arise, investors could lose their entire investment.
7
The Company is subject to commodity price fluctuations. If the price of gold declines, the Company’s properties may not be economically viable. The Company’s revenues are, and are expected to be for the foreseeable future in large part derived from the extraction and sale of precious metals, particularly gold. The price of those commodities has fluctuated widely, particularly in recent years, and is affected by numerous factors beyond the Company’s control including international, economic and political trends, expectations of inflation, currency exchange fluctuations, interest rates, global or regional consumptive patterns, speculative activities and increased production due to new or improved mining and production methods. The effect of these factors on the price of base and precious metals cannot be predicted and the combination of these factors may result in the Company not receiving adequate returns on invested capital or the investments retaining their respective values. If the price of gold (including other base and precious metals) is below the cost to produce gold, the properties will not be mined at a profit. Fluctuations in the gold price affect the Company’s reserve estimates, its ability to obtain financing and its financial condition as well as requiring reassessments of feasibility and operational requirements of a project. Reassessments may cause substantial delays or interrupt operations until the reassessment is finished.
The Company may not be able to compete with other mining companies for mineral properties, financing, personnel and technical expertise. The resource industry is intensely competitive in all of its phases, and the Company competes for mineral properties, financing, personnel and technical expertise with many companies possessing greater financial resources and technical facilities than it does. Competition could prevent the Company from conducting its business activities or prevent profitability of existing or future properties or operations if the Company were unable to obtain suitable properties for exploration in the future, secure financing for its operations or attract and retain mining experts. The Company’s inability to effectively compete could substantially impair its results of operations.
If the Company does not comply with all applicable regulations, it may be forced to halt its business activities. The activities the Company engages in are subject to various laws in the different jurisdictions in which the Company operates governing, among other matters, land use, the protection of the environment, production, exports, taxes, labor standards, occupational health, waste disposal, toxic substances and mine safety. The Company may not be able to obtain all necessary licenses and permits required to carry out the exploration, development or mining of the projects. Unfavorable amendments and/or back-dating of changes to current laws, regulations and permits governing operations and activities of resource exploration companies, or more stringent implementation thereof, could have a material adverse impact on the Company and cause increases in capital expenditures which could result in a cessation of operations by the Company. Failure to comply with applicable laws and regulations may result in enforcement actions thereunder, including orders issued by regulatory or judicial authorities causing operations to cease or be curtailed, and may include corrective measures requiring capital expenditures, installation of additional equipment or remedial actions. The Company may be required to compensate those suffering loss or damage by reason of the mining activities and may have civil or criminal fines or penalties imposed for violation of applicable laws or regulations. Large increases in capital expenditures resulting from any of the above factors could force the Company to cease business activities which could cause investors to lose their investment.
Non-compliance with environmental regulation may hurt the Company’s ability to perform its business activities. The Company’s operations are subject to environmental regulation in the jurisdiction in which it operates. Environmental legislation is still evolving in these jurisdictions and it is expected to evolve in a manner which may require stricter standards and enforcement, increased fines and penalties for non-compliance, more stringent environmental assessments of proposed projects and a heightened degree of responsibility for companies and their officers, directors and employees. If there are future changes in environmental regulation, or changes in its interpretations, possibly backdated, they could impede the Company’s current and future business activities and negatively impact the profitability of operations.
8
Land reclamation requirements for exploration properties may be burdensome and may divert funds from the Company’s exploration programs. Although variable, depending on location and the governing authority, land reclamation requirements are generally imposed on mineral exploration companies, as well as companies with mining operations, in order to minimize long term effects of land disturbance. Reclamation may include requirements to control dispersion of potentially deleterious effluents and to reasonably re-establish pre-disturbance land forms and vegetation. In order to carry out reclamation obligations imposed on the Company in connection with its mineral exploration, the Company must allocate financial resources that might otherwise be spent on further exploration programs.
Mining operations and projects are vulnerable to supply chain disruption and the Company’s operations and development projects could be adversely affected by shortages of, as well as lead times to deliver, strategic spares, critical consumables, mining equipment or metallurgical plant. The Company’s operations and development projects could be adversely affected by shortages of, as well as lead times to deliver, strategic spares, critical consumables, mining equipment and metallurgical plant. In the past, the Company and other gold mining companies have experienced shortages in critical consumables, particularly as production capacity in the global mining industry has expanded in response to increased demand for commodities, and it has experienced increased delivery times for these items. These shortages have also resulted in unanticipated increases in the price of certain of these items. Shortages of strategic spares, critical consumables, mining equipment or metallurgical plant, which could occur in the future, could result in production delays and production shortfalls, and increases in prices result in an increase in both operating costs and the capital expenditure to maintain and develop mining operations.
The Company and other gold mining companies, individually, have limited influence over manufacturers and suppliers of these items. In certain cases there are only limited suppliers for certain strategic spares, critical consumables, mining equipment or metallurgical plant who command superior bargaining power relative to the Company, or it could at times face limited supply or increased lead time in the delivery of such items.
If the Company experiences shortages, or increased lead times in delivery of strategic spares, critical consumables, mining equipment or processing plant, its results of operations and financial condition could be adversely affected.
If the Company is unable to obtain and keep in good standing certain licenses and permits, it will be unable to explore, develop or mine any of its property interests. The current and future operations of the Company require licenses and permits from various governmental authorities and such operations are and will be subject to laws and regulations governing prospecting, development, mining, production, exports, taxes, labor standards, occupational health, waste disposal, toxic substances, use of explosives, land use, surface rights, environmental protection, safety and other matters, and are dependent upon the grant, or as the case may be, the maintenance of appropriate licenses, concessions, leases, permits and regulatory consents which may be withdrawn or made subject to limitations. The maintaining of tenements, obtaining renewals, or getting tenements granted, often depends on the Company being successful in obtaining required statutory approvals for its proposed activities and that the licenses, concessions, leases, permits or consents it holds will be renewed as and when required. There is no assurance that such renewals will be given as a matter of course and there is no assurance that new conditions will not be imposed in connection therewith. There can be no assurance that the Company will be able to obtain or maintain all necessary licenses or permits that may be required to commence construction, development or operation of mining facilities at these properties on terms which enable operations to be conducted at economically justifiable costs.
9
If the Company does not make certain payments or fulfill other contractual obligations, it may lose its option rights and interests in its joint ventures. There is a risk that the Company may be unable to meet its share of costs incurred under any option or joint venture agreements to which it is presently or becomes a party in the future and the Company may have its interest in the properties subject to such agreements reduced as a result. Furthermore, if other parties to such agreements do not meet their share of such costs, the Company may be unable to finance the cost required to complete recommended programs. The loss of any option rights or interest in joint ventures on properties material to the Company could have a material adverse effect on the Company.
Title to the Company’s assets can be challenged or impugned, which could prevent the Company from exploring, developing or operating at any of its properties. There is no guarantee that title to concessions will not be challenged or impugned to the detriment of the Company. In Malaysia, Vietnam and the Philippines, the system for recording title to the rights to explore, develop and mine natural resources is such that a title opinion provides only minimal comfort that the holder has title. For example, in Vietnam, mining laws are in a state of flux, continuously being reviewed and updated, and the system is new and as yet untested. If title to assets is challenged or impugned, the Company may not be able to explore, develop or operate its properties as permitted or enforce its rights with respect to the properties.
Political and economic instability in the jurisdictions in which the Company operates could make it more difficult or impossible for the Company to conduct its business activities. The Company’s exploration, development and operation activities occur in Malaysia, Vietnam, the Philippines and Australia. As such, the Company may be affected by possible political or economic instability in those countries. The risks include, but are not limited to, terrorism, military repression, fluctuations in currency exchange rates and high rates of inflation. Changes in resource development or investment policies or shifts in political attitude in those countries may prevent or hinder the Company’s business activities and render its properties unprofitable by preventing or impeding future property exploration, development or mining. Operations may be affected in varying degrees by government regulations with respect to restrictions on production, price controls, export controls, restrictions on repatriation of earnings, royalties and duties, income taxes, nationalization of properties or businesses, expropriation of property, maintenance of claims, environmental legislation, land use, land claims of local people, water use and mine safety. The laws on foreign investment and mining are still evolving in Vietnam and it is not known how they will evolve. The effect of these factors cannot be accurately predicted. There may be risks in Malaysia and the Philippines including nationality restriction in the ownership of mining properties regarding the payment of permitting fees and obtaining the free, prior and informed consent of affected indigenous peoples.
Vietnamese tax laws are open to interpretation and, with respect to mining and refining, there are no clear precedents to properly guide the Company’s tax policies. Management considers that the Company has made adequate provision for tax liabilities to the Vietnamese national, provincial and local authorities based on correspondence with such authorities, and on external advice received. However, because Vietnam’s tax laws, especially with respect to mining and refining, are evolving and open to interpretation, there is a risk that material additional and/or back-dated taxes and penalties may be levied on the Company, which could adversely impact its results of operations.
Exchange rate and interest rate fluctuations may increase the Company’s costs. The profitability of the Company may decrease when affected by fluctuations in the foreign currency exchange rates between the United States Dollar and the Canadian Dollar, Malaysian Ringgit, Vietnamese Dong, Philippines Peso and Australian Dollar. Exchange rate fluctuations affect the costs of exploration and development activities that the Company incurs in United States dollar terms. The Company does not currently take any steps to hedge against currency fluctuations. In the event of interest rates rising, the liabilities of the Company that are tied to market interest rates would increase the Company’s borrowing costs.
10
The Company’s stock price could be volatile. The market price of the Company’s common shares, like that of the common shares of many other natural resource companies, has been and is likely to remain volatile. Results of exploration and mining activities, the price of gold and silver, future operating results, changes in estimates of the Company’s performance by securities analysts, market conditions for natural resource shares in general, and other factors beyond the control of the Company, could cause a significant decline in the market price of the Company’s common shares and results in the need to revalue derivative liabilities.
In the US, the Company’s common shares are “Penny Stock” which imposes significant restrictions on broker-dealers recommending the stock for purchase. Securities and Exchange Commission (“SEC”) regulations define "penny stock" to include common stock that has a market price of less than $5.00 per share, subject to certain exceptions. These regulations include the following requirements: broker-dealers must deliver, prior to the transaction, a disclosure schedule prepared by the SEC relating to the penny stock market; broker-dealers must disclose the commissions payable to the broker-dealer and its registered representative; broker-dealers must disclose current quotations for the securities; if a broker-dealer is the sole market-maker, the broker-dealer must disclose this fact and the broker-dealers presumed control over the market; and a broker-dealer must furnish its customers with monthly statements disclosing recent price information for all penny stocks held in the customer’s account and information on the limited market in penny stocks. Additional sales practice requirements are imposed on broker-dealers who sell penny stocks to persons other than established customers and accredited investors. For these types of transactions, the broker-dealer must make a special suitability determination for the purchaser and must have received the purchaser’s written consent to the transaction prior to sale. For so long as the Company’s common shares are subject to these penny stock rules, these disclosure requirements may have the effect of reducing the level of trading activity in the secondary market for the shares. Accordingly, this may result in a lack of liquidity in the common shares and investors may be unable to sell their shares at prices considered reasonable by them.
The Company may not be able to comply with the requirements of Section 404 of the Sarbanes-Oxley Act. Section 404 of the Sarbanes-Oxley Act of 2002 (‘‘SOX’’) requires an annual assessment by management of the effectiveness of the Company’s internal control over financial reporting. Section 404 of SOX also requires an annual attestation report by the Company’s independent auditors addressing the effectiveness of the Company’s internal control over financial reporting. The Company has completed its Section 404 assessment and received the auditors’ attestation as of June 30, 2012.
If the Company fails to maintain the adequacy of its internal control over financial reporting, as such standards are modified, supplemented or amended from time to time, the Company may not be able to conclude that it has effective internal control over financial reporting in accordance with Section 404 of SOX. The Company’s failure to satisfy the requirements of Section 404 of SOX on an ongoing, timely basis could result in the loss of investor confidence in the reliability of its financial statements, which in turn could harm the Company’s business and negatively impact the trading price of its common shares and securities convertible or exchangeable for common shares. In addition, any failure to implement required new or improved controls, or difficulties encountered in their implementation, could harm the Company’s operating results or cause it to fail to meet its reporting obligations. Future acquisitions of companies may provide the Company with challenges in implementing the required processes, procedures and controls in its acquired operations. Acquired companies may not have disclosure controls and procedures or internal control over financial reporting that are as thorough or effective as those required by securities laws currently applicable to the Company. No evaluation can provide complete assurance that the Company’s internal control over financial reporting will prevent misstatement due to error or fraud or will detect or uncover all control issues or instances of fraud, if any. The effectiveness of the Company’s controls and procedures could also be limited by simple errors or faulty judgments. In addition, as the Company continues to expand, the challenges involved in maintaining adequate internal control over financial reporting will increase and will require that the Company continue to improve its internal control over financial reporting. Although the Company intends to devote substantial time and incur substantial costs, as necessary, to ensure ongoing compliance, the Company cannot be certain that it will be successful in continuing to comply with Section 404 of SOX.
11
The Company does not plan to pay any dividends in the foreseeable future. The Company has not paid a dividend in the past and it is unlikely that the Company will declare or pay a dividend for the foreseeable future. The declaration, amount and date of distribution of any dividends in the future will be decided by the Board of Directors from time-to-time, based upon, and subject to, the Company’s earnings, financial requirements, loan covenants and other conditions prevailing at the time.
Shareholders could suffer dilution of the value of their investment if the Company issues additional shares. There are a number of outstanding securities and agreements pursuant to which common shares may be issued in the future, including pursuant to the Convertible Notes, stock options and warrants. If these shares are issued, this may result in further dilution to the Company’s shareholders.
In the event that key employees leave the Company or its subsidiaries, the Company would be harmed since it is heavily dependent upon them for all aspects of the Company’s activities. The Company is dependent on key employees and contractors, and on a relatively small number of key directors and officers, the loss of any of whom could have, in the short-term, a negative impact on the Company’s business and results of operations. The Company has a consulting agreement or employment agreement, as applicable, with each of the Company’s officers.
Management may be subject to conflicts of interest due to their affiliations with other resource companies. Because some of the Company directors and officers have private mining interests and also serve as officers and/or directors of other public mining companies, their personal interests may be in conflict with the interests of the Company. Because of their activities, situations may arise where these persons are presented with mining opportunities, which may be desirable for the Company, as well as other companies in which they have an interest, to pursue. If the Company is unable to pursue such opportunities because of its officers’ and/or directors’ conflicts, this would reduce the Company’s opportunities to increase its future profitability and revenues. In addition to competition for suitable mining opportunities, the Company competes with these other companies for investment capital, and technical resources, including geologists, metallurgists, mining engineers and others. Similarly, if the Company is unable to obtain necessary investment capital and technical resources because of its officers’ and directors’ conflicts, the Company would not be able to obtain potential profitable properties or interests which would reduce the Company’s opportunities to increase its future revenues and income. Any material potential conflicts of interest is directed to the Company’s board of directors and is resolved on a case by case basis in accordance with applicable Canadian law. In addition, each of the directors is required to declare and refrain from voting on any matter in which such directors may have a conflict of interest in accordance with the procedures set forth in applicable laws. Nevertheless, potential conflicts of interests could deny the Company access to important corporate opportunities.
Future sales of common shares by existing shareholders could decrease the trading price of the common shares. Sales of large quantities of the common shares in the public markets or the potential of such sales could decrease the trading price of the common shares and could impair the Company’s ability to raise capital through future sales of common shares.
12
The profitability of the Company’s operations and the cash flow generated by these operations are significantly affected by fluctuations in input production prices, many of which are linked to the prices of oil and steel. Fuel, energy and consumables, including diesel, heavy fuel oil, chemical reagents, explosives, tires, steel and mining equipment consumed in mining operations form a relatively large part of the operating costs and/or capital expenditures of any mining company. The Company has no influence over the cost of these consumables, many of which are linked to some degree to the price of oil and steel.
The price of oil has recently been volatile. The Company’s mines at Bong Mieu and Phuoc Son are most vulnerable to changes in the price of oil. Furthermore, the price of steel which is used in the manufacture of most forms of fixed and mobile mining equipment is also a relatively large contributor to the operating costs and capital expenditure of a mining company and has also been volatile recently.
Fluctuations in the price of oil and steel have a significant impact upon operating cost and capital expenditure estimates and, in the absence of other economic fluctuations, could result in significant changes in the total expenditure estimates for new mining projects or render certain projects not viable.
Inflation may have a material adverse effect on the Company’s operational results. Most of the Company’s operations are located in countries that have experienced high rates of inflation during certain periods. Since the Company is unable to influence the market price at which it sells gold, it is possible that significantly higher future inflation in the countries in which the Company operates may result in an increase in future operational costs in local currencies without a concurrent devaluation of the local currency of operations against the dollar or an increase in the dollar price of gold. This could have a material adverse effect upon the Company’s results of operations and its financial condition. Significantly higher and sustained inflation in the future, with a consequent increase in operational costs, could result in operations being reduced or rationalized at higher cost mines.
Mining companies such as the Company are increasingly required to consider and ensure the sustainable development of, and provide benefits to, the communities and countries in which they operate. As a result of public concern about the perceived ill effects of economic globalization, businesses generally and multinational corporations such as the Company face increasing public scrutiny of their activities. These businesses are under pressure to demonstrate that, as they seek to generate satisfactory returns on investment to shareholders, other stakeholders, including employees, communities surrounding operations and the countries in which they operate, benefit and will continue to benefit from their commercial activities. Such pressure tends to be particularly focused on companies whose activities are perceived to have a high impact on their social and physical environment. The Company’s failure to adequately perceive and address these pressures could lead to reputational damage, legal suits and social spending obligations.
In addition, the location of mining operations often coincides with the location of existing towns and villages, natural water courses and other infrastructure. Mining operations must therefore be designed to minimize their impact on such communities and the environment, either by changing mining plans to avoid any such impact, modifying mining plans and operations, or relocating the relevant people to an agreed location. These measures may include agreed levels of compensation for any adverse impact the mining operation may continue to have upon the community. The Company is subject to the above factors at its mining and exploration sites. The cost of these measures could increase capital and operating costs and therefore could have an adverse impact upon the Company’s results of operations.
13
ITEM 4: INFORMATION ON THE COMPANY
4A. History and Development of the Company
Olympus Pacific Minerals Inc. was formed under the laws of the Province of Ontario, Canada on July 4, 1951 under the name “Meta Uranium Mines Limited”. Effective August 24, 1978, the Company changed its name from “Meta Uranium Mines Limited” to “Metina Developments Inc.” The Company reincorporated under the Company Act (British Columbia) under the name “Olympus Holdings Ltd.” on November 5, 1992 and simultaneously consolidated its share capital on a 4.5:1 basis. The Company further consolidated its share capital on a 3:1 basis and changed its name from “Olympus Holdings Ltd.” to “Olympus Pacific Minerals Inc.” on November 29, 1996. The Company was continued under the Business Corporations Act (Yukon) on November 17, 1997 and the Canada Business Corporations Act on July 13, 2006.
Operations in Vietnam
On February 26, 1997, as subsequently amended on August 18, 1997, the Company entered into an agreement with Ivanhoe Mines Limited (formerly Indochina Goldfields Ltd., “Ivanhoe”) and Zedex Ltd. (formerly Iddison Group Vietnam Limited, Iddison Holdings Limited, Iddison Limited and IT Capital Limited, with the agreement being referred to herein as the “Ivanhoe Agreement”). Pursuant to the Ivanhoe Agreement, which closed on September 11, 1997, the Company acquired from Ivanhoe all of the shares of Formwell Holdings Limited (“Formwell”), which holds 100% of the shares of Bong Mieu Holdings Limited, which in turn holds 80% of the shares of Bong Mieu Gold Mining Company Limited (“Bogomin”). Bogomin, together with then local and national branches of the government of the Socialist Republic of Vietnam, holds various mining and exploration licenses comprising the Bong Mieu gold property in Quang Nam-Da Nang Province in the Socialist Republic of Vietnam. Refer to Item 4D for further details on the Bong Mieu Gold Property.
Also in September 1997, the Company acquired an interest in the Phuoc Son Gold Property by entering into a joint venture agreement with Ivanhoe and Zedex Ltd., regarding a joint venture company, New Vietnam Mining Corporation (“NVMC”), which holds an 85% interest in the Phuoc Son Gold Property. Initially, NVMC was comprised of the Company (57.18%), Ivanhoe (32.64%) and Zedex Ltd. (10.18%) with the Company as the operator of the project.
In 2003, NVMC, entered into a joint venture agreement with Mien Trung Industrial Company (“MINCO”), a mining company then controlled by the local provincial government, resulting in the formation of the Phuoc Son Gold Company Limited (“PSGC”) for the purposes of exploration and extraction activities and any other related activities.
On March 1, 2004, the Company entered into a Vend-in Agreement and, on June 21, 2004, an Extension of Vend-in Agreement, with Ivanhoe and Zedex Ltd. (the “Vendors”) to acquire the remaining 42.82% interest held by the Vendors in NVMC. The sale was concluded in June 2004, resulting in the Company owning 100% of NVMC, which owns 85% of PSGC. MINCO currently owns 15% of PSGC. Refer to Item 4D for further details on the Phuoc Son Gold Property.
The Company commenced production at the Bong Mieu Gold Property with the construction of the Bong Mieu Central Gold Mine (Ho Gan) which was completed in 2006. The Bong Mieu Underground project was subsequently placed into commercial production on April 1, 2009.
Following the receipt by the Company on March 26, 2008 of a positive independent feasibility study, the Company determined to construct a plant at the Phuoc Son Gold Property. The Company partially funded the plant construction by the treatment of high-grade ore from Phuoc Son’s Dak Sa deposit at the Bong Mieu gold processing plant on a toll treatment basis.
14
In March 2010, the Company obtained private placement funding of CAD$12,750,000. The net funds were used towards the establishment of the Phuoc Son processing plant. The financing was in the form of nine percent unsecured convertible promissory notes which mature on March 26, 2014. The holders are entitled to convert the notes and any accrued interest owing at a conversion rate of CAD$0.42 per common share.
In June 2010, the Company obtained further private placement funding of US$21,960,000. The net proceeds also were used towards the construction of the Phuoc Son processing plant and for general exploration and corporate purposes. The financing was in the form of gold delivery notes which mature on May 31, 2013, bear interest at a rate of eight percent and obligate the Company to physically deliver gold in six semi-annual increments of which two deliveries remain.
The Phuoc Son gold plant was commissioned in June 2011, has been in commercial production since July 1, 2011 and achieved full scale processing in the fourth quarter, 2011 processing order from the South Deposit (Bai Dat) at the Dak Sa area. Commercial production from the North Deposit (Bai Go) at the Dak Sa area commenced in July 2012. The principal capital expenditures relating to the new Phuoc Son plant include infrastructure, machinery and equipment and buildings, which total $27M.
Effective January 1, 2011, the Vietnamese government imposed a 10% gold export tax. As a result, the Company refines all gold from the Company’s Vietnam mines in Vietnam to 99.99 gold, pursuant to an agreement with a local Vietnamese refinery, which enables the Company to export gold from Vietnam without incurring the export tax.
Operations in Malaysia
The Company’s initial interest in North Borneo Gold Sdn Bhd (a Malaysian company, hereinafter referred to as “NBG”) came about as a result of the Company’s amalgamation with Zedex Minerals Limited (“Zedex”) on January 12, 2010. NBG is governed by a joint venture agreement between the Company and a local Malaysian company and is the operator of the Bau Gold Project.
The Bau Gold Project comprises consolidated mining and exploration tenements that collectively cover more than 1,340 km2 of the most highly-prospective ground within the historic Bau Goldfield, in Sarawak, East Malaysia. This goldfield has been operating since 1864, with estimated historic gold production of approximately 3-4 million oz. gold of which approximately two million oz. of gold production has been recorded.
On September 30, 2010 (as amended on May 20, 2011 and further amended on January 20, 2012), the Company entered into an agreement to acquire a further 43.50% interest in NBG. The settlement is to be paid in several tranches as set out below and will bring the Company’s effective interest to 93.55% by January 2014.
15
Purchase Price | Purchase Date | North Borneo Gold Sdn Bhd Class A Shares | Company's Effective Holding | ||||||||||
| Tranche 1 | $ | 7,500,000 | 9/30/2010 | 31,250 | 62.55 | % | |||||||
| Tranche 2 | $ | 7,500,000 | 10/30/2010 | 31,250 | 75.05 | % | |||||||
| Tranche 3a | $ | 6,000,000 | 5/20/2011 | 13,700 | 80.53 | % | |||||||
| Tranche 3b | $ | 3,000,000 | 1/20/2012 | 6,800 | 83.25 | % | |||||||
| Tranche 3c | $ | 2,000,000 | 1/28/2013 | 4,500 | 85.05 | % | |||||||
| Tranche 4a | $ | 3,000,000 | 9/13/2013 | 7,000 | 87.85 | % | |||||||
| Tranche 4b | $ | 6,000,000 | 1/21/2014 | 14,250 | 93.55 | % | |||||||
| 108,750 | 93.55 | % | |||||||||||
In September 2011, the Company moved the Bau project into feasibility phase with the objective of a favourable development decision targeting stage one production commencing in 2015. The feasibility study is focussed on initial development of the Jugan deposit, a near surface gold deposit that outcrops as a low hill towards the northeast end of the Bau Central gold trend. Exploration, mining feasibility and environmental studies are now in progress to further expand the resource base, determine the best development route and examine the issues involved in developing multiple deposits in a sequential manner.
In addition, in 2011, upgraded sample processing facilities and an independent on-site assay laboratory were established.
During 2012, work on the feasibility study progressed, particularly with respect to metallurgical testing. The feasibility study is expected to be completed during 2013.
Operations in the Philippines
The Company operates in the Philippines through KMC, a Philippine corporation registered with the Republic of the Philippines Securities and Exchange Commission on May 31, 2007. KMC is 100% beneficially owned by the Company. Kadabra will hold the Company’s interest in its Philippines operations.
On September 30, 2011, the Company entered into formal joint venture agreement (the “Capcapo Joint Venture Agreement”) with Abra Mining & Industrial Corporation(“AMIC”), Jabel Corporation (“Jabel”), Kadabra Mining Corporation (a wholly-owned subsidiary of the Company) (“KMC”), and PhilEarth Mining Corporation (a Company in the process of incorporation and in which the Company will hold a 40% interest, hereinafter referred to as “PhilEarth”) in respect of the Capcapo Gold Property, Northern Philippines.
Pursuant to the terms of the Capcapo Joint Venture Agreement, the Company, in consortium with PhilEarth, has an option to acquire up to a 60% interest in the Capcapo Gold Project, Northern Philippines, subject to compliance with Philippine foreign ownership laws. Olympus paid to AMIC $300,000 upon the signing of the joint venture agreement, is required to pay a further $400,000 upon gaining unencumbered access to the property and may fully exercise its option over three stages of expenditure as follows:
16
| STAGE | EXPECTED EXPENDITURES USD | PAYMENT DUE UPON COMPLETION OF THE STAGE USD | ||||||
| Stage 1 | 1,000,000 | 400,000 | ||||||
| Stage 2 | 2,000,000 | 400,000 | ||||||
| Stage 3 | 4,000,000 | N/A | ||||||
In addition, Jabel will be paid a royalty based on the calculation that yields the highest payment; either 3% of the gross value of production from the Capcapo Gold Property or 6% of the annual profit of the joint venture corporation.
Finally, Olympus is also obligated to make milestone payments each time a specified milestone is achieved in respect of the property. A specified milestone occurs at the earlier of defining a cumulative mineral reserve of 2,000,000 ounces of gold and gold equivalents for the property, or upon achievement of a consistent production rate of 2,000 tonnes per day. Accordingly, achieving one milestone does not trigger the obligation to make a subsequent milestone payment if the alternative milestone has already been achieved. The milestone payment to AMIC consists of a payment of $2,000,000 and the issuance of 2,000,000 common shares of the Company or common shares having a market value of $5,000,000, whichever is of lesser value.
The Capcapo Gold Property consists of a Mineral Production Sharing Agreement No. 144-99-CAR (“MPSA 144”), which covers 756 hectares in Capcapo, Licuan-Baay, Abra Province, Philippines, and a two-kilometre radius buffer zone around MPSA 144, with an area of about 3,500 hectares, which formed the subject of a renewal Exploration Permit Application (“EXPA”) filed by Jabel.
The Capcapo Joint Venture Agreement replaced a Memorandum of Agreement and Supplement to Memorandum of Agreement dated November 23, 2006 among the Company, AMIC and Jabel.
The Company is in the process of co-ordinating a community consultation program in accordance with Philippine laws as part of a formal program of obtaining the Free, Prior and Informed Consent of affected indigenous peoples in the area, undertaken in conjunction with the National Commission on Indigenous Peoples. All efforts in the Capcapo area have concentrated on obtaining community approval which is required before any further exploration can continue. No further work will be undertaken at the project until this issue is resolved.
Total cumulative spending on this project as at December 31, 2008 was $865,779 which was capitalized to deferred exploration. As at December 31, 2008 the full $865,779 of capitalized deferred exploration expenditure was written off. Management considered this to be a prudent measure given the delays in recommencing exploration activity and the economic uncertainty of world markets at the time. Refer to Item 3D for a list of risk factors. Spending on this project was minimal in 2009 and 2010 and has been expensed. In 2011, exploration expenditure of $561,839 was expensed due to the fact that the Company does not yet have unencumbered access to the property. A further $252,965 was expensed during the six-month transition year ended June 30, 2012, primarily towards a community consultation program for which KMC retained a consultant.
Future spending on the property will be expensed until such time as the Company gains unencumbered access to the Capcapo Gold Property at which point it will be capitalized.
17
Operations in Laos and Cambodia
The Company continues to investigate prospective areas in Laos and Cambodia, but to date no formal agreements have eventuated.
Other Historical Matters
On April 3, 2006, the Company’s common shares commenced trading on the Toronto Stock Exchange (the “TSX”) in Canada under the symbol “OYM”. On March 6, 2008, the Company’s common shares commenced trading on the OTC Bulletin Board in the United States under the symbol “OLYMF”. Effective February 5, 2010, the Company’s shares commenced trading on the Australian Securities Exchange under the symbol “OYM”. The Company’s common shares were delisted from the OTC Bulletin Board and began trading on the OTCQX effective October 31, 2011 under the symbol “OLYMF”.
On November 10, 2009, the Company announced its intention to merge with Zedex. On January 12, 2010, the Company and Zedex amalgamated. Under the terms of the merger, Zedex’s shareholders received one share of the Company for every 2.4 Zedex shares owned, resulting in an issuance on January 25, 2010 of 54,226,405 new common shares in Olympus and the distribution to holders of Zedex shares, on a prorata basis, of the 65,551,043 common shares of Olympus owned by Zedex. Mr. Leslie Robinson, director of Zedex, was appointed to the Board of Olympus. Mr. Rodney Murfitt, formerly Chief Geologist for Zedex, became Group Exploration Manager for Olympus. Mr. Paul Seton, formerly CEO of Zedex, became Senior Vice President, Commercial for Olympus. Ms. Jane Bell (previously Baxter), formerly CFO and Company Secretary for Zedex, became Vice President, Finance for Olympus. All costs associated with the amalgamation were expensed during the 2009 fiscal year, these being recorded in professional and consulting fees in the consolidated statement of operations and comprehensive loss.
In March of 2010 and June of 2010, the Company issued convertible notes and gold loan notes, respectively, as discussed above.
In October 2010, the Company issued 37,000,000 common shares at AUD$0.45 per share, for gross proceeds of $16,291,697 and net proceeds of $15,548,141. Agents for the private placement were paid a cash commission of 5% of the gross proceeds of the placement.
On March 29, 2011, the Company completed an AUD$5.6 million private placement. The private placement was for 14,000,000 common shares to be held in the form of CHESS Depository Interests (“CDI”) at a price of AUD$0.40 per CDI. Olympus paid a capital-raising fee of 5% to Patersons Securities Limited, the lead manager for the placement.
On May 6, 2011, the Company closed a private placement financing of US$14.6 million of four-year 8% unsecured and redeemable notes convertible into common shares at US$0.51 per common share (the “2011 Notes”) and including warrants exercisable to acquire common shares at CAD$0.55 based on a one share and one-half warrant equivalent structure.
A similar private placement of CAD$15 million of 8% unsecured and redeemable notes convertible at CAD$0.50 per common share and including warrants exercisable to acquire common shares at CAD$0.55 closed May 5, 2011. Euro Pacific Capital Inc. acted as the exclusive sole placement agent on both private placements. Proceeds of both private placements provided Olympus with the necessary funds to advance its development, exploration, and acquisition plans in Vietnam, Malaysia, and the Philippines.
18
The Company’s registered and records office is located at Suite 500, 10 King Street East, Toronto, Ontario, M5C 1C3, Canada. Its telephone number is (416) 572-2525.
Capital Expenditures
The table below shows the historical capital balances, in United States dollars:
Capital Assets, Advances on Capital Assets, Mine Properties and Deferred Exploration and Development Costs | ||||
| As at December 31, 2010 | 102,934,415 | |||
| As at December 31, 2011 | 115,571,472 | |||
| As at June 30, 2012 | 102,204,591 | |||
Amalgamation with Zedex
On January 12, 2010, the Company and Zedex amalgamated. Total consideration for the amalgamation amounted to US$15,206,478. The purchase consideration was settled by way of share issue effective January 25, 2010.
The properties acquired as a result of the Zedex amalgamation were the Bau Property in East Malaysia, the Tien Thuan Property in Central Vietnam and the GR Enmore Property in New South Wales, Australia.
The purchase consideration was allocated as follows:
| USD | ||||
| Current assets | ||||
| Cash | 45,643 | |||
| Accounts receivable and prepaid expenses | 158,997 | |||
| Non-current assets | ||||
| Property, plant and equipment | 86,759 | |||
| Mineral properties | 33,159,770 | |||
| Current liabilities | ||||
| Accounts payable and accrued liabilities | (1,626,168 | ) | ||
| Non-current liabilities | ||||
| Future income tax liability | (6,707,733 | ) | ||
| 25,117,268 | ||||
| Other elements of consideration | ||||
| Amounts attributable to non-controlling interests | (9,910,790 | ) | ||
| Total consideration | 15,206,478 | |||
The table below shows the mine properties and deferred exploration and development costs by the Company in United States dollars:
19
| Mine Properties | Deferred Exploration and Development Costs | |||||||||||||||||||||||
| June 30, 2012/December 31, 2011 and December 31, 2010 | 2012 | 2011 | 2010 | 2012 | 2011 | 2010 | ||||||||||||||||||
| Bong Mieu Gold Mining Co | $ | 3,220,670 | $ | 3,220,670 | $ | 3,220,670 | $ | 21,669,031 | $ | 20,300,410 | $ | 15,846,392 | ||||||||||||
| Phuoc Son Gold Co | 4,995,064 | 4,995,064 | 4,995,064 | 30,417,319 | 25,409,263 | 19,582,685 | ||||||||||||||||||
| North Borneo Gold | 31,276,437 | 31,276,437 | 31,276,437 | 10,663,853 | 7,526,402 | 2,267,175 | ||||||||||||||||||
| Binh Dinh NZ Gold Co | 1,333,333 | 1,333,333 | 1,333,333 | 796,583 | 756,674 | 535,827 | ||||||||||||||||||
| GR Enmore | 550,000 | 550,000 | 550,000 | - | - | - | ||||||||||||||||||
| Kadabra Mining Corp | - | - | - | - | - | - | ||||||||||||||||||
| 41,375,504 | 41,375,504 | 41,375,504 | 63,546,786 | 53,992,749 | 38,232,079 | |||||||||||||||||||
| Accumulated amortization | - 4,210,190 | -3,478,939 | -2,177,725 | -21,137,528 | -14,199,704 | -6,506,447 | ||||||||||||||||||
| Impairment charge | - | - | - | -10,344,162 | - | - | ||||||||||||||||||
| Total | $ | 37,165,314 | $ | 37,896,565 | $ | 39,197,779 | $ | 32,065,096 | $ | 39,793,045 | $ | 31,725,632 | ||||||||||||
The table below shows the property, plant and equipment of the Company in United States dollars for the periods shown.
| June 30, 2012 | December 31, 2011 | December 31, 2010 | ||||||||||||||||||||||||||||||||||||||
| Cost | Accumulated Depreciation | Impairment Charge | Net Book Value | Cost | Accumulated Depreciation | Net Book Value | Cost | Accumulated Depreciation | Net Book Value | |||||||||||||||||||||||||||||||
| Building | $ | 3,080,057 | $ | 1,306,560 | $ | 88,000 | $ | 1,685,497 | $ | 2,961,812 | $ | 1,074,037 | $ | 1,887,775 | $ | 976,993 | $ | 803,136 | $ | 173,857 | ||||||||||||||||||||
| Leasehold improvements | 141,405 | 134,055 | - | 7,350 | 141,405 | 129,201 | 12,204 | 125,821 | 114,923 | 10,898 | ||||||||||||||||||||||||||||||
| Machinery & equipment | 30,317,738 | 12,317,293 | 1,673,000 | 16,327,445 | 28,349,882 | 9,928,627 | 18,421,255 | 12,292,843 | 6,047,774 | 6,245,069 | ||||||||||||||||||||||||||||||
| Office equipment, furniture & fixtures | 1,770,843 | 1,033,880 | 32,000 | 704,963 | 1,614,970 | 1,029,664 | 585,306 | 1,504,391 | 942,896 | 561,495 | ||||||||||||||||||||||||||||||
| Vehicles | 438,651 | 392,134 | 13,000 | 33,517 | 438,651 | 381,120 | 57,531 | 439,589 | 349,365 | 90,224 | ||||||||||||||||||||||||||||||
| Infrastructure | 20,925,447 | 7,028,358 | 547,000 | 13,350,089 | 20,337,058 | 5,138,091 | 15,198,967 | 4,732,912 | 2,902,757 | 1,830,155 | ||||||||||||||||||||||||||||||
| Capital assets in progress(1) | 833,073 | - | 115,000 | 718,073 | 775,077 | - | 775,077 | 21,737,979 | - | 21,737,979 | ||||||||||||||||||||||||||||||
| Total | $ | 57,507,214 | $ | 22,212,280 | $ | 2,468,000 | $ | 32,826,934 | $ | 54,618,855 | $ | 17,680,740 | $ | 36,938,115 | $ | 41,810,528 | $ | 11,160,851 | $ | 30,649,677 | ||||||||||||||||||||
(1) Included in the net carrying value of buildings, plant & equipment and infrastructure at December 31, 2011 were capitalized interest and borrowing costs of $4,417,315 in relation to the Phuoc Son plant which was under construction and placed into commercial production on July 1, 2011.
On September 30, 2010, as amended on May 20, 2011 and further amended on January 20, 2012, the Company entered into an agreement to acquire a further 43.50% interest in NBG, which is the owner of the Bau property. The settlement is to be paid in several tranches as set out below and will bring the Company’s effective interest to 93.55% by January 2014.
20
Purchase Price | Purchase Date | North Borneo Gold Sdn Bhd Class A Shares | Company’s Effective Holding | ||||||||||
| Tranche 1 | $ | 7,500,000 | 9/30/2010 | 31,250 | 62.55 | % | |||||||
| Tranche 2 | $ | 7,500,000 | 10/30/2010 | 31,250 | 75.05 | % | |||||||
| Tranche 3a | $ | 6,000,000 | 5/20/2011 | 13,700 | 80.53 | % | |||||||
| Tranche 3b | $ | 3,000,000 | 1/20/2012 | 6,800 | 83.25 | % | |||||||
| Tranche 3c | $ | 2,000,000 | 1/28/2013 | 4,500 | 85.05 | % | |||||||
| Tranche 4a | $ | 3,000,000 | 9/13/2013 | 7,000 | 87.85 | % | |||||||
| Tranche 4b | $ | 6,000,000 | 1/21/2014 | 14,250 | 93.55 | % | |||||||
| Total | 108,750 | 93.55 | % | ||||||||||
4B. Business Overview
General
Olympus Pacific Minerals Inc. is an international mining exploration, development and production company focused on the mineral potential of Southeast Asia. Olympus is focussed on its two producing gold mines in Central Vietnam, property in East Malaysia that is currently the subject of a feasibility study and an early stage exploration property in the Northern Philippines.
Olympus has been active in Vietnam since the mid-1990s on its own account and through associated companies, PSGC and Bogomin, and maintains an office in Danang in central Vietnam. In January 2010 the Company acquired by merger with Zedex, its interests in NBG which operates the Bau Gold Project near Kuching in East Malaysia, Binh Dinh New Zealand Gold Company Limited which operates the Tien Thuan Gold Project near Qui Nhon in Central Vietnam and GR Enmore Pty Ltd, which operates a gold project in New South Wales Australia.
In September 2011, the Company signed the Capcapo Joint Venture Agreement in respect of the Capcapo Gold Property, Northern Philippines, superseding a memorandum of agreement entered into in November 2006.
The Company’s two most advanced properties, covered by investment certificates, are the Phuoc Son Gold Property and the Bong Mieu Gold Property, both including producing mines. Both properties are located in central Vietnam along the Phuoc Son-Sepon Suture. The Bong Mieu and Phuoc Son Gold properties are approximately 74 kilometres apart. Proven and probable reserves exist for the Bong Mieu Central Gold Mine and for the Phuoc Son Dak Sa area.
The Bong Mieu Central plant was commissioned in April 2006 and commercial production started in the fourth quarter of 2006. The Company poured its first 3.6 kg doré bar on February 15, 2006. To June 30, 2012, the plant had produced 102,061 ounces of gold.
Exploration work to date has resulted in one new significant discovery in the Bong Mieu East area (Thac Trang) as well as a number of new, surface showings. In addition, further exploration will be required to define the extent of the deposits in several directions. Based on results of the exploration work completed to date, management believes the potential for additional discoveries and resource expansion at the Bong Mieu Gold Property is positive. Underground evaluation studies are continuing at the Bong Mieu Underground mine, located within one kilometre of the Bong Mieu Central plant.
21
The Phuoc Son Gold Property is located in central Vietnam, 74 kilometres from the Bong Mieu Gold Property. The property hosts over 30 known gold prospects and two known high-grade gold deposits in the Dak Sa area of the property. PSGC has been granted a mining licence by the Government of Vietnam to mine and develop its Dak Sa deposits (north and south deposits).Exploration work to date has defined the Dak Sa zone, which contains two deposits, North and South Deposits, over a minimum length of approximately five kilometres. Evaluation of the large Phuoc Son land package continues to reinforce the potential of the overall property to host new deposits which could be mined in conjunction with the Dak Sa operation or have potential to be stand-alone deposits. The Phuoc Son mine was put into commercial production effective October 1, 2009 with ore from the Southern Deposit (Bai Dat) of Dak Sa being processed at the Bong Mieu Central plant on a toll treatment basis. The new plant at the Phuoc Son Gold Property was commissioned in June 2011, has been in commercial production since July 1, 2011 and achieved full scale processing in the fourth quarter, 2011.Commercial production from the Northern Deposit (Bai Go) commenced in July 2012.
The Bau Gold Project comprises consolidated mining and exploration tenements that collectively cover more than 1,340 km2 of the most highly prospective ground within the historic Bau Goldfield in Sarawak, East Malaysia. The property is attributed with significant gold resources and has been independently assessed as having substantially greater resource potential.
The Capcapo Gold-Copper Project comprises MPSA 144which covers 756 Ha. Due diligence studies conducted in 2006 confirmed the presence of potential ore-grade, epithermal, gold-copper mineralization at surface and extending beyond 100m depth. The mineralization is inferred to be related to a classic copper-gold porphyry system at depth. The resumption of exploration currently awaits completion of a community relations programme.
The Tien Thuan Gold Project in Central Vietnam covers about 100 km2 of hilly terrain, encompassing numerous hard rock and alluvial gold occurrences within and peripheral to a large, multiphase intrusive complex of predominantly granitic composition. Quartz veins extend over 15 km of strike. Two discrete intrusive featuring veins and disseminated molybdenum mineralization have been discovered. Geological mapping has revealed outcropping features that are broadly consistent with economically productive circum-pacific porphyry (copper-molybdenum-gold-silver) deposits.
The Enmore Gold Project covers approximately 325km2 within the Enmore-Melrose Goldfield of northeastern New South Wales, Australia. The Company holds a 100 percent interest in an exploration licence covering 290km2 and is earning an 80 percent interest in two exploration licences covering 35 km2. The geological setting is broadly analogous to that at the nearby Hillgrove copper gold mine. Exploration results to date have confirmed the potential for lode and/or quartz stock-work style gold deposits at a number of individual prospects, including Bora, Sunnyside, Lone Hand, Stony Hill, Sheba and Tabben. Potentially minable grades and widths have to date been drill-intersected at Sunnyside and Bora prospects.
Description of Mining Industry
Our business is highly speculative. We are exploring for base and precious metals and other mineral resources. Ore is rock containing particles of a particular mineral (and possibly other minerals which can be recovered and sold). Mining involves the legal extraction and processing of ore to recover minerals which can be sold at a profit. Although mineral exploration is a time consuming and expensive process with no assurance of success, the process is straight forward. First, we acquire the rights to enable us to explore for, and if warranted, extract and remove ore so that it can be refined and sold on the open market to dealers. Second, we explore for precious and base metals by examining the soil, rocks on the surface, and by drilling into the ground to retrieve underground rock samples, which can then be analyzed. This work is undertaken in staged programs, with each successive stage built upon the information gained in prior stages. If exploration programs discover what appears to be an area which may be able to be profitably mined, we will focus our activities on determining whether that is feasible, while at the same time continuing the exploratory activities to further delineate the location and size of the potential ore body. Things that will be analyzed by us in making a determination of whether we have a deposit which can be feasibly mined at a profit include:
22
1. The amount of mineralization which has been established, and the likelihood of increasing the size of the mineralized deposit through additional drilling;
2. The expected mining dilution;
3. The expected recovery rates in processing;
4. The cost of mining the deposit;
5. The cost of processing the ore to separate the gold from the host rocks, including refining the precious or base metals;
6. The costs to construct, maintain, and operate mining and processing activities;
7. Other costs associated with operations including permitting, community co-operation programs and reclamation costs upon cessation of operations;
8. The costs of capital;
9. The costs involved in acquiring and maintaining the property; and
10. The price of the precious or base minerals. For example, the price of one ounce of gold for the years 2001 to June 30, 2012 ranged from a low of $271 in 2001, to a high of $1,895 in 2011. At September 17, 2012, the price of gold was $1,770 per ounce1.
Our analysis will rely upon the estimates and plans of geologists, mining engineers, metallurgists and others.
If we determine that we have a feasible mining project, we will consider pursuing alternative courses of action, including:
| · | seeking to sell the project to third parties; |
| · | entering into a joint venture with another mining company to mine the deposit; or |
| · | placing the property into production ourselves. |
1Based upon the Average Spot Price of Gold, London PM fix.
23
There can be no assurance that we will discover any precious or base metals, establish the feasibility of mining a deposit, or, other than the Bong Mieu Central, Underground and East areas and the Phuoc Son Dak Sa area which are currently in production, develop a property to production and maintain production activities, either alone or as a joint venture participant. Furthermore, there can be no assurance that we would be able to sell the property on acceptable terms or at all, enter into such a joint venture on acceptable terms, or be able to place a property into production ourselves. Our mining operations are subject to various factors and risks generally affecting the mining industry, many of which are beyond our control. These include the price of precious or base metals declining, the possibility that a change in laws respecting the environment could make operations unfeasible, or our ability to conduct mining operations could be adversely affected by government regulation. For a more complete description of risk factors facing our Company, please see “Item 3D. Risk Factors” of this report.
Regulation of Mining Industry and Foreign Investment in Vietnam
The current Vietnamese mining law was enacted in November 2010 replacing the 1996 mining law as subsequently modified. The new Vietnamese mining law came into effect on July 1, 2011 and a formal decree of implementation came into effect on April 25, 2012. Pursuant to the new legislation, a company exploring and mining precious metals may apply to the licensing authority, the Ministry of Natural Resources & Environment, for exploration and mining licenses. An exploration license provides an exclusive right to conduct advanced exploration over areas defined in the exploration license for an initial 4 year term, after which the exploration license may be renewed for subsequent terms not exceeding four years subject to the requirement to relinquish 30% of the area upon each renewal. Exploration license holders have the right to apply for a mining license at any time up to 6 months after expiry of an exploration license. An approved level of mineral reserves, an environmental impact assessment report, an investment certificate and specified minimum levels of equity are required to support a mining license application. Investment certificates are issued by the Ministry of Planning and Investment. A mining license provides the right to mine specified minerals for the term of the license which can be no more than 30 years. A mining license can be extended subject to a maximum aggregate duration of the extensions of 20 years.
On January 11, 2007, Vietnam became a full member of the World Trade Organization (“WTO”). After becoming a full member of the WTO, various commitments Vietnam made for joining the WTO became effective. These commitments impact a number of areas such as tariffs and duties on goods, foreign service providers’ access to Vietnam, foreign ownership, reforms on Vietnam’s legal and institutional set up for trade, foreign exchange, commercial business, trading rights, policy making, duties, restrictions, pricing and export restrictions. The overall changes were expected to further expand Vietnam’s access to the global economy and facilitate doing business in Vietnam.
Since Vietnam is now a member of the World Trade Organization (“WTO”), foreign companies under the terms of WTO membership, are expected to be treated on an equal basis as Vietnamese companies.
Profits earned in Vietnam transferred abroad annually shall be the amount of profits of a fiscal year distributed to the foreign investor after payment of corporate income tax, plus (+) other profits earned in the year, such as profits from assignment of capital, from assignment of assets, items of corporate income tax which were paid and then refunded to the foreign investor in accordance with the provisions of the Law on Corporate Income Tax; less (-) items which the foreign investor has used or undertaken to use to re-invest in Vietnam, profit items which the foreign investor has used to pay out the expenses of such foreign investor for production and business operations or for private needs of the investor in Vietnam, and profit items provisionally transferred during the year. The amount of income that an investor is permitted to transfer abroad in a fiscal year shall be determined after the Company submits an audited financial report and a tax finalization report for the fiscal year with the local tax office which manages the enterprise. Foreign investors shall be permitted to transfer profits abroad in the following circumstances: (i) Annual transfer and one-off transfer of the whole of the amount of profits distributed or earned after the end of the fiscal year and after filing a tax finalization report with the tax office, (ii) Provisional transfer during a fiscal year once every quarter or once every six months after payment of corporate income tax in accordance with the Law on Corporate Income Tax (except for foreign investors exempt from corporate income tax in accordance with the provisions of the Law on Corporate Income Tax and the Law on Foreign Investment in Vietnam), (iii) Transfer of profits upon termination of business operation in Vietnam in accordance with the Law on Foreign Investment in Vietnam.
24
Regulation of Mining Industry and Foreign Investment in Malaysia
The two main legal instruments that govern activities relating to minerals are the Mineral Development Act, 1994 and the State Mineral Enactment. The Mineral Development Act came into force in August 1998. The State Mineral Enactment for Sarawak, where the Bau Gold Project is located, is entitled the “Minerals Ordinance, 2004” and was proclaimed into effect on July 1, 2010.
The Mineral Development Act 525 of 1994 defines the powers of the Federal Government for inspection and regulation of mineral exploration and mining and other related issues. The State Mineral Enactment provides the States with the powers and rights to issue mineral prospecting and exploration licenses and mining leases and other related matters. The Governor of the state of Sarawak, in which the Bau Project is located, has statutory rights to forfeit or cancel the mining tenements if there is a breach of, or default in the observance of any of the covenants or conditions attached to the relevant Mining Tenement.
Parties may apply for a General Prospecting License or an Exclusive Prospecting License for an initial term of two years (with one renewal period for a further two years). Mining operations require a Mining Lease, or in the case of a Mining Lease where the boundary survey of the area has not been completed, a Mining Certificate. In either case, the maximum term is 21 years.
Malaysia has been a member of the World Trade Organisation (“WTO”) since 1 January 1995 and has made various commitments pursuant to the General Agreement on Trade in Services (“GATS”) including setting out the transactions relating to investment in Malaysia which would require approval. Since Malaysia is a member of the WTO, foreign companies under the terms of the WTO membership are expected to be treated on an equal basis as Malaysian Companies.
No restrictions are imposed on foreign companies investing in Malaysia with regard to repatriation of capital, interest, profits and dividends. No royalties are payable to the Federal Government.
4C. Organizational Structure
The following is a chart showing the corporate organizational structure of the Company and its subsidiaries as of the date of this report.
25
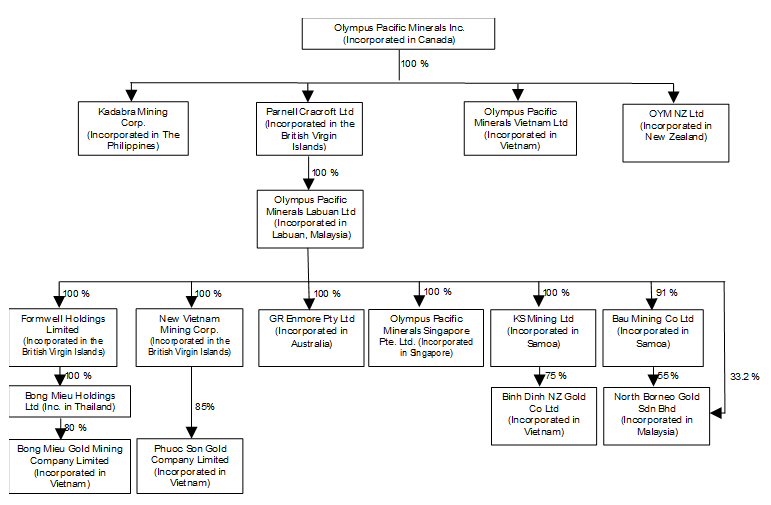
| 4D. | Property, Plant and Equipment |
General
The Company is currently prioritizing its resources towards the production of gold from, and the continued exploration and development of, the Phuoc Son Gold Property and the Bong Mieu Gold Property in Vietnam and towards the feasibility study underway at the Company’s Bau Gold Project in East Malaysia. The Company also intends to dedicate the resources necessary to earn its interest in the Capcapo joint venture, Philippines, as set out in the Capcapo Joint Venture Agreement. The company maintains small exploration bases at the Tien Thuan Gold Project in Vietnam and at the Enmore Gold Project in NSW, Australia but is not actively engaged in operations at those sites. The Company has thus diversified its property portfolio over four key projects in three jurisdictions, thus reducing sovereign risk.
In order to acquire, explore and develop its property interests in Vietnam, the Company was required to acquire licenses from the Vietnamese government. Please refer to Item 4.A of this report for a discussion of the regulation of mining activities in Vietnam. Following is a schedule of the investment, mining and exploration licenses/certificates the Company, through its subsidiaries or affiliated companies, holds in respect of the Phuoc Son Gold Property and the Bong Mieu Gold Property:
26
Schedule of Investment Licenses
| PROJECT | OWNER | LICENSE | AREA | STATUS | GRANT DATE | TERM | EXPIRY DATE |
| 1. Bong Mieu | BOGOMIN | Certificate No 331022000008 | 30 Sq Km | Granted | 6/27/08 | 7.75 years | 5/3/2016 |
| 2. Phuoc Son | PSGC | Certificate No 331022000010 | 70 Sq Km | Granted | 7/8/2008 | 25 years | 10/20/2033 |
Schedule of Mining Licenses
| PROJECT | MINE | OWNER | LICENSE | AREA | STATUS | GRANT DATE | TERM | EXPIRY DATE |
| 1. Bong Mieu | Ho Gan | BOGOMIN | ML592/CNNg | 358 Ha | Granted | 7/22/92 | 25 years | 7/22/2017 |
| Bong Mieu | Nui Kem | BOGOMIN | ML592/CNNg | 358 Ha | Granted | 7/22/92 | 25 years | 7/22/2017 |
| Bong Mieu | Ho Ray | BOGOMIN | Proposed new MLA | Not yet defined | Proposed | - | - | - |
| 2. Phuoc Son | Dak Sa Bai Dat | PSGC | ML565/GP-BTNMT | 3.67 Ha | Granted | 4/25/2012 | 5 years | 4/25/2017 |
| Phuoc Son | Dak Sa Bai Go | PSGC | ML565/GP-BTNMT | 4,28 Ha | Granted | 4/25/2012 | 5 years | 4/25/2017 |
27
Schedule of Certificates
| COMPANY | TYPE OF CERTIFICATE | DATE GRANTED | TERM | EXPIRY DATE |
| Bong Mieu Gold Mining Company | Gold export certificate | Jan9, 2012 | 1 year | Dec 31, 2012 |
| Phuoc Son Gold Mining Company | Gold export certificate | Jan9, 2012 | 1 year | Dec 31, 2012 |
| Bong Mieu Gold Mining Company | Land Use Certificate | Oct 9, 1993 | 25 years | Sep 2017 |
Schedule of Exploration Tenements (Applications)
| PROJECT | E.L. REG. # | REG. HOLDER |
| 1. Phuoc Son | 67/GP-BTNMT | PSGMC |
| 2. Bong Mieu | 2125/GP BTNMT | BOGOMIN |
In order to acquire, explore and develop its property interests in Malaysia, the Company is required to acquire licenses from the Malaysian government. Reference is made to Item 4.A for a discussion of the regulation of mining activities in Malaysia. Following is a schedule of the mining licenses and certificates the Company, through its subsidiaries or affiliated companies, holds in respect of the Bau Gold Property:
28
Schedule of Mining Licenses/Certificates
| GRANT | EXPIRY | ||||||
| PROJECT | OWNER | LICENSE | AREA | STATUS | DATE | TERM | DATE |
| Bau | NBG | ML1D/134/ML/2008 | 40.5 Ha | Granted | 6/12/2005 | 20 years | 6/11/2025 |
| NBG | ML 136 | 139.6 Ha | Granted | 1/19/2003 | 20 years | 1/18/2023 | |
| NBG | ML/01/2012/1D | 12.7 Ha | Granted | 1/19/2003 | 20 years | 1/18/2023 | |
| NBG | ML/03/2012/1D | 49.4 Ha | Granted | 3/5/2004 | 20 years | 3/4/2024 | |
| NBG | ML 138 | 409.5 Ha | Granted | 11/20/2005 | 20 years | 11/19/2025 | |
| NBG | ML/04/2012/1D | 52.1 Ha | Granted | 1/10/2005 | 20 years | 1/9/2025 | |
| NBG | ML/05/2012/1D | 5.3 Ha | Granted | 1/10/2005 | 20 years | 1/9/2025 | |
| NBG | ML 142 | 38.4 Ha | Granted | 6/12/2005 | 20 years | 6/11/2025 | |
| NBG | ML/02/2012/1D | 49.8 Ha | Granted | 6/23/2004 | 20 years | 6/22/2024 | |
| NBG | ML 1D/137/ML/2008 | 2.6 Ha | Granted | 6/23/2004 | 20 years | 6/22/2024 | |
| NBG | MC KD/01/1994 | 1,694.9 Ha | Granted | 10/27/1994 | 20 years | 6/22/2014 | |
| NBG | ML 101 | 48.2 Ha | New Application | ||||
| NBG | MLA (ex ML93) | 17.1 Ha | New Application | ||||
| NBG | MLA (ex ML129) | 263.0 Ha | New Application | ||||
| NBG | MC (ex ML132) | 126.0 Ha | New Application | ||||
| NBG | MC (ex ML 99) | 12.7 Ha | New Application | ||||
| NBG | MC (ex ML 106) | 25.1 Ha | New Application | ||||
| NBG | MC (ex ML 114) | 42.9 Ha | New Application | ||||
| NBG | MC (ex ML 116) | 43.3 Ha | New Application | ||||
| NBG | MC (ex ML 120) | 43.7 Ha | New Application | ||||
| NBG | MC (ex ML 130) | 13.7 Ha | New Application | ||||
| NBG | MC (ex ML 132) | 126.0 Ha | New Application | ||||
| NBG | MLA (ex ML110) | 64.2 Ha | Renewal Application | ||||
| NBG | MC 1D/3/1987(A) | 7,240.0 Ha | Renewal Application | ||||
| NBG | MC 1D/1/1987 | 194.0 Ha | Renewal Application | ||||
| NBG | MC 1D/2/1987(A) | 82.0 Ha | Renewal Application | ||||
| NBG | MC 1D/2/1987(B) | 3,237.0 Ha | Renewal Application | ||||
| NBG | MC SD/1/1987 | 1397.0 Ha | Renewal Application |
The Capcapo Joint Venture Agreement provides the Olympus Consortium with the right to earn a 60% interest in Mineral Production and Sharing Agreement #144-99-CAR covering756 Ha expiring November 29, 2024 and registered in the name of Jabel.
29
Global Resource Estimates
CAUTIONARY NOTE TO U.S. INVESTORS CONCERNING ESTIMATES OF MEASURED AND INDICATED MINERAL RESOURCES
This section and section 4D.1 describing the Phuoc Son Gold Property and section 4D.2 describing the Bong Mieu Gold Property use the term “ measured and indicated resources.” We advise U.S. investors that while those terms are recognized and required by Canadian regulations, the U.S. Securities and Exchange Commission (“SEC”) does not recognize them. U.S. investors are cautioned not to assume that any part or all of the mineral deposits in these categories will ever be converted into reserves.
CAUTIONARY NOTE TO U.S. INVESTORS CONCERNING ESTIMATES OF INFERRED MINERAL RESOURCES
This section uses the term “inferred resources.” We advise U.S. investors that while this term is recognized and required by Canadian regulations, the U.S. Securities and Exchange Commission does not recognize it. “Inferred resources” have a great uncertainty as to their existence, and great uncertainty as to their economic and legal feasibility. It cannot be assumed that all or any part of an Inferred Mineral Resource will ever be upgraded to a higher category. Under Canadian rules, estimates of Inferred Mineral Resources may not form the basis of feasibility or prefeasibility studies, except in rare cases. U.S. investors are cautioned not to assume that part or all of an inferred resource exists, or is economically and legally mineable.
The mineral reserve and mineral resource estimates contained in the following tables have been prepared in accordance with NI 43-101. Although generally the NI 43-101 standards are similar to those used by the SEC Industry Guide No. 7, the definitions in NI 43-101 differ in certain significant respects from those under Industry Guide No. 7.Accordingly, mineral reserve and mineral resource information contained herein may not be comparable to similar information disclosed by U.S. companies.
The Company’s Global Reserves and Resources are summarized in the table below as at June 30, 2012 and December 31, 2011.
30
| RESERVES | As at June 30, 2012 | As at December 31, 2011 | ||||||||||||||||||||||||||
| Property | Reserve Catagory | Tonnes | Gold Grade (g/t) | Contained Gold (oz) | Tonnes | Gold Grade (g/t) | Contained Gold (oz) | |||||||||||||||||||||
| Bong Mieu Gold Property (1) | ||||||||||||||||||||||||||||
| NI43-101 | Proven | 0 | - | 0 | 0 | - | 0 | |||||||||||||||||||||
| Probable | 109,312 | 2.04 | 7,169 | 133,547 | 2.17 | 9,333 | ||||||||||||||||||||||
| Total P&P | 109,312 | 2.04 | 7,169 | 133,547 | 2.17 | 9,333 | ||||||||||||||||||||||
| Phuoc Son Gold Property (2) | ||||||||||||||||||||||||||||
| NI43-101 | Proven | 170,481 | 6.97 | 38,182 | 180,313 | 4.88 | 28,303 | |||||||||||||||||||||
| Probable | 557,068 | 5.78 | 103,512 | 567,635 | 5.83 | 106,377 | ||||||||||||||||||||||
| Total P&P | 727,549 | 6.06 | 141,694 | 747,948 | 5.60 | 134,680 | ||||||||||||||||||||||
| RESOURCES | As at June 30, 2012 | As at December 31, 2011 | ||||||||||||||||||||||||||
| (Measured & Indicated Resources Include Proven and Probable Reserves) | ||||||||||||||||||||||||||||
| Property | Reserve Catagory | Tonnes | Gold Grade (g/t) | Contained Gold (oz) | Tonnes | Gold Grade (g/t) | Contained Gold (oz) | |||||||||||||||||||||
| Bong Mieu Gold Property (3) | ||||||||||||||||||||||||||||
| NI43-101 | Measured | 1,037,660 | 1.95 | 65,038 | 1,037,660 | 1.95 | 65,038 | |||||||||||||||||||||
| Indicated | 2,494,970 | 1.47 | 117,585 | 2,519,205 | 1.48 | 119,750 | ||||||||||||||||||||||
| Total M&I | 3,532,630 | 1.61 | 182,839 | 3,556,865 | 1.62 | 184,788 | ||||||||||||||||||||||
| Inferred | 4,951,920 | 1.39 | 221,306 | 4,951,920 | 1.39 | 221,306 | ||||||||||||||||||||||
| Ancillary Metal Credits (7) | Measured | 37,908 | 37,908 | |||||||||||||||||||||||||
| Indicated | 69,793 | 69,793 | ||||||||||||||||||||||||||
| Total M&I credits | 107,701 | 107,701 | ||||||||||||||||||||||||||
| Inferred | 97,779 | 97,779 | ||||||||||||||||||||||||||
| Historic Estimate | Measured | 24,200 | 5.00 | 3,890 | 24,200 | 5.00 | 3,890 | |||||||||||||||||||||
| Indicated | 192,700 | 6.60 | 40,890 | 192,700 | 6.60 | 40,890 | ||||||||||||||||||||||
| Total M&I | 216,900 | 6.42 | 44,780 | 216,900 | 6.42 | 44,780 | ||||||||||||||||||||||
| Inferred | 1,220,000 | 8.00 | 313,792 | 1,220,000 | 8.00 | 313,792 | ||||||||||||||||||||||
| Phuoc Son Gold Property (4) | ||||||||||||||||||||||||||||
| NI43-101 | Measured | 118,731 | 9.26 | 35,354 | �� | 111,273 | 8.17 | 29,214 | ||||||||||||||||||||
| Indicated | 418,463 | 9.12 | 122,654 | 429,030 | 9.15 | 126,276 | ||||||||||||||||||||||
| Total M&I | 537,194 | 9.15 | 158,008 | 540,303 | 8.95 | 155,490 | ||||||||||||||||||||||
| Inferred | 2,448,797 | 5.96 | 469,384 | 2,466,256 | 6.01 | 476,206 | ||||||||||||||||||||||
| Tien Thuan Gold Property (5) | ||||||||||||||||||||||||||||
| NI43-101 | n/a | Not disclosed - See Note (5) below. | Not disclosed - See Note (5) below. | |||||||||||||||||||||||||
| Bau Gold Property (6) | ||||||||||||||||||||||||||||
| NI43-101 | Measured | 3,425,000 | 1 | 158,500 | 0 | - | 0 | |||||||||||||||||||||
| Indicated | 13,633,000 | 1.72 | 755,000 | 10,963,000 | 1.60 | 563,900 | ||||||||||||||||||||||
| Total M&I | 17,058,000 | 1.67 | 913,500 | 10,963,000 | 1.60 | 563,900 | ||||||||||||||||||||||
| Inferred | 50,062,000 | 1.31 | 2,108,100 | 35,808,000 | 1.64 | 1,888,500 | ||||||||||||||||||||||
| Global Totals: | As at June 30, 2012 | As at December 31, 2011 | ||||||||||||||||||||||||||
| Reserve Catagory | Tonnes | Gold Grade (g/t) | Contained Gold (oz) | Tonnes | Gold Grade (g/t) | Contained Gold (oz) | ||||||||||||||||||||||
| RESERVES | ||||||||||||||||||||||||||||
| NI43-101 | Proven | 170,481 | 6.97 | 38,182 | 180,313 | 4.88 | 28,303 | |||||||||||||||||||||
| Probable | 666,380 | 5.17 | 110,680 | 701,182 | 5.13 | 115,711 | ||||||||||||||||||||||
| Total P&P | 836,861 | 5.53 | 148,863 | 881,495 | 5.08 | 144,014 | ||||||||||||||||||||||
| RESOURCES | ||||||||||||||||||||||||||||
| NI43-101 | Measured | 4,581,391 | 2.01 | 296,800 | 1,148,933 | 3.58 | 132,160 | |||||||||||||||||||||
| Indicated | 16,546,433 | 2.00 | 1,065,033 | 13,911,235 | 1.97 | 879,719 | ||||||||||||||||||||||
| Total M&I | 21,127,824 | 2.00 | 1,361,832 | 15,060,168 | 2.09 | 1,011,879 | ||||||||||||||||||||||
| Inferred | 57,462,717 | 1.57 | 2,896,570 | 43,226,176 | 1.93 | 2,683,792 | ||||||||||||||||||||||
| Historic Estimate | Measured | 24,200 | 5.00 | 3,890 | 24,200 | 5.00 | 3,890 | |||||||||||||||||||||
| Indicated | 192,700 | 6.60 | 40,890 | 192,700 | 6.60 | 40,890 | ||||||||||||||||||||||
| Total M&I | 216,900 | 6.42 | 44,780 | 216,900 | 6.42 | 44,780 | ||||||||||||||||||||||
| Inferred | 1,220,000 | 8.00 | 313,792 | 1,220,000 | 8.00 | 313,792 | ||||||||||||||||||||||
31
Notes to reserves and resources table
1 - Bong Mieu Reserve Estimate
Bong Mieu reserves were estimated by Olympus in accordance with NI 43-101 and the Council of the Canadian Institute of Mining, Metallurgy and Petroleum (“CIMM”) definitions & standards and were independently reviewed by Terra Mining Consultants and Stevens & Associates (“TMC/SA”) in March 2009. A copy of the TMC/SA technical report entitled “Updated Technical Review of Bong Mieu Gold Project in Quang Nam Province, Vietnam”, dated April, 2009 can be found in the Company’s filings at www.sedar.com. Deposit notes and reserve impairments as at June 30, 2012 are as noted below:
1.1 - Ho Gan Deposit
Lower and upper grade-cutoffs are 0.80 g/t Au and 10.00 g/t Au respectively. The mining dilution factor is 10% @ 0.30 g/t Au.
No new reserves were developed during the quarter ended June 30, 2012. Accordingly, the remaining reserve was estimated by deducting the tonnage mined during the quarter ended June 30, 2012 from the reserve remaining at the quarter ended March 31, 2012. The tonnage mined during the quarter ended June 30, 2012 was estimated by reconciling the tonnage (by truck count) with mill tonnage (by weightometer).
1.2 - Ho Ray-Thac Trang Deposit
No reserves have yet been estimated.
1.3 - Nui Kem Deposit
No reserves have yet been estimated.
2 - Phuoc Son (Dak Sa) Reserve Estimate
Dak Sa (Bai Dat and Bai Go Sector) reserves were estimated by Olympus (based on a 3.00 g/t Au stope cut-off, practical stope layouts and the application of appropriate mining dilution rules and minimum width criteria) in accordance with NI 43-101 and CIMM definitions & standards. This estimate was independently audited by TMC/SA in March 2008. This TMC/SA report entitled “Technical Report on the Phuoc Son Project in Quang Nam Province, Vietnam” (March 2008), is within the Company’s filings at www.sedar.com. Deposit notes and reserve impairments as at June 30, 2012 are as noted below:
2.1 - Bai Dat Sector
During the quarter ended June 30, 2012, mining of Bai Dat deposit continued down to sub-level 6. No new reserves were developed during the quarter ended June 30, 2012. Accordingly, the remaining reserves were determined by deducting the ore mined during the quarter ended June 30, 2012 from the quarter ended March 31, 2012 reserve. The ore mined was determined by underground survey, reconciled with the official milled tonnage (by weightometer). The Bai Dat reserve estimate employed a lower grade-cutoff of 3.00 g/t Au and an upper grade-cutoff of 100.00 g/t Au.
2.2 - Bai Go Sector
During the quarter ended June 30, 2012, development ore was mined from the Bai Go ore body. No new (NI 43-101 status) reserves were developed. Accordingly, the Bai Go quarter ended June 30, 2012 reserve was determined by deducting the ore mined during the quarter ended June 30, 2012 from the quarter ended March 31, 2012 reserve. The ore mined was determined by underground survey, reconciled with milled tonnage (by weightometer). The March 2008 reserve estimate employed a lower grade-cutoff of 3.00 g/t Au and an upper cutoff of 80.00 g/t Au.
3 - Bong Mieu Resource Estimate
Bong Mieu resources were initially estimated by Olympus (in accordance with NI 43-101 and CIMM definitions & standards) and independently audited/updated by Watts Griffis and McOuat (“WGM”) (“A Technical Review of the Bong Mieu Gold Project in Quang Nam Province, Vietnam”) in September 2004, by TMC/SA (“Technical Review of the Bong Mieu Gold Project in Quang Nam Province, Vietnam”) in August 2007 and by TMC/SA (“Updated Technical Review of Bong Mieu Gold Project in Quang Nam Province, Vietnam”) in April 2009. Copies of these reports can be found within the Company’s filings at www.sedar.com. Deposit notes and resource impairments as at June 30, 2012 are as noted below:
3.1 - Bong Mieu Central (Ho Gan) Deposit
During the quarter ended June 30, 2012, mining was conducted, but no new (NI 43-101 status) resources were estimated. The quarter ended June 30, 2012 resource was therefore estimated by deducting the tonnage mined from the resource model during the quarter ended June 30, 2012 from the resource remaining at end of the quarter ended March 31, 2012. Mining conducted outside of the resource model is excluded from this calculation.
3.2 - Bong Mieu East (Ho Ray-Thac Trang) Deposit
During the quarter ended June 30, 2012, no mining was conducted. An internal (NI 43-101/CIMM status) block model resource estimate (Bong Mieu-East Mineral Resource Update, March, 2011) is the basis for the quarter ended June 30, 2012 resource statement. This estimate incorporated upper and lower grade cutoffs of 0.5g/t Au and 10 g/t Au respectively. The previous estimate was from an April 2009 independent review by TMC/SA (refer above), which incorporated drilling completed by Olympus during 2008 (using upper and lower grade cutoffs of 0.5g/t Au and 10 g/t Au respectively) to update prior NI 43-101 and CIMM standard estimates/audits.
32
3.3 - Bong Mieu South (Nui Kem) Deposit
The Nui Kem underground resource is an Historic estimate; being an independent estimate by Continental Resource Management Pty Ltd (“CRM”) in 1993. This estimate used lower and upper grade-cutoffs of 3.00 g/t Au and 30.00 g/t Au respectively. Although this CRM estimate pre-dates NI 43-101, it was independently reviewed by WGM in 1997 and again in 2007 by TMC/SA (refer above).
Neither WGM nor TMC/SA audited the CRM estimate, nor did they attempt to reclassify the Nui Kem resource to meet NI 43-101 standards. Nonetheless, both independent consultant groups consider it to have been carried out in a manner consistent with standard industry practice of the time and deem it to be relevant and of historic significance. It is accordingly herein reported as a historical resource.
During the quarter ended June 30, 2012, Olympus continued mining production from trial stoping and underground exploration developments. The historic resource has not been impaired by this production because the production to date is small and predominantly external to the CRM resource boundaries. Depth considerations effectively preclude resource drilling from surface, but it is anticipated sufficient data will become available from underground drilling and exploratory headings to enable a new NI 43-101 compliant estimate to be prepared, which will allow an application for an extended mining license.
4 - Phuoc Son (Dak Sa) Resource Estimate
Dak Sa (Bai Dat and Bai Go Sector) resources were estimated by Olympus in January 2008, in accordance with NI 43-101 and CIMM definitions & standards. This estimate was independently reviewed by TMC/SA in a technical report entitled “Technical Report on the Phuoc Son Project in Quang Nam Province, Vietnam”, dated March 2008, copy of which can be found in the Company’s filings at www.sedar.com. A prior independent review (by WGM) entitled “A Technical Review of the Phuoc Son Gold Project in Quang Nam Province, Vietnam”, dated January 30, 2004 can also be found in the Company’s filings at www.sedar.com. Current resources include an in-house estimate of additional resources conducted in May 2010. Deposit notes and resource impairments as at June 30, 2012 are as noted below:
4.1 - Dak Sa South (Bai Dat) Deposit
During the quarter ended June 30, 2012, mining of the Bai Dat deposit continued, but no additional (NI 43-101 status) resources were defined. Accordingly, the quarter ended June 30, 2012 resource (which includes reserves) was determined by deducting the quarter ended June 30, 2012 mining depletion from the resource remaining at end of the quarter ended March 31, 2012. The Dak Sa South estimate (refer above) employed an upper grade cutoff of 100.00 g/t Au, with no lowercut.
4.2 - Dak Sa North (Bai Go) Deposit
During the quarter ended June 30, 2012, underground access to the Bai Go ore body was developed and mining commenced. No new (NI 43-101 status) resources were developed. Accordingly, the Bai Go quarter ended June 30, 2012 resource was determined by deducting the ore mined during the quarter ended June 30, 2012 from the quarter ended March 31, 2012 resource. The ore mined was determined by underground survey, reconciled with milled tonnage (by weightometer). The Dak Sa North resource estimate employed an upper grade cutoff of 80.00 g/t Au, with no lower grade cutoff.
5 - Tien Thuan Resource Estimate
No Tien Thuan resource is disclosed as of the quarter ended June 30, 2012 because no NI 43-101 status resource estimate has yet been made. An historic (1993) gold resource estimate by the Geological Survey of Vietnam cannot presently be disclosed because it is neither JORC nor NI 43-101 compliant.
6 - Bau Resource Estimate
No mining was conducted at the Bau Gold Project during the quarter ended June 30, 2012. Current Bau resources are pursuant to an estimate conducted by TMC/SA, dated February 28, 2012. This estimate employed lower grade-cutoffs of 0.50 g/t Au and 2.00 g/t Au respectively for near surface (open-pit) and deeper (u/g) deposits. Upper cutoffs ranged from 3.3 g/t Au in respect of tailings and from 6.47 g/t Au to 33.13 g/t Au in respect of other deposits, depending upon grade statistics for each deposit. This estimate supersedes an earlier estimate by the same consultants dated June 15, 2010.
A prior estimate (of partial Bau resources) was completed in November 2008 by Ashby Consultants Ltd (“ACL”) of New Zealand. The ACL estimate (conducted in accordance with JORC standards) is superseded by the TMC/SA estimate, which was conducted in accordance with NI 43-101 and CIMM definitions & standards. A copy of the 2010 TMC/SA technical report in respect of the Bau resource estimate may be viewed within the Company’s filings at www.sedar.com.
33
Ongoing Bau project resource drilling is expected to enable a further resource update later in 2012.
7 - Ancillary Metals
The gold-equivalent value of the Tungsten in the Bong Mieu East Resource was calculated using Tungsten value of US$430/MTU and gold value of US$1,650/ounce. Other metals, such as silver, copper, lead, zinc and fluorine, have not been included in the quarter ended June 30, 2012 estimate because they are of insignificant value or uneconomic to recover.
(8) Commodity Prices
Commodity prices used over the last three years (in USD) were as follows:
| Commodity | 2009 Price | 2010 Price | 2011 Price | 2012 Price |
| Gold | US$1,120/oz | US$1,340/oz | US$1,650/oz | US$1,650/oz |
| Tungsten | US$200/MTU | US$320/MTU | US$430/MTU | US$430/MTU |
The 2008 – 2015 gold metal price forecasts used were those of Macquarie Bank (consistent with near term trailing gold price averages and the January 2008 Reuters poll), as follows:
| YEAR | GOLD PRICE (US$) | |||
| 2008 | 960 | |||
| 2009 | 1050 | |||
| 2010 | 1000 | |||
| 2011 | 900 | |||
| 2012 | 800 | |||
| 2013 | 750 | |||
| 2014 | 750 | |||
| 2015 | 750 | |||
| (10) | The Company currently operates three mines (Bong Mieu Central, Bong Mieu Underground and Phuoc Son), company ownership of which is 80% at Bong Mieu and 85% at Phuoc Son. The quantities disclosed relate to the whole mines. |
Minor differences between estimated reserves and actual production have been accounted for in the respective reserve tables. There are no material variations to be disclosed.
The new Phuoc Son processing plant was out into commercial production on July 1, 2011. Metallurgical recoveries are consistently within the 90-95% range.
An independent financial analysis of the Phuoc Son Deposit was conducted in 2008 by Mr John Glenn of Meridian Capital Group Pty Ltd.
The metallurgical recovery factor used was 90%, with sensitivity analyses at: +5%, -5% and -10%.
Phuoc Son Gold Property, Vietnam
Olympus Pacific currently holds an 85% interest in the Phuoc Son Gold Property with a focus on exploration, development and production of gold and other potential minerals in the specified project area, located in Phuoc Son and Nam Giang districts in the Quang Nam Province. In 2003, NVMC, a subsidiary of the Company, entered into a joint venture agreement with MINCO, a mining company then controlled by the local provincial government, to form PSGC. PSGC has an investment certificate on the Phuoc Son property. NVMC’s initial interest in PSGC is 85% and MINCO has a 15% interest.
After five years, from the end of the period in which PSGC makes a profit for 12 consecutive months, MINCO can increase its interest by 15% to 30% if MINCO chooses to acquire such interest from NVMC by paying fair market value. After 20 years, MINCO can increase its interest to a total of 50% if MINCO chooses to acquire such additional 20% interest from NVMC by paying fair market value. Fair market value shall be determined by using an independent accounting firm to perform the fair market value assessment and that assessment will be considered final and binding for both parties. If MINCO does not exercise its right of acquisition within three months from the dates of entitled acquisition, MINCO will be considered as having waived its right to acquire the interest.
34
If either party fails to contribute, by way of debt or equity, in proportion to its participating interest or defaults on any other substantial obligation under the agreement and such default is not rectified within 60 days of notice of default, the non-defaulting party can terminate the agreement or serve notice on the defaulting party which would result in the participating interest of each party being recalculated and adjusted based on the percentage of debt and equity contributed by each party when compared to the total debt and equity contributed by both parties.
Phuoc Son License Tenure
Investment Certificate
On October 20, 2003, a 30-year investment license No. 2355/GP was granted for the Phuoc Son property covering 70 km2. This license permitted MINCO and NVMC to establish the PSGC joint venture for a term of 30 years. PSGC has investment capital of $65,000,000 and legal capital of $5,000,000, of which NVMC contributed $4,250,000 (85%) and MINCO contributed $750,000 (15%). PSGC must pay the Vietnamese government a royalty equal to fifteen percent of the sales value of gold production, annual land rent and annual corporate tax of 40% of net profit but will be exempt from import duties and is subject to 7% tax upon remittance of profits abroad. Following issuance of new Investment Law, the original investment license was reissued on July 8, 2010 as an investment certificate (no. 331022000010) which will expire on October 20, 2033.
Exploration Licenses
Initial Exploration Licences (1953 & 1955/QD-DCKS) were granted over 100 km2 on 18/9/1998, with and extended term that expired on 31/12/2002. Since then, a series of exploration licenses have been held over progressively diminishing areas. The penultimate exploration license (EL67/GP-BTNMT) was granted over 70 km2 on 10/1/2008. Application for renewal of this EL over a reduced area of 28km2 has recently been held up pending issuance of a governmental mining law decree and implementation circular and confirmation that Phuoc Son IC area is exempt from government competitive mineral rights bidding. PSGC may also apply for two additional Exploration Licences over peripheral areas of interest in 2012.
Mining Licenses
A Mining License (ML116/GP-BTNMT) was originally granted over the Dak Sa (North and South deposits) on January 23, 2006 for a 3 year term. The term was later extended to 5.5 years, after which a replacement mining license was applied for and the current Mining License (ML 565/GP/BTNMT) was issued on April 25, 2012 for a five year term expiring on April 25, 2017. An additional mining license application over an area to the north of the current mining license is currently in preparation.
Gold Export License
PSGC exports and sells gold offshore pursuant to a gold export certificate that is renewed annually. The current certificate was issued on January 9, 2012 and will expire on December 31, 2012.
35
Production History and Processing Plant
The Phuoc Son processing plant was designed to a capacity of 1,000 tpd. The mill was commissioned on June 2011 at a nominal throughput of 500 tpd. The processing plant consists of a conventional grinding, gravity, flotation, CIL and detox circuits. Gold is recovered by a combination of gravity, cyanidation and carbon-in-pulp methods.
Ore from the underground workings is delivered to the mill. The run of mine ore is then processed through a primary jaw crusher and two cone crushers, standard and short head. The crushed product is subsequently fed to the grinding circuit, consisting of two ball mills operating in a closed circuit with hydrocyclones. The ground particles from the ball mill reports to two gravity concentrators where gold particles are extracted and treated in a high efficiency leaching system with an intensive cyanidation process. Between 70 percent and 80 percent of the gold in the ore fed to the mill is extracted in the Acacia system. The high-grade, gold-bearing solution from the Acacia system goes to electrowinning.
After the gravity circuit, product grind is conditioned with chemical reagents to activate flotation of sulphide minerals bearing gold particles. The unwanted flotation tails report to the tailings area, Dam 1 containment. The floated sulphide concentrate is thickened to approximately 50% solids (2w/w) and fed to the CIL (carbon in leach) circuit containing activated carbon. This is a cyanidation circuit to adsorb dissolved gold onto activated carbon in agitated tanks.
Gold is removed from the loaded carbon using the pressurized Zadra technique. The resulting solution goes to a pregnant solution tank and subsequently to electrowinning where gold is deposited onto stainless steel cathodes by electrolysis. The gold is washed from the cathodes, filtered, dried and smelted in a furnace to produce yellow-gold metal.
Prior to the disposal of CIL tailings they are subject to cyanide detoxification. This results in a reduction of cyanide levels (measured in terms of weak-acid-dissociable cyanide) from about 100 parts per million to 5 parts per million. After treatment, the tailings are pumped to a tailings impoundment (Dam 2B and 2A) located approximately 1 kilometre from the mill site. In the tailings impoundment, solids settle out and the clear supernatant is recycled back to the mill for reuse. Surplus effluent from the tailings is disposed to the natural environment, under the permission from the dignitaries in the local communities.
For further information on the operating results from Bong Mieu, refer to Operating Results at 5A.
| Phuoc Son Exploration & Development Expenditure |
The carrying value of the mine property and rights and deferred exploration and development costs related to the Phuoc Son Gold Property, is $2,286,349 and $14,459,318 respectively, as at June 30, 2012, and the carrying value of the property, plant, equipment and infrastructure for the Phuoc Son property is $27,098,950.
Phuoc Son Property Description and Location
The Phuoc Son Gold property, is located in the western highlands of Quang Nam Province, in central Vietnam, some 8kilometres (14.5 kilometres by road) northwest of the small town of Kham Duc and approximately 90 kilometres (140kilometres by road) southwest of the coastal city of Da Nang, the fourth largest city in Vietnam (see Figure 1).
36
Figure 1 (below) shows the location of the property, whilst Figure 2 shows the location of the South and North Dak Sa deposits and the location of principal facilities on the property.
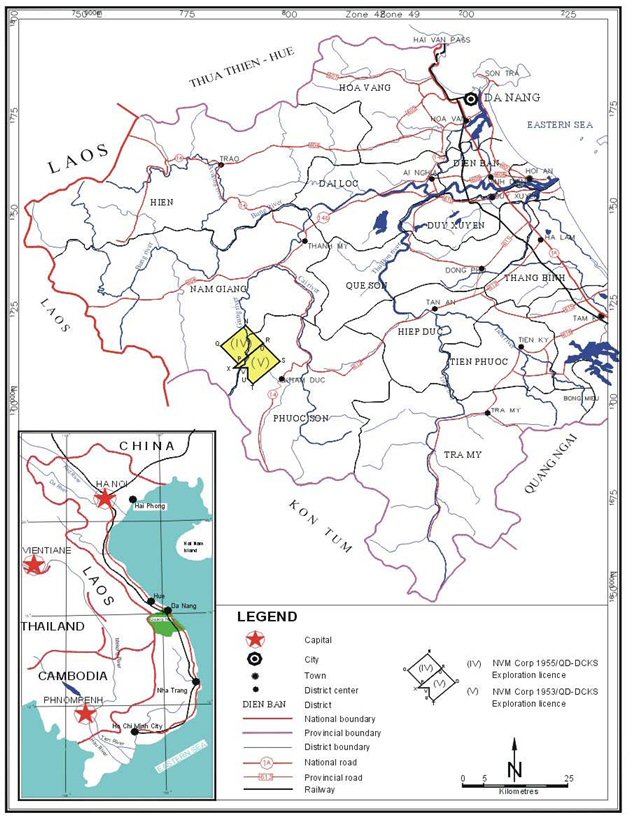
Figure 1. Phuoc Son Gold Property
37
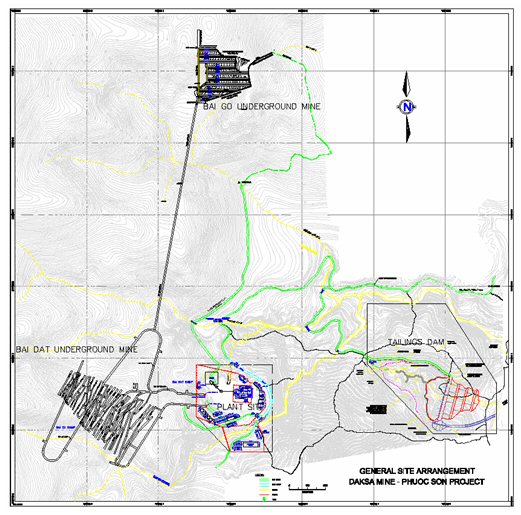
Figure 2. Project Site Plan for Bai Dat (South) and Bai Go (North) deposits
Accessibility, Climate, Local Resources, and Infrastructure for Phuoc Son Property
Access to the Dak Sa Project area within the Phuoc Son Gold Property is by 140 kilometres of bitumen road from Da Nang to Kham Duc. From Kham Duc to the mine area is approximately 14.5 kilometres on a newly upgraded access road. The South and North gold deposits lie about one kilometre apart and are linked together via a dirt road.
The climate is sub-tropical with average monthly temperatures ranging from about 27°C in June to 20.5°C in December, although it is reported that temperatures may fall below 15º C in the cold season. Average annual rainfall is 2,762.5 mm with the maximum average monthly value of 763.8 mm, which occurs in October.
The minimum average monthly precipitation value is for February and measures 30.9 mm. Regionally, the relative humidity is high and reasonably consistent year round, ranging from an average of approximately 83% in April to 93% in November and December. Storms often occur in Quang Nam Province in September, October and November and cause heavy rain and strong winds with an average speed of 65 kilometres/hr and a maximum of approximately 140 kilometres/hr.
The Phuoc Son Gold Property is located in the central highlands, an area that is one of the poorest regions of Vietnam. The local economy is primarily subsistence agriculture although local ongoing highway construction has provided a source of employment. Artisanal mining is ongoing on the Property and while this activity has reduced from past periods it is not strongly discouraged by the government as it helps reduce unemployment and stimulate the local economy. Olympus is doing its best to keep this activity in check. These miners may be suitable candidates for future Olympus development and mining operations.
38
Nearby communities include Phuoc Duc Commune (population ~1,990) and Kham Duc District Town (population ~6,560), where PSGC has its local headquarters. Although Kham Duc has a district hospital with out-patient facilities and limited trauma casualty facilities, health care and education facilities are considered inadequate, with a distinct division in the standard of services and socio-economic opportunity available to ethnic minorities.
Electricity is provided from the Vietnam national grid supplying 1.6 MW at 22 kV supply. Telecommunications facilities are good and include internet and cell phone service. Water, although often polluted by the artisanal mining, is readily available on and near the Property. The population density within the Dak Sa Valley is approximately 25 per km2. Except for small-scale slash and burn agriculture, the topographic relief in the area of the project area is unfavorable for farming activities.
Geology of Phuoc Son Property
Two major stratigraphic units are present on the Property as follows:
Kham Duc Formation (Proterozoic): This formation consists largely of sedimentary rock.
Avuong Formation (Paleozoic): This formation is distinctive as it hosts significant amounts of mafic volcanic rock types.
The most significant fault related to mineralization on the Property is the Dak Sa fault zone (“DSFZ”). The DSFZ runs North-South for over five kilometres through the centre of the Dak Sa Prospect (host to the South (Bai Dat) and North (Bai Go) deposits). The DSFZ appears to be primarily a thrust fault and features prominent gold mineralized quartz vein/breccias.
The Phuoc Son gold deposits are typical of those occurring within orogenic belts elsewhere in the world.
History of Exploration on the Phuoc Son Gold Property
A regional stream sediment survey was originally conducted in the Phuoc Son area in the early 1990’s, by a cooperative agreement between Indochina Goldfields Ltd and the Geological Survey of Vietnam. As a result of this, exploration licenses were applied for to cover geochemical anomalies in the Phuoc Son area. These applications were acquired from Indochina Goldfields by Olympus Pacific Minerals in 1997.
Olympus commenced exploration in 1998 and subsequently conducted staged exploration (carried out on behalf of Olympus through and by NVMC), including: inspection of artisanal underground workings, geological mapping, bedrock, float and channel sampling, soil geochemical surveying, geophysical surveys (ground magnetic surveying & self-potential) and diamond drilling. The initial exploration stages (Oct 1998 to Dec 2003) are described as follows:
· Stage 1 (October 1998 – March 1999): reconnaissance surveying of the then 100 km2 license area, identification of the three major mineralized shear structures, and commencement of detailed exploration over the first of these structures (the Dak Sa shear zone);
· Stage 2 (April 1999 – December 1999): continuation of detailed exploration over the southern end of the Dak Sa shear zone (including mapping/sampling and diamond drilling six holes at Bai Dat) and follow-up exploration at other sites (particularly at K7) within the balance of the license area;
39
· Stage 3 (January 2000 to June 2000): grid soil sampling in the Dak Sa & K7 shear zones, rock sampling, geological mapping, pan concentrate survey, diamond drilling of 29 holes at Bai Dat, Bai Cu, Bai Chuoi and Bai Go, within the Dak Sa shear zone;
· Stage 4 (July 2000 to December 2000): detailed geological mapping, nine km2soil survey north of Bai Go, rock geochemistry, petrology and diamond drilling of 17 holes at Bai Dat, Bai Cu, Bai Chuoi and Bai Go;
· Stage 5 (January 2001–December, 2001): continuation of drilling with 31 additional holes at the Bai Go, Bai Gio and Bo prospects, as well as geological mapping, rock and soil geochemistry, pitting, surface and underground channel sampling, petrology, and gridding at other prospects including K7, Hoa Son, Tra Lon, Suoi Cay, Vang Nhe, Khe Rin, Khe Do and Khe Cop;
· Stage 6 (January 2002 to December, 2002): scout drilling at the Khe Rin, North Khe Do, Khe Do, Bai Buom, Tra Long and K7 prospects (32 drillholes), as well as pitting at Nui Vang, geological mapping/sampling, soil geochemistry, ground magnetometer surveying at Khe Rin-Khe Do and Bai Buom, reconnaissance mapping elsewhere, including Vang Nhe, Tra Long, K7 and Hoa Son; commencement of mine scoping studies at Dak Sa; and
· Stage 7 (January 2003 to December 31, 2003): in-fill, step-out and geotechnical diamond drilling at Bai Dat, Bai Go, Bai Chuoi and Bai Cu (27 holes); preparation of mineral resource estimates for the Bai Dat and Bai Go deposits; continuation of the scoping studies. A diamond drilling program was completed at Bai Chuoi sector (between the Bai Dat and Bai Go deposits) and soil geochemical surveys were being conducted elsewhere on the property. As at December 31, 2003, accumulated deferred exploration costs were $3,320,716 and mineral properties was $904,605 for the Phuoc Son Gold Property.
Since January 2004, the exploration focus in the Dak Sa Zone has been onin-fill and step-out drilling to confirm deposit extents, upgrade and estimate resources to JORC/NI43-101 status, support tenure applications and the establishment of mining operations. Descriptions of the work completed each year are as follows:
In 2004: deep C-horizon soil geochem, ground magnetic and radiometric surveying were completed at the South Bai Cu, Round Hill, Ca Creek, Dak Sa, North Dak Sa, Bai Gio East, Bai Gio North, Hoa Son, K7 East and Tra Long prospects. A small orientation SP (self potential geophysics), program was completed at Nui Vang prospect. Geological mapping was conducted at Dak Sa, Quartz Creek, South Bai Cu, Round Hill, K7 and Ca Creek prospects. A BLEG and stream sediment sample program was completed over the northern section of the Phuoc Son investment licence not covered by previous surveys. Diamond drill programs were carried out at Bai Cu (4 holes), Bai Chuoi (one hole), Round Hill (5 holes), Nui Vang (3 holes), K7 (3 holes), Bai Gio North (6 holes), and Khe Rin (7 holes) prospects. Two metallurgic drill holes were completed at Dak Sa – South Deposit (one hole), and North Deposit (one hole). A geophysical consultant from Canada visited the property and filtered/processed all previous magnetic data to facilitate improved anomaly resolution. Based on what management considered to be favorable results, exploration continued into 2005. During the year ended December 31, 2004, $1,095,335 was incurred on mineral properties for the Phuoc Son Gold Property, excluding the impact of the vend-in transaction described in Item 4.D.1.
In 2005: Self Potential (SP), geophysical programs were completed over the Dak Sa sector, Hoa Son, Bai Gio North, Bai Gio East and Bai Cu prospects. Trenching and sampling at Bai Gio North and Bai Gio East was completed. Geological mapping was completed at Bai Gio North, Bai Gio East, Hoa Son and Bai Chuoi. Exploration diamond drilling programs were conducted at Bai Go North (one hole), North Deposit (9 holes), South Deposit (16 holes) and Bai Chuoi (3 holes). An intensive re-logging program was carried out on North Deposit drill core during the year, combined with structural studies and new drill sections prepared and reviewed for Dak Sa. Resource estimates were completed to update the South Deposit ore body, incorporating the results of the in-fill drill program. The results of exploration were favorable in 2005, especially in the Dak Sa area, resulting in further exploration work in 2006. During the year ended December 31, 2005, other capital expenditures of $1,805,607 were incurred for the Phuoc Son Gold Property.
40
In 2006: the Company had completed 63 drill holes totalling approximately 11,330 metres, mainly focusing on the North (Bai Go) Deposit, South (Bai Dat) Deposit, and other exploration holes on assorted priority targets in the Dak Sa area. These ongoing exploration activities resulted in additional positive drill results at Phuoc Son. Over the course of 2006, the North Deposit was significantly enlarged and then extended in excess of 900 metres in a north-south orientation. The drilling also confirmed that the deposit remains open for further expansion. In April 2006 resource estimates were updated internally by qualified persons using the original resource estimates audited by an independent engineering firm, as a base document. The April 2006 update was on the North Deposit ore body, incorporating the results of drilling to March 31, 2006. An in-house technical report was completed with respect to the North and South Deposits. An engineering firm was selected to complete an independent review of this technical report that would result in an issuance of a compliant independent Technical Report in Form 43-101F1 to NI 43-101. During the year ended December 31, 2006, other capital expenditures of $2,458,242 were incurred for the Phuoc Son Gold Property.
In 2007: 11,170 meters were drilled in 37 drill holes. The company reviewed all Dak Sa (VN 320) exploration results to date and conducted an updated resource assessment (released on 15/1/2008)based on drilling up to October 2007.Measured and Indicated resources were stated to be 600,260 tonnes at an average grade of 10.95 g/t for 211,325 ounces of gold. The M & I total comprised Measured Resources of 157,450 tonnes, grading 13.06g/t and Indicated Resources of 442,810 tonnes, grading 10.2g/t. Additional resources of 425,610 ounces are contained within the Inferred category (1,955,400 tonnes at 6.77 g/t).Reference is made to the technical report “Preliminary Assessment of the Phuoc Son Project” dated December 2007 posted on www.sedar.com under the Company’s filings for further details. Based largely upon this report, the decision was made to commence preliminary studies to determine the commercial viability of proposed mining development. During the year ended December 31, 2007, other capital expenditures of $5,064,000 were incurred.
In 2008: The Company completed 22 drill holes totalling 8,558 meters. Exploration work defined the “productive” Dak Sa shear deposit over a strike length of approximately five kilometers, expanded the Dak Sa resource base, and confirmed that the mineralization remained open along strike. During the fourth quarter of 2008 work was undertaken to re-evaluate the Reserves and Resources in the Phuoc Son Gold Property following drilling programs completed earlier in the year. The Proven and Probable Reserve Estimates, based on drilling up to December 31, 2008, stood at 930,390 tonnes at an average grade of 7.79 g/t for 233,150 ounces of gold. Measured and Indicated resources, based on drilling up to December 2008, stood at 709,670 tonnes at an average grade of 10.76 g/t for 245,470 ounces of gold. The Measured and Indicated total comprised Measured Resources of 163,320 tonnes, grading 12.76g/t and Indicated Resources of 546,350 tonnes, grading 10.16g/t. Additional resources of 401,640 ounces of gold are contained within the Inferred category (1,884,200 tonnes at 6.63 g/t).Also during 2008, the Phuoc Son Technical Report confirmed the feasibility of the Company’s goal to design and construct an efficient and environmentally sound operation that will bring economic benefits to the region and the shareholders. On March 26, 2008, the Company received a positive independent feasibility study in the Phuoc Son Technical Report, which confirmed the feasibility of the Company’s goal to design and construct an efficient and environmentally sound operation that will bring economic benefits to the region and the shareholders. On this basis, the Company determined to bring the Phuoc Son Gold Property into production. On August 28, 2008 the Company received approval from the Vietnamese authorities to conduct a trial test of the toll treatment of Phuoc Son ore at its Bong Mieu plant, with a view towards partially self-funding the Phuoc Son processing plant. The Company commenced sourcing high-grade ore from the Phuoc Son mine in a trial trucking and toll treatment operation in August 2008. The trial treatment operation was carried out over three months. Based upon the results of this test, the Company applied to the Vietnamese authorities for a permanent trucking permit to source and toll treat high grade ore from Phuoc Son through the Bong Mieu Gold Plant, and a temporary permit was granted in February 2009.During the year ended December 31, 2008, other capital expenditures of $4,630,344 were incurred.
41
In 2009: No additional exploration drilling was conducted during this year, but feasibility studies continued to re-evaluate the Reserves and Resources in the Phuoc Son Gold Property following drilling programs completed in 2008.As a result, the Company placed the Phuoc Son mine into commercial production effective October 1, 2009, with ore initially being trucked for toll treatment at the company’s Bong Mieu Mine. In September 2009 the Company was granted a trucking permit to truck ore from Phuoc Son to the Bong Mieu plant until December 2010 and the Company placed the Phuoc Son mine into commercial production effective October 1, 2009. The trucking permit was renewed effective March 15, 2011 until May 30, 2011. This permit allowed treatment of Phuoc Son ore through the Bong Mieu plant until commissioning of Phuoc Son’s new processing plant. During the year ended December 31, 2009, PSGC spent $323,170 on property, plant and equipment acquisitions and $2,416,768 on other capital expenditures.
In 2010: Exploration of the North and South Deposits continued and a new resource estimate update was completed in May 2010. This resulted in an approximate 16% gold resource increase, in comparison with results estimated in March 2008. The then current resource estimate (by block modeling, using Inverse Distance Square) was based on 157 drill holes and included additional mineralization extensions that had been intersected by step-out drilling in 2008 around the periphery of the South and North deposits. During 2010, no peripheral exploration drilling was conducted, but five holes (2,123m) were completed in Bai Chuoi and Bai Dat. At Bai Chuoi North, results confirmed the continuation of the mineralised structure to the NW. At Bai Dat, results indicated that the mineralisation host structure extends to the NE, NW and SW directions, beyond the boundary of the area currently being explored, still following the marble-argillite contact zone. Work on the process plant accelerated during the fourth quarter as all the major equipment arrived on site. The main civil works were completed and all the sections of the plant were in the final stages of construction. During the year ended December 31, 2010, PSGC spent $19,955,625 on property, plant and equipment acquisitions (including advances) and $4,099,686 on other capital expenditures.
In 2011: The first phase (9,000m in 26 holes) of a two-phase drilling program to upgrade inferred resources within the Dak Sa Shear to the north of Bai Go commenced in October 2011, continued throughout the fourth quarter. By the end of December 2011, 3,972.40 metres had been drilled in 13 holes and was continuing into 2012 with 2 holes still in progress as of 31/12/2012.Weak veining exposed in the Bai Chuoi cross-cut was examined with a view to Kempe drilling. A review of the down-dip projection of the Bai Dat ore body was conducted. Vein characteristics in Bai Dat Level 5 were found to support the proposed Level 6 development. No exploration drilling was conducted peripheral to Dak Sa.
A University of Tasmania PhD research project continued. The company entered participation in the UTAS CODES “Ore Deposits of SE Asia” project, from which the Company will derive the benefit of research results that are normally beyond the reach of an individual exploration company. Aside from exploration, the Company focus was upon completing construction of the new processing plant. This was commissioned in June 2011. The plant achieved designed processing capacity in the fourth quarter of 2011 and has since been in full commercial production.During the year ended December 31, 2011, PSGC spent $8,832,610 on property, plant and equipment acquisitions (including advances) and $5,826,577 on other capital expenditures.
42
During six-month transition period ended June 30, 2012: Within the Dak Sa Shear, first stage drilling to the north of Bai Go continued, with the objective of converting about 500,000oz of inferred resources to mining reserves. From January 1 to April 7, 2,952.07 meters were drilled in 23 holes. A review of partial results obtained up until end of March 2012 indicated that (i) Most of the thick intercepts of mineralization obtained to date in veins QTZ2 and QTZ3 occur within WNW-ESE trending shoots that remain open down-dip beyond the current drilling limits and (ii) the delineation of potentially mineable zones may entail increasing the average drilling density (to about 25 meters spacing).In view of the westerly increasing depth to the veins, underground exploration may be the preferred option for ongoing detailed resource definition and upgrade to mining reserves. At Bai Dat, vein characteristics in the lower levels of the mine supported Level 6. The Company’s participation in the UTAS CODES “Ore Deposits of SE Asia” project continued.
Work Plan for fiscal year ending June 30, 2013: The forward exploration programme provides for review of mineralization within the Bai Go-North sector of the Dak Sa shear, in order to determine the preferred option for ongoing detailed resource definition and upgrade to mining reserves. In light of the westerly increasing depth of the ore bodies, the cost/benefit of deploying an underground drilling rig will be determined. Subject to this review, further drilling will be conducted and a new resource report will be prepared to support a new (Bai Go-North) Mining License application. At Bai Dat, development and a new drill drive is under consideration for investigating the down-dip projection of the ore body. Consideration is also being given to step-out drilling to the south of Bai Dat. Peripheral to the Dak Sa shear, 1,350m of drilling is planned in 10 holes within interpreted Upper & Lower Shears and at Tra Long.
Mineral Occurrences on Phuoc Son Property
Since 1998, Olympus has discovered and explored 23 significant gold mineralization zones. The most important of these are the South and North Deposits within the Dak Sa Shear Zone, in the southern area of the property. Descriptions of these deposits and a summary of the other showings are as follows:
South Deposit (Bai Dat)
The South Deposit is hosted within the Dak Sa shear zone. Exploration to date has delineated one main mineralized quartz vein, which varies in thickness from one metre to over ten metres. The mineralized quartz contains pyrite, pyrrhotite, galena, sphalerite, and native gold, with total sulphides varying from less than 1% to more than 60%. The South Deposit has to date been mined (by room and pillar method) in over six Levels. The ore deposit remains open-ended down-dip to the NW. Further surface drilling in this direction however is constrained by rising terrain, with rapidly increasing depth to target in this direction. It is also possible that the mineralization may extend further along strike to the south. Current Bai Dat reserves and resources are as listed in the company’s reserve and resource table. With additional exploration, additional resources could be identified.
North Deposit (Bai Go)
The North Deposit is approximately 1 kilometre north of the South Deposit and is also hosted within the Dak Sa shear zone. The North Deposit is a sheeted quartz vein system, with widths of up to 32 metres. The Au-Ag-Pb-Zn mineralization is primarily fracture controlled in quartz. Drilling has delineated a thick central high-grade zone. An independent technical review was completed in March 2008 and an internal update of resources was estimated in May 2010. The deposit is currently being developed on three levels underground. Drilling has demonstrated that the mineralization extends along strike to the north for at least 900 metres and remains open down-dip to the west. Ongoing drilling in this area will focus on resource expansion as well as upgrading resources within the northern extension to reserve status for inclusion within a future Mining License application. Current Bai Go reserves and resources are as listed in the company’s reserve and resource table. With additional exploration, additional resources may be identified.
43
Other Phuoc Son Prospects
Exploration completed to date indicates that the Phuoc Son property contains 23 other significant prospects, on which follow-up exploration is required to evaluate the potential for commercial development. Some of these prospects appear to be within a stacked series of shear zones lying above and below the Dak Sa shear Zone. Further exploration of these will be conducted during the 2012 fiscal year.
Resource Estimates
Results of Phuoc Son exploration have periodically been quantified to JORC/NI43-101 status by resource estimation, as follows:
On January 30, 2004: Company estimate of resources was independently reviewed (by Watts, Griffis and McOuat Limited) in a report entitled “A Technical Review of the Phuoc Son Gold Project in Quang Nam Province, Vietnam”.This report is available at www.sedar.com.
On March 7, 2007: An in-house resource estimate update was made, incorporating drilling results up to October 2006.
On January 15, 2008: An updated resource estimate incorporated drilling results up to October 2007. This resource estimate was independently reviewed in a technical report entitled “Technical Report on Feasibility Studies for the Phuoc Son Gold Project in Quang Nam Province, Vietnam” authored by independent mining and geological consultants, Terra Mining Consultants/Services & Associates(the “Phuoc Son Technical Report”). The full text of the report is available at www.sedar.com.
In May 2010: An in-house resource estimate update was made, incorporating drilling results up to the end of 2008.
In September, 2012: An in-house resource estimate update was in progress, incorporating drilling results up to April, 2012. This is expected to be released before the end of the calendar year.
Current Phuoc Son Gold Property JORC/NI43-101 status resources and ore reserves are as stated in the Global Reserves and Resources table at 4D.
Bong Mieu Gold Property, Vietnam
The Company currently holds an 80% interest in the Bong Mieu Gold Property. The Company acquired its interest in the Bong Mieu Gold Property in September 1997 by acquiring 100% of Bong Mieu Holdings, Ltd. from Ivanhoe Mines Ltd (formerly Indochina Goldfields Ltd.). The Company has a 100% interest in Bong Mieu Holdings Ltd., which holds an 80% ownership interest in Bogomin, a joint venture enterprise incorporated in Vietnam. The other 20% of Bogomin is owned by two Vietnamese former governmental organizations, MIDECO (10%) and MINCO (10%).
The Company manages the operations at the Bong Mieu Gold Property on behalf of the joint venture, including exploration programs. The property covers four known deposits, namely Ho Gan at Bong Mieu Central, Ho Ray and Thac Trang at Bong Mieu East and Nui Kem at Bong Mieu Underground as well as several other mineralized occurrences.
44
The Company initially developed proven and probable reserves at Bong Mieu Central (Ho Gan), which contributed to the Company’s decision to commence mine and processing plant construction and gold production. Bong Mieu Underground (Nui Kem), an underground deposit that was operated by the French from 1896 to 1941, is located within one kilometre of the Bong Mieu Central plant.
Exploration work to date has resulted in a significant new discovery at Bong Mieu East in the eastern area of the property, as well as a number of new surface showings. There is potential for additional discoveries and resource expansion based on work completed to date.
The joint venture has a term of 25 years starting from the date of issuance of the investment license, after which an application can be made for extension. The investment capital of Bogomin as provided by the investment certificate, as amended, is USD$40,000,000. The legal capital of Bogomin is $3,000,000 with $2,400,000 contributed by the Company via its subsidiary, BMHL, and $300,000 contributed by each of MINCO and MIDECO. The joint venture profits shall be shared as follows: 10% for MIDECO, 10% for MINCO and 80% for BMHL.
Licensing Tenure
Investment Certificate
The property is covered by a 25-year Investment Certificate (Investment Certificate No. 331022000008) covering 30km2 ha initially granted in March, 1991 with the Company’s interest at that time being held by Covictory Investment Limited. The Company, through its subsidiary Bong Mieu Holdings Ltd. (“BMHL”), is a successor in interest to Covictory Investment Limited, which assigned all of its share capital, obligations, and rights to BMHL pursuant to an amendment to the investment certificate dated November 29, 1993.
The Investment Certificate permits the company to explore for, mine, refine, export and sell gold from Bong Mieu during the 25 year term of the license. A mining license (ML592/CNNg covering Ho Gan and Nui Kem), a tailings area and a construction area (on the camp/office area), covering a total of 365 ha are located within the investment certificate area.
The original Investment License was dated March 5, 1991 and amended on November 29, 1993 permits the establishment of a joint venture company, Bogomin to carry out gold mining and exploration at the Bong Mieu Gold Property. Pursuant to a new legislation, the original Investment License was converted into an Investment Certificate on June 9, 2005. The investment certificate is due to expire March 5, 2016. The Company has commenced discussions with the Vietnamese governmental authorities regarding renewing the investment certificate.
Pursuant to the terms of the investment certificate, Bogomin is exempt from import duties for all materials, equipment and spare parts imported by Bogomin and the product of Bogomin is licensed for export and sale in Vietnam. Bogomin must pay a 3% net smelter return royalty to the Vietnamese government, pay specified rent of US$200 per hectare per annum for land, remit corporate profit tax equal to 18% of profits for the first five years of profit (after five years the tax rate will be determined but will not exceed 25%). However, Bogomin is exempt from corporate profit tax for the first two profit-making years.
45
Mining Licensing
The Mining License (ML592/CNNg, covering Ho Gan and Nui Kem) was granted on July 22, 1992 with a 25 year term expiring July 22, 2017. The mining license permits the mining of gold at the Bong Mieu gold mine covering a total mining area of 358 ha including an open pit area of 230 ha, an underground mine of 100 ha and a tailings area of 28 ha. The Bogomin must submit a mining report annually to the Ministry of Heavy Industry and the State Mineral Resources Management Department.
Application for another Mining License is proposed to cover the Bong Mieu East (Ho Ray-Thac Trang) deposit. The Company received approval from the Council for Mineral Reserve Evaluation (“CMRE”) for its reserve report on the Stage 1 (Ho Ray) portion of this deposit on June 1, 2012 and intends to file a mining license application prior to the end of the 2012 calendar year, after completing the requisite supporting pre-feasibility and environmental impact assessment documentation.
Exploration Licensing
Bong Mieu exploration license 2125/GP BTNMT was granted on December 15, 2008. The Company had previously been conducting exploration activities under the investment license. Under Vietnamese law, an exploration license is required in order to get new or amended mining licenses. The Exploration license initial term is two years and thus expired in October 2010. The Company has applied for a two-year renewal of its exploration license over a 18.5 km2 area in the Bong Mieu project area. This application, (together with several other planned exploration license applications within the investment certificate area) is presently on hold pending Governent confirmation that the area not subject to competitive mineral rights bidding.
Other Licensing and Permitting
On October 9, 1993, a Land Use certificate was issued to Bogomin by the People’s Committee of Quang Nam-Da Nang Province for the Bong Mieu gold mine. The certificate covers a 365 ha area of which 300 ha is gold mining land, 32.3 ha is waste dumping land and 2.7 ha is for basic construction. The Land Use Certificate has a term of 25 years from September 1992 to September 2017.
On January 9, 2011, Bong Mieu Gold Mining Company obtained the renewed annual gold export certificate to allow for exportation of any dore that is produced by the Company. The gold export certificate expires on December 31, 2012.
Production History and Processing Facilities
The Company constructed the Bong Mieu Central open pit mine and associated infrastructure in 2005 and 2006, with commercial gold production starting in October of 2006.
Production at the Bong Mieu Central plant has steadily improved since commercial production began as a result of improved throughput levels, grades, and recoveries. Ongoing improvements have been made to increase recovery and capacity including the installation of a control monitoring system in the first quarter of 2007 and, in the first and second quarter of 2007, installation of a third detoxification tank and absorption tank to scavenge gold in solution from the leach tails.
The Bong Mieu Underground project was placed into commercial production on April 1, 2009. During 2009, the Company filed a Nui Kem Environmental Impact Assessment Report submitted to Department of Natural Resources on December 10, 2009. Formal inspection occurred early in the first quarter of 2010. All Environmental Impact Assessment amendments and requirements, as advised by the Department of Natural Resources, were complied with.
46
During 2009, mining and processing of ore from the Bong Mieu Central pit was cut back to allow more of the high grade Phuoc Son ore to be processed in the plant.
Mining and processing of ore from the Bong Mieu Central pit was also cut back in 2010 to allow more of the high grade Phuoc Son ore to be processed in the plant.
Ore from the mines is delivered to the mill and is then processed through a primary jaw crusher and two cone crushers, standard and short head. The crushed product is subsequently fed to the grinding circuit, consisting of two ball mills operating in a closed circuit with hydrocyclones. The ground particles from the ball mill reports to two gravity concentrators. The gravity gold bearing concentrate is processed via shaking tables to recover gold for smelting. The tails from the gravity circuit is processed through a flotation circuit to separate the gold bearing sulphide minerals. The sulphide concentrate, is thickened and pumped to the ILR (intensive leach reactors) circuit and gold is extracted via cyanidation leaching process. The gold bearing solution from leaching is treated with activated carbon to recover the dissolve gold in solution. The gold bearing carbon solids is the classified using a vibrating screen and ashed to eventually produce a dore gold bar.
Prior to the disposal of cyanide leached stream tails, the pulp is subjected to cyanide detoxification. This results in a reduction of cyanide levels (measured in terms of total cyanide) from about 100 parts per million to 5 parts per million. After treatment, the detoxified tailings are pumped to a tailing impoundment (Dam 3A and 3B) located approximately 1 kilometre from the mill site. The flotation tails is pumped to Dam 1A containment area. . In the tailings impoundment, solids settle out and the clear supernatant is recycled back to the mill for reuse. Surplus effluent from the tailings is disposed to the natural environment, under the permission from the dignitaries in the local communities.
In late 2011, the mill was upgraded to increase recovery and lower operating cost via material/reagent consumption. The overall objective of the project was to eliminate the aging ILR (intensive leach circuits) and replace the units with up to date technology of CIL (carbon in leach) tanks. The residence time for cyanide leaching was increased from 7 hours to 24 hours which provided for the gold particles to be leached efficiently. With the increased in cyanidation leach time, lower dosage of reagents are utilized in the milling process which reflects in the overall lower operating cost while improving recovery significantly.
Effective April 2012, the Ho Gan open pit was mined out and mining operations ceased. Further, in August 2012 management determined that Ho Gan underground operations were no longer profitable as the grade had dropped to approx 2 g/t Au and operating costs rendered continued production unprofitable. The mine was closed effective August 16, 2012 and was flooded and secured to allow future access if economic circumstances change. Equipment has been deployed to other sites within the group and staffing reassigned.
For further information on the operating results from Bong Mieu, refer to Operating Results at 5A.
Exploration and Development Expenditure
The carrying value of the mine property and rights and deferred exploration and development costs related to the Bong Mieu Gold Property, is approximately $1,719,195 and $6,145,341 respectively, as at June 30, 2012, and the carrying value of the property, plant, equipment and infrastructure for the Bong Mieu Gold Property is approximately $1,531,538.
47
Bong Mieu Property Description and Location
The Bong Mieu property is located in the Tam Lanh Commune of the Tam Ky District, in the southeast corner of Quang Nam Province in central Vietnam. It is some 20 kilometres south of the provincial capital of Tam Ky which lies about 60 kilometres south of the city of Da Nang along Highway 1 (see Figure 3).
The Bong Mieu Central (Ho Gan) gold deposit is located some 2 kilometres south of the Bong Mieu camp and offices on the southern side of the Bong Mieu River. Figure 4 shows the location of the Ho Gan, Bong Mieu East (Ho Ray) and Nui Kem deposits and the other principal occurrences on the property.
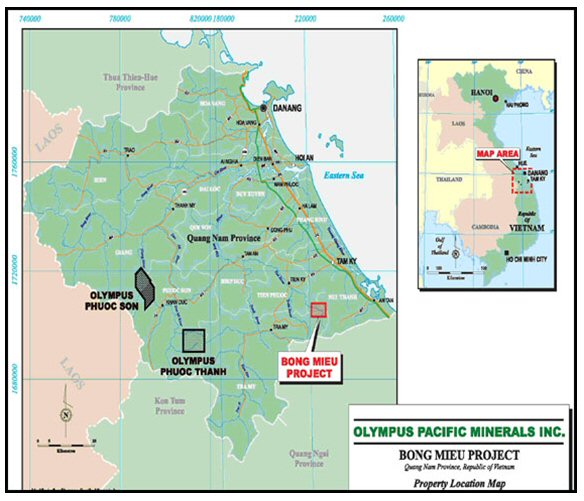
Figure 3: Bong Mieu Gold Property
48

Figure 4: Ho Gan Mining Map
Accessibility, Climate, Local Resources, and Infrastructure for Bong Mieu Property
Access to the Bong Mieu Project area is by 90 kilometres of bitumen road from Da Nang, via Tam Ky to Tien Phuoc. The Bong Mieu Central (Ho Gan) Mine is accessed from Bong Mieu via previously constructed dirt tracks. Some of these are heavily eroded in places but can easily be reformed by bulldozer and faced with rock to provide all weather access.
The monsoon tropical climate has temperatures varying from a high of 42°C in summer to 16°C in winter, although it is reported that temperatures may fall below 16°C in the cold season. Rainfall records from the weather station at Bong Mieu show an average annual rainfall of 4,086 mm over a 2 year period (August 1993 to July 1995) with a minimum annual rainfall of 2,935 mm and a maximum annual rainfall of 5,265 mm. Generally, 80% of the total annual precipitation occurs within the wet season (September to December) with the greatest precipitation occurring in October. January through August are generally drier months, with less than 180 mm of precipitation per month and January to April are typically extremely dry. Regionally, the relative humidity is high and reasonably consistent year round, ranging from an average of approximately 83% in April to 93% in November and December.
Most of the property associated with the Bong Mieu Gold Property is relatively rugged with steep slopes and valleys. Maximum elevation is approximately 500 metres above sea level. The flattest portion of the property is cultivated but the remainder has second and third growth forest.
The Bong Mieu property is near the commune of Tam Lanh which comprises 10-12 villages and a population of between 5,000 to 10,000. The commune provides a medical clinic and primary schools. The local economy is based on agriculture although some employment is found in local construction and a small amount of artisanal gold mining, both on the property and outside.
49
Electrical power via the national grid is close to the property and reaches the villages. Water is available on the property from the local rivers.
| Geology of Bong Mieu Gold Property |
The Bong Mieu Gold Property lies proximal to the Phuoc Son Suture, which separates high-grade metamorphic Precambrian terrain of the Kontum Massif to the south from lower-grade metamorphic of the Truong Son fold belt to the north. This suture is one of the most important structural controls of gold mineralization in central Vietnam. The Bong Mieu area mainly comprises Lower Proterozoic metamorphic (gneissic granite, biotite-sillimanite gneiss and biotite-quartz gneiss and schists). At Bong Mieu, most of the mineralization identified to date is hosted within a strataform unit, which has been folded around a SE plunging anticline (Bong Mieu Anticline). The gold mineralization is typically associated with sulphides (pyrite and galena, with subordinate sphalerite and pyrhotite. Sulphide content is typically in the order of 10%, but locally up to 70%, or more. There are a number of exploration sites, plus three principal mining deposits, as follows:
Bong Mieu Central (Ho Gan Deposit)
The Ho Gan gold mineralization comprises sulphidic quartz veins and hydraulic breccias, hosted within altered intrusives. The deposit is flat lying, more or less conformable with topography, outcrops over an area of 1000 metres by 800 metres and extends to vertical depths of up to 15 metres. This deposit has now been largely mined out by open-pit.
Bong Mieu East (Ho Ray Deposit & Thac Trang)
Mineralization is hosted by quartz veined and sulphide bearing skarn zones, granite gneiss and schists that strike E-W to NE-SW along the northern limb of the Bong Mieu Anticline and dip moderately to the E and NE. The mineralization is associated with skarn zones with appreciable scheelite content. Post mineralization pegmatite dykes are common. This deposit is presently proposed as a new open-pit development.
Nui Kem
Quartz-sulphide vein mineralization is hosted within a sequence of altered schists and gneisses that strike NE-SW along the southern limb of the Bong Mieu Anticline and dip shallowly to the SE. There are 5 known vertically stacked veins. Mining by the company has to date been confined to two (known as Main and Upper Veins). The deposit extends for over 3 km along strike and remains open in the down-dip direction. The veins are hosted within shear/thust fault zones. Nui Kem has historically been extensively mined under French administration from the 1890’s up until WWII. Underground mining by Bogomin is presently in progress.
History of Exploration on Bong Mieu Gold Property
In 1994-1996: Bogomin first conducted prospect wide geological, geochemical and geophysical surveys, funded by Indochina Goldfields Ltd. The property was subsequently acquired from Indochina by Olympus in 1997.
From 1997 until late 2001: Olympus (as operator of Bogomin), carried out only minimal field, owing to perceived low-grade nature of the mineralization, coupled with low gold price and depressed commodity market. During this period, a small staff was employed to maintain a presence at the field office, to keep the Property secure and discourage artisanal mining as much as possible.
50
In 2002: The commodity markets improved and Olympus resumed exploration at Bong Mieu. The property database was reviewed, mapping and sampling carried out and historic Mineral Resource estimates reassessed, in part by geologists who had worked on the property previously. A start was made on preparing updated JORC-compliant Mineral Resource estimates and forward exploration programmes were designed.
In 2003: Regional and property scale geological mapping and geochemical rock sampling was completed. By the end of 2003, several areas were identified as meriting follow-up work. As at December 31, 2003, accumulated deferred exploration costs were CAD$517,079 and mineral properties was CAD$3,944,000 for the Bong Mieu Gold Property.
In 2004: The Bong Mieu Central (Ho Gan) deposit was identified as having potential for early mining development. An infill and step-out diamond drilling program comprising 228 holes was undertaken. The holes were drilled vertically, on approximately 25 metre centers to depths ranging from 5.0 to 36 metres. The objective of the drill program was to define the limits of the deposit, estimate resources to JORC/NI43-101 status and provide data for detailed engineering of open-pits and preparation of production schedules. The program successfully expanded the limits of known Ho Gan mineralization and established continuity of mineralization between three previously discrete resource areas. At Thac Trang, immediately southeast of the Ho Ray deposit, a 15-hole program was completed in July 2004. It encountered encouraging results which management believed warranted additional exploration in 2005. During the year ended December 31, 2004, other capital expenditures of CAD$2,847,014 were incurred for the Bong Mieu Gold Property.
In 2005: At Bong Mieu Central (Ho Gan Deposit), new Ho Gan open pit deposit resource estimates were completed in March of 2005, based on the drill and assay results from the 2004 programme. Largely at the behest of the Provincial Government, a decision to develop a “demonstration mine and process plant” was made. Three shallow exploration/condemnation holes (comprising 54 metres) were drilled, engineering, metallurgical and environmental studies were completed and construction of the Ho Gan mine process plant, tailings dams and related infrastructure commenced. At Bong Mieu East, a diamond drilling program during the early part of 2005 continued to evaluate the Thac Trang discovery. At the Nui Kem underground mine, five widely spaced exploration holes were completed. The drill program successfully confirmed the down-dip continuation of the main Nui Kem structure over a strike length of approximately 1.7 kilometres and to a depth of 250 metres below the deepest underground development level. During the year ended December 31, 2005, CAD$5,577,384 was spent on capital assets and CAD$2,794,000 was spent on other capital expenditures for the Bong Mieu Gold Property.
In 2006: Exploration, infill and metallurgical drill programs continued in the Bong Mieu East area. Through December 2006, Olympus completed 66 drill holes totalling approximately 3,020 metres. Metallurgical test-work on representative Bong Mieu East ore types was conducted. Preliminary exploration programs, including drilling, were initiated to evaluate the economic potential of two new prospects, Ho Gan East and Bong Mieu West. At the Nui Kem mine, an exploration decline portal was completed and the first 70 metres of the decline were developed. During the year ended December 31, 2006, other capital expenditures of CAD$3,147,855 were incurred for the Bong Mieu Gold Property.
In 2007: On October 9, 2007, the Company reported increases to the mineral resources at the Bong Mieu Gold Property as outlined in a Technical Report prepared by TMC/SA. The full text of the report is available at www.sedar.com. During the year, Olympus completed 15 drill holes totalling approximately 1,615 metres at Bong Mieu. The bulk of this drilling was focused on the Nui Kem/Saro Hill areas which host vein structures parallel to the main Nui Kem vein system. Other capital expenditures of CAD$1,870,000 were incurred for the Bong Mieu Gold Property during the year.
51
In 2008: Geological mapping at Suoi Tre, followed up a deep soil sampling program undertaken in 2007 and confirmed the presence of a steep SE-dipping mineralized structure. A program of consolidating the ground-based and remote sensing data was completed by Encom in the second quarter of 2008 and follow up field work was commenced in the third and fourth quarter of 2008. In the first quarter 2008 the first ore targets were intersected at the Bong Mieu Underground Deposit. The decline development to the lowest level of the old French mine was completed in the second quarter, which lead to partial development and stoping in the third quarter of 2008. The Bong Mieu exploration licence No 2125/GP-BTNMT was received and registered with the DGMV in the fourth quarter of 2008. The Company completed 35 exploration drill holes totaling approximately 5,062 metres on the property. The bulk of this drilling was focused on the Ho Ray and Nui Kem West sectors. During the year ended December 31, 2008, other capital expenditures of CAD$4,183,755 were incurred for the Bong Mieu Gold Property.
In 2009: During the year, the Company established a 64% upgrade of Gold Resources at Bong Mieu East and a preliminary financial assessment of Bong Mieu East was completed. Improvements to the Bong Mieu gold process plant were also completed to allow more efficient toll processing of the high grade ore from Phuoc Son. By end of year, production had been increased to 40,000 oz annualized. In the quarter of 2009, the Company also placed its Nui Kem (Bong Mieu Central) underground mine into production. During the year ended December 31, 2009, Bogomin spent $1,088,427 on property, plant and equipment acquisitions and $1,906,778 on other capital expenditures.
In 2010: At Bong Mieu Central (Ho Gan Deposit), two exploration holes, totalling 291 metres length were drilled on the south of Bong Mieu Central in September 2010 to test the southern extension of the Ho Gan mineralized structure. These two holes were successful in intercepting the Ho Gan mineralization host structure at its projected depths. Although the thickness and grade of the above intersections were not economically viable, they confirmed the continuation of the mineralization to the south, beyond the Ho Gan deposit boundary. Exploration in the final quarter of 2010 consisted of one hole being drilled (declined westerly) to test the potential at depth of the mineralised granite outcrop east of Dam 3. The hole did not intersect the target, which was thought to either dip easterly, or be faulted or pinched out at depth. At Bong Mieu East (Ho Ray Deposit and Thac Trang Prospect), infill drilling program commenced in late June 2010, and concluded in September 2010, with a total of 1,291m drilled in ten holes. All assays were received during the fourth quarter of 2010 and the updating and modification of geological models was completed. During the year ended 31 December, 2010, $1,282,332 was spent on property, plant and equipment acquisitions and $4,689,381 on other capital expenditures.
In 2011: At Bong Mieu Central (Ho Gan Deposit), exploration continued with the commencement of a drill programme of 1,900m in 30 holes. The results showed marked gold grade and thickness variation. A small (10,000-20,000 ton) potentially mineable open-pit extension was located. A review of 2006 data revealed several prospective anomalies, at depth below Ho Gan pit and in an area designated Ho Gan-West. However, two holes, which tested the Ho Gan-West mineralised breccia, did not intersect significant mineralization and drilling was suspended. At Bong Mieu Underground (Nui Kem Deposit), two exploration holes were drilled on the Nui Kem northern slope to probe the Ho Gan projection within the Nui Kem footwall sequence. Both holes intersected a sheared, altered and mineralized (sulphidic) zone at the projected depth, but insignificant mineralization was intersected. Drilling was suspended.In addition, exploration drilling was conducted to test the eastern extension of the Nui Kem main vein system. Total drilling at Nui Kem for 2011 was 2,152.3 meters in 8 holes (drill holes NKDD017-024). Drilling results to date indicated that the best resource potential of the Nui Kem Main Vein lies down dip (SE) from NKDD019 and the best Nui Kem Upper Vein potential lies up-dip (NNW) and down-dip from holes NKDD017 and 018. At Bong Mieu East (Ho Ray Deposit and Thac Trang Prospect), the geological model was updated with results from 2010 infill drilling. During the third quarter, a resource update was internally reported and is reflected in the Global Reserves and Resources table at 4D, above. Further, Bogomin decided to split the overall Ho Ray-Thac Trang mine development into two stages. The first stage was to focus on a 2M tonne block containing most of the Ho Ray oxide resources with the second stage including the balance of the resource. For 2011, 1,426.30 meters were drilled in 21 holes. The geological model was updated and financial modeling was conducted at various production scenarios. Mine planning, evaluation of process options and compilation of an environmental impact assessment report commenced. The Ho Ray Reserve Criteria Proposal report was submitted to the CMRE on December 27, 2011.
52
Work for transitional six-month fiscal year ended June 30, 2012: At Ho Gan-South Underground, the Company determined that the ore zone plunges southerly into steeply rising terrain, beyond open-pit stripping limits, but because exploration drilling within this area has to date been sparse, no JORC/NI 43-101 resources were established.
An integrated surface and underground exploration program was proposed between Ho Gan South and the Nui Kem ore-body.
At Nui Kem, underground exploration and production from the recently discovered Nui Kem upper vein continues. Although both upper and main veins pinch and swell, mineable grades over widths of up to several meters continue to be encountered on both east and west headings. Exploration of the 3 km long Nui Kem stacked vein system however is currently at an early stage and additional unexplored potential lies in at least three other stacked veins above the two that have been mined to date. Specification of an integrated surface and underground exploration program is accordingly in progress to supersede the 1993 CRM estimate and generate current JORC/NI 43-101 resources and reserves. As noted above, this program will also cover the Ho Gan-South ore body.
Exploration at Bong Mieu East has been subdivided into two sequential stages. The first encompasses the Ho Ray resource block in respect of which a resource report received CMRE approval in April. This will form the basis of a mining license application in the 2nd half of 2012. The second stage provides for incremental pit expansion to include the balance of Ho Ray, plus Thac Trang. The Company also provided assistance for a three-year research project entitled “Ore Deposits of SE Asia” and participation in the project is ongoing. The project is run by the University of Tasmania (“UTAS”) Centre of Excellence in Ore Deposit (CODES) in which mineral industry sponsors help to fund the research. The Company will derive the benefit of research results that are normally beyond the reach of an individual exploration company.
Work plan proposed for fiscal year ending June 30, 2013: At Nui Kem, the Company intends to conduct underground mapping and sampling and the contracting of an underground drill rig is proposed for underground exploration and to guide new development headings on both main and upper veins. At Ho Ray-Thac Trang deposit, further resource studies will be conducted for input into feasibility and environmental impact assessment studies for the proposed new open-pit development. A new mining license application is expected to be lodged in respect of the Ho Ray resource block, while conceptual mine planning, feasibility and environmental studies will be conducted in respect of the rest of the Ho Ray-Thac Trang deposit area. Work in support of an application for extension to the term of the Bong Mieu Investment Certificate will also be carried out.
Main mineral occurrences on Bong Mieu Property
The majority of gold deposits and prospects on the property lie within the core and on both limbs of the Bong Mieu anticline. Mineralization at all locations, except that at Ho Ray, occurs within shears that host quartz+sulphide veins, brecciated quartz+sulphide+schist and/or sulphide bearing schist. The Ho Ray mineralization occurs within calc-silicate lithologies and underlying quartzite, biotite schist and gneiss. The mineralization has an apparent stratabound distribution. The most significant mineral occurrences on the property are Ho Gan, Ho Ray and Nui Kem.
53
Ho Gan (Bong Mieu Central)
Gold mineralization is located within several closely stacked shallow dipping shears that host quartz+sulphide veins, brecciated quartz+sulphide+schist, and/or sulphide bearing schist (occasionally oxidized and carrying limonite/goethite). Some shears have demonstrated lateral extent to some 2 kilometres. The most common sulphide is pyrite. Galena and arsenopyrite also occur. Much of the deposit outcrops and extends to shallow depth beneath the surface; varying in thickness up to 11.60 m
Ho Ray and Thac Trang (Bong Mieu East)
The Ho Ray-Thac Trang gold deposit comprises sulphidic quartz vein and calc-silicate (skarn) mineralization. The skarn gold is associated with significant tungsten (scheelite) mineralization and subordinate molybdenite and fluorite mineralization. The tungsten is potentially economically recoverable, but the molybdenite and fluorite mineralization is probably subeconomic. The mineralization outcrops and strikes along the northern limb of the Bong Mieu Anticline, dipping shallowly to the northeast.
Nui Kem (Bong Mieu Underground)
Gold mineralization is hosted by a stacked series of quartz+sulphide veins that occupy thrust fault within quartz+feldspar+biotite schist and gneiss country rocks that strike NE-SW along the southern limb of the Bong Mieu Anticline; dipping shallowly to the SE. The common sulphide minerals are pyrite, galena, sphalerite and lesser pyrrhotite. The veins vary in thickness up to 2.2 metres and average bout 1.0 metre. The Nui Kem main vien has been exploited over a strike length of some 2.5 kilometres and down dip for at least 350 metres.
The Bong Mieu property hosts five other gold occurrences that warrant additional exploration to determine economic viability.
Resource and Reserve Estimates for Bong Mieu Property
Refer to the Global Reserves and Resources table at 4D for detail of mineral resource and ore reserves for the Bong Mieu Gold Property
Bau Gold Property, East Malaysia
The Bau Gold Project comprises consolidated mining and exploration tenements that collectively cover more than 1,340 km2 of the most highly-prospective ground within the historic Bau Goldfield, in Sarawak, East Malaysia. In operation since 1864, this goldfield has estimated total historic gold production of approximately 3-4 million oz of gold of which approximately two million oz of gold production has been recorded. Regional analogy with goldfields across the border in Kalimantan suggests significantly greater remaining potential.
Following the amalgamation with Zedex in January 2010, the Company acquired a 50.05% controlling interest in and became the operator of the Bau Gold Project as part of a joint venture agreement with a local Malaysian company. On September 30, 2010 (as amended May 20, 2011 and further amended January 20, 2012) the Company entered into an agreement to acquire a further 43.50% interest in NBG by January 2014. The settlement is to be paid in several tranches as set out below and will bring the Company’s effective interest to 93.55%. As a result, the Joint Venture agreement was revised to deal with a number of operational and governance matters.
54
These transactions can be summarized as follows:
Purchase Price | Purchase Date | North Borneo Gold Sdn Bhd Class A Shares | Company's Effective Holding | ||||||||||
| Tranche 1 | $ | 7,500,000 | 9/30/2010 | 31,250 | 62.55 | % | |||||||
| Tranche 2 | $ | 7,500,000 | 10/30/2010 | 31,250 | 75.05 | % | |||||||
| Tranche 3a | $ | 6,000,000 | 5/20/2011 | 13,700 | 80.53 | % | |||||||
| Tranche 3b | $ | 3,000,000 | 1/20/2012 | 6,800 | 83.25 | % | |||||||
| Tranche 3c | $ | 2,000,000 | 1/28/2013 | 4,500 | 85.05 | % | |||||||
| Tranche 4a | $ | 3,000,000 | 9/13/2013 | 7,000 | 87.85 | % | |||||||
| Tranche 4b | $ | 6,000,000 | 1/21/2014 | 14,250 | 93.55 | % | |||||||
| 108,750 | 93.55 | % | |||||||||||
The agreement includes a condition subsequent that must be met before the Tranche 3c payment is required to be settled. The condition subsequent requires the vendor to obtain:
| a) | All renewals or grants (as applicable) of mining licences and mining certificates relating to the Jugan deposit (including, without limitation, the renewal of mining certificate MD 1D/1/1987 relating to the Jugan, Sirenggok and Jambusan areas) on terms acceptable to Olympus in all respects; and |
| b) | All ministerial, governmental and other regulatory approvals to ensure that the mining licences and certificates referred to at a) above are valid and effective in all respects in accordance with applicable laws and regulations |
If the condition precedent to tranche 3c is not met, tranches 3c, 4a and 4b settle without any further consideration payable by Olympus. In addition, on completion of Tranche 3c the right of the vendor to appoint a director to the board of NBG ceases. There are no conditions specific to the settlement of tranche 4a or tranche 4b.
Bau Gold Property Description and Location
The Bau Gold project area is centered on the township of Bau, about 35 kilometres WSW from the port city of Kuching. Kuching is the state capital (population in excess of 650,000) and has an international airport and two deep water ports. The project area is serviced by a network of sealed roads.
55
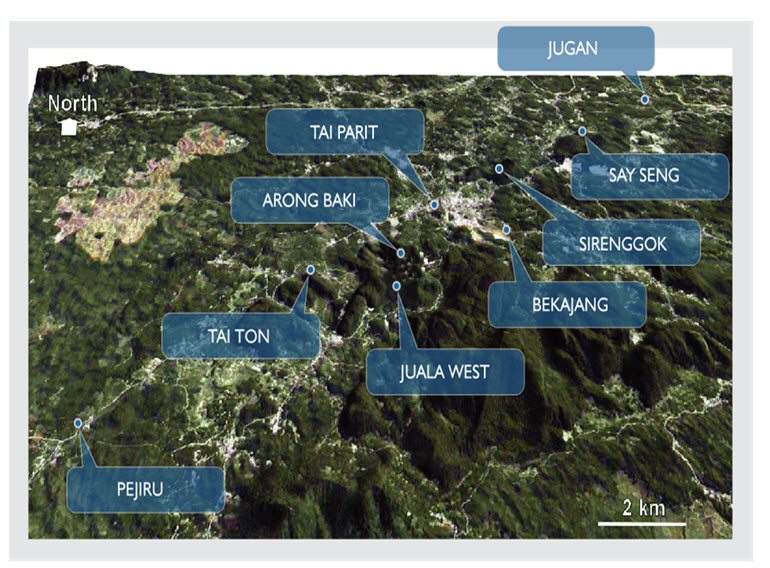
Figure 1: Bau Gold Property
Bau Gold Property Accessibility, Climate, Local Resources, and Infrastructure
The area is of tropical climate with annual rainfall in the order of four metres up to six metres. The highest rainfall months are between December and January, but with significant rainfall events possible all year round.
The morphology of the Bau area is striking. Tropical karst limestone blocks rise up to 350 m above peripheral lowland plain of 10 m to 20 m elevation.
Much of the area is covered by milled modified tropical rain forests, with sporadic Kampong style residential developments.
The Bau Project features excellent infrastructure, comprising regular and reliable international air services to Kuching from Kuala Lumpur, Singapore, Hong Kong and Indonesia. There are two ports with good dock and storage facilities and main sealed trunk roads from Kuching for delivery of supplies, heavy plant and equipment to the site. There is excellent labor and engineering support services. Accessibility is easy with the exploration base being less than 20 minutes’ drive to the extremities of the project area. Roads within the project area connect all of the important deposits. The area is serviced with power, water and communications.
56
Bau Gold Property Geology
Analysis of historical technical data and reprocessing of geophysical datasets coupled with detailed field work to date has revealed the existence of various mineralization styles and setting, each with the individual potential to host a multi-million ounce gold resource. Four relatively un-explored, large-scale mineralization styles are present, as follows:
Intrusive porphyry-gold and adjacent skarn deposits: Historic drillhole information and diagnostic surface exposures are indicative of significant mineralization, largely overlooked by previous workers.
Sediment hosted gold deposits (Carlin Style): The depth and lateral extent of a number of known near-surface deposits have not previously been tested.
Tectonic breccia hosted gold deposits: As evidenced by the Tai Parit mine, which closed in 1996, these structurally-controlled deposits are of elevated grade (> 9g/t Au) and of relatively low-refractory metallurgical character.
Epithermal quartz-carbonate vein deposits: Key exposures of low-sulphidation epithermal mineralization systems that lie within previously unexplored parts of the goldfield.
History of Exploration on Bau Gold Property
Historically, Bau Goldfield is considered one of the more important goldfields in Southeast Asia. Operating since 1864, this goldfield has recorded approximately two million oz of gold production. The total historic goldfield production is estimated to be approximately 3-4 million oz of gold. During the early gold rush era (1850s to 1890s), more than 50 mines scattered over an area of approx. 250 km2 were operated by Chinese miners not only mining gold, but also antimony, mercury and native arsenic. The Borneo Company Ltd. introduced one of the world’s first commercial cyanide process in 1898 and successfully operated this until it ceased operations in 1921, by which time it had produced 983,225 ounces of gold, including 438,000 oz from the Tai Parit Mine. From 1921 to the early 1980s, many small mines were operated by local Chinese mining syndicates (“Kongsi”) until the early 1980s when Bukit Young Goldmines SDN BHD (“BYG”) initially started re-treating tailings and later resumed open-pit mining, most notably at the Taiton, Bukit Young and Tai Parit Mines, producing close to a further 1 million oz of gold.
The Taiton and Bukit Young mine sites currently remain part of the property comprising the Bau joint venture, but the Tai Parit open-pit has since been flooded and returned to the local government as a scenic reserve. The remains of several process plants (including a CIP plant) remain on-site in various stages of dilapidation. An engineering evaluation is required to determine what may be salvageable for future use.
Exploration to date has evaluated: (a) jasperoid mineralization in the Bekajang Sector, (b) epithermal veining, crackle breccia and skarn mineralization in the Juala West Sector, (c) quartz-calcite veining in the Taiton Sector, (d) carbonate replacement mineralization in the Say Seng Sector, (e) fault breccia mineralization in Bekajang Sector and porphyry-gold mineralization in the Sirenggok Sector. Gold resources in the Pejiru, Jugan, Taiton, Say Seng and Sirenggok Sectors, plus the Bukit Young Tailings and adjacent structures have been block-modelled and estimated to JORC/NI43-101 status. Only minor work has to date been conducted on the regional tenements.
57
2010 Work
Resource drilling focused largely on the Taiton A Zone (Taiton Sector) and Tabai Zone (Taiton Sector). During the second half of 2010, exploration drilling of new geological and geophysical targets commenced. A separate resource drilling programme, aimed at upgrading the bulk of the existing resource to measured and indicated categories and to test deeper and lateral extensions of mineralization also commenced around the same time.
During the year ended December 31, 2010, NBG spent $40,848 on property, plant and equipment acquisitions and $2,551,343 on other capital expenditures.
Upgraded sample processing facilities and an on-site assay laboratory were put into place enabling processing times for samples of 48 to 72 hours.
2011 Work
Geological mapping and geophysical modeling continued as did the drilling program that was commenced during the second half of 2010.
The focus of the drilling programme was the completion of the Taiton Sector drilling, drilling the Bukit Young Pit Zone (Bekajang Sector) and Jugan Hill (Jugan Sector), the immediate focus for upgrading resources and the feasibility study. Additional exploration drilling was undertaken to follow up on geological and geophysical targets in these areas as well.
In addition to drilling at Jugan Hill, the Company also completed 673 meters of trenching in 7 trenches, which confirmed a higher grade zone at south-western end, north-eastern end and locally extended the mineralization boundary. In addition, two metallurgical drill holes were completed and >400kg of sample was sent to SGS Lakefield in Perth for metallurgical test-work. A deep NE trending, steeply NW dipping (fault-bounded) structure has been interpreted as the main mineralization control (feeder structure).
The total drilling programme culminated in an updated resource estimate that was announced during March 2012. The update indicated an approximate 23% gold resource increase at Bau to 913,500 oz Au in the measured and indicated categories and 2,107,000 oz Au in the inferred category. Included in the resource estimate is an upgrade of 349,600 oz of resources from inferred to measured and indicated resource categories. This increase and upgrade derive from the drilling of 19,817 meters in 122 holes during 2011.
During the third quarter of 2011, the Company moved the Bau project into feasibility phase with the objective of achieving a favorable development decision targeting stage one production of at least 100,000 oz of gold per annum by 2015. Exploration, mining feasibility, and environmental studies were planned to further expand the resource base, determine the best development route and examine the issues involved in developing multiple deposits in an optimal manner. Key development objectives include upgrade of the resource categories for a mining feasibility study. Key exploration objectives are to geologically, geophysically and geochemically define new targets for drilling in order of assessed priority.
During the year ended December 31, 2011, NBG spent $80,858 on property, plant and equipment acquisitions and $5,537,081 on other capital expenditures.
58
Work for the six-month transition year ended June 30, 2012
The Bau feasibility study is ongoing, initially focussed on the Jugan deposit, which is the first of several Bau Central deposits listed for development. A feasibility study of resources within the Bekajang Sector is also in progress for planned development. Other sectors spread along the 17 km long Bau Central gold trend and are at varying stages of exploration and feasibility assessment. Ongoing drilling and related exploration activities during 2012 are expected to continue to expand and upgrade these for subsequent mining feasibility assessment. A further resource update is scheduled for the fourth quarter of 2012.
Activity during the 2012 financial year ended June 30, 2012 focused on Jugan Hill in connection with the feasibility study. 8,812 meters of resource drilling in 33 holes were completed as well as 502.8 meters of metallurgical drilling in 6 holes. Ongoing resource (in-fill and step-out) drilling is continuing to broaden the Jugan deposit boundaries and upgrade the resource categories.
The Jugan/Carlin comparison continues to be considered valid (similar host rock geological setting, mineralization age and pathfinder geochemistry) (eg: Arsenic, Mercury, Barium, Tungsten, Thallium).
A definitive C-horizon soil geochemical survey is now in progress. This comprises a close-spaced (25 meters) grid survey over the Jugan Hill deposit and immediate surrounds, coupled with extensive (sector-wide) peripheral C-horizon ridge and spur sampling at 50 meter sample interval. Comprehensive ICP multi-element assay (26 elements) and HyChip sampling will be conducted over both phases.
Contract preparation and contractor selection for an IP survey at Jugan Hill is now in final stages. Final survey geometry will be specified after receipt of the geochemical survey results. Since preparatory line cutting, etc will likely entail about two months, the IP survey will not be ready to commence before October 2012.
Evaluation work also continued at Pejiru where preliminary remote sensing analysis identified prospective target areas, which require further field work prior to drill target specification. Any such further work will entail prior discussions with local Kampongs, local government officials and community leaders and negotiation of access agreements with landowners.
During the six-month period ended June 30, 2012, NBG spent $60,846 on property, plant and equipment acquisitions and $3,137,451 on other capital expenditures.
Work Plan for fiscal year ending June 30, 2013
During the 12 months ending June 30, 2013, a further 4,000 meters of exploration drilling (in 13 holes) has been planned. Work on the feasibility study will continue with the study expected to be completed during the 2013 calendar year.
Bau Gold Property Main Mineral Occurrences
The Bau resource comprises multiple deposits, all which remain open with potential for further expansion through continuing exploration. The deposits comprise several different mineralization styles.
Jugan Hill
This is a near-surface (open-pitable) gold deposit located at the north-eastern end of the Bau Central gold trend. It comprises sediment-hosted, disseminated (Carlin style) mineralization. It is hosted within a thick shale/sandstone sedimentary sequence, which is transected by deep faulting and intruded by dacite porphyry stocks, dykes and sills. The current published resource based on a historic and current dataset, has been estimated (at 0.5 g/t Au lowercut) to contain a NI 43-101/JORC Measured Resource of 158,500 oz Au (3,425,000 tonnes @ 1.44g/t Au), an Indicated Resource of 500,600 oz Au (10,259,000 tonnes @ 1.52g/t Au) and an Inferred Resource of 16,300 oz AU (507,000 tonnes @ 1.0 g/t Au). Jugan exploration and resource drilling is ongoing and mining feasibility studies are concurrently in progress.
59
Bekajang
This is an area of intense historic mining where residual near-surface auriferous quartz-carbonate-sulphides, associated with tectonic and hydrothermal breccias and vein-stock-work mineralization zones are developed principally within fault jogs and at major fault intersections. To the immediate west, a separate zone of disseminated (porphyry-gold) style mineralization is now being drilled within an adjacent intrusive stock of dacitic composition. Currently defined resources (at 0.5 g/t Au lowercut) comprise 120,400 oz (1,857,000) tonnes @ 2.02 g/t Au) in the Indicated Resource category and 10.64 million tonnes @ 1.53 g/t Au, containing 524,100 oz in the Inferred Resource category. Exploration is ongoing and mining feasibility studies are concurrently in progress. All of the currently defined mineralization zones presently remain open-ended, both laterally and at depth.
Sirenggok
This exploration prospect comprises an outcropping porphyry gold deposit with associated gold skarn and quartz-sulphide vein mineralization. Current resources (at 0.5g/t lowercut) are 8.35 million tonnes @ 1.14 g/t Au, containing 307,000 oz gold in the Inferred category. This deposit currently remains under-explored, with several known open-ended strike and depth extensions and prospective fault-coincident geophysical and geophysical anomalies yet to be drilled.
Taiton
This exploration prospect comprises more than 5 strike-kilometers of quartz-carbonate vein and vein breccia deposits that have to date been only partially delineated by drilling. Current resources (at lowercuts of 0.5g/t Au for shallow open-pitable zones and 2.0 g/t Au for deeper underground zones) being: 1.52 million tonnes @ 2.75 g/t Au containing 134,000 oz gold in the Indicated Resource category and 3.42 million tonnes @ 1.75 g/t Au containing 192,000 oz gold in the Inferred Resource category. These deposits remain under-explored with numerous open-ended depth extensions and a further 3 strike-kilometers of the total of 5 strike-kilometres of veining yet to be drilled. A number of mineralized intrusive dykes also remain to be further explored.
Juala
This exploration prospect comprises a large intrusive body that locally carries disseminated Cu-Mo-Au mineralization and is also associated with gold skarn and epithermal vein mineralization. Drilling in this area is as yet insufficiently advanced to allow estimation of resources. Further exploration is planned in due course.
Pejiru
This exploration prospect comprises an extensive area of limestone-hosted mineralized collapse breccias and associated cavity fill mineralization along limestone-shale contacts. Current resources (at a lowercut of 0.5g/t Au) comprise: 25.80 million tonnes @ 1.20 g/t Au containing 997,800 oz gold in the Inferred Resource category. These deposits remain under-explored with numerous open-ended strike and depth extensions and a number of prospective geophysical anomalies yet to be drilled.
60
Say Seng
This exploration prospect comprises sediment-hosted, disseminated (Carlin style) mineralization, as well as fault-hosted breccia mineralization associated with limestone-shale contacts and cavity fill mineralization where faults transect limestone blocks. Current resources (at a lowercut of 0.5g/t Au) comprise 1.35 million tonnes @ 1.63 g/t Au containing 70,900 oz gold in the Inferred Resource category. These deposits remain under-explored with open-ended strike and depth extensions yet to be drilled.
Within the Bau Central gold trend, potential for substantial additional gold resource has been estimated within deposit extensions and adjacent zones that remain as yet unexplored. Further unexplored potential remains within zones beyond the Bau Central gold trend and within two regional tenement blocks (Serian and Rawan).
Bau Gold Property Resource and Reserve Estimates
Refer to the Global Reserves and Resources table at 4D for detail of estimated mineral resources for the Bau Gold Property.
A further resource update is expected to be announced in the fourth quarter of 2012.
There is no known commercially minable mineral deposit on the property.
61
Capcapo Gold Property, The Philippines
The Capcapo Gold Property is located north of the prolific Baguio-Mankayan Gold District in the Northern Philippines. The project area has all the similar epithermal–porphyry gold characteristics as the Baguio Gold District but has remained virtually unexplored.
On September 30, 2011, the Company entered into the Capcapo Joint Venture Agreement with AMIC, Jabel Corporation, KMC, and PhilEarth. Pursuant to the Capcapo Joint Venture Agreement, the Company and Philearth (collectively referred to as the “Olympus Consortium”) is entitled to earn a 60% interest in the Capcapo Gold Property. AMIC, one of the Company’s joint venture partners on the Capcapo Gold Property, has been operating and exploring within Northern Luzon for over 40 years and provides Olympus with a local partnership in the Philippines.
The Capcapo Gold Property consists of MPSA 144, which covers 756 hectares in Capcapo, Licuan-Baay, Abra Province, Philippines, and a two-kilometre radius buffer zone around MPSA 144, with an area of about 3,500 hectares, which is the subject of a renewal Exploration Permit Application (“EXPA”) filed by Jabel Corporation.
The Capcapo Joint Venture Agreement replaced a Memorandum of Agreement and Supplement to Memorandum of Agreement dated November 23, 2006 among the Company, AMIC and Jabel.
Pursuant to the joint venture agreement, the parties will form a joint venture corporation to be named Abrakadabra Goldfields Corp. (“Abrakadabra”) that will develop, manage and conduct mining operations on the Capcapo Property. Pending incorporation of Abrakadabra and until completion of the third stage of expenditure described below, KMC was appointed as independent contractor of Abrakadabra to conduct exploration and related activities on the Property.
Abrakadabra and Jabel will become co-contractors to MPSA 144. Although Jabel’s name will remain a co-contractor on MPSA 144, Jabel’s only economic interest in the property will be a royalty equal to either 3% of gross value of production or 6% of annual profit of Abrakadabra, whichever is higher. Aside from the royalty, all of the Capcapo Property’s proceeds shall flow through Abrakadabra in proportion to the shareholdings in Abrakadabra at the time.
Upon full exercise of the option through expenditure of US$7 million, Abrakadabra will be 40% owned by KMC, 20% owned by Philearth and 40% owned by AMIC. KMC’s 40% interest and Philearth’s 20% interest represent the Olympus Consortium’s 60% interest in the property. Under Philippine law, foreign-owned entities can only hold up to 40% of a MPSA. The Olympus Consortium’s interest is to be earned over three stages as follows:
| Stage | Expected Expenditures | Payment Due Upon Completion of the Stage | |||
| Stage 1 | US$1,000,000 | US$400,000 | |||
| Stage 2 | US$2,000,000 | US$400,000 | |||
| Stage 3 | US$4,000,000 | N/A | |||
Furthermore, the Company paid to AMIC US$300,000 upon the signing of the joint venture agreement and is required to pay a further US$400,000 upon gaining unencumbered access to the property.
The Company also is obligated to make milestone payments each time a specified milestone is achieved in respect of the property. A specified milestone occurs at the earlier of also defining a cumulative mineral reserve of 2,000,000 ounces of gold and gold equivalents for the property, or upon achievement of a consistent production rate of 2,000 tonnes per day. Accordingly, achieving one milestone does not trigger the obligation to make a subsequent milestone payment if the alternative milestone has already been achieved. The milestone payment to AMIC consists of a payment of US$2,000,000 and the issuance of 2,000,000 common shares of the Company or common shares having a market value of US$5,000,000, whichever is of lesser value.
62
The joint venture agreement also grants the Company a right of first refusal over a mineral production sharing agreement held by Jabel over the Patok property, also located in Abra Province, Northern Philippines.
Following the initiation of community consultation in accordance with Philippine laws in the fourth quarter of 2007 and the commencement in the first quarter of 2008 of a formal program of Free, Prior and Informed Consent, undertaken in conjunction with the National Commission on Indigenous Peoples (“NCIP”), all efforts in Capcapo area have concentrated on obtaining Community approval which is required before any further exploration can continue. Upon the signing of the Capcapo Joint Venture Agreement, efforts in this area have recommenced.
Capcapo Property Description and Location
The Capcapo Property is located in Abra Province approximately 85 kilometers north of the Baguio – Mankayan gold district which is estimated to have past production & current reserves/resources in excess of 60 million ounces of gold.
63
Figure 1 Capcapo Regional Setting
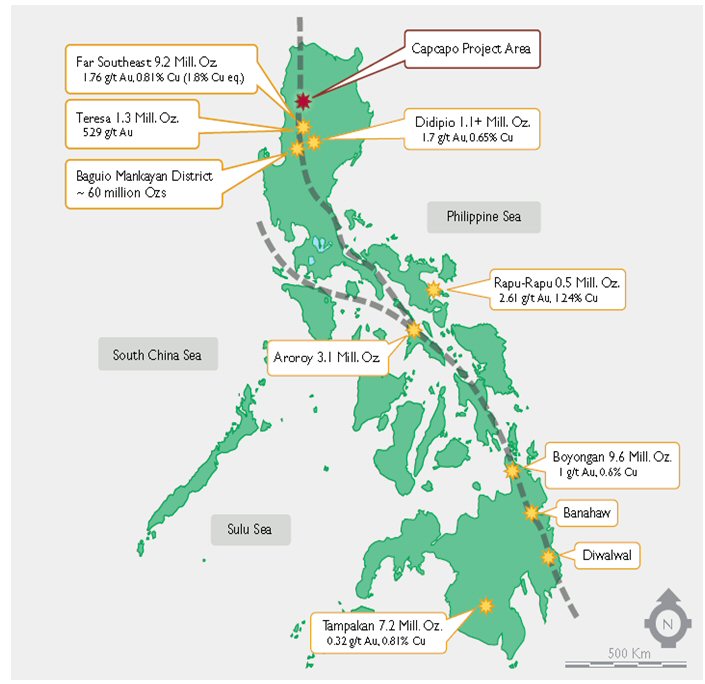
64
Figure 2 Capcapo Local Setting
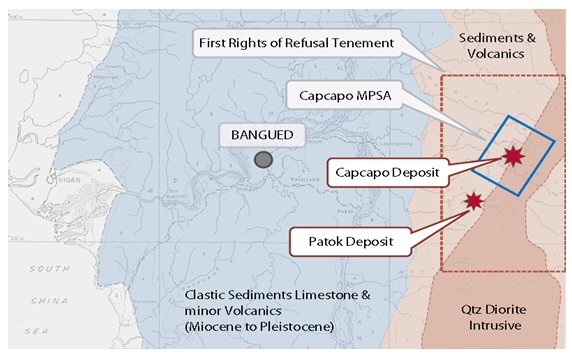
Capcapo Property Accessibility, Climate, Local Resources, and Infrastructure
The Capcapo property is accessible by road some 45 km southeast from Bangued, the provincial capital. Bangued is 409 road kilometres north of Manila. The Capcapo prospect is traversed by the main Abra-Kalinga road, however access is restricted to foot throughout most of the areas on both the Patok and Capcapo tenements. Old mine and drill access tracks are present, however these are generally heavily eroded. These could provide excellent vehicular access once they are rehabilitated.
The climate is tropical, with marked wet and dry seasons and seasonal exposure to typhoons.
The Capcapo Gold Property is in a rural setting, with only local village resources. Reticulated electricity is available and houses are available for rent.
History of Exploration at the Capcapo Property
In the mid-1980s, Gold Fields Asia Ltd based in Australia, completed trenching and eight short holes in the Capcapo deposit area. Since drill core from this previous drilling was not available, Olympus, as part of its final due diligence, has re-drilled three of the previous holes (OYM holes 07-9 to 07-11). Surface trench results yielded an average grade of 4.54 g/t gold over 9,150 m2 area using a 0.5 g/t cut-off. Individual trench assays ranged up to 110 g/t gold. Olympus trench sampling has confirmed the previous assay values. OYM trench A assayed 6.8 g/t Au over 20 meters. Results from due diligence holes 07-9 to 07-11 have returned extensive gold - copper mineralization. Step-out drilling (holes 07-12 onwards) has extended the mineralized zone.
Total cumulative spending on this project as at December 31, 2008 was $865,779 which was capitalized to deferred exploration. At December 31, 2008 the full $865,779 of capitalized deferred exploration expenditure had been written off. Management considered this to be a prudent measure given the delays in formalizing the joint venture agreement and the economic uncertainty of world markets at that time.
With the signing of the Capcapo Joint Venture Agreement on September 30, 2011, the Company is seeking to recommence exploration activity. To that end, the Company engaged a community relations consultant to undertake a social preparations program at the site in order to facilitate land access. Once the Company gains unencumbered access to the property, which is expected to occur before the calendar year end, the Company expects to commence an active drilling programme. At that point, spending will be capitalized pursuant to the Company’s accounting policies.
65
Capcapo Property Resource and Reserve Estimates
There is no known commercially minable mineral deposit on the property.
Tien Thuan Gold Project, Central Vietnam
The Binh Dinh Provincial Government has granted an investment certificate to the Olympus subsidiary, Binh Dinh New Zealand Gold Company (“BNG”). Pursuant to the investment certificate, Olympus may earn an equity interest of 75% in the Tien Thuan Gold Project, by funding exploration through to completion of a bankable feasibility study (such funding to be repayable from future profits). Biotan Mineral Joint Stock Company, a Vietnamese corporation, holds the remaining 25% interest in BNG. Upon reaching a “decision to mine”, project development will be jointly funded on a pro-rata basis.
Tien Thuan Property Description and Location
The Tien Thuan Gold Project lies some 50 km west of the port city of Quy Nhon in Binh Dinh Province in Southern Vietnam. The project area broadly encompasses about 100 km2 of hilly terrain containing numerous hard rock and alluvial gold occurrences, within and peripheral to a large, multiphase intrusive complex of predominantly felsic composition.
Prior exploration by the Vietnamese Geological Survey (DGMV) during 1990-93 recorded six sub-parallel, closely spaced quartz veins hosted by a granitic intrusive.
The Company has since mapped and sampled three intrusive related vein-swarms, confirming the presence of multiple quartz veins of potentially economic grade and width.
66

Figure 1: Tien Thuan Gold Property
67
Tien Thuan Property Accessibility, Climate, Local Resources, and Infrastructure
The project is readily accessible from Quy Nhon City by sealed roads. The road distance from Quy Nhon city to Tien Thuan is about 80 km, via national road No 19 and provincial road 637 to Vinh Thanh District.
Binh Dinh Province is in the south of the central coast region of Vietnam, bounded by coordinates 13o30’-14o42’ N latitude and 108o35’-109o18’ E longitude. Quang Ngai Province lies to the North, Phu Yen to the south. The South China Sea lies to the east, and Gia Lai Province to the west. Binh Dinh provides the principal access routes to the western highland provinces.
The project area broadly encompasses about 100 km2 on the eastern side of the Song Con River Valley. The area is characterized as low to moderately mountainous, transitional between a mountainous region in the west (maximum 975m ASL), reducing to the fertile agricultural plains in the east (minimum 275m). A proportion of the project area (500-700m ASL) is characterised as rugged terrain with locally steep slopes (>250). At lower elevations, the slopes are generally of 10-15o. Narrow alluvial plains and terraces extend along the Song Con Valley floor.
The climate in the region is characterised as humid-tropical monsoon. Temperature varies from 20 to 35oC and averages 26-28oC. The average annual precipitation is 1700-1800 mm. 70-80% of this falls in the rainy season (from August to December), at which time high rainfall events sometimes cause lowland flooding. The dry season begins from January and lasts for eight months, sometimes resulting in droughts. The average humidity is 75%.
The population of Binh Dinh is approximately 1,337,000 people (1993 census). Ethnic Kinh comprise 98.1% of the population, with three ethnic minorities (Cham, Bana, and H-re) living mainly in mountainous districts. The average population density is about 232 people/km2, but it is unequally distributed, with only about 20 people/km2 living in mountainous areas. 82.5% of the population live in rural areas, whilst 17% live in urban areas.
Primary forests have been completely removed by prior milling. The high country comprises secondary natural re-growth of scrubby character. Lowland slopes mostly comprise plantations (cashews, peanuts, paper trees, eucalypts, etc), while the valley floors are mostly occupied cultivated crops (rice, watermelons, etc).
Tien Thuan Property Geology
Central to the project area, a sparsely outcropping mineralized granitoid intrusive (quartz monzonite porphyry) of probable Early Tertiary age has been partially delineated beneath shallow alluvium in a pronounced circular depression of some 4 km diameter. Rhyolites and felsites appear to dominate much of the peripheral terrain. Gold mineralization is intimately associated with quartz veins, which are locally associated with rhyolite dykes. Individual quartz veins locally exceed 20m in width and 2km of strike. A major N-S trending structural corridor (featuring multiple quartz vein, stock-work and breccia bodies, associated with intensive zones of silicification and hydrothermal alteration) has been mapped more or less continuously along 12 km of strike (roughly tangential to the circular depression).
To the Southeast and East of the central granitoid outcrops, the country rocks mostly comprise fractured rhyolites and felsites, which appear to be re-crystallized and cut by numerous irregular quartz stringers. Although gross geological relationships have yet to be interpreted, it is presently conjectured that these exposures may represent a younger granitoid intrusive body (of perhaps batholithic extent) partially exposed beneath older rhyolites forming the batholith roof.
68
History of Exploration on Tien Thuan Gold Property
Artisan gold mining has historically been widespread throughout the Tien Thuan area. Since the early 1990s however, artisan mining has been strongly curtailed by the provincial authorities, mainly for social reasons and to prevent environmental degradation.
The first systematic exploration of the Tien Thuan area was conducted by the Vietnamese Geological Survey (DGMV) during 1990–93. This work included geological mapping, costeaning and pit sampling of quartz veins within artisan mining areas. Four separate gold resource areas were delineated. One of these (at Nui Bac Ma) was focused on six sub parallel, steeply dipping quartz veins, hosted within granitoid intrusives.
Following formation of BNG as the joint venture company and the Provincial Government approval of the work programme, BNG commenced exploration in December 2007 with 1:5,000 scale geological mapping and 100m x 50m grid rock and soil geochemical surveys of the tenement area.
During the second quarter of 2008, the sample spacing was reduced to 100m x 25m, in order to provide greater geochemical resolution within the main areas of interest. All assays were performed by laboratories registered with the New Zealand Testing Laboratory Registration Council (TELARC). In the third quarter of 2008, detailed (1:1,000 scale), geological mapping of individual veins and ore shoots commenced, preparatory to the specification of initial drill targets.
The above detailed field work has revealed extensive outcropping geological features that are broadly consistent with those of economically productive goldfields.
Reconnaissance mapping around the Tien Thuan periphery has also highlighted additional base-metal potential, particularly molybdenum.
During 2009, further geological mapping and the soil survey grid was infilled and extended.
An access road to the summit of Nui Bac Ma and a field base (core shed) were constructed. Further geological reconnaissances were made to the North of Vinh Binh and to Hon Lap and Hon Bong. These revealed both gold and molybdenum potential warranting follow-up exploration. Application was therefore made for a northerly extension of the Tien Thuan Investment Certificate which was granted during the fourth quarter of 2010.
During 2010, the Company conducted drilling in Area One, Bac Ma sector. An aggregated length of 1,212m was drilled in nineteen holes during 2010, specifically at Bac Ma sector (897m in 14 holes), Tien Long (258m in 4 holes) and Vinh Binh (57m in 1 hole). Full assay results were received during the fourth quarter. Results to date indicate that Bac Ma sector mineralization comprises Au-Ag-Cu-Pb-Zn with shear, vein and broad alteration zones within a granite-felsite intrusive complex. These alteration zones contain local quartz stockworks and sheeted veining and vary up to tens of meters in thickness. However, gold grades above 1g/t are primarily confined to the quartz veins. In general, no near-surface potential has yet been found at Bac Ma.
No exploration work was conducted on the Tien Thuan Gold Project in 2011 or 2012 to date as the Company focussed its resources on its other projects.
69
Tien Thuan Property Main Mineral Occurrences
Gold resources have previously been delineated (to pre-JORC status) within four Sectors of the Tien Thuan project area, while BNG exploration subsequently identified additional mineralization areas, as follows:
Nui Bac Ma
Nui Bac Ma, which was the principal focus of BNG’s exploration effort, features a prominent hill with more than 350m of topographic relief. A large quartz vein-swarm transects the hill and is associated with coincident gold, silver, lead, zinc, arsenic and cadmium anomalies in both rocks and soil. The lead, zinc, arsenic and cadmium values show appreciable vertical zonation, while the gold values appear to remain consistent, irrespective of elevation.
Thanh Hoa
The Thanh Hoa vein swarm is parallel to the Bac Ma swarm and lies about 1 km to the east. At least one of this vein swarm appears to be mineralized over a strike length of more than 2km, with appreciable mineralization occurring within the hanging wall. Anecdotal artisan miner narratives suggest that the gold grade in this vein increases with depth.
Vinh Binh
The Vinh Binh vein swarm comprises one section of the prominent structural corridor that trends North-South from the Tien Thuan circular depression. The Vinh Binh veins are probably semi continuous (beneath alluvium of west flowing streams) with collinear vein sets within the northernmost (Hon Lap) sector of the N-S trending structural corridor.
Suoi Ha
The DGMV has estimated a (P1) resource at Suoi Ha (two km to the east of Vinh Binh), but BNG has not yet conducted any detailed follow-up work at this location.
Hon Lap
Hon Lap is collinear with Vinh Binh and is at the northern end of the structural corridor that trends N-S from the Tien Thuan circular depression. A Vietnamese company is currently operating a small-scale underground mine, which produces lead, zinc and pyrite-gold concentrates, primarily by floatation, using equipment of Chinese origin. Although reconnaissance by BNG has revealed float values of up to 20 g/t of gold shedding from one of the main quartz veins, no substantive follow-up work has yet been undertaken.
Other Areas
Reconnaissance of other gold and base metal targets peripheral to the above areas also recorded positive indicators. These include a 1,100m x 300m open-ended (>20ppm) Molybdenum-in-soil anomaly coincident with the Tien Long dacitic intrusive and a large tungsten-molybdenum intrusive granite porphyry (peak value 1,400 ppm Mo) within an adjacent valley to the north.
70
Tien Thuan Property Resource and Reserve Estimates
The only mineral resources estimated to date within the Tien Thuan Gold Project area are those (measured in tonnes of gold) that were completed by the Geological Survey of Vietnam during the early 1990’s. Although these were estimated and classified by methods approved by Vietnamese authorities, they pre-date current standards.
There is no known commercially minable mineral deposit on the property.
GR Enmore Gold Project, New South Wales, Australia
The Enmore Gold Project covers approximately 325km2 within the Enmore-Melrose Goldfield of northeastern New South Wales, Australia. The Company holds a 100 percent interest in an exploration licence (EL 7836) covering 290km2 and is earning an 80 percent interest in two exploration licences covering 35 km2 (EL 4619 and EL 4702). The geological setting is broadly analogous to that at the nearby Hillgrove copper gold mine.
During the fourth quarter of 2011, renewal exploration license applications were filed in respect of the various exploration licenses. EL 7836 was granted effective September 13, 2011 in replacement of two exploration licenses held by Zedex prior to the amalgamation with the Company. The renewal of EL4619 and EL4702 were granted on June 22, 2012.
Exploration results to date have confirmed the potential for lode and/or quartz stock-work style gold deposits at a number of individual prospects, including at Bora, Sunnyside, Lone Hand, Stony Hill, Sheba and Tabben. Potentially minable grades and widths have to date been drill-intersected at Sunnyside and Bora prospects.
GR Enmore Property Description and Location
The Enmore Gold Project is located within the Enmore-Melrose Goldfield of northeastern New South Wales, Australia.
71
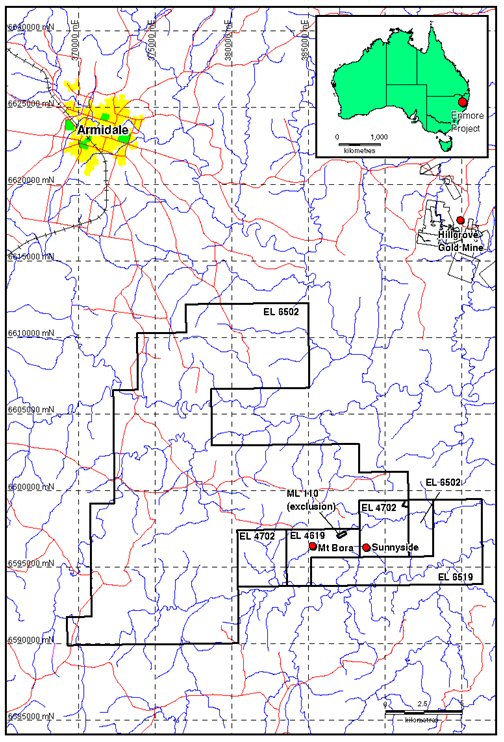
Figure 1: GR Enmore Gold Property
Enmore Property Accessibility, Climate, Local Resources, and Infrastructure
The Enmore Project lies approximately 30 km south of the regional centre of Armidale in northern New South Wales, Australia. Armidale is serviced by sealed highways and by daily air services. Vehicle access to the property is by sealed rural roads. Access within the tenements is by farm tracks.
The climate is temperate, with marked seasonal variation. Winter temperatures can fall below freezing on the Enmore Plateau.
The Enmore Project is in a rural setting. Reticulated electricity is available at roadside and accommodation and field supplies are available from the nearby township of Armidale.
72
Enmore Property Geology and Main Mineral Occurrences
At Sunnyside diamond drilling demonstrated vertical continuity down to 118m and subsequent trenching through a strike length of 400m and width of up to 50m confirmed variable frequency stockwork mineralisation.
Oxide mineralisation extends to a depth exceeding 50m towards the Sunnyside fault. There is limited information beyond the fault, but at least one footwall structure has been identified. Drilling at Bora has confirmed a NE striking steeply plunging to the NW lode style vein system developed within an extensive mylonite zone comprising milled adamellite locally intensively altered to a quartz ‐ sericite assemblage. Drilling to date has confirmed grade potential to 180m, but with the plunge component additional step out drilling is required. Given the occurrences of eluvial gold along the Bora fault it is highly probable that further dilation zones hosting auriferous lodes exist between Bora and Red Hill (across a topographic divide).
History of Exploration on Enmore Gold Project Property
Drilling and subsequent trenching over the Bora, Sunnyside and Sheba prospects has confirmed the potential for limited scale economic mineralisation. Of the three prospects, Bora and Sunnyside appear to have the most upside potential, other prospects including Red Hill, Golden Gully and Stony Hill have generated some interesting results but there appears to be limited structural focus which is critical for shoot style lode development in this area. Very extensive trenching right through the Sunnyside stockwork zone was conducted to confirm the full strike and width of this mineralisation, the results confirmed additional drilling is required to close off the full strike extent of the mineralisation, however, this is unlikely add any significant additional ounces to the resource.
During the fourth quarter of 2010, a field reconnaissance was conducted to further assess mineralization indicators. A review assessment report was completed. However, the proposed ongoing programme calling for detailed geological mapping and rock sampling, combined with in-fill soil geochemistry was deferred as the Company explores options for divesting of its interest in the Enmore property in order to focus on the Southeast Asian properties in its portfolio.
As a result of renewal of certain exploration licenses, detailed geological mapping and sampling will be conducted over target areas (particularly around the old Sherwood Mine). A detailed in-fill soil geochemical and HYCHIP survey is planned to refine anomalies and delineate drill targets along the Bora, Sheba, Sunnyside and Tabben faults. The existing soil survey grid will be extended into the Lone Hand mine area. Subject to results, a scout drilling program will be designed for subsequent work.
A small exploration program has been scheduled for the quarter ended September 2012. This will involve landowner negotiations and field base refurbishment, Quickbird image analysis and a small airborne magnetic survey.
GR Enmore Property Resource and Reserve Estimates
There is no known commercially minable mineral deposit on the property.
ITEM 4A: UNRESOLVED STAFF COMMENTS
Disclosure under this item is not required for the Company as it is not an accelerated filer, a large accelerated filer, nor a well-known seasoned issuer.
73
ITEM 5: OPERATING AND FINANCIAL REVIEW AND PROSPECTS
The following is a discussion of the results of operations of the Company for the transition financial year ended June 30, 2012 and the fiscal years ended December 31, 2011, 2010, 2009 and 2008 and should be read in conjunction with the audited financial statements of the Company for such periods, together with the accompanying notes, included elsewhere in this Transition Report on Form 20-F. Unless indicated otherwise, all references herein are to U.S. dollars.
The financial statements have been prepared in accordance with International Financial Reporting Standards (IFRS) as issued by the International Accounting Standards Board (IASB) for the transition fiscal year ended June 30, 2012 and the fiscal years ended December 31, 2011 and 2010. Prior to the adoption by the Company of IFRS, for a description of the material differences between Canadian and United States generally accepted accounting principles, and how these differences could affect the Company’s financial statements, please see Note 19 to the audited financial statements for the years ended December 31 2010, 2009 and 2008 which are included in Item 19 of the Company's 2010 20-F Annual Report dated June 7, 2011. This reconciliation is not required for financial statements prepared under IFRS. In addition to historical information, the following discussion contains forward-looking statements that involve risk and uncertainties. The Company’s actual results could differ significantly from those anticipated in these forward-looking statements as a result of certain factors, including those discussed in “Risk Factors” and elsewhere in this Transition Report on Form 20-F.
Overview
Olympus is an international mineral exploration and development company engaged in the business of acquiring and developing mineral properties in Southeast Asia. The Company’s long-term strategy is to position itself as a significant gold producer in Southeast Asia. In addition to interests in other properties discussed above in Item 4D, the Company currently owns interests in two gold producing properties in Vietnam, which are referred to as the Phuoc Son Gold Property and the Bong Mieu Gold Property.
The Ho Gan plant at the Bong Mieu Gold Property has been commissioned and commercial production started in the fourth quarter of2006. The Company poured its first 3.6 kg doré bar on February 15, 2006. On October 9, 2007, the Company reported increases to the mineral resource estimates at the Bong Mieu Gold Property as outlined in a Technical Report prepared by TMC/SA. The full text of the report is available on the Sedar website (www.sedar.com).
At the Company’s Phuoc Son Gold Property, on January 25, 2006, the Company secured a mining license (renewed in 2012) in respect of the Bai Dat and Bai Go deposits (collectively the “Dak Sa Underground”). The property includes the higher grade Dak Sa Underground Project which has proven and probable reserves and its Bai Dat mine was put into commercial production in the fourth quarter of 2009. The Company commenced development of a new processing plant in 2010 and it was put into commercial production on July 1, 2011.
5A. Operating Results
Bong Mieu Gold Property
In 2006, Olympus completed the construction of its gold processing plant at Bong Mieu Central where the first 3.65 kilogram gold dore bar was poured on February 15, 2006. The plant was built on budget at $4.5 million but the start-up was slightly delayed due to the typical annual heavy rain falls from May to October. The plant has a throughput capacity of approximately 500 tonnes per day (“tpd”).Based upon an evaluation of the operating results of the Bong Mieu Central (Ho Gan) plant since the commencement of commercial production, management determined during the fourth quarter of 2006 that the carrying amount of the long-lived assets related to the Bong Mieu Central (Ho Gan) mine was not fully recoverable. Consequently, an impairment charge of CAD$4,280,000 was taken on the Bong Mieu Central (Ho Gan) deferred exploration and development cost in the fourth quarter of 2006.
74
Effective April 2012, the Ho Gan open pit was mined out and mining operations ceased. Further, in August 2012 management determined that Ho Gan underground operations were no longer profitable as the grade had dropped to approx 2 g/t Au and operating costs rendered continued production unprofitable. The mine was closed effective August 16, 2012 and was flooded and secured to allow future access if economic circumstances change. Equipment has been deployed to other sites within the group and staffing reassigned.
Higher than expected costs at Nui Kem, that are now forecast to continue, prompted management to asses indicators of impairment releated to the project and its associated assets. Management used a discounted cash flow model to calculate the recoverable amount. This resulted in an impairment charge of $11,534,569 to the Nui Kem project and its associated assets, allocated $2,468,000 to property, plant and equipment, and $9,066,659 to deterred development expenditure.
Phuoc Son Gold Property
On January 25, 2006, the Company received approval of its Mining Licence and on January 10, 2008, the Company received the exploration license that replaced the expired license for the Dak Sa Underground deposits located on the Phuoc Son property. On March 26, 2008 the Company received a positive independent “Technical Report on Feasibility Studies for the Phuoc Son Gold Project in Quang Nam Province, Vietnam” (the “Technical Report) authored by independent mining and geological consultants. The full text of the report is available on Sedar website (www.sedar.com).The Company commenced development of the project with a mix of self-funding through toll treatment of ore at the Bong Mieu plant and external financing. The Bai Dat mine was put into commercial production in the fourth quarter of 2009.
The Company commenced development of a new processing plant in 2010. In 2011, Olympus completed the construction of the plant, where the first 11.1 kilogram gold dore bar was poured on June 22, 2011. The new plant, which was put into commercial production on July 1, 2011, has a throughput capacity of up to 1,000 tpd. The principal capital expenditures relating to the new Phuoc Son plant include infrastructure, machinery and equipment and buildings, which total $27 million.
Statistical Results from the Combined Projects:
| Six months ended June 30, 2012 | Bong Mieu | Phuoc Son | Total | |||||||||
Gold sales (US$) (1) | 9,505,983 | 25,046,282 | 34,552,265 | |||||||||
Cost of sales (US$) (2) | 7,995,494 | 7,468,668 | 15,464,162 | |||||||||
Amortisation (US$) (2) | 3,734,675 | 8,058,260 | 11,792,935 | |||||||||
| Royalties (US$) | 305,316 | 3,959,557 | 4,264,873 | |||||||||
| Cash operating cost per ounce (US$) | 1,403 | 497 | 747 | |||||||||
Ounces sold (1) | 5,698 | 15,013 | 20,711 | |||||||||
| Tonnes of ore milled | 79,846 | 63,812 | 143,658 | |||||||||
| Grade (g/t Au) | 3.19 | 7.47 | 5.06 | |||||||||
| Mill recoveries (percent) | 74 | 93 | 87 | |||||||||
| Gold produced (ounces) | 6,061 | 14,301 | 20,362 | |||||||||
(1) Excludes 3,279 ounces from Bai Go, for which sales revenue has been capitalized to project development, as the project is still in development phase at June 30, 2102. Gold sale capitalization during the period ended June 30, 2012 totalled $5,368,535 from the Bai Go project (2) Excludes Bai Go cost of sales and amortization for the period ended June 30, 2012, during which stage the project was still in development phase (sales and costs capitalized to project development) |
75
| Year ended December 31, 2011 | Bong Mieu | Phuoc Son | Total | |||||||||
| Gold sales (US$) | 15,839,981 | 32,136,649 | 47,976,630 | |||||||||
| Cost of sales (US$) | 11,806,471 | 9,100,413 | 20,906,884 | |||||||||
| Amortisation (US$) | 3,785,709 | 9,391,203 | 13,176,912 | |||||||||
| Royalties (US$) | 524,118 | 5,869,085 | 6,393,203 | |||||||||
| Toll treatment charged to Phuoc Son (US$) | (17,756 | ) | 17,756 | - | ||||||||
| Cash operating cost per ounce (US$) | 1,202 | 469 | 715 | |||||||||
| Ounces sold | 9,826 | 19,423 | 29,249 | |||||||||
| Tonnes of ore milled | 148,753 | 87,528 | 236,281 | |||||||||
| Grade (g/t Au) | 3.69 | 11.45 | 6.57 | |||||||||
| Mill recoveries (percent) | 74 | 92 | 87 | |||||||||
| Gold produced (ounces) | 13,142 | 29,726 | 42,868 | |||||||||
| Year ended December 31, 2010 | Bong Mieu | Phuoc Son | Total | |||||||||
| Gold sales (US$) | 9,211,851 | 26,774,162 | 35,986,013 | |||||||||
| Cost of sales (US$) | 3,920,171 | 9,203,413 | 13,123,584 | |||||||||
| Amortisation (US$) | 4,999,430 | 4,110,876 | 9,110,306 | |||||||||
| Royalties (US$) | 283,431 | 4,512,504 | 4,795,935 | |||||||||
| Toll treatment charged to Phuoc Son (US$) | (4,675,106 | ) | 4,675,106 | - | ||||||||
| Cash operating cost per ounce (US$) | 531 | 422 | 450 | |||||||||
| Ounces sold | 7,383 | 21,803 | 29,186 | |||||||||
| Tonnes of ore milled | 63,663 | 75,116 | 138,779 | |||||||||
| Grade (g/t Au) | 4.94 | 13.08 | 9.35 | |||||||||
| Mill recoveries (percent) | 70 | 82 | 80 | |||||||||
| Gold produced (ounces) | 7,035 | 26,199 | 33,234 | |||||||||
76
Production as planned was lower in the first half of the 2012 calendar year.
Costs of mining and milling increased at each mine site with additional development undertaken and lower grades. In addtion, in the current period, the effects of a new environmental tax levied on tonnes mixed in Vietnam also had an impact on cash costs per ounce. At Bong Mien, the grade mined at Ho Gan Underground became sub-economic so that deposit was closed in mid-August 2012. It is expected that there will be a minimum average grade of 4 g/t Au at Bong Mieu and 6 g/t Au at Phuoc Son for the 2013 fiscal year. Management is of the view that there are operational changes that will reduce cash cost per ounce and this is a key focus for the management team.
During the transitional financial year ended June 30, 2012, a total of 20,711 ounces of gold were sold at an average price of $1,668 per ounce for proceeds of $34,552,265. Effective from July 2010 all silver is immediately sold to Argor-Heraeus SA (“Argor”) while gold is held on account for the Company and sold on the spot market using Auramet as agents for the transaction. Argor continues to provide refining services to the company. From January 1, 2011 the Vietnamese government imposed an export tax on unrefined gold exported, therefore the company is trialing refinery services in Vietnam which enables 99.99% gold to be shipped out of the country without incurring the export tax. The trialing process was completed in 2011, and the Company continues to use local refineries. No binding agreement has been put in place with the refineries in Vietnam. All gold and silver is shipped to Argor in Switzerland for final assessment.
Management’s Discussion and Analysis for the 6 months ended June 30, 2012 and 2011 (amounts in accordance with IFRS)
Results of Operation
| 6 months ended June 30 | ||||||||||||||
| US$ | 2012 | 2011 | Change (%) | Comments on variances | ||||||||||
Sales | 34,552,265 | 6,749,680 | 412 | % | The Company sold 20,711 ounces of gold during the six months ended June 30, 2012 (at an average realized price of $1,668 per ounce, an increase of $300 per ounce on the average price in 2011). Sales increased due to higher sales volumes (15,776 additional ounces sold in the six months ended June 30, 2012) and higher average prices in 2012. | |||||||||
| Cost of sales | 15,464,162 | 4,786,574 | 223 | % | Increased in 2012 due to two plants now being operational and the increase in sales. | |||||||||
| Amortization | 11,922,054 | 1,742,435 | 584 | % | Increased in 2012 due to depreciation for new Phuoc Son plant and higher sales. | |||||||||
| Corporate and administrative expenses | 4,376,195 | 5,789,121 | -24 | % | Decreased in 2012 largely due to reduced legal fees and management bonuses. | |||||||||
| Stock-based compensation | 1,462,071 | 616,227 | 137 | % | Increased due to changes in the stock price at the time of valuation in 2012 compared with 2011 and a change in director compensation package. | |||||||||
| Interest and accretion on term loans | 4,938,341 | 1,833,417 | 169 | % | Increased as a result of the new debt facilities entered into in May 2011. In the first 6 months of 2011, interest and accretion totaling $1,891,171 was capitalized in relation to the new Phuoc Son plant under construction at that time. | |||||||||
| Derivatives-fair value revaluation | (4,619,530 | ) | (6,986,110 | ) | -34 | % | Fluctuates with market prices of underlying valuation factors such as the gold price, share price, volatility and risk-free rates. | |||||||
| Royalty expense | 4,264,873 | 260,453 | 1537 | % | Increased due to higher sales volumes, especially of Phuoc Son gold which is subject to a Government royalty at 15% of the sales value of gold production (Bong Mieu is subject to royalties at a lower rate of 3% on the same basis). | |||||||||
77
Management’s Discussion and Analysis for the years ended December 31, 2011 and 2010 (amounts in accordance with IFRS)
Results of Operation
| 2011 | 2010 | % Change | Comments on variances | |||||||||||
| Sales | 47,976,630 | 35,986,013 | 33 | % | The Company sold 29,249 ounces of gold in 2011 (at an average realized price of US$1,640 per ounce, an increase of $407 per ounce on the average price in 2010). Sales increased due to higher average prices in 2011. | |||||||||
| Cost of sales | 20,906,884 | 13,213,918 | 58 | % | Increased in 2011 due to the new Phuoc Son plant being in use for 6 months (different operating costs to the Bong Mieu Plant). | |||||||||
| Amortization | 13,410,876 | 8,974,079 | 49 | % | Increased in 2011 due to depreciation for new Phuoc Son plant and higher amortization for mine underground development costs. | |||||||||
| Corporate and administrative expenses | 10,947,423 | 8,453,673 | 29 | % | Increased year to date largely due to increased management fees, increased marketing expenses, increased international travel related to management oversight of new projects and new Phuoc Son plant, and increased costs related to raising of finance in 2011. | |||||||||
| Stock-based compensation | 1,277,892 | 1,876,574 | -32 | % | Decreased due to changes in the stock price at the time of valuation in 2011 compared with 2010. | |||||||||
| Interest and accretion on term loans | 6,975,083 | 1,321,122 | 428 | % | Increased as a result of the new debt facilities. | |||||||||
| Derivatives-fair value revaluation | (16,351,957 | ) | 9,886,791 | -265 | % | Fluctuates with market prices of underlying valuation factors such as the gold price, share price, volatility and risk-free rates. | ||||||||
| Royalty expense | 6,393,203 | 4,795,935 | 33 | % | Royalties paid to Government increased due to higher sales values. | |||||||||
78
Management’s Discussion and Analysis for the years ended December 31, 2009 and 2008 (amounts in accordance with Canadian GAAP)
Results of Operation
The Bong Mieu Central mine went into commercial production effective October 1, 2006. The Bong Mieu Underground mine went into commercial production effective April 1, 2009. The Phuoc Son mine went into commercial production effective October 1, 2009. During the year ended December 31, 2009, a total of 24,198 ounces of gold were sold for proceeds of $24,328,860 during 2009 of which 8,489 ounces with proceeds of $7,928,120 were netted against deferred development costs for projects while they were not in commercial production. Comments on selected items from our Consolidated Statements of Operations are noted in the table:
2009 ($) | 2008 ($) | % Change | Comments on variances | |
| Sales | 16,400,740 | 7,275,324 | 125 | The Bong Mieu central plant sold 15,709 oz of gold during the 2009 year (at an average realized price of US$1,044 per ounce) compared to 8,489 oz of gold in the same period last year (at an average realized price of US$883 per ounce). An additional 8,489 oz of gold sales worth $7,928,120 in 2009 were capitalised for projects prior to their commercial production start date. |
| Cost of sales | 9,448,441 | 5,820,382 | 62 | Costs of sales increased due to increased sales in 2009. The cost per ounce of gold produced was lower due to increased throughput and efficiency gains achieved by modifications to the Plant and Equipment during the year. |
| Amortization | 4,392,945 | 2,468,047 | 78 | Increased as a result of two mines coming into commercial production during 2009 which resulted in the commencement of amortisation of those Capital Assets. |
| Management fees and salaries | 2,944,646 | 2,901,152 | 2 | Decreases as a result of reduced corporate office staffing in 2009 compared with 2008 and offset by inflation. |
| Professional fees | 2,429,012 | 968,020 | 151 | Increased as a result of the engagement of additional external professionals in relation to the amalgamation with Zedex Minerals Ltd |
| Travel | 581,024 | 604,493 | -4 | No significant movement in this item during the 2009 year. |
| Investor relations and promotion | 232,090 | 440,884 | -47 | Lower for the 2009 year due to change in marketing plans in 2008 flowing through to 2009 which had an overall reduction in costs. |
| Stock-based compensation | 3,569,314 | 997,336 | 258 | Increased as at the time the stock options were awarded the company share price was significantly lower than when they were considered granted for accounting purposes later in the year and the valuation of those options changed significantly. |
| Interest expense (income) | (11,795) | (551,023) | -98 | Interest income decreased in 2009 due to the decreased cash balances held and reduced rates on available balances. |
| Foreign exchange loss (gain) | (196,962) | (330,916) | -40 | Exchange gain reduced mainly as a result of no longer having to translate US dollars to CAD as the functional currency has changed to US Dollars and the majority of the Company Cash and Investments are held in US dollars. |
79
Government Economic, Fiscal, Monetary or Political Policies or Factors
In order to explore, invest, mine, export or import equipment in Vietnam, the Company goes through a licensing process to obtain the specific licenses. This can be a lengthy process and, as a result, the Company must include the licensing process into the project plan when determining the time frame of a project. However, obtaining licenses can take longer than anticipated and could result in additional costs to the Company if delays occur that impact our projects or existing operations.
On January 11, 2007, Vietnam became a full member of the World Trade Organization (“WTO”). After becoming a full member of the WTO, various commitments Vietnam has made for joining the WTO will become effective. These commitments impact a number of areas such as tariffs and duties on goods, foreign service providers’ access to Vietnam, foreign ownership, reforms on Vietnam’s legal and institutional set up for trade, foreign exchange, commercial business, trading rights, policy making, duties, restrictions, pricing and export restrictions. The overall changes will further expand Vietnam’s access to the global economy and facilitate doing business in Vietnam. These reforms have no immediate impact on the Company but would likely make it easier in the future for the Company to conduct its business activities in Vietnam.
5B. Liquidity and Capital Resources
The Company receives cash for use in exploration, development and future operations mainly from the issuance of common shares, debt financing, exercise of warrants/stock options, investment income generated by its cash position, gold sales and the occasional sale of selected assets.
As at June 30, 2012, the cash and cash equivalents’ balance was $3,397,728 compared to $8,730,248 as at December 31, 2011 and $4,105,325 as at December 31, 2010.
In May 2012, PSGC entered into a loan agreement with Vietcombank for a maximum borrowing of US$5,000,000, to be drawn down as required. The loan term is six months from the date of principal drawdown to the date of repayment for each drawdown. The interest rate is specified at the time of drawdown and may be adjusted every three months. The interest rate for drawdowns to June 30, 2012 is 5.5 percent per annum. The bank loan is secured over plant and equipment with a net carrying value of US$12,063,626
80
In the first quarter of 2011, the Company raised funds of US$5,498,220 net of costs, through newly issued equity. In the second quarter of 2011, the Company raised funds of US$28,732,255, net of costs, by the issue of convertible notes. In 2010 the company raised funds of US$15,841,667, net of costs, through newly issued equity. In March 2010, the Company obtained private placement funding of CAD$12,750,000 through issuance of convertible promissory notes. In June, 2010 the Company completed a private placement of Gold Delivery Notes, resulting in gross proceeds to the Company of US$21,960,000.
In 2009 the Company raised US$5,200,000 of funds through newly issued equity.
On June 27, 2007 a US$2 million Non-Revolving Debt Facility with Macquarie Bank Limited of Sydney, Australia was repaid in full. The Company did not obtain any debt facilities in 2007, 2008 and 2009.
The ability of the Company to continue its growth is dependent upon obtaining the necessary funding and/ or generating funds to continue its exploration and development programs and/or the realization of proceeds from the sale of one or more of its properties and/or assets.
In Vietnam, Bong Mieu and Phuoc Son are able to receive funding from the Company based on loan agreements and the receipt of a Vietnamese State Bank Certificate with respect to foreign loans and repayments. Any foreign loans must receive a certification of registration of borrowing and repayment with the State Bank of Vietnam. The total of the foreign loan amounts and legal capital must not exceed the investment capital stated in the investment license. In the case of Bong Mieu and Phuoc Son, the total of the loans and legal capital are below the stated investment capital of the investment license for each project.
During the six months ended June 30, 2012, the Company spent $1,660,342 (2011: $10,108,738, 2010: $21,974,982) on acquisition of property, plant and equipment and $7,969,936 (2011: $16,051,004, 2010: $11,876,238) on other capital expenditures.
5C. Research and development, patents and licenses, etc.
For a description of the investment certificates, mining licenses, mining certificates, exploration licenses and other licenses held by the Company, please refer to Item 4D.
5D. Trend Information
Gold price volatility could impact profitability at the current operating mine and economic viability at development and exploration projects;
The ability of the Company to continue its activities is dependent upon obtaining the necessary funding and/ or generating funds to continue its exploration and development programs and/or the realization of proceeds from the sale of one or more of its properties and/or assets.
Production and sales trends are as follows:
81
| 5E. | 2012 (6 months) | 2011 (12 months) | 2010 (12 months) | |||||||||||
| Ounces produced | 20,362 | 42,868 | 33,234 | |||||||||||
| Sales US$ | 34,552,265 | 47,976,630 | 35,986,013 | |||||||||||
| Average sales price | 1,668 | 1,640 | 1,233 | |||||||||||
5F. Off-Balance Sheet Arrangements
The Company is not engaged in any off-balance sheet arrangements.
5G. Tabular Disclosure of Contractual Obligations as at June 30, 2012
| Payment Due | Total | Less than one year | Year 2 | Year 3 | Year 4 | Year 5 and thereafter | ||||||||||||||||||
| Capital lease obligations | 872,782 | 872,782 | - | - | - | |||||||||||||||||||
| Operating leases | 985,865 | 818,211 | 61,937 | 61,937 | 43,780 | - | ||||||||||||||||||
| Purchase obligations – supplies & services | 2,805,010 | 2,754,215 | 50,795 | - | - | - | ||||||||||||||||||
| Purchase obligations – capital | 1,719,095 | 1,719,095 | - | - | - | - | ||||||||||||||||||
| Asset retirement obligations | 1,751,972 | 600,645 | 424,276 | 134,905 | 88,482 | 503,664 | ||||||||||||||||||
| Total | 8,134,724 | 6,764,948 | 537,008 | 196,842 | 132,262 | 503,664 | ||||||||||||||||||
In the normal course of business, the Company may be subject to various legal claims. Provisions are recorded where claims are likely.
| ITEM 6: | DIRECTORS, SENIOR MANAGEMENT, AND EMPLOYEES |
6A. Directors and Senior Management
At September 15, 2012 the Company’s directors and executive officers were as follows:
82
Name & Place of Residence | Title | Date of Birth | Date of First Election or Appointment | Term of Office of the Directors |
David A. Seton (Hanoi, Vietnam) | Executive Chairman and Director | Dec. 13, 1955 | Aug. 23, 1996 | Expires at 3rd AGM following June 6, 2011 AGM |
Kevin M. Tomlinson (Richmond, United Kingdom) | Deputy Chairman and Director | May 2, 1960 | Jan. 17, 2012 | Expires at 3rd AGM following May 29, 2012 AGM |
Jon Morda (Ontario, Canada) | Director | Jan. 13, 1952 | Aug. 16, 2005 | Expires at 3rd AGM following May 11, 2010 AGM |
Leslie Robinson (Wellington, New Zealand) | Director | Aug 31, 1960 | Dec 17, 2009 | Expires at 3rd AGM following May 11, 2010 AGM |
John A.G. Seton (Auckland, New Zealand) | Chief Executive Officer | Jan. 10, 1963 | July 7, 1999 | n/a |
S. Jane Bell (Auckland, New Zealand) | Chief Financial Officer | July 27, 1967 | Dec. 17, 2009 | n/a |
Darin M. Lee (Phoenix, Arizona) | Chief Operating Officer | April 7, 1964 | August 22, 2012 | n/a |
Peter Tiedemann (Auckland, New Zealand) | Chief Information Officer | Sept 18,1942 | July 25, 2006 | n/a |
Charles Barclay (Suva, Fiji) | Chief Strategy Officer | Dec. 18, 1950 | July 13, 2006 | n/a |
Paul Seton (Auckland, New Zealand) | Chief Commercial Officer | Oct 10, 1953 | Dec. 17, 2009 | n/a |
James Hamilton (Orangeville, Canada) | VP – Investor Relations | Oct. 7, 1951 | Nov. 16, 2005 | n/a |
Jeffrey D. Klam (Toronto, Canada) | General Counsel and Corporate Secretary | February 22, 1976 | March 7, 2012 | n/a |
A brief education and relevant work history of the Directors and Executive Officers follows:
David A. Seton, Executive Chairman of the Board of Directors
Mr. David Seton has been affiliated with the Company in various capacities since 1996. He has served as Chairman of the Board of Directors since August 23, 1996. He is responsible for the overall coordination of strategic planning as Executive Chairman and a Director. Mr. Seton has also served as a director or managing director of a number of companies listed on the New Zealand and Australian Stock Exchanges in both the mining and non-mining industries. He is the Chairman of Polar Star Mining Corporation, a Canadian gold exploration and development company which trades on the TSX. He has over 20 years’ business experience in Vietnam and over 30 years’ experience in the mining industry. David Seton holds a Bachelor of Law from Victoria University Wellington. David Seton is the brother of John Seton and Paul Seton.
83
Kevin M. Tomlinson, Deputy Chairman of the Board of Directors
Kevin Tomlinson has over 30 years of international mining experience, having worked in several key management positions in the mining and energy sectors. Major tenures have been as Manager Regional Exploration for Plutonic Resources, CEO of Austminex NL, Head of Research at Hartleys Australia, Director of Natural Resources at Williams de Broë and Managing Director, Investment Banking for Westwind Partners/Thomas Weisel/Stifel Nicolaus in London and Toronto. He is currently a board member of Centamin Egypt Limited (LSE and TSX) and Samco Gold Limited (TSX-V). He has previously served as Chairman of Medusa Mining (ASX, AIM, and formerly TSX) and Dragon Mountain Gold (ASX). He holds a M.Sc. in Structural Geology, has completed a postgraduate finance diploma, and is a Liveryman of the Worshipful Company of International Bankers, a Freeman of London and a Fellow of the Chartered Institute for Securities & Investment.
Jon Morda, Director
Jon Morda has a Bachelor of Arts degree from the University of Toronto (1975) and is a member of the Institute of Chartered Accountants of Ontario (1980). He has over 20 years’ experience in the mining industry, with several positions as Chief Financial Officer of mineral exploration and gold producing companies listed on the TSX. Mr. Morda recently retired as Chief Financial Officer of Alamos Gold Inc. in Toronto, a mineral exploration and gold producing company listed for trading on the TSX. He currently is a director of Kootenay Silver Inc. (TSX-V).
Leslie Robinson, Director
Leslie Robinson has over 20 years experience in the financial markets sector, most recently as a senior manager with one of Australia’s leading banks where he specialized in corporate and institutional advisory work. He holds a Bachelor of Commerce (Honors) degree.
John A.G. Seton, Chief Executive Officer
John Setonhas over 20 years’experience in the resources industry, is a former President of Olympus Pacific Minerals, Inc., and has extensive business experience in Vietnam, serving at one time as Chairman of the Vietnam/New Zealand Business Council. He is a director of Manhattan Corporation Limited (ASX:MHC) and has been a director and chairman of a number of companies listed on the Australian Securities Exchange and the New Zealand Stock Exchange. John Seton holds a Bachelor of Law from Victoria University Wellington and a Master of Law (Honours) from the University of Auckland. John Seton is the brother of David Seton and Paul Seton.
S. Jane Bell, Chief Financial Officer
Ms. Bell has a Bachelor of Commerce degree from LincolnUniversity. She obtained her CA designation with the NZ institute of Chartered Accountants in 1989. Ms. Bell spent eight years in compliance work with KPMG in New Zealand and the Cayman Islands, leaving as business services manager. Since then she has been involved in a management capacity with a number of organisations dealing with corporate finance, regulation and governance. Jane has in conjunction with her finance roles been the company secretary for several companies and has for over 15 years served on or reported to corporate boards.
84
Darin M. Lee, Chief Operating Officer
Darin Lee is an engineer with over 25 years’ experience in the industry, most recently from 2010 to 2012 as Operations Director of Minera Panama SA (controlled by Inmet Mining) where he was responsible for planning and mine development of the $6.2 billion Cobre Panama Copper project. Prior to that he spent 10 years with Freeport-McMoRan Copper & Gold, based in Indonesia as Vice President of Concentrating and a further 5 years as Vice President of Technical Services in Phoenix, AZ. He also worked for Echo Bay Minerals for 12 years finishing at the McCoy/Cove mine in Nevada as Operations Manager. Mr. Lee holds a Bachelor of Science; Mineral Process Engineering from the University of Alberta (1987).
Peter Tiedemann, Chief Information Officer
Peter Tiedemann has been involved in various capacities with the Company since July 25, 2006. He received a Bachelor of Commerce degree from the University of Auckland and has considerable financial and consulting experience spanning some 40 years. He has worked with a wide range of companies including Fortune 500 corporations: Canon NZ, Pitney Bowes NZ and DRG New Zealand Ltd. Since January 2012, Peter spends about 20% of his time on Olympus Pacific Minerals Inc.
Charles Barclay, Chief Strategy Officer
Charles Barclay is a former member of the association of Mine Managers of South Africa. He has 40 years’ experience in the gold mining sector, of which 30 years have been in senior management roles in developing jurisdictions. After leaving the role of COO of Emperor Mines, Fiji, in 2000, he worked in Malaysia and Papua New Guinea as an independent consultant designing mines and constructing one before joining Olympus in February 2006.
Paul Seton, Chief Commercial Officer
Paul Seton has been involved in Vietnam related investment and resources since 1991. A former resident of Hanoi as executive director for NZ listed Iddison Group Vietnam Limited, Mr Seton has been responsible for negotiating a number of investment and exploration or mining licences in Vietnam. He holds or has held directorships in and has been Chairman of a number of Vietnam licensed joint venture enterprises.Paul Seton is the brother of David Seton and John Seton.
James Hamilton, Vice President – Investor Relations
James Hamilton has an Ontario Associate Diploma in Agriculture from the University of Guelph (1972). He has 30 years’ experience in sales and marketing and has held several senior sales positions throughout his career. Prior to joining the Company, he was Sales Manager for UAP Canada Inc.(Div. of ConAgra) where he led sales and marketing efforts for this agribusiness company. Mr. Hamilton spent several years in the Canadian potash industry and was the Canadian Sales Manager for the Potash Co. of America, Div. Rio Algom Ltd. from 1983 through 1993. Mr. Hamilton also served the Potash Corporation of Saskatchewan from 1978 to 1983 as their Eastern Canadian Sales Manager. James was active within the industry's association serving The Canadian Fertilizer Institute (CFI) as Chairman of the Transportation Committee and the CFI's Vice Chairman for one term. Mr. Hamilton has served Olympus Pacific Minerals Inc. since November 2005.
85
Jeffrey D. Klam, General Counsel & Corporate Secretary
Jeffrey Klam is a lawyer called to the bar in Ontario, Canada in 2002 and is a member of the Law Society of Upper Canada. He practiced as an associate with Fasken Martineau DuMoulin LLP from 2002 to 2007 with a focus on corporate and securities law and mining finance. He subsequently joined the Ontario Securities Commission as Legal Counsel in the Corporate Finance Branch. Mr. Klam joined the Company in 2011. Mr. Klam holds a Bachelor of Arts (political science) from McGill University and a LL.B. from Osgoode Hall Law School.
Zedex Merger and the Company’s Senior Management and Board of Directors
On November 10, 2009 the Company announced its intention to merge with Zedex. At a Special General Meeting of Zedex’s shareholders held on December 17, 2009 Zedex’s shareholders approved the merger. On January 12, 2010, the Company and Zedex amalgamated. Mr. Leslie Robinson, director of Zedex, was appointed to the Board of Olympus on December 17, 2009. Mr. Rodney Murfitt, formerly Chief Geologist for Zedex, became Group Exploration Manager for Olympus. Mr. Paul Seton, formerly CEO of Zedex, became Senior Vice President Commercial for Olympus (currently Chief Commercial Officer) and Ms. Jane Bell (previously Baxter), formerly CFO and Company Secretary for Zedex, became Vice President Finance for Olympus (currently Chief Financial Officer).
| 6B. | Compensation |
The following summary compensation table sets out the compensation during the fiscal year ended June 30, 2012 and the two fiscal years ended December 31, 2011 and 2010 for the Chief Executive Officer, the Chief Financial Officer and the three other most highly compensated officers of the Company measured by total compensation earned during the above fiscal periods. All amounts shown in the table below are denominated in Canadian dollars as the compensation paid to the below individuals was also denominated in Canadian dollars.
86
Year(1) | Salary($) | Share- based awards ($) | Non-equity incentive plan compensation | Total Compen- sation ($) | |||||
Option- based awards(2) ($) | Annual incentive plans | Long- term incentive plans ($) | Pension Value ($) | All Other Compen- sation ($) | |||||
David A. Seton(3) Executive Chairman | 2012 | 160,000 | N/A | 700,920 | 0 | N/A | N/A | N/A | 860,920 |
| 2011 | 320,000 | N/A | 315,000 | 213,333 | N/A | N/A | N/A | 848,333 | |
| 2010 | 258,000 | N/A | 270,662 | 64,500 | N/A | N/A | N/A | 593,162 | |
John A G Seton(4) Chief Executive Officer | 2012 | 152,500 | N/A | 400,488 | 0 | N/A | N/A | N/A | 552,988 |
| 2011 | 274,083 | N/A | 260,100 | 173,412 | N/A | N/A | N/A | 707,595 | |
| 2010 | 80,000 | N/A | 638,005 | 16,667 | N/A | N/A | N/A | 734,005 | |
S Jane Bell (5) Chief Financial Officer | 2012 | 90,000 | N/A | 54,319 | 0 | N/A | N/A | N/A | 144,319 |
| 2011 | 168,333 | N/A | 87,500 | 77,333 | N/A | N/A | N/A | 333,166 | |
| 2010 | 152,650 | N/A | 47,764 | 22,898 | N/A | N/A | N/A | 223,282 | |
Paul Seton Chief Commercial Officer | 2012 | 115,500 | N/A | 163,844 | 0 | N/A | N/A | N/A | 279,344 |
| 2011 | 231,000 | N/A | 105,000 | 123,200 | N/A | N/A | N/A | 459,200 | |
| 2010 | 220,000 | N/A | 95,528 | 44,000 | N/A | N/A | N/A | 359,528 | |
Charles Barclay(6) Chief Technical Officer | 2012 | 110,000 | N/A | 80,622 | 0 | N/A | N/A | N/A | 190,622 |
| 2011 | 220,000 | N/A | 100,000 | 117,333 | N/A | N/A | N/A | 437,333 | |
| 2010 | 188,125 | N/A | 63,685 | 37,625 | N/A | N/A | N/A | 289,435 | |
| NOTES: |
| (1) | Information presented for 2010 and 2011 years are for the financial years ended December 31. Information presented for 2012 is for the six month transition year ended June 30, 2012. |
| (2) | Figures represent value of options granted during a particular year; see “Aggregate Option” table for the aggregate number of options outstanding at year end. |
| (3) | Prior to August 16, 2011, David Seton served in the capacity of Chairman and Chief Executive Officer. Effective August 16, 2011, Mr. Seton resigned as Chief Executive Officer but continued to serve as Executive Chairman. |
| (4) | Prior to August 16, 2011, John Seton served in the capacity of Chief Financial Officer. Effective August 16, 2011, Mr. Seton was appointed Chief Executive Officer. |
| (5) | Prior to August 16, 2011, Jane Bell served in the capacity of Vice President, Finance. Effective August 16, 2011, Ms. Bell was appointed Chief Financial Officer. |
| (6) | Prior to September 1, 2011, Charles Barclay served in the capacity of Chief Operating Officer. Effective August 16, 2011, Mr. Barclay was appointed Chief Technical Officer. |
87
Management Services Agreements
The Company has entered into a management services agreement or employment agreement (each a “Executive Agreement”), as the case may be, with each of its senior executive officers (each, an “Executive”) that provide for specific benefits in the event that executive’s employment is terminated voluntarily by the Executive upon notice to the Company or a material change in the Executive’s responsibilities or by the Company with cause or upon notice. A summary of these benefits follows.
Termination
Pursuant to the Executive Agreements, the Company is required to make certain payments upon termination (whether voluntary, involuntary, or constructive), resignation or retirement or upon a change in the Executive’s responsibilities, as applicable. An estimate of the amount of these payments assuming that the triggering event giving rise to such payments occurred on June 30, 2012, is set out in the table below and is more fully described in the section that follows:
| Triggering Event | |||
| Executive | Resignation or Retirement | Termination without Cause | Material Change in Responsibilities |
| David Seton | Nil | $975,000 | $975,000(1) |
| John Seton | Nil | $975,000 | $975,000(1) |
| S. Jane Bell | Nil | $300,000 | $300,000(2) |
| Peter Tiedemann | Nil | Nil | Nil |
| Charles Barclay | Nil | $352,500 | $352,5003) |
| Darin M. Lee | Nil | $182,500 | $182,500(4) |
| Paul Seton | Nil | $612,500 | $612,500(1) |
| James Hamilton | Nil | $175,000 | $174,000(5) |
| Jeffrey D. Klam | Nil | $210,000 | $210,000(5) |
| (1) | equivalent to 30 months’ salary |
| (2) | equivalent to 15 months’ salary |
| (3) | equivalent to 12 months’ salary |
| (4) | equivalent to 18 months’ salary |
| (5) | equivalent to 6 months’ salary |
Termination by the Executive
The Executive may terminate his or herExecutive Agreement and the services being provided by it thereunder by giving the Company at least three (3) months prior written notice (the “Executive’s Termination Notice”), provided that the Company shall have the right to give written notice to the Executive that the Company is waiving the full notice period and is permitting the agreement and the services of the Executive to be terminated upon a date that is less than three months after the date of the Executive’s Termination Notice as determined by the Company (the “Company’s Termination Notice”) and further provided that all salaries or fees payableto the Executive or the Executive’s management company, and all other obligations of the Company to the Executive hereunder shall cease upon the date specified in the Executive’s Termination Notice or the Company’s Termination Notice, whichever is applicable provided that if the Company provides the Company’s Waiver of Notice, it will be obligated to pay fees up to and including the date specified in the Consultant’s Termination Notice at the rate of the Consultant’s annual fee or salary in effect at the time of the notice subject to a maximum of three (3) months payment.
88
The Executive shall be entitled to terminate his/her Executive Agreement immediately upon serving written notice to the Company in the event that:
1) a receiver or liquidator is appointed in respect of the Company; or
2) the Company fails to pay any moneys payable thereunder within fourteen (14) calendar days of the due date and shall further fail to pay such moneys within fourteen (14) calendar days of receiving written notice of such failure from the Executive.
The Executive may also terminate the Executive Agreementby giving the Company at least seven (7) days’ notice if without the written agreement of the Executive, the nature of the duties, requirements and arrangements of the Executive are substantially changed such that the nature of the work that is required to be performed is not work which is consistent with the work ordinarily required to be performed for a position similar to that assumed by the Executive for a publicly listed mining company and certain other enumerated circumstances, in which event the Company shall be obligated to provide the Executive with a payment which shall be payable on the fifth calendar day following the date of the notice of termination (the “Employee’s Notice of Termination”) and shall consist of the following, subject to the Executive executing and delivering a full and final release in writing of the Company:
| (i) | the Executive’s full fee through to the date of termination at the amount in effect at the time the Employee’s Notice of Termination was given and the amount of any allowable expenses reimbursable; |
| (ii) | in lieu of further fees for periods subsequent to the date of the Employee’s Notice of Termination, a payment as per the above table; |
| (iii) | an amount equal to the average of (i) the target bonus payable under the Company’s short-term incentive plan to the Executive for the current fiscal year, and (ii) the greater of the bonuses actually paid to the Executive in each of the previous two fiscal years; prorated over the number of months provided for in the above table; and |
| (iv) | in lieu of common shares of the Company issuable upon exercise of options, if any, previously granted to the Consultant under the Company's incentive programs and remaining unexercised at 5:00 p.m. (Toronto time) on the fourth calendar day following the date of termination, a cash amount equal to the aggregate difference between the exercise price of all options held by the Executive, whether or not then fully exercisable, and the average of the closing prices of the Company's common shares as reported on the Toronto Stock Exchange and Australian Securities Exchange for thirty (30) calendar days preceding the date of termination. The above payment is subject to the Executive’s right to waive such payment whereupon in accordance with the Company’s stock option plan, the Executive’s unvested options on shares of the Company shall immediately vest and all of the Executive's options on shares of the Company will expire within ninety (90) days of the Date of Termination. |
The Executive Agreements with Dason Investments Limited providing for the services of David Seton as Executive Chairman and with Jura Trust Limited providing for the services of John Seton as Chief Executive Officer also provide each such executive with the right to terminate their agreement and receive the payment described above in the event that such executive is not included as a nominee of management of the Company as a Director at any meeting of shareholders of the Company at which Directors are to be elected if requested by the executive in writing at least ten days prior to the deadline for mailing the management proxy circular in respect of such meeting of shareholders of the Company or in the event such executive is not elected a director, if nominated
89
Termination by the Company
The Company may at any time terminate an ExecutiveAgreement and the engagement of the Executive without cause. In this event the Company shall be obligated to pay the Executive the amounts set out above. Such payment shall be payable on the fifth calendar day following the date of the notice of termination (the “Company’s Notice of Termination”) andshall consist of the following, subject to the Executive executing and delivering a full and final release in writing of the Company:
| (i) | the Executive’s full fee through to the date of termination at the amount in effect at the time the Company’s Notice of Termination was given and the amount of any allowable expenses reimbursable; |
| (ii) | in lieu of further fees for periods subsequent to the date of the Company’s Notice of Termination, a payment as per the above table; |
| (iii) | an amount equal to the average of (i) the target bonus payable under the Company’s short-term incentive plan to the Executive for the current fiscal year, and (ii) the greater of the bonuses actually paid to the Executive in each of the previous two fiscal years; prorated over the number of months provided for in the above table; and |
| (iv) | the Executive’s options on shares of the Company shall remain in full force and effect for the earlier of the expiry date of such options or twelve (12) months following the Company’s Notice of Termination and the option agreements shall be deemed to have been amended, to the extent required, to the effect that any provision which would otherwise terminate such options as a result of the termination of the Executive’s services shall be null and void. |
The Company may at any time terminate an Executive Agreement for any just cause that would in law permit the Company to, without notice, terminate the Executive, in which event the Executive shall not be entitled to the payments set forth above, but shall be entitled to receive the full amount of the Executive’s fees due through to the date of the notice of termination plus reimbursement of any allowable expenses.
General Termination Provisions
On an executive’s termination for any reason, the Executive agrees to deliver up to the Company all equipment, documents, financial statements, records, plans, drawings, papers of every nature in any way relating to the affairs of the Company and its associated or affiliated companies which may be in its possession or under its control.
The Executive shall not be required to mitigate the amount of any payment provided for under any paragraph of these termination provisions by seeking other engagement or otherwise nor shall the amount of any payment provided by the termination provisions be reduced by any other compensation earned by the Executive as a result of engagement by another client after the date of termination or otherwise.
90
The Company shall have full rights to offset any money properly due by the Executive or the Manager to the Company against any amounts payable by the Company to the Executive hereunder.
The Executive will cease to be enrolled in any Company benefit plan after the last day of any notice period given.
Stock Option Plan
On September 12, 2003, the Company adopted a stock option plan (the “Plan”) which was re-approved by its shareholders on June 16, 2006. On June 7, 2007, the shareholders approved a new stock option plan to replace the existing plan. On May 11, 2010, the shareholders reapproved the existing stock option plan. Under the current plan, options to purchase shares of the Company may be granted to directors, officers, employees and consultants of the Company. Options granted under the plan have a maximum term of five years and vesting dates are determined by the Board of Directors on an individual basis at the time of granting.
1. The maximum number of options that can be issued at any one time cannot be higher than 12% of the Company’s issued and outstanding share capital (on a non-diluted basis).
2 Options are subject to an accelerated expiry term (the “Accelerated Term”) for those options held by individuals who are no longer associated with the Company. The Accelerated Term requires that options held by individuals who resign or are terminated from the Company expire on the earliest of: (i) the original expiry term; (ii) 90 days from the date of resignation or termination; or (iii) the date provided for in the employment or consulting agreement between participant and the Company; provided that shareholder approval is required if this would cause the options to extend beyond original expiry.
3. The maximum number of shares that may be reserved for option grants to any one individual insider in any 12 month period may not exceed 5% of the common shares issued and outstanding (on a non-diluted basis) on the date of grant.
4. The maximum number of shares that may be reserved for issuance to insiders of the Company may not exceed 10% of the common shares issued and outstanding (on a non-diluted basis) on the date of grant.
5. The maximum number of shares that may be issued to insiders, as a group, within a one year period may not exceed 10% of the common shares issued and outstanding (on a non-diluted basis) on the date of issuance.
6. The maximum number of shares that may be issued to any non-employee directors, as a group, during any 12 month period shall not exceed 5% of the common shares issued and outstanding (on a non-diluted basis) on the date of grant.
7. Subject to the policies, rules and regulations of any lawful authority having jurisdiction (including the TSX), the Board may, at any time, without further action by its shareholders, amend the Plan or any option granted thereunder in such respects as it may consider advisable. The Board may not, however, without the consent of a Plan participant, alter or impair any of the rights or obligations under an option previously granted. No common shares of the Company shall be issued under any amendment to this Plan unless and until the amended Plan has been approved by the TSX. The Plan may be abandoned or terminated in whole or in part at any time by the Board, except with respect to any option then outstanding under the Plan.
91
8. The exercise price of any option granted shall be determined by the Board but shall not be less than the volume weighted average trading price of the common shares on the TSX, or another stock exchange where the majority of the trading volume and value of the listed shares occurs, for the five trading days immediately prior to the date of grant (or, such other price required by the TSX) (calculated by dividing the total value by the total volume of securities traded for the relevant period).
9. Upon the announcement of any form of transaction (a “Change of Control Transaction”) which, if completed, would constitute a change of control and under which common shares of the Company are to be exchanged, acquired or otherwise disposed of, including a take-over bid, or tender offer made for all or any of the issued and outstanding common shares, the Company shall, as soon as practicable following the announcement of such Change of Control Transaction, notify each Plan participant currently holding an option of the Change of Control Transaction, and all options of such participant which have not vested shall be deemed to be fully vested and exercisable solely for purposes of permitting the participant to exercise such options in order to participate in the Change of Control Transaction in respect of the common shares thereby acquired.
During the transition year ended June 30, 2012, 14,737,960 options were issued and valued for accounting purposes throughout the year using the Black-Scholes calculation, at $2,465,107. These options have various exercise prices of between CAD$0.26 and CAD$0.52. The exercise price of these and most of the other outstanding options was determinedwith reference to the volume weighted average trading price of the common shares on the TSX and ASX for the 5 trading days immediately prior to the date of grant plus a small premium. All options issued during the transition year ended June 30, 2012 vest one year from the date of issuance.
6C. Board Practices
The directors are serving terms of three years.
The Company has an Audit Committee, which recommends to the Board of Directors the engagement of the independent auditors of the Company and reviews with the independent auditors the scope and results of the Company’s audits, the Company’s internal accounting controls, and the professional services furnished by the independent auditors to the Company. The current members of the Audit Committee,each of whom is independent, are as follows: Jon Morda (Chairman), Leslie Robinson, and Kevin M. Tomlinson.
The Company’s Compensation Committee is comprised of three independent directors:Kevin M. Tomlinson (Chairman), Leslie Robinson and Jon Morda.
The Corporate Governance Committee is comprised of Leslie Robinson (Chairman), David Seton and Kevin M. Tomlinson. Two of the three members are independent.
Audit Committee
The primary objective of the Company’s Audit Committee is to act as a liaison between the Board and the Company’s independent external auditors and to assist the Board in fulfilling its oversight responsibilities with respect to:
| (a) | the Company’s financial reporting and disclosure requirements, |
| (b) | the Company’s compliance with legal and regulatory requirements, |
92
| (c) | external and internal audit processes and the qualification, independence and performance of the Auditors, and |
| (d) | the Company's risk management and internal financial and accounting controls, and management information systems. |
The Audit Committee is responsible for the Company’s financial reporting and disclosure. This includes reviewing the Company’s annual audited financial statements (including the Auditors’ report thereon), the interim financial statements and the related management’s discussion and analysis as well as financial information contained in any prospectus, annual information form, annual report to shareholders, management proxy circular, material change disclosure or press release of a financial nature. The Committee is also responsible for considering issues regarding accounting principles used in the preparation of the Company’s financial statements.
The Audit Committee also performs a risk management function and maintains oversight of the Company’s internal controls including reviewing the scope and plan of the work to be done by the Company’s financial and accounting group and the responsibilities, budget and staffing needs of such group as well as periodically reviewing the adequacy and effectiveness of the Company’s system of internal control and management information systems. The Audit Committee also implements and reviews policies and procedures on risk oversight and management to establish an effective system for identifying, assessing, monitoring and managing risk.
The Audit Committee maintains primary responsibility for the relationship with the Company’s external auditors and recommends to the Board the independent auditors to be nominated for appointment at shareholder meetings.
Finally, the Audit Committee maintains oversight of the accounting principles used in the preparation of the Company’s financial statements, including those policies for which management is required to exercise discretion or judgments regarding the implementation thereof, and considers, if appropriate, significant changes to the Company's accounting principles and financial disclosure practices as suggested by the external auditors or management.
Compensation and Benefits Committee
The primary objective of the Company’s Compensation and Benefits Committee is to assist the Board in fulfilling its oversight responsibilities with respect to:
| (a) | the establishment and ongoing review of compensation policies including all incentive and equity based compensation policies, |
| (b) | the performance evaluation of the Company’s Executive Chairman, the Chief Executive Officer and the Chief Financial Officer, and determination of the compensation for the board of directors and all officers of the Company including approving awards under any incentive or equity based compensation plans, including the Company’s stock option plan, and |
| (c) | succession planning, including the appointment, training and evaluation of senior management. |
In fulfilling its oversight responsibility, the Compensation and Benefits Committee reviews and approves on an annual basis corporate goals and objectives relevant to the performance of the Company’s Executive Chairman, the Chief Executive Officer and the Chief Financial Officer and evaluates performance in light of those goals and objectives. The Compensation and Benefits Committee also establish compensation policies for the directors and officers of the Company that reflect their respective duties and responsibilities, are competitive in attracting and retaining people of the highest quality, align the interests of the directors and officers with the Company’s shareholders, are based on established corporate and individual performance objectives and that promote transparency and fairness in the determination of compensation.
93
The Compensation and Benefits Committee also administers the Company's stock option plan and determines the recipients of, and the nature and size of share compensation awards and bonuses granted from time to time, in compliance with applicable securities law, stock exchange and other regulatory requirements.
6D. Employees
| 2010 | 2011 | 2012 | ||||||||||
| Vietnam | 1,258 | 1,594 | 1,848 | |||||||||
| Elsewhere Worldwide | 26 | 24 | 37 | |||||||||
| Total | 1,284 | 1,618 | 1,885 | |||||||||
The Company also employs temporary employees. The average number of temporary employees as of September 15, 2012 was approximately 37, of which 32 were based in Vietnam and 5 based outside of Vietnam
The Company also engages external suppliers who provide their own employees to fulfill service and maintenance contracts at the project sites in Vietnam.
6E. Share Ownership
The following table shows the shareholdings of the Directors and Executive Officers of the Company as at September 15, 2012.
Title of Class | Name of Beneficial Owner | Common Shares Held | Options Vested or Vesting within 60 days | Beneficial Ownership | Percent of Class | ||||||||||||
| Common | David A. Seton | 5,590,133 | 4,945,155 | 10,535,288 | 2.78 | % | |||||||||||
| Common | John A. G. Seton | 5,220,107 | 4,912,696 | 10,132,803 | 2.68 | % | |||||||||||
| Common | Jon Morda | 52,088 | 1,628,720 | 1,680,808 | 0.44 | % | |||||||||||
| Common | Les Robinson | 2,387,005 | 2,128,720 | 4,515,725 | 1.19 | % | |||||||||||
| Common | Kevin Tomlinson | Nil | 1,250,000 | 1,250,000 | 0.33 | % | |||||||||||
| Common | S. Jane Bell | 333,377 | 939,466 | 1,272,843 | 0.34 | % | |||||||||||
| Common | Charles Barclay | 1,479,292 | 1,792,307 | 3,271,599 | 0.86 | % | |||||||||||
| Common | Darin Lee | Nil | Nil | Nil | Nil | ||||||||||||
| Common | Paul Seton | 130,530 | 2,076,240 | 2,206,770 | 0.58 | % | |||||||||||
| Common | Peter Tiedemann | 687,732 | 1,491,776 | 2,179,508 | 0.58 | % | |||||||||||
| Common | James Hamilton | 898,012 | 1,047,878 | 1,945,890 | 0.51 | % | |||||||||||
| Common | Jeffrey D. Klam | 160,000 | - | 160,000 | 0.04 | % | |||||||||||
94
The following table shows the securities convertible into common shares held by the Directors and Executive Officers of the Companyas at September 15, 2012.
| Name | Number of Common Shares | Exercise Price | Grant Date | Expiration Date | ||||||
| CDN $ | ||||||||||
| David A. Seton | 1,809,000 | 0.40 | Jun 18, 2008 | Jan 1, 2013 | ||||||
| 1,573,618 | 0.40 | Jan 4, 2010 | Dec 31, 2014 | |||||||
| 810,938 | 0.72 | Jan 7, 2011 | Dec 31, 2015 | |||||||
| 751,599 | 0.532 | Sep 26, 2011 | Sep 25, 2016 | |||||||
| 500,000 | 0.52 | Feb 15, 2012 | Feb 14, 2017 | |||||||
| 722,872 | 0.52 | Feb 15, 2012 | Feb 14, 2017 | |||||||
| 2,700,000 | 0.33 | March 14, 2012 | March 13, 2017 | |||||||
| John A. G. Seton | 1,000,000 | 0.40 | Apr 1, 2010 | Apr 1, 2015 | ||||||
| 750,000 | 0.42 | Apr 1, 2010 | Apr 1, 2015 | |||||||
| 750,000 | 0.60 | Apr 1, 2010 | Apr 1, 2015 | |||||||
| 997,252 | 0.45 | Sep 1, 2010 | Dec 31, 2014 | |||||||
| 540,625 | 0.72 | Jan 7, 2011 | Dec 31, 2015 | |||||||
| 254,213 | 0.515 | Aug 15, 2011 | Aug 14, 2016 | |||||||
| 620,606 | 0.532 | Sep 26, 2011 | Sep 25, 2016 | |||||||
| 1,000,000 | 0.52 | Feb 15, 2012 | Feb 14, 2017 | |||||||
| 900,000 | 0.33 | March 14, 2012 | March 13, 2017 | |||||||
| 562,500 | 0.26 | June 18, 2012 | June 17, 2017 | |||||||
| Leslie Robinson | 500,000 | 0.40 | Jan 4, 2010 | Dec 31, 2014 | ||||||
| 750,000 | 0.42 | Apr 1, 2010 | Apr 1, 2015 | |||||||
| 750,000 | 0.60 | Apr 1, 2010 | Apr 1, 2015 | |||||||
| 128,720 | 0.72 | Jan 20, 2011 | Dec 31, 2015 | |||||||
| 250,000 | 0.52 | Feb 15, 2012 | Feb 14, 2017 | |||||||
| 150,000 | 0.32 | May 1, 2012 | April 30, 2017 | |||||||
| Jon Morda | 750,000 | 0.42 | Apr 1, 2010 | Apr 1, 2015 | ||||||
| 750,000 | 0.60 | Apr 1, 2010 | Apr 1, 2015 | |||||||
| 128,720 | 0.72 | Jan 20, 2011 | Dec 31, 2015 | |||||||
| 250,000 | 0.52 | Feb 15, 2012 | Feb 14, 2017 | |||||||
| 315,000 | 0.33 | Mar 14, 2012 | Mar 13, 2017 | |||||||
| Kevin Tomlinson | 1,250,000 | 0.42 | Jan 17, 2012 | Jan 16, 2017 | ||||||
| 1,750,000 | 0.52 | Feb 15, 2012 | Feb 14, 2017 | |||||||
| S. Jane Bell | 104,167 | 0.80388 | Jan 12, 2010 | Sep 28, 2013 | ||||||
| 277,697 | 0.40 | Jan 4, 2010 | Dec 31, 2014 | |||||||
| 128,720 | 0.72 | Jan 7, 2011 | Dec 31, 2015 | |||||||
| 190,279 | 0.515 | Aug 15, 2011 | Aug 14, 2016 | |||||||
| 238,603 | 0.532 | Sep 26, 2011 | Sep 25, 2016 | |||||||
| 200,000 | 0.52 | Feb 15, 2012 | Feb 14, 2017 | |||||||
| 25,000 | 0.52 | March 7, 2012 | Feb 14, 2017 | |||||||
| 93,750 | 0.32 | May 1, 2012 | Apr 30, 2017 | |||||||
| Peter Tiedemann | 426,000 | 0.40 | Jun 12, 2008 | Jan 1, 2013 | ||||||
| 170,088 | 0.12 | Jan 2, 2009 | Jan 2, 2014 | |||||||
| 370,263 | 0.40 | Jan 4, 2010 | Dec 31, 2014 | |||||||
| 257,441 | 0.72 | Jan 7, 2011 | Dec 31, 2015 | |||||||
95
| 59,651 | 0.532 | Sep 26, 2011 | Sep 25, 2016 | |||||||
| 180,000 | 0.33 | March 14, 2012 | March 13, 2017 | |||||||
| 37,500 | 0.32 | May 1, 2012 | Apr 30, 2017 | |||||||
| Darin Lee | 4,562,500 | 0.24 | Sep 4, 2012 | Sep 3, 2017 | ||||||
| Charles Barclay | 426,000 | 0.40 | Jun 18, 2008 | Jan 1, 2013 | ||||||
| 370,263 | 0.40 | Jan 4, 2010 | Dec 31, 2014 | |||||||
| 257,441 | 0.72 | Jan 7, 2011 | Dec 31, 2015 | |||||||
| 238,603 | 0.532 | Sep 26, 2011 | Sep 25, 2016 | |||||||
| 250,000 | 0.52 | Feb 15, 2012 | Feb 14, 2017 | |||||||
| 170,088 | 0.52 | Feb 15, 2012 | Feb 14, 2017 | |||||||
| 500,000 | 0.65 | Aug 16, 2012 | Aug 15, 2017 | |||||||
| Paul Seton | 555,394 | 0.40 | Jan 4, 2010 | Dec 31, 2014 | ||||||
| 1,000,000 | 0.40 | Jan 4, 2010 | Dec 31, 2014 | |||||||
| 270,313 | 0.72 | Jan 7, 2011 | Dec 31, 2015 | |||||||
| 250,533 | 0.532 | Sep 26, 2011 | Sep 25, 2016 | |||||||
| 250,000 | 0.52 | Feb 15, 2012 | Feb 14, 2017 | |||||||
| 1,031,250 | 0.26 | June 18, 2012 | June 17, 2017 | |||||||
| James Hamilton | 150,000 | 0.65 | Aug 15, 2007 | Aug 15, 2012 | ||||||
| 319,000 | 0.40 | Jun 13, 2008 | Jan 1, 2013 | |||||||
| 127,566 | 0.12 | Jan 2, 2009 | Jan 2, 2014 | |||||||
| 277,697 | 0.40 | Jan 4, 2010 | Dec 31, 2014 | |||||||
| 90,104 | 0.72 | Jan 7, 2011 | Dec 31, 2015 | |||||||
| 83,511 | 0.532 | Sep 26, 2011 | Sep 25, 2016 | |||||||
| 150,000 | 0.52 | Feb 15, 2012 | Feb 14, 2017 | |||||||
| 50,000 | 0.52 | March 7, 2012 | Feb 14, 2017 | |||||||
| 150,000 | 0.26 | Aug 16, 2012 | Aug 15, 2012 | |||||||
| Jeffrey D. Klam | 100,000 | 0.52 | Feb 15, 2012 | Feb 14, 2017 | ||||||
| 100,000 | 0.52 | March 7, 2012 | Feb 14, 2017 |
| ITEM 7: | MAJOR SHAREHOLDERS AND RELATED PARTY TRANSACTIONS |
7A. Major Shareholders
To the knowledge of the directors and senior officers of the Company, the following are the only persons or companies who beneficially own, directly or indirectly, or exercise control or direction over shares carrying more than 5% of the Company’s outstanding shares, at September 15, 2012:
| Name | No. of Common Shares | Percentage |
Dragon Capital Group Limited Ho Chi Minh City, Vietnam | 62,943,172(1) | 16.6% |
Notes:
| (1) | Of these securities 42,484,497 shares are beneficially held by Vietnam Growth Fund Limited, 19,188,675 shares are beneficially held by Vietnam Enterprise Investments Limited, and 1,270,000 shares are beneficially held by Dragon Capital Markets Limited. |
96
Management of the Company is unaware of who the beneficial owners of Dragon Capital Group Limited (“Dragon Capital”) are. Based upon information contained on its website, Dragon Capital is an investment group focused exclusively on Vietnam’s capital markets.
In January 2010 Dragon Capital was issued 8,739,583 common shares of Olympus in exchange for their holding in Zedex under the terms of the Zedex/Olympus amalgamation. These were issued as Chess Depository Interests and are available for trade on the Australian Securities Exchange. This issuance changed Dragon Capital’s ownership percentage of the common shares to 30.38%. Dragon sold 32,163,124 common shares in 2010 and a further2,436,500 common shares in 2011, bringing their effective ownership to 16.8%.
Reference is made to the Dragon Schedule 13D for additional information on Dragon Capital including the source and amount of funds utilized in the investments in the Company’s common shares, the purpose of Dragon Capital’s investments in the Company, information relating to the voting and dispositive power over the Company’s common shares, and the executive officers and directors of each member of Dragon Capital Group Limited.
As at September 21, 2012, the Company was aware of 1,457 beneficial holders in the United States, the host country, representing ownership of 8.44% of the outstanding common shares of the Company.
Effective February 5, 2010, the Company commenced trading Chess Depositary Interests on the Australian Securities Exchange. As at September 21, 2012, the Company was aware of 941 Chess Depositary Interest holders in Australia, representing 47.15% of the outstanding common shares of the Company.
As of the date of this report, there were no arrangements, the operation of which could result in a change of control. All shareholders have the same voting rights with respect to the common shares they own.
7B. Related Party Transactions
During the transition year ended June 30, 2012, the Company paid or accrued $715,046 for management fees ($555,682 for the period from June 30, 2012 to the date hereof). The companies that were paid for management fees include the following: Dason Investments Limited associated with David Seton. Action Management Limited and Starsail Capital Limited associated with Charles Barclay, Wholesale Products Trading Limited associated with Peter Tiedemann, Jura Trust Limited associated with John Seton, Lloyd Beaumont Trust associated with Paul Seton, Whakapai Consulting Ltd. associated with S. Jane Bell and K&K Management GmbH associated with Klaus Leiders, who resigned as chief operating officer effective June 20, 2012.
Please see Item 4A, History and Development of the Company; Other Historical Matters, for a description of the Company’s merger with Zedex. Mr. Paul Seton, formerly CEO of Zedex and now the Chief Commercial Officer of the Company, Mr. John Seton, Chief Executive Officer and Mr. David Seton, Executive Chairman, are brothers.
These transactions were in the normal course of business and were measured at the exchange value which represented the amount of consideration established and agreed to by the related parties.These transactions were equivalent to terms agreed upon in similar transactions with non-affiliated parties.
7C. Interests of Experts and Counsel
97
Not applicable.
ITEM 8: FINANCIAL INFORMATION
8A. Consolidated Statements and Other Financial Information
Reference is made to Item 17, Financial Statements, for the financial statements required to be included in this Transition Report on Form 20-F.
There are no legal proceedings of a material nature pending against the Company, or its subsidiaries. The Company is unaware of any legal claim known to be contemplated by any governmental authorities.
The Company has never paid a dividend and it is unlikely that the Company will declare or pay a dividend in the near future.
8B. Significant Changes
The following significant events have occurred subsequent to June 30, 2011:
| · | Mr. Darin Lee was appointed chief operating officer of the Company effective August 22, 2012. Mr. Lee was issued 4,562,500 options upon his appointment exercisable at a price of CAD$0.24 on or before September 3, 2017. |
| · | On August 16, 2012 the Company issued 650,000 options to officers of the Company pursuant to the Company’s stock option plan. The options vest on August 16, 2013, have an exercise price of CAD$0.27 and can be exercised on or before August 15, 2017. |
| · | On September 4, 2012, the Company issued 300,000 options to employees and consultants of the Company pursuant to the Company’s stock option plan. The options vest on September 4, 2017, have an exercise price of CAD$0.24 and can be exercised on or before September 3, 2017. |
ITEM 9: THE OFFER AND LISTING
9A. Offer and Listing Details
The Company’s common shares trade on the TSX in Canada, under the symbol “OYM”. The initial listing date was effective on the TSX on April 3, 2006. Prior to April 3, 2006, the Company’s common shares traded on the TSX Venture Exchange in Canada.
The closing price of the common shares on September 21, 2012 was CAD$0.26.
The table below lists the low and high market prices for the common shares, on a monthly, quarterly and annual basis for actual trades of the Company’s common shares on the TSX:
98
| TSX Common Share Trading Activity | ||||||||
| Month and Year | Low (CAD$) | High (CAD$) | ||||||
| September 1-21 2012 | 0.16 | 0.28 | ||||||
| August 2012 | 0.16 | 0.21 | ||||||
| July 2012 | 0.21 | 0.27 | ||||||
| June 2012 | 0.22 | 0.31 | ||||||
| May 2012 | 0.22 | 0.30 | ||||||
| April 2012 | 0.27 | 0.35 | ||||||
| March 2012 | 0.31 | 0.37 | ||||||
| February 2012 | 0.35 | 0.40 | ||||||
| January 2012 | 0.25 | 0.38 | ||||||
Quarter | Low (CAD$) | High (CAD$) | ||||||
| April – June 2012 | 0.22 | 0.35 | ||||||
| January – March 2012 | 0.25 | 0.40 | ||||||
| October – December 2011 | 0.23 | 0.38 | ||||||
| July – September 2011 | 0.30 | 0.44 | ||||||
| April – June 2011 | 0.36 | 0.47 | ||||||
| January – March 2011 | 0.30 | 0.57 | ||||||
| October – December 2010 | 0.50 | 0.69 | ||||||
| July – September 2010 | 0.28 | 0.59 | ||||||
| Annual (Fiscal Year): | Low (CAD$) | High (CAD$) | ||||||
| Ended June 30, 2012 | 0.22 | 0.40 | ||||||
| Ended December 31, 2011 | 0.23 | 0.57 | ||||||
| Ended December 31, 2010 | 0.23 | 0.69 | ||||||
| Ended December 31, 2009 | 0.07 | 0.36 | ||||||
| Ended December 31, 2008 | 0.04 | 0.50 | ||||||
Effective February 5, 2010, the Company’s common shares commenced trading on the Australian Securities Exchange under the symbol “OYM”.The closing price of the common shares on the Australian Securities Exchange on September 21, 2012 was AUD$0.25.
99
The table below lists the low and high market prices for the common shares, on a monthly, quarterly and annual basis for actual trades of the Company’s common shares on the Australian Securities Exchange:
| ASX Common Share Trading Activity | ||||
| Month and Year | Low (AUD$) | High (AUD$) | ||||||
| September 1-21 2012 | 0.16 | 0.32 | ||||||
| August 2012 | 0.17 | 0.22 | ||||||
| July 2012 | 0.19 | 0.24 | ||||||
| June 2012 | 0.22 | 0.28 | ||||||
| May 2012 | 0.22 | 0.32 | ||||||
| April 2012 | 0.28 | 0.34 | ||||||
| March 2012 | 0.29 | 0.34 | ||||||
| February 2012 | 0.34 | 0.38 | ||||||
| January 2012 | 0.26 | 0.35 | ||||||
Quarter | Low (AUD$) | High (AUD $) | ||||||
| April – June 2012 | 0.22 | 0.34 | ||||||
| January – March 2012 | 0.26 | 0.38 | ||||||
| October – December 2011 | 0.24 | 0.36 | ||||||
| July – September 2011 | 0.33 | 0.41 | ||||||
| April – June 2011 | 0.34 | 0.46 | ||||||
| January – March 2011 | 0.37 | 0.54 | ||||||
| October – December 2010 | 0.47 | 0.65 | ||||||
| July – September 2010 | 0.30 | 0.52 | ||||||
| April – June 2010 | 0.31 | 0.44 | ||||||
February 5 – March 2010 | 0.10 | 0.35 | ||||||
| Annual (Fiscal Year): | Low (AUD $) | High (AUD $) | ||||||
| Ended June 30, 2012 | 0.22 | 0.38 | ||||||
| Ended December 31, 2011 | 0.24 | 0.54 | ||||||
| Ended December 31, 2010 | 0.10 | 0.65 | ||||||
100
Effective September 30, 2011, the Company’s common shares commenced trading on the OTCQX bulletin board in the United States under the symbol “OLYMF”.Prior to then, the Company’s common shares traded on the OTC Bulletin Board. The closing price of the shares on the OTCQX on September 21, 2012was US$0.28 .
The Company’s common shares are also posted for trading on the Frankfurt Stock Exchange under the symbol “OP6”. The closing price of the shares on the Frankfurt Stock Exchange on September 21, 2012 was €0.21.
9B. Plan of Distribution
Not applicable.
| 9C. | Markets |
See 9A.above
| 9D. | Selling Shareholders |
Not applicable.
| 9E. | Dilution |
Not applicable.
| 9F. | Expenses of the Issue |
Not applicable.
| ITEM 10: | ADDITIONAL INFORMATION |
| 10A. | Share Capital |
Not applicable
| 10B. | Memorandum and Articles of Association |
Incorporated by reference to Item 10B of the Company’s Registration Statement on Form 20-F, as amended, filed November 16, 2006.
| 10C. | Material Contracts |
The following material contracts have been entered into by the Company within the past two years outside the ordinary course of its business:
| 1) | Gold Export Certificates – Phuoc Son Gold Company Limited - dated December 31, 2010 and January 9, 2012 and Bong Mieu Gold Mining Company Limited dated December 31, 2010 and January 9, 2012. Refer to Items 4D.1 (a) and 4D.2 (a) for details on these licenses. |
101
| 2) | Convertible Promissory Notes – dated March 26, 2010. In March 2010 the Company obtained private placement funding of CAD$12,750,000 through issuance of convertible promissory notes. Refer to Items 4A and 8B for details of this debt. |
| 3) | Gold Loan Notes – dated June 19, 2010. In June 2010, the Company obtained private placement funding of US$21,960,000 in the form of gold delivery notes. Refer to Items 4A and 8B for details of this debt. |
| 4) | North Borneo Gold agreement for purchase and sale of shares in NBG – The Company acquired a 50.05% controlling interest in the Bau Gold Project when it merged business with Zedex Minerals Ltd in January 2010. Under the agreement for purchase and sale of shares in NBG dated September 30, 2010 as varied by a deed of variation dated May 20, 2011 and January 5, 2011 the Company agreed to acquire additiona interests in NBG culminating in an interest of 93.55% by January 2014. |
| 5) | North Borneo Gold exploration and shareholders agreement relating to the Bau Project –Under the Bau exploration and shareholders agreement the company operates in Joint Venture with a Malaysian mining group, Gladioli Enterprises SDN BHD (Bau Agreement). The joint venture agreement is dated November 2006 and under the terms of the agreement Olympus is the project operator. The agreement was amended and restated in October 2010. |
| 6) | Binh Dinh New Zealand Gold joint venture agreement - The Tien Thuan Gold Project is owned by the Binh Dinh New Zealand Gold Company (BNG), which is a joint venture between an Olympus subsidiary (KS Mining Ltd) and a company owned by the local Provincial Government (Biotan Minerals Ltd). BNG has been exploring the Tien Thuan Gold Project since grant of Investment Certificate No: 351022000036 (August 2007). Pursuant to the Investment Certificate, Zedex may earn 75% project equity, by funding exploration through to completion of a bankable freasibility study (such funding to be repayable from future profits). Upon reaching a “decision to mine”, project development will be jointly funded on a pro-rata basis and (December 2007) receipt of Provincial Government approval for the proposed exploration and development programme. |
| 7) | Deed of amendment and agreement with Gladioli Enterprises Sdn Bhd for Sale and Purchase of Shares in NBG - on September 30, 2010 the Company entered into an agreement to acquire a further 43.50% interest in North Borneo Gold Sdn Bhd by July 2013, at which time the Company’s effective interest in the Bau Gold Project will be 93.55%. The settlement is to be paid in several tranches as set out in Items 4A and 4D. |
| 8) | Convertible Promissory Notes – dated April 29, 2011. In April 2011 the Company obtained private placement funding of CAD$15 million through issuance of convertible promissory notes. Refer to Items 4A and 8B for details of this debt. |
| 9) | Convertible Promissory Notes – dated May 6, 2011. In May 2011 the Company obtained private placement funding of US$14.6 million through issuance of convertible promissory notes. Refer to Items 4A and 8B for details of this debt. |
| 10) | Agreement between NBG and SGS (Malaysia) Sdn Bhd forsample preparation and analytical services, dated November 2010. SGS (Malaysia) is responsible for setting up and operating an independent laboratory within the Bau Mine and the term of the agreement is 5 years. |
102
| 11) | Capcapo Joint Venture Agreement – dated September 30, 2011 pursuant to which the Company, in consortium with PhilEarth, obtained the right to earn a 60% interest in the Capacpo Mineral Production Sharing Agreement in the Northern Philippines. |
| 10D. | Exchange Controls |
There are no laws, governmental decrees or regulations in Canada that restrict the export or import of capital or which affect the remittance of dividends, interest or other payments to non-resident holders of our shares, other than the withholding tax requirements (Reference is made to Item 10E) and the Proceeds of Crime (Money Laundering) and Terrorist Financing Act. The Proceeds of Crime (Money Laundering) and Terrorist Financing Act requires that persons and entities report the importation or exportation of currency or monetary instruments of a value equal to or greater than $10,000 to Canadian customers officers in the prescribed form and manner.
There are no limitations under the laws of Canada or the Province of Ontario, or in our constituting documents, with respect to the right of non-resident or foreign owners to hold or vote common shares other than those imposed by the Investment Canada Act.
The Investment Canada Act is a federal Canadian statute which regulates the acquisition of control of existing Canadian businesses and the establishment of new Canadian businesses by an individual, government or entity that is a “non-Canadian” as defined in the Investment Canada Act. Such investments are generally reviewable under the Investment Canada Act by the Minister, designated as being responsible for the administration of the Investment Canada Act. Reviewable investments, generally, may not be implemented prior to the Minister’s determining that the investment is likely to be of “net benefit to Canada” based on the criteria set out in the Investment Canada Act. Generally investments by non-Canadians consisting of the acquisition of control of Canadian businesses which are otherwise non-reviewable and the establishment of new Canadian businesses are subject to certain notification requirements under the Investment Canada Act in the prescribed form and manner.
Management of the Company believes that it is not currently a“non-Canadian” for purposes of the Investment Canada Act and therefore it is not subject to the Act. However, if the Company were to become a “non-Canadian” in the future, acquisitions of control of Canadian businesses by the Company would become subject to the Investment Canada Act. Generally, the direct acquisition by a “non-Canadian” of an existing Canadian business with gross assets of $5 million or more is reviewable under the Investment Canada Act, unless the business is acquired by a WTO investor in which the thresholds for transactions are CAD$281 million in 2007,CAD$295 million in 2008, CAD$312 million in 2009, CAD$299 million in 2010 and CAD$312 million in 2011.Generally, indirect acquisitions of existing Canadian businesses (with gross assets over $50 million) are reviewable under the Investment Canada Act, except in situations involving “WTO investors” where indirect acquisitions are generally not reviewable but are nonetheless subject to notification. In transactions involving Canadian businesses engaged in the production of uranium, providing financial services, providing transportation services or which are cultural businesses, the benefit of the higher “WTO investor” thresholds do not apply.
Acquisitions of businesses related to Canada’s cultural heritage or national identity (regardless of the value of assets involved) may also be reviewable under the Investment Canada Act. In addition, investments to establish new, unrelated businesses are not generally reviewable but are nonetheless subject to nofication. An investment to establish a new business that is related to the non-Canadian’s existing business in Canada is not subject to notification under the Investment Canada Act unless such investment relates to Canada’s cultural heritage or national identity.
103
Any proposed take-over of the Company by a “non-Canadian” would likely only be subject to the simple notification requirements of the Investment Canada Act, as in all likelihood that non-Canadian would be a “WTO investor” for purposes of the Investment Canada Act provided that the high WTO threshold is not met. Generally, a “WTO investor” is an individual, other than a Canadian, who is a national of a country that is a member of the World Trade Organization or a business entity controlled by such an individual. Virtually all countries of the Western world are members of the World Trade Organization. The Company would have to have a gross asset base of at least $5 million for a direct acquisition, and at least $50 million for an indirect acquisition, before the reviewable transaction provisions of the Investment Canada Act would apply to a third party non-Canadian acquirer that is not a WTO investor.
| 10E. | Taxation |
10E.1. Certain Canadian Federal Income Tax Consequences – General
The following is a brief summary of some of the principal Canadian federal income tax consequences to a holder of the common-voting shares of the Company (a “Holder”) who deals at arm’s length with the Company, holds the shares as capital property and who, for the purposes of the Income Tax Act (Canada) (the “Act”) and the Canada – United States Income Tax Convention (the “Treaty”), is at all relevant times resident in the United States, is not and is not deemed to be resident in Canada and does not use or hold and is not deemed to use or hold the shares in carrying on a Business in Canada. Special rules, which are not discussed below, may apply to a U.S. Holder that is an insurer that carries on Business in Canada and elsewhere.
Under the Act a Holder of the common-voting shares will generally be subject to a 25%withholding tax on dividends paid or credited or deemed by the Act to have been paid or credited on such shares, reduced bythe Treatyto 15%. The withholding tax rate is 5% where the Holder is a corporation that beneficially owns at least 10% of the voting shares of the Company and the dividends may be exempt from such withholding in the case of some Holders such as qualifying pension funds and charities. Reference is made to “Item 10E.4 – United States Taxation” for a more detailed discussion of the United States tax considerations relating to an investment in the common shares.
10E.2. Dividends
A Holder will be subject to Canadian withholding tax (“Part XIII Tax”) equal to 25%, or such lower rate as may be available under an applicable tax treaty, of the gross amount of any dividend paid or deemed to be paid on common shares. Under the Canada-U.S. Income Tax Convention (1980) as amended by the Protocols signed on 6/14/1983, 3/28/1984, 3/17/1995, 7/29/1997and 9/21/2007 (the “Treaty”), the rate of Part XIII Tax applicable to a dividend on common shares paid to a Holder who is a resident of the United States and who is the beneficial owner of the dividend, shall not exceed 15%. If the Holder is a company that owns at least 10% of the voting stock of the Company paying the dividend, the withholding tax rate is reduced to 5% and, in all other cases, the tax rate is 15% of the gross amount of the dividend (under the provisions of the Canada – US Income Tax Convention). The Company will be required to withhold the applicable amount of Part XIII Tax from each dividend so paid and remit the withheld amount directly to the Receiver General for Canada for the account of the Holder.
| 10E.3. | Disposition of Common Shares |
A Holder who disposes of a common share, including by deemed disposition on death, will not normally be subject to Canadian tax on any capital gain (or capital loss) thereby realized unless the common share constituted “taxable Canadian property” as defined by the Tax Act. Generally, a common share of a public corporation will not constitute taxable Canadian property of a Holder if the share is listed on a designated stock exchange unless the Holder or persons with whom the Holder did not deal at arm’s length alone or together held or held options to acquire, at any time within the five years preceding the disposition, 25% or more of the shares of any class of the capital stock of the Company. The TSX is a designated stock exchange under the Tax Act. A Holder who is a resident of the United States and realizes a capital gain on a disposition of a common share that was taxable Canadian property will nevertheless, by virtue of the Treaty, generally be exempt from Canadian tax thereon unless (a) more than 50% of the value of the common shares is derived from, or from an interest inreal or immovable property situated in Canada including Canadian real estate,Canadian timber resource properties, Canadian mineral resource properties,and options in respect of property of the aforementioned (b) the common share formed part of the Business property of a permanent establishment that the Holder has or had in Canada within the 12 month period preceding the disposition, or (c) the Holder is an individual who (i) was a resident of Canada at any time during the 10 years immediately preceding the disposition, and for a total of 120 months during any period of 20 consecutive years, preceding the disposition, and (ii) owned the common share when he ceased to be resident in Canada.
104
A Holder who is subject to Canadian tax in respect of a capital gain realized on a disposition of a common share must include one-half of the capital gain (taxable capital gain) in computing the Holder’s taxable income earned in Canada. The Holder may, subject to certain limitations, deduct one-half of any capital loss (allowable capital loss) arising on a disposition of taxable Canadian property from taxable capital gains realized in the year of disposition in respect of taxable Canadian property and, to the extent not so deductible, from such taxable capital gains realized in any of the three preceding years or any subsequent year.
| 10E.4. | United States Taxation |
The following summary is a general discussion of the material United States Federal income tax considerations to US holders of our common shares under current law. It does not discuss all the tax consequences that may be relevant to particular holders in light of their circumstances or to holders subject to special rules, such as tax-exempt organizations, qualified retirement plans, financial institutions, insurance companies, real estate investment trusts, regulated investment companies, broker-dealers, non-resident alien individuals or foreign corporations whose ownership of our shares is not effectively connected with the conduct of a trade or Business in the United States, shareholders who acquired their stock through the exercise of employee stock options or otherwise as compensation, shareholders who hold their stock as ordinary assets and not capital assets and any other non-US holders.
The following discussion is based upon the Internal Revenue Code of 1986, as amended (the “Code”), Treasury Regulations, published Internal Revenue Service (“IRS”) rulings, published administrative positions of the IRS and court decisions that are currently applicable, any or all of which could be materially and adversely changed, possibly on a retroactive basis, at any time. This discussion does not consider the potential effects, both adverse and beneficial, of any recently proposed legislation that, if enacted, could be applied, possibly on a retroactive basis, at any time. The following discussion is not intended to be, nor should it be construed to be, legal or tax advice to any holder or prospective holder of our shares and no opinion or representation with respect to the United States Federal income tax consequences to any such holder or prospective holder is made. Accordingly, holders and prospective holders of our shares should consult their own tax advisors about the Federal, state, local, estate and foreign tax consequences of purchasing, owning and disposing of our shares.
US Holders
105
As used herein, a “US Holder” includes a holder of shares of the Company who is a citizen or resident of the United States, a corporation created or organized in or under the laws of the United States or of any political subdivision thereof, any entity that is taxable as a US corporation for US tax purposes and any other person or entity whose ownership of our shares is effectively connected with the conduct of a trade or Business in the United States. A US Holder does not include persons subject to special provisions of Federal income tax law, such as tax exempt organizations, qualified retirement plans, financial institutions, insurance companies, real estate investment trusts, regulated investment companies, broker-dealers, non-resident alien individuals or foreign corporations whose ownership of our shares is not effectively connected with the conduct of or trade or Business in the United States, shareholders who acquired their stock through the exercise of employee stock options or otherwise as compensation and shareholders who hold their stock as ordinary assets and not as capital assets.
Distributions on our Shares
Subject to the discussion of passive foreign investment companies below, US Holders receiving dividend distributions (including constructive dividends) with respect to our shares are required to include in gross income for United States Federal income tax purposes the gross amount of such distributions to the extent that we have current or accumulated earnings and profits as defined under US Federal tax law, without reduction for any income tax withheld from such distributions. Such tax withheld may be credited, subject to certain limitations, against the US Holder’s United States Federal income tax liability or, alternatively, may be deducted in computing the US Holder’s United States Federal taxable income by those who itemize deductions. (See more detailed discussion at “Foreign Tax Credit” below). To the extent that distributions exceed our current or accumulated earnings and profits, they will be treated first as a return of capital up to the US Holder’s adjusted basis in the shares and thereafter as gain from the sale or exchange of the shares. Preferential tax rates for net capital gains are applicable to a US Holder that is an individual, estate or trust. There are currently no preferential tax rates for long-term capital gains for a US Holder that is a corporation.
With effect from January 1, 2003 and ending December 31, 2010, the United States reduced the maximum tax rate on certain qualifying dividend distributions to 15% (tax rate for low income holders is 5% until 2007 and 0% for 2008 through 2012). In order for dividends paid by foreign corporations to qualify for the reduced rates, (1) the foreign corporation must meet certain requirements, including that it not be classified as a foreign investment company or a passive foreign investment company for United States federal income tax purposes in either the taxable year of the distribution or the preceding taxable year, (2) the shares of the foreign corporation must be readily tradable on an established securities market in the United States and (3) the US Holder must meet the required holding period. In order to meet the required holding period, the US Holder must hold our common shares for at least 60 days during the 121-day period beginning 61 days before the ex-dividend date. Under published IRS guidance, our common shares will be considered readily tradable on an established securities market in the United States only if they are listed on certain exchanges, which presently do not include the OTC Bulletin Board. Therefore, the availability of the lower tax rates for dividends paid with respect to our common shares is in substantial doubt, and US holders are advised to consult their own tax advisers regarding the availability of the lower tax rate for any dividends paid with respect to our common shares.
Dividends paid on our shares will not generally be eligible for the dividends received deduction provided to corporations receiving dividends from certain United States corporations. A US Holder that is a corporation may, under certain circumstances, be entitled to a 70% deduction of the United States source portion of dividends received from us (unless we qualify as a “foreign personal holding company” or a “passive foreign investment company”, as defined below) if such US Holder owns shares representing at least 10% of our voting power and value. The availability of this deduction is subject to several complex limitations that are beyond the scope of this discussion.
106
In the case of foreign currency received as a dividend that is not converted by the recipient into US dollars on the date of receipt, a US Holder will have a tax basis in the foreign currency equal to its US dollar value on the date of receipt. Generally, any gain or loss recognized upon a subsequent sale or other disposition of the foreign currency, including the exchange for US dollars, will be ordinary income or loss. However, for tax years after 1997, an individual whose realized foreign exchange gain does not exceed US $200 will not recognize that gain, to the extent that there are no expenses associated with the transaction that meet the requirement for deductibility as a trade or Business expense (other than travel expenses in connection with a Business trip or as an expense for the production of income).
Foreign Tax Credit
A US Holder who pays (or has withheld from distributions) Canadian income tax with respect to the ownership of our shares may be entitled, atthe option of the Holder, to either a deduction or a tax credit for such foreign tax paid or withheld. Generally, it will be more advantageous to claim a credit because a credit reduces United States Federal income taxes on a dollar-for-dollar basis, while a deduction merely reduces the taxpayer’s income subject to tax. This election is made on a year-by-year basis and applies to all foreign taxes paid by (or withheld from) the US Holder during that year. There are significant and complex limitations that apply to the credit, among which is the general limitation that the credit cannot exceed the proportionate share of the US Holder’s United States Federal income tax liability that the US Holder’s foreign source income bears to his or its worldwide taxable income. In the determination of the application of this limitation, the various items of income and deduction must be classified into foreign and domestic sources. Complex rules govern this classification process. There are further limitations on the foreign tax credit for certain types of income such as “passive income”, “high withholding tax interest”, “financial services income”, “shipping income”, and certain other classifications of income. The availability of the foreign tax credit and the application of the limitations on the credit are fact specific and holders and prospective holders of our shares should consult their own tax advisors regarding their individual circumstances.
Disposition of our Shares
Subject to the discussion of passive foreign investment companies, below, a US Holder will recognize a gain or loss upon the sale of our shares equal to the difference, if any, between (i) the amount of cash plus the fair market value of any property received, and (ii) the shareholder’s tax basis in our shares. This gain or loss will be a capital gain or loss if the shares are a capital asset in the hands of the US Holder, and will be a short-term or long-term capital gain or loss depending upon the holding period of the US Holder. Preferential tax rates for long-term gains are applicable to a U.S. Holder which is an individual, estate or trust. There are currently no preferential tax rates for long-term capital gains for a U.S. Holder which is a corporation.
Gains and losses are netted and combined according to special rules in arriving at the overall capital gain or loss for a particular tax year. Deductions for net capital losses are subject to significant limitations. Corporate capital losses (other than losses of corporations electing under Subchapter S or the Code) are deductible to the extent of capital gains. Non-corporate taxpayers may deduct net capital losses, whether short-term or long-term, up to US $3,000 a year (US $1,500 in the case of a married individual filing separately). For US Holders which are individuals, any unused portion of such net capital loss may be carried over to be used in later tax years until such net capital loss is thereby exhausted. For US Holders which are corporations (other than corporations subject to Subchapter S of the Code), an unused net capital loss may be carried back three years from the loss year and carried forward five years from the loss year to be offset against capital gains until such net capital loss is thereby exhausted.
107
Other Considerations
In the following circumstances, the above sections of this discussion may not describe the United States Federal income tax consequences resulting from the holding and disposition of our shares:
Passive Foreign Investment Company
As a foreign corporation with US Holders, we could potentially be treated as a passive foreign investment company (“PFIC”), as defined in Section 1297 of the Code, if 75% or more of our gross income in a taxable year is passive income, or the average percentage of our assets (by value) during the taxable year which produce passive income or which are held for production of same is at least 50%. Passive income is generally defined to include gross income in the nature of dividends, interest, royalties, rents and annuities; excess of gains over losses from certain transactions in any commodities not arising inter alia from a PFIC whose Business is actively involved in such commodities; certain foreign currency gains; and other similar types of income. US Holders owning shares of a PFIC are subject to an additional tax and to an interest charge based on the value of deferral of tax for the period during which the shares of the PFIC are owned, in addition to treatment of any gain realized on the disposition of shares of the PFIC as ordinary income rather than as a capital gain. However, if the US Holder makes a timely election to treat a PFIC as a qualified electing fund (“QEF”) with respect to such shareholder’s interest therein, the above-described rules generally will not apply. Instead, the electing US Holder would include annually in his gross income his pro rata share of the PFIC’s ordinary earnings and any net capital gain regardless of whether such income or gain was actually distributed. A US Holder of a QEF can, however, elect to defer the payment of United States Federal income tax on such income inclusions. Special rules apply to US Holders who own their interests in a PFIC through intermediate entities or persons.
The IRS has issued proposed regulations that, subject to certain exceptions, would treat as taxable certain transfers of PFIC stock by a Non-Electing US Holder that are generally not otherwise taxed, such as gifts, exchanges pursuant to corporate reorganizations, and transfers at death. Generally, in such cases, the basis of our shares in the hands of the transferee and the basis of any property received in the exchange for those shares would be increased by the amount of gain recognized. A US Holder who has made a timely QEF election (as discussed below) will not be taxed on certain transfers of PFIC stock, such as gifts, exchanges pursuant to corporate reorganizations, and transfers at death. The transferee’s basis in this case will depend on the manner of the transfer. The specific tax effect to the US Holder and the transferee may vary based on the manner in which our shares are transferred. We have not made a determination as to whether we would be considered a PFIC as of the date of this report or any time prior to such date. Moreover, we do not have any current intention to conduct such a determination in the future.Therefore, each US Holder should consult a tax advisor with respect to how the PFIC rules affect their tax situation.
Shareholder Election
These adverse tax consequences may be avoided, if the US Holder has elected to treat the PFIC as a qualified electing fund (a “QEF”) with respect to that US Holder effective for each of the PFIC’s taxable years beginning on or after January 1, 1987, which include any portion of the US Holder’s holding period.
The procedure a US Holder must comply with in making an effective QEF election will depend on whether the year of election is the first year in the US Holder’s holding period in which we are a PFIC. If the US Holder makes a QEF election in such first year (i.e. a timely QEF election), then the US Holder may make the QEF election by simply filing the appropriate documents at the time the US Holder files his tax return for such first year. If, however, we qualified as a PFIC in a prior year and the QEF election was not made by the US Holder, then in addition to filing documents, the US Holder must generally recognize gain as if it had sold the QEF stock on the first day of the taxable year in which the QEF election is made, if (i) the US Holder holds stock in the PFIC on that day, and (ii) the US Holder can establish the fair market value of the PFIC stock on that day. The US Holder will treat that deemed sale transaction as a disposition of PFIC stock and will, thereafter, be subject to the rules described below applicable to US shareholders of a QEF.
108
In order to comply with the requirements of a QEF election, a US Holder must receive a PFIC annual information statement from us. If we determine we are a PFIC for any taxable year, we will endeavor to provide to the US Holder such information as the IRS may require, including a PFIC annual information statement, in order to enable the US Holder to make and maintain a QEF election. However, there is no assurance that we will have timely knowledge of our status as a PFIC in the future or of the required information to be provided.
In general, US shareholders of a QEF are taxable currently on their pro rata share of the QEF’s ordinary income and net capital gain regardless of whether such income or gain was actually distributed. A US Holder of a QEF can, however, elect to defer the payment of United States Federal income tax on such income inclusions.
The PFIC and QEF election rules are complex. US Holders should consult a tax advisor regarding the availability and procedure for making the QEF election as well as the applicable method for recognizing gains or earnings and profits under the foregoing rules.
Mark to Market Election
Effective for tax years of US Holders beginning after December 31, 1997, US Holders who hold, actually or constructively, marketable stock of a foreign corporation that qualifies as a PFIC may elect to mark such stock to market (a “mark-to-market election”). If such an election is made, such US Holder will not be subject to the special taxation rules of PFIC described above for the taxable years for which the mark-to-market election is made. A US Holder who makes such an election will include in income for the taxable year an amount equal to the excess, if any, of the fair market value of our shares as of the close of such tax year over such US Holder’s adjusted basis in such shares. In addition, the US Holder is allowed a deduction for the lesser of (i) the excess, if any, of such US Holder’s adjusted tax basis in the shares over the fair market value of such shares as of the close of the tax year, or (ii) the excess, if any of (A) the mark-to-market gains for our shares included by such US Holder for prior tax years, including any amount which would have been included for any prior year but for Section 1291 interest on tax deferral rules discussed above with respect to a US Holder, who has not made a timely QEF election during the year in which he holds (or is deemed to have held) our shares and we are a PFIC (“Non-Electing US Holder”), over (B) the mark-to-market losses for shares that were allowed as deductions for prior tax years. A US Holder’s adjusted tax basis in our shares will be increased or decreased to reflect the amount included or deducted as a result of mark-to-market election. A mark-to-market election will apply to the tax year for which the election is made and to all later tax years, unless the PFIC stock ceases to be marketable or the IRS consents to the revocation of the election.
The mark-to-market election is available only for stock that is regularly traded on a national securities exchange that is registered with the Securities and Exchange Commission or on Nasdaq, or on a foreign exchange or market that the IRS determines has rules sufficient to ensure that the market price represents a legitimate and sound fair market value. Since we expect that our common shares will be listed and traded on the OTC Bulletin Board, our common shares may not qualify as marketable stock for purposes of this election. Moreover, there can be no assurance that our common shares will be “regularly traded” for purposes of the mark-to-market election. US Holders are advised to consult their own tax advisors regarding the availability and tax consequences of a mark-to-market election in respect to our common shares under their particular circumstances.
109
Controlled Foreign Corporation
If more than 50% of the voting power of all classes of stock or the total value of our stock is owned, directly or indirectly, by citizens or residents of the United States, United States domestic partnerships and corporations or estates or trusts other than foreign estates or trusts, each of whom own 10% or more of the total combined voting power of all classes of our stock (“United States shareholder”), we could be treated as a “controlled foreign corporation” under Subpart F of the Code. This classification would cause many complex results including the required inclusion by such United States shareholders in income of their pro rata share of our “Subpart F income” (as specially defined by the Code). If we are both a PFIC and controlled foreign corporation, we will generally not be treated as a PFIC with respect to United States shareholders of the controlled foreign corporation. This rule generally will be effective for our taxable years ending with or within such taxable years of United States shareholders. In addition, under Section 1248 of the Code, a gain from the sale or exchange of shares by a US Holder who is or was a United States shareholder at any time during the five year period ending with the sale or exchange is treated as ordinary dividend income to the extent of our earnings and profits attributable to the stock sold or exchanged. Because of the complexity of Subpart F, and because it is not clear that Subpart F would apply to the US Holders of our shares, a more detailed review of these rules is outside of the scope of this discussion.
| 10F. | Dividends and Paying Agents |
Not applicable
| 10G. | Statements by Experts |
Not applicable.
| 10H. | Documents on Display |
Copies of the documents referred to in this document may be inspected during normal business hours, at the offices ofthe Company at Suite 500, 10 King Street East, Toronto, Ontario, Canada. Its telephone number is (416) 572-2525.
| 10I. | Subsidiary Information |
Not applicable.
| ITEM 11: | QUANTITATIVE AND QUALITATIVE DISCLOSURES ABOUT MARKET RISK |
Reference is made to Note 28 to the Company’s audited financial statements for the transitional six-month fiscal year ended June 30, 2012, at Item 17. Financial Statements, for a description of the Company’s (a) market and commodity price risks, (b) foreign exchange risks, (c) interest rate risks, (d) credit risks, and (e) liquidity risks, and how such risks affect the Company.
| ITEM 12: | DESCRIPTION OF SECURITIES OTHER THAN EQUITY SECURITIES |
Not Applicable.
110
PART II
ITEM 13: DEFAULTS, DIVIDEND ARREARAGES AND DELINQUENCIES
None.
ITEM 14: MATERIAL MODIFICATIONS TO THE RIGHTS OF SECURITY HOLDERS AND USE OF PROCEEDS
None.
ITEM 15: CONTROLS AND PROCEDURES
(a) Disclosure Controls and Procedures of the Company’s Chief Executive Officer
Based on an evaluation under the supervision of and with the participation of the Company’s management, the Company’s principal executive officer and principal financial officer have concluded that theCompany’s disclosure controls and procedures as defined in Rules 13a-15(e) and 15d-15(e) under the Securities Exchange Act of 1934, as amended, were effective as of June 30, 2012 to provide reasonable assurance that information required to be disclosed by the Company in reports that it files or submits under the Exchange Act is (i) recorded, processed, summarized and reported within the time periods specified in the Securities and Exchange Commission rules and forms and (ii) accumulated and communicated to the Company’s management, including its principal executive officer and principal financial officer, as appropriate to allow timely decisions regarding required disclosure.
(b) Management’s Report on Internal Control Over Financial Reporting
Management of the Company is responsible for establishing and maintaining adequate internal control over financial reporting. Internal control over financial reporting is a process designed by, or under the supervision of, the Company’s Chief Executive Officer and Chief Financial Officer and effected by the Company’s Board, management and other personnel to provide reasonable assurance regarding the reliability of financial reporting and the preparation of financial statements for external purposes in accordance with generally accepted accounting principles. Because of its inherent limitations, internal control over financial reporting may not prevent or detect misstatements. Also, projections of any evaluation of effectiveness to future periods are subject to risk that controls may become inadequate because of changes in conditions, or that the degree of compliance with the policies or procedures may deteriorate.
The Company’s management, including the Company’s Chief Executive Officer and Chief Financial Officer, assessed the effectiveness of the Company’s internal control over financial reporting as of June 30, 2012. In making this assessment, the Company’s management used the criteria set forth by the Committee of Sponsoring Organizations of the Treadway Commission in Internal Control-Integrated Framework. Based upon its assessment, management concluded that, as of June 30, 2012, the Company’s internal control over financial reporting was effective.
The effectiveness of the Company’s internal control over financial reporting as of June 30, 2012 has been audited by Ernst & Young LLP, an independent registered public accounting firm, as stated in their report which appears herein.
111
The Company will continue to periodically review its disclosure controls and procedures and internal control over financial reporting and may make modifications from time to time as considered necessary or desirable.
(c) Attestation Report of the Registered Public Accounting Firm
Report of Independent Registered Public Accounting Firm
The Board of Directors and Shareholders of Olympus Pacific Minerals Inc.:
We have audited Olympus Pacific Minerals Inc. internal control over financial reporting as of June 30, 2012, based on criteria established in Internal Control—Integrated Framework issued by the Committee of Sponsoring Organizations of the Treadway Commission (the COSO criteria). Olympus Pacific Minerals Inc. management is responsible for maintaining effective internal control over financial reporting, and for its assessment of the effectiveness of internal control over financial reporting included in the accompanying Statement of Management's Responsibility. Our responsibility is to express an opinion on the company’s internal control over financial reporting based on our audit.
We conducted our audit in accordance with the standards of the Public Company Accounting Oversight Board (United States). Those standards require that we plan and perform the audit to obtain reasonable assurance about whether effective internal control over financial reporting was maintained in all material respects. Our audit included obtaining an understanding of internal control over financial reporting, assessing the risk that a material weakness exists, testing and evaluating the design and operating effectiveness of internal control based on the assessed risk, and performing such other procedures as we considered necessary in the circumstances. We believe that our audit provides a reasonable basis for our opinion.
A company’s internal control over financial reporting is a process designed to provide reasonable assurance regarding the reliability of financial reporting and the preparation of financial statements for external purposes in accordance with generally accepted accounting principles. A company’s internal control over financial reporting includes those policies and procedures that (1) pertain to the maintenance of records that, in reasonable detail, accurately and fairly reflect the transactions and dispositions of the assets of the company; (2) provide reasonable assurance that transactions are recorded as necessary to permit preparation of financial statements in accordance with generally accepted accounting principles, and that receipts and expenditures of the company are being made only in accordance with authorizations of management and directors of the company; and (3) provide reasonable assurance regarding prevention or timely detection of unauthorized acquisition, use or disposition of the company’s assets that could have a material effect on the financial statements.
Because of its inherent limitations, internal control over financial reporting may not prevent or detect misstatements. Also, projections of any evaluation of effectiveness to future periods are subject to the risk that controls may become inadequate because of changes in conditions, or that the degree of compliance with the policies or procedures may deteriorate.
In our opinion, Olympus Pacific Minerals Inc. maintained, in all material respects, effective internal control over financial reporting as of June 30, 2012, based on the COSO criteria.
We also have audited, in accordance with the standards of the Public Company Accounting Oversight Board (United States), the consolidated financial statements of Olympus Pacific Minerals Inc., which comprise the consolidated statement of financial position as at June 30 2012 and December 31, 2011 and December 31, 2010, and consolidated statements of income (loss) and comprehensive income (loss), changes in equity and cash flows for the six month period ended June 30, 2012 and the years ended December 31, 2011 and December 31, 2010, and our report dated September 28, 2012, expressed an unqualified opinion thereon that included an explanatory paragraph regarding Olympus Pacific Minerals Inc.'s ability to continue as a going concern.
112
Ernst & Young LLP
Licensed Public Accountants
Toronto, Canada, September 28, 2012
(d) Changes in Internal Control over Financial Reporting
There were no changes in our internal controls over financial reporting during our fiscal year ended June 30, 2012 that has materially affected, or is reasonably likely to materially affect, our internal controls over financial reporting.
ITEM 16: [RESERVED]
ITEM 16A. Audit Committee Financial Expert
The Company’s Audit Committee is independent and all members are considered financially literate under Canadian regulatory standards. The Audit Committee is composed of Jon Morda, Leslie Robinson and Kevin Tomlinson. The Company considers that the Audit Committee has at least one member, Jon Morda, who would be considered an “audit committee financial expert”, based on his background and education as set forth in Item 6, above.
ITEM 16B. Code of Ethics
The Company has a Code of Business Conduct and Ethics that was approved by the Company’s Board of Directors on March 30, 2012and which is posted at www.olympuspacific.com.
Refer to Exhibit 4.43 for the Code of Business Conduct and Ethics.
ITEM 16C. Principal Accountant Fees and Services
The aggregate fees billed by the Company’s external auditors in each of the last two fiscal years are as follows:
Financial Year Ending | Audit Fees(1) ($CAD) | Audit Related Fees(2) ($CAD) | Tax Fees(3) ($CAD) | All Other Fees(4) ($CAD) | |||||||||
2012(5) | $ | 326,000 | $ | 108,500 | $ | 1,500 | Nil | ||||||
| 2011 | $ | 428,160 | $ | 128,225 | $ | 1,450 | Nil | ||||||
(1) The aggregate audit fees billed.
| (2) | The aggregate fees billed for assurance and related services that are reasonably related to the performance of the audit or review of our consolidated financial statements which are not included under the heading “Audit Fees”. |
| (3) | The aggregate fees billed for professional services rendered for tax compliance, tax advice and tax planning. |
| (4) | The aggregate fees billed for products and services other than as set out under the headings “Audit Fees”, “Audit Related Fees” and “Tax Fees”. |
| (5) | Represents the six-month transitional financial year ended June 30, 2012. |
113
The Audit Committee must approve in advance any non-audit related services provided by the auditor to the Company, and the fees for such services. The Audit Committee reviews these with a view to ensure the independence of the Auditor, and in accordance with applicable regulatory standards, including applicable stock exchange requirements with respect to approval of non-audit related services performed by the auditors. The Audit Committee then, as necessary, takes or recommends that the Board take, appropriate action to oversee the independence of the Auditor.
ITEM 16D. Exemptions From the Listing Standards for Audit Committees
None
ITEM 16E. Purchases of Equity Securities by the Issuer and Affiliated Purchasers
On November 28, 2011, the Company announced its intention to make a normal course issuer bid to be transacted through the facilities of the TSX and filed a buy-back announcement with the Australian Securities Exchange (collectively, the “Buy-Back Program”).
Pursuant to the terms of the Buy-Back Program, Olympus may purchase its own common shares for cancellation in compliance with TSX or ASX rules, as applicable, up to a maximum of 30,072,558 shares, being 10% of its public float as of November 28, 2011. Purchases on the TSX will be subject to a daily maximum of 49,601 shares representing 25% of the average daily trading volume of 198,403 shares for the six months ended October 31, 2011, except where such purchases are made in accordance with “block” purchase exemptions under TSX guidelines. Olympus will initiate purchases at different times starting on or after December 1, 2011, and ending no later than November 30, 2012.
The following table sets out information regarding purchases made by the Company under the Buy-Back Program:
| Period | Market | Total Number of Common Shares Purchased | Average Price Paid per Common Share | Total Number of Common Shares Purchased as Part of Publicly Announced Program | Maximum Number of Common Shares that May Yet be Purchased Under the Program |
| December 2011 | TSX | 347,500 | CAD$0.2525 | 347,500 | 29,725,058 |
| January 2012 | TSX | 218,500 | CAD$0.2803 | 713,000 | 29,012,058 |
| ASX | 147,000 | AUD$0.3477 | |||
| February 2012 | TSX | 514,500 | CAD$0.3793 | 1,744,476 | 27,267,582 |
| ASX | 516,976 | AUD$0.3612 |
114
| March 2012 | TSX | 173,500 | CAD$0.3419 | 2,295,179 | 27,704,821 |
| ASX | 377,203 | AUD$0.3264 | |||
| April 2012 | TSX | 362,500 | CAD0.3419 | 2,975,179 | 27,024,821 |
| ASX | 217,500 | AUD$0.3166 | |||
| May – Sep. 15, 2012 | TSX | Nil | Nil | 2,975,179 | 27,024,821 |
| ASX | Nil | Nil |
ITEM 16F. Change in Registrant’s Certifying Accountant
None
115
PART III
ITEM 17: FINANCIAL STATEMENTS
Consolidated Statements of Financial Position of Olympus Pacific Minerals Inc. as at June 30, 2012 and December 31, 2011 and and January 1, 2011, and Consolidated Statements of Income (Loss) and Comprehensive Income (Loss),Changes in Equity and Cash Flows for the fiscal years ended June 30, 2012 and December 31, 2011, reported on by Ernst & Young LLP, Chartered Accountants. These statements are prepared in accordance with International Financial Reporting Standards as issued by the International Accounting Standards Board, which differ in certain respects from United States generally accepted accounting principles.
ITEM 18: FINANCIAL STATEMENTS
See Item 17. Financial Statements.
ITEM 19: EXHIBITS
19A. Financial Statements
Consolidated Statements of Financial Position of Olympus Pacific Minerals Inc. as at June 30, 2012 and December 31, 2011, and December 31, 2010, and Consolidated Statements of Income (Loss) and Comprehensive Income (Loss), Changes in Equity and Cash Flows for the six-month period ended June 30, 2012 and the years ended December 31, 2011 and December 31, 2010, reported on by Ernst & Young LLP, Chartered Accountants. These statements are prepared in accordance with International Financial Reporting Standards as issued by the International Accounting Standards Board, which differ in certain respects from United States generally accepted accounting principles.
19B. Exhibits
1. Incorporated by reference from the 2007 20F Annual Report dated March 28, 2008 exhibit 1. Articles of Incorporation and By Laws
1.1. Incorporated by reference from the 2007 20F Annual Report dated March 28, 2008 exhibit 1.1 Certificates of Status, Amendment, Continuance
1.2. Incorporated by reference from the 2007 20F Annual Report dated March 28, 2008 exhibit 1.2 Bylaws as currently in effect.
2. Instruments defining the rights of holders of equity – refer to exhibit 1 under 19B.
| 4. | Material Contracts |
4.1. Incorporated by reference from the 2007 20F Annual Report dated March 28, 2008 exhibit 3.1 - Mining Permit – dated July 22, 1992
4.2. Incorporated by reference from the 2007 20F Annual Report dated March 28, 2008 exhibit 3.2 - Right to Use Land Certificate – dated October 9, 1993
4.3. Incorporated by reference from the 2007 20F Annual Report dated March 28, 2008 exhibit 3.5 - Mining License No 116/GP –BTNMT – dated January 23, 2006
116
4.4. Incorporated by reference from the 2007 20F Annual Report dated March 28, 2008 exhibit 3.8 - Joint Venture Agreement - dated March 5, 2003.
4.5. Incorporated by reference from the 2007 20F Annual Report dated March 28, 2008 exhibit 3.19 - Assignment Agreement among Ivanhoe Mines Ltd., Zedex Minerals Limited, andOlympus Pacific Minerals, Inc. dated January 1, 2006
4.6. Incorporated by reference from the 2007 20F Annual Report dated March 28, 2008 exhibit 3.20 - Certificate of Incorporation and Articles of Incorporation of Kadabra Mining Corp – May, 2007.
4.7. Stock Option Plan – dated June 7, 2007. Incorporated by reference from the Amended Annual Report on Form 20-F for the year ended December 31, 2008, dated February 3, 2010, exhibit 3.18.
4.8. Incorporated by reference from the 2007 20F Annual Report dated March 28, 2008 exhibit 3.28 - Exploration License dated January 10, 2008
4.9. Incorporated by reference from the 2008 20F Annual Report dated March 31,2009 exhibit 3.31 Bong Mieu Exploration Licence No 2125/GP-BTNMT
4.10. Incorporated by reference from the 2009 20F Annual Report dated July 15, 2010 exhibit 3.37 Convertible Loan Note Agreement and attachment dated March 26, 2010
4.11. Incorporated by reference from the 2009 20F Annual Report dated July 15, 2010 exhibit 3.38 Gold Loan Note Agreement dated June 19, 2010
4.12. Zedex Amalgamation Document – Incorporated by reference from Form CB filed with the SEC on November 19, 2009.
4.13. Incorporated by reference from the 2009 20F Annual Report dated July 15, 2010 exhibit 3.41 Foreign Investment Committee Approval of Bau Joint Venture dated November 9, 2007
4.14. Incorporated by reference from the 2009 20F Annual Report dated July 15, 2010 exhibit 3.42 Tien Thuan Joint Venture Agreement – dated November 1, 2006
4.15. Incorporated by reference from the 2010 20F Annual Report dated June 7, 2011 exhibit 3.44 Convertible Loan Note Agreement and attachment dated May 5,2011.
4.16. Incorporated by reference from the 2010 20F Annual Report dated June 7, 2011 exhibit 3.45 Convertible Loan Note Agreement and attachment dated May 6,2011.
4.17. Incorporated by reference from the 2010 20F Annual Report dated June 7, 2011 exhibit 3.54 Agreement and deed of amendment with Gladioli Enterprises Sdn Bhd for Sale and Purchase of Shares in North Borneo Gold Sdn Bhd datedSeptember 30, 2010 and May 20, 2011 respectively.
4.18. Incorporated by reference from the 2010 20F Annual Report dated June 7, 2011 exhibit 3.55 Amended and Restated Exploration and Shareholders’ Agreement Relating to the Bau Project dated October 29, 2010 and Schedules to Agreement.
117
4.19. Incorporated by reference from the 2010 20F Annual Report dated June 7, 2011 exhibit 3.56 Refining contract and addendum to refining contract between Argor-Hearaeus SA and Bong Mieu Gold Mining Company dated January 1, 2010 and December 31, 2010 respectively.
4.20. Incorporated by reference from the 2010 20F Annual Report dated June 7, 2011 exhibit 3.57 Refining contract and addendum to refining contract between Argor-Hearaeus SA and Phuoc Son Gold Company dated January 1, 2010 and December 31, 2010 respectively.
4.21. Incorporated by reference from the 2010 20F Annual Report dated June 7, 2011 exhibit 3.58 Agreement between North Borneo Gold Sdn Bhd and SGS (Malaysia) Sdn Bhd for sample preparation and analytical services, dated November 1, 2010.
4.22. Incorporated by reference from the 2011 20F Annual Report dated March 30, 2012 exhibit 4.29 Investment Certificate No. 33102200001008 dated July 8, 2008 in respect of Bong Mieu Gold Mining Company Limited.
4.23. Incorporated by reference from the 2011 20F Annual Report dated March 30, 2012 exhibit 4.30 Investment Certificate No. 331022000010 dated July 8, 2008 in respect of Phuoc Son Gold Company Limited.
4.24. Incorporated by reference from the 2011 20F Annual Report dated March 30, 2012 exhibit 4.31 Gold Export Certificates for Bong Mieu Gold Mining Company Limited and Phuoc Son Gold Company Limited dated January 9, 2012.
4.25. Incorporated by reference from the 2011 20F Annual Report dated March 30, 2012 exhibit 4.32 Deed of Variation #1 with Gladioli Enterprises Sdn Bhd for Sale and Purchase of Shares in North Borneo Gold Sdn Bhd dated May 20, 2012.
4.26. Incorporated by reference from the 2011 20F Annual Report dated March 30, 2012 exhibit 4.41 Deed of Variation #2 with Gladioli Enterprises Sdn Bhd for Sale and Purchase of Shares in North Borneo Gold Sdn Bhd dated January 31, 2012.
4.27. Incorporated by reference from the 2011 20F Annual Report dated March 30, 2012 exhibit 4.42 Capcapo Joint Venture Agreement dated September 30, 2011 pursuant to which the Company, in consortium with PhilEarth, obtained the right to earn a 60% interest in the Capcapo Mineral Production Sharing Agreement in the Northern Philippines.
4.28. Incorporated by reference from the 2011 20F Annual Report dated March 30, 2012 exhibit 4.43 Code of Busines Conduct and Ethics dated March 30, 2012.
4.29. Mining License ML565/GP-BTNMT dated April 25, 2012.*
4.30. Form of management services agreement entered into with the Company’s officers.*
* filed herewith
5. List of Subsidiaries
The Company has the following subsidiaries:
118
a. Formwell Holdings Ltd. – incorporated in British Virgin Islands;
b. Bong Mieu Holdings Ltd. – incorporated in Thailand;
c. Bong Mieu Gold Mining Company Limited – incorporated in Vietnam (80% owned by Bong Mieu Holdings Ltd);
d. Olympus Pacific Vietnam Ltd. – incorporated in British Virgin Islands;
e. New Vietnam Mining Corporation (NVMC) – incorporated in British Virgin Islands;
f. Phuoc Son Gold Company Limited – incorporated in Vietnam (85% owned by New Vietnam Mining Corporation (NVMC);
g. Olympus Pacific Thailand Ltd. – incorporated in British Virgin Islands;
h. Kadabra Mining Corp. – incorporated in Philippines;
i. Olympus Pacific Minerals Vietnam Ltd. – incorporated in Vietnam;
j. Olympus Pacific Minerals Labuan Ltd. (formerly Olympus Pacific Minerals NZ Ltd) – incorporated in Malaysia;
k. OYM NZ Ltd – incorporated in New Zealand;
l. Parnell Cracroft Ltd – incorporated in British Virgin Islands;
m. GR Enmore Pty Ltd. – incorporated in Australia (acquired as a result of the Zedex transaction which completed on January 12, 2010);
n. Binh Dinh NZ Gold Company Ltd. – incorporated in Vietnam (acquired as a result of the Zedex transaction which completed on January 12, 2010);
o. North Borneo Gold Sdn Bhd – incorporated in Malaysia (acquired as a result of the Zedex transaction which completed on January 12, 2010);
p. Bau Mining Co Ltd – incorporate in Samoa (acquired as a result of the Zedex transaction which completed on January 12, 2010);
q. KS Mining Ltd – incorporated in Samoa (acquired as a result of the Zedex transaction which completed on January 12, 2010); and
r. Olympus Pacific Minerals Singapore Pte Ltd – incorporated in Singapore.
12. Certifications
12.1 Certification of Chief Executive Officer
12.2 Certification of Chief Financial Officer
13. Certifications
119
13.1 Certification of Chief Executive Officer
13.2 Certification of Chief Financial Officer
| 99. | Other Exhibits |
99.1. Consent of Terra Mining Consultants and Stevens & Associates.
120
SIGNATURES
The Registrant hereby certifies that it meets all of the requirements for filing on Form 20-F and that is has duly caused and authorized the undersigned to sign this annual report on its behalf.
Olympus Pacific Minerals Inc.
By:/s/ John A. G. Seton
John A. G. Seton
Chief Executive Officer
Date: September 28, 2012
S-1
Statement of Management’s Responsibility
The accompanying consolidated financial statements, Management’s Discussion and Analysis and all of the other information included in the Annual Report have been prepared by and are the responsibility of management of the Company. The consolidated financial statements have been prepared in accordance with International Financial Reporting Standards (“IFRS”) as issued by the International Accounting Standards Board (“IASB”) and reflect management’s best estimates and judgments based on currently available information. The Company has a system of internal controls designed to provide reasonable assurance that the financial statements are accurate and complete in all material respects. Management believes that the internal controls provide reasonable assurance that our financial information is reliable and relevant, and that assets are properly accounted for and safeguarded from loss.
The Board of Directors is responsible for ensuring that management fulfills its responsibilities for financial reporting and internal control. The Board exercises its responsibilities through the Audit Committee, appointed by the Board and comprised of independent directors, which meets with the independent auditors to satisfy itself that management’s responsibilities are properly discharged and to review the consolidated financial statements before they are presented to the Board of Directors for approval.
The consolidated financial statements have been audited by Ernst & Young LLP Chartered Accountants. The independent auditors have unrestricted access to the Audit Committee. Their report outlines the scope of their examination and opinion on the consolidated financial statements.
Signed: “John A. G. Seton” | Signed: “S. Jane Bell” |
John. A.G. Seton Chief Executive Officer September 28, 2012 | S. Jane Bell Chief Financial Officer September 28, 2012 |
1
Independent Auditors’ Report of Registered Public Accounting Firm
To the Shareholders of Olympus Pacific Minerals Inc.
We have audited the accompanying consolidated financial statements of Olympus Pacific Minerals Inc., which comprise the consolidated statements of financial position as at June 30, 2012, December 31, 2011 and December 31, 2010 and the consolidated statements of income (loss) and comprehensive income (loss), changes in equity and cash flows for the six-month period ended June 30, 2012 and the years ended December 31, 2011 and December 31, 2010, and a summary of significant accounting policies and other explanatory information.
Management's responsibility for the consolidated financial statements
Management is responsible for the preparation and fair presentation of these consolidated financial statements in accordance with International Financial Reporting Standards as issued by the International Accounting Standards Board, and for such internal control as management determines is necessary to enable the preparation of consolidated financial statements that are free from material misstatement, whether due to fraud or error.
Auditors’ responsibility
Our responsibility is to express an opinion on these consolidated financial statements based on our audits. We conducted our audits in accordance with Canadian generally accepted auditing standards and the standards of the Public Company Accounting Oversight Board (United States). Those standards require that we comply with ethical requirements and plan and perform the audit to obtain reasonable assurance about whether the consolidated financial statements are free from material misstatement.
An audit involves performing procedures to obtain audit evidence about the amounts and disclosures in the consolidated financial statements. The procedures selected depend on the auditors’ judgment, including the assessment of the risks of material misstatement of the consolidated financial statements, whether due to fraud or error. In making those risk assessments, the auditors consider internal control relevant to the entity's preparation and fair presentation of the consolidated financial statements in order to design audit procedures that are appropriate in the circumstances. An audit also includes examining, on a test basis, evidence supporting the amounts and disclosures in the consolidated financial statements, evaluating the appropriateness of accounting policies used and the reasonableness of accounting estimates made by management, as well as evaluating the overall presentation of the consolidated financial statements.
We believe that the audit evidence we have obtained in our audits is sufficient and appropriate to provide a basis for our audit opinion.
Opinion
In our opinion, the consolidated financial statements present fairly, in all material respects, the financial position of Olympus Pacific Minerals Inc. as at June 30, 2012, December 31, 2011 and December 31, 2010 and its financial performance and its cash flows for the six-month period ended June 30, 2012 and years ended December 31, 2011and December 31, 2010 in accordance with International Financial Reporting Standards as issued by the International Accounting Standards Board.
Emphasis of Matter
Without qualifying our opinion, we draw attention to Note 3 in the financial statements which indicates that the Company incurred a net loss of $18.3 million during the six-month period ended June 30, 2012 and, as of that date, the Company’s current liabilities exceeded its current assets by $12.9 million. These conditions, along with other matters as set forth in Note 3, indicate the existence of a material uncertainty that may cast significant doubt on the Company’s ability to continue as a going concern.
Other matter
We have also audited, in accordance with the standards of the Public Company Accounting Oversight Board (United States), Olympus Pacific Minerals Inc.'s internal control over financial reporting as of June 30, 2012, based on the criteria established in Internal Control — Integrated Framework issued by the Committee of Sponsoring Organizations of the Treadway Commission and our report dated September 28, 2012 expressed an unqualified opinion on Olympus Pacific Minerals Inc.’s internal control over financial reporting.
 | |
Toronto, Canada September 28, 2012 | Chartered Accountants Licensed Public Accountants |
2
Report of Independent Registered Public Accounting Firm
The Board of Directors and Shareholders of Olympus Pacific Minerals Inc.
We have audited Olympus Pacific Minerals Inc.’s internal control over financial reporting as of June 30, 2012, based on criteria established in Internal Control—Integrated Framework issued by the Committee of Sponsoring Organizations of the Treadway Commission (the COSO criteria). Olympus Pacific Minerals Inc.’s management is responsible for maintaining effective internal control over financial reporting, and for its assessment of the effectiveness of internal control over financial reporting included in the accompanying Statement of Management’s Responsibility. Our responsibility is to express an opinion on the company’s internal control over financial reporting based on our audit.
We conducted our audit in accordance with the standards of the Public Company Accounting Oversight Board (United States). Those standards require that we plan and perform the audit to obtain reasonable assurance about whether effective internal control over financial reporting was maintained in all material respects. Our audit included obtaining an understanding of internal control over financial reporting, assessing the risk that a material weakness exists, testing and evaluating the design and operating effectiveness of internal control based on the assessed risk, and performing such other procedures as we considered necessary in the circumstances. We believe that our audit provides a reasonable basis for our opinion.
A company’s internal control over financial reporting is a process designed to provide reasonable assurance regarding the reliability of financial reporting and the preparation of financial statements for external purposes in accordance with generally accepted accounting principles. A company’s internal control over financial reporting includes those policies and procedures that (1) pertain to the maintenance of records that, in reasonable detail, accurately and fairly reflect the transactions and dispositions of the assets of the company; (2) provide reasonable assurance that transactions are recorded as necessary to permit preparation of financial statements in accordance with generally accepted accounting principles, and that receipts and expenditures of the company are being made only in accordance with authorizations of management and directors of the company; and (3) provide reasonable assurance regarding prevention or timely detection of unauthorized acquisition, use or disposition of the company’s assets that could have a material effect on the financial statements.
Because of its inherent limitations, internal control over financial reporting may not prevent or detect misstatements. Also, projections of any evaluation of effectiveness to future periods are subject to the risk that controls may become inadequate because of changes in conditions, or that the degree of compliance with the policies or procedures may deteriorate.
In our opinion, Olympus Pacific Minerals Inc. maintained, in all material respects, effective internal control over financial reporting as of June 30, 2012, based on the COSO criteria.
We also have audited, in accordance with the standards of the Public Company Accounting Oversight Board (United States), the consolidated financial statements of Olympus Pacific Minerals Inc., which comprise the consolidated statement of financial position as at June 30, 2012, December 31, 2011 and December 31, 2010 and consolidated statements of income (loss) and comprehensive income (loss), changes in equity and cash flows for the six-month period ended June 30, 2012 and the years ended December 31, 2011 and December 31, 2010 and our report dated September 28, 2012 expressed an unqualified opinion thereon that included an explanatory paragraph regarding Olympus Pacific Minerals Inc.'s ability to continue as a going concern.
| |
Toronto, Canada September 28, 2012 | Chartered Accountants Licensed Public Accountants |
3
Financial Statements - Consolidated Statement of Income (Loss) and Comprehensive Income (Loss)
| (Stated in United States dollars) | For the six months ended June 30, | For the year ended December 31, | For the year ended December 31, | |||||||||
| 2012 | 2011 | 2010 | ||||||||||
| Sales | $ | 34,552,265 | $ | 47,976,630 | $ | 35,986,013 | ||||||
| Cost and expenses | ||||||||||||
| Cost of sales | 15,464,162 | 20,906,884 | 13,123,584 | |||||||||
| Amortization | 11,922,054 | 13,410,876 | 8,974,079 | |||||||||
| Royalty expense | 4,264,873 | 6,393,203 | 4,795,935 | |||||||||
| (Gain) loss on gold loan principal repayments | 1,157,625 | (2,305,926 | ) | (689,178 | ) | |||||||
| Exploration | 287,528 | 669,119 | 96,468 | |||||||||
| Stock-based compensation (note 25) | 1,462,071 | 1,277,892 | 1,876,574 | |||||||||
| Interest and accretion on term loans | 4,938,341 | 6,975,083 | 1,321,122 | |||||||||
| Derivatives - fair value revaluation | (4,619,530 | ) | (16,351,957 | ) | 9,886,791 | |||||||
| Corporate and administrative expenses | 4,376,195 | 10,947,423 | 8,357,205 | |||||||||
| 39,253,319 | 41,922,597 | 47,742,580 | ||||||||||
| Other (income)/expense | ||||||||||||
| Interest (income) expense | (64,533 | ) | 204,941 | 49,493 | ||||||||
| Other (income) | (65,208 | ) | (27,754 | ) | (11,470 | ) | ||||||
| Impairment charge (notes 10, 11 & 12) | 12,812,162 | - | - | |||||||||
| Loss on disposal of capital assets | 25,824 | 251,994 | 16,193 | |||||||||
| Foreign exchange gain | (481,799 | ) | (200,603 | ) | (672,557 | ) | ||||||
| 12,226,446 | 228,578 | (618,341 | ) | |||||||||
| Income (loss) for the period before income tax | (16,927,500 | ) | 5,825,455 | (11,138,226 | ) | |||||||
| Income tax expense (note 29) | 1,399,391 | 4,180,557 | 1,634,846 | |||||||||
| Net income (loss) and comprehensive income (loss) for the period | (18,326,891 | ) | 1,644,898 | (12,773,072 | ) | |||||||
| Attributable to: | ||||||||||||
| Equity owners | $ | (15,320,128 | ) | $ | 1,084,649 | $ | (13,882,384 | ) | ||||
| Non-controlling interest | (3,006,763 | ) | 560,249 | 1,109,312 | ||||||||
| $ | (18,326,891 | ) | $ | 1,644,898 | $ | (12,773,072 | ) | |||||
| Earnings (loss) per share attributable to equity owners (note 8) | ||||||||||||
| Basic | $ | (0.040 | ) | $ | 0.003 | $ | (0.042 | ) | ||||
| Diluted | $ | (0.040 | ) | $ | 0.003 | $ | (0.042 | ) | ||||
| See accompanying notes to the Consolidated Financial Statements | ||||||||||||
4
Financial Statements - Consolidated Statement of Financial Position
| As at | June 30, | December 31, | December 31, | |||||||||
| (Stated in United States dollars) | 2012 | 2011 | 2010 | |||||||||
| ASSETS | ||||||||||||
| Non-current | ||||||||||||
| Advances on plant & equipment | $ | 147,247 | $ | 822,515 | $ | 1,361,327 | ||||||
| Property, plant and equipment (note 10) | 32,826,934 | 36,938,115 | 30,649,677 | |||||||||
| Deferred exploration expenditure (note 11) | 21,428,562 | 19,516,555 | 13,621,774 | |||||||||
| Deferred development expenditure (note 12) | 10,636,534 | 20,276,490 | 18,103,858 | |||||||||
| Mine properties (note 13) | 37,165,314 | 37,896,565 | 39,197,779 | |||||||||
| Deferred tax assets (note 29) | - | 121,232 | - | |||||||||
| 102,204,591 | 115,571,472 | 102,934,415 | ||||||||||
| Current | ||||||||||||
| Cash and cash equivalents (note 14) | 3,397,728 | 8,730,248 | 4,105,325 | |||||||||
| Trade and other receivables (note 15) | 1,614,115 | 2,022,122 | 7,989,736 | |||||||||
| Inventories (note 16) | 11,295,411 | 15,286,535 | 6,689,000 | |||||||||
| Other financial assets (note 17) | 2,605,304 | 3,641,797 | 1,473,929 | |||||||||
| 18,912,558 | 29,680,702 | 20,257,990 | ||||||||||
| Total assets | 121,117,149 | 145,252,174 | 123,192,405 | |||||||||
| SHAREHOLDERS' EQUITY | ||||||||||||
| Equity attributable to equity owners | ||||||||||||
| Capital and reserves (note 24) | 129,495,807 | 131,387,415 | 126,412,502 | |||||||||
| Deficit | (81,103,158 | ) | (65,783,030 | ) | (66,867,679 | ) | ||||||
| 48,392,649 | 65,604,385 | 59,544,823 | ||||||||||
| Non-controlling interest | 2,169,412 | 5,920,409 | 5,682,771 | |||||||||
| Total shareholders' equity | 50,562,061 | 71,524,794 | 65,227,594 | |||||||||
| LIABILITIES | ||||||||||||
| Non-current | ||||||||||||
| Provisions (note 18) | 1,151,327 | 1,278,993 | 1,119,332 | |||||||||
| Derivative financial liabilities (note 19) | 6,063,607 | 13,963,138 | 18,200,216 | |||||||||
| Interest-bearing loans and borrowings (note 20) | - | 2,795,510 | 8,979,280 | |||||||||
| Convertible notes (note 21) | 24,320,588 | 22,524,540 | 6,436,133 | |||||||||
| Deferred tax liabilities (note 29) | 7,228,227 | 6,695,129 | 6,590,305 | |||||||||
| 38,763,749 | 47,257,310 | 41,325,266 | ||||||||||
| Current | ||||||||||||
| Provisions (note 18) | 1,219,683 | 1,036,017 | 967,574 | |||||||||
| Derivative financial liabilities (note 19) | 3,280,000 | |||||||||||
| Trade and other payables (note 22) | 14,323,461 | 15,891,548 | 8,033,182 | |||||||||
| Other financial liabilities (note 23) | 872,782 | 354,312 | 818,946 | |||||||||
| Interest-bearing loans and borrowings (note 20) | 11,474,321 | 8,558,040 | 6,429,600 | |||||||||
| Convertible notes (note 21) | 621,092 | 630,153 | 390,243 | |||||||||
| 31,791,339 | 26,470,070 | 16,639,545 | ||||||||||
| Total liabilities | 70,555,088 | 73,727,380 | 57,964,811 | |||||||||
| Commitments, contingencies and contractual obligations (note 27) | ||||||||||||
| Total liabilities and shareholders' equity | $ | 121,117,149 | $ | 145,252,174 | $ | 123,192,405 | ||||||
| See accompanying notes to the Consolidated Financial Statements | ||||||||||||
For and on behalf of the Board September 28, 2012 | Signed: “John A. G. Seton” John A. G. Seton Chief Executive Officer | Signed: “Jon Morda” Jon Morda Director & Chairman of the Audit Committee |
5
Financial Statements - Consolidated Statement of Changes in Equity
| For the six month period ended June 30, 2012 | ||||||||||||||||||||||||
| (Stated in United States dollars) | ||||||||||||||||||||||||
| Issued | Other Reserves | Non-Controlling | Total | |||||||||||||||||||||
| Notes | Capital | Deficit | Note 24(d) | Interest | Equity | |||||||||||||||||||
| Balance at January 1, 2010 | $ | 97,318,003 | $ | (52,985,295 | ) | $ | 4,425,408 | $ | (444,033 | ) | $ | 48,314,083 | ||||||||||||
| Income/(loss) for the year | (13,882,384 | ) | 1,109,312 | (12,773,072 | ) | |||||||||||||||||||
| Issue of share capital | 24 | 32,585,853 | 32,585,853 | |||||||||||||||||||||
| Options granted and vested | 2,323,275 | 2,323,275 | ||||||||||||||||||||||
| Options exercised | (654,896 | ) | (654,896 | ) | ||||||||||||||||||||
| Warrants granted and vested | 521,561 | 521,561 | ||||||||||||||||||||||
| Non-controlling interest on amalgamation | 9,910,790 | 9,910,790 | ||||||||||||||||||||||
| Investment in subsidiary | (10,106,702 | ) | (4,893,298 | ) | (15,000,000 | ) | ||||||||||||||||||
| Balance at December 31, 2010 | 129,903,856 | (66,867,679 | ) | (3,491,354 | ) | 5,682,771 | 65,227,594 | |||||||||||||||||
| Income/(loss) for the year | 1,084,649 | 560,249 | 1,644,898 | |||||||||||||||||||||
| Issue of share capital | 24 | 6,016,121 | 750,000 | 6,766,121 | ||||||||||||||||||||
| Share capital cancelled | (73,022 | ) | (73,022 | ) | ||||||||||||||||||||
| Options granted and vested | 3,063,380 | 3,063,380 | ||||||||||||||||||||||
| Options exercised | (661 | ) | (661 | ) | ||||||||||||||||||||
| Warrants granted and vested | 896,484 | 896,484 | ||||||||||||||||||||||
| Investment in subsidiary | (4,927,389 | ) | (1,072,611 | ) | (6,000,000 | ) | ||||||||||||||||||
| Balance at December 31, 2011 | 135,846,955 | (65,783,030 | ) | (4,459,540 | ) | 5,920,409 | 71,524,794 | |||||||||||||||||
| Income/(loss) for the six month period | (15,320,128 | ) | (3,006,763 | ) | (18,326,891 | ) | ||||||||||||||||||
| Dividend declared non-controlling interest portion | - | - | - | (211,843 | ) | (211,843 | ) | |||||||||||||||||
| Share capital cancelled | (910,114 | ) | (910,114 | ) | ||||||||||||||||||||
| Options granted and vested | 1,462,067 | 1,462,067 | ||||||||||||||||||||||
| Options exercised | 197,856 | (173,808 | ) | 24,048 | ||||||||||||||||||||
| Investment in subsidiary | (2,467,609 | ) | (532,391 | ) | (3,000,000 | ) | ||||||||||||||||||
| Balance at June 30, 2012 | 135,134,697 | (81,103,158 | ) | (5,638,890 | ) | 2,169,412 | 50,562,061 | |||||||||||||||||
| See accompanying notes to the Consolidated Financial Statements | ||||||||||||||||||||||||
6
Financial Statements – Consolidated Statement of Cash Flows
| (Stated in United States dollars) | For the six months ended June 30, | For the year ended December 31, | For the year ended December 31, | |||||||||
| 2012 | 2011 | 2010 | ||||||||||
| Operating activities: | ||||||||||||
| Income (loss) for the period after tax | $ | (18,326,891 | ) | $ | 1,644,898 | $ | (12,773,072 | ) | ||||
| Items not affecting cash | ||||||||||||
| Amortization | 11,922,054 | 13,410,876 | 8,974,079 | |||||||||
| Impairment charge | 12,812,162 | - | - | |||||||||
| Loss on disposal of capital assets | 25,824 | 251,994 | 16,193 | |||||||||
| (Gain) loss on gold loan principal repayment | 1,157,625 | (2,305,926 | ) | (689,178 | ) | |||||||
| Stock-based compensation expense | 1,462,071 | 1,277,892 | 1,876,574 | |||||||||
| Deferred income tax | 694,349 | 213,400 | (619,978 | ) | ||||||||
| Deferred issuance cost | - | 673,456 | 350,202 | |||||||||
| Derivatives revaluation | (4,619,530 | ) | (16,351,957 | ) | 9,886,791 | |||||||
| Interest and accretion of term loans | 2,756,314 | 3,190,811 | 191,167 | |||||||||
| Unrealized foreign exchange | (239,638 | ) | (508,282 | ) | 332,751 | |||||||
| ARO accretion adjustment | 56,348 | 79,969 | 90,333 | |||||||||
| Changes in non-cash working capital balances | ||||||||||||
| Trade and other receivables and other financial assets | 1,234,970 | 3,395,252 | (6,163,287 | ) | ||||||||
| Trade and other payables | (1,849,952 | ) | 7,981,187 | 3,878,290 | ||||||||
| Inventory | (1,980,562 | ) | (10,115,544 | ) | (5,441,604 | ) | ||||||
| Cash provided by (used in) operating activities | 5,105,144 | 2,838,026 | (90,739 | ) | ||||||||
| Investing activities: | ||||||||||||
| Cash acquired in amalgamation | - | 45,643 | ||||||||||
| Deferred exploration and development costs | (7,969,936 | ) | (16,051,004 | ) | (11,876,238 | ) | ||||||
| Investment in subsidiary | (3,000,000 | ) | (6,000,000 | ) | (15,000,000 | ) | ||||||
| Acquisition of property, plant and equipment | (1,660,342 | ) | (10,108,738 | ) | (21,974,982 | ) | ||||||
| Cash used in investing activities | (12,630,278 | ) | (32,159,742 | ) | (48,805,577 | ) | ||||||
| Financing activities: | ||||||||||||
| Capital lease payments | - | (609,626 | ) | (739,307 | ) | |||||||
| Convertible notes issued | - | 28,732,255 | 11,481,794 | |||||||||
| Gold loan notes issued | - | - | 20,215,700 | |||||||||
| Purchase of shares through share buy-back | (910,114 | ) | (73,022 | ) | - | |||||||
| Shares issued, net of costs | - | 5,498,220 | 15,841,667 | |||||||||
| Proceeds from secured bank loan | 3,028,593 | - | - | |||||||||
| Capital contributions from JV partner | - | 750,000 | - | |||||||||
| Proceeds from options and warrants exercised | 24,048 | 1,487 | 82,591 | |||||||||
| Cash provided by financing activities | 2,142,527 | 34,299,314 | 46,882,445 | |||||||||
| Increase (decrease) in cash during the period | (5,382,607 | ) | 4,977,598 | (2,013,871 | ) | |||||||
| Cash - beginning of the year | 8,730,248 | 4,105,325 | 5,718,725 | |||||||||
| Effect of foreign exchange rate changes on cash | 50,087 | (352,675 | ) | 400,471 | ||||||||
| Cash - end of period | $ | 3,397,728 | $ | 8,730,248 | $ | 4,105,325 | ||||||
| Supplemental information: | ||||||||||||
| Interest paid | $ | 2,182,027 | $ | 3,846,066 | $ | 1,129,955 | ||||||
| Income taxes paid | $ | 2,803,404 | $ | 3,077,065 | $ | 994,783 | ||||||
| See accompanying notes to the Consolidated Financial Statements | ||||||||||||
7
Notes to the Financial Statements
1. Corporate Information
The comparative consolidated financial statements of Olympus Pacific Minerals Inc. (the “Company” or “Olympus”) as at and for the six-month period ended June 30, 2012 were authorized for issue in accordance with a resolution of the Company’s board of directors on September 28, 2012. Olympus is a corporation continued under the Canada Business Corporation Act with its registered office located and domiciled in Toronto, Ontario, Canada whose shares are publically traded. Its common shares are traded on the Toronto Stock Exchange, the Australian Securities Exchange and the OTCQX in the United States of America.
The principal activities of the group are the acquisition, exploration, development, mining and re-instatement of gold bearing properties in Southeast Asia. The Company has two key properties located in Central Vietnam: the Bong Mieu Gold property and the Phuoc Son Gold property; as well as one key property in Central Malaysia: The Bau Gold property; and, one key property in the Northern Philippines: The Capcapo Gold property.
2. Statement of Compliance
These comparative consolidated financial statements of Olympus Pacific Minerals Inc. and its subsidiaries (the “Group”) have been prepared in accordance with International Financial Reporting Standards (“IFRS”) as issued by the International Accounting Standards Board (“IASB”). These comparative financial statements include all of the information required for full annual financial statements.
3. Basis of Preparation and Going Concern
The consolidated financial statements are presented in US dollars, which is the parent’s functional and presentation currency.
The accounting policies in note 6 have been applied in preparing the consolidated financial statements. These policies are based on IFRS as issued by the IASB and outstanding as of June 30, 2012.
These consolidated financial statements were prepared on a going concern basis, under the historical cost basis, which assumes the Company will continue its operations for the foreseeable future and will be able to realize its assets and discharge its liabilities and commitments in the ordinary course of business. In assessing whether the going concern assumption is appropriate, management takes into account all available information about the future, which is at least, but not limited to, twelve months from the end of the reporting period.
During the six-month period ended June 30, 2012, the Company had a significant disruption to its operations at the Phuoc Son Mine which negatively impacted the cashflows and the Company incurred a net loss of $18.3 million for the period and, as of that date, the Company’s current liabilities exceeded its current assets by $12.9 million. As a result, there is a substantial doubt regarding the ability of the Company to continue as a going concern. The Phuoc Son Mine has now resumed normal operations. The ability of the Company to continue as a going concern depends upon its ability to continue profitable operations or to continue to access public debt or equity capital in the ordinary course. No assurance can be given that such capital will be available at all or on terms acceptable to the Company.
These consolidated statements do not include any adjustments related to the carrying values and classification of assets and liabilities should the Company be unable to continue as a going concern. If the “going concern” assumption was not appropriate for these consolidated financial statements, then adjustments to the carrying values of the assets and liabilities, expenses and consolidated balance sheet classification, which could be material, may be necessary.
Change of Financial Year-End
The financial year-end of the Company was changed from December 31 to June 30 effective for the Company’s 2012 financial year. This change was made to better meet operational demands in an Asian based group. Accordingly, the Company’s transition period is the six-month period ended June 30, 2012 which means the comparative figures presented are not entirely comparable however they do comply with IFRS. Refer to note 30 for the unaudited condensed comparative consolidated financial statements for the six-month period ended June 30, 2011.
4. Significant Accounting Judgments, Estimates and Assumptions
The preparation of these consolidated financial statements for the Company and its subsidiaries (the “Group”) in conformity with IFRS requires management to make judgments, estimates and assumptions that affect the reported amounts of assets, liabilities and contingent liabilities at the date of the consolidated financial statements and reported amounts of revenues and expenses during the reporting period. Estimates and assumptions are continuously evaluated and are prepared by appropriately qualified people and based on management’s experience and other factors, including expectations of future events that are believed to be reasonable under the circumstances. However, actual outcomes can differ from these estimates.
8
In particular, information about significant areas of estimation uncertainty considered by management in preparing the consolidated financial statements is described below.
Ore reserves and resource estimates
Ore reserves are estimates of the amount of ore that can be economically and legally extracted from the Group’s mining properties. The Group estimates its ore reserves and mineral resources based on information compiled by appropriately qualified persons, relating to the geological data on the size, depth and shape of the ore body, and requires complex geological judgments to interpret the data. The estimation of recoverable reserves is based upon factors such as estimates of foreign exchange rates, commodity prices, future capital requirements, and production costs along with geological assumptions and judgments made in estimating the size and grade of the ore body. Changes in the reserve or resource estimates may impact upon the carrying value of exploration and evaluation assets, mine properties, property, plant and equipment, goodwill, provisions for asset retirements, recognition of deferred tax assets, and depreciation and amortization charges.
Derivative valuation (Note 19)
The Group measures certain derivative financial liabilities by reference to their fair values at the date of the consolidated statement of financial position. The estimation of fair value of such derivatives is based upon factors such as estimates of commodity prices and volatility, equity prices, risk-free rates and terms to maturity. Changes in such estimates may impact upon the carrying value of derivative liabilities and derivative revaluation charges.
Impairment of assets (Notes 10, 11, 12, 13)
The Group assesses each cash generating unit annually to determine whether any indication of impairment of the assets comprising the cash generating unit exists. Where an indicator of impairment exists, a formal estimate of the recoverable amount is made, which is considered to be the higher of the fair value less costs to sell and value in use. These estimates require the use of assumptions such as long-term commodity prices, discount rates, future capital requirements, political environment, exploration potential and operating performance. Fair value is determined as the amount that would be obtained from the sale of the asset in an arm’s length transaction between knowledgeable and willing parties. Fair value for mineral assets is generally determined as the present value of estimated future cash flows arising from the continued use of the asset, which includes estimates such as the cost of future expansion plans and eventual disposal, using assumptions that an independent market participant may take into account. Cash flows are discounted to their present value using a pre-tax discount rate that reflects current market assessments of the time value of money and the risks specific to the asset. Management has assessed its cash generating units as being individual ore bodies, which is the lowest level for which cash inflows are largely independent of those of other assets.
Deferred exploration expenditure (Note 11)
Exploration costs are capitalized by the Group and accumulated in respect of each identifiable area of interest. These costs are only carried forward to the extent that they are expected to be recouped through the successful development of the area of interest (or alternatively by its sale), or where activities in the area have not yet reached a stage which permits a reasonable assessment of the existence or otherwise of economically recoverable reserves, and active operations are continuing.
Production start date (Notes 10, 11, 12, 13)
The Group assesses the stage of each mine under construction to determine when a mine moves into the production stage being when the mine is substantially complete and ready for its intended use. The criteria used to assess the start date are determined based on the unique nature of each mine construction project, such as the complexity of a plant and its location. The Group considers various relevant criteria to assess when the production phase is considered to commence and all related amounts are reclassified from ‘capital assets in progress’ to ‘producing mines’ and ‘property, plant and equipment’. Some of the criteria used will include, but are not limited to, the following:
| · | level of capital expenditure incurred compared to the original construction cost estimates; |
| · | completion of a reasonable period of testing of the mine plant and equipment; |
| · | ability to produce metal in saleable form (within specifications); |
| · | ability to sustain ongoing production of metal. |
When a mine development/construction project moves into the production stage, the capitalization of certain mine development/construction costs ceases and costs are either regarded as forming part of the cost of inventory or expensed, except for costs that qualify for capitalization relating to mining asset additions or improvements, underground mine development or mineable reserve development. It is also at this point that depreciation/amortization commences.
Inventories (Note 16)
Net realizable value tests are performed monthly and represent the estimated future sales price of the product based on prevailing spot metals prices at the reporting date, less estimated costs to complete production and bring the product to sale.
Stockpiles are measured by estimating the number of tonnes added and removed from the stockpile, the number of contained gold ounces based on assay data, and the estimated recovery percentage based on the expected processing method.
9
Stockpile tonnages are verified by periodic surveys.
Asset retirement obligations (Note 18)
The provisions for asset retirement obligations are based on estimated future costs using information available at the balance date. To the extent the actual costs differ from these estimates, adjustments will be recorded and the statement of comprehensive income/(loss) may be impacted (refer to note 18).
Share-based payment transactions (Note 24)
The Group measures the cost of equity-settled transactions with employees by reference to the fair value of the equity instruments at the date at which they are granted. The fair value of options is determined by using the Black-Scholes model. The accounting estimates and assumptions relating to equity-settled share-based payments would have no impact on the carrying amounts of assets and liabilities within the next annual reporting period but may impact expenses and equity.
Contingencies (Note 27)
By their nature, contingencies will only be resolved when one or more uncertain future events occur or fail to occur. The assessment of contingencies inherently involves the exercise of significant judgment and estimates of the outcome of future events.
5. Change in Accounting Policies, New Standards and Interpretations Not Applied
The Company has reviewed new and revised accounting pronouncements that have been issued but are not yet effective and determined that the following may have an impact on the Company:
IFRS 9 Financial Instruments
IFRS 9, Financial Instruments, was issued in November 2009 and contained requirements for financial assets. This standard addresses classification and measurement of financial assets and replaces the multiple category and measurement models in IAS 39, Financial Instruments - Recognition and Measurement, for debt instruments with a new mixed measurement model having only two categories: amortized cost and fair value through profit or loss. IFRS 9 also replaces the models for measuring equity instruments, and such instruments are either recognized at fair value through profit or loss or at fair value through other comprehensive income/(loss). Where such equity instruments are measured at fair value through other comprehensive income/(loss), dividends to the extent not clearly representing a return of investment, are recognized in profit or loss; however, other gains and losses (including impairments) associated with such instruments remain in accumulated other comprehensive income/(loss) indefinitely.
Requirements for financial liabilities were added in October 2010 and they largely carried forward existing requirements in IAS 39, except that fair value changes due to credit risk for liabilities designated at fair value through profit and loss would generally be recorded in other comprehensive income/(loss).
IFRS 9 is required to be applied for accounting periods beginning on or after January 1, 2015, with earlier adoption permitted. The Company has not yet assessed the impact of the standard which would be effective as of fiscal year commencing July 1, 2015 or determined whether it will adopt the standard early.
IFRS 10 Consolidated Financial Statements
For annual periods beginning on January 1, 2013, IFRS 10, Consolidated Financial Statements will replace portions of IAS 27 Consolidated and Separate Financial Statements and interpretation SIC-12 Consolidation — Special Purpose Entities. The new standard requires consolidated financial statements to include all controlled entities under a single control model. The Company will be considered to control an investee when it is exposed, or has rights to variable returns from its involvement with the investee and has the current ability to affect those returns through its power over the investee. As required by this standard, control is reassessed as facts and circumstances change. All facts and circumstances must be considered to make a judgment about whether the Company controls another entity; there are no ‘bright lines’. Additional guidance is given on how to evaluate whether certain relationships give the Company the current ability to affect its returns, including how to consider options and convertible instruments, holding less than a majority of voting rights, how to consider protective rights, and principal-agency relationships (including removal rights), all of which may differ from current practice.
IFRS 10 is required to be applied for accounting periods beginning on or after January 1, 2013, with earlier adoption permitted. The Company has not yet assessed the impact of the standard which would be effective as of fiscal year commencing July 1, 2013 or determined whether it will adopt the standard early.
IFRS 11 Joint Arrangements
On January 1, 2013, the Company will be required to adopt IFRS 11, Joint Arrangements, which applies to accounting for interests in joint arrangements where there is joint control. The standard requires the joint arrangements to be classified as either joint operations or joint ventures. The structure of the joint arrangement would no longer be the most significant factor when classifying the joint arrangement as either a joint operation or a joint venture. In addition, the option to account for joint ventures (previously called jointly controlled entities) using proportionate consolidation will be removed and replaced by equity accounting. Due to the adoption of this new section, venturers will transition the accounting for joint ventures from the proportionate consolidation method to the equity method by aggregating the carrying values of the proportionately consolidated assets and liabilities into a single line item.
10
IFRS 11 is required to be applied for accounting periods beginning on or after January 1, 2013, with earlier adoption permitted. The Company has not yet assessed the impact of the standard which would be effective as of fiscal year commencing July 1, 2013 or determined whether it will adopt the standard early.
IFRS 12 Disclosure of Interests in Other Entities
During 2013, the Company will be required to adopt IFRS 12, Disclosure of Involvement with Other Entities, which includes disclosure requirements about subsidiaries, joint ventures, and associates, as well as unconsolidated structured entities and replaces existing disclosure requirements. Due to this new section, the Company will be required to disclose the following: judgments and assumptions made when deciding how to classify involvement with another entity, interests that non-controlling interests have in consolidated entities, and nature of the risks associated with interests in other entities.
IFRS 12 is required to be applied for accounting periods beginning on or after January 1, 2013, with earlier adoption permitted. The Company has not yet assessed the impact of the standard or determined whether it will adopt the standard early.
IFRS 13 Fair Value Measurement
During 2013, the Company will be required to adopt IFRS 13, Fair Value Measurement. The new standard will generally converge the IFRS and US GAAP requirements for how to measure fair value and the related disclosures. IFRS 13 establishes a single source of guidance for fair value measurements, when fair value is required or permitted by IFRS. Upon adoption, the Company will provide a single framework for measuring fair value while requiring enhanced disclosures when fair value is applied. In addition, fair value will be defined as the ‘exit price’ and concepts of ‘highest and best use’ and ‘valuation premise’ would be relevant only for non-financial assets and liabilities.
IFRS 13 is required to be applied for accounting periods beginning on or after January 1, 2013, with earlier adoption permitted. The Company has not yet assessed the impact of the standard or determined whether it will adopt the standard early.
IAS 27 Separate Financial Statements
During 2013, the Company will be required to adopt IAS 27, Separate Financial Statements. As a result of the issue of the new consolidation suite of standards, IAS 27 has been reissued to reflect the change as the consolidation guidance has recently been included in IFRS 10. In addition, IAS 27 will now only prescribe the accounting and disclosure requirements for investments in subsidiaries, joint ventures and associates when the Company prepares separate financial statements. The Company has not yet assessed the impact of the new accounting standard on its separate financial statements.
IAS 28 Investments in Associates and Joint Ventures
During 2013, the Company will be required to adopt IAS 28, Investments in Associates and Joint Ventures. As a consequence of the issue of IFRS 10, IFRS 11 and IFRS 12, IAS 28 has been amended and will further provide the accounting guidance for investments in associates and will set out the requirements for the application of the equity method when accounting for investments in associates and joint ventures. This standard will be applied by the Company when there is joint control, or significant influence over an investee. Significant influence is the power to participate in the financial and operating policy decisions of the investee but does not include control or joint control of those policy decisions. When determined that the Company has an interest in a joint venture, the Company will recognize an investment and will account for it using the equity method in accordance with IAS 28.
IFRS 28 is required to be applied for accounting periods beginning on or after January 1, 2013, with earlier adoption permitted. The Company has not yet assessed the impact of the standard or determined whether it will adopt the standard early.
6. Significant Accounting Policies
Basis of consolidation
The financial statements consolidate the financial statements of the Company and the Group. All intra-group balances and transactions, including unrealized profits and losses arising from intra-Group transactions, have been eliminated in full.
Foreign currency translation
The consolidated financial statements are presented in United States dollars, which is the parent company’s functional currency and the Group’s presentation currency. The financial statements of subsidiaries are maintained in their functional currencies and converted to US dollars for consolidation of the Group results. The functional currency of each entity is determined after consideration of the primary economic environment of the entity. The monetary assets and liabilities of the Company that are denominated in currencies other than the United States dollar are translated at the rate of exchange at the dates of the consolidated statements of financial position and non-monetary items are translated at historical rates. Revenues and expenses are translated at the average exchange rate for the year. Exchange gains and losses arising on translation are included in the consolidated statements of income (loss) and comprehensive income (loss).
11
Business combinations
On the acquisition of a subsidiary, the acquisition method of accounting is used, whereby the purchase consideration is allocated to the identifiable assets, liabilities and contingent liabilities (identifiable net assets) of the acquiree on the basis of fair value at the date of acquisition. Those mining rights, mineral reserves and resources that are able to be reliably valued are recognized in the assessment of fair values on acquisition. Other potential reserves, resources and mineral rights, for which, in the Directors’ opinion, values cannot be reliably determined, are not recognized. Acquisition costs are expensed.
When the cost of acquisition exceeds the fair values attributable to the Group’s share of the identifiable net assets, the difference is treated as purchased goodwill, which is not amortized but is reviewed for impairment annually or where there is an indication of impairment. If the fair value attributable to the Group’s share of the identifiable net assets exceeds the cost of acquisition, the difference is immediately recognized in the statement of comprehensive income (loss).
Non-controlling interests represent the portion of profit or loss and net assets in subsidiaries that are not held by the Group and are presented in equity in the consolidated statement of financial position, separately from the parent’s shareholders’ equity.
Mine properties
The Company’s recoverability of the recorded value of its mineral properties and associated deferred expenses is based on market conditions for minerals, underlying mineral resources associated with the properties and future costs that may be required for ultimate realization through mining operations or by sale. The Company is in an industry that is dependent on a number of factors, including environmental, legal and political risks, the existence of economically recoverable reserves and the ability of the Company and its subsidiaries to obtain necessary financing to complete the development and future profitable production or the proceeds of disposition thereof.
The Company records its interests in mineral properties and areas of geological interest at cost. All costs, comprised of cash paid and/or the assigned value of share consideration, relating to the acquisition of these interests are capitalized on the basis of specific claim blocks or areas of geological interest until the project to which they relate is placed into production, sold or where management has determined impairment. The capitalized cost of the mineral properties is tested for recoverability whenever events or changes in circumstances indicate the carrying amount may not be recoverable. An impairment loss is recognized if it is determined that the carrying amount is not recoverable and exceeds the recoverable amount. The net proceeds from the sale of a portion of a mineral project which is sold before that project reaches the production stage will be credited against the cost of the overall project. The sale of a portion of a mineral project which has reached the production stage will result in a gain or loss recorded in the consolidated statements of operations and comprehensive loss. Mineral properties are amortized on the basis of units produced in relation to the proven and probable reserves, or measured and indicated resources where the criteria to establish proven and probable reserves have not been met, available on the related project following commencement of commercial production. The recorded amount may not reflect recoverable value as this will be dependent on the development program, the nature of the mineral deposit, commodity prices, adequate funding and the ability of the Company to bring its projects into production.
Asset retirement obligations
Asset Retirement Obligations (“ARO”) occur as a result of the acquisition, development or construction and normal operation of mining property, plant and equipment, due to government controls and regulations protecting the environment and public safety on the closure and reclamation of mining properties. The recorded ARO reflects the expected cost of reclamation, taking into account the probability of particular scenarios.
The Company recognizes the fair value of an ARO as a liability, in the period of disturbance or acquisition associated with the retirement of tangible long-lived assets that result from the acquisition, construction, development, and/or normal use of the assets. The Company concurrently recognizes a corresponding increase in the carrying amount of the related long-lived asset that is depreciated over the life of that asset. The value of the ARO is estimated using the risk-adjusted expected cash flow approach discounted at a risk-free interest rate. Subsequent to the initial measurement, the ARO is adjusted to reflect the passage of time or changes in the estimated future cash flows underlying the obligation. Changes in the obligation due to the passage of time are recognized in income as an operating expense. Changes in the obligation due to changes in estimated cash flows are recognized as an adjustment of the carrying amount of the long-lived asset that is depreciated over the remaining life of the asset.
Exploration and evaluation expenditure
Exploration and evaluation expenditure relates to costs incurred on the exploration and evaluation of potential mineral reserves and resources and includes costs such as exploratory drilling and sample testing and the costs of pre-feasibility studies.
The Company defers all exploration and evaluation expenses relating to mineral projects and areas of geological interest, in which it has licenses or a joint venture operating, until the project to which they relate is placed into production, sold or where management has determined impairment. These costs will be amortized over the proven and probable reserves, or measured and indicated resources where the criteria to establish proven and probable reserves have not been met, available on the related property following commencement of production.
Purchased exploration and evaluation assets are recognized as assets at their cost of acquisition or at fair value if purchased as part of a business combination.
12
Initial reconnaissance exploration is expensed as incurred.
An impairment review is performed, either individually or at the cash-generating unit level, when there are indicators that the carrying amount of the assets may exceed their recoverable amounts. To the extent that this occurs, the excess is fully provided against, in the financial period in which this is determined. Exploration and evaluation assets are reassessed on a regular basis and these costs are carried forward provided that at least one of the conditions outlined above is met.
Deferred development costs
The Company defers all development expenses relating to mineral projects and areas of geological interest, in which it has licenses or a joint venture operating, until the project to which they relate is placed into production, sold or where management has determined impairment. These costs will be amortized over the proven and probable reserves, or measured and indicated resources where the criteria to establish proven and probable reserves have not been met, available on the related property following commencement of production.
Capital work in progress
Assets in the course of construction are capitalized in the capital work in progress account. On completion, the cost of construction is transferred to the appropriate category of property, plant and equipment.
The cost of property, plant and equipment comprises its purchase price and any costs directly attributable to bringing it into working condition for its intended use.
Costs associated with a start-up period are capitalized where the asset is available for use but incapable of operating at normal levels without a commissioning period.
Capital work in progress is not depreciated. The net carrying amounts of capital work in progress at each mine property are reviewed for impairment either individually or at the cash-generating unit level and when events and changes in circumstances indicate that these values exceed their recoverable amounts, that excess is fully provided against in the financial year in which this is determined.
Property, plant and equipment
The Company initially records buildings, plant and equipment and infrastructure at cost, being the purchase price and the directly attributable costs of acquisition or construction required to bring the asset to the location and condition necessary for the asset to be capable of operating in the manner intended by management.
Buildings, plant and equipment, and infrastructure involved in service, production and support are then amortized, net of residual value, using the straight-line method, over the estimated productive life of the asset. Where parts of an asset have different useful lives, depreciation is calculated on each separate part. Each asset or part’s estimated useful life has due regard to both its own physical life limitations and the present assessment of economically recoverable reserves of the mine property at which the item is located, and to possible future variations in those assessments. Productive lives for these assets range from 3 to 10 years, but the productive lives do not exceed the related estimated mine life based on proven and probable reserves. Estimates of remaining useful lives and residual values are reviewed annually. Changes in estimates are accounted for prospectively.
The expected useful lives are as follows:
| Buildings | 4 to 10 years | ||
| Infrastructure | 3 to 8 years | ||
| Computer hardware and software | 3 years | ||
| Plant and equipment | 3 to 10 years |
Property, plant and equipment are stated at cost less accumulated depreciation and any impairment in value.
The net carrying amounts of property, plant and equipment are reviewed for impairment either individually or at the cash generating unit level when events and changes in circumstances indicate that the carrying amounts may not be recoverable. To the extent that these values exceed their recoverable amounts, that excess is fully provided against in the financial period in which this is determined.
Expenditure on major maintenance or repairs includes the cost of the replacement of parts of assets and overhaul costs. Where an asset or part of an asset is replaced and it is probable that future economic benefits associated with the item will be available to the Group, the expenditure is capitalized and the carrying amount of the item replaced derecognized. Similarly, overhaul costs associated with major maintenance are capitalized and depreciated over their useful lives where it is probable that future economic benefits will be available and any remaining carrying amounts of the cost of previous overhauls are derecognized. All other costs are expensed as incurred.
Where an item of property, plant and equipment is disposed of, it is derecognized and the difference between its carrying value and net sales proceeds is disclosed as a profit or loss on disposal in the statement of income (loss) and comprehensive income (loss).
13
Any items of property, plant or equipment that cease to have future economic benefits are derecognized with any gain or loss included in the statement of income (loss) and comprehensive income (loss) in the financial year in which the item is derecognized.
Leasing commitments
The determination of whether an arrangement is or contains a lease is based on the substance of the arrangement at the inception date, including whether the fulfillment of the arrangement is dependent on the use of a specific asset or assets or whether the arrangement conveys a right to use the asset. A reassessment after inception is only made in specific circumstances.
Assets held under finance leases, where substantially all the risks and rewards of ownership of the asset have passed to the Group, and hire purchase contracts, are capitalized in the consolidated statement of financial position at the lower of the fair value of the leased property and the present value of the minimum lease payments during the lease term calculated using the interest rate implicit in the lease agreement. These amounts are determined at the inception of the lease and are depreciated over the shorter of their estimated useful lives or lease term. The capital elements of future obligations under leases and hire purchase contracts are included as liabilities in the consolidated statement of financial position. The interest elements of the lease or hire purchase obligations are charged to the statement of comprehensive income/(loss) over the periods of the leases and hire purchase contracts and represent a constant proportion of the balance of capital repayments outstanding.
Leases where substantially all the risks and rewards of ownership have not passed to the Group are classified as operating leases. Rentals payable under operating leases are charged to the statement of comprehensive income/(loss) on a straight-line basis over the lease term.
Impairment of assets
At least annually, the Company reviews and evaluates the carrying value of its non-current assets for impairment. They are also reviewed for impairment when events or changes in circumstances, such as a decrease in commodity (gold) prices, increase in costs of capital, the achievement of lower than expected resource quantities and grades or the expiration and non-renewal of a key exploration or mining license, indicate that the carrying amounts of related assets or groups of assets might not be recoverable. Such reviews are undertaken on an asset-by-asset basis, except where assets do not generate cash inflows independent of other assets, in which case the review is undertaken at the cash-generating unit level. Where a cash-generating unit, or group of cash-generating units, has goodwill allocated to it, or includes intangible assets that are either not available for use or that have an indefinite useful life (and which can only be tested as part of a cash-generating unit), an impairment test is performed at least annually or whenever there is an indication that the carrying amounts of such assets may be impaired.
If the carrying amount of an asset exceeds its recoverable amount, defined as the higher of the asset’s value-in-use and its fair value less costs to sell, an impairment loss is recorded in the statement of comprehensive income/(loss) to reflect the asset at the lower amount. In assessing the value-in-use, the relevant future cash flows expected to arise from the continuing use of such assets and from their disposal are discounted to their present value using a market-determined pre-tax discount rate that reflects current market assessments of the time value of money and asset-specific risks for which the cash flow estimates have not been adjusted. Fair value less costs to sell is determined as the amount that would be obtained from the sale of the asset in an arm’s-length transaction between knowledgeable and willing parties. For mining assets this would generally be determined based on the present value of the estimated future cash flows arising from the continued use and eventual disposal of the asset. In assessing these cash flows and discounting them to present value, assumptions used are those that an independent market participant would consider appropriate.
An impairment loss is reversed in the statement of comprehensive income/(loss) if there is a change in the estimates used to determine the recoverable amount since the prior impairment loss was recognized. The carrying amount is increased to the recoverable amount, but not beyond the carrying amount, net of depreciation or amortization that would have arisen if the prior impairment loss had not been recognized. After such a reversal the depreciation charge is adjusted in future periods to allocate the asset’s revised carrying amount, less any residual value, on a systematic basis over its remaining useful life.
Stripping costs
Stripping costs incurred during the production phase of a mine are accounted for as variable production costs that are included in the costs of the inventory produced during the period that the stripping costs are incurred.
Inventory
Inventory is comprised of ore in stockpiles, operating supplies, gold in circuit, doré bars and gold bullion. Inventory is recorded at the average cost, determined from the weighted average of the cost of similar items at the beginning of a month and the cost of similar items added during the month. Gold bullion, doré bars and gold in circuit inventory cost includes the laid-down cost of raw materials plus direct labor and an allocation of applicable overhead costs. Gold in circuit inventory represents gold in the processing circuit that has not completed the production process, and is not yet in a saleable form.
Ore in stockpiles is measured by estimating the number of tonnes added and removed from the stockpile, the number of contained ounces (based on assay data) and estimated metallurgical recovery rates (based on the expected processing method). Costs are allocated to a stockpile based on relative values of material stockpiled and processed using current mining costs incurred up to the point of stockpiling the ore, including applicable overheads, depreciation, depletion and amortization relating to mining operations, and removed at the stockpiles average cost per recoverable unit.
14
The Company values finished goods (gold bullion and doré bars), ore in stockpiles, and gold in circuit at the lower of cost or net realizable value.
Operating supplies are valued at the lower of cost or net realizable value. Any provision for obsolescence is determined by reference to specific items of stock. A regular review is undertaken to determine the extent of any provision for obsolescence.
Cash and cash equivalents
Cash and cash equivalents in the statement of financial position comprise cash at banks and on hand and short-term deposits with an original maturity of three months or less. The Company does not have any overdraft facilities with any bank.
Borrowing costs
Borrowing costs are considered an element of the historical cost of an asset when a period of time is necessary to prepare it for its intended use. The Company capitalizes borrowing costs to assets under development or construction while development or construction activities are in progress. Capitalizing borrowing costs ceases when construction of the asset is substantially complete and it is ready for its intended use.
Borrowing costs related to the establishment of a loan facility are capitalized and amortized over the life of the facility. Other borrowing costs are recognized as an expense in the financial period in which it is incurred.
Financial instruments
Financial instruments are measured at fair value on initial recognition of the instrument. Measurement in subsequent periods depends on whether the financial instrument has been classified as held-for-trading, available-for-sale, held-to-maturity, loans and receivables, or other financial liabilities. The Group determines the classification of its financial assets at initial recognition.
All financial liabilities are initially recognized at their fair value. Subsequently, all financial liabilities with the exception of derivatives are carried at amortized cost.
The Group considers whether a contract contains an embedded derivative when the Group becomes a party to the contract. Embedded derivatives are separated from the host contract if it is not measured at fair value through profit and loss and when the economic characteristics and risks are not closely related to the host contract.
Loans and receivables
Loans and receivables are non-derivative financial assets with fixed or determinable payments that are not quoted in an active market. After initial measurement, such financial assets are subsequently measured at amortized cost using the effective interest rate method (“EIR”), less impairment. Amortized cost is calculated by taking into account any discount or premium on acquisition and fees or costs that are an integral part of the EIR. The EIR amortization is included in finance income in the statement of comprehensive income/(loss). The losses arising from impairment are recognized as finance costs in the statement of comprehensive income/(loss).
Fair values
The fair value of quoted financial assets is determined by reference to bid prices at the close of business on the date of the consolidated statement of financial position. Where there is no active market, fair value is determined using valuation techniques. These include recent arm’s-length market transactions; reference to current market values of other instrument which are substantially the same; discounted cash flow analyses; and pricing models.
Derivative financial instruments are valued using applicable valuation techniques such as those outlined above.
De-recognition of financial assets and liabilities
Financial assets
A financial asset is de-recognized when:
| · | the rights to receive cash flows from the asset have expired; |
| · | the Group retains the right to receive cash flows from the asset, but has assumed an obligation to pay them in full without material delay to a third party under a ‘pass-through’ arrangement; or |
| · | the Group has transferred its rights to receive cash flows from the asset and either has transferred substantially all the risks and rewards of the asset, or has neither transferred nor retained substantially all the risks and rewards of the asset, but has transferred control of the asset. |
Where the Group has transferred its right to receive cash flows from an asset and has neither transferred nor retained substantially all the risks and rewards of the asset nor transferred control of the asset, it continues to recognize the financial asset to the extent of its continuing involvement in the asset.
15
Financial liabilities
A financial liability is de-recognized when the obligation under the liability is discharged or cancelled or expires.
Gains and losses on de-recognition are recognized within finance income and finance costs respectively.
Where an existing financial liability is replaced by another from the same lender on substantially different terms, or the terms of an existing liability are substantially modified, such an exchange or modification is treated as a de-recognition of the original liability and the recognition of a new liability, and the difference in the respective carrying amounts is recognized in the statement of comprehensive income/(loss).
Impairment of financial assets
The Group assesses at each date of the consolidated statement of financial position whether a financial asset is impaired.
Financial assets carried at amortized costs
If there is objective evidence that an impairment loss on loans and receivables and held-to-maturity investments carried at amortized cost has been incurred, the amount of the loss is measured as the difference between the asset’s carrying amount and the present value of estimated future cash flows (excluding future credit losses that have been incurred) discounted at the financial asset’s original effective interest rate (i.e. the effective interest rate computed at initial recognition). The carrying amount of the asset is reduced and the amount of the loss is recognized in the statement of comprehensive income/(loss). Objective evidence of impairment of loans and receivables exists if the counter-party is experiencing significant financial difficulty, there is a breach of contract, concessions are granted to the counter-party that would not normally be granted, or it is probable that the counter-party will enter into bankruptcy or a financial reorganization.
If, in a subsequent period, the amount of the impairment loss decreases and the decrease can be related objectively to an event occurring after the impairment was recognized, the previously recognized impairment loss is reversed. Any subsequent reversal of an impairment loss is recognized in the statement of comprehensive income/(loss), to the extent that the carrying value of the asset does not exceed its amortized cost as at the reversal date.
Assets carried at cost
If there is objective evidence of an impairment loss on an unquoted equity instrument that is not carried at fair value (because its fair value cannot be reliably measured), the amount of the loss is measured as the difference between the asset’s carrying amount and the present value of estimated future cash flows discounted at the current market rate of return for a similar financial asset.
Interest bearing loans and borrowings
Loans are recognized at inception at the fair value of proceeds received, net of directly attributable transaction costs. Subsequently they are measured at amortized cost using the effective interest method. Finance costs are recognized in the statement of comprehensive income/(loss) using the effective interest method.
Convertible notes
The components of the convertible note that exhibit characteristics of a liability are initially recognized at fair value as a liability in the consolidated statement of financial position, net of transaction costs and are subsequently accounted for at amortized cost. The derivative liability components (warrants and conversion features) are fair valued using a binomial option pricing model. The carrying amount of the warrant and conversion features are re-measured at each reporting date and any movement in value is reflected in the statement of comprehensive income (loss).
The remainder of the proceeds is allocated to the convertible note debt that is recognized and included in term liabilities, net of broker transaction costs. Interest on the liability component of the convertible note is recognized as an expense in the statement of comprehensive income/(loss).
Transaction costs are apportioned between the components of the convertible note based on the allocation of proceeds to such components when the instrument is first recognized.
Gold Loan Notes
The equity components (attached warrants) are valued using the Black Scholes option pricing model after taking account of relevant inputs.
The remainder of the proceeds is allocated to the gold note debt that is recognized and included in term liabilities, net of an allocated portion of broker transaction costs, and is accreted to face value over the life of the debt on an effective yield basis.
Interest on the liability component of the gold note is recognized as an expense in the statement of comprehensive income/(loss).
Transaction costs are apportioned between the liability, equity and derivative components of the gold note based on the allocation of proceeds to the liability, equity and derivative components when the instrument is first recognized.
Derivative financial instruments
The Group has embedded derivative instruments in its debt finance on the Convertible Note and the Gold Loan Notes.
16
The components of the gold note that exhibit characteristics of a derivative, being those that fluctuate in accordance with gold price movements, are recognized at fair value as a derivative liability at the date of issue. The derivative liability is re-valued at each reporting date with the corresponding unrealized movement in value being reflected in the statement of comprehensive income/(loss).
The convertible notes are denominated in Canadian dollars and US dollars and the associated warrants are denominated in Canadian dollars. The functional reporting currency of the Company is US dollars. As the exercise price of the stock underlying the warrants and conversion feature is not denominated in the Company’s functional currency the contractual obligations arising from the warrants and conversion feature do not meet the definition of equity instruments and are considered derivative liabilities. The warrants are recorded as financial liabilities and are re-valued at each reporting date with any change in valuation being recognized in the statement of comprehensive income/(loss).
Employee entitlements
Provisions are recognized for short-term employee entitlements, on an undiscounted basis, for services rendered by employees that remain unpaid at the date of the statement of financial position.
Other provisions
Provisions are recognized when the Group has a present obligation (legal or constructive), as a result of past events, and it is probable that an outflow of resources that can be reliably estimated will be required to settle the obligation. Where the effect is material, the provision is discounted to net present value using an appropriate current market-based pre-tax discount rate and the unwinding of the discount is included in finance costs in the statement of comprehensive income/(loss).
Taxation
Current tax
Current tax for each taxable entity in the Group is based on the local taxable income at the local statutory tax rate enacted or substantively enacted at the date of the consolidated statement of financial position and includes adjustments to tax payable or recoverable in respect of previous periods.
Deferred tax
Deferred tax is recognized using the “balance sheet” method in respect of all temporary differences between the tax bases of assets and liabilities, and their carrying amounts for financial reporting purposes, except as indicated below:
Deferred income tax liabilities are recognized for all taxable temporary differences, except:
| · | where the deferred income tax liability arises from the initial recognition of goodwill, or the initial recognition of an asset or liability in a transaction that is not a business combination and, at the time of the transaction, affects neither the accounting profit nor taxable profit or loss: and |
| · | in respect of taxable temporary differences associated with investments in subsidiaries, associates and interests in joint ventures, where the timing of the reversal of the temporary differences can be controlled and it is probable that the temporary differences will not reverse in the foreseeable future. |
Deferred income tax assets are recognized for all deductible temporary differences, carry-forward of unused tax assets and unused tax losses, to the extent that it is probable that taxable profit will be available against which the deductible temporary differences and the carry-forward of unused tax assets and unused tax losses can be utilized, except:
| · | where the deferred income tax asset relating to the deductible temporary difference arises from the initial recognition of an asset or liability in a transaction that is not a business combination and, at the time of the transaction, affects neither the accounting profit nor taxable profit or loss; and |
| · | in respect of deductible temporary differences associated with investments in subsidiaries, associates and interests in joint ventures, deferred tax assets are recognized only to the extent that it is probable that the temporary differences will reverse in the foreseeable future and taxable profit will be available against which the temporary differences can be utilized. |
The carrying amount of deferred income tax assets is reviewed at each date of the consolidated statement of financial position and reduced to the extent that it is no longer probable that sufficient taxable profit will be available to allow all or part of the deferred income tax asset to be utilized. To the extent that an asset not previously recognized fulfils the criteria for recognition, a deferred income tax asset is recorded.
Deferred tax is measured on an undiscounted basis at the tax rates that are expected to apply in the periods in which the asset is realized or the liability is settled, based on tax rates and tax laws enacted or substantively enacted at the date of the consolidated statement of financial position.
Mining taxes and royalties are treated and disclosed as current and deferred taxes if they have the characteristics of an income tax.
Ordinary share capital
Ordinary shares issued by the Company are recorded at the net proceeds received, which is the fair value of the consideration received less costs that are incurred in connection with the share issue.
17
Stock-based cash settled transactions
The transactions involving the issuance of vested and vesting warrants associated with the 2010 convertible note issue and the warrants to the agent under the offering are measured initially at fair value at the grant date using a binomial model, taking into account the terms and conditions upon which the instruments were granted. The contractual life of each warrant is four years.
Stock-based compensation
The Group makes share-based awards to certain directors, officers, employees and consultants.
Equity-settled awards
For equity-settled awards, the fair value is charged to the statement of comprehensive income/(loss) and credited to equity, on a straight-line basis over the vesting period, after adjusting for the estimated number of awards that are expected to vest (taking into account the achievement of non-market-based performance conditions). The fair value of the equity-settled awards is determined at the date of the grant. In calculating fair value, no account is taken of any vesting conditions, other than conditions linked to the price of the shares of the Company (market conditions). The fair value is determined using a Black Scholes option pricing model. At each date of the consolidated statement of financial position prior to vesting, the cumulative expense representing the extent to which the vesting period has expired and management’s best estimate of the awards that are ultimately expected to vest is computed (after adjusting for non-market performance conditions). The movement in cumulative expense is recognized in the statement of comprehensive income (loss) with a corresponding entry within equity.
No expense is recognized for awards that do not ultimately vest, except for awards where vesting is conditional upon a market condition, which are treated as vesting irrespective of whether or not the market condition is satisfied, provided that all other performance conditions are satisfied.
Where the terms of an equity-settled award are modified, as a minimum an expense is recognized as if the terms had not been modified over the original vesting period. In addition, an expense is recognized for any modification that increases the total fair value of the share-based payment arrangement, or is otherwise beneficial to the employee as measured at the date of modification, over the remainder of the new vesting period.
Where an equity-settled award is cancelled, it is treated as if it had vested on the date of cancellation, and any expense not yet recognized for the award is recognized immediately. Any compensation paid up to the fair value of the award at the cancellation or settlement date is deducted from equity, with any excess over fair value being treated as an expense in the statement of comprehensive income/(loss). However, if a new award is substituted for the cancelled award, and designated as a replacement award on the date that it is granted, the new award is treated as if it is a modification of the original award, as described in the previous paragraph.
Cash-settled awards
For cash-settled awards, the fair value is recalculated at each balance date until the awards are settled based on the estimated number of awards that are expected to vest, adjusting for market and non-market based performance conditions. During the vesting period, a liability is recognized representing the portion of the vesting period that has expired at the date of the consolidated statement of financial position multiplied by the fair value of the awards at that date. After vesting, the full fair value of the unsettled awards at each balance date is recognized as a liability. Movements in the liability are recognized in the statement of comprehensive income (loss).
Revenue recognition
Revenue is recognized to the extent it is probable that the economic benefits will flow to the Group and the revenue can be reliably measured. Revenue is measured at the fair value of the consideration received. Sales, export taxes or duty are recorded as part of cost of sales.
Revenue from the sale of gold and by-products, such as silver, are recognized when: (i) the significant risks and rewards of ownership have been transferred; (ii) reasonable assurance exists regarding the measurement of the consideration that will be derived from the sales of goods, and the extent to which goods may be returned; and (iii) ultimate collection is reasonably assured. The risks and rewards of ownership for the gold and silver reside with the Company until the point that gold and silver are confirmed as sold to the end consumer. Gold is sold on the spot market in US dollars whereas silver is sold at the silver fixing price of the London Bullion Market in US dollars.
Refining and transport charges are classified as part of cost of sales and revenues from by-products are netted against cost of sales.
18
7. Segment Analysis
For management purposes, the group is organized into one business segment and has two reportable segments based on geographic area as follows:
| · | The Company’s Vietnamese operations produce ore in stockpiles, gold in circuit, doré bars and gold bullion through its Bong Mieu and Phuoc Son subsidiaries. |
| · | The Company’s Malaysian operations are engaged in the exploration for, and evaluation of, gold properties within the country. |
Management monitors the operating results of its reportable segments separately for the purpose of making decisions about resource allocation and performance assessment. Segment performance is evaluated based on operating profit or loss, as well as mine development, and is measured consistently with operating profit or loss in the consolidated financial statements. However, group financing (including finance costs and finance income) and income taxes are managed on a group basis and are not allocated to operating segments.
All revenues are transacted via one merchant on behalf of external customers unknown to the Company.
19
| 7. | Segment Analysis (continued) |
| US$ | Property, plant and equipment | Deferred exploration expenditure | Deferred development expenditure | Mine properties | Other non-current assets | Total non-current assets | Current assets | Liabilities | ||||||||||||||||||||||||
| At June 30, 2012 | ||||||||||||||||||||||||||||||||
| Vietnam | 32,461,421 | 10,764,709 | 10,636,534 | 5,338,877 | 147,247 | 59,348,788 | 16,122,295 | 18,374,461 | ||||||||||||||||||||||||
| Malaysia | 139,248 | 10,663,853 | - | 31,276,437 | 42,079,538 | 131,511 | 7,129,422 | |||||||||||||||||||||||||
| Other | 226,265 | - | 550,000 | - | 776,265 | 2,658,752 | 45,051,205 | |||||||||||||||||||||||||
| Total | 32,826,934 | 21,428,562 | 10,636,534 | 37,165,314 | 147,247 | 102,204,591 | 18,912,558 | 70,555,088 | ||||||||||||||||||||||||
| At December 31, 2011 | ||||||||||||||||||||||||||||||||
| Vietnam | 36,680,791 | 11,990,153 | 20,276,490 | 6,070,128 | 943,747 | 75,961,309 | 25,885,982 | 16,337,040 | ||||||||||||||||||||||||
| Malaysia | 99,954 | 7,526,402 | - | 31,276,437 | 38,902,793 | 226,969 | 6,857,473 | |||||||||||||||||||||||||
| Other | 157,370 | - | 550,000 | - | 707,370 | 3,567,751 | 50,532,867 | |||||||||||||||||||||||||
| Total | 36,938,115 | 19,516,555 | 20,276,490 | 37,896,565 | 943,747 | 115,571,472 | 29,680,702 | 73,727,380 | ||||||||||||||||||||||||
| At December 31, 2010 | ||||||||||||||||||||||||||||||||
| Vietnam | 30,528,865 | 11,354,600 | 18,103,857 | 7,371,342 | 1,361,327 | 68,719,991 | 16,994,721 | 9,125,471 | ||||||||||||||||||||||||
| Malaysia | 51,484 | 2,267,175 | - | 31,276,437 | - | 33,595,096 | 185,331 | 6,619,248 | ||||||||||||||||||||||||
| Other | 69,328 | - | - | 550,000 | - | 619,328 | 3,077,938 | 42,220,092 | ||||||||||||||||||||||||
| Total | 30,649,677 | 13,621,775 | 18,103,857 | 39,197,779 | 1,361,327 | 102,934,415 | 20,257,990 | 57,964,811 | ||||||||||||||||||||||||
For the six-month period ended June 30, 2012 | For the year ended December 31, 2011 | For the year ended December 31, 2010 | ||||||||||||||||||||||
| US$ | Revenue | Income/(loss) and comprehensive income/(loss) | Revenue | Income/(loss) and comprehensive income/(loss) | Revenue | Income/(loss) and comprehensive income/(loss) | ||||||||||||||||||
| Vietnam | 34,552,265 | (11,941,899 | ) | 47,976,630 | 3,129,813 | 35,986,013 | 6,801,605 | |||||||||||||||||
| Malaysia | - | 145,883 | - | (563,049 | ) | - | 16,137 | |||||||||||||||||
| Other | - | (6,530,875 | ) | - | (921,866 | ) | - | (19,590,814 | ) | |||||||||||||||
| Total | 34,552,265 | (18,326,891 | ) | 47,976,630 | 1,644,898 | 35,986,013 | (12,773,072 | ) | ||||||||||||||||
Intra-segment transactions are eliminated in the above table.
20
8. Earnings Per Share
6 months ended June 30, 2012 | 12 months ended December 31, 2011 | 12 months ended December 31, 2010 | ||||||||||
| Basic Earnings per Share Attributable to Equity Owners | ||||||||||||
| Earnings (loss) for the period (US$) | (15,320,128 | ) | 1,084, 649 | (13,882,384 | ) | |||||||
| Weighted average number of common shares outstanding | 379,450,910 | 377,193,706 | 329,747,069 | |||||||||
| Basic earnings (loss) per share (US$) | (0.040 | ) | 0.003 | (0.042 | ) | |||||||
| Diluted Earnings per Share Attributable to Equity Owners | ||||||||||||
| Net earnings (loss) used to calculate diluted earnings per share (US$) | (15,320,128 | ) | 1,084,649 | (13,882,384 | ) | |||||||
| Weighted average number of common shares outstanding | 379,450,910 | 377,193,706 | 329,747,069 | |||||||||
| Dilutive effect of stock options outstanding and convertible notes (US$) | 321,519 | 967,077 | N/A | |||||||||
| Weighted average number of common shares outstanding used to calculate diluted earnings per share | 379,772,429 | 378,160,783 | 329,747,069 | |||||||||
| Diluted earnings (loss) per share (US$) | (0.040 | ) | 0.003 | (0.042 | ) | |||||||
Basic earnings per share is calculated by dividing the net profit (loss) for the period attributable to the equity owners of the Parent Company by the weighted average number of common shares outstanding for the period.
Diluted earnings per share is based on basic earnings (loss) per share adjusted for the potential dilution if share options and warrants are exercised and the convertible notes are converted into common shares.
9. Business Combinations
The Group did not make any business combinations during the six-month period ended June 30, 2012.
Prior year business combinations
Amalgamation with Zedex
The Company has accounted for the amalgamation between the Company via Olympus Pacific Minerals Labuan Limited (previously named Olympus Pacific Minerals NZ), a wholly owned subsidiary of the Company, and registered in Malaysia (previously registered in New Zealand), and Zedex Minerals Limited (“Zedex”), also registered in New Zealand, as an acquisition with the Company being identified as the acquiror, and recorded it as a business combination.
Under the terms of the transaction the two companies amalgamated and management of the Company took control of the assets and liabilities of Zedex from January 12, 2010. Total consideration for the amalgamation amounted to US$15,206,478 and was paid to Zedex shareholders by way of redistribution of the 65,551,043 Olympus shares that Zedex already held along with the issuance of a further 54,226,405 new Olympus shares. In addition, stock options were issued in Olympus to compensate for the cancellation of Zedex options. The fair value of this exchange of options was determined using a Black-Scholes calculation to equal $446,701, which is included in the total consideration of $15,206,478. Further as a result of the exchange of Zedex options for Olympus options an additional amount of $66,591 has been immediately expensed in stock-based compensation expense.
Zedex had the right under an agreement it acquired in January 2006 to a 2 percent gross production royalty on Bong Mieu sales, less incremental costs. Under the agreement, Ivanhoe Mines Limited assigned to Zedex all its rights, title to and interest in the debt, gross production royalties and royalty agreement. The royalty was calculated as 2 percent of the net sales amount equal to the revenues for gold and silver less refining and delivery costs. The amalgamation results in this royalty agreement being dissolved releasing Olympus from any future obligation in this regard.
All costs associated with the amalgamation have been expensed when incurred, these being recorded in corporate and administrative expenses in the statement of comprehensive income/(loss).
The purchase consideration was settled by way of share issue. The shares were not issued until January 25, 2010.
The purchase consideration was allocated as follows:
21
| Current assets | US$ | |||
| Cash | 45,643 | |||
| Account receivables and prepaid expenses | 158,997 | |||
| Non-current assets | ||||
| Property, plant and equipment | 86,759 | |||
| Mine properties | 33,159,770 | |||
| Current liabilities | ||||
| Accounts payable and accrued liabilities | (1,626,168 | ) | ||
| Non-current liabilities | ||||
| Deferred tax liability | (6,707,733 | ) | ||
| 25,117,268 | ||||
| Other elements of consideration | ||||
| Amount attributable to non-controlling interests | (9,910,790 | ) | ||
| Total consideration | 15,206,478 | |||
Bau Gold Project - Increase in investment in North Borneo Gold
On September 30, 2010, the Company entered into an agreement, as amended on May 20, 2011 and January 20, 2012, to acquire up to a 93.55% interest in North Borneo Gold Sdn Bhd by January 2014, subject to payments to be made in several tranches.
The Company has accounted for the increased interest in North Borneo Gold Sdn Bhd as an equity transaction and has recorded in other reserves the premium paid on the purchase on a pro rata basis of the fair value of the non-controlling interest initially recognized on acquisition.
The transactions can be summarized as follows:
| Purchase Price | Purchase Date | North Borneo Gold Sdn Bhd Class A Shares | Company’s Effective Holding | ||||||||||
| Tranche 1 | $ | 7,500,000 | 9/30/2010 | 31,250 | 62.55 | % | |||||||
| Tranche 2 | $ | 7,500,000 | 10/30/2010 | 31,250 | 75.05 | % | |||||||
| Tranche 3a | $ | 6,000,000 | 5/20/2011 | 13,700 | 80.53 | % | |||||||
| Tranche 3b | $ | 3,000,000 | 1/20/2012 | 6,800 | 83.25 | % | |||||||
| Tranche 3c | $ | 2,000,000 | 1/28/2013 | 4,500 | 85.05 | % | |||||||
| Tranche 4a | $ | 3,000,000 | 9/13/2013 | 7,000 | 87.85 | % | |||||||
| Tranche 4b | $ | 6,000,000 | 1/21/2014 | 14,250 | 93.55 | % | |||||||
| Total | 108,750 | 93.55 | % | ||||||||||
The agreement includes a condition subsequent that must be met before the Tranche 3c payment is required to be settled. The condition subsequent requires the vendor to obtain:
| (a) | all renewals or grants (as applicable) of mining licenses and mining certificates relating to the Jugan Hill deposit (including, without limitation, the renewal of mining certificate MD 1D/1/1987 relating to the Jugan Hill, Sirenggok and Jambusan areas) on terms acceptable to the Purchaser in all respects; and |
| (b) | all ministerial, Governor and other regulatory approvals to ensure that the mining licenses and certificates referred to at (a) above are valid and effective in all respects in accordance with applicable laws and regulations |
Conditions to be met before settlement of each tranche are as follows:
| Tranche 1: | Has no conditions. |
| Tranche 2: | Amendment of the Joint Venture agreement to deal with a number of operational and governance matters. This condition was met on October 30, 2010 and settlement of Tranche 2 occurred on that date. |
| Tranche 3: | If the condition subsequent noted above has been met by January 1, 2013 settlement of the Tranche 3c payment occurs. If the condition subsequent has not been met then the shares transfer to the purchaser at no additional cost. |
On completion of Tranche 3c the right of the vendor to appoint a director to the board of North Borneo Gold Sdn Bhd ceases.
| Tranche 4: | Has no conditions. |
22
Capcapo Gold Property
The Company entered a formal joint venture agreement on September 30, 2011 with Abra Mining & Industrial Corporation (“AMIC”), Jabel Corporation (“Jabel”), Kadabra Mining Corporation (a wholly-owned subsidiary of the Company) (“KMC”) and PhilEarth Mining Corporation (“PhilEarth”) (a Philippine company in the process of incorporation in which the Company will hold a 40 percent interest) in respect of the Capcapo Gold Property in the Northern Philippines.
Pursuant to the terms of the joint venture agreement, the Company, in consortium with PhilEarch, has an option to acquire up to a 60 percent interest in the Capcapo Gold Project, Northern Philippines, subject to compliance with Philippine foreign ownership laws. Olympus paid to AMIC US$300,000 upon the signing of the joint venture agreement, is required to pay a further US$400,000 upon gaining unencumbered access to the property and may fully exercise its option over three stages of expenditure as follows:
| Stage | Expected Expenditures | Payment Due Upon Completion of The Stage | ||||||
| Stage 1 | 1,000,000 | 400,000 | ||||||
| Stage 2 | 2,000,000 | 400,000 | ||||||
| Stage 3 | 4,000,000 | n/a | ||||||
In addition, Jabel will be paid a royalty based on the calculation that yields the highest payment; either 3 percent of the gross value of production from the Capcapo Gold Project or 6 percent of the annual profit of the joint venture corporation.
Finally, Olympus is also obligated to make milestone payments each time a specified milestone is achieved in respect of the property. The specified milestone occurs at the earlier of defining a cumulative mineral reserve of 2,000,000 ounces of gold and gold equivalents for the property, or upon achievement of a consistent production rate of 2,000 tonnes per day. Accordingly, achieving one milestone does not trigger the obligation to make a subsequent milestone payment if the alternative milestone has been achieved. The milestone payment to AMIC consists of a US$2,000,000 payment and the issuance of 2,000,000 common shares of the Company or common shares having a market value of US$5,000,000, whichever is of lesser value.
23
10. Property, Plant and Equipment
| At June 30, 2012 | ||||||||||||||||||||
| US$ | Land & buildings | Plant & equipment | Infrastructure | Capital assets in progress | Total | |||||||||||||||
| At January 1 , 2012, net of accumulated depreciation | 1,899,978 | 19,064,092 | 15,198,968 | 775,077 | 36,938,115 | |||||||||||||||
| Additions | 79,463 | 2,308,784 | 210,983 | 512,645 | 3,111,875 | |||||||||||||||
| Disposals | - | (6,348 | ) | - | - | (6,348 | ) | |||||||||||||
| Reclassifications | 38,782 | 38,462 | 377,405 | (454,649 | ) | - | ||||||||||||||
| Impairment charge | (88,000 | ) | (1,718,000 | ) | (547,000 | ) | (115,000 | ) | (2,468,000 | ) | ||||||||||
| Depreciation | (237,376 | ) | (2,620,023 | ) | (1,890,267 | ) | - | (4,747,666 | ) | |||||||||||
| Translation adjustments | - | (1,042 | ) | - | - | (1,042 | ) | |||||||||||||
| At June 30, 2012, net of accumulated depreciation | 1,692,847 | 17,065,925 | 13,350,089 | 718,073 | 32,826,934 | |||||||||||||||
| At June 30, 2012: Cost | 3,221,462 | 32,527,232 | 20,925,447 | 833,073 | 57,507,214 | |||||||||||||||
| Accumulated depreciation | 1,440,615 | 13,743,307 | 7,028,358 | - | 22,212,280 | |||||||||||||||
| Impairment charge | 88,000 | 1,718,000 | 547,000 | 115,000 | 2,468,000 | |||||||||||||||
| Net carrying amount | 1,692,847 | 17,065,925 | 13,350,089 | 718,073 | 32,826,934 | |||||||||||||||
| At December 31, 2011 | ||||||||||||||||||||
| US$ | Land & buildings | Plant & equipment | Infrastructure | Capital assets in progress | Total | |||||||||||||||
| At January 1, 2011 net, of accumulated depreciation | 184,755 | 6,896,788 | 1,830,155 | 21,737,979 | 30,649,677 | |||||||||||||||
| Additions | 147,336 | 3,032,208 | 9,545,693 | 744,745 | 13,469,982 | |||||||||||||||
| Disposals | - | (252,703 | ) | - | - | (252,703 | ) | |||||||||||||
| Reclassifications | 1,852,126 | 13,796,964 | 6,058,557 | (21,707,647 | ) | - | ||||||||||||||
| Depreciation | (284,239 | ) | (4,372,794 | ) | (2,235,437 | ) | - | (6,892,470 | ) | |||||||||||
| Translation adjustments | - | (36,371 | ) | - | - | (36,371 | ) | |||||||||||||
| At December 31, 2011, net of accumulated depreciation | 1,899,978 | 19,064,092 | 15,198,968 | 775,077 | 36,938,115 | |||||||||||||||
| At December 31, 2011: Cost | 3,103,216 | 30,403,504 | 20,337,058 | 775,077 | 54,618,855 | |||||||||||||||
| Accumulated depreciation | 1,203,238 | 11,339,412 | 5,138,090 | - | 17,680,740 | |||||||||||||||
| Net carrying amount | 1,899,978 | 19,064,092 | 15,198,968 | 775,077 | 36,938,115 | |||||||||||||||
| At December 31, 2010 | ||||||||||||||||||||
| US$ | Land & buildings | Plant & equipment | Infrastructure | Capital assets in progress | Total | |||||||||||||||
| At January 1, 2010 net, of accumulated depreciation | 331,492 | 5,508,753 | 2,590,631 | 999,862 | 9,430,738 | |||||||||||||||
| Additions | 28,508 | 3,357,973 | 32,294 | 21,517,083 | 24,935,858 | |||||||||||||||
| Disposals | - | (15,606 | ) | - | - | (15,606 | ) | |||||||||||||
| Reclassifications | 33,310 | 467,566 | 278,090 | (778,966 | ) | - | ||||||||||||||
| Depreciation | (208,555 | ) | (2,424,655 | ) | (1,070,860 | ) | - | (3,704,070 | ) | |||||||||||
| Translation adjustments | - | 2,757 | - | - | 2,757 | |||||||||||||||
| At December 31, 2010, net of accumulated depreciation | 184,755 | 6,896,788 | 1,830,155 | 21,737,979 | 30,649,677 | |||||||||||||||
| At December 31, 2010: Cost | 1,102,815 | 14,236,823 | 4,732,912 | 21,737,979 | 41,810,529 | |||||||||||||||
| Accumulated depreciation | 918,060 | 7,340,035 | 2,902,757 | - | 11,160,852 | |||||||||||||||
| Net carrying amount | 184,755 | 6,896,788 | 1,830,155 | 21,737,979 | 30,649,677 | |||||||||||||||
The carrying value of plant and equipment held under finance leases at June 30, 2012 is $1,044,917 (December 31, 2011: $370,580; December 31, 2010: $971,195).
Included in the net carrying value of buildings, plant & equipment and infrastructure at June 30, 2012 were amounts of US$0.2 million, US$1.8 million and US$1.9 million respectively (December 31, 2011 – buildings, plant & equipment and infrastructure - US$0.3 million, US$2.0 million and US$2.1 million respectively; December 31, 2010 – capital assets in progress: US$3.01 million)) for interest and borrowing costs capitalized for the Phuoc Son plant which was under construction and placed into commercial production on July 1, 2011.
Plant and equipment with a carrying value of $12,063,626 at June 30, 2012 has been pledged as security for a bank loan (Note 20).
An impairment charge has been recognized on property, plant and equipment associated with the Nui Kem project (Note 12).
24
11. Deferred Exploration Expenditure
| US$ | Bong Mieu Gold Mining Company | Phuoc Son Gold Company | North Borneo Gold | Binh Dinh NZ Gold Co | Total | |||||||||||||||
| Cost as at January 1, 2010 | 3,234,713 | 7,415,048 | - | - | 10,649,761 | |||||||||||||||
| Additions | 405,057 | 484,110 | 2,267,175 | 535,827 | 3,692,169 | |||||||||||||||
| Cost as at December 31, 2010 | 3,639,770 | 7,899,158 | 2,267,175 | 535,827 | 14,341,930 | |||||||||||||||
| Additions | 258,436 | 712,429 | 5,537,081 | 233,327 | 6,741,273 | |||||||||||||||
| Translation adjustments | - | - | (277,854 | ) | (12,480 | ) | (290,334 | ) | ||||||||||||
| Cost as at December 31, 2011 | 3,898,206 | 8,611,587 | 7,526,402 | 756,674 | 20,792,869 | |||||||||||||||
| Additions | 97,049 | 434,376 | 3,137,451 | 39,909 | 3,708,785 | |||||||||||||||
| Impairment charge | (91,070 | ) | (1,186,433 | ) | - | - | (1,277,503 | ) | ||||||||||||
| Cost as at June 30, 2012 | 3,904,185 | 7,859,530 | 10,663,853 | 796,583 | 23,224,151 | |||||||||||||||
| US$ | Bong Mieu Gold Mining Company | Phuoc Son Gold Company | North Borneo Gold | Binh Dinh NZ Gold Co | Total | |||||||||||||||
| Accumulated Amortization as at January 1, 2010 | (117,316 | ) | (107,054 | ) | - | - | (224,370 | ) | ||||||||||||
| Additions | (29,701 | ) | (466,085 | ) | - | - | (495,786 | ) | ||||||||||||
| Accumulated amortization as at December 31, 2010 | (147,017 | ) | (573,139 | ) | - | - | (720,156 | ) | ||||||||||||
| Additions | (15,007 | ) | (541,151 | ) | - | - | (556,158 | ) | ||||||||||||
| Accumulated amortization as at December 31, 2011 | (162,024 | ) | (1,114,290 | ) | - | - | (1,276,314 | ) | ||||||||||||
| Additions | (64,820 | ) | (454,455 | ) | (519,275 | ) | ||||||||||||||
| Accumulated amortization as at June 30, 2012 | (226,844 | ) | (1,568,745 | ) | (1,795,589 | ) | ||||||||||||||
| Net book value as at December 31, 2010 | 3,492,753 | 7,326,019 | 2,267,175 | 535,827 | 13,621,774 | |||||||||||||||
| Net book value as at December 31, 2011 | 3,736,182 | 7,497,297 | 7,526,402 | 756,674 | 19,516,555 | |||||||||||||||
| Net book value as at June 30, 2012 | 3,677,341 | 6,290,785 | 10,663,853 | 796,583 | 21,428,562 | |||||||||||||||
Accumulated amortization relates to the Bong Mieu central mine which commenced commercial production on October 1, 2006, the Bong Mieu underground mine which commenced production on April 1, 2009 and the Phuoc Son mine which commenced commercial production on October 1, 2009.
As the Company did not yet have unencumbered access to the Capcapo property at June 30, 2012, exploration costs incurred to date in 2012 in respect of this property have been expensed.
The impairment charge for Phuoc Son relates to exploration costs incurred within the core area of the Song Thanh Natural Reserve, which the Company no longer intends exploring or ultimately mining in the future due to access issues surrounding reserve areas in Vietnam.
25
12. Deferred Development Expenditure
| US$ | Bong Mieu Gold Mining Company | Phuoc Son Gold Company | Total | |||||||||
| Cost as at January 1, 2010 | 7,922,299 | 8,050,086 | 15,972,385 | |||||||||
| Additions | 4,284,323 | 3,633,441 | 7,917,764 | |||||||||
| Cost as at December 31, 2010 | 12,206,622 | 11,683,527 | 23,890,149 | |||||||||
| Additions | 4,195,582 | 5,114,149 | 9,309,731 | |||||||||
| Cost as at December 31, 2011 | 16,402,204 | 16,797,676 | 33,199,880 | |||||||||
| Additions | 1,271,572 | 4,573,680 | 5,845,252 | |||||||||
| Cost as at June 30, 2012 | 17,673,776 | 21,371,356 | 39,045,132 | |||||||||
| Accumulated Amortization as at January 1, 2010 | (306,467 | ) | (1,042,256 | ) | (1,348,723 | ) | ||||||
| Additions | (2,100,383 | ) | (2,337,185 | ) | (4,437,568 | ) | ||||||
| Accumulated amortization as at December 31, 2010 | (2,406,850 | ) | (3,379,441 | ) | (5,786,291 | ) | ||||||
| Additions | (1,246,501 | ) | (5,890,598 | ) | (7,137,099 | ) | ||||||
| Accumulated amortization as at December 31, 2011 | (3,653,351 | ) | (9,270,039 | ) | (12,923,390 | ) | ||||||
| Additions | (2,485,766 | ) | (3,932,783 | ) | (6,418,549 | ) | ||||||
| Accumulated amortization as at June 30, 2012 | (6,139,117 | ) | (13,202,822 | ) | (19,341,939 | ) | ||||||
| Impairment charge as at June 30, 2012 | (9,066,659 | ) | - | (9,066,659 | ) | |||||||
| Net book value as at December 31, 2010 | 9,799,772 | 8,304,086 | 18,103,858 | |||||||||
| Net book value as at December 31, 2011 | 12,748,853 | 7,527,637 | 20,276,490 | |||||||||
| Net book value as at June 30, 2012 | 2,468,000 | 8,168,534 | 10,636,534 | |||||||||
The impairment charge for Bong Mieu relates to the Nui Kem project where, due to higher than expected costs that are now forecast to continue, management assessed indicators of impairment related to the Nui Kem project and its associated assets and used a discounted cash flow model to calculate the recoverable amount. This resulted in an impairment charge of $11,534,659 to the Nui Kem project and its associated assets, allocated $2,468,000 to property, plant and equipment, and $9,066,659 to deferred development expenditure.
26
13. Mine Properties
| US$ | Bong Mieu Gold Mining Company | Phuoc Son Gold Company | North Borneo Gold | Binh Dinh NZ Gold Co | GR Enmore | Total | ||||||||||||||||||
| Cost as at January 1, 2010 | 3,219,595 | 4,993,450 | - | - | - | 8,213,045 | ||||||||||||||||||
| Additions | 1,075 | 1,614 | 31,276,437 | 1,333,333 | 550,000 | 33,162,459 | ||||||||||||||||||
| Cost as at December 31, 2010, December 31, 2011 and June 30, 2012 | 3,220,670 | 4,995,064 | 31,276,437 | 1,333,333 | 550,000 | 41,375,504 | ||||||||||||||||||
| Accumulated Amortization as at January 1, 2010 | (654,693 | ) | (355,000 | ) | - | - | - | (1,009,693 | ) | |||||||||||||||
| Additions | (289,532 | ) | (878,500 | ) | - | - | - | (1,168,032 | ) | |||||||||||||||
| Accumulated amortization as at December 31, 2010 | (944,225 | ) | (1,233,500 | ) | - | - | - | (2,177,725 | ) | |||||||||||||||
| Additions | (344,696 | ) | (956,518 | ) | - | - | - | (1,301,214 | ) | |||||||||||||||
| Accumulated amortization as at December 31, 2011 | (1,288,921 | ) | (2,190,018 | ) | - | - | - | (3,478,939 | ) | |||||||||||||||
| Additions | (212,554 | ) | (518,697 | ) | - | - | - | (731,251 | ) | |||||||||||||||
| Accumulated amortization as at June 30, 2012 | (1,501,475 | ) | (2,708,715 | ) | - | - | - | (4,210,190 | ) | |||||||||||||||
| Net book value as at December 31, 2010 | 2,276,445 | 3,761,564 | 31,276,437 | 1,333,333 | 550,000 | 39,197,779 | ||||||||||||||||||
| Net book value as at December 31, 2011 | 1,931,749 | 2,805,046 | 31,276,437 | 1,333,333 | 550,000 | 37,896,565 | ||||||||||||||||||
| Net book value as at June 30, 2012 | 1,719,195 | 2,286,349 | 31,276,437 | 1,333,333 | 550,000 | 37,165,314 | ||||||||||||||||||
The Company’s exploration and mining licenses related to the above mine properties are of a fixed term. Prior to the expiry of any of its exploration or mining licenses, the Company files applications in the ordinary course to renew those licenses that it deems necessary or advisable for the continued operation of its business. Certain of the Company’s exploration and mining licenses described above, including Phuoc Son exploration license, Bong Mieu (Ho Gan) exploration license, and North Borneo Gold mining and exploration licenses are currently pending renewal.
Bong Mieu Gold Property
The Company holds an 80 percent interest in the Bong Mieu Gold Project and holds mining and investment licenses covering thirty square kilometers within the Bong Mieu gold property area. The investment license covers three deposits: Bong Mieu Central Gold mine (an open pit), Bong Mieu Underground (an underground deposit) and Bong Mieu East (a potentially open-pit deposit). In 1997, the Company's subsidiary, Formwell Holdings Limited ("FHL"), entered into a joint venture with The Mineral Development Company Limited ("Mideco") and with Mien Trung Industrial Company ("Minco"), a mining company then controlled by the local provincial government to form the Bong Mieu Gold Mining Company ("BMGC"). The Company constructed the Bong Mieu Central open pit mine and associated infrastructure in 2005 and 2006, and commercial gold production commenced in the fourth quarter of 2006. The Company placed the Bong Mieu Underground project into production effective April 1, 2009 on substantial completion of the plant installation which enabled commercial production of Bong Mieu Underground to commence. The Company pays the Vietnam Government a royalty equal to three percent of the sales value of gold production in Vietnam from the Bong Mieu Gold Project.
27
Phuoc Son Gold Property
The Company holds an 85 percent interest in the Phuoc Son Gold Project with a focus on exploration, development and production of gold and other potential minerals in the specified project area, located in Phuoc Son and Nam Giang districts in the Quang Nam Province. In 2003, the Company's subsidiary, New Vietnam Mining Company ("NVMC"), entered into a joint venture with Minco, a mining company then controlled by the local provincial government, to form the Phuoc Son Gold Company ("PSGC"). PSGC has an investment license on the Phuoc Son property. NVMC's initial interest in PSGC is 85 percent and Minco has a 15 percent interest. After five years, from the end of the period in which PSGC makes a profit for 12 consecutive months, Minco can increase its interest by 15 percent to 30 percent if Minco chooses to acquire such interest from NVMC by paying fair market value. After 20 years, Minco can increase its interest to a total of 50 percent if Minco chooses to acquire such additional 20 percent interest from NVMC by paying fair market value. Fair market value shall be determined by using an independent accounting firm to perform the fair market value assessment and that assessment will be considered final and binding for both parties. If Minco does not proceed on exercising its right of acquisition within three months from the dates of entitled acquisition, Minco will be considered as having waived its right to acquire the interest.
The Phuoc Son Gold Property was put into commercial production in the fourth quarter of 2009.
Ore mined from Phuoc Son was trucked to the Bong Mieu processing facility under a trucking permit until December 31, 2010. The permit was renewed effective March 15, 2011, however, management decided not to utilize the permit opting instead to stock pile ore for treatment in the new processing plant.
The Company pays the Vietnam Government a royalty equal to fifteen percent of the sales value of gold production in Vietnam from the Phuoc Son Gold Project.
Bau Gold Project
During the third and fourth quarters of 2010, the Company purchased an additional combined 25 percent interest in North Borneo Gold Sdn Bhd and in May 2011, the Company acquired an additional 5.48 percent, taking its effective interest in the Bau Gold Project to 80.53 percent at December 31, 2011. In January 2012 the Company purchased an additional 2.72 percent, taking its effective interest to 83.25 percent at June 30, 2012. The remaining interest is held by the Malaysian mining group, Gladioli Enterprises Sdn Bhd. Pursuant to the Bau Agreement, Olympus is the project operator.
The Bau Gold Project comprises consolidated mining and exploration tenements within the historic Bau Goldfield, in Sarawak, East Malaysia.
The Company has agreed to acquire a further 10.3 percent from the local Malaysian joint venture partner in three remaining tranches, with final completion in January 2014 which will bring the Company’s effective interest to 93.55 percent. As a condition of settlement of Tranche 2, the Joint Venture agreement has been revised. The revisions deal with a number of operational and governance matters. Further information about the acquisition can be found in note 9.
Capcapo Gold Property
The Company entered a formal joint venture agreement on September 30, 2011 with Abra Mining & Industrial Corporation (“AMIC”), Jabel Corporation (“Jabel”), Kadabra Mining Corporation (a wholly-owned subsidiary of the Company) (“KMC”) and PhilEarth Mining Corporation in respect of the Capcapo Gold Property in the Northern Philippines.
The terms of the joint venture agreement are described in note 9. The joint venture agreement also grants the Company a right of first refusal over a mineral production sharing agreement held by Jabel over the Patok property, also located in Abra Province, Northern Philippines.
Tien Thuan Gold Property
The Company holds an option to acquire a 75 percent development interest in the Tien Thuan Gold Project in Binh Dinh Province, Central Vietnam.
The Tien Thuan Gold Project lies some 50 km west of the port city of Quy Nhon in Binh Dinh Province.
The Binh Dinh Provincial Government has granted an Investment Certificate to the Olympus subsidiary, Binh Dinh New Zealand Gold Company. Pursuant to the Investment Certificate, Olympus may earn 75 percent equity in the Tien Thuan Project, by funding exploration through to completion of a bankable feasibility study (such funding to be repayable from future profits). Upon reaching a “decision to mine”, project development will be jointly funded on a pro-rata basis.
Enmore Gold Property
The Company holds a 100 percent interest in the Enmore Gold Project in north western New South Wales, Australia through two exploration licenses covering 290km2 and is earning an 80 percent interest in two exploration licenses covering 35 km2.
28
14. Cash and Cash Equivalents
Cash at banks earns interest at floating rates based on daily bank deposit rates. Short-term deposits are made at call and for less than one month, depending on the immediate cash requirements of the Group, and earn interest at the respective short-term deposit rates. The fair value of cash and short-term deposits at June 30, 2012 and at December 31, 2011 approximates carrying value. The Group only deposits cash surpluses with major banks of high quality credit standing.
Cash and cash equivalents comprise the following:
| US$ | June 30, 2012 | December 31, 2011 | December 31, 2010 | |||||||||
| Cash at banks and on hand | 3,397,728 | 7,976,516 | 4,105,325 | |||||||||
| Short-term deposits | - | 753,732 | - | |||||||||
| Total | 3,397,728 | 8,730,248 | 4,105,325 | |||||||||
15. Trade and Other Receivables
| US$ | June 30, 2012 | December 31, 2011 | December 31, 2010 | |||||||||
| Trade receivables | 45,490 | 19,933 | 1,628,255 | |||||||||
| Vietnam value-added tax | 854,784 | 1,224,617 | 5,613,964 | |||||||||
| Deposits | 657,956 | 666,549 | 620,680 | |||||||||
| Other receivables | 55,885 | 111,023 | 126,837 | |||||||||
| Total | 1,614,115 | 2,022,122 | 7,989,736 | |||||||||
16. Inventories
| US$ | June 30, 2012 | December 31, 2011 | December 31, 2010 | |||||||||
| Doré bars and gold bullion | 4,991,918 | 8,974,577 | 2,153,029 | |||||||||
| Ore in stockpiles | 474,492 | 488,788 | 714,021 | |||||||||
| Gold in circuit | 1,064,236 | 1,559,123 | 94,924 | |||||||||
| Mine operating supplies and spares | 4,764,765 | 4,264,047 | 3,727,026 | |||||||||
| Total | 11,295,411 | 15,286,535 | 6,689,000 | |||||||||
17. Other Financial Assets
| US$ | June 30, 2012 | December 31, 2011 | December 31, 2010 | |||||||||
| Prepaid expenses | 2,605,304 | 3,641,797 | 1,473,929 | |||||||||
| Total | 2,605,304 | 3,641,797 | 1,473,929 | |||||||||
Prepayments are entered into in the ordinary course of business and are generally utilized within a twelve month period.
29
18. Provisions
| US$ | Asset Retirement Obligation | Employee Entitlements | Other | Total | ||||||||||||
| At January 1, 2010 | 974,726 | 128,756 | 135,833 | 1,239,315 | ||||||||||||
| Arising during the twelve months | 574,666 | 173,616 | 571,058 | 1,319,340 | ||||||||||||
| Accretion | 90,334 | - | - | 90,334 | ||||||||||||
| Utilization | (29,049 | ) | (208,665 | ) | (324,369 | ) | (562,083 | ) | ||||||||
| At December 31, 2010 | 1,610,677 | 93,707 | 382,522 | 2,086,906 | ||||||||||||
| Arising during the twelve months | 401,260 | 264,221 | 450,584 | 1,116,065 | ||||||||||||
| Write back of unused provisions | - | - | (95,106 | ) | (95,106 | ) | ||||||||||
| Accretion | 79,969 | - | - | 79,969 | ||||||||||||
| Utilization | (375,947 | ) | (209,461 | ) | (287,416 | ) | (872,824 | ) | ||||||||
| At December 31, 2011 | 1,715,959 | 148,467 | 450,584 | 2,315,010 | ||||||||||||
| Arising during the six months | 48,265 | 223,013 | 457,325 | 728,603 | ||||||||||||
| Write back of unused provisions | - | - | (2,675 | ) | (2,675 | ) | ||||||||||
| Accretion | 77,757 | - | - | 77,757 | ||||||||||||
| Utilization | (90,010 | ) | (171,611 | ) | (486,064 | ) | (747,685 | ) | ||||||||
| At June 30, 2012 | 1,751,971 | 199,869 | 419,170 | 2,371,010 | ||||||||||||
| Comprising: | ||||||||||||||||
| Current 2012 | 600,644 | 199,869 | 419,170 | 1,219,683 | ||||||||||||
| Non-current 2012 | 1,151,327 | - | - | 1,151,327 | ||||||||||||
| 1,751,971 | 199,869 | 419,170 | 2,371,010 | |||||||||||||
| Comprising: | ||||||||||||||||
| Current 2011 | 436,966 | 148,467 | 450,584 | 1,036,017 | ||||||||||||
| Non-current 2011 | 1,278,993 | - | - | 1,278,993 | ||||||||||||
| 1,715,959 | 148,467 | 450,584 | 2,315,010 | |||||||||||||
| Comprising: | ||||||||||||||||
| Current 2010 | 491,345 | 93,707 | 382,522 | 967,574 | ||||||||||||
| Non-current 2010 | 1,119,332 | - | - | 1,119,332 | ||||||||||||
| 1,610,677 | 93,707 | 382,522 | 2,086,906 | |||||||||||||
Asset Retirement Obligations
In accordance with Vietnamese and Malaysian law, land must be restored to its original condition. The Group recognized $1,977,103 in provisions for this purpose. Because of the long-term nature of the liability, the biggest uncertainty in estimating the provision relates to the costs that will be incurred. The provisions for asset retirement obligations are based on estimated future costs using information available at the date of the consolidated statement of financial position. The provision has been calculated using a discount rate of 6.9 percent. The rehabilitation is expected to occur progressively over the next 5 years. To the extent the actual costs differ from these estimates, adjustments will be recorded and the statement of comprehensive income/(loss) may be impacted.
Employee entitlements
Employee entitlements includes the value of excess leave entitlements allocated over the leave taken by the employees of the Group. These amounts are expected to be utilized as the employees either take their accrued leave or receive equivalent benefits upon ceasing employment. Employee entitlements also include provisions for short-term incentive plan benefits.
Other
Other provisions mainly represents a provision for audit fees that relate to the period but for which the services are generally performed in a future period.
30
19. Derivative Financial Liabilities
| US$ | June 30, 2012 | December 31, 2011 | December 31, 2010 | |||||||||
| Gold loan - gold price movements derivative | 3,280,000 | 4,394,000 | 4,497,000 | |||||||||
| Gold loan vested warrants - conversion option | 52,034 | 209,181 | 1,806,149 | |||||||||
| Convertible notes - conversion option | 3,322,698 | 5,171,272 | 7,837,083 | |||||||||
| Convertible notes vested warrants - conversion option | 2,688,875 | 4,188,685 | 4,059,984 | |||||||||
| 9,343,607 | 13,963,138 | 18,200,216 | ||||||||||
| Current portion | 3,280,000 | - | - | |||||||||
| Non-current portion | 6,063,607 | 13,963,138 | 18,200,216 | |||||||||
| Total | 9,343,607 | 13,963,138 | 18,200,216 | |||||||||
Convertible Notes (Unsecured)
Some of the convertible notes outstanding are denominated in Canadian dollars while others are denominated in US dollars and the associated warrants are denominated in Canadian dollars. The functional reporting currency of the Company is US dollars. As the exercise price of the stock underlying the warrants and conversion feature of the convertible notes denominated in Canadian dollars is not denominated in the Company’s functional currency, the contractual obligations arising from the warrants and conversion feature meet the definition of derivatives under IFRS. They are re-valued at each reporting date using the Black-Scholes model for the warrants and a binomial option pricing model for the conversion option, with any change in valuation being recognized in the statement of comprehensive income (loss).
8 percent redeemable promissory notes (Gold Loan)
The Gold loan was issued in US$10,000 units, bears interest at 8 percent per annum and is payable semi-annually in arrears. The Gold Loan initially obligates the Company to deliver (subject to adjustment) an aggregate of approximately 24,400 ounces of gold (at US$900 per ounce). The Gold Loan matures on May 31, 2013, and requires various quantities of gold to be delivered at regular six monthly intervals leading up to the maturity date. The amount of gold that must be delivered is established by reference to a Gold Price Participation Arrangement (“GPPA”). Under certain conditions, the GPPA allows the Company to proportionally reduce the quantity of gold it has to deposit in trust. For gold prices between US$900 and US$1,200 per ounce, payment volumes are altered so that the Company’s US dollar repayment obligation to repay the loans will not be affected by any changes in gold prices. However, volumes of gold payments are frozen if the price of gold falls below US$900 (the Company being protected from having to deliver more gold) or exceeds US$1,200 per ounce (the Company then being forced to give away a capped volume and thus value to the note holders) so in option terms the Company has a written put when gold prices are below US$900 per ounce and written call option when they are above US$1,200 per ounce.
The call option and put option features of the Gold Loan are re-valued at each reporting date using the Black 76 variant of the Black-Scholes option pricing model, with each gold deposit date (May 31 and November 30 each year) valued as a separate option in accordance with the criteria noted above.
The call option component of the gold note, a derivative liability of the Company, has a value of US$3,296,000 at June 30, 2012 (US$4,539,000 as at December 31, 2011; US$4,846,000 as at December 31, 2010). Inputs used when valuing the call option components of the Gold Loan are:
| June 30, 2012 | December 31, 2011 | December 31, 2010 | |
| Gold futures prices | US$1,608 to US$1,614 per ounce | US$1,571 to US$1,585 per ounce | US$1,425 to US$1,468 per ounce |
| Exercise price (call options) | US$1,200 per ounce | US$1,200 per ounce | US$1,200 per ounce |
| Term to maturity | 0.42 to 0.92 years | 0.42 to 1.42 years | 0.42 to 2.42 years |
| Annualized volatility | 25% to 30% | 30% | 18% - 24% |
| Risk free rate | 0.2% to 0.3% | 0.1% to 0.2% | 0.2% to 0.8% |
31
The put option component of the gold note, a derivative asset of the Company, has a value of US$16,000 at June 30, 2012 (US$145,000 as at December 31, 2011; US$349,000 as at December 31, 2010). Inputs used when valuing the put option components of the Gold Loan are:
| June 30, 2012 | December 31, 2011 | December 31, 2010 | |
| Gold futures prices | US$1,608 to US$1,614 per ounce | US$1,571 to US$1,585 per ounce | US$1,425 to US$1,468 per ounce |
| Exercise price (put options) | US$900 per ounce | US$900 per ounce | US$900 per ounce |
| Term to maturity | 0.42 to 0.92 years | 0.42 to 1.42 years | 0.42 to 2.42 years |
| Annualized volatility | 30% to 35% | 35% | 27% - 31% |
| Risk free rate | 0.2% to 0.3% | 0.1% to 0.2% | 0.2% to 0.8% |
The common stock purchase warrants offered with the Gold Loan are exercisable for a number of shares of common stock in the Company equal to 20% of the stated or deemed principal amount of the issued notes divided by CAD $0.60. Each warrant entitles the holder to purchase 3,470 shares of common stock. The warrants are fully vested, are exercisable in whole or in part at CAD $0.60 per share. As the exercise price of the stock underlying the gold loan warrants is not denominated in the Company’s functional currency, the warrants meet the definition of derivatives and are recorded as derivative liabilities under IFRS, and are revalued at each reporting date, with any change in valuation being recognized in the statement of income/(loss) and comprehensive income/(loss).
32
20. Interest Bearing Loans and Borrowings
| US$ | June 30, 2012 | December 31, 2011 | December 31, 2010 | |||||||||
| Gold loan | 8,445,728 | 11,353,550 | 15,408,880 | |||||||||
| Secured bank loan | 3,028,593 | - | - | |||||||||
| 11,474,321 | 11,353,550 | 15,408,880 | ||||||||||
| Current portion | 11,474,321 | 8,558,040 | 6,429,600 | |||||||||
| Non-current portion | - | 2,795,510 | 8,979,280 | |||||||||
| Total | 11,474,321 | 11,353,550 | 15,408,880 | |||||||||
8 percent redeemable promissory notes (Gold Loan)
On June 21, 2010 the Company announced that it had consummated a private placement consisting of (i) a senior secured redeemable gold delivery promissory note (“Gold Loan”) and (ii) common stock purchase warrants. The Gold Loan is secured by certain assets of the Company and Formwell Holdings Limited and New Vietnam Mining Corporation (“Guarantors”).
| At June 30, 2012 | ||||||||||||||
| Issued | Maturity | Interest Rate | Number of Units | Face Value US$ | ||||||||||
| Gold Loan | June 18, 2010 | May 31, 2013 | 8 | % | 1,314 | 9,360,000 | ||||||||
As at June 30, 2012, the Gold Loan has a face value of US$9,360,000 (December 31, 2011: $13,140,000; December 31, 2010: $19,440,000). The Gold Loan has an original face value of US$21,960,000, the difference to the original face value being payments of principal of US$12,600,000. It was issued in US$10,000 units, bears interest at 8 percent per annum and is payable semi-annually in arrears.
The Gold Loan initially obligates the Company to deliver gold as settlement of the loan’s principal, subject to the adjustment feature described in note 19.
The common stock purchase warrants offered with the Gold Loan are exercisable for a number of shares of common stock in the Company equal to 20 percent of the stated or deemed principal amount of the issued notes divided by CAD $0.60. Each warrant entitles the holder to purchase 3,470 shares of common stock. The warrants are fully vested, are exercisable in whole or in part at CAD $0.60 per share, and have been accounted for as derivative liabilities.
The Company did not exercise its option for early repayment through a one-off provision for the early redemption of the Gold Loan on November 30, 2011.
On the date of issuance, the value of the Gold Loan, net of transaction costs, was determined as $18.189 million.
As part of this offering, the Company issued broker warrants which were valued at $0.252 million and have been recorded as part of the transaction cost.
Gold delivered as repayment of the loan is accounted for as a disposal of a current asset, for which a gain or loss is recorded as other income (loss) in the consolidated statement of comprehensive income (loss). The gain or loss represents the difference between the value of the note settled by way of gold and the cost of production of inventory used to settle that portion of the loan.
The Gold Loan Notes require the Company to meet certain covenants, all of which had been met as at June 30, 2012, including the following:
| · | Affirmative and negative covenants, anti-dilution provision and other provisions that are customary for transactions of this nature. |
Secured bank loan
In May 2012, Phuoc Son Gold Company Limited entered into a loan agreement with Vietcombank for a maximum borrowing of US$5,000,000, to be drawn down as required. The loan term is six months from the date of principal drawdown to the date of repayment for each drawdown. The interest rate is specified at the time of drawdown and may be adjusted every three months. The interest rate for drawdowns to June 30, 2012 is 5.5 percent per annum. The bank loan is secured over plant and equipment with a net carrying value of US$12,063,626 (Note 10).
33
21. Convertible Notes
| US$ | June 30, 2012 | December 31, 2011 | December 31, 2010 | |||||||||
| Convertible notes | 24,941,680 | 23,154,693 | 6,826,376 | |||||||||
| Current portion | 621,092 | 630,153 | 390,243 | |||||||||
| Non-current portion | 24,320,588 | 22,524,540 | 6,436,133 | |||||||||
| Total | 24,941,680 | 23,154,693 | 6,826,376 | |||||||||
| At June 30, 2012 | ||||||||||||||||||||||||||||||
| Convertible Notes | Issued | Maturity | Interest Rate | Number of Units | Face Value CAD | Face Value USD | Effective Interest Rate | Conversion Rate per Unit | Total Shares on Conversion | |||||||||||||||||||||
9% CAD Notes(1) | 26-Mar-10 | 26-Mar-14 | 9 | % | 12,709,942 | 10,676,355 | 31.9 | % | 0.42 | 25,419,893 | ||||||||||||||||||||
8% CAD Notes(2) | 29-Apr-11 | 29-Apr-15 | 8 | % | 150 | 15,000,000 | 36.8 | % | 0.50 | 30,000,000 | ||||||||||||||||||||
8% USD Notes(3) | 6-May-11 | 6-May-15 | 8 | % | 14,600,000 | 14,600,000 | 24.5 | % | 0.51 | 28,627,451 | ||||||||||||||||||||
(1) The 9% CAD Notes also have two separate common stock warrants. A vested warrant that is fully vested and immediately exercisable at an exercise price of CAD$0.50 each and a Vesting warrant that is exercisable, subject to vesting upon early redemption of the Convertible Notes, for two common shares at an exercise price of CAD$0.42 per warrant share. | |||||||||||
(2) The 8% CAD Notes also have two separate common stock warrants. A vested warrant that is fully vested and immediately exercisable at an exercise price of CAD$0.55 each and a Vesting warrant that is exercisable, subject to vesting upon early redemption of the Convertible Notes, for two common shares at an exercise price of CAD$0.50 per warrant share. | |||||||||||
(3) The 8% USD Notes also have two separate common stock warrants. A vested warrant that is fully vested and immediately exercisable at an exercise price of CAD$0.55 each and a Vesting warrant that is exercisable, subject to vesting upon early redemption of the Convertible Notes, for two common shares at an exercise price of CAD$0.50 per warrant share. |
The Convertible Note agreements require the Company to meet certain covenants, all of which had been met as at June 30, 2012, including the following:
| · | Affirmative and negative covenants, anti-dilution provision and other provisions that are customary for transactions of this nature. |
22. Trade and Other Payables
| US$ | June 30, 2012 | December 31, 2011 | December 31, 2010 | |||||||||
| Current: | ||||||||||||
| Trade payables | 9,316,329 | 8,040,276 | 809,712 | |||||||||
| Accruals and other payables | 5,007,132 | 7,851,272 | 7,223,470 | |||||||||
| Total | 14,323,461 | 15,891,548 | 8,033,182 | |||||||||
23. Other Financial Liabilities
The Company had capital leases for projects related to the Phuoc Son property.
| US$ | June 30, 2012 | December 31, 2011 | December 31, 2010 | |||||||||
| Total minimum lease payment | 872,782 | 354,312 | 818,946 | |||||||||
| Less: current position | (872,782 | ) | (354,312 | ) | (818,946 | ) | ||||||
| Total | - | - | - | |||||||||
As all lease payments will be settled within one year, the present value of the lease payments approximates their book value.
34
24. Capital and Reserves
Common shares
The Company is authorized to issue an unlimited number of common shares with one vote per share and no par value per share.
The following table shows movements in the capital stock of the Company for the six-month period ended June 30, 2012 and the years ended December 31, 2011 and December 31, 2010.
| Number of Shares | Amount (US$) | |
| Common shares, January 1, 2010 | 268,458,779 | 97,318,003 |
Common shares issued(1) Common shares issued(2) Exercise of options Common shares issued(3) Conversion of Notes Share issue costs(3) | 54,226,405 951,703 1,181,150 37,000,000 3,692,760 - | 14,759,776 293,526 717,201 16,291,697 1,267,210 (743,557) |
| Common shares, December 31, 2010 | 365,510,797 | 129,903,856 |
| Number of Shares | Amount (US$) | |
| Common shares, January 1, 2011 | 365,510,797 | 129,903,856 |
Common shares issued(4) Exercise of options Exercise of warrants Conversion of Notes Common Shares Bought Back and Cancelled(5) Share issue costs(4) | 14,000,000 3,334 9,921 1,363,855 (294,000) - | 5,787,600 2,148 18,068 497,685 (73,022) (289,380) |
| Common shares, December 31, 2011 | 380,593,907 | 135,846,955 |
| Number of Shares | Amount (US$) | |
| Common shares, December 31, 2011 | 380,593,907 | 135,846,955 |
Exercise of options Common Shares Bought Back and Cancelled(6) | 817,458 (2,630,179) | 197,856 (910,114) |
| Common shares, June 30, 2012 | 378,781,186 | 135,134,697 |
| (1) | On January 12, 2010 Olympus and Zedex amalgamated their business and Olympus took control. The amalgamation was effected with a record date of January 19, 2010, at that time Zedex shareholders shares were cancelled and they were allocated 1 common share in Olympus in exchange for 2.4 common shares in Zedex. The consideration for the amalgamation was valued at $15,206,478 which was settled by way of shares. This resulted in 54,226,405 new common shares in Olympus being issued and 65,551,043 common shares which were formerly held by Zedex being redistributed to former Zedex shareholders. The shares were issued on January 25, 2010. |
| (2) | The Company issued 951,703 common shares in settlement of AUD$319,335 consultancy fee related to the amalgamation with Zedex. |
| (3) | The Company issued 37,000,000 common shares at A$0.45 per share, for gross proceeds of 16,291,697 and net proceeds of $15,548,141. Agents for the private placement were paid a cash commission of 5% of the gross proceeds of the placement. |
(4) In March 2011 the Company completed a non-brokered private placement of 14,000,000 shares at a price of A$0.40 per share, for gross proceeds of $5,787,600 and net proceeds of $5,498,220. Agents for the private placement were paid a cash commission of 5% of the gross proceeds of the placement. |
(5) In December 2011 the Company bought back 294,000 shares on market at an average price of USD$0.25 per share and cancelled them. |
(6) In 2012 the Company bought back 2,630,179 shares on market at an average price of USD$0.35 per share and cancelled them. |
Common Share Buy-back Program
On November 28, 2011, the Company announced its intention to make a normal course issuer bid to be transacted through the facilities of the TSX (the “Normal Course Issuer Bid”) and filed a buy-back announcement with the Australian Securities Exchange (with the Normal Course Issuer Bid, the “Buy-Back Program”).
Pursuant to the terms of the Buy-Back Program, Olympus may purchase its own common shares for cancellation in compliance with TSX or ASX rules, as applicable up to a maximum of 30,072,558 shares, being 10 percent of its public float. Purchases will be subject to a daily maximum of 49,601 shares representing 25 percent of the average daily trading volume of 198,403 shares for the six months ended October 31, 2011, except where such purchases are made in accordance with “block” purchase exemptions under TSX guidelines. Olympus will initiate purchases at different times starting on or after December 1, 2011, and ending no later than November 30, 2012.
35
Stock options
Under the Company’s stock option plan, options to purchase shares of the Company may be granted to directors, officers, employees and consultants of the Company. The maximum number of shares that may be issued under the new plan is 12 percent (on a non-diluted basis) of the Company’s issued and outstanding shares. Options granted under the plan have a maximum term of five years and vesting dates are determined by the Board of Directors on an individual basis at the time of granting.
The following table provides a summary of the stock option activity for the six-month period ended June 30, 2012 and the years ended December 31, 2011 and December 31, 2010.
June 30, 2012 | December 31, 2011 | December 31, 2010 | ||||||||||||||||||||||
| Number of Options | Weighted Average Exercise Price $CAD | Number of Options | Weighted Average Exercise Price $CAD | Number of Options | Weighted Average Exercise Price $CAD | |||||||||||||||||||
| Outstanding, beginning of the period | 35,278,977 | 0.54 | 31,084,998 | 0.52 | 18,212,496 | 0.50 | ||||||||||||||||||
| Granted | 14,737,960 | 0.42 | 6,235,733 | 0.62 | 18,395,716 | 0.50 | ||||||||||||||||||
| Exercised | (1,092,960 | ) | 0.12 | (3,334 | ) | 0.45 | (4,072,798 | ) | 0.32 | |||||||||||||||
| Cancelled/ Expired | (11,041,221 | ) | 0.66 | (2,038,420 | ) | 0.49 | (1,450,416 | ) | 0.51 | |||||||||||||||
| Outstanding, end of the period | 37,882,756 | 0.47 | 35,278,977 | 0.54 | 31,084,998 | 0.52 | ||||||||||||||||||
| Options exercisable at the end of the period | 24,433,130 | 0.50 | 30,858,452 | 0.54 | 23,701,997 | 0.53 | ||||||||||||||||||
The following table summarizes information about the stock options outstanding as at June 30, 2012.
| Options Outstanding | Options Exercisable | ||||||
| Range of Exercise Prices $CAD | Number Outstanding As at June 30, 2012 | Weighted Average Remaining Life (years) | Weighted Average Exercise Price $CAD | Number Exercisable As at June 30, 2012 | Weighted Average Exercise Price $CAD | ||
| 0.12 | 297,654 | 1.51 | 0.12 | 297,654 | 0.12 | ||
| 0.20 - 0.29 | 1,875,000 | 4.97 | 0.26 | - | - | ||
| 0.30 - 0.39 | 4,470,000 | 4.76 | 0.33 | - | - | ||
| 0.40 - 0.49 | 14,202,184 | 2.90 | 0.41 | 13,993,851 | 0.41 | ||
| 0.50 - 0.59 | 9,908,229 | 4.38 | 0.52 | 3,095,269 | 0.53 | ||
| 0.60 – 0.69 | 3,950,000 | 1.77 | 0.61 | 3,916,667 | 0.61 | ||
| 0.70 – 0.79 | 2,763,022 | 3.63 | 0.72 | 2,713,022 | 0.72 | ||
| 0.80 – 0.89 | 416,667 | 1.25 | 0.80 | 416,667 | 0.80 | ||
| 37,882,756 | 0.47 | 24,433,130 | 0.50 | ||||
During the six-month period ended June 30, 2012, 14,737,960 options were issued to directors, officers, employees and consultants of the Company and were valued for accounting purposes, at $2,465,107. These options have various exercise prices of between CAD$0.26 and CAD$0.52. The exercise price of these and most of the other outstanding options was determined based on the Volume Weighted Average Price (VWAP), being the listing of the stock activities for five business days from the grant date. 1,425,000 of the options vest within three months, the remaining 13,137,960 outstanding options vest after 12 months from the grant date and 175,000 options were cancelled subsequent to the period end.
36
Warrants
The following table shows movements in number of warrants of the Company for the six-month period ended June 30, 2012 and the years ended December 31, 2011 and December 31, 2010.
| June 30, 2012 | December 31, 2011 | December 31, 2010 | ||||||||||||||||||||||
| Number of Warrants | Weighted Average Exercise Price $CAD | Number of Warrants | Weighted Average Exercise Price $CAD | Number of Warrants | Weighted Average Exercise Price $CAD | |||||||||||||||||||
| Outstanding, beginning of the period | 39,508,908 | 0.86 | 20,278,076 | 0.74 | - | - | ||||||||||||||||||
Granted – Vested Warrants1 | - | - | - | - | 15,178,559 | $ | 0.50 | |||||||||||||||||
| Granted – Broker Warrants | - | - | - | - | 2,428,571 | $ | 0.50 | |||||||||||||||||
| Granted – Agent Warrants | - | - | - | - | 2,668,750 | $ | 0.60 | |||||||||||||||||
Granted – Gold Loan Warrants2 | - | - | - | - | 2,196 | $ | 2,082 | |||||||||||||||||
| Granted – Agent Warrants | - | - | 4,690,196 | 0.55 | - | - | ||||||||||||||||||
Granted – Vested Warrants3 | - | - | 150 | 55,000 | - | - | ||||||||||||||||||
Granted – Vested Warrants4 | - | - | 14,600,000 | 0.55 | - | - | ||||||||||||||||||
| Exercised | - | - | (59,514 | ) | 0.50 | - | - | |||||||||||||||||
| Outstanding, end of the period | 39,508,908 | 0.86 | 39,508,908 | 0.86 | 20,278,076 | $ | 0.74 | |||||||||||||||||
| 1. | In 2010 the Company issued a further 15,178,559 vesting warrants which only vest in the event of early redemption of the 9% CAD convertible note described in note 19. In that event the vested warrants are no longer exercisable. |
| 2. | Gold Loan warrants were issued in June 2010. Each Gold Loan warrant entitles the holder to purchase 3,470 common shares at an exercise price of CAD$0.60 each. The Company has thus issued 2,196 warrants for the purchase of 7,620,120 common shares. |
| 3. | In April 2011 the Company issued a further 150 vesting warrants, which only vest in the event of early redemption of the 8% CAD convertible note described in note 19. In that event the vested warrants are no longer exercisable. |
| 4. | In May 2011 the Company issued a further 14,600,000 vesting warrants, which only vest in the event of early redemption of the 8% USD convertible note described in note 19. In that event the vested warrants are no longer exercisable. |
Consolidated Changes in Equity - Other Reserves
The changes in equity-other reserves for the six-month period ended June 30, 2012 is as follows:
| US$ | Other reserves | Broker warrants | Foreign currency | Equity based compensation reserve | Investment premium reserve | Total | ||||||||||||||||||
| Balance at January 1, 2010 | (93,627 | ) | - | (2,513,078 | ) | 7,032,113 | - | 4,425,408 | ||||||||||||||||
| Options granted and vested | - | - | - | 2,323,275 | - | 2,323,275 | ||||||||||||||||||
| Options exercised | - | - | - | (654,896 | ) | - | (654,896 | ) | ||||||||||||||||
| Warrants granted and vested | - | 521,561 | - | - | - | 521,561 | ||||||||||||||||||
| Investment in subsidiary | - | - | - | - | (10,106,702 | ) | (10,106,702 | ) | ||||||||||||||||
| Balance at December 31, 2010 | (93,627 | ) | 521,561 | (2,513,078 | ) | 8,700,492 | (10,106,702 | ) | (3,491,354 | ) | ||||||||||||||
| Options granted and vested | - | - | - | 3,063,380 | - | 3,063,380 | ||||||||||||||||||
| Options exercised | - | - | - | (661 | ) | - | (661 | ) | ||||||||||||||||
| Warrants granted and vested | - | 896,484 | - | - | 896,484 | |||||||||||||||||||
| Investment in subsidiary | - | - | - | (4,927,389 | ) | (4,927,389 | ) | |||||||||||||||||
| Balance at December 31, 2011 | (93,627 | ) | 1,418,045 | (2,513,078 | ) | 11,763,211 | (15,034,091 | ) | (4,459,540 | ) | ||||||||||||||
| Options granted and vested | - | - | - | 1,462,067 | - | 1,462,067 | ||||||||||||||||||
| Options exercised | - | - | - | (173,808 | ) | - | (173,808 | ) | ||||||||||||||||
| Warrants granted and vested | - | - | - | - | - | - | ||||||||||||||||||
| Investment in subsidiary | - | - | - | - | (2,467,609 | ) | (2,467,609 | ) | ||||||||||||||||
| Balance at June 30, 2012 | (93,627 | ) | 1,418,045 | (2,513,078 | ) | 13,051,470 | (17,501,700 | ) | (5,638,890 | ) | ||||||||||||||
37
Other reserves
This reserve originated in 2009 and represents the tax recovery on expiry of warrants.
Broker warrants
This reserve represents broker warrants associated with the 9 percent CAD Convertible Note that was issued in March 2010, the 8 percent CAD Convertible Note that was issued in April 2011 and the 8 percent USD Convertible Note that was issued in May 2011.
Foreign currency translation
This reserve originated on January 1, 2009 when the Company changed from reporting in CAD to USD and represents accumulated translation differences on balance sheet translation.
Equity based compensation reserve
This reserve records the movements in equity based compensation.
Investment premium reserve
This reserve represents the premium paid on acquisition of a greater equity interest in North Borneo Gold Sdn Bhd.
25. Employee Entitlements
Share based payments
Equity settled share based payments are valued at grant date using a Black Scholes model.
Under the Company’s stock option plan, options to purchase shares of the Company may be granted to directors, officers, employees and consultants of the Company. The maximum number of shares that may be issued under the new plan is 12 percent (on a non-diluted basis) of the Company’s issued and outstanding shares. Options granted under the plan have a maximum term of five years and vesting dates are determined by the Board of Directors on an individual basis at the time of granting.
The total share compensation expense recognized for stock options during the six-month period ended June 30, 2012 is $1,462,071 (twelve-month period ended December 31, 2011 - $1,277,892; twelve-month period ended December 31, 2010 - $1,876,574).
During the six-month period ended June 30, 2012, 14,737,960 options were issued to directors, officers, employees and consultants of the Company and were valued for accounting purposes, at $2,465,107 (refer to note 24 for further information).
Deferred Share Units
In second quarter 2008, the Company set up a deferred share unit plan for the non-executive members of the Board. Under this plan, fees are paid as deferred share units (“DSUs”) whose value is based on the market value of the common shares. Under terms of the plan, the DSU plan will be an unfunded and unsecured plan. The deferred share units are paid out in cash upon retirement/resignation. The value of DSU cash payment changes with the fluctuations in the market value of the common shares. Compensation expense for this plan is recorded in the year the payment is earned and changes in the amount of the deferred share unit payments as a result of share price movements are recorded in management fees and salaries in the period of the change. Total DSUs granted as at June 30, 2012 were 237,357 units. No DSUs were granted during the six-month period ended June 30, 2012, 237,357 units were paid out during the same period and 237,357 were due to be paid out at June 30, 2012. Liabilities related to this plan are recorded in accrued liabilities and totaled $57,885 as at June 30, 2012 (as at December 31, 2011 - $188,491; as at December 31, 2010 - $384,556). Compensation expense related to this plan for the six-month period ended June 30, 2012 was $36,064 (income for the year ended December 31, 2011 - $196,065; income for the year ended December 31, 2010 - $181,296).
26. Related Party Disclosures
The consolidated financial statements include the financial statements of Olympus Pacific Minerals Inc. and the subsidiaries listed in the following table:
38
| % equity interest held as at | |||
| Name | Country of incorporation | June 30, 2012 | December 31, 2011 |
| Formwell Holdings Ltd | British Virgin Islands | 100 | 100 |
| Bong Mieu Holdings Ltd | Thailand | 100 | 100 |
| Bong Mieu Gold Mining Company Limited | Vietnam | 80 | 80 |
| Olympus Pacific Vietnam Ltd | British Virgin Islands | 100 | 100 |
| New Vietnam Mining Corporation | British Virgin Islands | 100 | 100 |
| Phuoc Son Gold Company Limited | Vietnam | 85 | 85 |
| Olympus Pacific Thailand Ltd | British Virgin Islands | 100 | 100 |
| Kadabra Mining Corp. | Philippines | 100 | 100 |
| Olympus Pacific Minerals Vietnam Ltd | Vietnam | 100 | 100 |
| OYM NZ Ltd | New Zealand | 100 | 100 |
| Olympus Pacific Minerals Labuan Ltd | Malaysia | 100 | 100 |
| Parnell Cracroft Ltd | British Virgin Islands | 100 | 100 |
| GR Enmore Pty Ltd | Australia | 100 | 100 |
| Binh Dinh NZ Gold Company Ltd | Vietnam | 75 | 75 |
| North Borneo Gold Sdn Bhd | Malaysia | 83.25 | 80.53 |
| Bau Mining Co Ltd | Samoa | 91 | 91 |
| KS Mining Ltd | Samoa | 100 | 100 |
Compensation of key management of the group was as follows:
| US$ | 6 months ended June 30, 2012 | 12 months ended December 31, 2011 | 12 months ended December 31, 2010 | |||||||||
| Management fees and salary | 715,046 | 3,023,077 | 1,307,518 | |||||||||
| Share based compensation | 957,243 | 924,409 | 1,281,203 | |||||||||
| Total compensation of key management | 1,672,289 | 3,947,486 | 2,588,721 | |||||||||
These transactions were in the normal course of operations and were measured at the exchange value which represented the amount of consideration established and agreed to by the related parties. The above figures represent amounts either paid or accrued.
Management fees and reimbursement of expenses
Management fees incurred on behalf of the Company were paid to companies controlled by officers of the Company. The companies that were paid for management fees and reimbursement of expenses include the following: Orangue Holdings Limited and Dason Investments Limited associated with David Seton in 2012 and 2011; Wholesale Products Trading Limited associated with Peter Tiedemann in 2012 and 2011; Action Management Limited and Starsail Capital Limited associated with Charles Barclay in 2012 and 2011; Lloyd Beaumont No. 2 Trust associated with Paul Seton in 2012 and 2011; Whakapai Consulting Ltd associated with Jane Bell in 2012 and 2011; The Jura Trust associated with John Seton in 2012 and 2011 and K&K Management GmbH associated with Klaus Leiders in 2012.
Directors' interest in the stock option plan
Stock options held by members of the Board of Directors under the stock option plan to purchase ordinary shares have the following expiry dates and exercises prices:
| Number of options outstanding | |||||||||||||||||
| Issue Date | Expiry Date | Exercise Price CAD$ | June 30, 2012 | December 31, 2011 | December 31, 2010 | ||||||||||||
| Mar-07 | Mar-12 | 0.65 | - | 850,000 | 850,000 | ||||||||||||
| Mar-07 | Mar-12 | 0.75 | - | 4,000,000 | 4,000,000 | ||||||||||||
| Jun-08 | Jan-13 | 0.40 | 1,809,000 | 1,809,000 | 1,809,000 | ||||||||||||
| Apr-09 | Jan-14 | 0.12 | - | 722,872 | 722,872 | ||||||||||||
| Jan-10 | Dec-14 | 0.40 | 2,073,618 | 3,073,618 | 3,073,618 | ||||||||||||
| Feb-10 | Apr-12 | 0.87278 | - | 166,667 | 166,667 | ||||||||||||
| Feb-10 | Jun-12 | 0.5742 | - | 625,000 | 625,000 | ||||||||||||
| Jun-10 | Apr-15 | 0.42 | 2,250,000 | 3,000,000 | 3,000,000 | ||||||||||||
| Jun-10 | Apr-15 | 0.60 | 2,250,000 | 3,000,000 | 3,000,000 | ||||||||||||
| Sep-10 | Dec-14 | 0.45 | - | 997,252 | 997,252 | ||||||||||||
| Jan-11 | Dec-15 | 0.72 | 1,068,378 | 1,737,723 | |||||||||||||
| Aug-11 | Aug-16 | 0.515 | - | 254,213 | |||||||||||||
| Sep-11 | Sep-16 | 0.532 | 751,599 | 1,372,205 | |||||||||||||
| Jan-12 | Jan-17 | 0.420 | 1,250,000 | ||||||||||||||
| Feb-12 | Feb-17 | 0.520 | 3,472,872 | ||||||||||||||
| Mar-12 | Mar-17 | 0.330 | 3,015,000 | ||||||||||||||
| May-12 | May-13 | 0.320 | 150,000 | ||||||||||||||
| Total | 18,090,467 | 21,608,550 | 18,244,409 | ||||||||||||||
39
Directors' interest in the deferred share units plan
Deferred share units are held by non-executive members of the Board of Directors. Under this plan, fees are paid as deferred share units (“DSUs”) whose value is based on the market value of the common shares.
| Units | Value of units outstanding (US$) | |||||||||||||||||||||||
| Award Date | June 30, 2012 | Dec 31, 2011 | Dec 31, 2010 | June 30, 2012 | Dec 31, 2011 | Dec 31, 2010 | ||||||||||||||||||
| 14/05/2008 | 116,667 | 350,000 | 350,000 | 28,452 | 92,648 | 189,019 | ||||||||||||||||||
| 14/05/2009 | 120,690 | 362,070 | 362,070 | 29,433 | 95,843 | 195,537 | ||||||||||||||||||
| Total of deferred share units outstanding | 237,357 | 712,070 | 712,070 | 57,885 | 188,491 | 384,556 | ||||||||||||||||||
27. Commitments and Contingencies
| As at June 30, 2012 | ||||||||||||||||||||||||
| Payment Due (US$) | Total | Less than one year | Year 2 | Year 3 | Year 4 | Year 5 and thereafter | ||||||||||||||||||
| Capital lease obligations | 872,782 | 872,782 | ||||||||||||||||||||||
| Operating leases | 985,865 | 818,211 | 61,937 | 61,937 | 43,780 | |||||||||||||||||||
| Purchase obligations - supplies & services | 2,805,010 | 2,754,215 | 50,795 | |||||||||||||||||||||
| Purchase obligations - capital | 1,719,095 | 1,719,095 | ||||||||||||||||||||||
| Asset retirement obligations | 1,751,972 | 600,645 | 424,276 | 134,905 | 88,482 | 503,664 | ||||||||||||||||||
| Total | 8,134,724 | 6,764,948 | 537,008 | 196,842 | 132,262 | 503,664 | ||||||||||||||||||
In the normal course of business, the Company is subject to various legal claims. Provisions are recorded where claims are likely and estimable.
28. Financial Instruments
The Company’s activities expose it to a variety of financial risks; credit risk, interest rate risk, liquidity risk, foreign currency risk and commodity price risk. These risks arise from exposures that occur in the normal course of business and are managed by the Officers of the Company. Material risks are monitored and are regularly discussed with the Audit Committee of the Board.
40
Market and commodity price risk
The profitability of the operating subsidiaries of the Company is related to the market price of gold and silver. The Company’s market risk exposure, for metal prices and exchange rates, with respect to its accounts receivable is minimal as payment is typically received within two weeks of shipment.
During the six-month period ended June 30, 2012 the Company sold gold at the weighted average price of US$1,668 per ounce. A change of US$100 in the gold price per ounce the Company received would have changed the Company’s net income by approximately $2,071,100 in the six-month period.
The Company has entered into a redeemable promissory note arrangement that requires repayment of the principal by the physical delivery of gold into trust at regular six monthly periods until May 2013. The price of gold will determine the physical quantities of gold that need to be delivered as settlement of the liability associated with this financial arrangement. Components of the Gold Loan that exhibit characteristics of a derivative are discussed in note 19.
Foreign exchange risk
The Company operates in Canada, Vietnam, Malaysia, Australia and the Philippines. The functional and reporting currency of the parent company is the US dollar. The functional currency of significant subsidiaries is also in US dollars. The subsidiaries transact in a variety of currencies but primarily in the US dollar, Vietnamese dong and Malaysian ringgit.
The most significant transaction exposure arises in the parent Company in Canada. The balance sheet of the Parent Company includes US and Canadian dollar cash and cash equivalents and Convertible Note liabilities in Canadian dollars. The Parent Company is required to revalue the US dollar equivalent of the Canadian dollar cash and cash equivalents and liability at each period end. Foreign exchange gains and losses from these revaluations are recorded in the statement of comprehensive income (loss).
At present, the Company does not hedge foreign currency transaction or translation exposures.
The currency sensitivity analysis is based on the following assumptions:
| · | differences resulting from the translation of financial statements of subsidiaries or joint ventures into the Group’s presentation currency, US$, are not taken into consideration; |
| · | the major currency exposures for the Group relate to the US$ and local currencies of subsidiaries and joint ventures. Foreign currency exposures between two currencies where one is not the US$ are deemed insignificant to the Group and have therefore been excluded from the sensitivity analysis; |
In accordance with IFRS 7, the impact of foreign currencies has been determined based on the balances of financial assets and liabilities at June 30, 2012. This sensitivity does not represent the income statement impact that would be expected from a movement in foreign currency exchange rates over the course of a period of time.
If the US$ had gained (lost) 5 percent against all currencies significant to the Group, the impact would have been:
| Closing exchange rate | Effect on net earnings of a 5% change | Effect on equity of a 5% change | ||||||||||
| Local currency to the USD | June 30, 2012 | 2012 (6 months) | 2012 (6 months) | |||||||||
| US$ : VND | 20,829 | (330,198 | ) | (330,198 | ) | |||||||
| US$ : CAD | 1.0251 | (1,036,680 | ) | (1,036,680 | ) | |||||||
| Total | (1,366,878 | ) | (1,366,878 | ) | ||||||||
| Closing exchange rate | Effect on net earnings of a 5% change | Effect on equity of a 5% change | ||||||||||
| Local currency to the USD | December 31, 2011 | 2011 | 2011 | |||||||||
| US$ : VND | 20,829 | (71,745 | ) | (71,745 | ) | |||||||
| US$ : CAD | 1.0200 | (1,079,690 | ) | (1,079,690 | ) | |||||||
| Total | (1,151,435 | ) | (1,151,435 | ) | ||||||||
| Closing exchange rate | Effect on net earnings of a 5% change | Effect on equity of a 5% change | ||||||||||
| Local currency to the USD | December 31, 2010 | 2010 | 2010 | |||||||||
| US$ : VND | 18,932 | 382,738 | 382,738 | |||||||||
| US$ : CAD | 1.0000 | (835,729 | ) | (835,729 | ) | |||||||
| Total | (452,991 | ) | (452,991 | ) | ||||||||
41
Fair value hierarchy
The Group uses the following hierarchy for determining and disclosing the fair value of financial instruments which are measured at fair value by valuation technique:
| Level 1: | Quoted (unadjusted) prices in active markets for identical assets or liabilities. |
| Level 2: | Other techniques for which all inputs which have a significant effect on the recorded fair value are observable, either directly or indirectly. |
| Level 3: | Techniques which use inputs which have a significant effect on the recorded fair value that are not based on observable market data. |
All financial instruments measured at fair value use level 2 valuation techniques in all years.
There have been no transfers between fair value levels during the reporting period.
Interest rate risk
As at June 30, 2012, the Company holds Convertible Note liabilities that attract interest at fixed rates of 8 percent and 9 percent (refer note 21). The Company also has a redeemable promissory note arrangement associated with the delivery of gold that requires interest to be paid a fixed rate of 8 percent per annum (refer notes 19 and 20). There is no risk of the interest rate increasing for these convertible notes and the gold loan as the rates are fixed.
Credit risk
Credit risk arises from cash held with banks and financial institutions, as well as credit exposure to customers, including outstanding accounts receivable. The maximum exposure to credit risk is equal to the carrying value of the financial assets. The objective of managing counterparty credit risk is to prevent losses in financial assets. The Company assesses the credit quality of the counterparties, taking into account their financial position, past experience and other factors. The Company minimizes its exposure by holding cash and cash equivalents with two major financial institutions in Canada.
Credit risk exposure is mitigated because the Company can sell the gold it produces on many different markets and payment is typically received within two weeks of shipment. The Company’s receivables are all current.
Liquidity risk
Liquidity risk arises through excess financial obligations over available financial assets at any point in time. The Company’s objective in managing liquidity risk is to maintain sufficient readily available reserves in order to meet its liquidity requirements at any point in time. The Company achieves this by maintaining sufficient cash and cash equivalents. As at June 30, 2012, the Company was holding cash and cash equivalents of $3,397,728 (December 31, 2011 - $8,730,248; December 31, 2010: $4,105,325). A table of commitments and contractual obligations of the Company are presented in note 27.
Principal repayments on debt are due as follows:
Repayments during the year ended June 30, | ||||||||||||||||
| US$ | 2013 | 2014 | 2015 | Total | ||||||||||||
| Convertible notes-CAD 9% | 10,414,784 | 10,414,784 | ||||||||||||||
| Convertible notes-CAD 8% | 14,632,500 | 14,632,500 | ||||||||||||||
| Convertible notes-USD 8% | 14,600,000 | 14,600,000 | ||||||||||||||
| Gold loan | 9,360,000 | 9,360,000 | ||||||||||||||
| Total | 9, 360,000 | 10,414,784 | 29,232,500 | 49,007,284 | ||||||||||||
Capital management
The objective of the Group’s capital management is to safeguard the entity’s ability to continue as a going concern, so that it has the ability to provide returns for shareholders in the future and support its long-term growth strategy.
In the period, the Company has raised cash by issuing equity instruments.
The Company’s capital structure reflects the requirements of a company focused on significant growth in a capital intensive industry. The Company may face lengthy development lead times, as well as risks associated with raising capital, rising capital costs and timing of project completion because of the availability of resources, permits and other factors beyond control. The operations are also affected by potentially significant volatility of the gold mineral cycles.
The Company continually assesses the adequacy of its capital structure and makes adjustments within the context of its strategy, the mineral resources industry, economic conditions and the risk characteristics of our assets. To adjust or maintain the capital structure, the Company may obtain additional financing or issue new equity instruments.
The Company, at this stage, manages its capital structure by performing the following:
42
| · | maintaining a liquidity cushion in order to address the operational and/or industry disruptions or downturns; |
| · | preparing detailed budgets, by project, that are approved by the Board of Directors (the “Board”) for development, exploration, acquisition and corporate costs; |
| · | routine internal reporting and Board meetings to review actual versus budgeted spending; and |
| · | detailed project financial analysis to determine new funding requirements. |
As at June 30, 2012, the Company has convertible debt and gold loan debt totalling $36,416,001 (December 31, 2011: $34,508,243; December 31, 2010: $22,235,256) and a cash balance of $3,397,728 (December 31, 2011: $8,730,248; December 31, 2010: $4,105,325).
Total managed capital as at June 30, 2012 was $105,633,287 (December 31, 2011: $125,135,353; December 31, 2010: $101,601,187). The Company has no obligation to pay dividends on share capital.
| US$ | June 30, 2012 | December 31, 2011 | December 31, 2010 | |||||||||
| Current | ||||||||||||
| Interest-bearing loans and borrowings | 11,474,321 | 8,558,040 | 6,429,600 | |||||||||
| Convertible notes | 621,092 | 630,153 | 390,243 | |||||||||
| Trade and other payables | 14,323,461 | 15,891,548 | 8,033,182 | |||||||||
| Derivative financial liabilities | 3,280,000 | - | - | |||||||||
| Non-Current | ||||||||||||
| Interest-bearing loans and borrowings | - | 2,795,510 | 8,979,280 | |||||||||
| Convertible notes | 24,320,588 | 22,524,540 | 6,436,133 | |||||||||
| Derivative financial liabilities | 6,063,607 | 13,963,138 | 18,200,216 | |||||||||
| Less: | ||||||||||||
| Cash | (3,397,728 | ) | (8,730,248 | ) | (4,105,325 | ) | ||||||
| Trade and other receivables | (1,614,115 | ) | (2,022,122 | ) | (7,989,736 | ) | ||||||
| Net Debt | 55,071,226 | 53,610,559 | 36,373,593 | |||||||||
| Equity | 50,562,061 | 71,524,794 | 65,227,594 | |||||||||
| Capital and Net Debt | 105,633,287 | 125,135,353 | 101,601,187 | |||||||||
29. Income Taxes
The significant components of income tax expense for the six-month period ended June 30, 2012 and the years ended December 31, 2011 and December 31, 2010 are:
| US$,000 | June 30, 2012 | December 31, 2011 | December 31, 2010 | |||||||||
| Income tax expense | ||||||||||||
| Current tax: | ||||||||||||
| Based on taxable income for the current year | 564 | 3,810 | 2,237 | |||||||||
| Withholding tax on interest | 141 | 124 | 18 | |||||||||
| Prior year adjustment | - | 34 | - | |||||||||
| Total current taxation charge for the year | 705 | 3,968 | 2,255 | |||||||||
| Deferred tax: | ||||||||||||
| Origination and reversal of temporary differences | 694 | 213 | (620 | ) | ||||||||
| Total deferred tax charge/(credit) for the year | 694 | 213 | (620 | ) | ||||||||
| Total tax expense | 1,399 | 4,181 | 1,635 | |||||||||
43
A reconciliation between tax expense and the product of accounting profit multiplied by Olympus Pacific Mineral’s domestic tax rate for the years ended June 30, 2012, December 31, 2011 and December 31, 2010 are as follows:
| US$,000 | June 30, 2012 | December 31, 2011 | December 31, 2010 | |||||||||
| Income (loss) before income tax | (16,928 | ) | 5,825 | (11,138 | ) | |||||||
| Expected tax charge at the weighted average statutory income tax rate 16% | (2,735 | ) | 2,958 | (3,415 | ) | |||||||
| Non-deductible/(assessable) items | 756 | (384 | ) | 2,211 | ||||||||
| Benefit of current year loss not recognized | 3,149 | 1,459 | 3,281 | |||||||||
| Foreign exchange adjustments | - | (65 | ) | 160 | ||||||||
| Deferred tax on foreign exchange related to non-monetary assets | 88 | 213 | (620 | ) | ||||||||
| Withholding taxes | 141 | - | 18 | |||||||||
| Tax expense at an effective income tax rate | 1,399 | 4,181 | 1,635 | |||||||||
The above reconciling items are disclosed at the tax rates that apply in the country where they have arisen.
The weighted average statutory income tax rate is the average of the standard income tax rates applicable in the countries in which the Group operates, weighted by the profit/(loss) before tax of the subsidiaries in the respective countries as included in the consolidated accounts.
The change in the average statutory income tax rate is mainly due to the variation in the weight of subsidiaries’ profits.
Recognition of deferred tax assets
Deferred tax assets for the carry-forward of unused tax losses and unused tax credits are only recognized to the extent that it is probable that taxable profits will be available against which the unused tax losses/credits can be utilized.
Unrecognized tax losses/unrecognized deductible temporary differences
The Group has unrecognized deferred tax assets in relation to tax losses that are available to carry forward against future taxable income of the companies in which the losses arose. Deferred tax assets have not been recognized in respect of these losses as they may not be used to offset taxable profits elsewhere in the Group and they have arisen in entities for which it is not probable that there will be taxable profits in the future. The tax losses for Canada are $47,256,000 which will expire between 10 to 20 years. The tax losses for Vietnam are $19,540,000 which will expire between one to five years.
The following tax benefits related to deductible temporary differences have not been recognized:
| US$,000 | June 30, 2012 | December 31, 2011 | December 31, 2010 | |||||||||
| Non-capital loss | 66,831 | 42,021 | 34,934 | |||||||||
| Net capital losses | 1,681 | 1,267 | 165 | |||||||||
| Share Issuance costs | 1,629 | 1,936 | 2,398 | |||||||||
| Derivative Liability | 4,672 | 6,982 | 9,100 | |||||||||
| Property, Plant &Equipment | - | 119 | 216 | |||||||||
| Mineral Properties | 2,430 | 5,310 | 2,001 | |||||||||
| Total | 77,243 | 57,635 | 48,814 | |||||||||
44
Deferred Tax
The deferred tax assets/(liabilities) included on the face of the balance sheet are as follows:
| US$,000 | June 30, 2012 | December 31, 2011 | December 31, 2010 | Tax Exp 2012 | Tax Exp 2011 | Tax Exp 2010 | ||||||||||||||||||
| Deferred tax assets | ||||||||||||||||||||||||
| Mineral Properties | - | - | 254 | - | 254 | 329 | ||||||||||||||||||
| Property, Plant & Equipment | - | 121 | - | 121 | (121 | ) | - | |||||||||||||||||
| Non Capital Losses | 15 | - | - | (15 | ) | - | (254 | ) | ||||||||||||||||
| Total | 15 | 121 | 254 | 106 | 133 | 75 | ||||||||||||||||||
| Deferred tax liabilities | ||||||||||||||||||||||||
| Mineral Properties | (6,743 | ) | (6,695 | ) | (6,590 | ) | 88 | 334 | (620 | ) | ||||||||||||||
| Property, Plant & Equipment | (500 | ) | - | (254 | ) | 500 | (254 | ) | (75 | ) | ||||||||||||||
| Total | (7,243 | ) | (6,695 | ) | (6,844 | ) | 588 | 80 | (695 | ) | ||||||||||||||
Reflected in the consolidated statement of financial position as follows:
| US$,000 | June 30, 2012 | December 31, 2011 | December 31, 2010 | |||||||||
| Deferred tax asset | - | 121 | - | |||||||||
| Deferred tax liabilities | (7,228 | ) | (6,695 | ) | (6,590 | ) | ||||||
| Deferred tax liabilities, net | (7,228 | ) | (6,574 | ) | (6,590 | ) | ||||||
Deferred tax assets and liabilities denominated in foreign currencies are retranslated at year-end exchange rates.
45
30. Unaudited financial information
Unaudited condensed, comparative and consolidated financial information of the Group’s for the six-month period ended June 30, 2011.
| US$ | For the six-month period ended June 30, 2011 | |||
| Revenues | 6,749,680 | |||
| Income (Loss) before income taxes | (800,695 | ) | ||
| Income (Recovery) taxes | (7,981 | ) | ||
| Income after taxes | (792,714 | ) | ||
| Earnings/(loss) per share attributable to equity holders | ||||
| Basic | (0.002 | ) | ||
| Diluted | (0.002 | ) | ||
END OF NOTES TO FINANCIAL STATEMENTS
46