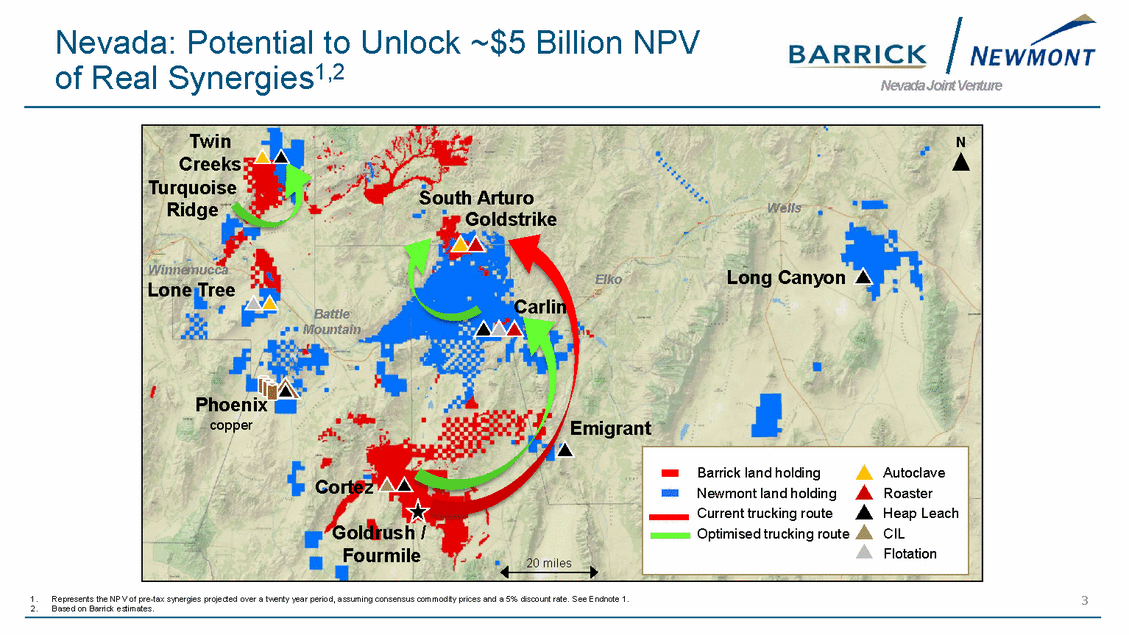
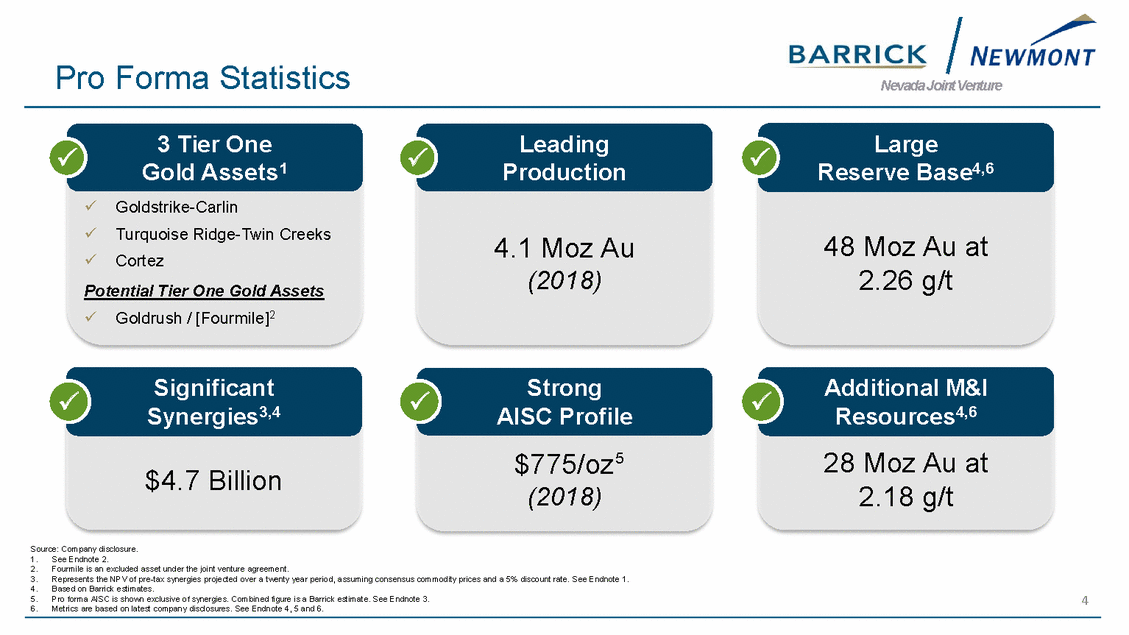
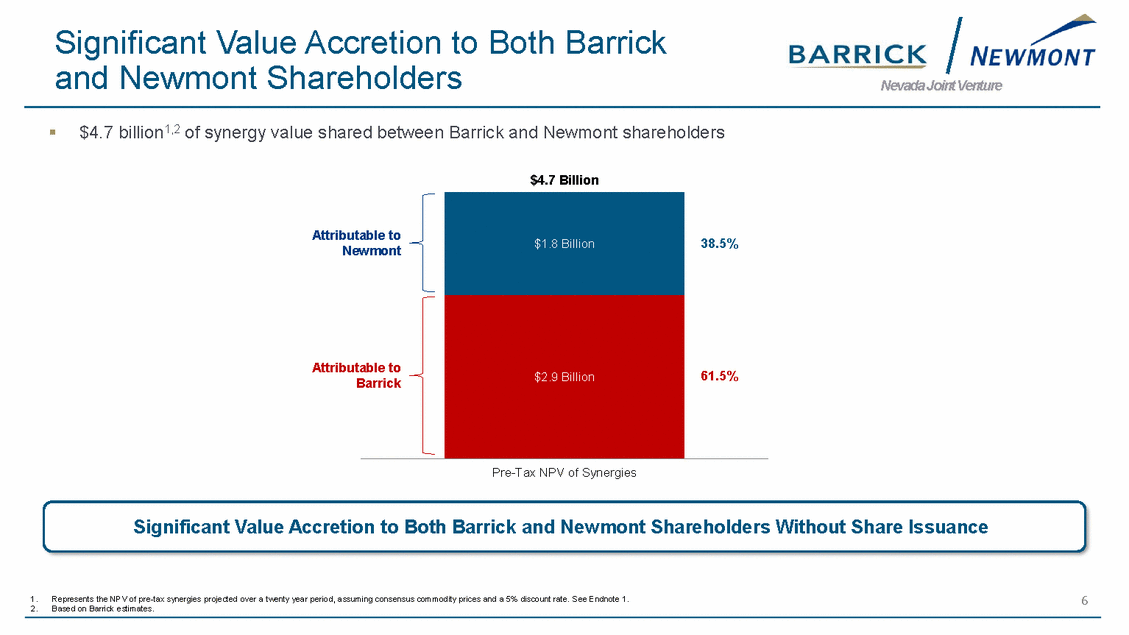
Endnotes Nevada Joint Venture 1. Synergies (or NPV of synergies) as used in this presentation is a management estimate provided for illustrative purposes, and should not be considered a GAAP/IFRS or non-GAAP/non-IFRS financial measure. "Synergies" represent management’s combined estimate of pre-tax synergies, supply chain efficiencies and cost improvements, as a result of the proposed joint venture that have been monetized and projected over a twenty year period for purposes of the estimation, applying a discount rate of 5 percent. Such estimates are necessarily imprecise and are based on numerous judgments and assumptions. Expected synergies is a “forward-looking statement” subject to risks, uncertainties and other factors which could cause actual synergies to differ from expected synergies. A Tier One Gold Asset is a mine with a stated mine life in excess of 10 years with annual production of at least five hundred thousand ounces of gold and total cash cost per ounce within the bottom half of Wood Mackenzie’s cost curve (excluding state-owned and privately owned mines). Total cash costs per ounce is based on data from Wood Mackenzie, except in respect of Barrick’s mines where Barrick relied on its internal data which is more current and reliable. The Wood Mackenzie calculation of total cash cost per ounce may not be identical to the manner in which Barrick calculates comparable measures. Total cash costs per ounce is a non-GAAP financial performance measure with no standardised meaning under IFRS and therefore may not be comparable to similar measures presented by other issuers. Total cash costs per ounce should not be considered by investors as an alternative to costs of sales or to other IFRS measures. Barrick believes that total cash cost per ounce is a useful indicator for investors and management of a mining company’s performance as it provides an indication of a company’s profitability and efficiency, the trends in cash costs as the company’s operations mature, and a benchmark of performance to allow for comparison against other companies. All-in sustaining cost (AISC) amounts presented for Barrick and Newmont are non-GAAP/non-IFRS financial performance measures with no standardized meaning under U.S. GAAP or IFRS and therefore may not be comparable to similar measures presented by other issuers. AISC as used by Newmont is defined as the sum of cost applicable to sales (including all direct and indirect costs related to current gold production incurred to execute on the current mine plan), remediation costs (including operating accretion and amortization of asset retirement costs), G&A, exploration expense, advanced projects and R&D, treatment and refining costs, other expense, net of one-time adjustments and sustaining capital. A reconciliation of Newmont’s historical AISC to CAS can be found in Item 7 of Newmont Annual Report on Form 10-K, filed with the Securities and Exchange Commission, under the heading “Non-GAAP Financial Measures.” AISC as used by Barrick is defined as cost of sales related to gold production, sustaining capital expenditures, G&A, mine-site exploration & evaluation costs and reclamation cost accretion and amortization, and removes depreciation, the non-controlling interest of cost of sales and includes by-product credits. These additional costs reflect the expenditures made to maintain current production levels. Proven and probable gold reserves and measured and indicated gold resources of Barrick in Nevada are stated on an attributable basis as of December 31, 2018 and include Goldstrike, Cortez, Goldrush, South Arturo (60%) and Turquoise Ridge (75%). Proven reserves of 84.4 million tonnes grading 4.36 g/t, representing 11.8 million ounces of gold. Probable reserves of 155.6 million tonnes grading 2.93 g/t, representing 14.7 million ounces of gold. Measured resources of 13.5 million tonnes grading 4.22 g/t, representing 1.8 million ounces of gold. Indicated resources of 101.6 million tonnes grading 4.34 g/t, representing 14.2 million ounces of gold. Measured and indicated resources are shown exclusive of reserves. Complete mineral reserve and mineral resource data for all Barrick mines and projects referenced in this presentation, including tonnes, grades, and ounces, as well as the assumptions on which the mineral reserves and resources for Barrick are reported, are set out in Barrick’s Q4 2018 Report issued on February 13, 2019. Proven and probable gold reserves and measured and indicated gold resources of Newmont in Nevada are stated on an attributable basis as of December 31, 2018 and include Carlin, Phoenix, Twin Creeks (including Newmont’s 25% equity in Turquoise Ridge) and Long Canyon. Proven reserves of 46.6 million tonnes grading 3.84 g/t, representing 5.8 million ounces of gold. Probable reserves of 378.1 million tonnes grading 1.32 g/t, representing 16.0 million ounces of gold. Measured resources of 19.7 million tonnes grading 2.19 g/t, representing 1.4 million ounces of gold. Indicated resources of 260.7 million tonnes grading 1.23 g/t, representing 10.3 million ounces of gold. Measured and indicated resources are shown exclusive of reserves. Complete mineral reserve and mineral resource data for all Newmont mines and projects referenced in this presentation, including tonnes, grades, and ounces, as well as the assumptions on which the mineral reserves and resources for Newmont are reported, are set out in Newmont’s press release dated February 21, 2019 reporting its 2018 Reserves and Resources and its annual report on Form 10-K for the fiscal year ended December 31, 2018. The potential pro forma reserves and resources figures from combining Barrick and Newmont’s operations in Nevada were derived by adding the reserves and resources reported by Barrick in its Q4 2018 Report and Newmont in its press release dated February 21, 2019 reporting its 2018 Reserves and Resources and its annual report on Form 10-K for the fiscal year ended December 31, 2018. See Endnotes 4 and 5. The pro forma reserves and resources are provided for illustrative purposes only. Barrick and Newmont calculate such figures based on different standards and assumptions, and accordingly such figures may not be directly comparable and the potential pro forma reserves and resources may be subject to adjustments due to such differing standards and assumptions. In particular, Barrick mineral reserves and resources have been prepared according to Canadian Institute of Mining, Metallurgy and Petroleum 2014 Definition Standards for Mineral Resources and Mineral Reserves as incorporated by National Instrument 43-101 – Standards of Disclosure for Mineral Projects (“NI 43-101”), which differ from the requirements of U.S. securities laws. Newmont’s reported reserves are prepared in compliance with Industry Guide 7 published by the SEC, however, the SEC does not recognise the terms “resources” and “measured and indicated resources”. According to its public disclosure, Newmont has determined that its reported “resources” would be substantively the same as those prepared using Guidelines established by the Society of Mining, Metallurgy and Exploration (SME) and defined as mineral resource. These reporting standards have similar goals in terms of conveying an appropriate level of confidence in the disclosures being reported, but embody different approaches and definitions. For example, the terms "Mineral Reserve", "Proven Mineral Reserve" and "Probable Mineral Reserve" are Canadian mining terms as defined in NI 43-101, and these definitions differ from the definitions in Industry Guide 7. Under Industry Guide 7 standards, a "final" or "bankable" feasibility study is typically required to report reserves or cash flow analysis to designate reserves. Further, under Industry Guide 7, mineralization may not be classified as a "reserve" unless the determination has been made that the mineralization could be economically and legally produced or extracted at the time the reserve determination is made. Newmont has not been involved in the preparation of Barrick’s reserve or resource estimates. Accordingly, Newmont assumes no responsibility for such estimates. No assurances can be made that all Barrick reserves under NI 43-101 will be recognized as Newmont reserves under Industry Guide 7. For more information regarding Newmont’s reserves, see Newmont’s Annual Report filed with the SEC on February 21, 2019 for the proven and probable reserve tables prepared in compliance with the SEC’s Industry Guide 7, which is available at www.sec.gov or on Newmont’s website. 2. 3. 4. 5. 6. 9
