Newmont Announces Positive 2008 Operating Results, with Continuing Improvements Expected in 2009
DENVER, January 27, 2009 – Newmont Mining Corporation (NYSE: NEM) (“Newmont” or “the Company”) today announced 2008 equity gold sales of approximately 5.2 million ounces at costs applicable to sales of $440 per ounce. With the start-up of the Boddington project in Australia in mid-2009, the Company expects continued operating performance improvements in 2009, with an equity gold sales outlook of between 5.2 and 5.5 million ounces at costs applicable to sales of between $400 and $440 per ounce. The 2009 expectations assume ownership of 100% of the Boddington project, reflecting the expected completion of the acquisition of the remaining 33.33% interest from AngloGold Ashanti Ltd., announced earlier today.
Consolidated capital expenditures for 2008 were approximately $1.9 billion, consistent with the Company’s original expectations for the year. With completion of the power plant in Nevada and the gold mill in Peru in 2008, and completion of the Boddington project expected in mid-2009, consolidated capital expenditures are expected to decline to between $1.4 and $1.6 billion ($1.3 to $1.5 billion on an equity basis).
2008 Highlights:
| | q | Equity gold sales of 5.2 million equity ounces at costs applicable to sales of $440 per ounce; |
| | q | Equity copper sales of 130 million pounds at costs applicable to sales of $1.38 per pound; |
| | q | Successful start-up of the Nevada power plant and Yanacocha gold mill; |
| | q | Successful acquisition of Miramar Mining Corporation; and |
| | q | Continued progress at the Boddington project, with start-up expected in mid-2009. |
Richard O’Brien, President and Chief Executive Officer, said, “We are pleased with the results of our initiatives to improve operating results, resulting in gold sales and costs applicable to sales performance consistent with our original expectations for the year. We achieved our goal of delivering on our plans for this year. For 2009, we expect equity gold sales to increase to between 5.2 and 5.5 million ounces at costs applicable to sales of between $400 and $440 per ounce, assuming the completion of the Boddington acquisition.”
As a result of recent financial market volatility, the value of certain investments declined during the fourth quarter of 2008, resulting in the recognition of a pre-tax charge of approximately $159 million for non-cash write-downs of marketable securities and property, plant and mine development. As of December 31, 2008, the Company’s Canadian Oil Sands Trust investment was valued at $534 million.
Exploration and Reserve Results:
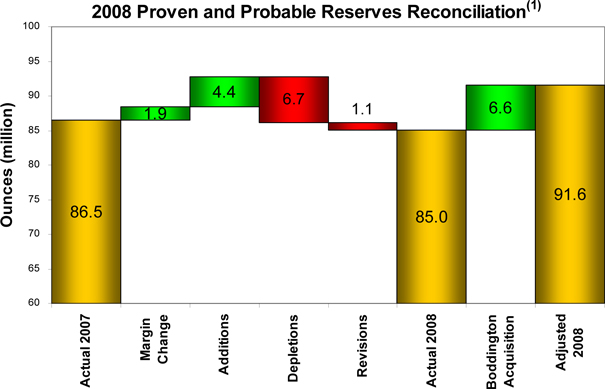
The Company reported year-end 2008 proven and probable gold reserves of 85.0 million equity ounces, compared with 86.5 million equity ounces at the end of 2007. Year-end 2008 reserves would have been 91.6 million equity ounces, an increase of approximately 6% over year-end 2007, if the expected acquisition of the remaining 33.33% interest in the Boddington project had occurred at the end of 2008.
In 2008 the Company added 6.3 million equity ounces of gold reserves due to margin changes and additional drilling, offset by revisions of 1.1 million equity ounces. The assumed gold price for the Company’s reserve calculations increased to $725 per ounce in 2008, from $575 per ounce in 2007.
| (1) | For detailed information on the Company’s year-end reserves, please refer to the Supplemental Information in this release. |
For 2008, the majority of the reserve additions from exploration of roughly 4.4 million equity ounces came from the Boddington project, and Nevada and Mexico. Gold reserves were revised downward at Phoenix in Nevada by 0.8 million ounces due to geological, modeling and metallurgical issues identified through the reconciliation process.
The Company’s reserve sensitivities to a $50 change in gold price between $725 and $775 per ounce, assuming costs remain constant, is approximately 3.0 to 4.0 million equity ounces. The Company’s ability to project reserve sensitivities at significantly higher gold prices is constrained by limited drill data.


2009 Operating Outlook:
The Company expects higher equity gold sales of between 5.2 and 5.5 million ounces at lower costs applicable to sales of between $400 and $440 per ounce in 2009. Higher gold sales are expected due to the start-up of Boddington, the anticipated 100% ownership of the Boddington project following the expected completion of the acquisition, as well as increased gold sales at Yanacocha and Batu Hijau. These increases are expected to be partially offset by lower sales in Nevada. Lower costs applicable to sales are expected due to the start-up of Boddington, higher expected gold sales from the lower cost Yanacocha and Batu Hijau operations, as well as lower oil price and Australian dollar exchange rate assumptions, partially offset by lower by-product copper price assumptions. The following table sets out the Company’s regional equity sales and costs applicable to sales outlook for 2009.
| | | 2008 Outlook | | | 2008 Actual | | | 2009 Outlook | |
| REGION | | Equity Sales (Kozs, Mlbs) | | | CAS ($/oz, $/lb) | | | Equity Sales (Kozs, Mlbs) | | | CAS ($/oz, $/lb) | | | Equity Sales (Kozs, Mlbs) | | | CAS(1) ($/oz, $/lb) | |
| Nevada | | | 2,270 – 2,400 | | | $ | 410 – $440 | | | | 2,225 | | | $ | 460 | | | | 1,800 – 2,000 | | | $ | 535 – $575 | |
| Yanacocha | | | 885 – 925 | | | $ | 350 – $370 | | | | 946 | | | $ | 346 | | | | 975 – 1,025 | | | $ | 290 – $310 | |
| Australia/NZ | | | 1,100 – 1,150 | | | $ | 585 – $625 | | | | 1,187 | | | $ | 552 | | | | 1,500 – 1,600 | | | $ | 440 – $480 | |
| Batu Hijau – Gold | | | 100 – 130 | | | $ | 360 – $400 | | | | 135 | | | $ | 414 | | | | 225 – 250 | | | $ | 240 – $260 | |
| Ahafo | | | 495 – 530 | | | $ | 400 – $450 | | | | 521 | | | $ | 408 | | | | 500 – 525 | | | $ | 450 – $475 | |
| Other Operations | | | 160 – 180 | | | $ | 480 – $520 | | | | 170 | | | $ | 566 | | | | 150 – 170 | | | $ | 465 – $480 | |
| Total Gold | | | 5,100 – 5,400 | | | $ | 425 – $450 | | | | 5,184 | | | $ | 440 | | | | 5,200 – 5,500 | | | $ | 400 – $440 | |
| Batu Hijau – Copper | | | 125 – 150 | | | $ | 1.50 - $1.75 | | | | 130 | | | $ | 1.38 | | | | 210 – 230 | | | $ | 0.65 - $0.75 | |
| (1) | The Company’s 2009 costs applicable to sales outlook assumes an average spot oil price of $70 per barrel and an Australian dollar exchange rate of 0.75. |
2009 Capital Expenditures Outlook:
The Company anticipates lower consolidated capital expenditures of between $1.4 and $1.6 billion in 2009 (between $1.3 and $1.5 billion on an equity basis), with approximately 60% invested in Australia/New Zealand, 15% in Nevada and the remaining 25% at other locations. We anticipate that approximately 45% of the 2009 capital will be allocated to sustaining investments, with the remaining 55% allocated to project development initiatives, including the completion of the Boddington project in Australia. The above ranges assume an economic interest of 100% in the Boddington project in Australia effective January 1, 2009. The following table sets out the Company’s regional capital expenditures outlook for 2009.
| Region ($ M) | | 2008 Outlook | | | 2008 Actual | | | 2009 Outlook | |
| Nevada | | $ | 300 – $350 | | | $ | 337 | | | $ | 230 – $260 | |
| Yanacocha | | $ | 200 – $250 | | | $ | 239 | | | $ | 180 – $200 | |
| Australia/NZ | | $ | 850 – $1,000 | | | $ | 962 | | | $ | 875 – $925 | |
| Batu Hijau | | $ | 80 – $120 | | | $ | 84 | | | $ | 45 – $55 | |
| Ahafo | | $ | 140 – $150 | | | $ | 117 | | | $ | 80 – $90 | |
| Corporate/Other Operations | | $ | 90 – $140 | | | $ | 136 | | | $ | 65 – $85 | |
| Consolidated Capital Expenditures | | $ | 1,700 – $2,000 | | | $ | 1,875 | | | $ | 1,400 – $1,600 | |
The Company expects to release complete financial results for the fourth quarter and year ended December 31, 2008 on Thursday, February 19, 2009.
The 2008 fourth quarter and year-end results, related financial and statistical information will be available prior to the conference call in the Investor Relations section of the Company’s web site, www.newmont.com. Additionally, the conference call will be archived for a limited time on the Company’s website.
| | | ### | | |
| | | | |
| John Seaberg | | 303.837.5743 | | john.seaberg@newmont.com |
| | | | | |
| | | | |
| Omar Jabara | | 303.837.5114 | | omar.jabara@newmont.com |
Cautionary Statement:
This news release contains “forward-looking statements” within the meaning of Section 27A of the Securities Act of 1933, as amended, and Section 21E of the Securities Exchange Act of 1934, as amended that are intended to be covered by the safe harbor created by such sections and other applicable laws. Such forward-looking statements include, without limitation, (i) estimates of gold and copper production and sales; (ii) estimates of costs applicable to sales; (iii) estimates of capital expenditures, project costs, and expenses; (iv) estimates regarding timing of future development, construction, production or closure activities; (v) statements regarding future exploration results, exploration expenditures, and reserves (vi) statements regarding potential cost savings, productivity, operating performance, cost structure and competitive position; (vii) expectations regarding the completion and timing of the Boddington acquisition; and (viii) expectations regarding the start-up time, design, mine life, production, costs applicable to sales and exploration potential of the Boddington mine. Where the Company expresses or implies an expectation or belief as to future events or results, such expectation or belief is expressed in good faith and believed to have a reasonable basis. However, forward-looking statements are subject to risks, uncertainties and other factors, which could cause actual results to differ materially from future results expressed, projected or implied by such forward-looking statements. Such risks include, but are not limited to, gold and other metals price volatility, currency fluctuations, increased production costs and variances in ore grade or recovery rates from those assumed in mining plans, political and operational risks in the countries in which we operate, and governmental regulation and judicial outcomes. For a more detailed discussion of such risks and other factors, see the Company’s 2007 Annual Report on Form 10-K, filed February 21, 2008, and the Company’s Quarterly Report on Form 10-Q, filed October 28, 2008, each of which is on file with the United States Securities and Exchange Commission (the “SEC”), as well as the Company’s other SEC filings. The Company does not undertake any obligation to release publicly revisions to any “forward-looking statement,” to reflect events or circumstances after the date of this news release, or to reflect the occurrence of unanticipated events, except as may be required under applicable securities laws.

Ian Douglas, Newmont’s Group Executive of Reserves and Geostatistics, is the qualified person responsible for the preparation of the scientific and technical information concerning its mineral properties in this press release. The reserves disclosed in this press release have been prepared in compliance with Industry Guide 7 published by the SEC. Mineralized material has not been prepared in accordance with Industry Guide 7. Newmont has determined that such reserves and mineralized material would be substantively the same as those prepared using the Guidelines established by the Canadian Institute of Mining, Metallurgy and Petroleum (“CIM”). For a description of the key assumptions, parameters and methods used to estimate mineral reserves and mineralized material on Newmont’s material properties, as well as a general discussion of the extent to which the estimates may be affected by any known environmental, permitting, legal, title, taxation, socio-political, marketing or other relevant factors, please see Newmont’s most recent Annual Report on Form 10-K and Newmont’s Management Discussion and Analysis of Financial Condition and Results of Operation, as filed from time to time, on EDGAR in the United States and on SEDAR in Canada.

Supplemental Information
Proven and Probable Gold Equity Reserves:
Equity Proven, Probable, and Combined Gold Reserves(1)
| | | December 31, 2008 | | | December 31, 2007 | |
| | | | | | Proven Reserves | | | Probable Reserves | | | Proven and Probable Reserves | | | | | | Proven + Probable Reserves | |
| | | Newmont | | | Tonnage | | | Grade | | | Gold | | | Tonnage | | | Grade | | | Gold | | | Tonnage | | | Grade | | | Gold | | | | | | Tonnage | | | Grade | | | Gold | |
Deposits/Districts by Reporting Unit | | Share | | | (000 tons) | | | (oz/ton) | | | (000 ozs) | | | (000 tons) | | | (oz/ton) | | | (000 ozs) | | | (000 tons) | | | (oz/ton) | | | (000 ozs) | | | Recovery | | | (000 tons) | | | (oz/ton) | | | (000 ozs) | |
| Nevada | | | | | | | | | | | | | | | | | | | | | | | | | | | | | | | | | | | | | | | | | | |
Carlin Open Pit(2) | | | 100 | % | | | 12,000 | | | | 0.072 | | | | 860 | | | | 190,400 | | | | 0.043 | | | | 8,190 | | | | 202,400 | | | | 0.045 | | | | 9,050 | | | | 74 | % | | | 213,500 | | | | 0.045 | | | | 9,520 | |
| Carlin Underground | | | 100 | % | | | 1,700 | | | | 0.256 | | | | 430 | | | | 10,000 | | | | 0.322 | | | | 3,220 | | | | 11,700 | | | | 0.313 | | | | 3,650 | | | | 89 | % | | | 7,200 | | | | 0.388 | | | | 2,820 | |
Midas(3) | | | 100 | % | | | 600 | | | | 0.498 | | | | 280 | | | | 300 | | | | 0.332 | | | | 110 | | | | 900 | | | | 0.436 | | | | 390 | | | | 95 | % | | | 1,000 | | | | 0.493 | | | | 530 | |
| Phoenix | | | 100 | % | | | 0 | | | | | | | | 0 | | | | 299,800 | | | | 0.021 | | | | 6,310 | | | | 299,800 | | | | 0.021 | | | | 6,310 | | | | 72 | % | | | 278,100 | | | | 0.027 | | | | 7,600 | |
| Twin Creeks | | | 100 | % | | | 9,200 | | | | 0.098 | | | | 900 | | | | 42,500 | | | | 0.072 | | | | 3,060 | | | | 51,700 | | | | 0.077 | | | | 3,960 | | | | 80 | % | | | 52,100 | | | | 0.078 | | | | 4,080 | |
Turquoise Ridge(4) | | | 25 | % | | | 1,900 | | | | 0.507 | | | | 970 | | | | 700 | | | | 0.483 | | | | 360 | | | | 2,600 | | | | 0.500 | | | | 1,330 | | | | 92 | % | | | 2,800 | | | | 0.458 | | | | 1,280 | |
Nevada In-Process(5) | | | 100 | % | | | 36,000 | | | | 0.026 | | | | 940 | | | | 0 | | | | | | | | 0 | | | | 36,000 | | | | 0.026 | | | | 940 | | | | 66 | % | | | 40,200 | | | | 0.026 | | | | 1,060 | |
Nevada Stockpiles(6) | | | 100 | % | | | 32,000 | | | | 0.075 | | | | 2,400 | | | | 2,200 | | | | 0.030 | | | | 60 | | | | 34,200 | | | | 0.072 | | | | 2,460 | | | | 78 | % | | | 32,400 | | | | 0.077 | | | | 2,480 | |
| TOTAL NEVADA | | | | | | | 93,400 | | | | 0.073 | | | | 6,780 | | | | 545,900 | | | | 0.039 | | | | 21,310 | | | | 639,300 | | | | 0.044 | | | | 28,090 | | | | 78 | % | | | 627,300 | | | | 0.047 | | | | 29,370 | |
| Yanacocha, Peru | | | | | | | | | | | | | | | | | | | | | | | | | | | | | | | | | | | | | | | | | | | | | | | | | | | | | | | | |
Conga(7) | | | 51.35 | % | | | 0 | | | | | | | | 0 | | | | 317,200 | | | | 0.019 | | | | 6,080 | | | | 317,200 | | | | 0.019 | | | | 6,080 | | | | 79 | % | | | 317,200 | | | | 0.019 | | | | 6,080 | |
Yanacocha In-Process(5) | | | 51.35 | % | | | 20,800 | | | | 0.026 | | | | 530 | | | | 0 | | | | | | | | 0 | | | | 20,800 | | | | 0.026 | | | | 530 | | | | 74 | % | | | 20,700 | | | | 0.027 | | | | 560 | |
Yanacocha Open Pits(8) | | | 51.35 | % | | | 19,200 | | | | 0.023 | | | | 430 | | | | 188,300 | | | | 0.030 | | | | 5,720 | | | | 207,500 | | | | 0.030 | | | | 6,150 | | | | 69 | % | | | 255,600 | | | | 0.029 | | | | 7,540 | |
| TOTAL YANACOCHA | | | | | | | 40,000 | | | | 0.024 | | | | 960 | | | | 505,500 | | | | 0.023 | | | | 11,800 | | | | 545,500 | | | | 0.023 | | | | 12,760 | | | | 74 | % | | | 593,500 | | | | 0.024 | | | | 14,180 | |
| Australia/New Zealand | | | | | | | | | | | | | | | | | | | | | | | | | | | | | | | | | | | | | | | | | | | | | | | | | | | | | | | | |
Boddington, Western Australia(9) | | | 66.67 | % | | | 125,500 | | | | 0.026 | | | | 3,310 | | | | 457,700 | | | | 0.022 | | | | 10,060 | | | | 583,200 | | | | 0.023 | | | | 13,370 | | | | 81 | % | | | 476,900 | | | | 0.023 | | | | 11,090 | |
| Jundee, Western Australia | | | 100 | % | | | 3,500 | | | | 0.096 | | | | 340 | | | | 2,800 | | | | 0.337 | | | | 930 | | | | 6,300 | | | | 0.202 | | | | 1,270 | | | | 91 | % | | | 6,700 | | | | 0.222 | | | | 1,490 | |
| Kalgoorlie Open Pits and Underground | | | 50 | % | | | 23,100 | | | | 0.061 | | | | 1,410 | | | | 40,600 | | | | 0.063 | | | | 2,560 | | | | 63,700 | | | | 0.062 | | | | 3,970 | | | | 85 | % | | | 66,100 | | | | 0.063 | | | | 4,170 | |
Kalgoorlie Stockpiles(6) | | | 50 | % | | | 14,400 | | | | 0.031 | | | | 450 | | | | 0 | | | | | | | | 0 | | | | 14,400 | | | | 0.031 | | | | 450 | | | | 76 | % | | | 13,500 | | | | 0.031 | | | | 420 | |
| Total Kalgoorlie, Western Australia | | | 50 | % | | | 37,500 | | | | 0.049 | | | | 1,860 | | | | 40,600 | | | | 0.063 | | | | 2,560 | | | | 78,100 | | | | 0.056 | | | | 4,420 | | | | 84 | % | | | 79,600 | | | | 0.058 | | | | 4,590 | |
| Waihi, New Zealand | | | 100 | % | | | 300 | | | | 0.267 | | | | 80 | | | | 2,600 | | | | 0.107 | | | | 280 | | | | 2,900 | | | | 0.124 | | | | 360 | | | | 89 | % | | | 3,800 | | | | 0.131 | | | | 500 | |
| Tanami Underground and Open Pits | | | 100 | % | | | 4,000 | | | | 0.167 | | | | 660 | | | | 5,600 | | | | 0.136 | | | | 760 | | | | 9,600 | | | | 0.149 | | | | 1,420 | | | | 96 | % | | | 11,400 | | | | 0.141 | | | | 1,600 | |
Tanami Stockpiles(6) | | | 100 | % | | | 0 | | | | 0.153 | | | | 0 | | | | 1,900 | | | | 0.029 | | | | 60 | | | | 1,900 | | | | 0.030 | | | | 60 | | | | 94 | % | | | 1,900 | | | | 0.045 | | | | 90 | |
| Total Tanami, Northern Territories | | | 100 | % | | | 4,000 | | | | 0.167 | | | | 660 | | | | 7,500 | | | | 0.108 | | | | 820 | | | | 11,500 | | | | 0.129 | | | | 1,480 | | | | 96 | % | | | 13,300 | | | | 0.127 | | | | 1,690 | |
| TOTAL AUSTRALIA/NEW ZEALAND | | | | | | | 170,800 | | | | 0.037 | | | | 6,250 | | | | 511,200 | | | | 0.029 | | | | 14,650 | | | | 682,000 | | | | 0.031 | | | | 20,900 | | | | 83 | % | | | 580,300 | | | | 0.033 | | | | 19,360 | |
Batu Hijau(10) | | | 45 | % | | | 166,000 | | | | 0.013 | | | | 2,110 | | | | 182,800 | | | | 0.009 | | | | 1,570 | | | | 348,800 | | | | 0.011 | | | | 3,680 | | | | 76 | % | | | 378,900 | | | | 0.010 | | | | 3,830 | |
Batu Hijau Stockpiles(6)(10) | | | 45 | % | | | 0 | | | | | | | | 0 | | | | 131,400 | | | | 0.003 | | | | 410 | | | | 131,400 | | | | 0.003 | | | | 410 | | | | 72 | % | | | 114,300 | | | | 0.004 | | | | 410 | |
| TOTAL BATU HIJAU | | | | | | | 166,000 | | | | 0.013 | | | | 2,110 | | | | 314,200 | | | | 0.006 | | | | 1,980 | | | | 480,200 | | | | 0.009 | | | | 4,090 | | | | 76 | % | | | 493,200 | | | | 0.009 | | | | 4,240 | |
| Ghana, West Africa | | | | | | | | | | | | | | | | | | | | | | | | | | | | | | | | | | | | | | | | | | | | | | | | | | | | | | | | |
Ahafo(11) | | | 100 | % | | | 5,900 | | | | 0.039 | | | | 230 | | | | 119,200 | | | | 0.077 | | | | 9,150 | | | | 125,100 | | | | 0.075 | | | | 9,380 | | | | 87 | % | | | 124,000 | | | | 0.078 | | | | 9,720 | |
Akyem(12) | | | 100 | % | | | 0 | | | | | | | | 0 | | | | 147,200 | | | | 0.052 | | | | 7,660 | | | | 147,200 | | | | 0.052 | | | | 7,660 | | | | 89 | % | | | 147,200 | | | | 0.052 | | | | 7,660 | |
| TOTAL GHANA | | | | | | | 5,900 | | | | 0.039 | | | | 230 | | | | 266,400 | | | | 0.063 | | | | 16,810 | | | | 272,300 | | | | 0.063 | | | | 17,040 | | | | 88 | % | | | 271,200 | | | | 0.064 | | | | 17,380 | |
| Other Operations | | | | | | | | | | | | | | | | | | | | | | | | | | | | | | | | | | | | | | | | | | | | | | | | | | | | | | | | |
| Kori Kollo, Bolivia | | | 88 | % | | | 9,100 | | | | 0.018 | | | | 160 | | | | 2,400 | | | | 0.014 | | | | 30 | | | | 11,500 | | | | 0.017 | | | | 190 | | | | 52 | % | | | 25,200 | | | | 0.017 | | | | 420 | |
| La Herradura, Mexico | | | 44 | % | | | 36,900 | | | | 0.025 | | | | 910 | | | | 39,200 | | | | 0.025 | | | | 980 | | | | 76,100 | | | | 0.025 | | | | 1,890 | | | | 66 | % | | | 67,700 | | | | 0.023 | | | | 1,580 | |
| TOTAL OTHER OPERATIONS | | | | | | | 46,000 | | | | 0.023 | | | | 1,070 | | | | 41,600 | | | | 0.024 | | | | 1,010 | | | | 87,600 | | | | 0.024 | | | | 2,080 | | | | 65 | % | | | 92,900 | | | | 0.022 | | | | 2,000 | |
| TOTAL NEWMONT WORLDWIDE | | | | | | | 522,100 | | | | 0.033 | | | | 17,400 | | | | 2,184,800 | | | | 0.031 | | | | 67,560 | | | | 2,706,900 | | | | 0.031 | | | | 84,960 | | | | 80 | % | | | 2,658,400 | | | | 0.033 | | | | 86,530 | |
| (1) | Reserves are calculated at a gold price of US$725, A$850, or NZ$1,000 per ounce unless otherwise noted. 2007 reserves were calculated at a gold price of US$575, A$750, or NZ$850 per ounce unless otherwise noted. Tonnage amounts have been rounded to the nearest 100,000 unless they are less than 50,000, and gold ounces have been rounded to the nearest 10,000. Varying cut-off grades have been used for the calculation of reserves depending on the mine or project, ore type and costs. |
| Includes undeveloped reserves at Castle Reef, North Lantern and Emigrant deposits for combined total undeveloped reserves of 1.4 million ounces. |
| Also contains reserves of 5.9 million ounces of silver with a metallurgical recovery of 88%. |
| Reserve estimates provided by Barrick, the operator of the Turquoise Ridge Joint Venture. Barrick estimated reserves using a gold price of US$725. |
| In-process material is the material on leach pads at the end of each year from which gold remains to be recovered. In-process material reserves are reported separately where tonnage or contained ounces are greater than 5% of the total site-reported reserves and contained ounces are greater than 100,000. |
| Stockpiles are comprised primarily of material that has been set aside to allow processing of higher grade material in the mills. Stockpiles increase or decrease depending on current mine plans. Stockpile reserves are reported separately where tonnage or contained ounces are greater than 5% of the total site-reported reserves and contained ounces are greater than 100,000. |
| Deposit is currently undeveloped. |
| Reserves include the currently undeveloped deposit at Corimayo, which contains undeveloped reserves of 1.2 million equity ounces. |
| Deposit is currently being developed. Production is expected to begin in 2009. |
| 45% reflects Newmont's ownership in PTNNT at year-end 2008. |
| Includes undeveloped reserves at Amoma, Yamfo South, Yamfo Central, Techire West, Subenso South, Subenso North, Yamfo Northeast, and Susuan totaling 3.7 million ounces. |
| Deposit is undeveloped. |

Gold Non-Reserve Mineralization:
Equity Gold Mineralized Material Not in Reserves(1)(2)
December 31, 2008
| | | | | | | | | Indicated Material | | | Measured + Indicated Material | | | Inferred Material | |
| | | Newmont | | | Tonnage | | | Grade | | | Tonnage | | | Grade | | | Tonnage | | | Grade | | | Tonnage | | | Grade | |
| Deposits/Districts | | Share | | | (000 tons) | | | (oz/ton) | | | (000 tons) | | | (oz/ton) | | | (000 tons) | | | (oz/ton) | | | (000 tons) | | | (oz/ton) | |
| Nevada | | | | | | | | | | | | | | | | | | | | | | | | | | | |
| Carlin Trend Open Pit | | | 100 | % | | | 7,400 | | | | 0.055 | | | | 81,000 | | | | 0.038 | | | | 88,400 | | | | 0.040 | | | | 21,100 | | | | 0.023 | |
| Carlin Trend Underground | | | 100 | % | | | 300 | | | | 0.329 | | | | 40 | | | | 0.352 | | | | 340 | | | | 0.33 | | | | 3,100 | | | | 0.327 | |
| Lone Tree Complex | | | 100 | % | | | 0 | | | | | | | | 4,200 | | | | 0.022 | | | | 4,200 | | | | 0.022 | | | | 0 | | | | | |
| Midas | | | 100 | % | | | 100 | | | | 0.176 | | | | 100 | | | | 0.194 | | | | 200 | | | | 0.186 | | | | 100 | | | | 0.321 | |
| Phoenix | | | 100 | % | | | 0 | | | | 0.000 | | | | 61,600 | | | | 0.015 | | | | 61,600 | | | | 0.015 | | | | 34,000 | | | | 0.019 | |
| Twin Creeks | | | 100 | % | | | 3,200 | | | | 0.099 | | | | 27,900 | | | | 0.045 | | | | 31,100 | | | | 0.051 | | | | 10,800 | | | | 0.018 | |
Turquoise Ridge (3) | | | 25 | % | | | 600 | | | | 0.436 | | | | 300 | | | | 0.434 | | | | 900 | | | | 0.435 | | | | 1,100 | | | | 0.505 | |
Nevada Stockpiles (4) | | | 100 | % | | | 3,700 | | | | 0.060 | | | | | | | | | | | | 3,700 | | | | 0.060 | | | | 2,400 | | | | 0.043 | |
| Total Nevada | | | | | | | 15,300 | | | | 0.085 | | | | 175,140 | | | | 0.032 | | | | 190,440 | | | | 0.036 | | | | 72,600 | | | | 0.042 | |
| Yanacocha, Peru | | | | | | | | | | | | | | | | | | | | | | | | | | | | | | | | | | | | |
| Conga | | | 51.35 | % | | | 0 | | | | | | | | 58,000 | | | | 0.013 | | | | 58,000 | | | | 0.013 | | | | 79,000 | | | | 0.011 | |
La Zanja(5) | | | 46.9 | % | | | 0 | | | | | | | | 18,000 | | | | 0.021 | | | | 18,000 | | | | 0.021 | | | | 0 | | | | | |
| Yanacocha | | | 51.35 | % | | | 3,900 | | | | 0.016 | | | | 146,800 | | | | 0.020 | | | | 150,700 | | | | 0.020 | | | | 34,600 | | | | 0.018 | |
| Total Yanacocha | | | | | | | 3,900 | | | | 0.016 | | | | 222,800 | | | | 0.018 | | | | 226,700 | | | | 0.018 | | | | 113,600 | | | | 0.013 | |
| Australia/New Zealand | | | | | | | | | | | | | | | | | | | | | | | | | | | | | | | | | | | | |
| Boddington, Western Australia | | | 66.67 | % | | | 17,900 | | | | 0.010 | | | | 230,000 | | | | 0.015 | | | | 247,900 | | | | 0.015 | | | | 131,800 | | | | 0.017 | |
| Jundee, Western Australia | | | 100 | % | | | 0 | | | | | | | | 100 | | | | 0.137 | | | | 100 | | | | 0.137 | | | | 4,400 | | | | 0.066 | |
| Kalgoorlie, Western Australia | | | 50 | % | | | 3,000 | | | | 0.060 | | | | 5,000 | | | | 0.056 | | | | 8,000 | | | | 0.057 | | | | 1,600 | | | | 0.136 | |
| Waihi, New Zealand | | | 100 | % | | | 0 | | | | | | | | 3,100 | | | | 0.134 | | | | 3,100 | | | | 0.134 | | | | 300 | | | | 0.146 | |
| Tanami, Northern Territory | | | 100 | % | | | 1,400 | | | | 0.110 | | | | 2,800 | | | | 0.136 | | | | 4,200 | | | | 0.127 | | | | 7,600 | | | | 0.180 | |
| TOTAL AUSTRALIA/NEW ZEALAND | | | | | | | 22,300 | | | | 0.023 | | | | 241,000 | | | | 0.019 | | | | 263,300 | | | | 0.019 | | | | 145,700 | | | | 0.028 | |
| Batu Hijau, Indonesia | | | | | | | | | | | | | | | | | | | | | | | | | | | | | | | | | | | | |
Batu Hijau (6) | | | 45.000 | % | | | 5,100 | | | | 0.001 | | | | 29,100 | | | | 0.001 | | | | 34,200 | | | | 0.001 | | | | 4,400 | | | | 0.001 | |
| TOTAL BATU HIJAU | | | | | | | 5,100 | | | | 0.001 | | | | 29,100 | | | | 0.001 | | | | 34,200 | | | | 0.001 | | | | 4,400 | | | | 0.001 | |
| Ghana, West Africa | | | | | | | | | | | | | | | | | | | | | | | | | | | | | | | | | | | | |
| Ahafo | | | 100 | % | | | 1,100 | | | | 0.028 | | | | 71,600 | | | | 0.061 | | | | 72,700 | | | | 0.060 | | | | 19,100 | | | | 0.120 | |
| Akyem | | | 100 | % | | | 0 | | | | | | | | 11,600 | | | | 0.048 | | | | 11,600 | | | | 0.048 | | | | 4,600 | | | | 0.047 | |
| TOTAL AFRICA | | | | | | | 1,100 | | | | 0.028 | | | | 83,200 | | | | 0.059 | | | | 84,300 | | | | 0.059 | | | | 23,700 | | | | 0.106 | |
| Other Operations and Projects | | | | | | | | | | | | | | | | | | | | | | | | | | | | | | | | | | | | |
| Kori Kollo, Bolivia | | | 88 | % | | | 1,000 | | | | 0.020 | | | | 900 | | | | 0.017 | | | | 1,900 | | | | 0.020 | | | | 900 | | | | 0.013 | |
| La Herradura, Mexico | | | 44 | % | | | 5,100 | | | | 0.020 | | | | 7,200 | | | | 0.019 | | | | 12,300 | | | | 0.019 | | | | 35,500 | | | | 0.020 | |
| TOTAL OTHER OPERATIONS AND PROJECTS | | | 6,100 | | | | 0.020 | | | | 8,100 | | | | 0.019 | | | | 14,200 | | | | 0.019 | | | | 36,400 | | | | 0.020 | |
| TOTAL NEWMONT WORLDWIDE | | | | | | | 53,800 | | | | 0.038 | | | | 759,340 | | | | 0.025 | | | | 813,140 | | | | 0.026 | | | | 396,400 | | | | 0.030 | |
| Mineralized material is reported exclusive of reserves. |
| Mineralized material is calculated at a gold price of US$850, A$1,000, or NZ$1,175 per ounce unless otherwise noted. 2007 mineralized material was calculated at a gold price of US$625, A$800, or NZ$950 per ounce. Tonnage amounts have been rounded to the nearest 100,000. Varying cut-off grades have been used for the calculation of mineralized material depending on the mine or project, ore type and costs. |
| Mineralized material estimates were provided by Barrick, the operator of the Turquoise Ridge Joint Venture. Barrick calculated mineralized material not in reserves assuming a gold price of US$850 per ounce. |
| Stockpiles are comprised primarily of material that has been set aside to allow processing of higher grade material in the mills. Stockpiles increase or decrease depending on current mine plans. |
| Mineralized material estimates were provided by Buenaventura, the operator of the La Zanja Project. Buenaventura calculated mineralized material at a gold price of US$525 per ounce. |
| 45% reflects Newmont's ownership in PTNNT at year-end 2008. |
Copper Proven and Probable Equity Reserves:
Equity Copper Reserves(1)
| | | December 31, 2008 | | | December 31, 2007 | |
| | | | | | Proven Reserves | | | Probable Reserves | | | Proven + Probable Reserves | | | | | | Proven + Probable Reserve | |
| | | Newmont | | | Tonnage | | | Grade | | | Copper (million | | | Tonnage | | | Grade | | | Copper (million | | | Tonnage | | | Grade | | | Copper (million | | | Metallurgical | | | Tonnage | | | Grade | | | Copper (million | |
| Deposits/Districts | | Share | | | (000 tons) | | | (Cu%) | | | pounds) | | | (000 tons) | | | (Cu%) | | | pounds) | | | (000 tons) | | | (Cu%) | | | pounds) | | | Recovery | | | (000 tons) | | | (Cu%) | | | pounds) | |
| | | | | | | | | | | | | | | | | | | | | | | | | | | | | | | | | | | | | |
Batu Hijau(2) | | | 45 | % | | | 166,000 | | | | 0.48 | % | | | 1,600 | | | | 182,800 | | | | 0.40 | % | | | 1,460 | | | | 348,800 | | | | 0.44 | % | | | 3,060 | | | | 77 | % | | | 378,900 | | | | 0.43 | % | | | 3,300 | |
Batu Hijau, Stockpiles(2)(3) | | | 45 | % | | | 0 | | | | | | | | 0 | | | | 131,400 | | | | 0.34 | % | | | 890 | | | | 131,400 | | | | 0.34 | % | | | 890 | | | | 67 | % | | | 114,300 | | | | 0.36 | % | | | 820 | |
| Batu Hijau, Indonesia | | | 45 | % | | | 166,000 | | | | 0.48 | % | | | 1,600 | | | | 314,200 | | | | 0.37 | % | | | 2,350 | | | | 480,200 | | | | 0.41 | % | | | 3,950 | | | | 75 | % | | | 493,200 | | | | 0.42 | % | | | 4,120 | |
Boddington, Western Australia(4) | | | 66.67 | % | | | 125,500 | | | | 0.11 | % | | | 280 | | | | 457,700 | | | | 0.11 | % | | | 1,000 | | | | 583,200 | | | | 0.11 | % | | | 1,280 | | | | 83 | % | | | 476,500 | | | | 0.11 | % | | | 1,030 | |
Conga, Peru(5) | | | 51.35 | % | | | 0 | | | | | | | | 0 | | | | 317,200 | | | | 0.26 | % | | | 1,660 | | | | 317,200 | | | | 0.26 | % | | | 1,660 | | | | 85 | % | | | 317,200 | | | | 0.26 | % | | | 1,660 | |
| Phoenix, Nevada | | | 100 | % | | | 0 | | | | | | | | 0 | | | | 302,000 | | | | 0.15 | % | | | 890 | | | | 302,000 | | | | 0.15 | % | | | 890 | | | | 61 | % | | | 279,600 | | | | 0.13 | % | | | 740 | |
| TOTAL NEWMONT WORLDWIDE | | | | | | | 291,500 | | | | 0.32 | % | | | 1,880 | | | | 1,391,100 | | | | 0.21 | % | | | 5,900 | | | | 1,682,600 | | | | 0.23 | % | | | 7,780 | | | | 77 | % | | | 1,566,500 | | | | 0.24 | % | | | 7,550 | |
| Reserves are calculated at US$2.00 or A$2.40 per pound copper price unless otherwise noted. 2007 reserves were calculated at US$1.75 or A$2.00 per pound copper price unless otherwise noted. Tonnage amounts have been rounded to the nearest 100,000 and pounds have been rounded to the nearest 10 million. Varying cut-off grades have been used for the calculation of reserves depending on the mine or project, ore type and costs. |
| 45% reflects Newmont's ownership in PTNNT at year-end 2008. |
| Stockpiles are comprised primarily of material that has been set aside to allow processing of higher grade material. Stockpiles increase or decrease depending on current mine plans. Stockpiles are reported separately where tonnage or contained metal are greater than 5% of the total site reported reserves. |
| Deposit currently being developed. |
Copper Non-Reserve Mineralization:
Equity Copper Mineralized Material Not in Reserves(1)(2)
| | | | | | Measured Material | | | Indicated Material | | | Measured + Indicated Material | | | Inferred Material | |
| | | Newmont | | | Tonnage | | | Grade | | | Tonnage | | | Grade | | | Tonnage | | | Grade | | | Tonnage | | | Grade | |
| Deposits/Districts | | Share | | | (000 tons) | | | (Cu%) | | | (000 tons) | | | (Cu%) | | | (000 tons) | | | (Cu%) | | | (000 tons) | | | (Cu%) | |
| | | | | | | | | | | | | | | | | | | | | | | | | | | | |
Batu Hijau, Indonesia (3) | | | 45 | % | | | 5,100 | | | | 0.18 | % | | | 29,100 | | | | 0.18 | % | | | 34,200 | | | | 0.18 | % | | | 4,400 | | | | 0.22 | % |
| Boddington, Western Australia | | | 66.67 | % | | | 17,900 | | | | 0.07 | % | | | 230,000 | | | | 0.09 | % | | | 247,900 | | | | 0.09 | % | | | 131,800 | | | | 0.10 | % |
| Conga, Peru | | | 51.35 | % | | | 0 | | | | 0.00 | % | | | 58,000 | | | | 0.18 | % | | | 58,000 | | | | 0.18 | % | | | 79,000 | | | | 0.17 | % |
| Phoenix, Nevada | | | 100 | % | | | 0 | | | | 0.00 | % | | | 91,700 | | | | 0.20 | % | | | 91,700 | | | | 0.20 | % | | | 95,953 | | | | 0.23 | % |
| TOTAL NEWMONT WORLDWIDE | | | | | | | 23,000 | | | | 0.09 | % | | | 408,800 | | | | 0.13 | % | | | 431,800 | | | | 0.13 | % | | | 311,153 | | | | 0.16 | % |
| Mineralized material is reported exclusive of reserves. |
| Mineralized material is calculated at a copper price of US$2.50 or A$3.00 per pound unless otherwise noted. 2007 mineralized material was calculated at a copper price of US$2.00 or A$2.50 per pound. Tonnage amounts have been rounded to the nearest 100,000. Varying cut-off grades have been used for the calculation of mineralized material depending on the mine or project, ore type and costs. |
| 45% reflects Newmont's ownership in PTNNT at year-end 2008. |