Exhibit 99.1
Exhibit 99.1
Take Stock in Gold
Wayne W. Murdy
Chairman & Chief Executive Officer
Merrill Lynch Global Metals, Mining & Steel Conference
Boston, MA
May 12, 2004
CAUTIONARY STATEMENT
PRIVATE SECURITIES LITIGATION REFORM ACT SAFE HARBOR STATEMENT
This presentation contains “forward-looking statements” within the meaning of Section 27A of the Securities Act of 1933, as amended, and Section 21E of the Securities Exchange Act of 1934, as amended, that are intended to be covered by the safe harbor created by such sections. Such forward-looking statements include, without limitation, (i) statements regarding future earnings, and the sensitivity of earnings to the gold and other metals prices; (ii) estimates of future gold and other metals production and sales; (iii) estimates of future cash costs and total production costs; (iv) statements of future cash flows, and the sensitivity of cash flows to the gold and other metals prices; (v) estimates of future capital expenditures, expenses and tax rates; (vi) estimates regarding timing of future production or closure activities; (vii) statements regarding future exploration results and the replacement of reserves; (viii) statements regarding future asset sales or rationalization efforts; and (ix) estimates of future royalty revenues Where the Company expresses or implies an expectation or belief as to future events or results, such expectation or belief is expressed in good faith and believed to have a reasonable basis. However, forward-looking statements are subject to risks, uncertainties and other factors, which could cause actual results to differ materially from future results expressed, projected or implied by such forward-looking statements. Such risks include, but are not limited to, gold and other metals price volatility, currency fluctuations, increased production costs and variances in ore grade or recovery rates from those assumed in mining plans, political and operational risks in the countries in which we operate, and governmental regulation and judicial outcomes. For a more detailed discussion of such risks and other factors, see the Company’s 2003 Annual Report on Form 10-K, which is on file with the Securities and Exchange Commission, as well as the Company’s other SEC filings. The Company does not undertake any obligation to release publicly revisions to any “forward-looking statement,” to reflect events or circumstances after the date of this news release, or to reflect the occurrence of unanticipated events, except as may be required under applicable securities laws.
May 12, 2004—Slide 2
Introduction
Outline
•Strategic Overview
•Gold Fundamentals
•Operating & Financial Results
•2004 Guidance
•Reserves and Exploration
•Conclusion
May 12, 2004—Slide 3
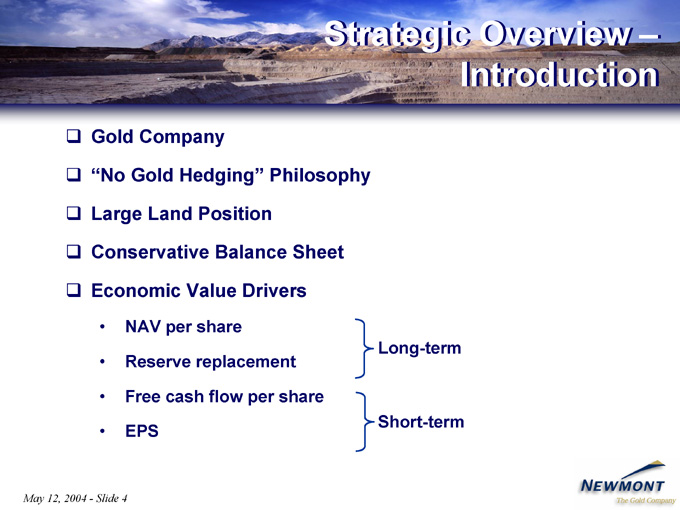
Strategic Overview –Introduction
Gold Company
“No Gold Hedging” Philosophy Large
Land Position
Conservative Balance Sheet
Economic Value Drivers
NAV per share
Long-term
Reserve replacement
Free cash flow per share Short-term
EPS
May 12, 2004—Slide 4
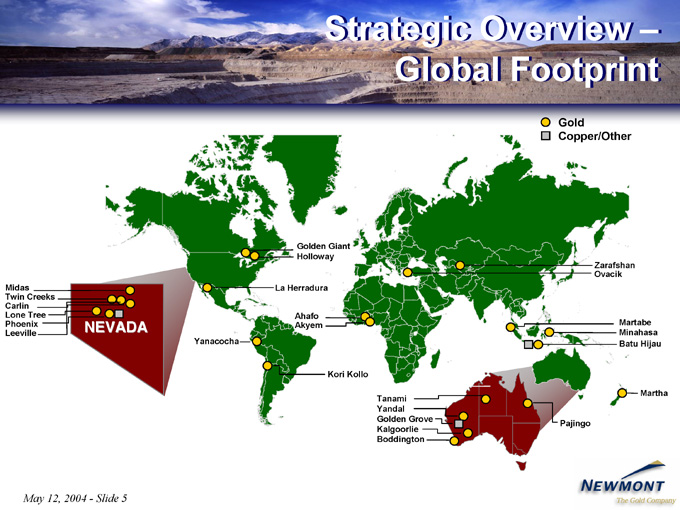
Strategic Overview –Global Footprint
Gold
Copper/Other
Midas
Twin Creeks
Carlin
Lone Tree
Phoenix NEVADA
Leeville
May 12, 2004—Slide 5
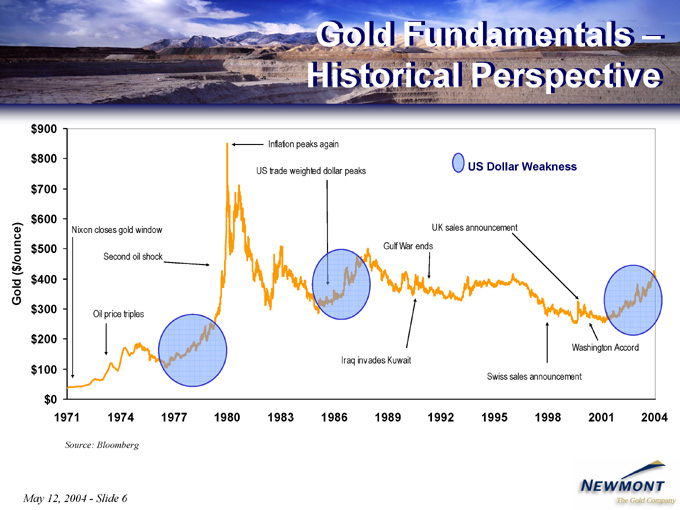
Gold Fundamentals – Historical Perspective
Source: Bloomberg
May 12, 2004—Slide 6
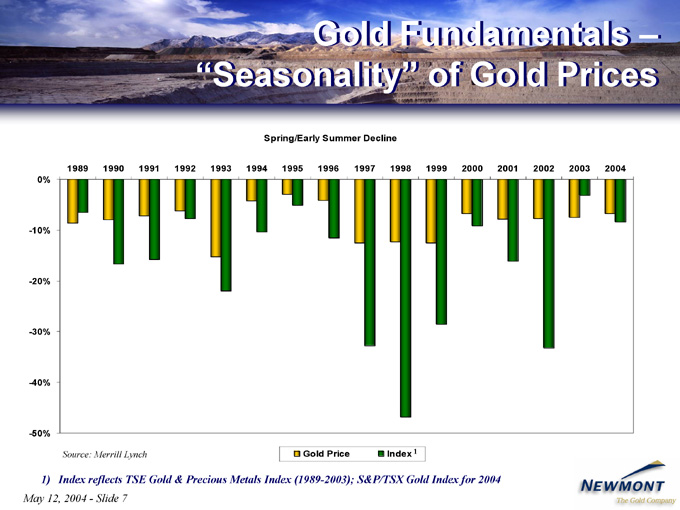
Gold Fundamentals –”Seasonality” of Gold Prices
Spring/Early Summer Decline
Source: Merrill Lynch Gold Price Index 1
1) Index reflects TSE Gold & Precious Metals Index (1989-2003); S&P/TSX Gold Index for 2004
May 12, 2004—Slide 7
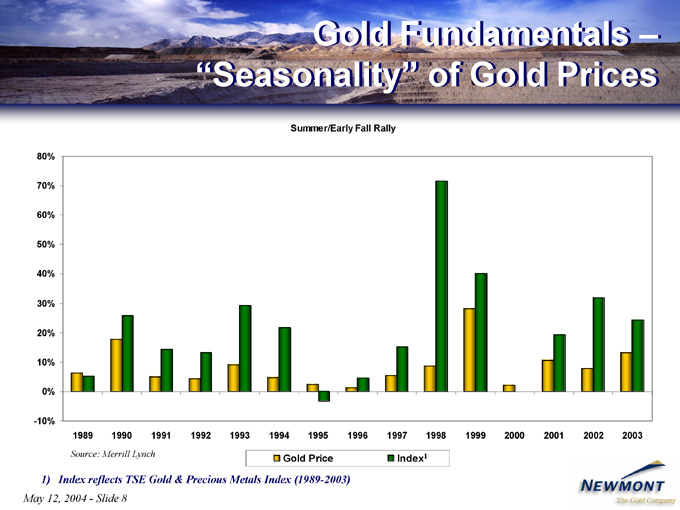
Gold Fundamentals –”Seasonality” of Gold Prices
Summer/Early Fall Rally
Source: Merrill Lynch Gold Price Index1
1) Index reflects TSE Gold & Precious Metals Index (1989-2003)
May 12, 2004—Slide 8
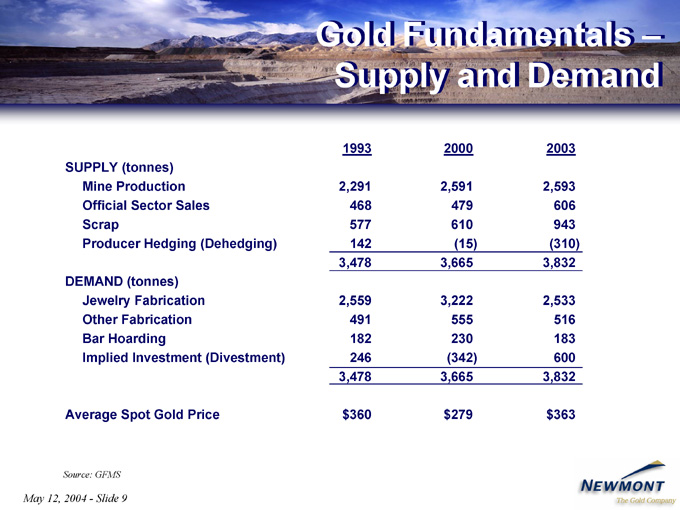
Gold Fundamentals – Supply and Demand
1993 2000 2003
SUPPLY (tonnes)
Mine Production 2,291 2,591 2,593
Official Sector Sales 468 479 606
Scrap 577 610 943
Producer Hedging (Dehedging) 142 (15) (310)
3,478 3,665 3,832
DEMAND (tonnes)
Jewelry Fabrication 2,559 3,222 2,533
Other Fabrication 491 555 516
Bar Hoarding 182 230 183
Implied Investment (Divestment) 246 (342) 600
3,478 3,665 3,832
Average Spot Gold Price $360 $279 $363
Source: GFMS
May 12, 2004—Slide 9
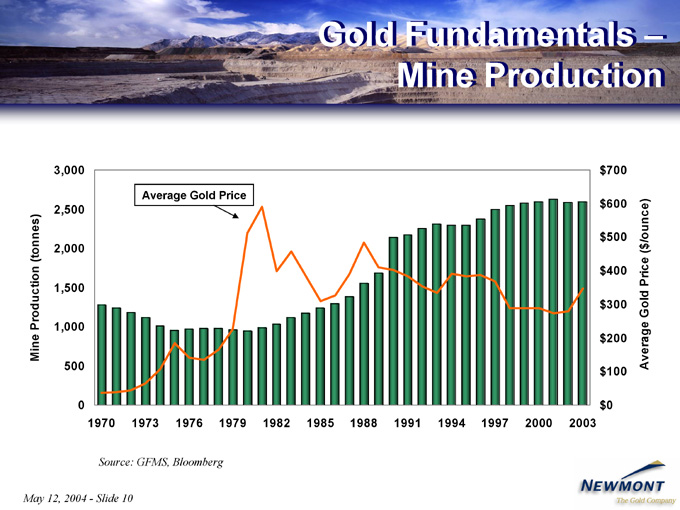
Gold Fundamentals – Mine Production
Source: GFMS, Bloomberg
May 12, 2004—Slide 10
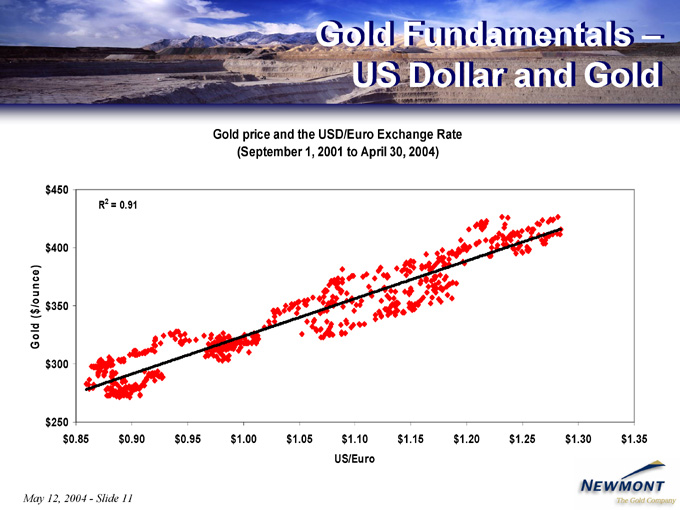
Gold Fundamentals – US Dollar and Gold
Gold price and the USD/Euro Exchange Rate
(September 1, 2001 to April 30, 2004)
US/Euro
May 12, 2004—Slide 11
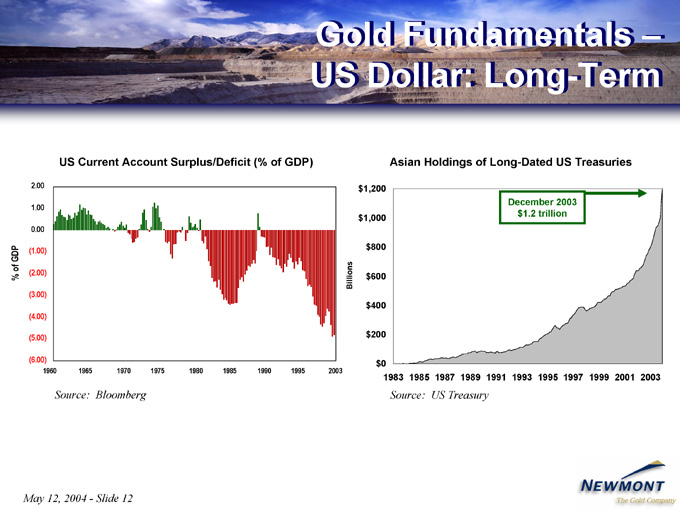
Gold Fundamentals – US Dollar: Long-Term -
US Current Account Surplus/Deficit (% of GDP)
Source: Bloomberg
Asian Holdings of Long-Dated US Treasuries
December 2003 $1.2 trillion
Source: US Treasury
May 12, 2004—Slide 12
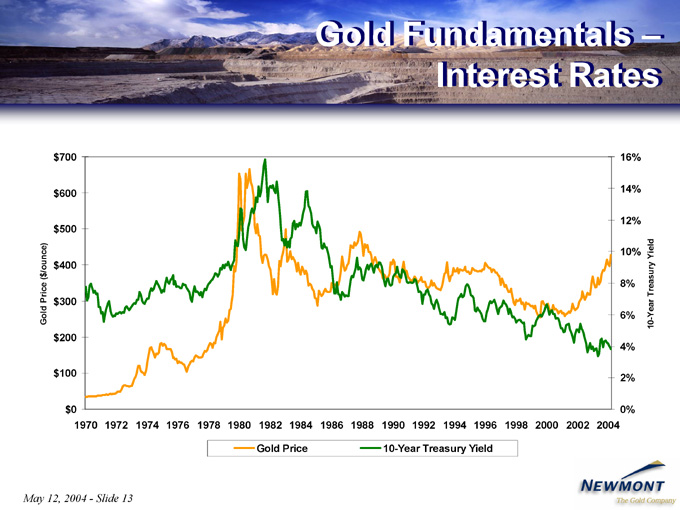
Gold Fundamentals – Interest Rates
Gold Price 10-Year Treasury Yield
May 12, 2004—Slide 13
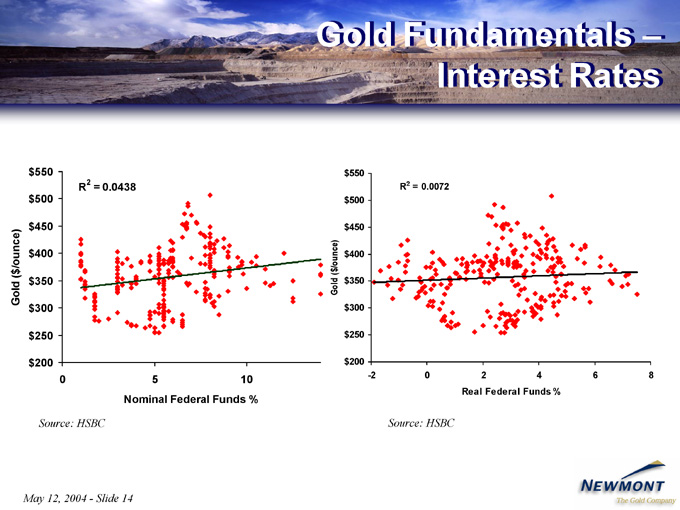
Gold Fundamentals – Interest Rates
Nominal Federal Funds %
Source: HSBC
Real Federal Funds %
Source: HSBC
May 12, 2004—Slide 14
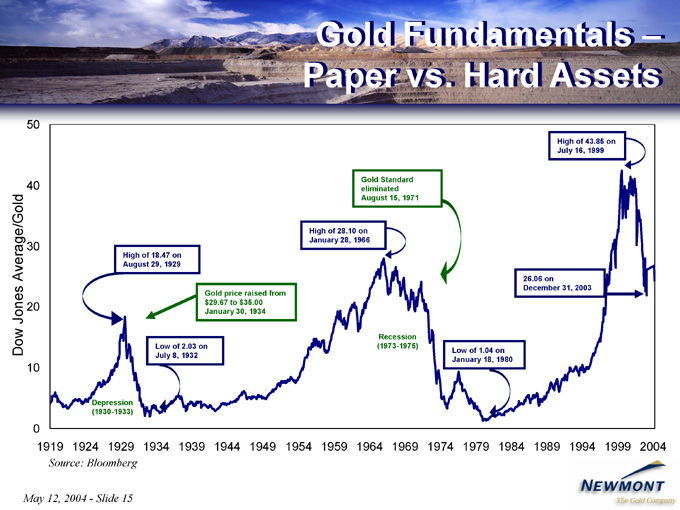
Gold Fundamentals – Paper vs. Hard Assets .
Source: Bloomberg
May 12, 2004—Slide 15
Operating & Financial Results
May 12, 2004—Slide 16
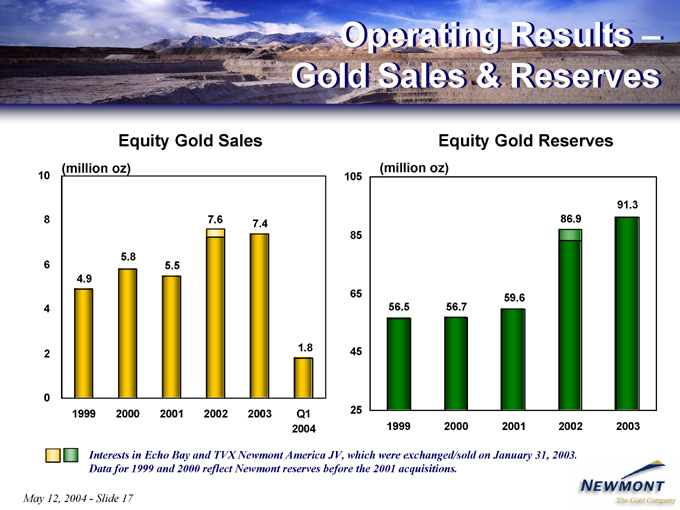
Operating Results –Gold Sales & Reserves
Equity Gold Sales
Equity Gold Reserves
Interests in Echo Bay and TVX Newmont America JV, which were exchanged/sold on January 31, 2003. Data for 1999 and 2000 reflect Newmont reserves before the 2001 acquisitions.
May 12, 2004—Slide 17
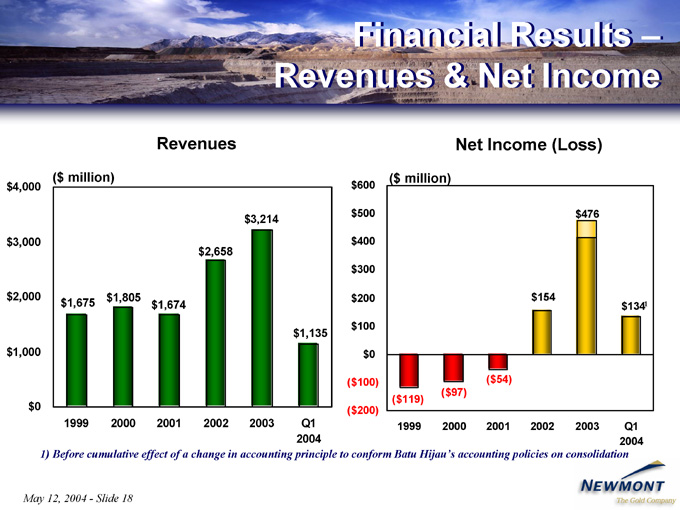
Financial Results –Revenues & Net Income
Revenues
Net Income (Loss)
1) Before cumulative effect of a change in accounting principle to conform Batu Hijau’s accounting policies on consolidation
May 12, 2004—Slide 18
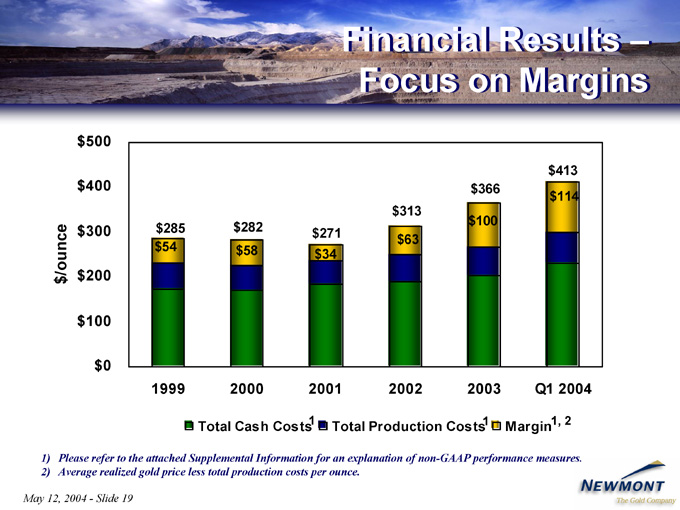
Financial Results –Focus on Margins
Total Cash Costs1 Total Production Costs1 Margin1, 2
1) Please refer to the attached Supplemental Information for an explanation of non-GAAP performance measures.
2) Average realized gold price less total production costs per ounce.
May 12, 2004—Slide 19
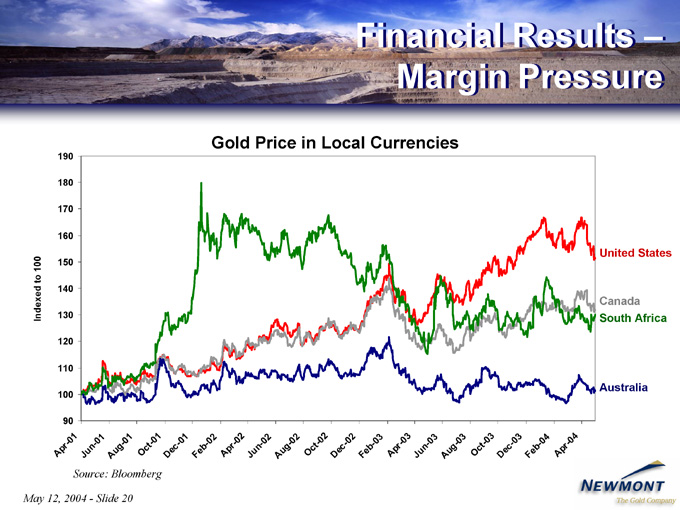
Financial Results –Margin Pressure
Gold Price in Local Currencies
United States
Canada
South Africa
Australia
Source: Bloomberg
May 12, 2004—Slide 20
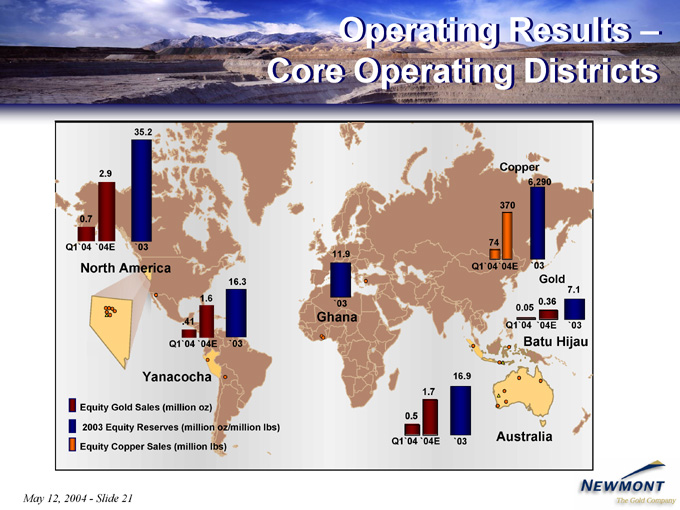
Core Operating Districts
35.2
2.9
0.7
Q1`04 `04E `03
North America
16.3 1.6
.41
Q1`04 `04E `03
Yanacocha
11.9
`03
Ghana
Copper
6,290
370
74
Q1`04`04E `03
Gold
7.1 0.05 0.36 Q1`04 `04E `03
Batu Hijau
16.9
1.7
0.5
Q1`04 `04E `03 Australia
May 12, 2004—Slide 21
Financial Results –Newmont Capital
Portfolio Optimization
• Semi-annual strategic asset review
• Acquisition of minority interests
• Acquisition of 25% interest in Turquoise Ridge joint venture
• Sale of non-core Wiluna, TVX NA and Mesquite operations
Royalty Business
• “Natural hedge”
• Revenues up 58% to $56.3 million in 2003
• Diversified portfolio
Gold Marketing
• Interest in European and Australian Gold Refiners
May 12, 2004—Slide 22
2004 Guidance
Gold Sales
• 7.0 to 7.2 million equity ounces
– 1.8 million equity ounces in Q1
– Approximate 10% decline in Q2 (vs. Q1)
– Stronger second half of the year
•$ 225 to $235 total cash costs per ounce
Copper Sales
• 420 million equity pounds
•$ 0.63 total cash cost per pound
CAPEX1
•$ 750—$800 million
Annualized Sensitivities
•$ 10 change in gold price
– ~$50 million change in net income
– ~$55 million change in cash generated by operations
1) Guidance now includes 100% of Batu Hijau, effective January 1, 2004
May 12, 2004—Slide 23
Reserves & Exploration
May 12, 2004—Slide 24
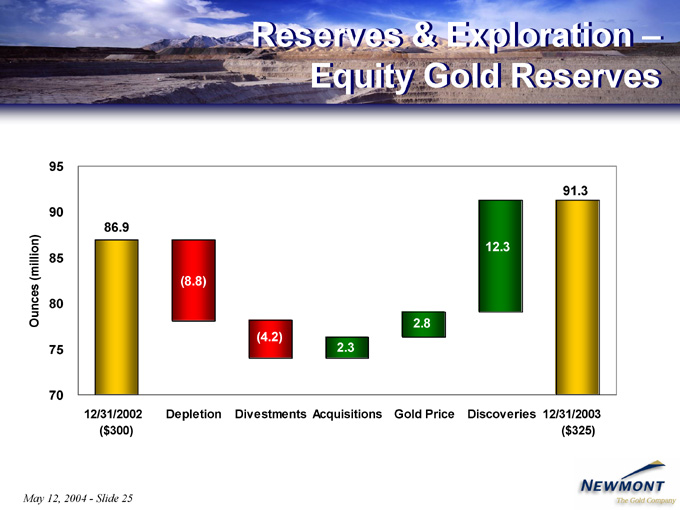
Reserves & Exploration –Equity Gold Reserves
May 12, 2004—Slide 25
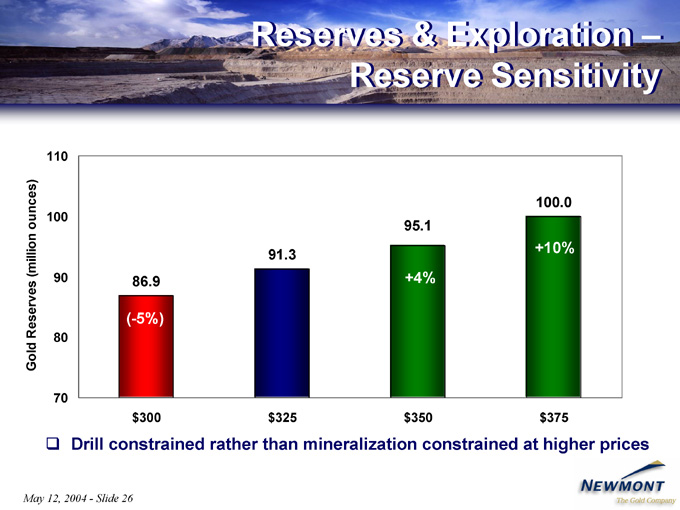
Reserves & Exploration –Reserve Sensitivity
Drill constrained rather than mineralization constrained at higher prices
May 12, 2004—Slide 26
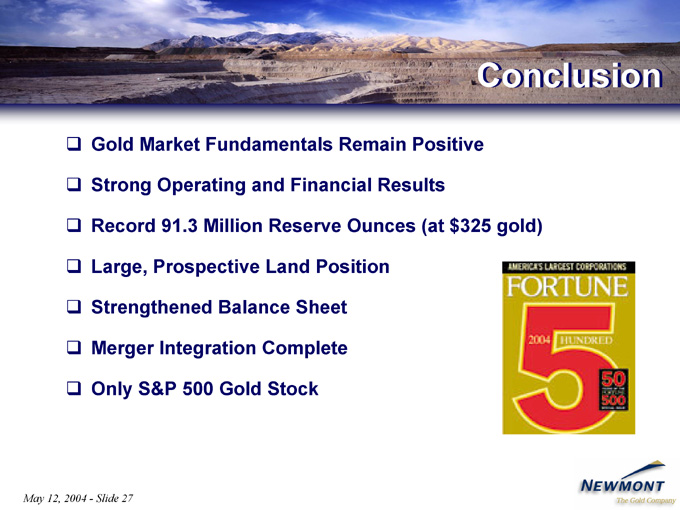
Conclusion
Gold Market Fundamentals Remain Positive
Strong Operating and Financial Results
Record 91.3 Million Reserve Ounces (at $325 gold)
Large, Prospective Land Position
Strengthened Balance Sheet
Merger Integration Complete
Only S&P 500 Gold Stock
May 12, 2004—Slide 27
Take Stock in Gold
Wayne W. Murdy
Chairman & Chief Executive Officer
Merrill Lynch Global Metals, Mining & Steel Conference
Boston, MA
May 12, 2004
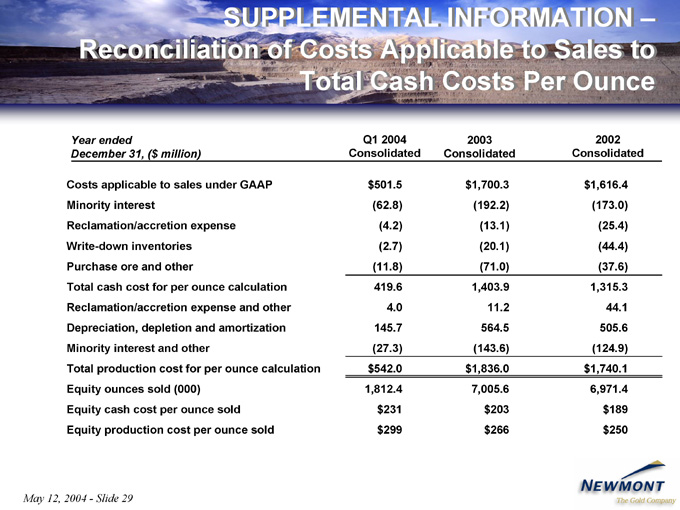
SUPPLEMENTAL INFORMATION – Reconciliation of Costs Applicable to Sales to Total Cash Costs Per Ounce
Year ended Q1 2004 2003 2002
December 31, ($ million) Consolidated Consolidated Consolidated
Costs applicable to sales under GAAP $ 501.5 $ 1,700.3 $ 1,616.4
Minority interest (62.8) (192.2) (173.0)
Reclamation/accretion expense (4.2) (13.1) (25.4)
Write-down inventories (2.7) (20.1) (44.4)
Purchase ore and other (11.8) (71.0) (37.6)
Total cash cost for per ounce calculation 419.6 1,403.9 1,315.3
Reclamation/accretion expense and other 4.0 11.2 44.1
Depreciation, depletion and amortization 145.7 564.5 505.6
Minority interest and other (27.3) (143.6) (124.9)
Total production cost for per ounce calculation $ 542.0 $ 1,836.0 $ 1,740.1
Equity ounces sold (000) 1,812.4 7,005.6 6,971.4
Equity cash cost per ounce sold $ 231 $ 203 $ 189
Equity production cost per ounce sold $ 299 $ 266 $ 250
May 12, 2004—Slide 29