Exhibit 99.1

Our Competitive Advantage

Executive Speakers
Wayne W. Murdy
Chairman & Chief Executive Officer
Pierre Lassonde
President
September 28, 2005
Slide 2
CAUTIONARY STATEMENT
PRIVATE SECURITIES LITIGATION REFORM ACT SAFE HARBOR STATEMENT
This presentation contains “forward-looking statements” within the meaning of Section 27A of the Securities Act of 1933, as amended, and 21E of the Securities Exchange Act of 1934, as amended, that are intended to be covered by the safe harbor created by such sections. Such forward-looking statements include, without limitation, (i) estimates of future gold and other metals production and sales, (ii) estimates of future cash costs; (iii) estimates of reserves, and statements regarding future exploration spending or results and the replacement of reserves; and (iv) the timing or results of permitting, construction and production activities. Where the Company expresses or implies an expectation or belief as to future events or results, such expectation or belief is expressed in good faith and believed to have a reasonable basis. However, forward-looking statements are subject to risks, uncertainties and other factors, which could cause actual results to differ materially from future results expressed, projected or implied by such forward-looking statements. Such risks include, but are not limited to, gold and other metals price volatility, currency fluctuations, increased production costs and variances in ore grade or recovery rates from those assumed in mining plans, as well as political and operational risks in the countries in which we operate and governmental regulation and judicial outcomes. For a more detailed discussion of such risks and other factors, see the Company’s Annual Report on Form 10-K for the year ended December 31, 2004, which is on file with the Securities and Exchange Commission, as well as the Company’s other SEC filings. The Company does not undertake any obligation to release publicly any revisions to any “forward-looking statement” to reflect events or circumstances after the date of this presentation, or to reflect the occurrence of unanticipated events, except as may be required under applicable securities laws.
September 28, 2005
Slide 3
Top Investor Questions
1) What is driving the gold price?
2) What about gold as currency?
3) Where is the gold price going?
4) Can you replace reserves?
5) Do you need to make acquisitions?
6) Are you looking to diversify?
7) What is your current outlook?
8) How do you manage political risk?
9) Can you manage cost pressures?
10) What are you doing to address costs & growth?
11) What will you do with your surplus cash flow?
1) What is driving the gold price?
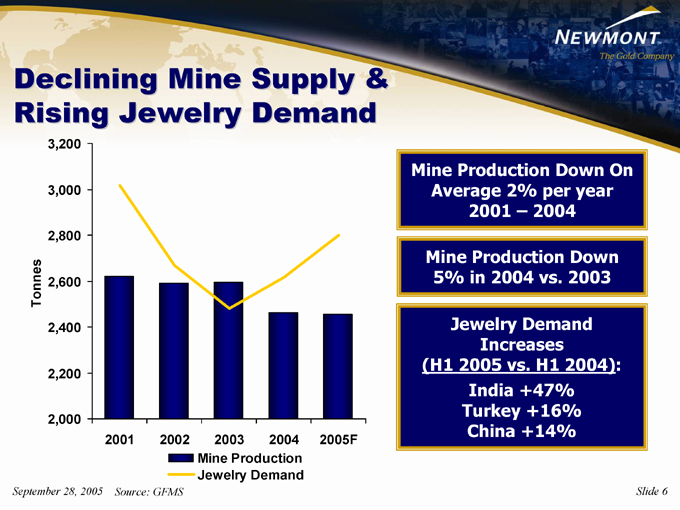
Declining Mine Supply & Rising Jewelry Demand
3,200
3,000
2,800
Tonnes 2,600
2,400 2,200 2,000
2001 2002 2003 2004 2005F
Mine Production Jewelry Demand
September 28, 2005 Source: GFMS
Mine Production Down On Average 2% per year 2001 – 2004
Mine Production Down 5% in 2004 vs. 2003
Jewelry Demand Increases (H1 2005 vs. H1 2004): India +47% Turkey +16% China +14%
Slide 6
2) What about gold as currency?
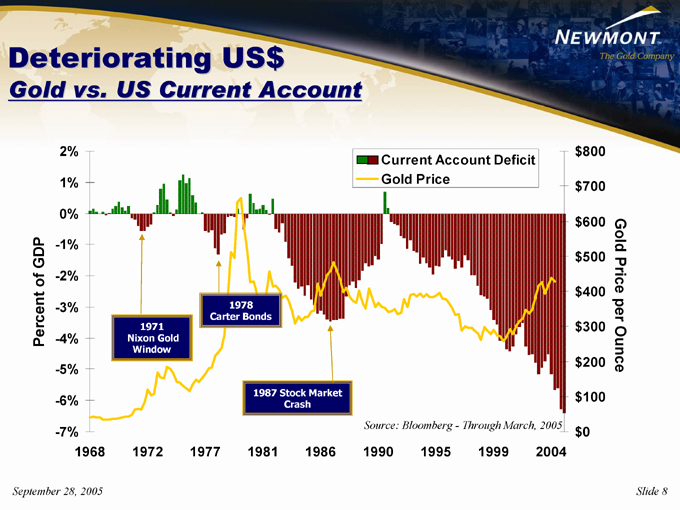
Deteriorating US$
Gold vs. US Current Account
Current Account Deficit Gold Price
2% 1% 0%
-1% -2% Percent of GDP
-3% -4% -5% -6% -7%
1968 1972 1977 1981 1986 1990 1995 1999 2004
1971 Nixon Gold Window
1978 Carter Bonds
1987 Stock Market Crash
Source: Bloomberg - Through March, 2005 $800 $700 $600 $500 $400 $300 $200 $100 $0
September 28, 2005
Gold Price per Ounce
Slide 8
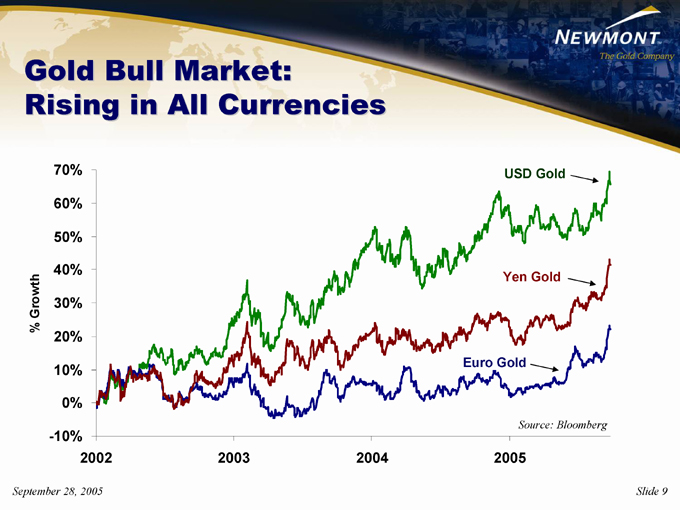
Gold Bull Market: Rising in All Currencies
70% 60% 50%
40%
Growth
30%
%
20% 10% 0% -10%
2002 2003 2004 2005
USD Gold
Yen Gold
Euro Gold
Source: Bloomberg
September 28, 2005
Slide 9
3) Where is the gold price going?
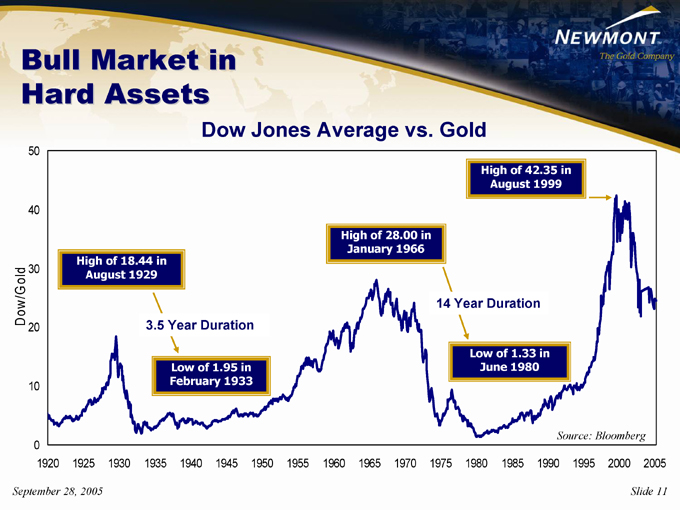
Bull Market in Hard Assets
Dow Jones Average vs. Gold
50
40
Dow/Gold 30
20 10 0
1920 1925 1930 1935 1940 1945 1950 1955 1960 1965 1970 1975 1980 1985 1990 1995 2000 2005
High of 18.44 in August 1929
3.5 Year Duration
Low of 1.95 in February 1933
High of 28.00 in January 1966
High of 42.35 in August 1999
14 Year Duration
Low of 1.33 in June 1980
Source: Bloomberg
September 28, 2005
Slide 11

4) Can you replace reserves?
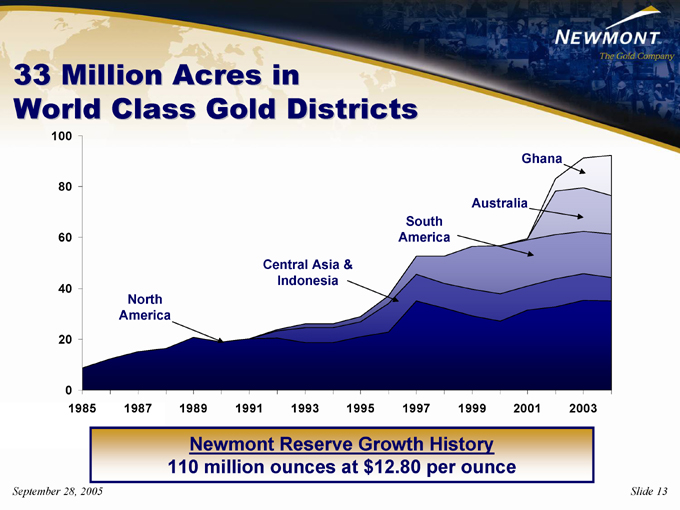
33 Million Acres in World Class Gold Districts
100 80 60 40 20 0
1985 1987 1989 1991 1993 1995 1997 1999 2001 2003
North America
Central Asia & Indonesia
South America
Australia
Ghana
Newmont Reserve Growth History 110 million ounces at $12.80 per ounce
September 28, 2005
Slide 13

5) Do you need to make acquisitions?
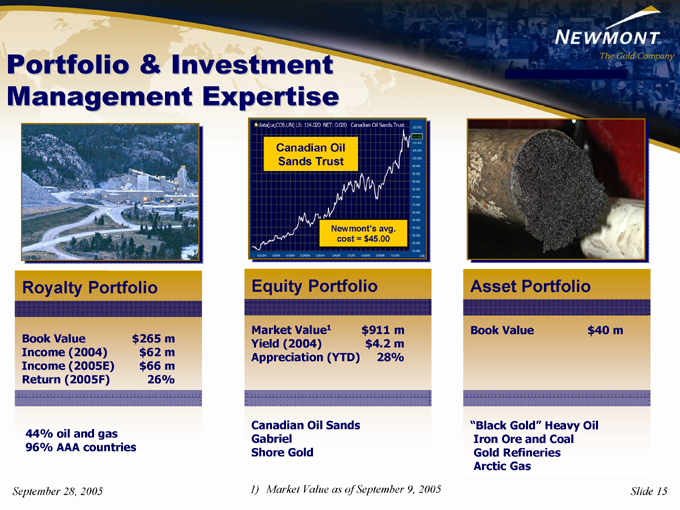
Portfolio & Investment Management Expertise
data(ca;COS.UN) LS: 114.020 NET: 0.020 Canadian Oil Sands Trust
Canadian Oil Sands Trust
Newmont’s avg. cost = $45.00
120.000
115.000 114.020 110.000
105.000 100.000 95.000 90.000 85.000 80.000 75.000 70.000 65.000 60.000 55.000 50.000 45.000
40.000 Daily
6/21/04 8/3/04 9/13/04 10/25/04 12/6/04 1/24/05 3/7/05 4/18/05 5/30/05 7/11/05
Royalty Portfolio
Book Value $265 m Income (2004) $62 m Income (2005E) $66 m Return (2005F) 26%
Equity Portfolio
Market Value1 $911 m Yield (2004) $4.2 m Appreciation (YTD) 28%
Asset Portfolio
Book Value $40 m
44% oil and gas 96% AAA countries
Canadian Oil Sands Gabriel Shore Gold
“Black Gold” Heavy Oil Iron Ore and Coal Gold Refineries Arctic Gas
September 28, 2005
1) Market Value as of September 9, 2005
Slide 15

6) Are you looking to diversify?
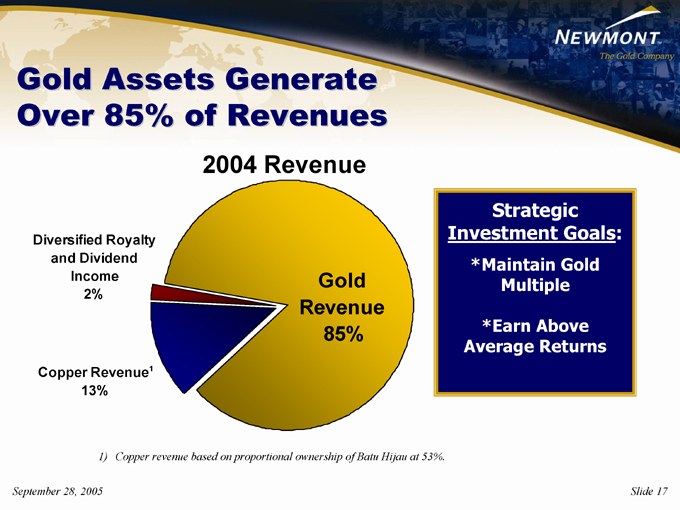
Gold Assets Generate Over 85% of Revenues
2004 Revenue
Diversified Royalty and Dividend Income 2%
Copper Revenue1 13%
Gold Revenue 85%
Strategic Investment Goals:
*Maintain Gold Multiple
*Earn Above Average Returns
1) Copper revenue based on proportional ownership of Batu Hijau at 53%.
September 28, 2005
Slide 17

7) What is your current outlook?
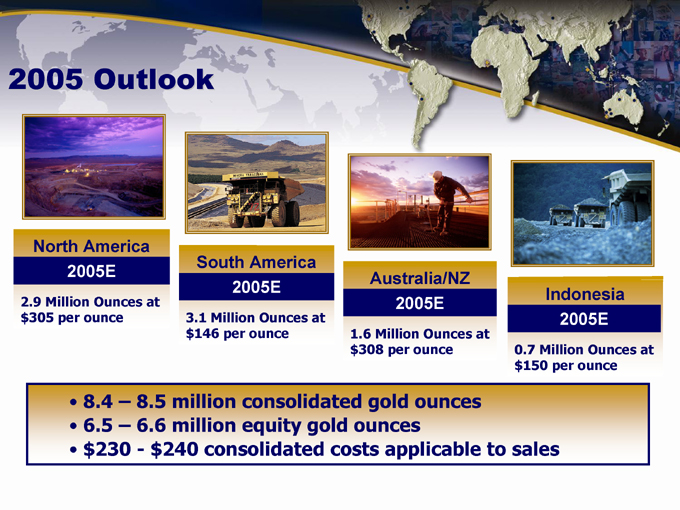
2005 Outlook
North America 2005E
2.9 Million Ounces at $305 per ounce
South America 2005E
3.1 Million Ounces at $146 per ounce
Australia/NZ
2005E
1.6 Million Ounces at $308 per ounce
Indonesia 2005E
0.7 Million Ounces at $150 per ounce
8.4 – 8.5 million consolidated gold ounces 6.5 – 6.6 million equity gold ounces $230—$240 consolidated costs applicable to sales

8) How do you manage political risk?
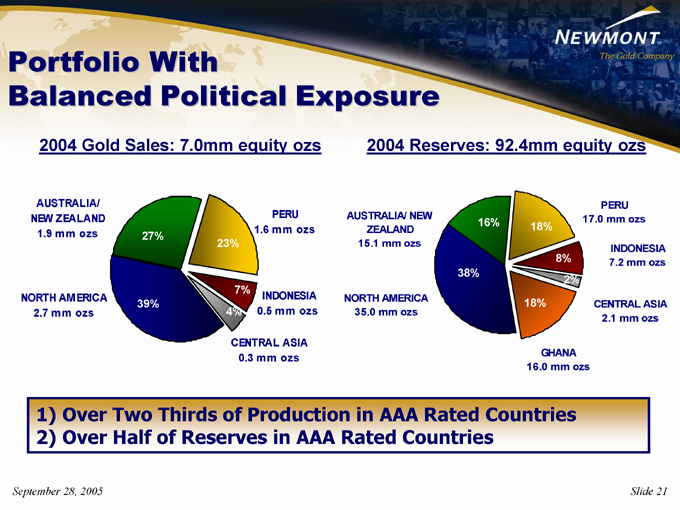
Portfolio With
Balanced Political Exposure
2004 Gold Sales: 7.0mm equity ozs
2004 Reserves: 92.4mm equity ozs
AUSTRALIA/ NEW ZEALAND
1.9 mm ozs
NORTH AMERICA
2.7 mm ozs
27%
39% 38%
23%
7%
4%
PERU 1.6 mm ozs
INDONESIA 0.5 mm ozs
CENTRAL ASIA
0.3 mm ozs
AUSTRALIA/ NEW
ZEALAND 15.1 mm ozs
NORTH AMERICA
35.0 mm ozs
16%
18%
8% 2%
18%
PERU 17.0 mm ozs
INDONESIA 7.2 mm ozs
CENTRAL ASIA
2.1 mm ozs
GHANA 16.0 mm ozs
1) Over Two Thirds of Production in AAA Rated Countries 2) Over Half of Reserves in AAA Rated Countries
September 28, 2005
Slide 21
9) Can you manage cost pressures?
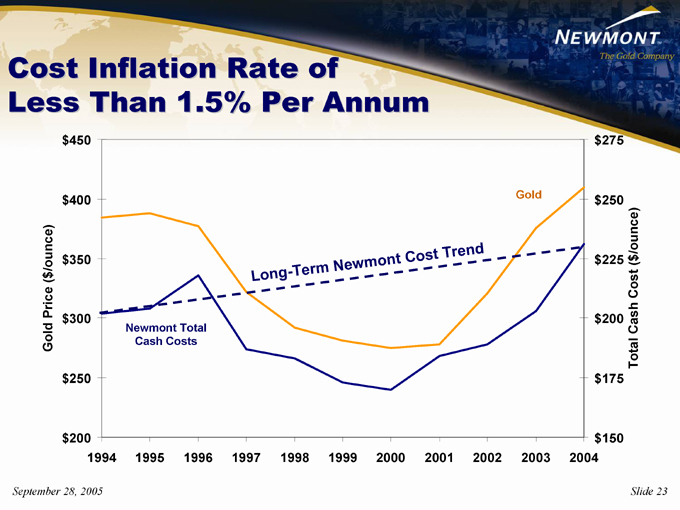
Cost Inflation Rate of Less Than 1.5% Per Annum $450
$400
$350 Gold Price ( $/ounce) $300 $250
$200
1994 1995 1996 1997 1998 1999 2000 2001 2002 2003 2004 $275
$250
$225 $200 Total Cash Cost $175( $/ounce)
$150
Newmont Total Cash Costs
Long - Term
Newmont
Cost
Trend
Gold
September 28, 2005
Slide 23

Over Two Thirds US$ Denominated Costs
$700 $600 $500 $400 $300 $200 $100 $0
Newmont Cash Cost Percentiles1
2002 = 56th Percentile 2004 = 38th Percentile 2005E = 38th–40th Percentile
H1 2005 Industry Cash Costs (2)
2004 Industry Cash Costs 2002 Industry Cash Costs
Improved Competitive Cost Position
0% 10% 20% 30% 40% 50% 60% 70% 80% 90% 100%
Source: GFMS
1) Newmont Cash Costs: 2002=$189, 2004=$231, H1 2005E = $246-$257 (based on current costs applicable to sales guidance of $230-$240).
2) Estimated H1 2005 from GFMS data
Note: Please refer to the attached Supplemental Information for an explanation of non-GAAP performance measures.
Slide 24

10) What are you doing to address costs and future growth ?

1.8 Million Ounces1
Annually at < $220 per Ounce
Future Projects
Leeville, Nevada
Production
Begins: Q4 2005E Reserves: 2.6 mm ozs Annual Production: ~500,000 ounces
Phoenix, Nevada
Production Begins: 1Q 2006E Reserves: 8.5 mm ozs Annual Production: ~380,000 ounces
Ahafo, Ghana
Production Begins: 2H 2006E Reserves: 10.6 mm ozs Annual Production: ~375,000 equity ounces
Akyem, Ghana
production Begins: 2H 2008E Reserves: 5.4 mm ozs Annual Production: ~400,000 ounces
Boddington, Australia
Reserves: 4.9 mm ozs Annual Production: ~375,000 equity ounces
Power Plant, Nevada
203 MW Coal Plant Up to $20/oz Estimated CAS savings Start-up 2008E
In Development
1) Estimated average over first five years of production.
Slide 24

11) What will you do with your surplus cash flow?
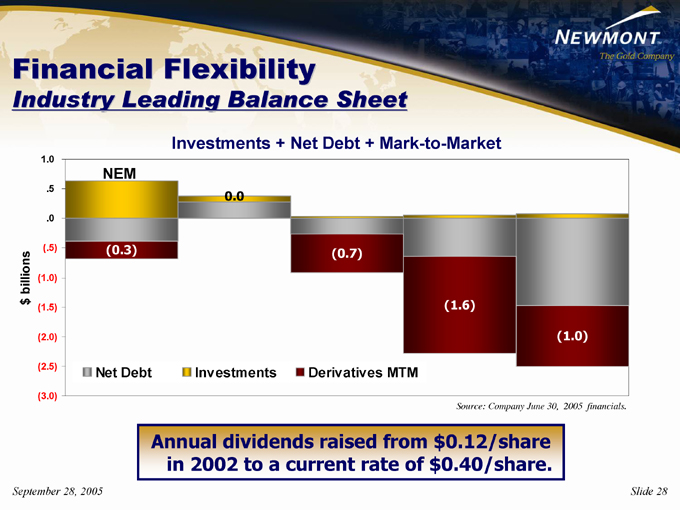
Financial Flexibility
Industry Leading Balance Sheet
Investments + Net Debt + Mark-to-Market
1.0 .5 .0
(.5)
billions
(1.0)
$
(1.5) (2.0) (2.5) (3.0)
NEM
(0.3)
0.0
(0.7)
(1.6)
(1.0)
Net Debt
Investments
Derivatives MTM
Source: Company June 30, 2005 financials.
Annual dividends raised from $0.12/share in 2002 to a current rate of $0.40/share.
September 28, 2005
Slide 28
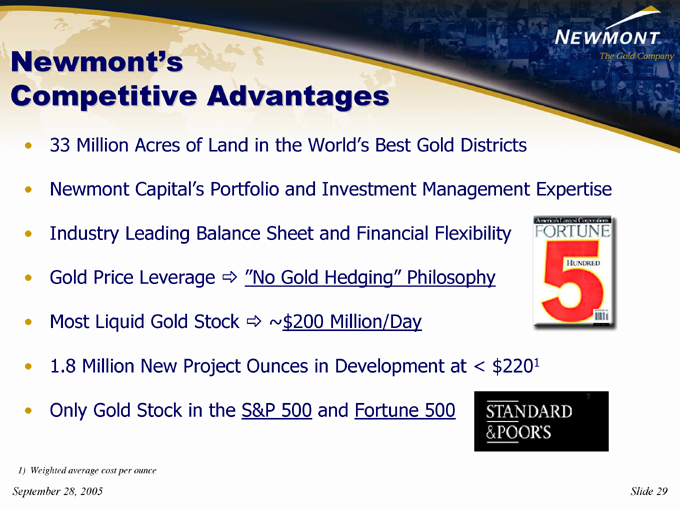
Newmont’s
Competitive Advantages
33 Million Acres of Land in the World’s Best Gold Districts
Newmont Capital’s Portfolio and Investment Management Expertise
Industry Leading Balance Sheet and Financial Flexibility Gold Price Leverage “No Gold Hedging” Philosophy Most Liquid Gold Stock ~$200 Million/Day
1.8 Million New Project Ounces in Development at < $2201
Only Gold Stock in the S&P 500 and Fortune 500
1) Weighted average cost per ounce
September 28, 2005
Slide 29

Our Competitive Advantage
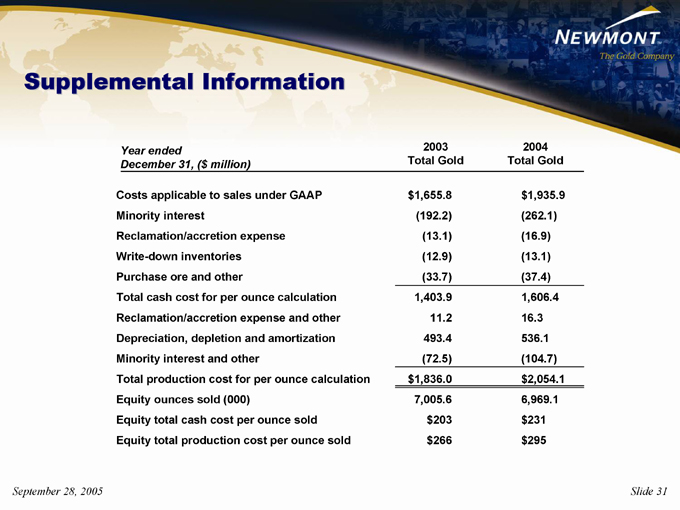
Supplemental Information
Year |
| ended 2003 2004 |
December |
| 31, ($ million) Total Gold Total Gold |
Costs |
| applicable to sales under GAAP $1,655.8 $1,935.9 |
Minority |
| interest (192.2) (262.1) |
Reclamation/accretion |
| expense (13.1) (16.9) |
Write-down |
| inventories (12.9) (13.1) |
Purchase |
| ore and other (33.7) (37.4) |
Total |
| cash cost for per ounce calculation 1,403.9 1,606.4 |
Reclamation/accretion |
| expense and other 11.2 16.3 |
Depreciation, |
| depletion and amortization 493.4 536.1 |
Minority |
| interest and other (72.5) (104.7) |
Total |
| production cost for per ounce calculation $1,836.0 $2,054.1 |
Equity |
| ounces sold (000) 7,005.6 6,969.1 |
Equity |
| total cash cost per ounce sold $203 $231 |
Equity |
| total production cost per ounce sold $266 $295 |
September 28, 2005
Slide 31
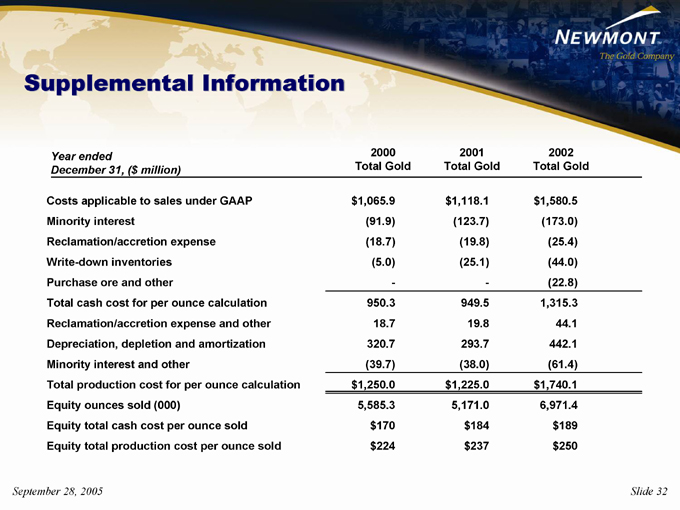
Supplemental Information
Year |
| ended 2000 2001 2002 |
December |
| 31, ($ million) Total Gold Total Gold Total Gold |
Costs |
| applicable to sales under GAAP $1,065.9 $1,118.1 $1,580.5 |
Minority |
| interest (91.9) (123.7) (173.0) |
Reclamation/accretion |
| expense (18.7) (19.8) (25.4) |
Write-down |
| inventories (5.0) (25.1) (44.0) |
Purchase |
| ore and other - (22.8) |
Total |
| cash cost for per ounce calculation 950.3 949.5 1,315.3 |
Reclamation/accretion |
| expense and other 18.7 19.8 44.1 |
Depreciation, |
| depletion and amortization 320.7 293.7 442.1 |
Minority |
| interest and other (39.7) (38.0) (61.4) |
Total |
| production cost for per ounce calculation $1,250.0 $1,225.0 $1,740.1 |
Equity |
| ounces sold (000) 5,585.3 5,171.0 6,971.4 |
Equity |
| total cash cost per ounce sold $170 $184 $189 |
Equity |
| total production cost per ounce sold $224 $237 $250 |
September 28, 2005
Slide 32