Exhibit 99.1

News ReleaseFourth Quarter and 2005 Results
2005 INCOME FROM CONTINUING OPERATIONS OF $374 MILLION ($0.84 PER SHARE); RECORD EQUITY GOLD RESERVES OF 93.2 MILLION OUNCES AT YEAR-END
DENVER, February 27, 2006 – Newmont Mining Corporation (NYSE: NEM) today announced fourth quarter income from continuing operations of $72 million ($0.16 per share) and 2005 income from continuing operations of $374 million ($0.84 per share). Newmont also reported industry-leading cash from operations of $1.25 billion for 2005, as well as record proven and probable gold reserves of 93.2 million equity ounces at year-end 2005, based on a gold price assumption of $400 per ounce. Other fourth quarter and 2005 highlights included:
| | • | | Consolidated gold sales for the fourth quarter of 2.4 million ounces at an average realized gold price of $472 per ounce and costs applicable to sales of $230 per ounce; |
| | • | | Consolidated gold sales for 2005 of 8.6 million ounces at an average realized gold price of $441 per ounce and costs applicable to sales of $236 per ounce; and |
| | • | | Cash and cash equivalents, short-term marketable securities and other short-term investments of $1.9 billion at year-end. |
Wayne W. Murdy, Chairman and Chief Executive Officer, said, “For 2005, we again generated industry leading operating cash flow, despite lower earnings resulting from industry-wide cost pressures and the impact of several non-cash accounting write-downs. We also achieved our goal of replacing depletion for the fourth straight year. As we look to 2006 and beyond, we are excited about the opportunities our newest initiatives will provide to improve our cost structure and competitive position in the industry. This year we will complete the Phoenix and Leeville projects in Nevada, plus the Ahafo project in Ghana. In 2008, we expect to complete the Nevada power plant, the Akyem project in Ghana, and the Boddington project in Australia.”
| | | | | | | | | | | | |
| Financial (in millions, except per share) | | Q4 2005 | | Q4 2004 | | 2005 | | 2004 |
Revenues | | $ | 1,305 | | $ | 1,198 | | $ | 4,406 | | $ | 4,411 |
Net cash provided from continuing operations | | $ | 489 | | $ | 587 | | $ | 1,253 | | $ | 1,549 |
Income from continuing operations | | $ | 72 | | $ | 150 | | $ | 374 | | $ | 453 |
Income from continuing operations per common share | | $ | 0.16 | | $ | 0.34 | | $ | 0.84 | | $ | 1.02 |
Operating | | | | | | | | | | | | |
Consolidated gold sales from continuing ops (000 ounces) | | | 2,437 | | | 2,308 | | | 8,552 | | | 8,829 |
Equity gold sales (000 ounces)1 | | | 1,799 | | | 1,794 | | | 6,493 | | | 6,969 |
Average realized gold price ($/ounce) | | $ | 472 | | $ | 436 | | $ | 441 | | $ | 412 |
Costs applicable to sales ($/ounce) | | $ | 230 | | $ | 211 | | $ | 236 | | $ | 216 |
| (1) | Includes sales from the Holloway discontinued operation of 16,000 and 19,000 ounces in the fourth quarter of 2005 and 2004, respectively, and 67,800 and 67,400 ounces for 2005 and 2004, respectively. |
| | |
| NEWMONT – FOURTH QUARTER 2005 RESULTS (FEBRUARY 27, 2006) | | Page 1 of 1 |

EXPLORATION AND RESERVES HIGHLIGHTS
For 2005, the Company added 9.4 million equity ounces of reserves through exploration, offsetting 8.6 million equity ounces of depletion and divestments. 2005 exploration highlights include:
| | • | | In Ghana, equity reserves grew by 17% (2.7 million ounces) to 18.7 million ounces; |
| | • | | In Nevada, Phoenix reserves grew by 0.5 million ounces to 8.9 million ounces; and |
| | • | | At Conga in Peru, equity reserves grew by 1.6 million ounces to 6.1 million ounces. |
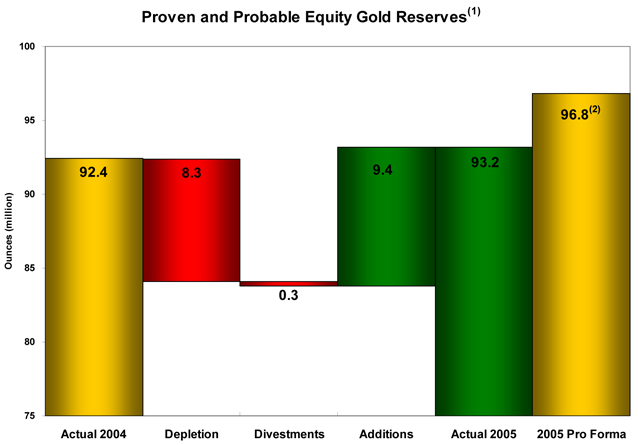
Of the 9.4 million equity ounces added to reserves during 2005, 6.8 million ounces were added from the drill bit, while 2.6 million ounces were added as a result of a higher gold price assumption ($400 per ounce).
Subsequent to December 31, 2005, pro forma year-end equity reserves increased by 3.6 million ounces to 96.8 million ounces resulting from the acquisitions of the remaining 15% interest in the Akyem project in Ghana and an additional 22.22% of the Boddington project in Australia (under contract), partially offset by a 0.2 million ounce reduction at Zarafshan due to a revision to the ore supply agreement.
| (1) | For detailed information on the Company’s year-end reserves, please refer to the Supplemental Information in this release. |
| (2) | Includes pro forma equity reserves added after December 31, 2005 through additional interest acquired in Akyem and pending interest to be acquired in Boddington. Also includes negative adjustment to Zarafshan reserves. |
| | |
| NEWMONT – FOURTH QUARTER 2005 RESULTS (FEBRUARY 27, 2006) | | Page 2 of 2 |
FINANCIAL & OPERATING REVIEW
Fourth quarter 2005 income from continuing operations was $72 million ($0.16 per share), compared with $150 million ($0.34 per share) for the fourth quarter 2004. For 2005, income from continuing operations was $374 million ($0.84 per share), compared with $453 million ($1.02 per share) for 2004. Income for the fourth quarter was impacted by the following:
| | | | | | | | | | | | | | | | |
Impact of the following transactions (after-tax) | | 2005 Q4 | | | 2004 Q4 | |
| | $ Million | | | EPS | | | $ Million | | | EPS | |
Income from continuing operations | | $ | 72 | | | $ | 0.16 | | | $ | 150 | | | $ | 0.34 | |
- Gain on sale of marketable securities | | $ | 11 | | | $ | 0.02 | | | | — | | | | — | |
- Gain on receivable valuation allowance adjustment | | $ | 6 | | | $ | 0.01 | | | | — | | | | — | |
- Gain on disposition of assets | | | — | | | | — | | | $ | 3 | | | $ | 0.01 | |
- Buyat Bay civil suit settlement | | ($ | 18 | ) | | ($ | 0.04 | ) | | | — | | | | — | |
- Gain on various tax items | | | — | | | | — | | | $ | 62 | | | $ | 0.14 | |
- (Loss)/gain on reclamation estimate revisions | | ($ | 16 | ) | | ($ | 0.03 | ) | | $ | 16 | | | $ | 0.04 | |
- Loss on write-down of long-lived assets | | ($ | 26 | ) | | ($ | 0.06 | ) | | ($ | 9 | ) | | ($ | 0.02 | ) |
- Loss on write-down of Nevada goodwill | | ($ | 41 | ) | | ($ | 0.09 | ) | | | — | | | | — | |
- Loss on write-down of Pajingo goodwill | | | — | | | | — | | | ($ | 52 | ) | | ($ | 0.12 | ) |
These items had the net effect of decreasing income from continuing operations for the fourth quarter of 2005 by $84 million ($0.19 per share) and increasing income from continuing operations for the fourth quarter of 2004 by $20 million ($0.06 per share). For 2005, income from continuing operations was reduced by $34 million ($0.07 per share) as a result of numerous similar transactions.1
The Company generated net cash from continuing operations of $489 million in the fourth quarter and $1.25 billion for 2005.
OPERATING HIGHLIGHTS – NEVADA
| | | | | | | | | | | | |
Nevada | | Q4 2005 | | Q4 2004 | | 2005 | | 2004 |
Consolidated gold sales (000 ounces) | | | 651.9 | | | 702.7 | | | 2,444.1 | | | 2,538.0 |
Equity gold sales (000 ounces) | | | 606.2 | | | 668.2 | | | 2,287.2 | | | 2,416.0 |
Consolidated costs applicable to sales ($/ounce) | | $ | 340 | | $ | 271 | | $ | 333 | | $ | 282 |
In Nevada, gold ounces sold decreased 7% in the fourth quarter of 2005 compared to the same period in 2004 as an 8% increase in mill throughput and a 14% increase in heap leach ore placed were offset by a 14% decrease in mill ore grade. Adverse mill grades were caused by unfavorable ground conditions at underground operations and a continuing underground labor shortage impacting production rates from higher grade underground ore zones. Costs applicable to sales per ounce increased 25% in the fourth quarter of 2005 from the fourth quarter of 2004, primarily due to lower volumes, increased labor and underground contract service costs, as well as higher diesel and other commodity prices. Experienced miners, particularly underground miners, remain in short supply in Nevada, with labor rates increasing commensurate with the shortfall.
| (1) | Please refer to Supplemental Information in this release. |
| | |
| NEWMONT – FOURTH QUARTER 2005 RESULTS (FEBRUARY 27, 2006) | | Page 3 of 3 |
OPERATING HIGHLIGHTS – YANACOCHA
| | | | | | | | | | | | |
Yanacocha | | Q4 2005 | | Q4 2004 | | 2005 | | 2004 |
Consolidated gold sales (000 ounces) | | | 1,062.9 | | | 849.1 | | | 3,327.5 | | | 3,039.9 |
Equity gold sales (000 ounces) | | | 545.8 | | | 436.0 | | | 1,708.7 | | | 1,561.0 |
Consolidated costs applicable to sales ($/ounce) | | $ | 145 | | $ | 132 | | $ | 147 | | $ | 142 |
At Yanacocha in Peru, gold ounces sold increased 25% in the fourth quarter of 2005 compared to the same period in 2004 due to a 15% increase in ore placed and reduction of precipitate inventory. Costs applicable to sales per ounce increased 10% as increased labor and commodity costs, including diesel, were partially offset by the increase in production.
OPERATING HIGHLIGHTS – AUSTRALIA/NEW ZEALAND
| | | | | | | | | | | | |
Australia/New Zealand | | Q4 2005 | | Q4 2004 | | 2005 | | 2004 |
Consolidated sales (000 ounces) | | | 397.0 | | | 473.2 | | | 1,600.5 | | | 1,887.6 |
Equity gold sales (000 ounces) | | | 397.0 | | | 473.2 | | | 1,600.5 | | | 1,887.6 |
Consolidated costs applicable to sales ($/ounce) | | $ | 315 | | $ | 292 | | $ | 317 | | $ | 280 |
At Pajingo in Australia, gold ounces sold decreased 27% in the fourth quarter of 2005 from the fourth quarter of 2004, primarily due to a 24% decrease in ore milled as low grade stockpiles that supplemented production in 2004 have been exhausted. Costs applicable to sales per ounce increased 11%, primarily due to lower production.
At Jundee in Australia, gold ounces sold increased 5% in the fourth quarter of 2005 from the fourth quarter of 2004, primarily due to a 6% increase in ore milled. Costs applicable to sales per ounce increased 2% in the fourth quarter of 2005 from the fourth quarter of 2004, primarily due to higher underground contract services and diesel costs.
At Tanami in Australia, gold ounces sold decreased 29% in the fourth quarter of 2005 from the fourth quarter of 2004, primarily due to a 33% decrease in mill throughput, primarily due to the completion of mining at Groundrush in 2004. Costs applicable to sales per ounce remained constant in the fourth quarter of 2005 from the fourth quarter of 2004, as higher underground support and diesel costs were offset by the cessation of milling operations at Groundrush in August 2005.
At Kalgoorlie in Australia, gold ounces sold decreased 11% in the fourth quarter of 2005 from the fourth quarter of 2004, primarily due to an 18% decline in ore grade. Costs applicable to sales per ounce increased 27% in the fourth quarter of 2005 from the fourth quarter of 2004, primarily due to lower production and increased diesel, reagent and power costs.
At Martha in New Zealand, gold ounces sold decreased 12% in the fourth quarter of 2005 compared to the fourth quarter of 2004, primarily the result of a 9% decrease in ore milled. Costs applicable to sales per ounce
| | |
| NEWMONT – FOURTH QUARTER 2005 RESULTS (FEBRUARY 27, 2006) | | Page 4 of 4 |
remained constant in the fourth quarter of 2005 from the fourth quarter of 2004, primarily a result of higher by-product revenue offset by higher processing costs from harder ore.
OPERATING HIGHLIGHTS – BATU HIJAU
| | | | | | | | | | | | |
Batu Hijau | | Q4 2005 | | Q4 2004 | | 2005 | | 2004 |
Consolidated copper sales (million pounds) | | | 128.7 | | | 164.3 | | | 572.7 | | | 683.3 |
Equity copper sales (million pounds) | | | 68.0 | | | 86.8 | | | 302.8 | | | 378.8 |
Consolidated costs applicable to sales ($/pound copper) | | $ | 0.60 | | $ | 0.48 | | $ | 0.53 | | $ | 0.45 |
Consolidated gold sales (000 ounces) | | | 180.9 | | | 178.9 | | | 720.5 | | | 715.2 |
Equity gold sales (000 ounces) | | | 95.7 | | | 94.6 | | | 381.0 | | | 396.3 |
Consolidated costs applicable to sales ($/ounce gold) | | $ | 161 | | $ | 135 | | $ | 152 | | $ | 128 |
At Batu Hijau in Indonesia, copper sales decreased 22% in the fourth quarter of 2005 from the fourth quarter of 2004, primarily due to an 18% decrease in ore milled and a 10% decrease in ore grade. Gold sales remained constant in the fourth quarter of 2005 from the fourth quarter of 2004 as an 18% decrease in ore milled was offset by a 15% increase in ore grade. Costs applicable to sales per pound of copper and ounce of gold increased 25% and 19%, respectively, during the fourth quarter of 2005 from the fourth quarter of 2004. Operating costs increased primarily as a result of higher fuel, maintenance, consumable, power and labor costs.
OPERATING HIGHLIGHTS – OTHER
| | | | | | | | | | | | |
Other | | Q4 2005 | | Q4 2004 | | 2005 | | 2004 |
Consolidated gold sales (000 ounces) | | | 144.0 | | | 103.8 | | | 459.4 | | | 648.2 |
Equity gold sales (000 ounces) | | | 138.1 | | | 103.1 | | | 448.1 | | | 640.8 |
Consolidated costs applicable to sales ($/ounce) | | $ | 214 | | $ | 219 | | $ | 229 | | $ | 220 |
At Golden Giant in Canada, gold ounces sold increased 11% in the fourth quarter of 2005 from the fourth quarter of 2004, attributable to a 28% increase in mill throughput and a 5% increase in ore grade. Costs applicable to sales per ounce decreased 10% in the fourth quarter of 2005 from the fourth quarter of 2004, primarily as a result of the increase in production, partially offset by the appreciation of the Canadian dollar.
At La Herradura in Mexico, gold ounces sold increased 9% in the fourth quarter of 2005 from the fourth quarter of 2004, primarily due to favorable timing of flows from the leach pads.
At Kori Kollo in Bolivia, additional material from the Kori Kollo pit was placed on the existing leach pad. Beginning in the third quarter of 2005, Kori Kollo also began processing ore from the Kori Chaca pit on a new leach pad. This resulted in a significant increase in ounces sold for the fourth quarter compared to the comparative period of 2004. Costs applicable to sales per ounce decreased significantly period to period, primarily as a result of the increased production.
At Zarafshan in Uzbekistan, gold ounces sold decreased 24% in the fourth quarter of 2005 from the fourth quarter of 2004, due to a 5% decrease in ore grade and lower production from leach pads. Costs applicable to
| | |
| NEWMONT – FOURTH QUARTER 2005 RESULTS (FEBRUARY 27, 2006) | | Page 5 of 5 |
sales per ounce increased 42% in the fourth quarter of 2005 from the fourth quarter of 2004, primarily as a result of the decrease in production and higher energy costs.
MERCHANT BANKING
Newmont Capital is responsible for the Company’s merchant banking activities, which include management of the royalty, equity and asset portfolios, as well as in-house investment banking and advisory services. For the fourth quarter of 2005, royalty and dividend income was $23 million, 24% higher than the year ago quarter. For 2005, royalty and dividend income was $79 million, up approximately 20% over last year. At the end of 2005, the market value of the marketable equity securities portfolio was $940 million, an increase of $433 million from year-end 2004. Growth in the equity portfolio in 2005 resulted primarily from an 80% return on average invested capital.
During the fourth quarter of 2005, Newmont reached an agreement to purchase the remaining 15% interest in the Akyem project. The transaction closed on January 20, 2006. During the first quarter of 2006, Newmont reached an agreement to acquire an additional 22.22% interest in the Boddington project from Newcrest Mining Limited, increasing Newmont’s ownership in the project to 66.67%, with AngloGold Ashanti owning the remaining 33.33%. Closing is expected by April 2006.
Environmental baseline studies and infill drilling are ongoing at Newmont’s 100% owned Alberta oil sands project. A prefeasibility study estimated that 165 million barrels are economically recoverable via steam assisted gravity drainage wells with the potential for production of 25,000 barrels per day.
CAPITAL PROJECT DEVELOPMENT UPDATE
The Leeville underground project in Nevada is approximately 86% complete. The production shaft reached its final depth in November 2005. Dewatering has been successful and the groundwater level is now below the production shaft bottom. The remaining construction work primarily relates to construction of underground facilities. Production ramp up is scheduled to achieve 2,100 tons per day of mine output by the end of 2006.
At the Phoenix project in Nevada, construction is approximately 96% complete. Commissioning of the process plant began in January 2006. Initial gold production is expected by April 2006.
Construction of the 200 megawatt power plant in Nevada was approved by the Newmont Board of Directors in January 2006 after receipt of the final air permit. Project engineering is currently 50% complete. Construction has commenced and the estimated completion date is mid-2008.
At the Ahafo project in Ghana, engineering, procurement, camp and general infrastructure construction are essentially complete. The process plant, including the tailings storage facility and water storage facility, is approximately 76% complete, with overall project construction approximately 83% complete at the end of January 2006. Mining commenced January 9, 2006 and the project is on schedule to deliver first gold production in the second half of 2006.
| | |
| NEWMONT – FOURTH QUARTER 2005 RESULTS (FEBRUARY 27, 2006) | | Page 6 of 6 |
The Akyem project in Ghana was approved by the Newmont Board of Directors in July 2005. An environmental impact statement was submitted to the Ghana Environmental Protection Agency in May 2005. Construction is expected to commence after approval of the environmental impact statement, with initial production expected in the second half of 2008.
EXPLORATION, ADVANCED PROJECTS, RESEARCH & DEVELOPMENT
Exploration expenditures were $43 million in the fourth quarter of 2005 compared with $31 million in the year ago quarter. Advanced projects, research and development expenditures were $26 million in the fourth quarter of 2005 compared with $21 million in the fourth quarter of 2004. For 2005, exploration expenditures were $147 million, with advanced projects, research and development expenditures totaling $73 million.
In the Conga district in Peru, infill drilling resulted in the conversion of non-reserve mineralization (NRM) to reserves at the Perol and Chailhuagon deposits. Assay results, as well as ongoing resource modeling and engineering, are advancing economic evaluations. Follow-up drilling at the Amaro prospect yielded encouraging results, adding NRM at year-end.
In the Ahafo district in Ghana, development drilling programs advanced the geologic understanding of the deposits in the north and south areas. Drilling of new exploration targets and extensions of known mineralization provided positive results throughout the year.
Drill programs in Nevada yielded positive results at the Carlin Trend and Phoenix, resulting in reserve and NRM additions totaling 2.5 million ounces for the year.
Development drilling at the Tanami, Jundee and Martha underground operations in Australia and New Zealand yielded conversion of NRM to reserves.
| | |
| NEWMONT – FOURTH QUARTER 2005 RESULTS (FEBRUARY 27, 2006) | | Page 7 of 7 |
The Company also updated its equity gold reserve price sensitivity. As illustrated below, if calculated at gold prices of $425 and $450 per ounce, gold reserves would increase to approximately 99 million ounces and 104 million ounces, respectively, all other assumptions remaining constant. The full impact of higher gold prices on gold reserves remains constrained by limited drill data on the margins of known mineralization.
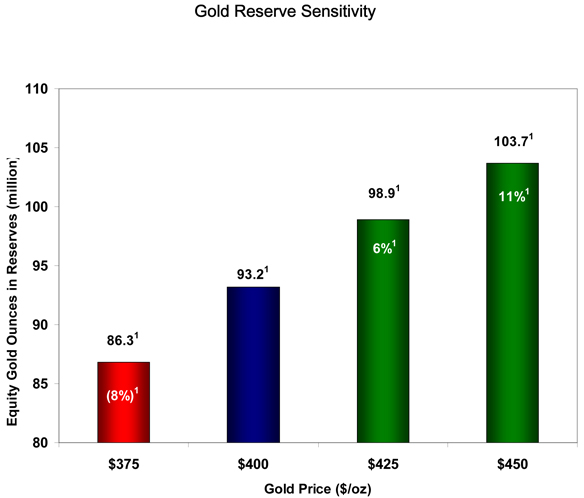
| (1) | Excludes pro forma equity reserves added after December 31, 2005. |
| | |
| NEWMONT – FOURTH QUARTER 2005 RESULTS (FEBRUARY 27, 2006) | | Page 8 of 8 |
STATEMENTS OF CONSOLIDATED INCOME
| | | | | | | | | | | | | | | | |
| | | Three Months Ended
December 31, | | | Years Ended
December 31, | |
| | | 2005 | | | 2004 | | | 2005 | | | 2004 | |
| | | (unaudited, in millions except per share) | |
Revenues | | | | | | | | | | | | | | | | |
Sales - gold, net | | $ | 1,138 | | | $ | 1,001 | | | $ | 3,734 | | | $ | 3,625 | |
Sales - copper, net | | | 167 | | | | 197 | | | | 672 | | | | 786 | |
| | | | | | | | | | | | | | | | |
| | | 1,305 | | | | 1,198 | | | | 4,406 | | | | 4,411 | |
| | | | | | | | | | | | | | | | |
Costs and expenses | | | | | | | | | | | | | | | | |
Costs applicable to sales (exclusive of depreciation, depletion and amortization shown separately below) | | | | | | | | | | | | | | | | |
Gold | | | 561 | | | | 487 | | | | 2,017 | | | | 1,910 | |
Copper | | | 76 | | | | 78 | | | | 303 | | | | 305 | |
Depreciation, depletion and amortization | | | 171 | | | | 162 | | | | 644 | | | | 662 | |
Exploration | | | 43 | | | | 31 | | | | 147 | | | | 107 | |
Advanced projects, research and development | | | 26 | | | | 21 | | | | 73 | | | | 80 | |
General and administrative | | | 40 | | | | 36 | | | | 134 | | | | 116 | |
Write down of goodwill | | | 41 | | | | 52 | | | | 41 | | | | 52 | |
Write down of long-lived assets | | | 41 | | | | 13 | | | | 43 | | | | 39 | |
Other expense | | | 52 | | | | (15 | ) | | | 111 | | | | 33 | |
| | | | | | | | | | | | | | | | |
| | | 1,051 | | | | 865 | | | | 3,513 | | | | 3,304 | |
| | | | | | | | | | | | | | | | |
Other income (expense) | | | | | | | | | | | | | | | | |
Other income, net | | | 92 | | | | 52 | | | | 269 | | | | 102 | |
Interest expense, net | | | (22 | ) | | | (21 | ) | | | (98 | ) | | | (98 | ) |
| | | | | | | | | | | | | | | | |
| | | 70 | | | | 31 | | | | 171 | | | | 4 | |
| | | | | | | | | | | | | | | | |
Income from continuing operations before income tax expense, minority interest and equity income of affiliates | | | 324 | | | | 364 | | | | 1,064 | | | | 1,111 | |
Income tax expense | | | (120 | ) | | | (110 | ) | | | (314 | ) | | | (325 | ) |
Minority interest in income of subsidiaries | | | (132 | ) | | | (105 | ) | | | (380 | ) | | | (335 | ) |
Equity income of affiliates | | | — | | | | 1 | | | | 4 | | | | 2 | |
| | | | | | | | | | | | | | | | |
Income from continuing operations | | | 72 | | | | 150 | | | | 374 | | | | 453 | |
(Loss) income from discontinued operations | | | (10 | ) | | | 40 | | | | (52 | ) | | | 37 | |
Cumulative effect of a change in accounting principle | | | — | | | | — | | | | — | | | | (47 | ) |
| | | | | | | | | | | | | | | | |
Net income | | $ | 62 | | | $ | 190 | | | $ | 322 | | | $ | 443 | |
| | | | | | | | | | | | | | | | |
Income per common share | | | | | | | | | | | | | | | | |
Basic: | | | | | | | | | | | | | | | | |
Income from continuing operations | | $ | 0.16 | | | $ | 0.34 | | | $ | 0.84 | | | $ | 1.02 | |
(Loss) income from discontinued operations | | | (0.02 | ) | | | 0.09 | | | | (0.12 | ) | | | 0.09 | |
Cumulative effect of a change in accounting principle | | | — | | | | — | | | | — | | | | (0.11 | ) |
| | | | | | | | | | | | | | | | |
Net income | | $ | 0.14 | | | $ | 0.42 | | | $ | 0.72 | | | $ | 1.00 | |
| | | | | | | | | | | | | | | | |
Basic weighted-average common shares outstanding | | | 446 | | | | 443 | | | | 446 | | | | 443 | |
| | | | | | | | | | | | | | | | |
Diluted weighted-average common shares outstanding | | | 449 | | | | 447 | | | | 449 | | | | 447 | |
| | | | | | | | | | | | | | | | |
Cash dividends declared per common share | | $ | 0.10 | | | $ | 0.10 | | | $ | 0.40 | | | $ | 0.30 | |
| | |
| NEWMONT – FOURTH QUARTER 2005 RESULTS (FEBRUARY 27, 2006) | | Page 9 of 9 |
CONSOLIDATED BALANCE SHEETS
| | | | | | |
| | | At December 31, |
| | | 2005 | | 2004 |
| | | (unaudited, in millions) |
| ASSETS | | | | | | |
Cash and cash equivalents | | $ | 1,082 | | $ | 781 |
Marketable securities and other short-term investments | | | 817 | | | 943 |
Trade receivables | | | 94 | | | 77 |
Accounts receivable | | | 136 | | | 130 |
Inventories | | | 320 | | | 244 |
Stockpiles and ore on leach pads | | | 255 | | | 230 |
Other current assets | | | 332 | | | 288 |
| | | | | | |
Current assets | | | 3,036 | | | 2,693 |
Property, plant and mine development, net | | | 5,645 | | | 5,136 |
Investments | | | 955 | | | 386 |
Long-term stockpiles and ore on leach pads | | | 603 | | | 525 |
Deferred income tax assets | | | 517 | | | 494 |
Other long-term assets | | | 283 | | | 264 |
Goodwill | | | 2,879 | | | 2,994 |
Assets of operations held for sale | | | 74 | | | 284 |
| | | | | | |
Total assets | | $ | 13,992 | | $ | 12,776 |
| | | | | | |
| LIABILITIES | | | | | | |
Current portion of long-term debt | | $ | 196 | | $ | 286 |
Accounts payable | | | 232 | | | 222 |
Employee-related benefits | | | 176 | | | 129 |
Derivative instruments | | | 270 | | | 71 |
Other current liabilities | | | 476 | | | 375 |
| | | | | | |
Current liabilities | | | 1,350 | | | 1,083 |
Long-term debt | | | 1,733 | | | 1,316 |
Reclamation and remediation liabilities | | | 445 | | | 418 |
Deferred income tax liabilities | | | 449 | | | 460 |
Employee-related benefits | | | 273 | | | 244 |
Other long-term liabilities | | | 414 | | | 487 |
Liabilities of operations held for sale | | | 21 | | | 55 |
| | | | | | |
Total liabilities | | | 4,685 | | | 4,063 |
| | | | | | |
Minority interest in subsidiaries | | | 931 | | | 775 |
| | | | | | |
| STOCKHOLDERS’ EQUITY | | | | | | |
Common stock | | | 666 | | | 656 |
Additional paid-in capital | | | 6,578 | | | 6,524 |
Accumulated other comprehensive income | | | 378 | | | 147 |
Retained earnings | | | 754 | | | 611 |
| | | | | | |
Total stockholders’ equity | | | 8,376 | | | 7,938 |
| | | | | | |
Total liabilities and stockholders’ equity | | $ | 13,992 | | $ | 12,776 |
| | | | | | |
| | |
| NEWMONT – FOURTH QUARTER 2005 RESULTS (FEBRUARY 27, 2006) | | Page 10 of 10 |
STATEMENTS OF CONSOLIDATED CASH FLOWS
| | | | | | | | | | | | | | | | |
| | | Three Months Ended
December 31, | | | Years Ended
December 31, | |
| | | 2005 | | | 2004 | | | 2005 | | | 2004 | |
| | | (unaudited, in millions) | |
Operating activities: | | | | | | | | | | | | | | | | |
Net income | | $ | 62 | | | $ | 190 | | | $ | 322 | | | $ | 443 | |
Adjustments to reconcile net income to net cash provided from operating activities: | | | | | | | | | | | | | | | | |
Depreciation, depletion and amortization | | | 171 | | | | 162 | | | | 644 | | | | 662 | |
Minority interest expense | | | 132 | | | | 105 | | | | 380 | | | | 335 | |
Loss (income) from discontinued operations | | | 10 | | | | (40 | ) | | | 52 | | | | (37 | ) |
Revenue from prepaid forward sales obligation | | | — | | | | — | | | | (48 | ) | | | — | |
Accretion of accumulated reclamation obligations | | | 7 | | | | 6 | | | | 27 | | | | 25 | |
Amortization of deferred stripping costs, net | | | (6 | ) | | | (4 | ) | | | (56 | ) | | | 4 | |
Deferred income taxes | | | 22 | | | | 16 | | | | (12 | ) | | | 74 | |
Write-down of inventories, stockpiles and ore on leach pads | | | 1 | | | | 14 | | | | 13 | | | | 25 | |
Write-down of long-lived assets | | | 41 | | | | 13 | | | | 43 | | | | 39 | |
Write-down of goodwill | | | 41 | | | | 52 | | | | 41 | | | | 52 | |
Cumulative effect of change in accounting principle, net | | | — | | | | — | | | | — | | | | 47 | |
(Gain) loss on investments, net | | | (27 | ) | | | — | | | | (54 | ) | | | 39 | |
Gain on guarantee of QMC debt | | | (9 | ) | | | (11 | ) | | | (9 | ) | | | (11 | ) |
(Gain) loss on asset sales, net | | | (12 | ) | | | 1 | | | | (48 | ) | | | (28 | ) |
Hedge loss, net | | | 31 | | | | 6 | | | | 99 | | | | 10 | |
Other operating adjustments | | | 55 | | | | (42 | ) | | | 56 | | | | (23 | ) |
Increase (Decrease) in operating assets: | | | | | | | | | | | | | | | | |
Trade and accounts receivable | | | (26 | ) | | | 63 | | | | (65 | ) | | | (6 | ) |
Inventories, stockpiles and ore on leach pads | | | (27 | ) | | | (25 | ) | | | (189 | ) | | | (15 | ) |
Other assets | | | (30 | ) | | | 12 | | | | (32 | ) | | | (1 | ) |
Increase (Decrease) in operating liabilities: | | | | | | | | | | | | | | | | |
Accounts payable and other accrued liabilities | | | 77 | | | | 84 | | | | 137 | | | | (37 | ) |
Early settlement of derivative instruments classified as cash flow hedges | | | — | | | | — | | | | — | | | | — | |
Reclamation liabilities | | | (24 | ) | | | (15 | ) | | | (48 | ) | | | (48 | ) |
| | | | | | | | | | | | | | | | |
Net cash provided from continuing operations | | | 489 | | | | 587 | | | | 1,253 | | | | 1,549 | |
Net cash (used in) provided from discontinued operations | | | (7 | ) | | | (2 | ) | | | (10 | ) | | | 8 | |
| | | | | | | | | | | | | | | | |
Net cash from operations | | | 482 | | | | 585 | | | | 1,243 | | | | 1,557 | |
| | | | | | | | | | | | | | | | |
Investing activities: | | | | | | | | | | | | | | | | |
Additions to property, plant and mine development | | | (340 | ) | | | (189 | ) | | | (1,226 | ) | | | (683 | ) |
Additions to property, plant and mine development of discontinued operations | | | — | | | | (9 | ) | | | (25 | ) | | | (35 | ) |
Investments in marketable debt and equity securities | | | (771 | ) | | | (380 | ) | | | (3,301 | ) | | | (1,720 | ) |
Proceeds from sale of marketable debt and equity securities | | | 796 | | | | 219 | | | | 3,358 | | | | 899 | |
Proceeds from sale of discontinued operations | | | 5 | | | | — | | | | 147 | | | | — | |
Cash recorded upon consolidation of Batu Hijau | | | — | | | | — | | | | — | | | | 82 | |
Proceeds from sale of assets | | | 18 | | | | 28 | | | | 79 | | | | 51 | |
Other investing | | | (10 | ) | | | (28 | ) | | | (9 | ) | | | (26 | ) |
| | | | | | | | | | | | | | | | |
Net cash used in investing activities | | | (302 | ) | | | (359 | ) | | | (977 | ) | | | (1,432 | ) |
| | | | | | | | | | | | | | | | |
Financing activities: | | | | | | | | | | | | | | | | |
Proceeds from debt, net | | | — | | | | — | | | | 583 | | | | 56 | |
Repayments of debt | | | (76 | ) | | | (95 | ) | | | (218 | ) | | | (254 | ) |
Dividends paid to common stockholders | | | (45 | ) | | | (44 | ) | | | (179 | ) | | | (133 | ) |
Dividends paid to minority interests | | | (101 | ) | | | (143 | ) | | | (186 | ) | | | (237 | ) |
Proceeds from stock issuance | | | 26 | | | | 45 | | | | 43 | | | | 78 | |
Change in restricted cash and other | | | 3 | | | | (3 | ) | | | (5 | ) | | | 15 | |
| | | | | | | | | | | | | | | | |
Net cash provided from (used in) financing activities | | | (193 | ) | | | (240 | ) | | | 38 | | | | (475 | ) |
| | | | | | | | | | | | | | | | |
Effect of exchange rate changes on cash | | | — | | | | 5 | | | | (3 | ) | | | 2 | |
| | | | | | | | | | | | | | | | |
Net change in cash and cash equivalents | | | (13 | ) | | | (9 | ) | | | 301 | | | | (348 | ) |
Cash and cash equivalents at beginning of year | | | 1,095 | | | | 790 | | | | 781 | | | | 1,129 | |
| | | | | | | | | | | | | | | | |
Cash and cash equivalents at end of year | | $ | 1,082 | | | $ | 781 | | | $ | 1,082 | | | $ | 781 | |
| | | | | | | | | | | | | | | | |
| | |
| NEWMONT – FOURTH QUARTER 2005 RESULTS (FEBRUARY 27, 2006) | | Page 11 of 11 |
2006 GUIDANCE
| | | | | | | |
Gold | | Equity Sales
(000 ounces) | | Consolidated
Sales (000
ounces) | | Consolidated Costs Applicable to Sales
( $ /oz) |
Nevada1 | | 2,410 | | 2,585 | | $ | 380 |
Yanacocha | | 1,330 | | 2,585 | | $ | 185 |
Batu Hijau | | 305 | | 575 | | $ | 155 |
Pajingo | | 195 | | 195 | | $ | 275 |
Jundee | | 335 | | 335 | | $ | 335 |
Tanami | | 435 | | 435 | | $ | 330 |
Kalgoorlie | | 430 | | 430 | | $ | 395 |
Martha | | 130 | | 130 | | $ | 265 |
Ahafo1 | | 260 | | 260 | | $ | 225 |
Holloway2 | | 75 | | 75 | | $ | 455 |
Golden Giant | | 15 | | 15 | | $ | 520 |
La Herradura | | 85 | | 85 | | $ | 210 |
Kori Kollo | | 110 | | 125 | | $ | 220 |
Zarafshan | | 145 | | 145 | | $ | 260 |
TOTAL GOLD | | 6,260 | | 7,980 | | $ | 283 |
| | | |
Copper | | Equity Sales (million lbs) | | Consolidated Sales (million lbs) | | Consolidated Costs Applicable to Sales ( $ /lb) |
Batu Hijau | | 300 | | 565 | | | $0.45 |
| Consolidated Financial Guidance ($ in million, except tax rate) | | | | | | | |
Royalty and dividend income | | | | | | | $60-$ 75 |
Depreciation, depletion & amortization | | | | | | | $ 700-$ 750 |
Exploration | | | | | | | $ 150-$ 160 |
Advanced projects, research and development | | | | | | | $40 -$ 45 |
General and administrative | | | | | | | $ 150-$ 160 |
Interest expense, net | | | | | | | $95-$ 105 |
Tax rate (assuming $525/oz gold) | | | | | | | 30%-34% |
Capital expenditures3 | | | | | | | $1,350 -$ 1,500 |
| (1) | The Company will account for incidental sales during the start-up phase at Leeville, Phoenix and Ahafo in Other income net of related incremental costs of production. |
| (2) | The Company accounts for Holloway as a discontinued operation. |
| (3) | Excludes approximately $47 million related to the acquisition of the additional 22.2% interest in Boddington. |
| | |
| NEWMONT – FOURTH QUARTER 2005 RESULTS (FEBRUARY 27, 2006) | | Page 12 of 12 |
COMPARISON OF EQUITY GOLD SALES OUNCES AND CONSOLIDATED GOLD SALES OUNCES
| | | | | | | | | | | |
| | | | | | Q4 2005 | | Q4 2004 |
Geographic Region | | | Equity Sales
(000 ozs)1 | | Consolidated
Sales (000 oz) | | Equity Sales
(000 ozs)1 | | Consolidated
Sales (000 oz) |
Operations | | Ownership | | | | | | | | | |
Nevada | | 100.00 | % | | 606.2 | | 651.9 | | 668.2 | | 702.7 |
Yanacocha | | 51.35 | % | | 545.8 | | 1,062.9 | | 436.0 | | 849.1 |
Batu Hijau | | 52.88 | % | | 95.7 | | 180.9 | | 94.6 | | 178.9 |
Australia/New Zealand | | | | | | | | | | | |
Pajingo | | 100.00 | % | | 51.0 | | 51.0 | | 69.4 | | 69.4 |
Yandal | | 100.00 | % | | 92.9 | | 92.9 | | 88.3 | | 88.3 |
Tanami | | 100.00 | % | | 108.2 | | 108.2 | | 152.2 | | 152.2 |
Kalgoorlie | | 50.00 | % | | 109.4 | | 109.4 | | 123.1 | | 123.1 |
Martha | | 100.00 | % | | 35.5 | | 35.5 | | 40.2 | | 40.2 |
Other | | | | | | | | | | | |
Golden Giant | | 100.00 | % | | 46.0 | | 46.0 | | 41.6 | | 41.6 |
Holloway | | 84.65 | % | | 16.0 | | — | | 19.0 | | — |
La Herradura | | 44.00 | % | | 19.0 | | 19.0 | | 17.4 | | 17.4 |
Kori Kollo | | 88.00 | % | | 43.5 | | 49.4 | | 4.9 | | 5.6 |
Zarafshan | | 50.00 | % | | 29.6 | | 29.6 | | 39.2 | | 39.2 |
Newmont | | | | | 1,798.8 | | 2,436.7 | | 1,794.1 | | 2,307.7 |
| (1) | Includes sales from Holloway, which is accounted for as a discontinued operation. |
| | | | | | | | | | | |
| | | | | | 2005 | | 2004 |
Geographic Region | | | Equity Sales
(000 ozs)1 | | Consolidated
Sales (000 oz) | | Equity Sales
(000 ozs)1 | | Consolidated
Sales (000 oz) |
Operations | | Ownership | | | | | | | | | |
Nevada | | 100.00 | % | | 2,287.2 | | 2,444.1 | | 2,416.0 | | 2,538.0 |
Yanacocha | | 51.35 | % | | 1,708.7 | | 3,327.5 | | 1,561.0 | | 3,039.9 |
Batu Hijau | | 52.88 | % | | 381.0 | | 720.5 | | 396.3 | | 715.2 |
Australia/New Zealand | | | | | | | | | | | |
Pajingo | | 100.00 | % | | 192.0 | | 192.0 | | 251.4 | | 251.4 |
Yandal | | 100.00 | % | | 341.8 | | 341.8 | | 379.3 | | 379.3 |
Tanami | | 100.00 | % | | 493.7 | | 493.7 | | 658.0 | | 658.0 |
Kalgoorlie | | 50.00 | % | | 409.6 | | 409.6 | | 468.4 | | 468.4 |
Martha | | 100.00 | % | | 163.4 | | 163.4 | | 130.5 | | 130.5 |
Other | | | | | | | | | | | |
Golden Giant | | 100.00 | % | | 162.0 | | 162.0 | | 160.0 | | 160.0 |
Holloway | | 84.65 | % | | 67.8 | | — | | 67.4 | | — |
La Herradura | | 44.00 | % | | 80.2 | | 80.2 | | 68.8 | | 68.8 |
Kori Kollo | | 88.00 | % | | 83.2 | | 94.5 | | 21.7 | | 24.6 |
Minahasa | | 94.00 | % | | — | | — | | 70.2 | | 74.7 |
Zarafshan | | 50.00 | % | | 122.7 | | 122.7 | | 210.1 | | 210.1 |
Ovacik | | 100.00 | % | | — | | — | | 110.0 | | 110.0 |
Newmont | | | | | 6,493.3 | | 8,552.0 | | 6,969.1 | | 8,828.9 |
| (1) | Includes sales from Holloway, which is accounted for as a discontinued operation. |
| | |
| NEWMONT – FOURTH QUARTER 2005 RESULTS (FEBRUARY 27, 2006) | | Page 13 of 13 |
SUPPLEMENTAL INFORMATION
PROVEN AND PROBABLE GOLD RESERVES
Equity Proven, Probable, and Combined Gold Reserves(1)
| | | | | | | | | | | | | | | | | | | | | | | | | | | | | | |
| | | | | | December 31, 2005 | | | December 31, 2004 |
Deposits/Districts by Reporting Unit | | Newmont
Share | | | Gold Proven Reserves | | Gold Probable Reserves | | Gold Proven + Probable Reserves | | Metallurgical
Recovery | | | Gold Proven + Probable
Reserves |
| | | Tonnage
(000 tons) | | Grade
(oz/ton) | | Ounces
(000 ozs) | | Tonnage
(000 tons) | | Grade
(oz/ton) | | Ounces
(000 ozs) | | Tonnage
(000 tons) | | Grade
(oz/ton) | | Ounces
(000 ozs) | | | Tonnage
(000 tons) | | Grade
(oz/ton) | | Ounces
(000
ozs) |
Nevada | | | | | | | | | | | | | | | | | | | | | | | | | | | | | | |
Carlin Open Pit(2) | | 100 | % | | 21,000 | | 0.072 | | 1,520 | | 217,300 | | 0.041 | | 8,810 | | 238,300 | | 0.043 | | 10,330 | | 72 | % | | 201,600 | | 0.047 | | 9,420 |
Twin Creeks | | 100 | % | | 14,800 | | 0.081 | | 1,200 | | 46,400 | | 0.072 | | 3,320 | | 61,200 | | 0.074 | | 4,520 | | 82 | % | | 61,800 | | 0.075 | | 4,660 |
Lone Tree Complex(3) | | 100 | % | | 800 | | 0.096 | | 70 | | 3,200 | | 0.076 | | 250 | | 4,000 | | 0.080 | | 320 | | 80 | % | | 14,000 | | 0.063 | | 880 |
Phoenix(4) | | 100 | % | | 0 | | | | 0 | | 308,400 | | 0.029 | | 8,950 | | 308,400 | | 0.029 | | 8,950 | | 81 | % | | 248,000 | | 0.034 | | 8,470 |
Carlin Underground(5) | | 100 | % | | 1,700 | | 0.53 | | 900 | | 6,000 | | 0.47 | | 2,850 | | 7,700 | | 0.49 | | 3,750 | | 94 | % | | 8,700 | | 0.51 | | 4,410 |
Midas(6) | | 100 | % | | 600 | | 0.67 | | 430 | | 900 | | 0.52 | | 470 | | 1,500 | | 0.58 | | 900 | | 95 | % | | 2,900 | | 0.51 | | 1,450 |
Turquoise Ridge(7) | | 25 | % | | 1,100 | | 0.56 | | 620 | | 800 | | 0.57 | | 480 | | 1,900 | | 0.56 | | 1,100 | | 90 | % | | 1,700 | | 0.61 | | 1,050 |
Nevada Stockpiles(8) | | 100 | % | | | | | | | | | | | | | | | | | | | | | | | | | | | |
| | | | | 22,600 | | 0.089 | | 2,010 | | 4,800 | | 0.053 | | 250 | | 27,400 | | 0.083 | | 2,260 | | 80 | % | | 30,300 | | 0.086 | | 2,610 |
Nevada In-Process(9) | | 100 | % | | 46,800 | | 0.021 | | 1,000 | | 2,100 | | 0.067 | | 140 | | 48,900 | | 0.023 | | 1,140 | | 65 | % | | 47,000 | | 0.022 | | 1,020 |
| | | | | | | | | | | | | | | | | | | | | | | | | | | | | | |
TOTAL NEVADA | | | | | 109,400 | | 0.071 | | 7,750 | | 589,900 | | 0.043 | | 25,520 | | 699,300 | | 0.048 | | 33,270 | | 80 | % | | 616,000 | | 0.055 | | 33,970 |
| | | | | | | | | | | | | | | | | | | | | | | | | | | | | | |
Yanacocha, Peru | | | | | | | | | | | | | | | | | | | | | | | | | | | | | | |
Yanacocha Open Pits(10) | | 51.35 | % | | 30,900 | | 0.024 | | 740 | | 263,600 | | 0.034 | | 8,960 | | 294,500 | | 0.033 | | 9,700 | | 69 | % | | 348,200 | | 0.032 | | 11,270 |
Yanacocha In-Process(9) | | 51.35 | % | | 34,700 | | 0.028 | | 970 | | 0 | | | | 0 | | 34,700 | | 0.028 | | 970 | | 70 | % | | 29,000 | | 0.028 | | 820 |
Conga(11) | | 51.35 | % | | 0 | | | | 0 | | 317,200 | | 0.019 | | 6,080 | | 317,200 | | 0.019 | | 6,080 | | 79 | % | | 190,500 | | 0.023 | | 4,470 |
| | | | | | | | | | | | | | | | | | | | | | | | | | | | | | |
TOTAL YANACOCHA | | | | | 65,600 | | 0.026 | | 1,710 | | 580,800 | | 0.026 | | 15,040 | | 646,400 | | 0.026 | | 16,750 | | 73 | % | | 567,700 | | 0.029 | | 16,560 |
| | | | | | | | | | | | | | | | | | | | | | | | | | | | | | |
Australia/New Zealand | | | | | | | | | | | | | | | | | | | | | | | | | | | | | | |
Boddington, Western Australia(12) | | 44.44 | % | | 60,600 | | 0.029 | | 1,780 | | 136,800 | | 0.025 | | 3,380 | | 197,400 | | 0.026 | | 5,160 | | 82 | % | | 190,900 | | 0.025 | | 4,850 |
Golden Grove, Western Australia(13) | | 100 | % | | 0 | | | | 0 | | 0 | | | | 0 | | 0 | | | | 0 | | | | | 4,500 | | 0.045 | | 200 |
Kalgoorlie Open Pits and Underground | | 50 | % | | 32,900 | | 0.060 | | 1,980 | | 39,400 | | 0.063 | | 2,500 | | 72,300 | | 0.062 | | 4,480 | | 88 | % | | 75,400 | | 0.063 | | 4,750 |
Kalgoorlie Stockpiles(8) | | 50 | % | | 12,600 | | 0.033 | | 420 | | 0 | | | | 0 | | 12,600 | | 0.033 | | 420 | | 88 | % | | 12,400 | | 0.035 | | 430 |
Total Kalgoorlie, Western Australia(14) | | 50 | % | | 45,500 | | 0.053 | | 2,400 | | 39,400 | | 0.063 | | 2,500 | | 84,900 | | 0.058 | | 4,900 | | 88 | % | | 87,800 | | 0.059 | | 5,180 |
Pajingo, Queensland | | 100 | % | | 400 | | 0.41 | | 150 | | 1,200 | | 0.25 | | 300 | | 1,600 | | 0.29 | | 450 | | 97 | % | | 1,900 | | 0.34 | | 650 |
Tanami Underground and Open Pits | | 100 | % | | 5,400 | | 0.17 | | 890 | | 8,100 | | 0.16 | | 1,330 | | 13,500 | | 0.16 | | 2,220 | | 95 | % | | 12,100 | | 0.16 | | 1,950 |
Tanami Stockpiles(8) | | 100 | % | | 400 | | 0.074 | | 30 | | 2,200 | | 0.037 | | 80 | | 2,600 | | 0.043 | | 110 | | 95 | % | | 4,100 | | 0.048 | | 200 |
Total Tanami, Northern Territory | | 100 | % | | 5,800 | | 0.16 | | 920 | | 10,300 | | 0.14 | | 1,410 | | 16,100 | | 0.15 | | 2,330 | | 95 | % | | 16,200 | | 0.13 | | 2,150 |
Jundee, Western Australia | | 100 | % | | 2,900 | | 0.060 | | 170 | | 3,700 | | 0.36 | | 1,360 | | 6,600 | | 0.23 | | 1,530 | | 93 | % | | 8,400 | | 0.17 | | 1,410 |
Martha, New Zealand(15) | | 100 | % | | 0 | | | | 0 | | 3,500 | | 0.16 | | 570 | | 3,500 | | 0.16 | | 570 | | 91 | % | | 4,400 | | 0.15 | | 670 |
| | | | | | | | | | | | | | | | | | | | | | | | | | | | | | |
TOTAL AUSTRALIA/NEW ZEALAND | | | | | 115,200 | | 0.047 | | 5,420 | | 194,900 | | 0.049 | | 9,520 | | 310,100 | | 0.048 | | 14,940 | | 88 | % | | 314,100 | | 0.048 | | 15,110 |
| | | | | | | | | | | | | | | | | | | | | | | | | | | | | | |
Batu Hijau, Indonesia | | | | | | | | | | | | | | | | | | | | | | | | | | | | | | |
Batu Hijau Open Pit(16) | | 52.875 | % | | 147,600 | | 0.012 | | 1,770 | | 446,500 | | 0.010 | | 4,540 | | 594,100 | | 0.011 | | 6,310 | | 80 | % | | 588,700 | | 0.012 | | 6,910 |
Batu Hijau Stockpiles(8) (16) | | 52.875 | % | | 0 | | | | 0 | | 103,900 | | 0.003 | | 340 | | 103,900 | | 0.003 | | 340 | | 69 | % | | 86,400 | | 0.004 | | 300 |
| | | | | | | | | | | | | | | | | | | | | | | | | | | | | | |
TOTAL BATU HIJAU | | | | | 147,600 | | 0.012 | | 1,770 | | 550,400 | | 0.009 | | 4,880 | | 698,000 | | 0.010 | | 6,650 | | 80 | % | | 675,100 | | 0.011 | | 7,210 |
| | | | | | | | | | | | | | | | | | | | | | | | | | | | | | |
Ghana | | | | | | | | | | | | | | | | | | | | | | | | | | | | | | |
Akyem(17) | | 85 | % | | 0 | | | | 0 | | 125,100 | | 0.052 | | 6,510 | | 125,100 | | 0.052 | | 6,510 | | 89 | % | | 109,400 | | 0.049 | | 5,410 |
Ahafo(18) | | 100 | % | | 0 | | | | 0 | | 156,900 | | 0.078 | | 12,190 | | 156,900 | | 0.078 | | 12,190 | | 88 | % | | 156,900 | | 0.068 | | 10,630 |
| | | | | | | | | | | | | | | | | | | | | | | | | | | | | | |
TOTAL GHANA | | | | | 0 | | | | 0 | | 282,000 | | 0.066 | | 18,700 | | 282,000 | | 0.066 | | 18,700 | | 88 | % | | 266,300 | | 0.060 | | 16,040 |
| | | | | | | | | | | | | | | | | | | | | | | | | | | | | | |
Other Operations | | | | | | | | | | | | | | | | | | | | | | | | | | | | | | |
Golden Giant, Ontario(19) | | 100 | % | | 0 | | | | 0 | | 0 | | | | 0 | | 0 | | | | 0 | | | | | 500 | | 0.31 | | 160 |
Holloway, Ontario(20) | | 100 | % | | 50 | | 0.17 | | 10 | | 100 | | 0.20 | | 20 | | 150 | | 0.19 | | 30 | | 90 | % | | 1,400 | | 0.18 | | 260 |
La Herradura, Mexico | | 44 | % | | 18,100 | | 0.021 | | 380 | | 16,800 | | 0.023 | | 390 | | 34,900 | | 0.022 | | 770 | | 66 | % | | 22,300 | | 0.027 | | 610 |
Kori Kollo, Bolivia | | 88 | % | | 12,600 | | 0.010 | | 120 | | 16,200 | | 0.019 | | 320 | | 28,800 | | 0.015 | | 440 | | 63 | % | | 22,500 | | 0.021 | | 470 |
Ovacik, Turkey(21) | | 100 | % | | 0 | | | | 0 | | 0 | | | | 0 | | 0 | | | | 0 | | | | | 400 | | 0.25 | | 100 |
Zarafshan, Uzbekistan(22) | | 50 | % | | 46,700 | | 0.036 | | 1,690 | | 0 | | | | 0 | | 46,700 | | 0.036 | | 1,690 | | 56 | % | | 53,800 | | 0.037 | | 1,940 |
| | | | | | | | | | | | | | | | | | | | | | | | | | | | | | |
TOTAL OTHER OPERATIONS | | | | | 77,450 | | 0.028 | | 2,200 | | 33,100 | | 0.022 | | 730 | | 110,550 | | 0.027 | | 2,930 | | 60 | % | | 100,900 | | 0.035 | | 3,540 |
| | | | | | | | | | | | | | | | | | | | | | | | | | | | | | |
TOTAL | | | | | 515,250 | | 0.037 | | 18,850 | | 2,231,100 | | 0.033 | | 74,390 | | 2,746,350 | | 0.034 | | 93,240 | | 81 | % | | 2,540,100 | | 0.036 | | 92,430 |
| | | | | | | | | | | | | | | | | | | | | | | | | | | | | | |
| (1) | Reserves are calculated at a gold price of US$400, A$550, or NZ$650 per ounce unless otherwise noted. 2004 reserves were calculated at a gold price of US$350, A$550, or NZ$650 per ounce unless otherwise noted. Tonnage amounts have been rounded to the nearest 100,000 unless they are less than 50,000, and gold ounces have been rounded to the nearest 10,000. |
| (2) | Includes undeveloped reserves at Castle Reef, North Lantern and Emigrant deposits for combined total undeveloped reserves of 1.75 million ounces. |
| (3) | The Lone Tree deposit will be mined out in August 2006 based on the current mine plan. Processing of stockpiles and residual leaching will continue after the open pit operation is closed. |
| (4) | Deposit is partially developed. Construction of facilities began in November 2004, and production is expected in 2006. |
| (5) | Includes partially developed reserves at Leeville, which contains total reserves of 2.43 million ounces. Production is expected in 2006. |
| (6) | Also contains reserves of 11 million ounces of silver with a metallurgical recovery of 90%. |
| (7) | Reserve estimates provided by Placer Dome, the operator of the Turquoise Ridge Joint Venture. |
| (8) | Stockpiles are comprised primarily of material that has been set aside to allow processing of higher grade material in the mills. Stockpiles increase or decrease depending on current mine plans. Stockpile reserves are reported separately where tonnage or contained ounces are greater than 5% of the total site-reported reserves and contained ounces are greater than 100,000. |
| (9) | In-process material is the material on leach pads at the end of each year from which gold remains to be recovered. In-process material reserves are reported separately where tonnage or contained ounces are greater than 5% of the total site-reported reserves and contained ounces are greater than 100,000. |
| (10) | Reserves include currently undeveloped deposits at Corimayo and Chaquicocha Sur, which contain combined undeveloped reserves of 3.0 million equity ounces.(11) Deposits are currently undeveloped. |
| (12) | Deposit is currently undeveloped. Newmont announced the acquisition of an additional 22.22% equity interest on February 12, 2006, which will increase Newmont's equity ownership to 66.67%. |
| (13) | Golden Grove was sold in June 2005. |
| (14) | Reserves based on a gold price of A$560 per ounce. |
| (15) | Includes partially developed reserves of 350,000 ounces at the Favona deposit. |
| (16) | Percentage reflects Newmont's economic interest in the remaining reserves. |
| (17) | Deposit is undeveloped. Newmont acquired the remaining 15% interest in January 2006, bringing Newmont's equity interest to 100%. |
| (18) | Deposits are partially developed. Includes undeveloped reserves totaling 5.51 million ounces. Construction of facilities began in November 2004, and production is expected in 2006. |
| (19) | Reserves were depleted by mining in December 2005. The mine is in closure. |
| (20) | Newmont’s equity interest increased to 100% in 2005 from 93.87% in 2004 because our joint venture partner elected not to participate in the work program as of September 30, 2005; as a result, its equity interest converted into a net profits interest. Property includes partially developed reserves of 15,000 ounces at the Blacktop deposit. |
| (21) | Ovacik was sold in March 2005. |
| (22) | Reserves are comprised primarily of stockpile material contractually designated for processing by Zarafshan-Newmont. Tonnage and gold content of material available to Zarafshan-Newmont for processing from the designated stockpiles are guaranteed by the state entities of Uzbekistan. Subsequent to December 31, 2005, and pursuant to an agreement with the state entities, the state entities re-designated the stockpile material available to Zarafshan-Newmont, which will reduce 2006 reserves by approximately 190,000 ounces. |
| | |
| NEWMONT – FOURTH QUARTER 2005 RESULTS (FEBRUARY 27, 2006) | | Page 14 of 14 |
GOLD NON-RESERVE MINERALIZATION
Equity Gold Mineralized Material Not in Reserves(1)
| | | | | | | | | | | | | | | | | | | |
| | | December 31, 2005 |
Deposits/Districts | | Newmont
Share | | | Gold Measured
Material | | Gold Indicated
Material | | Gold Measured +
Indicated Material | | Gold Inferred
Material |
| | | Tonnage
(000 tons) | | Grade
(oz/ton) | | Tonnage
(000 tons) | | Grade
(oz/ton) | | Tonnage
(000 tons) | | Grade
(oz/ton) | | Tonnage
(000 tons) | | Grade
(oz/ton) |
Nevada | | | | | | | | | | | | | | | | | | | |
Carlin Open Pit | | 100 | % | | 4,400 | | 0.045 | | 23,700 | | 0.039 | | 28,100 | | 0.040 | | 4,200 | | 0.024 |
Twin Creeks | | 100 | % | | 1,900 | | 0.058 | | 18,000 | | 0.048 | | 19,900 | | 0.049 | | 3,100 | | 0.033 |
Lone Tree Complex(2) | | 100 | % | | 3,000 | | 0.032 | | 0 | | | | 3,000 | | 0.032 | | 0 | | |
Phoenix | | 100 | % | | 0 | | 0.000 | | 22,200 | | 0.023 | | 22,200 | | 0.023 | | 16,500 | | 0.026 |
Total Nevada Open Pit | | | | | 9,300 | | 0.043 | | 63,900 | | 0.036 | | 73,200 | | 0.037 | | 23,800 | | 0.026 |
Carlin Underground | | 100 | % | | 100 | | 0.41 | | 200 | | 0.28 | | 300 | | 0.33 | | 3,700 | | 0.46 |
Midas | | 100 | % | | 0 | | 0.00 | | 0 | | | | 0 | | | | 600 | | 0.42 |
Turquoise Ridge(3) | | 25 | % | | 800 | | 0.42 | | 600 | | 0.42 | | 1,400 | | 0.42 | | 400 | | 0.54 |
Total Nevada Underground | | | | | 900 | | 0.42 | | 800 | | 0.39 | | 1,700 | | 0.41 | | 4,700 | | 0.46 |
Nevada Stockpiles(4) | | 100 | % | | 4,800 | | 0.055 | | 0 | | | | 4,800 | | 0.055 | | 0 | | |
| | | | | | | | | | | | | | | | | | | |
TOTAL NEVADA | | | | | 15,000 | | 0.070 | | 64,700 | | 0.040 | | 79,700 | | 0.046 | | 28,500 | | 0.099 |
| | | | | | | | | | | | | | | | | | | |
Peru | | | | | | | | | | | | | | | | | | | |
Yanacocha | | 51.35 | % | | 500 | | 0.008 | | 83,900 | | 0.027 | | 84,400 | | 0.027 | | 24,200 | | 0.023 |
Conga | | 51.35 | % | | 0 | | | | 58,000 | | 0.013 | | 58,000 | | 0.013 | | 79,000 | | 0.011 |
La Zanja(5) | | 46.9 | % | | 5,200 | | 0.027 | | 3,800 | | 0.024 | | 9,000 | | 0.026 | | 0 | | |
| | | | | | | | | | | | | | | | | | | |
TOTAL PERU | | | | | 5,700 | | 0.025 | | 145,700 | | 0.021 | | 151,400 | | 0.021 | | 103,200 | | 0.014 |
| | | | | | | | | | | | | | | | | | | |
Australia/New Zealand | | | | | | | | | | | | | | | | | | | |
Boddington, Western Australia(6) | | 44.44 | % | | 7,200 | | 0.013 | | 63,500 | | 0.018 | | 70,700 | | 0.017 | | 158,600 | | 0.020 |
Kalgoorlie, Western Australia | | 50 | % | | 1,700 | | 0.058 | | 2,600 | | 0.065 | | 4,300 | | 0.062 | | 2,000 | | 0.149 |
Pajingo, Queensland | | 100 | % | | 0 | | | | 100 | | 0.11 | | 100 | | 0.11 | | 300 | | 0.33 |
Tanami, Northern Territory | | 100 | % | | 0 | | | | 900 | | 0.067 | | 900 | | 0.067 | | 5,500 | | 0.18 |
Jundee, Western Australia | | 100 | % | | 0 | | | | 400 | | 0.051 | | 400 | | 0.051 | | 1,800 | | 0.27 |
Martha, New Zealand | | 100 | % | | 0 | | | | 3,000 | | 0.17 | | 3,000 | | 0.17 | | 600 | | 0.29 |
| | | | | | | | | | | | | | | | | | | |
TOTAL AUSTRALIA/NEW ZEALAND | | | | | 8,900 | | 0.022 | | 70,500 | | 0.027 | | 79,400 | | 0.026 | | 168,800 | | 0.031 |
| | | | | | | | | | | | | | | | | | | |
Batu Hijau, Indonesia | | | | | | | | | | | | | | | | | | | |
Batu Hijau(7) | | 52.875 | % | | 10,100 | | 0.007 | | 47,600 | | 0.006 | | 57,700 | | 0.006 | | 25,600 | | 0.002 |
| | | | | | | | | | | | | | | | | | | |
TOTAL BATU HIJAU | | | | | 10,100 | | 0.007 | | 47,600 | | 0.006 | | 57,700 | | 0.006 | | 25,600 | | 0.002 |
| | | | | | | | | | | | | | | | | | | |
Ghana | | | | | | | | | | | | | | | | | | | |
Akyem(8) | | 85 | % | | 0 | | | | 9,800 | | 0.048 | | 9,800 | | 0.048 | | 3,900 | | 0.047 |
Ahafo | | 100 | % | | 0 | | | | 45,400 | | 0.063 | | 45,400 | | 0.063 | | 19,000 | | 0.074 |
| | | | | | | | | | | | | | | | | | | |
TOTAL AFRICA | | | | | 0 | | | | 55,200 | | 0.060 | | 55,200 | | 0.060 | | 22,900 | | 0.070 |
| | | | | | | | | | | | | | | | | | | |
Other Operations and Projects | | | | | | | | | | | | | | | | | | | |
Holloway, Ontario(9) | | 100 | % | | 700 | | 0.20 | | 2,000 | | 0.18 | | 2,700 | | 0.19 | | 0 | | |
La Herradura, Mexico | | 44 | % | | 7,200 | | 0.022 | | 9,700 | | 0.021 | | 16,900 | | 0.021 | | 7,400 | | 0.024 |
Kori Kollo, Bolivia | | 88 | % | | 0 | | | | 12,400 | | 0.018 | | 12,400 | | 0.018 | | 0 | | |
Martabe, Indonesia | | 95 | % | | 0 | | | | 0 | | | | 0 | | | | 42,600 | | 0.066 |
| | | | | | | | | | | | | | | | | | | |
TOTAL OTHER OPERATIONS AND PROJECTS | | | 7,900 | | 0.037 | | 24,100 | | 0.033 | | 32,000 | | 0.034 | | 50,000 | | 0.060 |
| | | | | | | | | | | | | | | | | | | |
TOTAL | | | | | 47,600 | | 0.037 | | 407,800 | | 0.029 | | 455,400 | | 0.030 | | 399,000 | | 0.036 |
| | | | | | | | | | | | | | | | | | | |
| (1) | Mineralized material is calculated at a gold price of US$425, A$600, or NZ$715 per ounce unless otherwise noted. 2004 Mineralized material was calculated at a gold price of US$375, A$600, or NZ$715 per ounce. Tonnage amounts have been rounded to the nearest 100,000. |
| (2) | The Lone Tree deposit will be mined out in August 2006 based on the current mine plan. Processing of stockpiles and residual leaching will continue after the open pit operation is closed. |
| (3) | Mineralized material estimates were provided by Placer Dome, the operator of the Turquoise Ridge Joint Venture. Placer Dome calculated mineralized material not in reserves assuming a gold price of US$450 per ounce. |
| (4) | Stockpiles are comprised primarily of material that has been set aside to allow processing of higher grade material in the mills. Stockpiles increase or decrease depending on current mine plans. |
| (5) | Mineralized material estimates were provided by Buenaventura, the operator of the La Zanja Project. Buenaventura calculated mineralized material at a gold price of US$350 per ounce. |
| (6) | Deposit is currently undeveloped. Newmont announced the acquisition of an additional 22.22% equity interest on February 12, 2006, which will increase Newmont's equity ownership to 66.67%. |
| (7) | Percentage reflects Newmont's economic interest in remaining mineralized material. |
| (8) | Newmont acquired the remaining 15% interest in January 2006, bringing Newmont's equity interest to 100%. |
| (9) | Newmont's equity interest increased to 100% in 2005 from 96.7% in 2004 because our joint venture partner elected not to participate in the work program as of September 30, 2005; as a result, its equity interest converted into a net profits interest. |
| | |
| NEWMONT – FOURTH QUARTER 2005 RESULTS (FEBRUARY 27, 2006) | | Page 15 of 15 |
COPPER PROVEN AND PROBABLE RESERVES
Equity Copper Reserves(1)
| | | | | | | | | | | | | | | | | | | | | | | | | | | | | | | | | | |
| | | | | | December 31, 2005 | | | December 31, 2004 |
Deposits/Districts | | Newmont
Share | | | Copper Proven Reserves | | Copper Probable Reserves | | Copper Proven + Probable Reserves | | Metallurgical
Recovery | | | Copper Proven +
Probable Reserves |
| | | Tonnage
(000 tons) | | Grade
(Cu%) | | | Copper
(million
pounds) | | Tonnage
(000 tons) | | Grade
(Cu%) | | | Copper
(million
pounds) | | Tonnage
(000 tons) | | Grade
(Cu%) | | | Copper
(million
pounds) | | | Tonnage
(000 tons) | | Grade
(Cu%) | | | Copper
(million
pounds) |
Phoenix, Nevada(2) | | 100 | % | | 0 | | | | | 0 | | 309,900 | | 0.15 | % | | 900 | | 309,900 | | 0.15 | % | | 900 | | 67 | % | | 216,700 | | 0.15 | % | | 660 |
Conga, Peru(3) | | 51.35 | % | | 0 | | | | | 0 | | 317,200 | | 0.26 | % | | 1,660 | | 317,200 | | 0.26 | % | | 1,660 | | 85 | % | | 190,600 | | 0.30 | % | | 1,140 |
Batu Hijau | | 52.875 | % | | 147,600 | | 0.47 | % | | 1,390 | | 446,500 | | 0.44 | % | | 3,920 | | 594,100 | | 0.45 | % | | 5,310 | | 83 | % | | 588,900 | | 0.48 | % | | 5,600 |
Batu Hijau, Stockpiles(4) | | 52.875 | % | | 0 | | | | | 0 | | 103,900 | | 0.36 | % | | 750 | | 103,900 | | 0.36 | % | | 750 | | 70 | % | | 86,500 | | 0.38 | % | | 660 |
Total Batu Hijau, Indonesia(5) | | 52.875 | % | | 147,600 | | 0.47 | % | | 1,390 | | 550,400 | | 0.42 | % | | 4,670 | | 698,000 | | 0.43 | % | | 6,060 | | 81 | % | | 675,400 | | 0.46 | % | | 6,260 |
Boddington, Western Australia(6) | | 44.44 | % | | 60,600 | | 0.12 | % | | 140 | | 136,600 | | 0.12 | % | | 340 | | 197,200 | | 0.12 | % | | 480 | | 83 | % | | 190,700 | | 0.12 | % | | 470 |
Golden Grove, Western Australia(7) | | 100 | % | | 0 | | | | | 0 | | 0 | | | | | 0 | | 0 | | | | | 0 | | | | | 8,700 | | 2.07 | % | | 360 |
| | | | | | | | | | | | | | | | | | | | | | | | | | | | | | | | | | |
TOTAL | | | | | 208,200 | | 0.37 | % | | 1,530 | | 1,314,100 | | 0.29 | % | | 7,570 | | 1,522,300 | | 0.30 | % | | 9,100 | | 81 | % | | 1,282,100 | | 0.35 | % | | 8,890 |
| | | | | | | | | | | | | | | | | | | | | | | | | | | | | | | | | | |
| (1) | Reserves are calculated at a copper price of US$1.00 or A$1.43 per pound. 2004 reserves were calculated at a copper price of US$0.90 or A$1.45 per pound. Tonnage amounts have been rounded to the nearest 100,000 and copper pounds have been rounded to the nearest 10 million. |
| (2) | Deposit is partially developed. Construction of facilities began in November 2004, and production is expected in 2006. |
| (3) | Deposits are undeveloped. |
| (4) | Stockpiles are comprised primarily of material that has been set aside to allow processing of higher grade material in the mill. Stockpiles increase or decrease depending on current mine plans. Stockpile reserves are reported separately where tonnage or contained metal is greater than 5% of the total site-reported reserves. |
| (5) | Percentage reflects Newmont's economic interest in remaining reserves. |
| (6) | Deposit is undeveloped. Newmont announced the acquisition of an additional 22.22% equity interest on February 12, 2006, which will increase Newmont's equity ownership to 66.67%. |
| (7) | Golden Grove was sold in July 2005. |
COPPER NON-RESERVE MINERALIZATION
Equity Copper Mineralized Material Not in Reserves(1)
| | | | | | | | | | | | | | | | | | | | | | | |
| | | December 31, 2005 | |
| | | | | | Copper Measured
Material | | | Copper Indicated
Material | | | Copper Measured +
Indicated Material | | | Copper Inferred
Material | |
Deposits/Districts | | Newmont
Share | | | Tonnage
(000 tons) | | Grade
(Cu%) | | | Tonnage
(000 tons) | | Grade
(Cu%) | | | Tonnage
(000 tons) | | Grade
(Cu%) | | | Tonnage
(000 tons) | | Grade
(Cu%) | |
Phoenix, Nevada | | 100 | % | | 0 | | | | | 20,600 | | 0.11 | % | | 20,600 | | 0.11 | % | | 15,200 | | 0.17 | % |
Conga, Peru | | 51.35 | % | | 0 | | | | | 58,000 | | 0.18 | % | | 58,000 | | 0.18 | % | | 79,000 | | 0.17 | % |
Batu Hijau, Indonesia(2) | | 52.875 | % | | 10,100 | | 0.30 | % | | 47,600 | | 0.31 | % | | 57,700 | | 0.31 | % | | 25,600 | | 0.27 | % |
Boddington, Western Australia(3) | | 44.44 | % | | 7,200 | | 0.08 | % | | 63,500 | | 0.08 | % | | 70,700 | | 0.08 | % | | 158,600 | | 0.09 | % |
| | | | | | | | | | | | | | | | | | | | | | | |
TOTAL NEWMONT | | | | | 17,300 | | 0.21 | % | | 189,700 | | 0.17 | % | | 207,000 | | 0.18 | % | | 278,400 | | 0.14 | % |
| | | | | | | | | | | | | | | | | | | | | | | |
| (1) | Mineralized material is calculated at a copper price of US$1.10 or A$1.47 per pound. 2004 mineralized material was calculated at a copper price of US$1.00 or A$1.50 per pound. Tonnage amounts have been rounded to the nearest 100,000. |
| (2) | Percentage reflects Newmont’s economic interest in remaining mineralized material. |
| (3) | Deposit is currently undeveloped. Newmont announced the acquisition of an additional 22.22% equity interest on February 12, 2006, which will increase Newmont’s equity ownership to 66.67%. |
| | |
| NEWMONT – FOURTH QUARTER 2005 RESULTS (FEBRUARY 27, 2006) | | Page 16 of 16 |
2005 INCOME ANALYSIS
| | | | | | | | | | | | | | | | |
Impact of the following transactions (after-tax) | | 2005 | | | 2004 | |
| | $ Million | | | EPS | | | $ Million | | | EPS | |
Income from continuing operations | | $ | 374 | | | $ | 0.84 | | | $ | 453 | | | $ | 1.02 | |
- Gain on sale of assets | | $ | 56 | | | $ | 0.13 | | | $ | 10 | | | $ | 0.02 | |
- Loss on write-down of long-lived assets | | ($ | 26 | ) | | ($ | 0.06 | ) | | ($ | 17 | ) | | ($ | 0.04 | ) |
- Loss on write-down of goodwill | | ($ | 41 | ) | | ($ | 0.09 | ) | | ($ | 52 | ) | | ($ | 0.12 | ) |
- Loss on write-down of Kinross | | | — | | | | — | | | ($ | 32 | ) | | ($ | 0.07 | ) |
- Loss on write-down of Ovacik | | | — | | | | — | | | ($ | 16 | ) | | ($ | 0.03 | ) |
- Gain on receivable valuation allowance | | $ | 6 | | | $ | 0.01 | | | | — | | | | — | |
- Buyat Bay litigation and settlement | | ($ | 30 | ) | | ($ | 0.06 | ) | | | — | | | | — | |
- (Loss)/gain on reclamation revisions | | ($ | 22 | ) | | ($ | 0.05 | ) | | $ | 10 | | | $ | 0.02 | |
- Loss on Nevada waste dump slide | | ($ | 4 | ) | | ($ | 0.01 | ) | | | — | | | | — | |
- Gain on various tax items | | $ | 27 | | | $ | 0.06 | | | $ | 62 | | | $ | 0.14 | |
| | |
| NEWMONT – FOURTH QUARTER 2005 RESULTS (FEBRUARY 27, 2006) | | Page 17 of 17 |
OPERATING STATISTICS SUMMARY
| | | | | | | | | | | | | | | | | | | | | | | | | | | | | | | | | | | | |
| | | Nevada | | Yanacocha, Peru | | Australia/ New
Zealand | | Batu Hijau,
Indonesia | | Other(1) | | Total |
Three months ended
December 31, | | 2005 | | 2004 | | 2005 | | 2004 | | 2005 | | 2004 | | 2005 | | 2004 | | 2005 | | 2004 | | 2005 | | 2004 |
Gold Summary | | | | | | | | | | | | | | | | | | | | | | | | | | | | | | | | | | | | |
Ounces sold (000) | | | 651.9 | | | 702.7 | | | 1,062.9 | | | 849.1 | | | 397.0 | | | 473.2 | | | 180.9 | | | 178.9 | | | 144.0 | | | 103.8 | | | 2,436.7 | | | 2,307.7 |
Equity ounces sold (000) | | | 606.2 | | | 668.2 | | | 545.8 | | | 436.0 | | | 397.0 | | | 473.2 | | | 95.7 | | | 94.6 | | | 138.1 | | | 103.1 | | | 1,782.8 | | | 1,775.1 |
Cost applicable to sales (in millions) | | $ | 222 | | $ | 191 | | $ | 154 | | $ | 111 | | $ | 125 | | $ | 138 | | $ | 29 | | $ | 24 | | $ | 31 | | $ | 23 | | $ | 561 | | $ | 487 |
Cost applicable to sales per ounce | | $ | 340 | | $ | 271 | | $ | 145 | | $ | 132 | | $ | 315 | | $ | 292 | | $ | 161 | | $ | 135 | | $ | 214 | | $ | 219 | | $ | 230 | | $ | 211 |
Depreciation and amortization (in millions) | | $ | 32 | | $ | 31 | | $ | 57 | | $ | 47 | | $ | 31 | | $ | 32 | | $ | 9 | | $ | 8 | | $ | 9 | | $ | 6 | | $ | 138 | | $ | 124 |
Depreciation and amortization per ounce | | $ | 49 | | $ | 44 | | $ | 53 | | $ | 55 | | $ | 79 | | $ | 67 | | $ | 47 | | $ | 44 | | $ | 62 | | $ | 56 | | $ | 56 | | $ | 54 |
Average realized price per ounce | | | | | | | | | | | | | | | | | | | | | | | | | | | | | | | | $ | 472 | | $ | 436 |
| (1) | Includes Golden Giant, Canada; La Herradura, Mexico; Kori Kollo, Bolivia and Zarafshan, Uzbekistan. |
| | | | | | | | | | | | | | | | | | | | | | | | | | | | | | | | | | | | |
| | | Nevada | | Yanacocha, Peru | | New Zealand | | Batu Hijau, Indonesia | | Other(1) | | Total |
Year ended
December 31, | | 2005 | | 2004 | | 2005 | | 2004 | | 2005 | | 2004 | | 2005 | | 2004 | | 2005 | | 2004 | | 2005 | | 2004 |
Gold Summary | | | | | | | | | | | | | | | | | | | | | | | | | | | | | | | | | | | | |
Ounces sold (000) | | | 2,444.1 | | | 2,538.0 | | | 3,327.5 | | | 3,039.9 | | | 1,600.5 | | | 1,887.6 | | | 720.5 | | | 715.2 | | | 459.4 | | | 648.2 | | | 8,552.0 | | | 8,828.9 |
Equity ounces sold (000) | | | 2,287.2 | | | 2,416.0 | | | 1,708.7 | | | 1,561.0 | | | 1,600.5 | | | 1,887.6 | | | 381.0 | | | 396.3 | | | 448.1 | | | 640.8 | | | 6,425.5 | | | 6,901.7 |
Cost applicable to sales (in millions) | | $ | 807 | | $ | 716 | | $ | 487 | | $ | 432 | | $ | 508 | | $ | 528 | | $ | 109 | | $ | 91 | | $ | 106 | | $ | 143 | | $ | 2,017 | | $ | 1,910 |
Cost applicable to sales per ounce | | $ | 333 | | $ | 282 | | $ | 147 | | $ | 142 | | $ | 317 | | $ | 280 | | $ | 152 | | $ | 128 | | $ | 229 | | $ | 220 | | $ | 236 | | $ | 216 |
Depreciation and amortization (in millions) | | $ | 124 | | $ | 127 | | $ | 205 | | $ | 198 | | $ | 118 | | $ | 126 | | $ | 34 | | $ | 28 | | $ | 29 | | $ | 47 | | $ | 509 | | $ | 526 |
Depreciation and amortization per ounce | | $ | 51 | | $ | 50 | | $ | 62 | | $ | 65 | | $ | 74 | | $ | 67 | | $ | 47 | | $ | 39 | | $ | 63 | | $ | 73 | | $ | 60 | | $ | 60 |
Average realized price per ounce | | | | | | | | | | | | | | | | | | | | | | | | | | | | | | | | $ | 441 | | $ | 412 |
| (1) | 2005 and 2004 include Golden Giant, Canada; La Herradura, Mexico; Kori Kollo, Bolivia and Zarafshan, Uzbekistan. 2004 also includes Minahasa, Indonesia and Ovacik, Turkey. |
| | | | | | | | | | | | |
| | | Three months ended December 31, | | Year ended December 31, |
| | | 2005 | | 2004 | | 2005 | | 2004 |
Copper Summary | | | | | | | | | | | | |
Pounds sold (000) | | | 128,691 | | | 164,255 | | | 572,749 | | | 683,279 |
Equity pounds sold (000) | | | 68,045 | | | 86,850 | | | 302,841 | | | 378,801 |
Cost applicable to sales (in millions) | | $ | 76 | | $ | 78 | | $ | 303 | | $ | 305 |
Cost applicable to sales per pound | | $ | 0.60 | | $ | 0.48 | | $ | 0.53 | | $ | 0.45 |
Depreciation and amortization (in millions) | | $ | 21 | | $ | 24 | | $ | 87 | | $ | 90 |
Depreciation and amortization per pound | | $ | 0.16 | | $ | 0.15 | | $ | 0.15 | | $ | 0.13 |
Average realized price per pound | | $ | 1.67 | | $ | 1.39 | | $ | 1.45 | | $ | 1.33 |
| | |
| NEWMONT – FOURTH QUARTER 2005 RESULTS (FEBRUARY 27, 2006) | | Page 18 of 18 |
GOLD PRODUCTION – OPERATIONS
| | | | | | | | | | | | | | | | | | | | | | | | |
| | | Nevada | | | Yanacocha, Peru | | | Batu Hijau,
Indonesia | |
| Three months ended December 31, | | 2005 | | | 2004 | | | 2005 | | | 2004 | | | 2005 | | | 2004 | |
Tons Mined (000 dry short tons): | | | | | | | | | | | | | | | | | | | | | | | | |
Open-Pit | | | 49,536 | | | | 48,298 | | | | 53,062 | | | | 45,112 | | | | 51,985 | | | | 63,548 | |
Underground | | | 475 | | | | 482 | | | | n/a | | | | n/a | | | | n/a | | | | n/a | |
Tons Milled/Processed (000): | | | | | | | | | | | | | | | | | | | | | | | | |
Oxide | | | 1,581 | | | | 1,436 | | | | n/a | | | | n/a | | | | n/a | | | | n/a | |
Refractory | | | 2,607 | | | | 2,444 | | | | n/a | | | | n/a | | | | 11,763 | | | | 14,424 | |
Leach | | | 5,740 | | | | 5,018 | | | | 36,216 | | | | 31,435 | | | | n/a | | | | n/a | |
Average Ore Grade (oz/ ton): | | | | | | | | | | | | | | | | | | | | | | | | |
Oxide | | | 0.103 | | | | 0.113 | | | | n/a | | | | n/a | | | | n/a | | | | n/a | |
Refractory | | | 0.184 | | | | 0.217 | | | | n/a | | | | n/a | | | | 0.016 | | | | 0.014 | |
Leach | | | 0.021 | | | | 0.034 | | | | 0.028 | | | | 0.029 | | | | n/a | | | | n/a | |
Average Mill Recovery Rate: | | | | | | | | | | | | | | | | | | | | | | | | |
Oxide | | | 73.7 | % | | | 79.3 | % | | | n/a | | | | n/a | | | | n/a | | | | n/a | |
Refractory | | | 88.2 | % | | | 91.6 | % | | | n/a | | | | n/a | | | | 80.6 | % | | | 80.6 | % |
Ounces Produced (000): | | | | | | | | | | | | | | | | | | | | | | | | |
Oxide | | | 95.0 | | | | 130.9 | | | | n/a | | | | n/a | | | | n/a | | | | n/a | |
Refractory | | | 440.8 | | | | 488.0 | | | | n/a | | | | n/a | | | | 156.9 | | | | 172.7 | |
Leach | | | 80.2 | | | | 84.7 | | | | 1,064.4 | | | | 847.3 | | | | n/a | | | | n/a | |
| | | | | | | | | | | | | | | | | | | | | | | | |
Total | | | 616.0 | | | | 703.6 | | | | 1,064.4 | | | | 847.3 | | | | 156.9 | | | | 172.7 | |
| | | | | | | | | | | | | | | | | | | | | | | | |
Ounces Sold (000): | | | 651.9 | | | | 702.7 | | | | 1,062.9 | | | | 849.1 | | | | 180.9 | | | | 178.9 | |
Equity Ounces Produced (000): | | | 570.2 | | | | 669.1 | | | | 546.6 | | | | 435.1 | | | | 82.9 | | | | 91.3 | |
Equity Ounces Sold (000) | | | 606.2 | | | | 668.2 | | | | 545.8 | | | | 436.0 | | | | 95.7 | | | | 94.6 | |
| | | | | | | | | | | | | | | | | | | | | | | | |
Production Costs Per Ounce: | | | | | | | | | | | | | | | | | | | | | | | | |
Direct mining and production costs | | $ | 336 | | | $ | 258 | | | $ | 148 | | | $ | 133 | | | $ | 150 | | | $ | 144 | |
Capitalized mining and other | | | (4 | ) | | | 5 | | | | (8 | ) | | | (6 | ) | | | (1 | ) | | | (18 | ) |
Royalties and production taxes | | | 7 | | | | 6 | | | | 3 | | | | 3 | | | | 10 | | | | 8 | |
Reclamation and mine closure costs | | | 1 | | | | 2 | | | | 2 | | | | 2 | | | | 2 | | | | 1 | |
| | | | | | | | | | | | | | | | | | | | | | | | |
Costs applicable to sales | | | 340 | | | | 271 | | | | 145 | | | | 132 | | | | 161 | | | | 135 | |
Depreciation and amortization | | | 49 | | | | 44 | | | | 53 | | | | 55 | | | | 47 | | | | 44 | |
| | | | | | | | | | | | | | | | | | | | | | | | |
Total production costs | | $ | 389 | | | $ | 315 | | | $ | 198 | | | $ | 187 | | | $ | 208 | | | $ | 179 | |
| | | | | | | | | | | | | | | | | | | | | | | | |
| | |
| NEWMONT – FOURTH QUARTER 2005 RESULTS (FEBRUARY 27, 2006) | | Page 19 of 19 |
GOLD PRODUCTION – OPERATIONS (CONTINUED)
| | | | | | | | | | | | | | | | | | | | | | | | |
| | | Nevada | | | Yanacocha, Peru | | | Batu Hijau, Indonesia | |
| Year ended December 31, | | 2005 | | | 2004 | | | 2005 | | | 2004 | | | 2005 | | | 2004 | |
Tons Mined (000 dry short tons): | | | | | | | | | | | | | | | | | | | | | | | | |
Open-Pit | | | 193,565 | | | | 192,821 | | | | 218,933 | | | | 193,407 | | | | 225,838 | | | | 235,455 | |
Underground | | | 1,727 | | | | 1,683 | | | | n/a | | | | n/a | | | | n/a | | | | n/a | |
Tons Milled/Processed (000): | | | | | | | | | | | | | | | | | | | | | | | | |
Oxide | | | 5,645 | | | | 4,626 | | | | n/a | | | | n/a | | | | n/a | | | | n/a | |
Refractory | | | 9,877 | | | | 8,985 | | | | n/a | | | | n/a | | | | 50,210 | | | | 54,243 | |
Leach | | | 21,660 | | | | 17,356 | | | | 146,645 | | | | 133,514 | | | | n/a | | | | n/a | |
Average Ore Grade (oz/ ton): | | | | | | | | | | | | | | | | | | | | | | | | |
Oxide | | | 0.108 | | | | 0.125 | | | | n/a | | | | n/a | | | | n/a | | | | n/a | |
Refractory | | | 0.183 | | | | 0.199 | | | | n/a | | | | n/a | | | | 0.018 | | | | 0.016 | |
Leach | | | 0.024 | | | | 0.029 | | | | 0.028 | | | | 0.025 | | | | n/a | | | | n/a | |
Average Mill Recovery Rate: | | | | | | | | | | | | | | | | | | | | | | | | |
Oxide | | | 75.1 | % | | | 79.1 | % | | | n/a | | | | n/a | | | | n/a | �� | | | n/a | |
Refractory | | | 89.6 | % | | | 90.8 | % | | | n/a | | | | n/a | | | | 80.7 | % | | | 80.9 | % |
Ounces Produced (000): | | | | | | | | | | | | | | | | | | | | | | | | |
Oxide | | | 405.2 | | | | 461.2 | | | | n/a | | | | n/a | | | | n/a | | | | n/a | |
Refractory | | | 1,671.3 | | | | 1,666.7 | | | | n/a | | | | n/a | | | | 731.8 | | | | 718.8 | |
Leach | | | 357.1 | | | | 332.5 | | | | 3,333.1 | | | | 3,017.3 | | | | n/a | | | | n/a | |
| | | | | | | | | | | | | | | | | | | | | | | | |
Total | | | 2,433.6 | | | | 2,460.4 | | | | 3,333.1 | | | | 3,017.3 | | | | 731.8 | | | | 718.8 | |
| | | | | | | | | | | | | | | | | | | | | | | | |
Ounces Sold (000): | | | 2,444.1 | | | | 2,538.0 | | | | 3,327.5 | | | | 3,039.9 | | | | 720.5 | | | | 715.2 | |
Equity Ounces Produced (000): | | | 2,276.7 | | | | 2,338.5 | | | | 1,711.5 | | | | 1,549.4 | | | | 386.9 | | | | 398.5 | |
Equity Ounces Sold (000) | | | 2,287.2 | | | | 2,416.0 | | | | 1,708.7 | | | | 1,561.0 | | | | 381.0 | | | | 396.3 | |
Production Costs Per Ounce: | | | | | | | | | | | | | | | | | | | | | | | | |
| | | | | | | | | | | | | | | | | | | | | | | | |
Direct mining and production costs | | $ | 346 | | | $ | 297 | | | $ | 150 | | | $ | 144 | | | $ | 146 | | | $ | 110 | |
Capitalized mining and other | | | (23 | ) | | | (22 | ) | | | (8 | ) | | | (6 | ) | | | (5 | ) | | | 9 | |
Royalties and production taxes | | | 8 | | | | 5 | | | | 3 | | | | 2 | | | | 9 | | | | 8 | |
Reclamation and mine closure costs | | | 2 | | | | 2 | | | | 2 | | | | 2 | | | | 2 | | | | 1 | |
| | | | | | | | | | | | | | | | | | | | | | | | |
Costs applicable to sales | | | 333 | | | | 282 | | | | 147 | | | | 142 | | | | 152 | | | | 128 | |
Depreciation and amortization | | | 51 | | | | 50 | | | | 62 | | | | 65 | | | | 47 | | | | 39 | |
| | | | | | | | | | | | | | | | | | | | | | | | |
Total production costs | | $ | 384 | | | $ | 332 | | | $ | 209 | | | $ | 207 | | | $ | 199 | | | $ | 167 | |
| | | | | | | | | | | | | | | | | | | | | | | | |
| | |
| NEWMONT – FOURTH QUARTER 2005 RESULTS (FEBRUARY 27, 2006) | | Page 20 of 20 |
GOLD PRODUCTION – AUSTRALIA/NEW ZEALAND
| | | | | | | | | | | | | | | | | | | | | | | | | | | | | | | | | | | | | | | | |
| | | Pajingo | | | Jundee | | | Tanami | | | Kalgoorlie | | | Martha | |
Three months ended December 31, | | 2005 | | | 2004 | | | 2005 | | | 2004 | | | 2005 | | | 2004 | | | 2005 | | | 2004 | | | 2005 | | | 2004 | |
Tons Mined (000 dry short tons) | | | 147 | | | | 181 | | | | 2,124 | | | | 662 | | | | 504 | | | | 492 | | | | 11,772 | | | | 11,431 | | | | 534 | | | | 518 | |
Tons Milled/Processed (000) | | | 159 | | | | 208 | | | | 661 | | | | 624 | | | | 773 | | | | 1,157 | | | | 1,768 | | | | 1,870 | | | | 318 | | | | 349 | |
Average Ore Grade (oz/ton) | | | 0.342 | | | | 0.343 | | | | 0.157 | | | | 0.155 | | | | 0.146 | | | | 0.142 | | | | 0.057 | | | | 0.069 | | | | 0.129 | | | | 0.121 | |
Average Mill Recovery Rate | | | 96.5 | % | | | 96.3 | % | | | 92.5 | % | | | 93.4 | % | | | 94.6 | % | | | 95.6 | % | | | 81.7 | % | | | 85.7 | % | | | 93.6 | % | | | 91.0 | % |
Ounces Produced (000) | | | 50.9 | | | | 69.5 | | | | 92.2 | | | | 88.5 | | | | 107.3 | | | | 156.3 | | | | 109.5 | | | | 124.2 | | | | 34.6 | | | | 39.3 | |
Ounces Sold (000) | | | 51.0 | | | | 69.4 | | | | 92.9 | | | | 88.3 | | | | 108.2 | | | | 152.2 | | | | 109.4 | | | | 123.1 | | | | 35.5 | | | | 40.2 | |
Equity Ounces Produced (000) | | | 50.9 | | | | 69.5 | | | | 92.2 | | | | 88.5 | | | | 107.3 | | | | 156.3 | | | | 109.5 | | | | 124.2 | | | | 34.6 | | | | 39.3 | |
Equity Ounces Sold (000) | | | 51.0 | | | | 69.4 | | | | 92.9 | | | | 88.3 | | | | 108.2 | | | | 152.2 | | | | 109.4 | | | | 123.1 | | | | 35.5 | | | | 40.2 | |
Production Costs Per Ounce: | | | | | | | | | | | | | | | | | | | | | | | | | | | | | | | | | | | | | | | | |
Direct mining and production costs | | $ | 245 | | | $ | 226 | | | $ | 261 | | | $ | 250 | | | $ | 309 | | | $ | 301 | | | $ | 453 | | | $ | 295 | | | $ | 256 | | | $ | 269 | |
Capitalized mining and other | | | (6 | ) | | | (5 | ) | | | (1 | ) | | | (1 | ) | | | 3 | | | | 27 | | | | (82 | ) | | | (9 | ) | | | (55 | ) | | | (69 | ) |
Royalties and production taxes | | | 18 | | | | 12 | | | | 12 | | | | 10 | | | | 28 | | | | 22 | | | | 7 | | | | 11 | | | | — | | | | — | |
Reclamation and mine closure costs | | | 2 | | | | 1 | | | | 4 | | | | 3 | | | | 4 | | | | 2 | | | | 3 | | | | 3 | | | | 3 | | | | 3 | |
| | | | | | | | | | | | | | | | | | | | | | | | | | | | | | | | | | | | | | | | |
Costs applicable to sales | | | 259 | | | | 234 | | | | 276 | | | | 262 | | | | 344 | | | | 352 | | | | 381 | | | | 300 | | | | 204 | | | | 203 | |
Depreciation and amortization | | | 127 | | | | 137 | | | | 83 | | | | 59 | | | | 77 | | | | 58 | | | | 49 | | | | 36 | | | | 96 | | | | 93 | |
| | | | | | | | | | | | | | | | | | | | | | | | | | | | | | | | | | | | | | | | |
Total production costs | | $ | 386 | | | $ | 371 | | | $ | 359 | | | $ | 321 | | | $ | 421 | | | $ | 410 | | | $ | 430 | | | $ | 336 | | | $ | 300 | | | $ | 296 | |
| | | | | | | | | | | | | | | | | | | | | | | | | | | | | | | | | | | | | | | | |
| | | | | | | | | | | | | | | | | | | | | | | | | | | | | | | | | | | | | | | | |
| | | Pajingo | | | Yandal (1) | | | Tanami | | | Kalgoorlie | | | Martha | |
Year ended December 31, | | 2005 | | | 2004 | | | 2005 | | | 2004 | | | 2005 | | | 2004 | | | 2005 | | | 2004 | | | 2005 | | | 2004 | |
Tons Mined (000 dry short tons) | | | 629 | | | | 652 | | | | 14,307 | | | | 6,982 | | | | 2,049 | | | | 11,654 | | | | 45,603 | | | | 45,459 | | | | 2,125 | | | | 4,142 | |
Tons Milled/Processed (000) | | | 659 | | | | 809 | | | | 2,562 | | | | 2,821 | | | | 4,081 | | | | 4,525 | | | | 7,314 | | | | 7,142 | | | | 1,277 | | | | 1,405 | |
Average Ore Grade (oz/ton) | | | 0.303 | | | | 0.300 | | | | 0.145 | | | | 0.133 | | | | 0.125 | | | | 0.149 | | | | 0.067 | | | | 0.072 | | | | 0.140 | | | | 0.102 | |
Average Mill Recovery Rate | | | 96.6 | % | | | 96.5 | % | | | 92.2 | % | | | 92.9 | % | | | 94.8 | % | | | 95.3 | % | | | 85.6 | % | | | 86.7 | % | | | 93.0 | % | | | 90.4 | % |
Ounces Produced (000) | | | 193.0 | | | | 241.1 | | | | 341.6 | | | | 354.7 | | | | 487.5 | | | | 640.0 | | | | 409.4 | | | | 453.2 | | | | 163.5 | | | | 129.7 | |
Ounces Sold (000) | | | 192.0 | | | | 251.4 | | | | 341.8 | | | | 379.3 | | | | 493.7 | | | | 658.0 | | | | 409.6 | | | | 468.4 | | | | 163.4 | | | | 130.5 | |
Equity Ounces Produced (000) | | | 193.0 | | | | 241.1 | | | | 341.6 | | | | 354.7 | | | | 487.5 | | | | 640.0 | | | | 409.4 | | | | 453.2 | | | | 163.5 | | | | 129.7 | |
Equity Ounces Sold (000) | | | 192.0 | | | | 251.4 | | | | 341.8 | | | | 379.3 | | | | 493.7 | | | | 658.0 | | | | 409.6 | | | | 468.4 | | | | 163.4 | | | | 130.5 | |
Production Costs Per Ounce: | | | | | | | | | | | | | | | | | | | | | | | | | | | | | | | | | | | | | | | | |
Direct mining and production costs | | $ | 289 | | | $ | 227 | | | $ | 315 | | | $ | 266 | | | $ | 301 | | | $ | 245 | | | $ | 363 | | | $ | 279 | | | $ | 229 | | | $ | 292 | |
Capitalized mining and other | | | (5 | ) | | | (3 | ) | | | 5 | | | | — | | | | 3 | | | | 24 | | | | (25 | ) | | | 8 | | | | (55 | ) | | | (80 | ) |
Royalties and production taxes | | | 15 | | | | 11 | | | | 11 | | | | 9 | | | | 20 | | | | 24 | | | | 11 | | | | 10 | | | | — | | | | — | |
Reclamation and mine closure costs | | | 2 | | | | 1 | | | | 4 | | | | 4 | | | | 4 | | | | 2 | | | | 3 | | | | 4 | | | | 3 | | | | 3 | |
| | | | | | | | | | | | | | | | | | | | | | | | | | | | | | | | | | | | | | | | |
Costs applicable to sales | | | 301 | | | | 236 | | | | 335 | | | | 279 | | | | 328 | | | | 295 | | | | 352 | | | | 301 | | | | 177 | | | | 215 | |
Depreciation and amortization | | | 130 | | | | 125 | | | | 80 | | | | 71 | | | | 67 | | | | 58 | | | | 42 | | | | 35 | | | | 97 | | | | 106 | |
| | | | | | | | | | | | | | | | | | | | | | | | | | | | | | | | | | | | | | | | |
Total production costs | | $ | 431 | | | $ | 361 | | | $ | 415 | | | $ | 350 | | | $ | 395 | | | $ | 353 | | | $ | 394 | | | $ | 336 | | | $ | 274 | | | $ | 321 | |
| | | | | | | | | | | | | | | | | | | | | | | | | | | | | | | | | | | | | | | | |
| (1) | 2005 includes Jundee. 2004 includes Jundee and Bronzewing. |
| | |
| NEWMONT – FOURTH QUARTER 2005 RESULTS (FEBRUARY 27, 2006) | | Page 21 of 21 |
GOLD PRODUCTION – OTHER
| | | | | | | | | | | | | | | | | | | | | | | | | | | | | | |
| | | Golden Giant,
Canada | | | La Herradura,
Mexico | | | Kori Kollo,
Bolivia | | | Zarafshan,
Uzbekistan |
Three months ended December 31, | | 2005 | | | 2004 | | | 2005 | | | 2004 | | | 2005 | | | 2004 | | | 2005 | | 2004 |
Tons Mined (000 dry short tons) | | | 172 | | | | 135 | | | | 3,038 | | | | 3,049 | | | | 5,305 | | | | n/a | | | | n/a | | | n/a |
Tons Milled/Processed (000): | | | | | | | | | | | | | | | | | | | | | | | | | | | | | | |
Leach | | | n/a | | | | n/a | | | | 717 | | | | 1,038 | | | | 4,391 | | | | n/a | | | | 2,007 | | | 1,965 |
Mill | | | 176 | | | | 138 | | | | n/a | | | | n/a | | | | n/a | | | | n/a | | | | n/a | | | n/a |
Average Ore Grade (oz/ton) | | | 0.309 | | | | 0.295 | | | | 0.031 | | | | 0.025 | | | | 0.014 | | | | n/a | | | | 0.035 | | | 0.037 |
Average Mill Recovery Rate | | | 95.2 | % | | | 95.6 | % | | | n/a | | | | n/a | | | | n/a | | | | n/a | | | | n/a | | | n/a |
Ounces Produced (000) | | | 45.9 | | | | 41.7 | | | | 19.0 | | | | 17.4 | | | | 46.6 | | | | 5.7 | | | | 30.5 | | | 38.9 |
Ounces Sold (000) | | | 46.0 | | | | 41.6 | | | | 19.0 | | | | 17.4 | | | | 49.4 | | | | 5.6 | | | | 29.6 | | | 39.2 |
Equity Ounces Produced (000) | | | 45.9 | | | | 41.7 | | | | 19.0 | | | | 17.4 | | | | 41.0 | | | | 5.0 | | | | 30.5 | | | 38.9 |
Equity Ounces Sold (000) | | | 46.0 | | | | 41.6 | | | | 19.0 | | | | 17.4 | | | | 43.5 | | | | 4.9 | | | | 29.6 | | | 39.2 |
Production Costs Per Ounce: | | | | | | | | | | | | | | | | | | | | | | | | | | | | | | |
Direct mining and production costs | | $ | 271 | | | $ | 301 | | | $ | 263 | | | $ | 140 | | | $ | 120 | | | $ | 224 | | | $ | 220 | | $ | 153 |
Capitalized mining and other | | | 2 | | | | 2 | | | | (42 | ) | | | (23 | ) | | | (5 | ) | | | (22 | ) | | | 4 | | | 4 |
Royalties and production taxes | | | 1 | | | | 3 | | | | — | | | | — | | | | 23 | | | | 18 | | | | — | | | — |
Reclamation and mine closure costs | | | 3 | | | | 2 | | | | 2 | | | | 1 | | | | 7 | | | | 47 | | | | 2 | | | 2 |
| | | | | | | | | | | | | | | | | | | | | | | | | | | | | | |
Costs applicable to sales | | | 277 | | | | 308 | | | | 223 | | | | 118 | | | | 145 | | | | 267 | | | | 226 | | | 159 |
Depreciation and amortization | | | 54 | | | | 53 | | | | 80 | | | | 65 | | | | 47 | | | | 60 | | | | 86 | | | 55 |
| | | | | | | | | | | | | | | | | | | | | | | | | | | | | | |
Total production costs | | $ | 331 | | | $ | 361 | | | $ | 303 | | | $ | 183 | | | $ | 192 | | | $ | 327 | | | $ | 312 | | $ | 214 |
| | | | | | | | | | | | | | | | | | | | | | | | | | | | | | |
| | | | | | | | | | | | | | | | | | | | | | | | | | | | | | | | | | | | | | | | | |
| | | Golden Giant,
Canada | | | La Herradura,
Mexico | | | Kori Kollo, Bolivia | | Minahasa,
Indonesia | | | Zarafshan,
Uzbekistan | | Ovacik,
Turkey | |
Year ended December 31, | | 2005 | | | 2004 | | | 2005 | | | 2004 | | | 2005 | | | 2004 | | 2005 | | 2004 | | | 2005 | | 2004 | | 2005 | | 2004 | |
Tons Mined (000 dry short tons) | | | 576 | | | | 515 | | | | 13,181 | | | | 11,557 | | | | 14,055 | | | | n/a | | n/a | | | n/a | | | | n/a | | | n/a | | n/a | | | 4,659 | |
Tons Milled/Processed (000): | | | | | | | | | �� | | | | | | | | | | | | | | | | | | | | | | | | | | | | | | | | |
Leach | | | n/a | | | | n/a | | | | 3,510 | | | | 4,149 | | | | 12,712 | | | | n/a | | n/a | | | n/a | | | | 7,676 | | | 7,894 | | n/a | | | n/a | |
Mill | | | 581 | | | | 519 | | | | n/a | | | | n/a | | | | n/a | | | | n/a | | n/a | | | 441 | | | | n/a | | | n/a | | n/a | | | 331 | |
Average Ore Grade (oz/ton) | | | 0.298 | | | | 0.309 | | | | 0.029 | | | | 0.026 | | | | 0.013 | | | | n/a | | n/a | | | 0.158 | | | | 0.035 | | | 0.042 | | n/a | | | 0.320 | |
Average Mill Recovery Rate | | | 95.7 | % | | | 95.2 | % | | | n/a | | | | n/a | | | | n/a | | | | n/a | | n/a | | | 90.5 | % | | | n/a | | | n/a | | n/a | | | 95.4 | % |
Ounces Produced (000) | | | 161.8 | | | | 160.0 | | | | 80.2 | | | | 68.8 | | | | 97.4 | | | | 25.2 | | — | | | 63.8 | | | | 124.0 | | | 205.0 | | — | | | 104.8 | |
Ounces Sold (000) | | | 162.0 | | | | 160.0 | | | | 80.2 | | | | 68.8 | | | | 94.5 | | | | 24.6 | | — | | | 74.7 | | | | 122.7 | | | 210.1 | | — | | | 110.0 | |
Equity Ounces Produced (000) | | | 161.8 | | | | 160.0 | | | | 80.2 | | | | 68.8 | | | | 85.7 | | | | 25.2 | | — | | | 59.9 | | | | 124.0 | | | 205.0 | | — | | | 104.8 | |
Equity Ounces Sold (000) | | | 162.0 | | | | 160.0 | | | | 80.2 | | | | 68.8 | | | | 83.2 | | | | 21.7 | | — | | | 70.2 | | | | 122.7 | | | 210.1 | | — | | | 110.0 | |
Production Costs Per Ounce: | | | | | | | | | | | | | | | | | | | | | | | | | | | | | | | | | | | | | | | | | |
Direct mining and production cost | | $ | 291 | | | $ | 291 | | | $ | 212 | | | $ | 154 | | | $ | 140 | | | $ | 255 | | n/a | | $ | 249 | | | $ | 214 | | $ | 150 | | n/a | | $ | 202 | |
Capitalized mining and other | | | 1 | | | | 2 | | | | (30 | ) | | | (8 | ) | | | (8 | ) | | | 83 | | n/a | | | 5 | | | | 2 | | | 2 | | n/a | | | (11 | ) |
Royalties and production taxes | | | 1 | | | | 3 | | | | — | | | | — | | | | 21 | | | | 17 | | n/a | | | 8 | | | | — | | | — | | n/a | | | 14 | |
Reclamation and mine closure cos | | | 3 | | | | 2 | | | | 2 | | | | 1 | | | | 14 | | | | 43 | | n/a | | | 4 | | | | 2 | | | 2 | | n/a | | | 3 | |
| | | | | | | | | | | | | | | | | | | | | | | | | | | | | | | | | | | | | | | | | |
Costs applicable to sales | | | 296 | | | | 298 | | | | 184 | | | | 147 | | | | 167 | | | | 398 | | n/a | | | 266 | | | | 218 | | | 154 | | n/a | | | 208 | |
Depreciation and amortization | | | 67 | | | | 71 | | | | 63 | | | | 73 | | | | 40 | | | | 93 | | n/a | | | 32 | | | | 76 | | | 49 | | n/a | | | 143 | |
| | | | | | | | | | | | | | | | | | | | | | | | | | | | | | | | | | | | | | | | | |
Total production costs | | $ | 363 | | | $ | 369 | | | $ | 247 | | | $ | 220 | | | $ | 207 | | | $ | 491 | | n/a | | $ | 298 | | | $ | 294 | | $ | 203 | | n/a | | $ | 351 | |
| | | | | | | | | | | | | | | | | | | | | | | | | | | | | | | | | | | | | | | | | |
| | |
| NEWMONT – FOURTH QUARTER 2005 RESULTS (FEBRUARY 27, 2006) | | Page 22 of 22 |
COPPER PRODUCTION – BATU HIJAU
| | | | | | | | | | | | | | | | |
| | | Three months ended December 31, | | | Year ended December 31, | |
Batu Hijau, Indonesia | | 2005 | | | 2004 | | | 2005 | | | 2004 | |
Total tons mined (000) | | | 51,985 | | | | 63,548 | | | | 225,838 | | | | 235,455 | |
Dry tons processed (000) | | | 11,763 | | | | 14,424 | | | | 50,210 | | | | 54,243 | |
Average copper grade | | | 0.61 | % | | | 0.67 | % | | | 0.69 | % | | | 0.75 | % |
Average recovery rate | | | 85.0 | % | | | 84.7 | % | | | 86.7 | % | | | 87.8 | % |
Copper produced (000 lbs) | | | 120,790 | | | | 170,919 | | | | 596,006 | | | | 716,939 | |
Copper sold (000 lbs) | | | 128,691 | | | | 164,255 | | | | 572,749 | | | | 683,279 | |
Equity copper produced (000 lbs) | | | 63,868 | | | | 90,373 | | | | 315,138 | | | | 397,510 | |
Equity copper sold (000 lbs) | | | 68,045 | | | | 86,850 | | | | 302,841 | | | | 378,801 | |
Production Costs Per Pound: | | | | | | | | | | | | | | | | |
Direct mining and production costs | | $ | 0.52 | | | $ | 0.47 | | | $ | 0.47 | | | $ | 0.36 | |
Capitalized mining and other | | | 0.04 | | | | (0.02 | ) | | | 0.04 | | | | 0.06 | |
Royalties and production taxes | | | 0.03 | | | | 0.03 | | | | 0.02 | | | | 0.03 | |
Reclamation and mine closure costs | | | 0.01 | | | | — | | | | — | | | | — | |
| | | | | | | | | | | | | | | | |
Costs applicable to sales | | | 0.60 | | | | 0.48 | | | | 0.53 | | | | 0.45 | |
Depreciation and amortization | | | 0.16 | | | | 0.15 | | | | 0.15 | | | | 0.13 | |
| | | | | | | | | | | | | | | | |
Total production costs | | $ | 0.76 | | | $ | 0.63 | | | $ | 0.68 | | | $ | 0.58 | |
| | | | | | | | | | | | | | | | |
Smelting, refining and freight costs (in millions) | | $ | 48 | | | $ | 31 | | | $ | 161 | | | $ | 121 | |
GOLD HEDGE POSITION – AS OF DECEMBER 31, 2005
CURRENT MATURITY SUMMARY(1) (3) (000 OUNCES)
| | | | | | | | | | |
| | | Gold Put Option
Contracts | | Price Capped
Contracts |
Years | | Ozs | | Price (2) | | Ozs | | Price( 2) |
2006 | | 100 | | $ | 338 | | — | | | — |
2007 | | 20 | | $ | 397 | | — | | | — |
2008 | | — | | | — | | 1,000 | | $ | 384 |
2009 | | — | | | — | | 600 | | $ | 381 |
2010 | | — | | | — | | — | | | — |
2011 | | — | | | — | | 250 | | $ | 392 |
| | | | | | | | | | |
Total/Average | | 120 | | $ | 348 | | 1,850 | | $ | 384 |
| | | | | | | | | | |
Notes:
| (1) | For more detailed descriptions, definitions and explanations, refer to the Company’s Annual Report on Form 10-K for the year ended December 31, 2005. |
| (2) | Prices quoted are gross contract prices, which represent the gross cash flow per ounce of each contract. Not included in these prices are the additional cash outflows associated with borrowing gold over the life of the contract where the contracts are floating in nature. The rate at which gold is borrowed is determined over the life of the contract based on the prevailing market gold lease rate for the time period that the borrowing is fixed. The borrowing can be fixed for varying periods over the life of the contract. |
| (3) | In addition to the gold hedge positions shown in the table above, the Company entered into a prepaid forward gold sales contract in July 1999, which is reflected as debt on the Company’s consolidated balance sheets. Under the prepaid forward gold sales contract, the Company delivered its first of three annual installments of 161,111 ounces of gold in June 2005. For more detailed descriptions, definitions and explanations, refer to the Company’s Annual Report on Form 10-K for the year ended December 31, 2005. |
| | |
| NEWMONT – FOURTH QUARTER 2005 RESULTS (FEBRUARY 27, 2006) | | Page 23 of 23 |
The Company’s fourth quarter earnings conference call and web cast presentation will be held on February 27, 2006 beginning at 4:00 p.m. Eastern Time (2:00 p.m. Mountain Time). To participate:
| | |
| Dial-In Number: | | 210-234-0000 |
| |
| Leader: | | Randy Engel |
| |
| Password: | | Newmont |
The conference call will also be simultaneously carried on our web site at www.newmont.com under Investor Information/Presentations and will be archived there for a limited time.
Investor Contacts
| | | | |
| Randy Engel | | John Gaensbauer | | Jennifer Van Dinter |
| Telephone: (303) 837-6033 | | Telephone: (303) 837-5153 | | Telephone: (303) 837-5165 |
| Email: | | Email: | | Email: |
| randy.engel@newmont.com | | john.gaensbauer@newmont.com | | jennifer.vandinter@newmont.com |
| | |
| Media Contacts | | | | |
| | |
| Deb Witmer | | Heatheryn Higgins | | Maureen Upton |
| Telephone: (303) 837-5308 | | Telephone: (303) 837-5248 | | Telephone: (303) 837-5281 |
| Email: | | Email: | | Email: |
| deb.witmer@newmont.com | | heatheryn.higgins@newmont.com | | maureen.upton@newmont.com |
Cautionary Statement
This news release contains “forward-looking statements” within the meaning of Section 27A of the Securities Act of 1933, as amended, and Section 21E of the Securities Exchange Act of 1934, as amended, that are intended to be covered by the safe harbor created by such sections. Such forward-looking statements include, without limitation, (i) estimates of future gold and copper production and sales; (ii) estimates of future costs applicable to sales; (iii) estimates of future capital expenditures, royalty and dividend income, tax rates and expenses; (iv) estimates regarding timing of future development, construction, production or closure activities; (v) statements regarding future exploration results and the replacement of reserves; and (vi) statements regarding cost structure and competitive position. Where the Company expresses or implies an expectation or belief as to future events or results, such expectation or belief is expressed in good faith and believed to have a reasonable basis. However, forward-looking statements are subject to risks, uncertainties and other factors, which could cause actual results to differ materially from future results expressed, projected or implied by such forward-looking statements. Such risks include, but are not limited to, gold and other metals price volatility, currency fluctuations, increased production costs and variances in ore grade or recovery rates from those assumed in mining plans, political and operational risks in the countries in which we operate, and governmental regulation and judicial outcomes. For a more detailed discussion of such risks and other factors, see the Company’s 2004 Annual Report on Form 10-K, which is on file with the Securities and Exchange Commission, as well as the Company’s other SEC filings. The Company does not undertake any obligation to release publicly revisions to any “forward-looking statement,” to reflect events or circumstances after the date of this news release, or to reflect the occurrence of unanticipated events, except as may be required under applicable securities laws.
| | |
| NEWMONT – FOURTH QUARTER 2005 RESULTS (FEBRUARY 27, 2006) | | Page 24 of 24 |