 Slide 1 Wayne W. Murdy Chairman & CEO Pierre Lassonde President September 27, 2006 2006 DENVER GOLD SHOW 2006 DENVER GOLD SHOW Exhibit 99.1 |
 Slide 2 Cautionary Statement This presentation contains “forward-looking statements” within the meaning of Section 27A of the Securities Act of 1933, as amended, and Section 21E of the Securities Exchange Act of 1934, as amended, that are intended to be covered by the safe harbor created by such sections. Such forward-looking statements include, without limitation, (i) estimates of future gold and other metals production and sales; (ii) estimates of future costs and consolidated costs applicable to sales; (iii) estimates of future capital expenditures and expenses; (iv) estimates regarding timing of future development, construction, production and expansion activities; (v) statements regarding future exploration results; (vi) estimates of reserves and statements regarding replacement of reserves; and (vii) estimates of pre-tax gains. Where the Company expresses or implies an expectation or belief as to future events or results, such expectation or belief is expressed in good faith and believed to have a reasonable basis. However, forward-looking statements are subject to risks, uncertainties and other factors, which could cause actual results to differ materially from future results expressed, projected or implied by such forward-looking statements. Such risks include, but are not limited to, gold and other metals price volatility, currency fluctuations, increased production costs and variances in ore grade or recovery rates from those assumed in mining plans, political and operational risks in the countries in which we operate, and governmental regulation and judicial outcomes. For a more detailed discussion of such risks and other factors, see the Company’s 2005 Annual Report on Form 10-K, which is on file with the Securities and Exchange Commission, as well as the Company’s other SEC filings. The Company does not undertake any obligation to release publicly revisions to any “forward-looking statement,” to reflect events or circumstances after the date of this news release, or to reflect the occurrence of unanticipated events, except as may be required under applicable securities laws. |
 Slide 3 Overview • Gold in a Long-Term Bull Market • Generating Strong Bottom Line Leverage to Gold • New Mines to Grow Production Beyond 2007 • Expect to Grow Reserves for 5 Straight Year • Anticipate Approximately $160 Million in Net Q3 Pre-Tax Gains th |
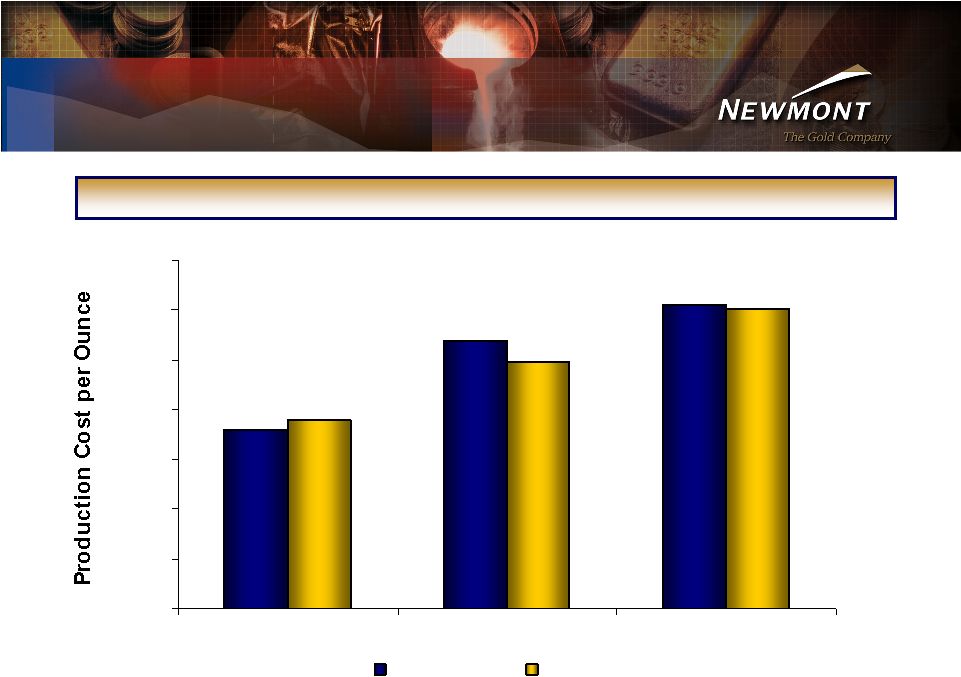 Slide 4 Competitive Cost Profile Newmont vs. Industry Weighted Average Cash Costs $- $50 $100 $150 $200 $250 $300 $350 2002 2005 H1 2006 Industry NEM 1) Source: GFMS 2) For 2005 and H1 2006, Newmont weighted average cash costs estimated as 1.05 x Cost Applicable to Sales per ounce |
 Slide 5 H1 2005 $173 H1 2005 $322 H1 2005 $182 H1 2006 $291 H1 2006 $584 H1 2006 $374 $0 $200 $400 $600 Income from Continuing Operations ($M) Net Cash from Continuing Operations ($M) Operating Margin ($/oz) ~ 40% Increase in Average Realized Gold Price From H1 2005 to H1 2006 First-Half 2006 Highlights * * Before deductions for DD&A |
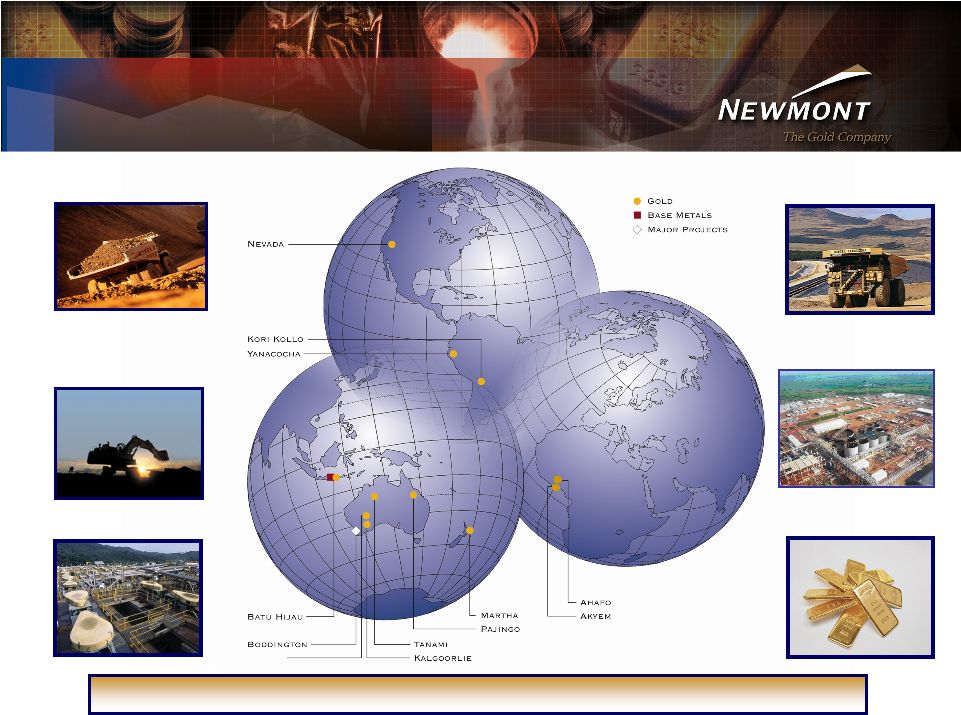 Slide 6 JUNDEE Newmont’s Strong Asset Portfolio Over 32 Million Acres of Land in the World’s Best Gold Districts Nevada Yanacocha Indonesia Ghana Australia/ New Zealand Investment Portfolio |
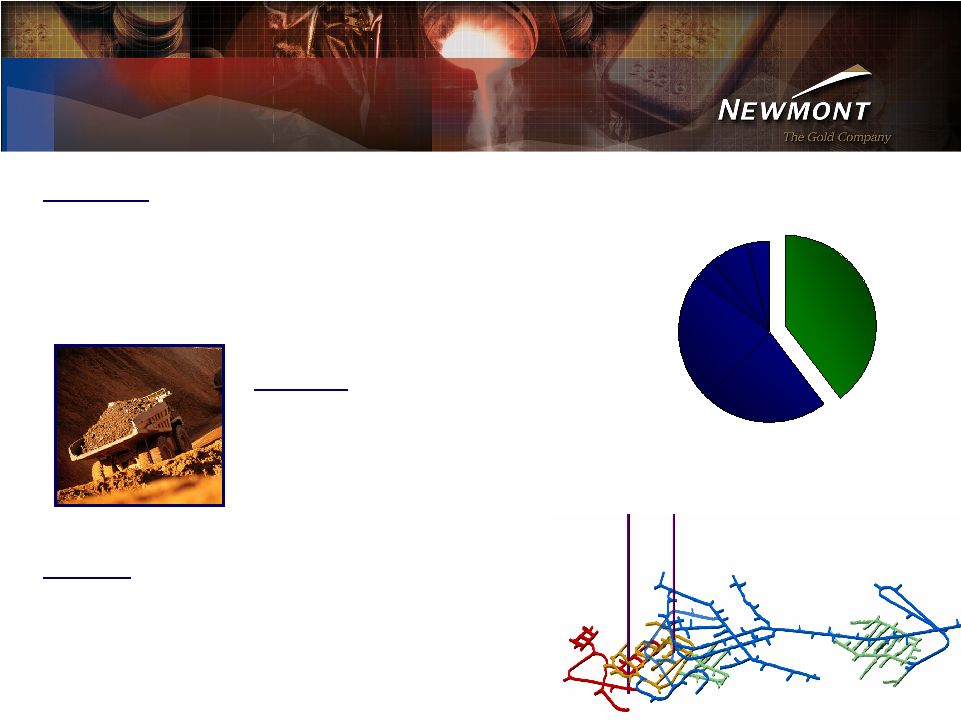 Slide 7 Phoenix • 300K – 350K oz/yr producer • 21 year mine life • 9 mm oz of gold reserves • Copper leach & exploration upside Leeville • Ramping-up to 3,200 tpd by end of 2007 • 400K – 450K oz/yr of steady state production • Platform for further exploration & expansion Nevada 33 mm oz of Reserves; ~ 2.3 mm oz of Production in 2006 Nevada 40% Overview • 15 mines; 11 processing facilities • Cost reduction initiatives through “One Nevada” management system & power plant 1.9 mm acre land package Newmont Global 2006E Production Leeville Mine Isometric View (Looking Northeast) |
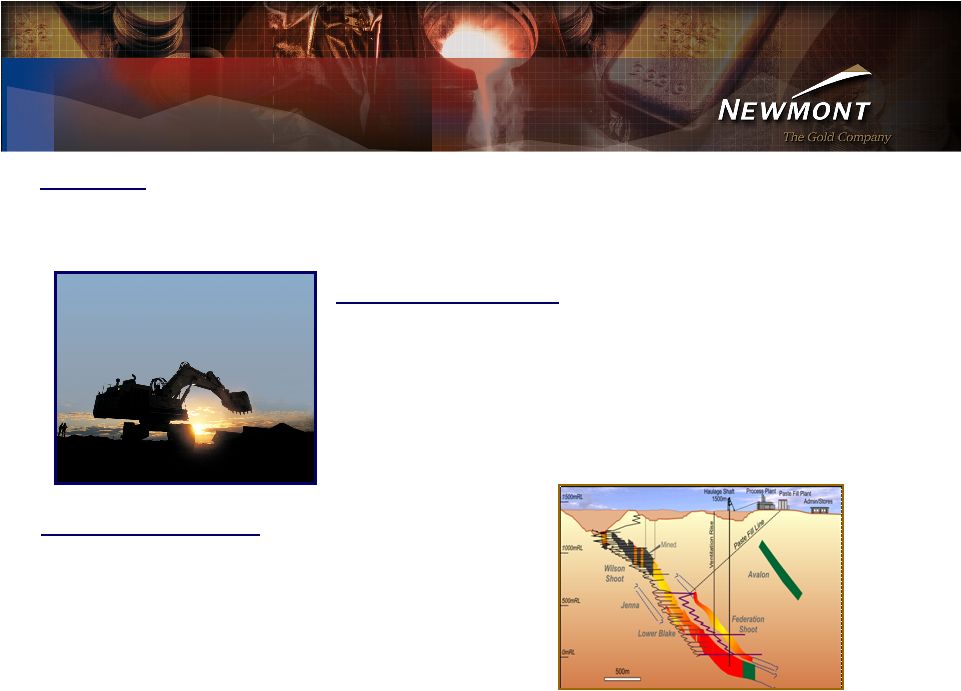 Slide 8 Australia & New Zealand 14.9 mm oz of Reserves; ~ 1.4 mm oz of Production in 2006 Overview • Operations in Western Australia, Northern Territory, Queensland and the North Island of New Zealand Boddington Project • Initial production in late 2008 or early 2009 • 600,000 – 675,000 equity oz of steady-state annual production • Potential to substantially increases equity reserves of 7.7mm oz of gold and 720mm lbs of copper Exploration Upside • Targeting reserve and NRM additions at Callie underground operations • Generating positive results at Boddington, Martha, Kalgoorlie and Jundee Callie |
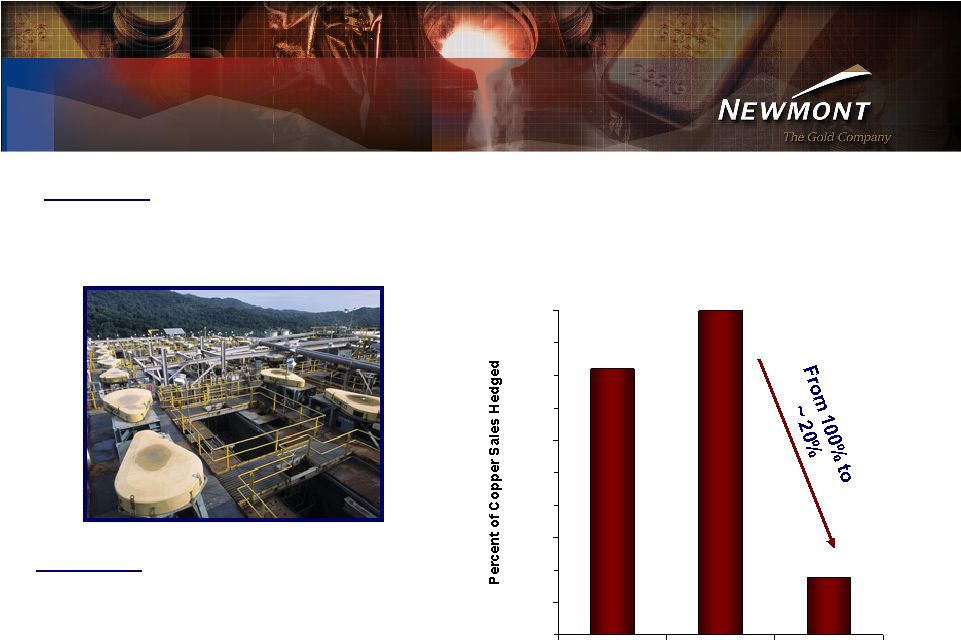 Slide 9 0% 10% 20% 30% 40% 50% 60% 70% 80% 90% 100% 2005 2006 2007 Overview • 2007 opportunities include strong cash flow and earnings contributions as copper hedges roll off in Q1 2007 Indonesia 6.7 mm oz of Au Reserves; ~ 200k oz of Au Production in 2006 Overview • Near-term challenges from harder ores affecting mill throughput Hedge Profile $1.35 $1.35 $1.40 Unite Hedge Price ($/lb) |
 Slide 10 Yanacocha 16.8 mm oz of Reserves; ~ 1.4 mm oz of Production in 2006 Overview • Yanacocha expected to average 850,000 – 900,000 equity ozs from 2007-2010 resulting in higher production costs • Gold mill in 2008 • New Government supportive of fair and sustainable business practices • Significant sulfide mineralization at depth Conga Project • Current reserves of 6.1 mm oz of gold; 1.6B lbs copper • Expected average annual gold sales of 250,000 equity oz of gold; 80 mm equity lbs copper |
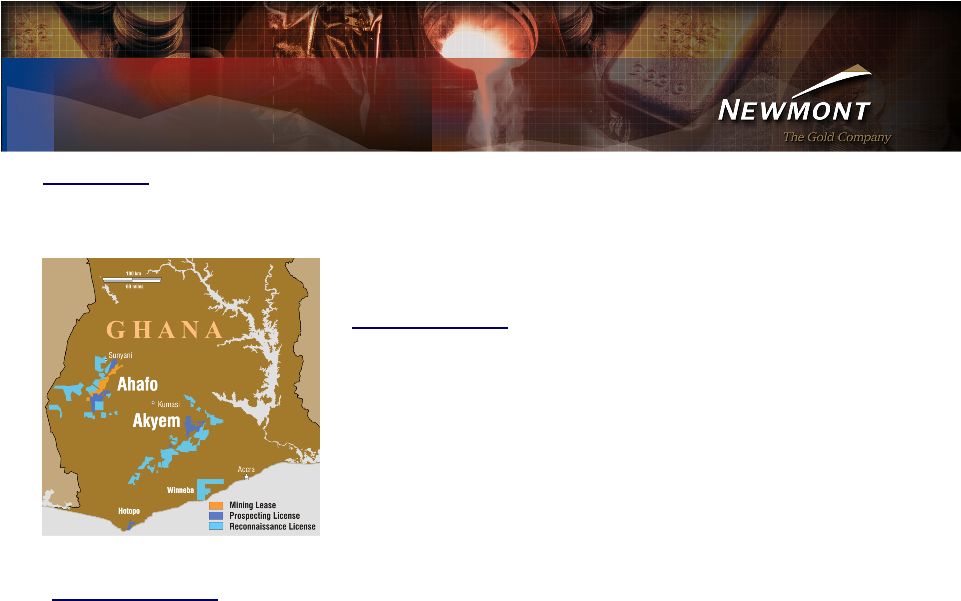 Slide 11 Ghana 18.7 mm oz of Reserves; ~ 170 k oz of Production in 2006 Ahafo Project • On schedule start-up and first gold pour in July 2006 • 500,000 – 550,000 oz at annual steady state production • Power rationing affecting 2006 and 2007 production Akyem Project • Deferring development to complete permitting, review capital and address power shortages Overview • Newmont’s 5 Core Operating District th |
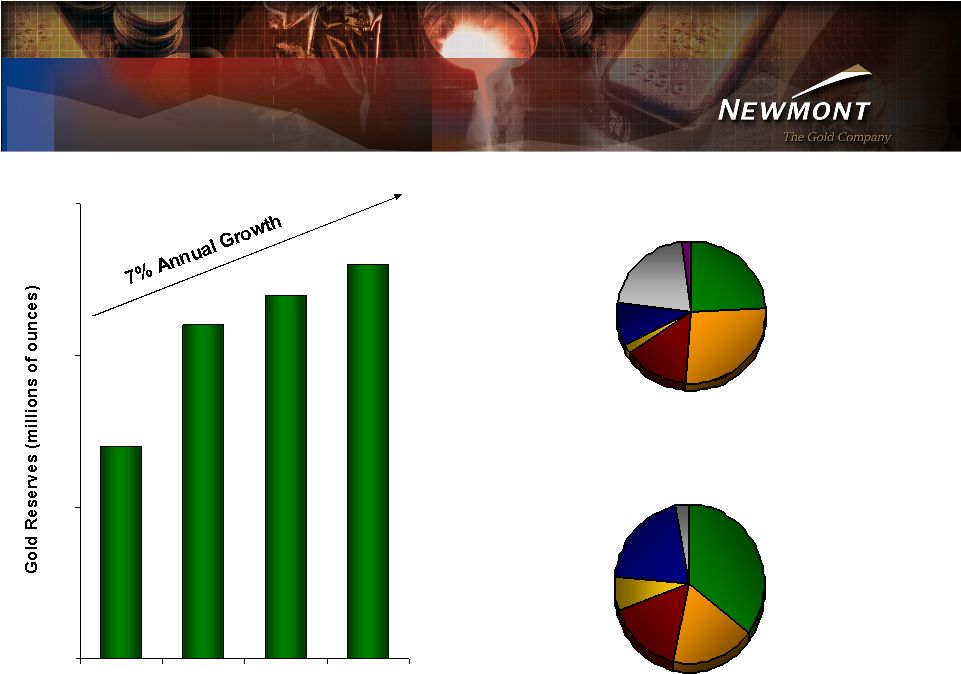 Slide 12 Confident We Will Grow Reserves for the 5 Straight Year 80 85 90 95 2002 2003 2004 2005 North America 24% South America 27% Australia 14% Indonesia 2% West Africa 10% Opportunity Fund & Support 21% Turkey 2% 2006 Exploration Expense - $160 mm - $165 mm Nevada 36% Yanacocha 18% Batu Hijau 7% Ghana 20% Other 3% Australia/ New Zealand 16% Reserves by Region (YE 2005) th |
 Slide 13 Ghana Growth 19.9 16.0 11.9 4.9 3.3 0 5 10 15 20 25 2001 2002 2003 2004 2005 Ahafo Akyem Rapid Reserve Growth & Expansion Opportunities • Over 16 mm ozs added to reserves since acquisition • Potential to add 250,000 – 350,000 ozs of annual production at Ahafo Ahafo Exploration • Significant exploration upside remains • 13 exploration targets in North Area • Working to advance Subika underground, Susuan and Awonsu targets |
 Slide 14 2006 • Estimated Royalty and Other Income of $90 - $105 million • +$300 Million in 2 Half Gains from Sale of Non-Core Assets Long-Term Wealth Creation 1) Alberta Heavy Oil Investment: $20 million Investment $280 million Sale Proceeds 2) Canadian Oil Sands Trust: $200 million Investment >$800 million 3) Other Assets: • Iron Ore and Coal • Arctic Gas • Gold Refineries 4) $153 Million Investment in Shore Gold Inc.’s FALC – Diamond Project Investment Portfolio nd |
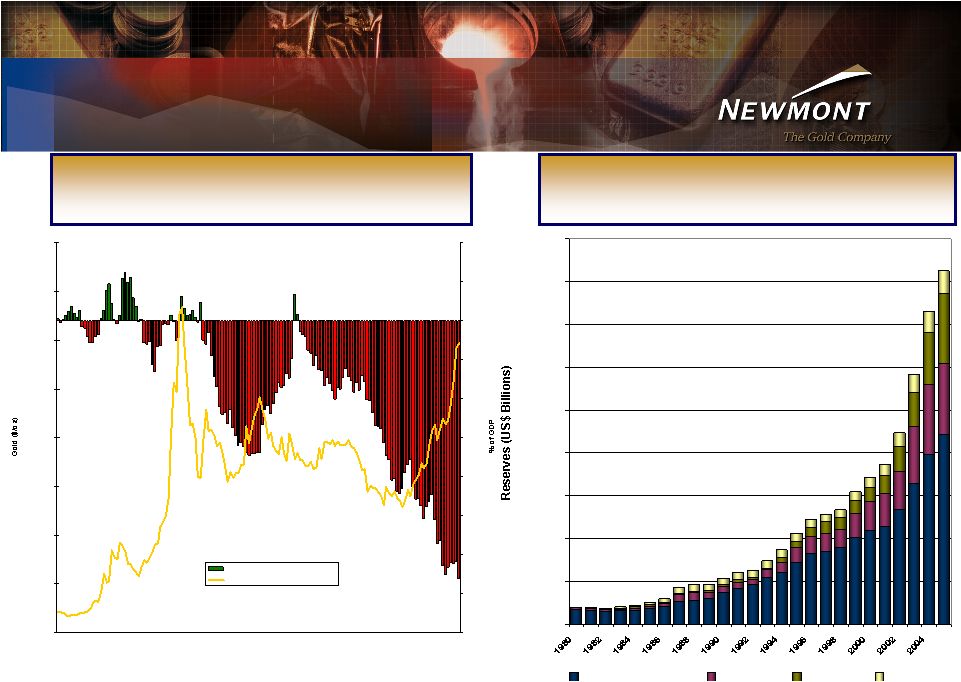 Slide 15 We are in a Long-Term Gold Bull Market $- $100 $200 $300 $400 $500 $600 $700 $800 1969 1972 1975 1978 1981 1984 1987 1990 1993 1996 1999 2002 2005 -8% -7% -6% -5% -4% -3% -2% -1% 0% 1% 2% Current Account Deficit/Surplus Gold Price Source: Bloomberg Excessive US Dollar Reserves in Asia Current Account Deficit Approaching a Trillion Dollars - 500 1,000 1,500 2,000 2,500 3,000 3,500 4,000 4,500 Rest Of World Japan China Taiwan Central Bank FX Reserves (Excluding Central Bank Gold Agreement Countries and the U.S.) Source: GFMS Gold Survey 2006 |
 Slide 16 Conclusion • Gold in a Long-Term Bull Market • Generating Strong Bottom Line Leverage to Gold • New Mines to Grow Production Beyond 2007 • Expect to Grow Reserves for 5 Straight Year • Anticipate Approximately $160 Million in Net Q3 Pre-Tax Gains th |