 Denver Gold Show September 10, 2008 Exhibit 99.1 |
 September 10, 2008 2 Cautionary Statement This presentation contains “forward-looking statements” within the meaning of Section 27A of the Securities Act of 1933, as amended, and Section 21E of the Securities Exchange Act of 1934, as amended, that are intended to be covered by the safe harbor created by such sections. Such forward-looking statements include, without limitation, (i) estimates of future mineral production and sales; (ii) estimates of future costs applicable to sales, other expenses and taxes for specific operations, and on a consolidated basis; (iii) estimates of future capital expenditures, construction, production, or closure activities; and (iv) statements regarding potential cost savings, productivity, operating performance, cost structure and competitive position. Where the Company expresses or implies an expectation or belief as to future events or results, such expectation or belief is expressed in good faith and believed to have a reasonable basis. However, forward- looking statements are subject to risks, uncertainties and other factors, which could cause actual results to differ materially from future results expressed, projected or implied by such forward-looking statements. Such risks include, but are not limited to, gold and other metals price volatility, currency fluctuations, increased production costs and variances in ore grade or recovery rates from those assumed in mining plans, political and operational risks in the countries in which we operate, and governmental regulation and judicial outcomes. For a more detailed discussion of such risks and other factors, see the Company’s 2007 Annual Report on Form 10-K, filed on February 21, 2008, with the Securities and Exchange Commission, as well as the Company’s other SEC filings. The Company does not undertake any obligation to release publicly revisions to any “forward-looking statement,” to reflect events or circumstances after the date of this news release, or to reflect the occurrence of unanticipated events, except as may be required under applicable securities laws. Explanation of Non-GAAP Measures and Certain Metrics This presentation contains the non-GAAP financial measure adjusted net income and a reconciliation of adjusted net income to net income calculated in accordance with GAAP. Adjusted net income is not, and should not, be used in isolation or as an alternative to GAAP net income as reflected in the Company's consolidated financial statements. For further information concerning the use of adjusted net income by the Company and analysts, see the 2008 Earnings Release on Form 8-K furnished by the Company to the Securities and Exchange Commission on or about July 24, 2008, and the Company's other SEC reports. |
 September 10, 2008 3 The Year In Review New management team in place Renewed focus on core business Continued to establish operating performance record Demonstrated leadership in safety, sustainability and environmental responsibility Deliver Yanacocha gold mill Deliver Nevada power plant Continue to deliver consistently strong operating and project performance Deliver Boddington project Update Hope Bay development plans Stage gate decisions on Conga and Akyem |
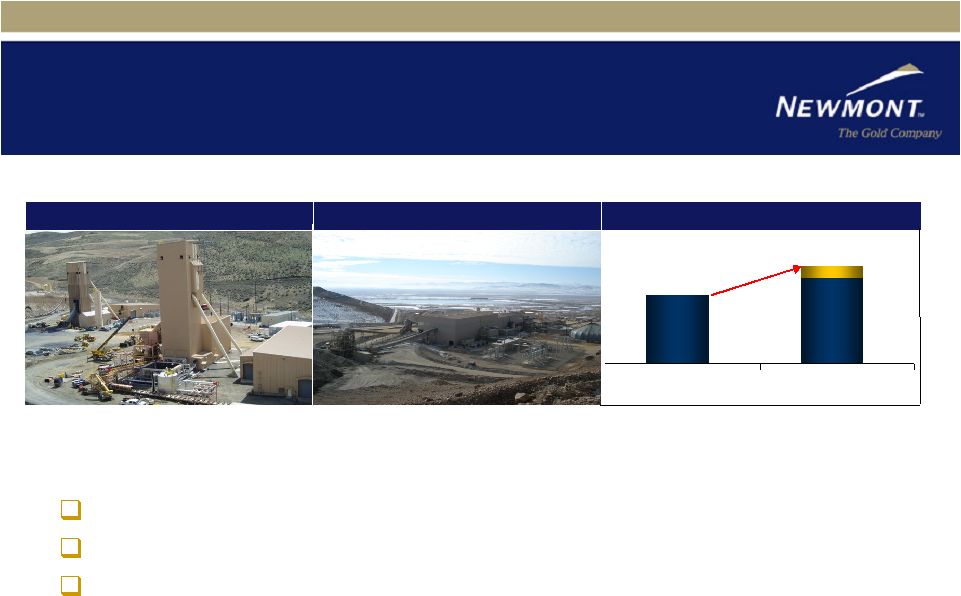 September 10, 2008 4 NEM 2008 Guidance NEM 2007 In the last 12 months: Where we want to be in 12 months: Continue to deliver consistently strong operating performance Execute on revised Phoenix mine plan Progress Batu Hijau divestiture Operational Execution Leeville – At Full Production Phoenix – Revised Plan Complete Peer Average – More than 25% $389 Up ~12% $425 - $450 |
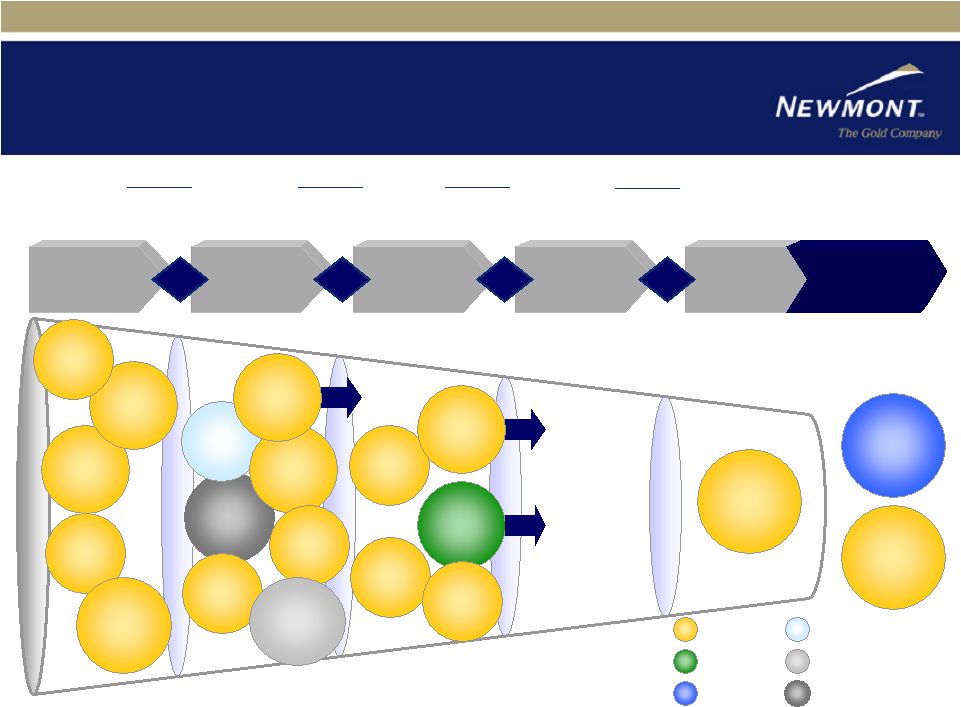 September 10, 2008 5 Project Pipeline Project Execution Execution Operations Stage 1 Stage 2 Stage 3 Stage 4 Gate Gate 4 Ensure single option is optimized, predictable and competitive Gate Gate 3 Select a single option to achieve Business Case Gate Gate 2 Determine if a Business Case exists Gate Gate 1 Advance viable business opportunities NV Power Plant Boddington Yanacocha Gold Mill Ahafo North Callie Deeps Gold Gate 3 Decision Q4 2008 Conga Gate 2 Decision Q4 2008 Euronimba Nassau FALC JV Hope Bay Akyem Subika UG Boddington Moly Yanacocha Sulfides Turf Elang GQ West Wall Layback Buffalo Valley Emigrant Copper Power Diamonds Molybdenum Iron Ore Gate 3 Decision 2009 Phoenix Cu Leach |
 September 10, 2008 6 Boddington Project Execution • ~83% complete as of August 31st • Upon completion, will be Australia’s largest gold producer and a major contributor to Newmont’s annual gold production — First 5 year average annual equity production of 600k to 700k ounces — Expected mine life in excess of 20 years Execution Operations Stage 1 Stage 2 Stage 3 Stage 4 Gate Gate Gate Gate Boddington • Ongoing industry-wide inflation and tightening Australian labor market expected to extend schedule, resulting in higher costs • Working closely with our partners toward project start-up in early to mid 2009 • Will provide updated capital cost estimate and project completion schedule during the third quarter earnings call |
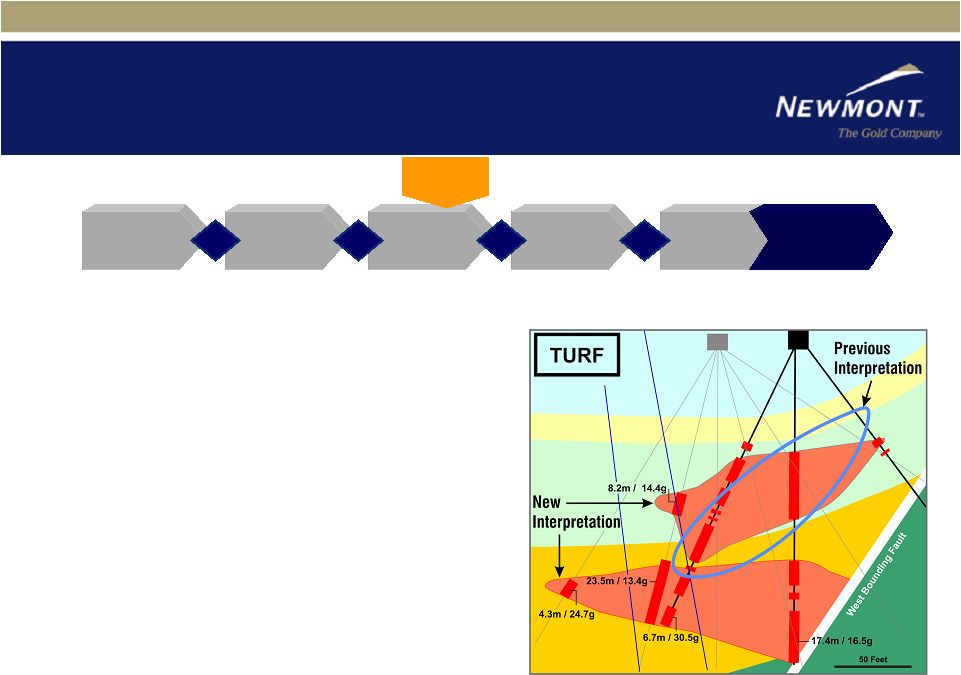 September 10, 2008 7 Nevada Exploration Target: Turf Exploration and Growth Turf • ~1 km NW of Leeville • Driving drift over top of target • Prospect is larger than surface drilling indicated • High-grade (+15 g/t) upside potential • 2008 budget of ~$4 million Execution Operations Stage 1 Stage 2 Stage 3 Stage 4 Gate Gate Gate Gate Turf |
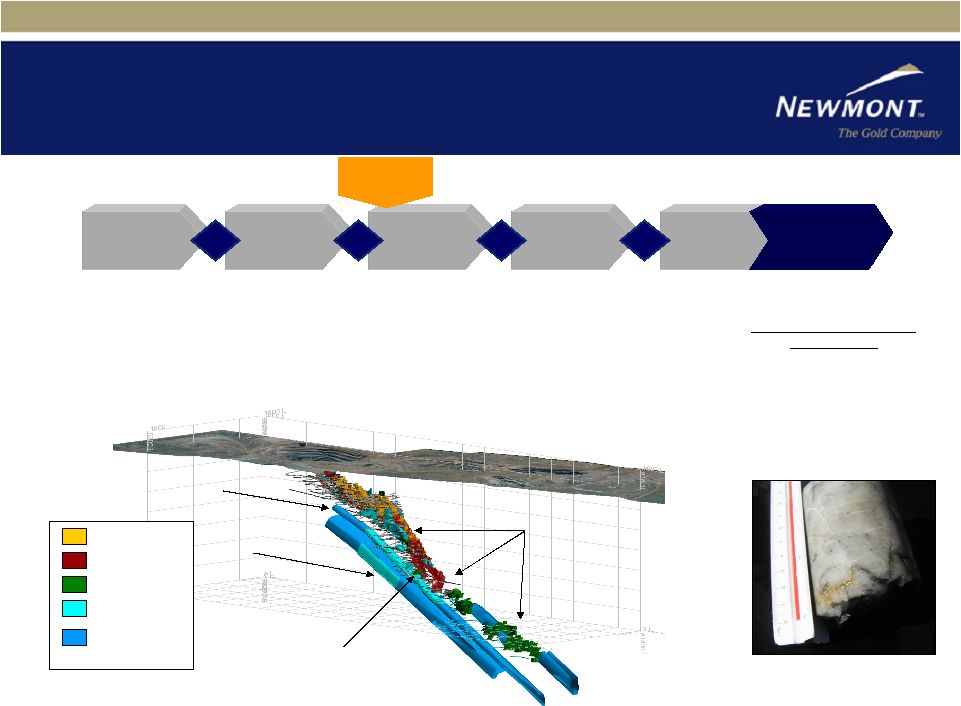 September 10, 2008 8 Callie Deeps, Australia Exploration and Growth • Drilling for NRM and reserve conversion • Base case of ~25 million tonnes at 4.5 grams per tonne • Located in AAA-rated country • Metallurgical testing underway Selected Auron and Asok Intersections 25m @ 6.0 g/t 39m @ 11.9 g/t 35m @ 6.3 g/t 5m @ 36.1 g/t 18m @ 5.6 g/t Visible Gold from Auron core Execution Operations Stage 1 Stage 2 Stage 3 Stage 4 Gate Gate Gate Gate Callie Deeps Federation Asok Auron Callie Mined Reserve NRM PEM Potential Extensions September 10, 2008 |
 September 10, 2008 9 Hope Bay, Canada Exploration and Growth Project Status • Year-round airstrip and Doris road complete • Camp infrastructure under construction • Drilling campaign targeting NRM in 2009 2 ~$30 million budget in 2008 • Stage 2 studies underway 2 ~$40 million budget in 2008 Execution Operations Stage 1 Stage 2 Stage 3 Stage 4 Gate Gate Gate Gate Hope Bay |
 September 10, 2008 10 H1 2008 Highlights • Adjusted net income (1) of $616 M ($1.36/share) • GAAP net income of $647 M ($1.43/share) • Net cash provided from continuing operations of $976 M ($2.15/share) • Equity gold sales of 2.56 Mozs at CAS of $417/oz • Commercial production at Nevada power plant and Yanacocha gold mill • Only senior to maintain gold sales and cost guidance through Q2 (1) Refer to Slide 20 for reconciliation to GAAP Net income per share |
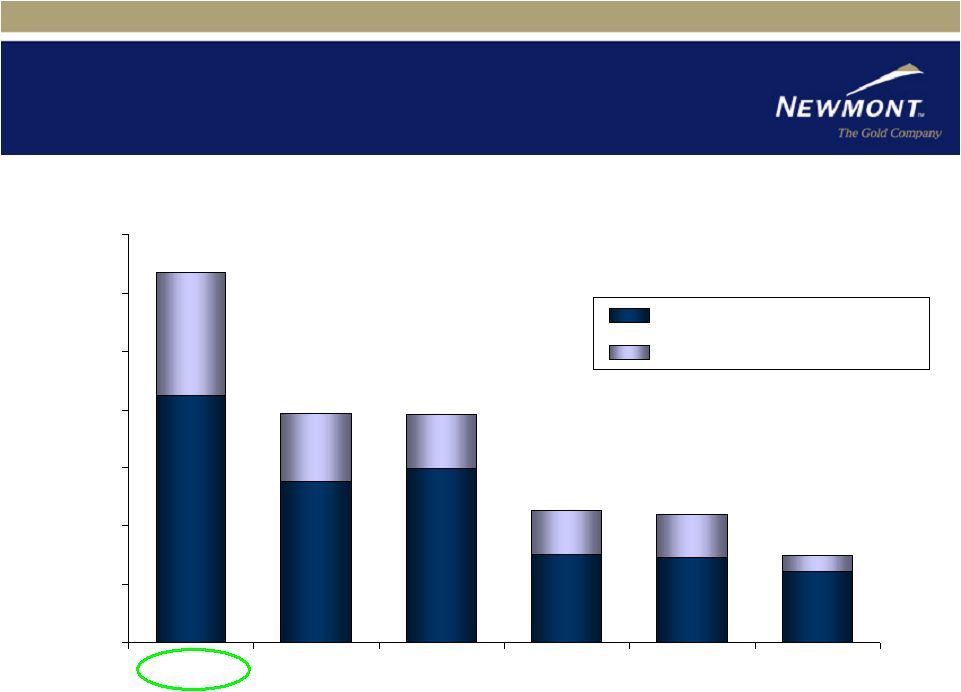
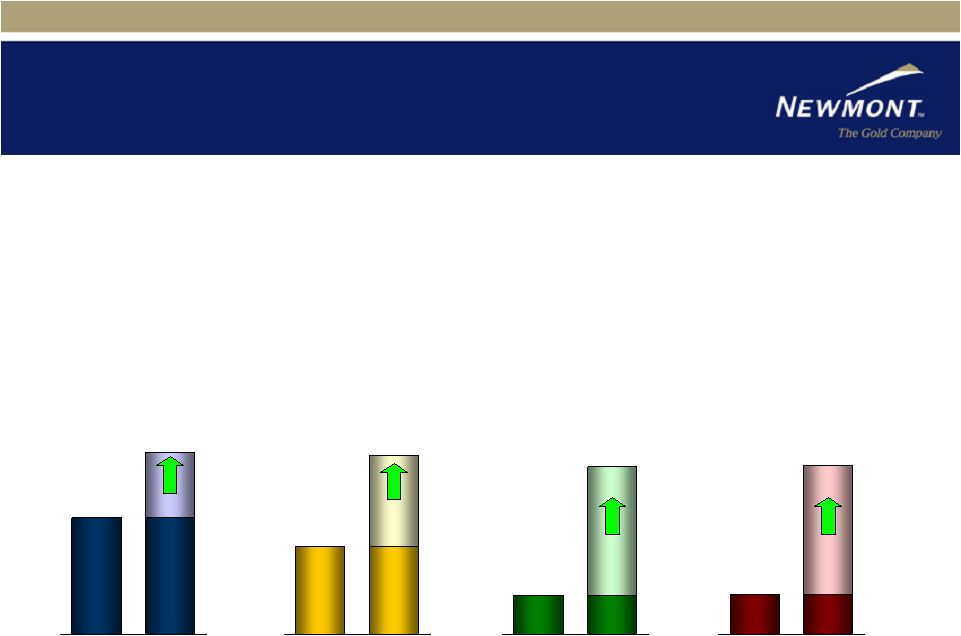 September 10, 2008 11 H1 2007 H1 2008 $657 $917 40% H1 2007 H1 2008 $247 $500 102% H1 2007 H1 2008 $0.51 $2.15 322% Why Newmont? • Most value per share in the peer group 2 Highest NA senior gold sales per share in H1 2008 2 Highest EPS and CFPS in H1 2008 2 Highest per share leverage to the gold price (RBC, BMO, CIBC, JPMorgan) 2 Only NA senior to maintain gold sales and cost guidance through Q2 2008 (1) Refer to Slide 23, footnote #1 (2) Refer to Slide 20 for reconciliation to GAAP Net income per share (3) Refer to Slide 21 for reconciliation to GAAP Net cash provided from (used in) operations Average Realized Price ($/ounce) Operating Margin - Gold (1) ($/ounce) Adjusted Net Income (2) ($/share) Adjusted Cash provided from Continuing Operations (3) ($/share) H1 2007 H1 2008 $0.32 $1.36 325% |
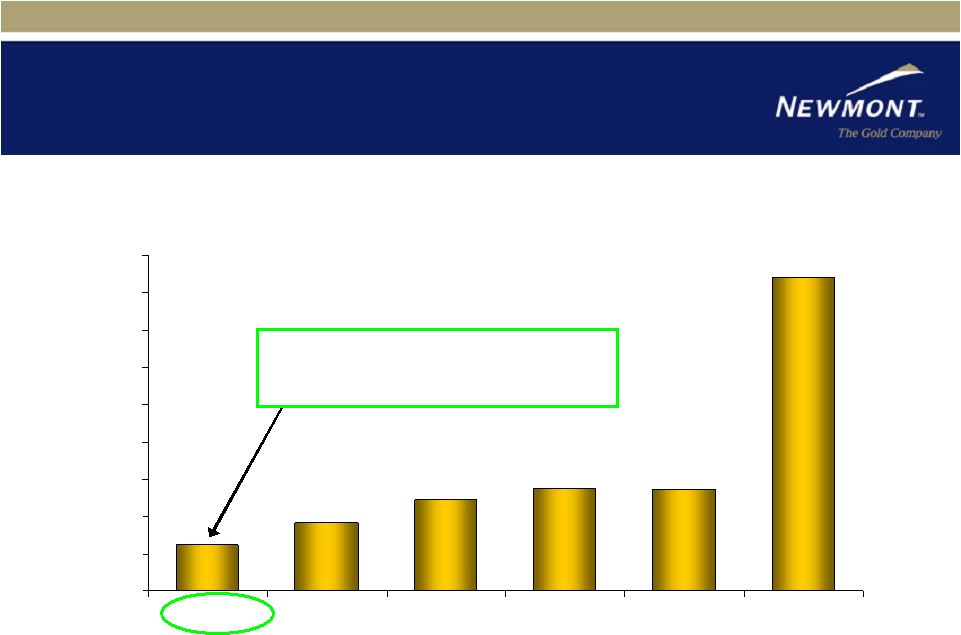 September 10, 2008 12 Leading the Peers in Cost Containment Source: Company reports (1) Gold equivalent basis (2) Represents actual results from fiscal years ended June 30, 2007 and June 30, 2008 (3) By-product basis. Guidance is “Less than $300/oz” 12% 18% 24% 27% 27% 84% 0% 10% 20% 30% 40% 50% 60% 70% 80% 90% Newmont Kinross (1) Barrick AngloGold Gold Fields (2) Goldcorp (3) Lowest forecasted cost inflation in peer group Cost inflation from 2007 actual costs to latest 2008 guidance ($/oz) |
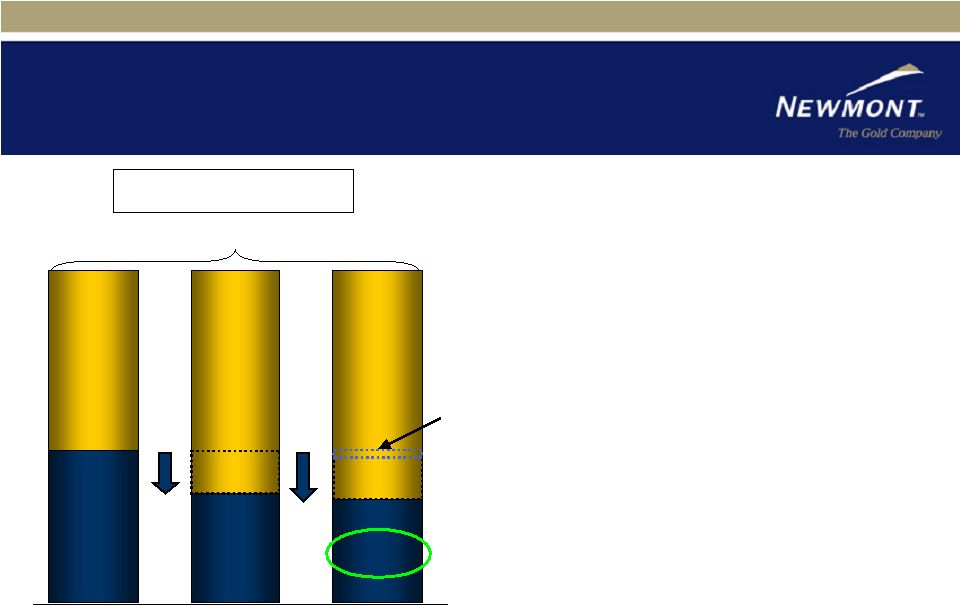 September 10, 2008 13 Another View of Costs First Half 2008 Avg. Realized Gold Price = $917 (1) Refer to slide 22 for a reconciliation to Costs Applicable to Sales per ounce (2) As of September 5, 2008 (3) Based on Q2 unit distributions of $1.00 per unit remaining constant in Q3 and Q4 • Canadian Oil Sands Trust 2 Unrealized gain of ~$1.1 B (2) 2 Cash distributions of ~$120 M in 2008 (3) 2 Distributions offset ~25% of Newmont’s oil exposure (3) • Nevada power plant estimated annual CAS savings of ~$70 – $80 million • Active A$ and diesel hedging programs Managing gold production costs $417 $301 $283 $500 $616 $634 CAS/oz CAS/oz, net of Cu credits (1) CAS/oz, net of Cu credits and COS Income (1) Copper Credits Copper Credits COS Income |
 September 10, 2008 14 Superior Per Share Leverage Source: RBC “North American Gold Equities Sensitivity to Rising Gold”, 7-18-08 2009E CFPS @ $800 gold 2009E CFPS @ $1000 gold RBC Estimated Cash Flow per Share Leverage to the Gold Price $2.21 $1.49 $2.26 $3.92 $3.94 $6.36 $1.21 $1.46 $1.51 $2.99 $2.77 $4.25 $0.00 $1.00 $2.00 $3.00 $4.00 $5.00 $6.00 $7.00 Newmont Barrick Agnico-Eagle Kinross Goldcorp Yamana |
 September 10, 2008 15 In the last 12 months: Divested non-core royalty assets for ~$1.3 billion Eliminated hedge book at ~$655/oz Nearing completion of 5 year intensive capital reinvestment period Holding Canadian Oil Sands Where we want to be in 12 months: Continue to deliver consistently strong operating and project performance Identify and implement aggressive cost cutting and operational efficiencies Optimize portfolio of high-value diversified assets Deliver shareholder wealth creation Financial Strength and Flexibility |
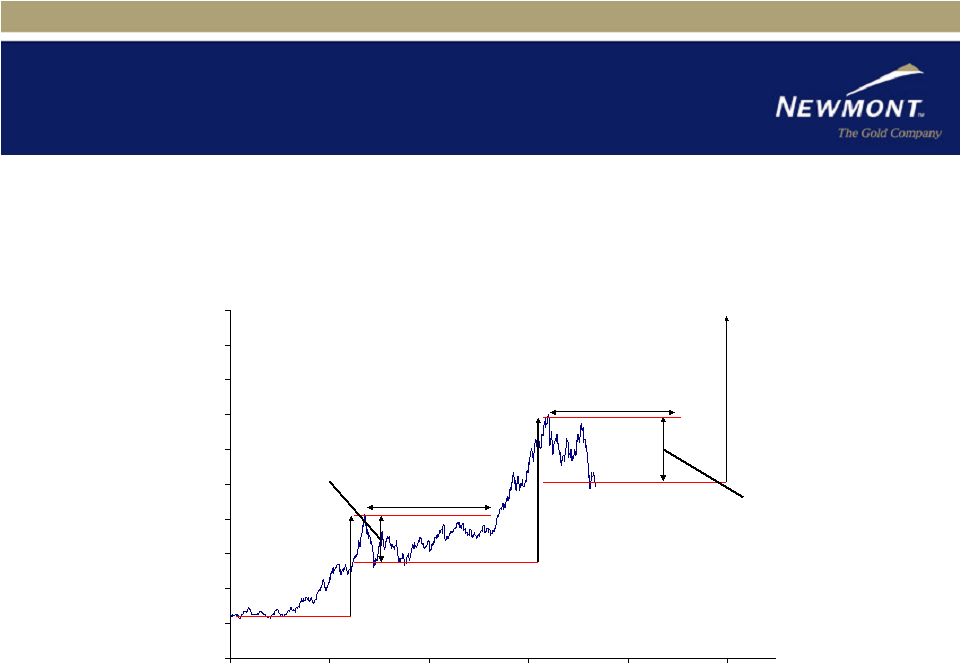 September 10, 2008 16 Gold Price Outlook Short-Term Fluctuations Expected • Despite the gold price decline in early August, gold continues to trade within expected range (approx. $800 – $1000/oz) • 16 month consolidation period with reduced volatility should revive jewelry demand $300 $400 $500 $600 $700 $800 $900 $1,000 $1,100 $1,200 $1,300 Jan-05 Jan-06 Jan-07 Jan-08 Jan-09 Jan-10 ~$1,300 - $1,400/oz Source: Reuters Last update: September 5, 2008 ~20% Trading Range ~16 Month Consolidation ~16 Month Consolidation ~20% Trading Range ~70% increase from previous trading range ~80% increase from previous trading range |
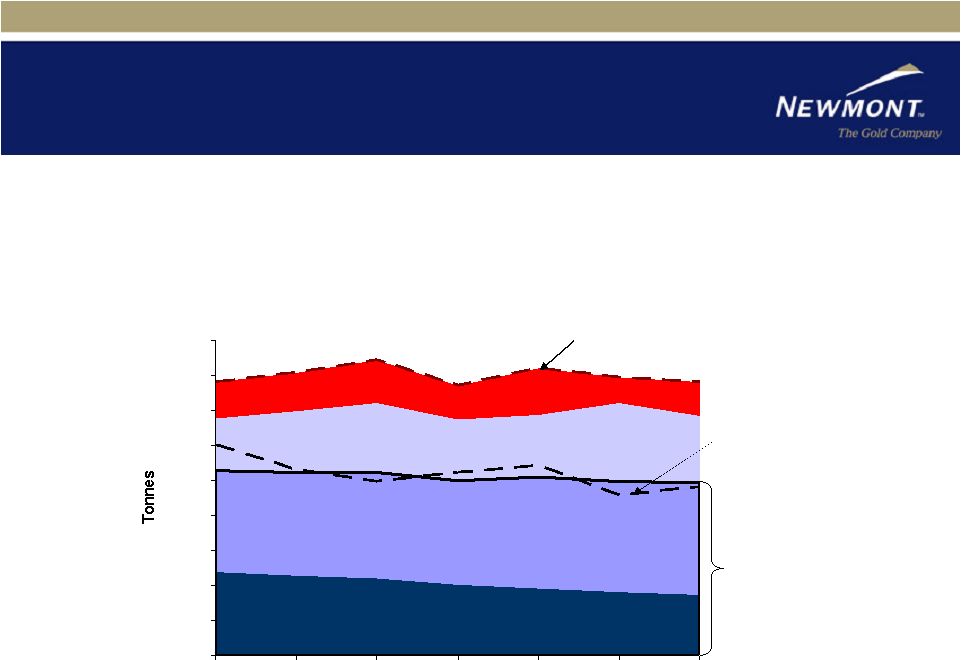 September 10, 2008 17 Gold Price Outlook Bullish Long-Term Expectations • Declining mine production, total cost of production rising 2 “Big Four” mine production down 28% from 2001 2 Total mine production down 6% from 2001 2 Lead time for new projects has lengthened, costs escalated Source: GFMS "Big Four" Mine Production - down 28% Other Mine Production - up 12% Scrap Supply Deficit Total Demand 0 500 1,000 1,500 2,000 2,500 3,000 3,500 4,000 4,500 2001 2002 2003 2004 2005 2006 2007 Jewelry Demand Total mine production - down 6% |
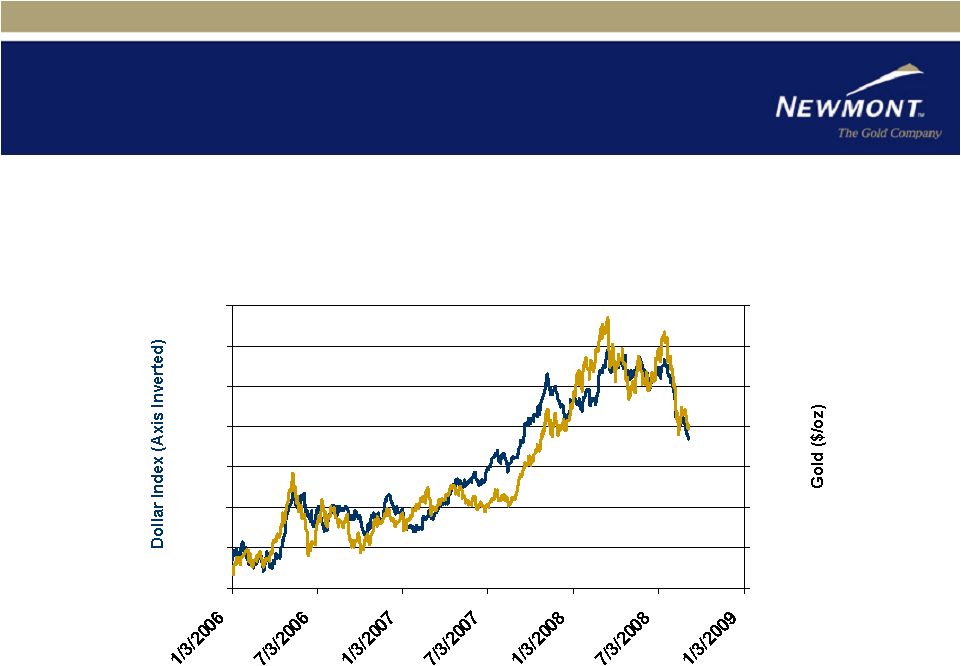 September 10, 2008 18 Gold Price Outlook Bullish Long-Term Expectations • Gold remains negatively correlated to US dollar Dollar should decline against emerging currencies Current account and trade deficits imply further dollar weakness Source: Reuters, Federal Reserve Statistics 66 69 72 75 78 81 84 87 $500 $575 $650 $725 $800 $875 $950 $1,025 GOLD US Trade-Weighted Dollar Index (Major Currencies) Last date: September 5, 2008 — — |
 Reference Slides |
 September 10, 2008 20 Reconciliation from Adjusted Net Income to GAAP Net Income $ - $ - $ (0.01) $ (5) Western Australia gas interruption $ - $ - $ (0.12) $ (56) Write-down of marketable securities $ (0.02) $ (11) $ (0.09) $ (41) Reclamation obligations $ - $ - $ 0.28 $ 129 Income taxes $ (0.02) $ (8) $ - $ - Senior management retirement $ (0.06) $ (25) $ - $ - Batu Hijau minority loan repayment $ (1.02) $ (460) $ - $ - Settlement of gold contracts $ (4.42) $ (1,994) $ 1.43 $ 647 GAAP Net income $ (3.62) $ (1,633) $ 0.01 $ 4 Income from discontinued operations $ (0.80) $ (361) $ 1.42 $ 643 GAAP Income from continuing operations $ 0.32 $ 143 $ 1.36 $ 616 Adjusted net income Per Share Q2 2007 YTD Per Share Q2 2008 YTD Description ($ million except per share, after-tax) |
 September 10, 2008 21 Reconciliation from Adjusted Net Cash Provided from Continuing Operations to GAAP Net Cash Provided from (used in) Operations $ (0.61) $ (276) $ - $ - Settlement of pre-acquisition Australian income taxes of Normandy $ (1.28) $ (578) $ - $ - Pre-tax settlement of price-capped forward sales contracts $ (1.24) $ (563) $ 1.90 $ 864 GAAP Net cash provided from (used in) operations $ 0.14 $ 61 $ (0.25) $ (112) Net cash (used in) provided from discontinued operations $ (1.38) $ (624) $ 2.15 $ 976 GAAP Net cash provided from (used in) continuing operations $ 0.51 $ 230 $ 2.15 $ 976 Adjusted net cash provided from continuing operations Per Share Q2 2007 YTD Per Share Q2 2008 YTD Description ($ million except per share) |
 September 10, 2008 22 Reconciliation from CAS per Ounce to CAS per Ounce, Net of Copper By-Products and COS Income $ (116) Copper credits (copper revenues less costs applicable to sales – copper) $ 283 Costs applicable to sales – gold, net of copper credits and COS income $ (18) Canadian Oil Sands Trust income $ 301 Costs applicable to sales – gold, net of copper credits $ 417 GAAP Costs applicable to sales – gold June 2008 YTD Description ($ per ounce) |
 September 10, 2008 23 Footnotes 1. “Operating Margin – Gold” defined as average realized price per ounce less costs applicable to sales per ounce, excluding amortization and accretion |