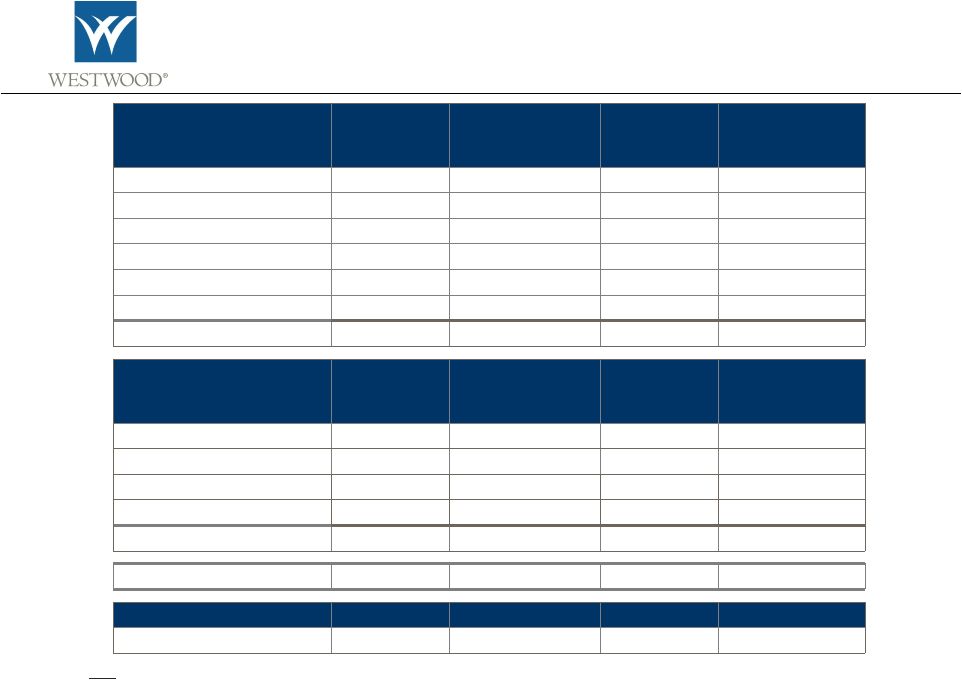
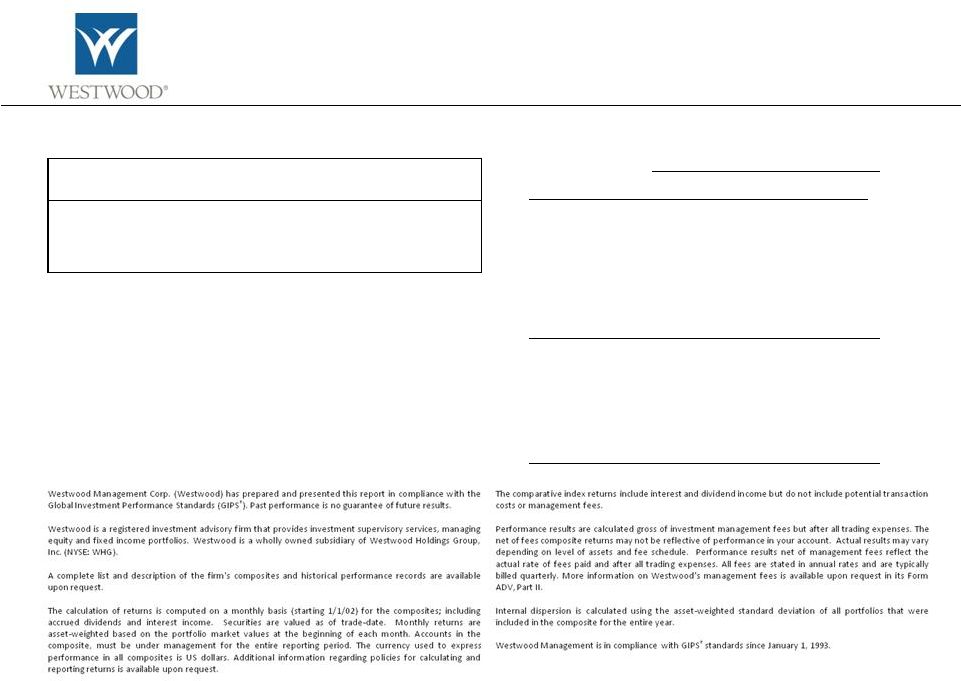
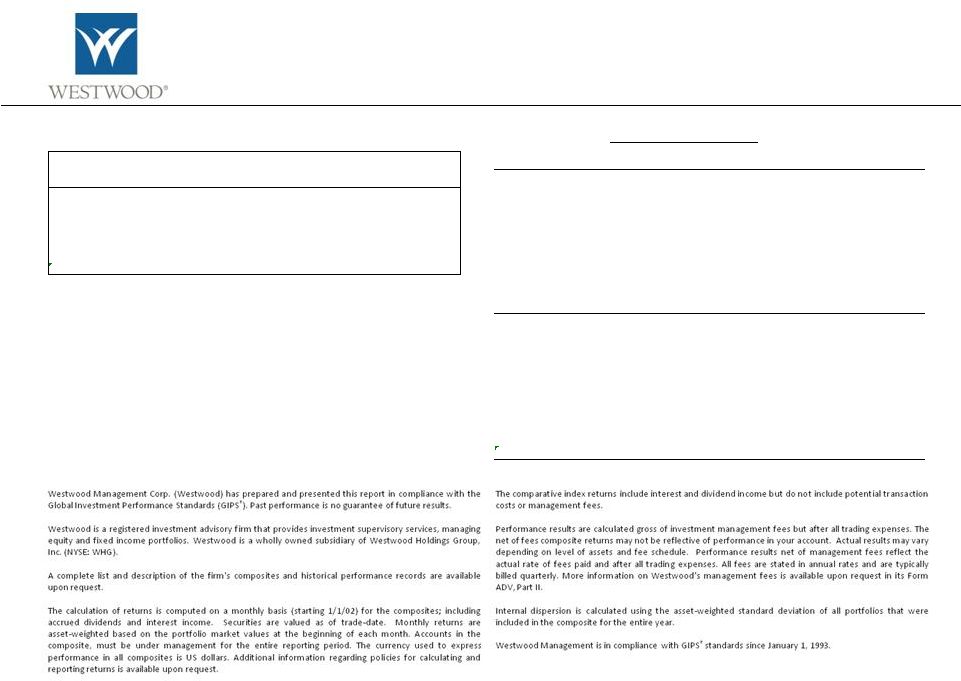
Income Opportunity Disclosure Information A complete list and description of the firm's composites and historical performance records are available upon request. The calculation of returns is computed on a monthly basis (starting 1/1/02) for the composites; including accrued dividends and interest income. Securities are valued as of trade-date. Monthly returns are asset-weighted based on the portfolio market values at the beginning of each month. Accounts in the composite, must be under management for the entire reporting period. The currency used to express performance in all composites is US dollars. Additional information regarding policies for calculating and reporting returns is available upon request. The comparative index returns include interest and dividend income but do not include potential transaction costs or management fees. Performance results are calculated gross of investment management fees but after all trading expenses. The net of fees composite returns may not be reflective of performance in your account. Actual results may vary depending on level of assets and fee schedule. Performance results net of management fees reflect the actual rate of fees paid and after all trading expenses. All fees are stated in annual rates and are typically billed quarterly. More information on Westwood's management fees is available upon request in its Form ADV, Part II. Internal dispersion is calculated using the asset-weighted standard deviation of all portfolios that were included in the composite for the entire year. Westwood Management is in compliance with GIPS® standards since January 1, 1993. Westwood Management Corp. (Westwood) has prepared and presented this report in compliance with the Global Investment Performance Standards (GIPS®). Past performance is no guarantee of future results. Westwood is a registered investment advisory firm that provides investment supervisory services, managing equity and fixed income portfolios. Westwood is a wholly owned subsidiary of Westwood Holdings Group, Inc. (NYSE: WHG). Year Gross of Fees Return Net of Fees Return S&P 500 Nareit 3 Mo T-Bill 10 Yr Treas Note Benchmark¹ Number of Portfolios Dispersion Total Assets at End of Period Percentage of Firm Assets Total Firm Assets 2010 15.2% 14.5% 15.1% 28.0% 0.1% 8.1% 13.1% 3 0.8 $313.2 3.0% $10,530.8 2009 13.9% 13.3% 26.5% 28.0% 0.2% -9.9% 12.0% 3 1.3 $203.5 2.2% $9,322.6 2008 -6.7% -7.1% -37.0% -37.7% 1.8% 20.3% -14.6% 3 4.3 $144.1 2.2% $6,538.0 2007 0.8% 0.2% 5.5% -15.7% 4.7% 9.8% 1.0% 3 1.1 $190.6 2.7% $7,113.2 2006 14.1% 13.5% 15.8% 35.1% 4.8% 1.4% 13.7% 5 0.2 $235.0 4.3% $5,455.9 2005 5.7% 5.4% 4.9% 12.2% 3.0% 2.0% 5.7% 20 0.3 $119.6 2.6% $4,606.5 2004 16.8% 16.3% 10.9% 31.6% 1.2% 4.9% 12.0% 2 0.3 $32.7 0.9% $3,797.6 2003 23.5% 23.2% 28.7% 37.1% 1.1% 1.3% 16.3% 2 0.2 $18.9 0.5% $3,815.3 1. 25%S&P500/25%Nareit Equity/25%Treasury Bill/25%10-Yr. Treasury Note PERFORMANCE RESULTS: INCOME OPPORTUNITY January 1, 2003 through December 31, 2010 Reporting Currency: USD Creation Date: January 2003 The Income Opportunity composite includes all taxable and tax-exempt, fee-paying fully discretionary accounts whose primary investment objective is to provide current income. A secondary objective is to provide the opportunity for long-term capital appreciation. The Income Opportunity Composite is compared to a four-part benchmark (25% S&P 500, 25% NAREIT, 25% 10-Yr Treasury, 25% 3-Month T-Bill), which is rebalanced monthly. The S&P 500 covers 500 companies of the US markets, is capitalization weighted, and includes a representative sample of leading companies in leading industries. The NAREIT Equity Index is an index of all tax-qualified equity REITs listed on the NYSE, AMEX, and NASDAQ, which have 75% or more of their gross invested book assets invested directly or indirectly in the equity ownership of real estate. Investments cannot be made directly into the NAREIT Equity Index. The return of the 3-month Treasury bill and the 10-year Treasury note are calculated by Lehman Brothers each month and published in their Global Bond Index. All of the indices described above are unmanaged market indices. The minimum portfolio size for inclusion in the Income Opportunity Composite is $5 million beginning 1/1/06. In January 2005, the name of this composite was changed from the Dynamic Income Composite to the Income Opportunity Composite. The standard fee schedule for Income Opportunity Institutional accounts is 0.80% on the first $25 million, negotiable thereafter. Westwood Management Corp. claims compliance with the Global Investment Performance Standards (GIPS®) and has prepared and presented this report in compliance with the GIPS standards. Westwood Management has been independently verified for the periods January 1, 1995 through December 31, 2009. Verification assesses whether (1) the firm has complied with all the composite construction requirements of the GIPS standards on a firm-wide basis and (2) the firm’s policies and procedures are designed to calculate and present performance in compliance with the GIPS standards. The Income Opportunity Composite has been examined for the periods January 1, 1995 through December 31, 2009. The verification and performance examination reports are available upon request. Westwood discontinued the use of the 45% S&P 500 and 55% LBG/C Intermediate benchmark on 1/1/05. The benchmark was no longer representative of the characteristics of the Composite. INCOME OPPORTUNITY COMPOSITE RETURNS Gross of Fees Net of Fees ANNUALIZED RETURNS 1 Year 15.2 % 14.5 % 15.1 % 28.0 % 0.1 % 8.1 % 13.1 % 2 Years 14.5 % 13.9 % 20.6 % 28.0 % 0.2 % -1.3 % 12.6 % 3 Years 7.0 % 6.4 % -2.9 % 0.7 % 0.7 % 5.4 % 2.7 % 4 Years 5.4 % 4.8 % -0.8 % -3.7 % 1.7 % 6.5 % 2.3 % 5 Years 7.1 % 6.5 % 2.3 % 3.0 % 2.3 % 5.5 % 4.5 % 6 Years 6.9 % 6.3 % 2.7 % 4.5 % 2.4 % 4.9 % 4.7 % 7 Years 8.2 % 7.7 % 3.9 % 8.0 % 2.2 % 4.9 % 5.7 % 8 Years 10.0 % 9.5 % 6.7 % 11.3 % 2.1 % 4.4 % 7.0 % Since Inception (1/1/03) 10.0 % 9.5 % 6.7 % 11.3 % 2.1 % 4.4 % 7.0 % 2010 15.2 % 14.5 % 15.1 % 28.0 % 0.1 % 8.1 % 13.1 % 2009 13.9 % 13.3 % 26.5 % 28.0 % 0.2 % -9.9 % 12.0 % 2008 -6.7 % -7.1 % -37.0 % -37.7 % 1.8 % 20.3 % -14.6 % 2007 0.8 % -0.8 % 5.5 % -15.7 % 4.7 % 9.8 % 1.0 % 2006 14.1 % 13.5 % 15.8 % 35.1 % 4.8 % 1.4 % 13.7 % 2005 5.7 % 5.4 % 4.9 % 12.2 % 3.0 % 2.0 % 5.7 % 2004 16.8 % 16.3 % 10.9 % 31.6 % 1.2 % 4.9 % 12.0 % 2003 23.5 % 23.2 % 28.7 % 37.1 % 1.1 % 1.3 % 16.3 % 1 . 25%S&P500/25%Nareit Equity/25%Treasury Bill/25%10-Yr. Treasury Note Benchmark1 S&P 500 Nareit 3 Mo T-Bill 10 Yr Treas Note Benchmark Data Source: © 2010 Mellon Analytical Solutions, LLC. All Rights Reserved. | 