 Westwood Holdings Group, Inc. March 2013 Investor Presentation Brian O. Casey President & Chief Executive Officer Mark A. Wallace Chief Financial Officer Bill Hardcastle Vice President Exhibit 99.1 |
 Forward – Looking Statements Statements in this presentation that are not purely historical facts, including statements about our expected future financial position, preliminary estimates, results of operations or cash flows, as well as other statements including words such as “anticipate,” “believe,” “plan,” “estimate,” “expect,” “intend,” “should,” “could,” “goal,” “target,” “designed,” “on track,” “comfortable with,” “optimistic” and other similar expressions, constitute forward- looking statements within the meaning of Section 27A of the Securities Act of 1933, as amended, and Section 21E of the Securities Exchange Act of 1934, as amended. Actual results and the timing of some events could differ materially from those projected in or contemplated by the forward- looking statements due to a number of factors, including, without limitation, those set forth below: • our ability to identify and successfully market services that appeal to our customers; • the significant concentration of our revenues in four of our customers; • our relationships with investment consulting firms; • our relationships with current and potential customers; • our ability to retain qualified personnel; • our ability to successfully develop and market new asset classes; • our ability to maintain our fee structure in light of competitive fee pressures; • competition in the marketplace; • downturn in the financial markets; • the passage of legislation adversely affecting the financial services industries; • interest rates; • changes in our effective tax rate; • our ability to maintain an effective system of internal controls; and • the other risks detailed from time to time in our SEC reports. Additional factors that could cause our actual results to differ materially from our expectations are discussed under the section entitled “Risk Factors” in our Form 10-K for the year ended December 31, 2012, which together with our other filings can be viewed at www.sec.gov. You should not unduly rely on these forward-looking statements. Except as required by law, we are not obligated to publicly release any revisions to these forward-looking statements. |
 Agenda I. Firm Overview II. Growth Opportunities III. Financial Highlights IV. Equity Based Compensation V. Summary |
 Firm Overview |
 Westwood at a Glance • Asset management firm focused on Value & Income, Global & Emerging Markets strategies • Serving institutional, private client and mutual fund investors since 1983 • Publicly traded since 2002 (NYSE : WHG) 1 as of February 28, 2013 1 Firm Overview Financial Profile • 2012 Revenue: $77 million • Assets Under Management: $14.2 billion • Dividend yield @ $1.60 annual rate: 3.9%¹ • Equity market cap: $336 million¹ • Liquid balance sheet: $63.7 million of cash and investments at year-end • No debt • Equity ownership - Employees & Directors: 30% - Institutional holdings: 59% |
 Organization & Product Distribution • Targeted consultant relationships • Subadvisory partners • Plan sponsor direct marketing Institutional Mutual Funds Westwood Management Westwood Holdings Group, Inc. Private Wealth Westwood International Westwood Trust Westwood Funds • Client referrals • Third party referral sources • Local community involvement • DC consultants • Private Wealth Advisors • Media • Separately managed portfolios • Subadvisory • UCITS • Canadian pooled fund • Separately managed portfolios • Subadvisory • Collective funds • Enhanced Balanced TM asset allocation model • Commingled funds • Separately managed portfolios • Tax-managed accounts • Capped expense ratios • Institutional share class - Defined contribution plans - Other institutions • A share class - Mutual fund supermarkets 2 D i s t r I b u t I o n C h a n n e l s |
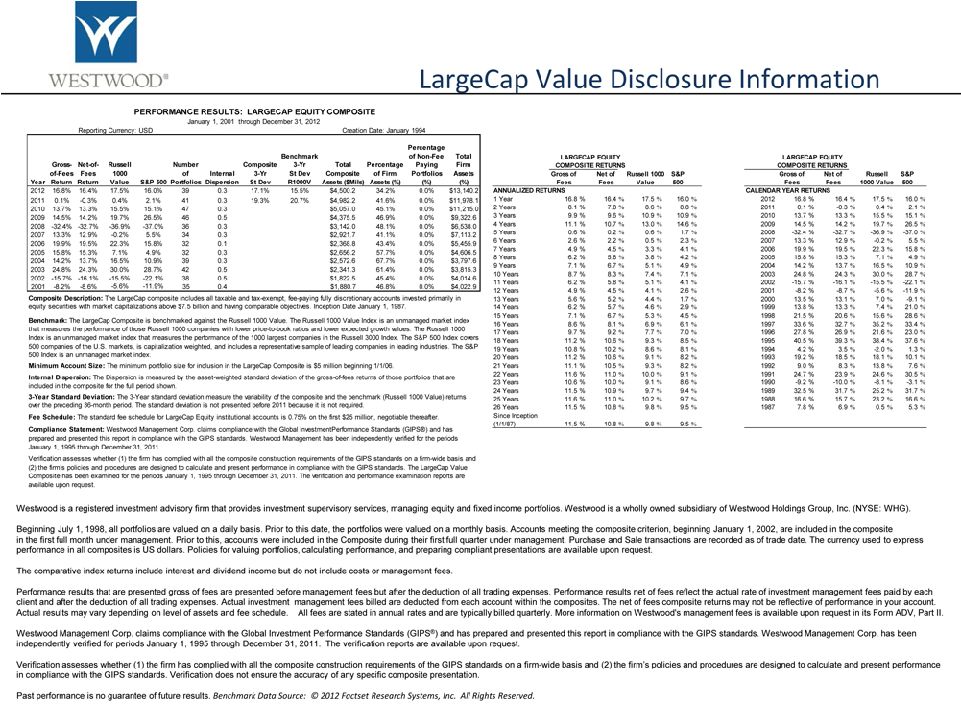
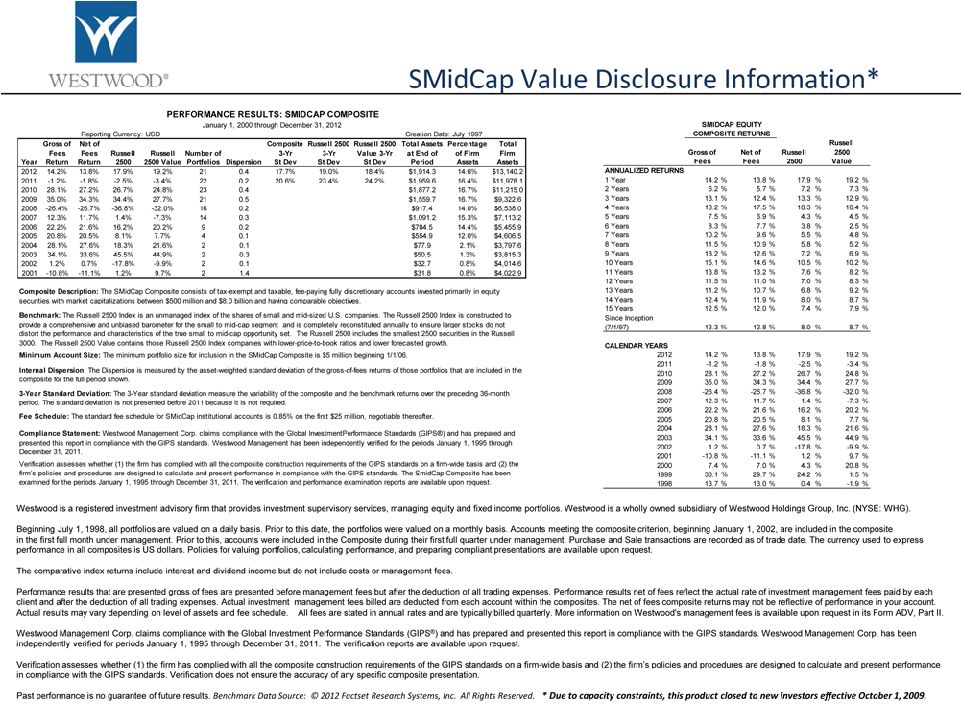
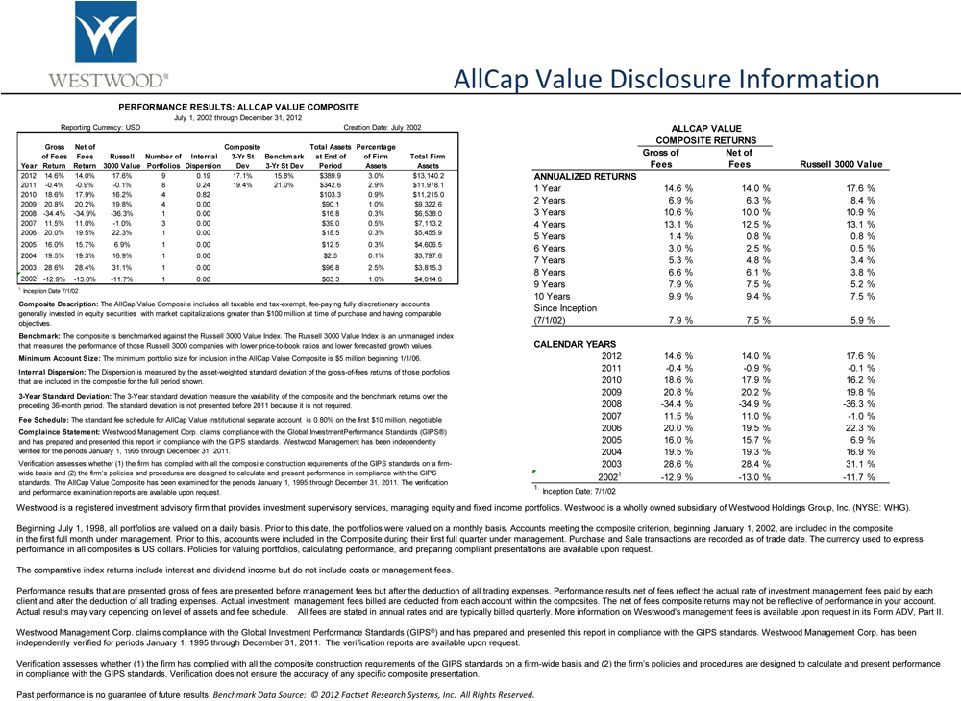
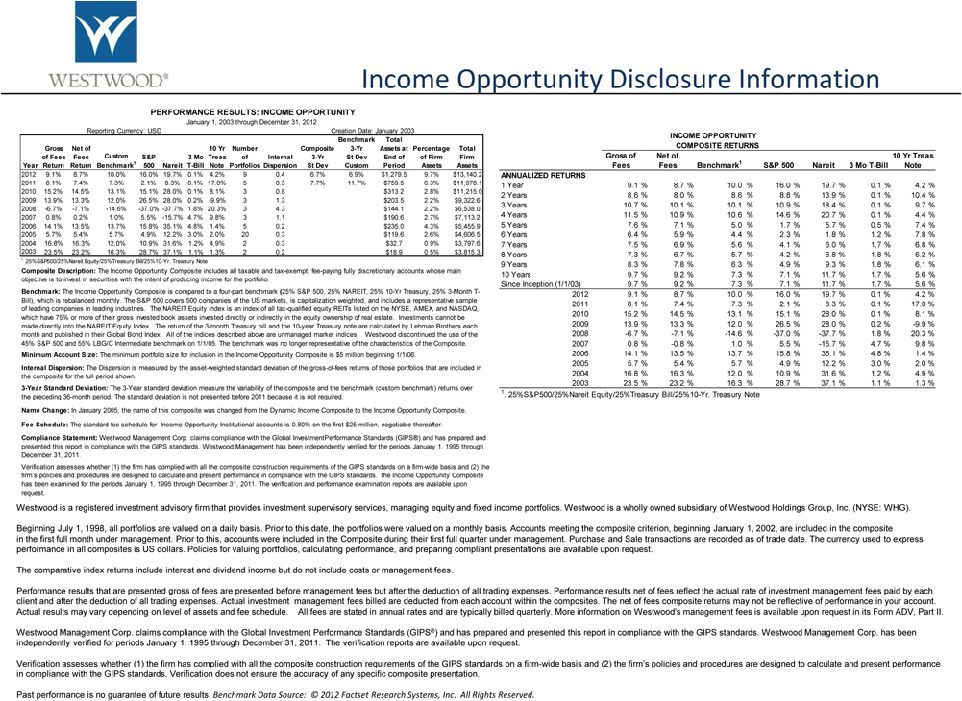
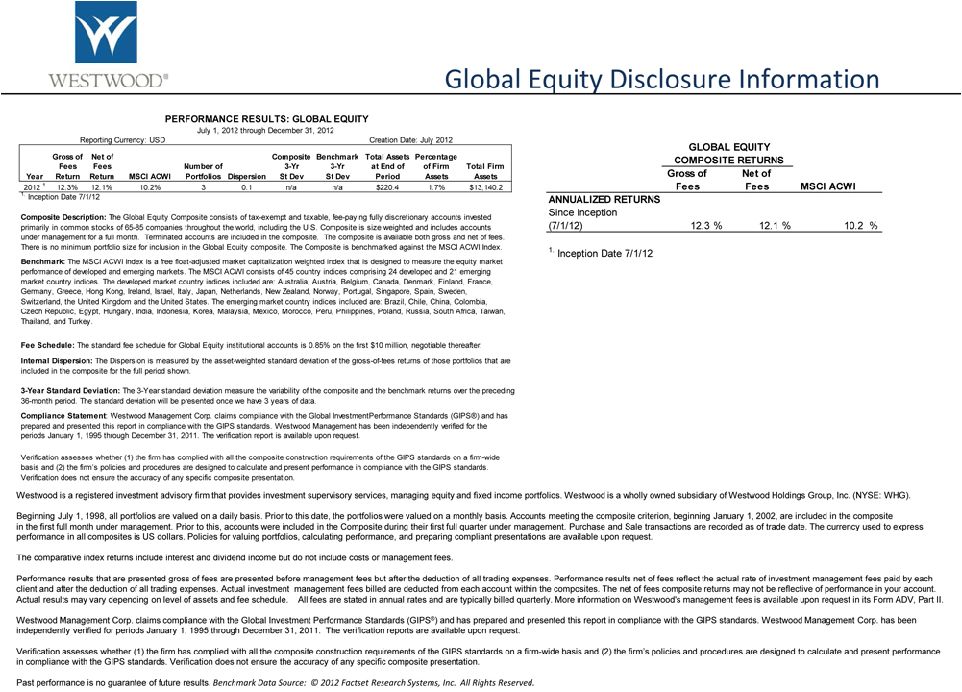
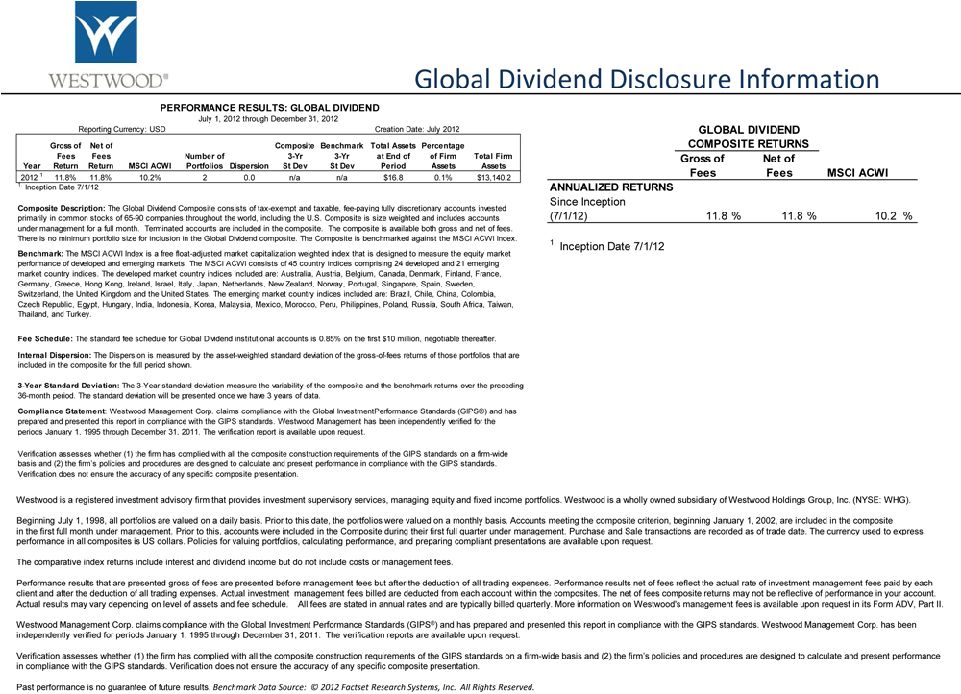
 *The institutional track record started January 1, 2002. In 2001, Westwood transitioned a midcap core equity strategy to the institutional SMidCap strategy. The midcap core portfolio was exclusively offered to private clients of Westwood's Trust Company. This change occurred as a result of the increased demand we observed by institutional investors. January 1, 2002 reflects the inception of the institutional SMidCap Equity strategy. The true inception date of the composite is 7/1/97. This strategy has consistently adhered to Westwood's investment process and philosophy. Please see appendix for full performance disclosures. The disclosures provided are considered an integral part of this presentation. Domestic Equity Strategies SmallCap Value 1/1/04 SMidCap Value * 1/1/02 (closed) SMidCap Value Plus+ 7/1/10 LargeCap Value 1/1/87 AllCap Value 7/1/02 Dividend Growth 11/1/93 Total Firm Assets Under Management as of 12/31/12: $14.2B Specialized Strategies Income Opportunity 1/1/03 LargeCap Value – Socially Responsible Investing 1/1/98 Master Limited Partnership Infrastructure Renewal 1/1/03 Westwood Offerings Product Mix Expanding with Non-U.S. & Specialized Offerings Global/Emerging Markets Strategies Global Equity 7/1/12 Global Dividend 7/1/12 Emerging Markets 7/1/12 Emerging Markets Plus 7/1/12 3 |
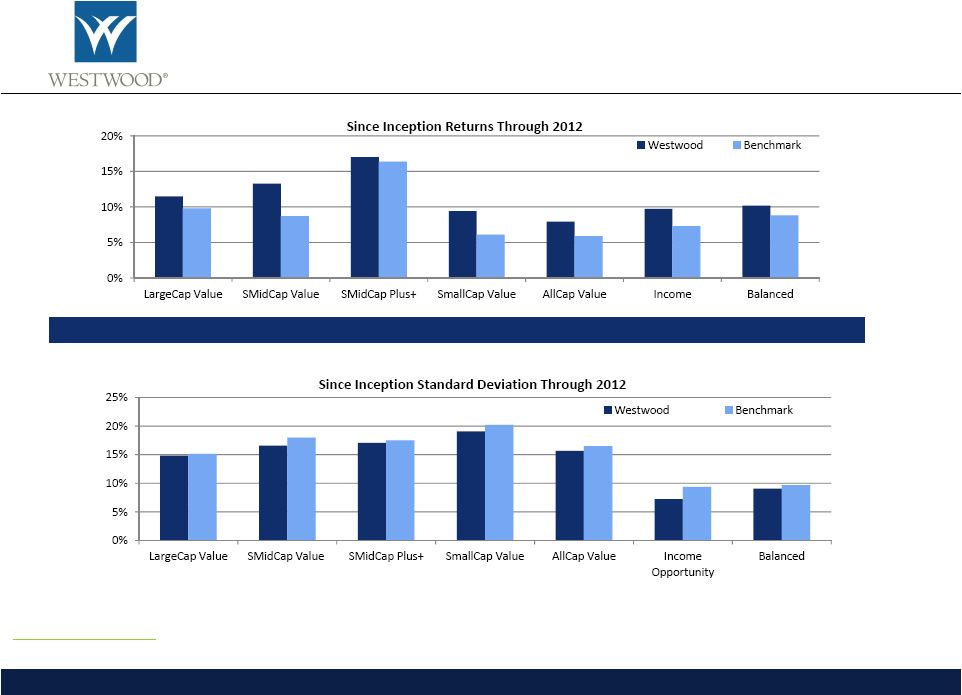 *Due to capacity constraints, this product closed to new investors effective October 1, 2009. Performance provided reflects the institutional track record which started January 1, 2002. In 2001, Westwood transitioned a midcap core equity strategy to the institutional SMidCap strategy. The midcap core portfolio was exclusively offered to private clients of Westwood's Trust Company. This change occurred as a result of the increased demand we observed by institutional investors. January 1, 2002 reflects the inception of the institutional SMidCap Equity strategy. The true inception date of the composite is 7/1/97. This strategy has consistently adhered to Westwood's investment process and philosophy. Past performance is not a guarantee of future returns. Please see appendix for full performance disclosures (http://westwoodgroup.com/disclaimers.pdf). The disclosures provided are considered an integral part of this presentation. Benchmark Data Source: © 2012 FactSet Research Systems, Inc. All Rights Reserved. Investment Product Performance Delivered Excess Returns with Lower than Benchmark Risk Net of Fees 10.8% 12.8% 17.1% 8.9% 7.5% 9.2% 9.1% 4 |
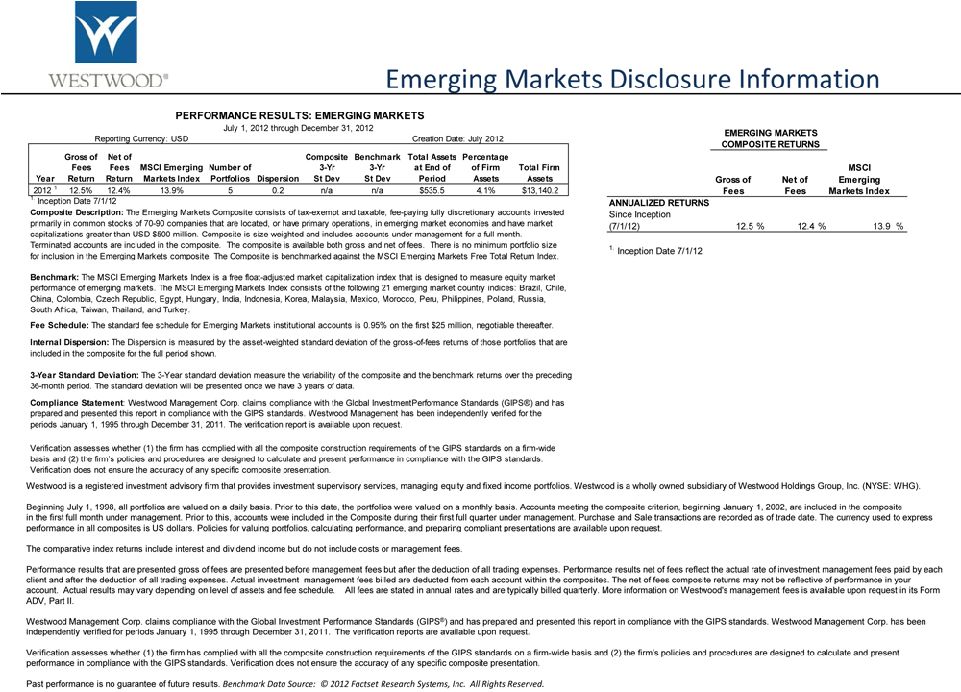
 Portfolio Attributes Westwood International’s AUM Surpassed $1B Emerging Markets Emerging Markets Plus Global Dividend Global Equity Target number of holdings 70-90 50-70 65-90 65-85 Positions at initiation 1.2 - 1.5% 1.6 - 1.8% 1.0 - 1.2% 1.2 - 1.5% Initial universe 27 countries 5,000+ securities 27 countries 5,000+ securities 45 countries 10,000+ securities 45 countries 10,000+ securities Minimum Market capitalization (USD) $500 million $1.5 billion $500 million $1 billion Liquidity (most recent 100 days - USD) $3.5 million daily trading average $7 million daily trading average $3.5 million daily trading average $7.5 million daily trading average Capacity (USD) $4 billion $4 billion $7 billion $10 billion Prospective Client Reserved Capacity $2.3 billion $0.5 billion $1 billion $1 billion Remaining Capacity $1.2 billion $3.4 billion $5.9 billion $8.8 billion 5 |
 Growth Opportunities |
 Growth Opportunities • Significant capacity remains in seasoned products - Opportunity for substantial operating leverage • Subadvisory mandates - Access to broad distribution infrastructure & global markets - Support partner distribution network vs. building proprietary distribution network • Westwood Funds - Family of 10 mutual funds - Assets under management currently exceed $1.8 billion - Launched Emerging Markets, Global Equity, and Global Dividend in 4Q12 - Strong organic growth - Asset acquisition opportunities 6 • Private Wealth • Westwood International - Cultivate new products - Expand private wealth platform in new markets - Acquisition opportunities in strategic markets - International Distribution - New Product Opportunities - Specialized Country Fund Structures |
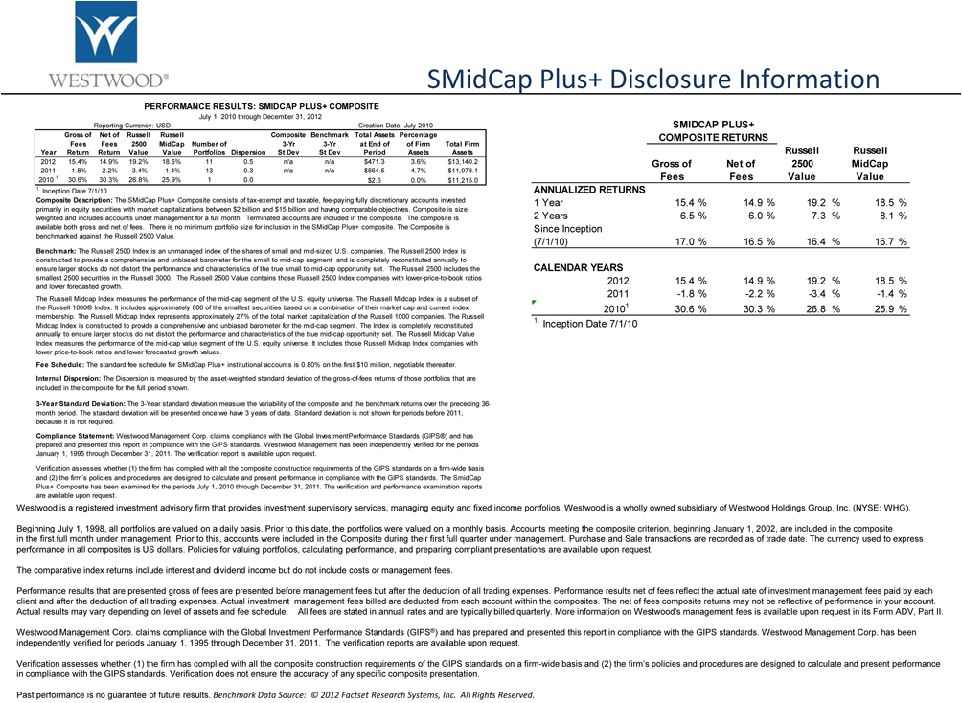
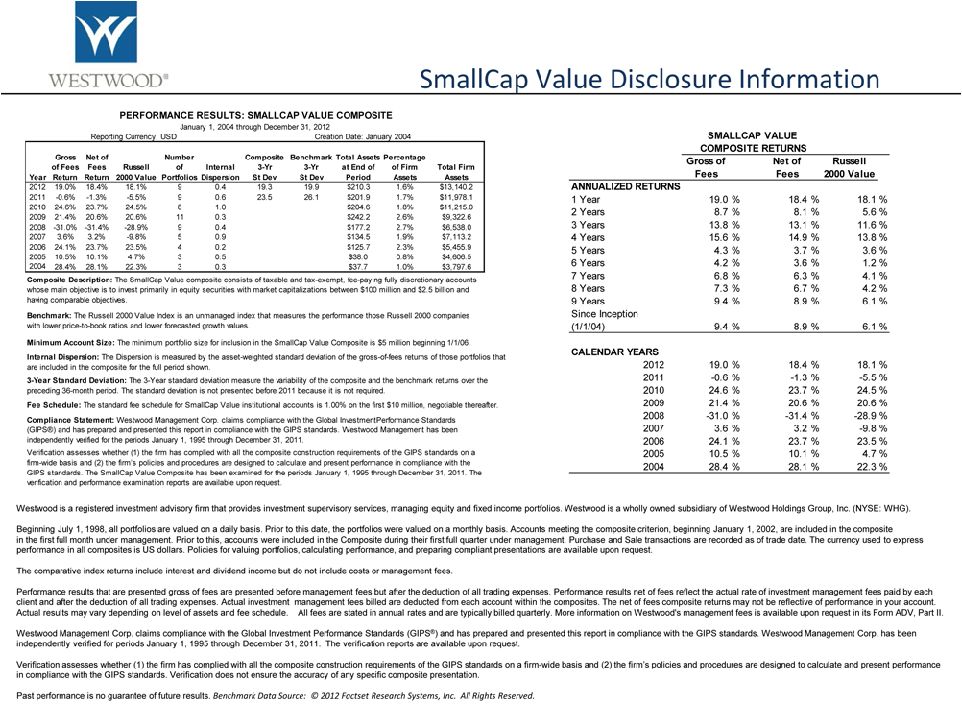
 Growth Opportunities Significant Product Capacity For Future Growth Seasoned Products (>3 year track record & >$100 Million in assets) Assets Under Management As of 12/31/12 Estimated Maximum Capacity AUM Asset Growth Potential Product Inception LargeCap Value $5.2 billion $25 billion $19.8 billion 1987 SMidCap Plus+ $492 million $8 billion $7.5 billion 2010 SMidCap Value $2.8 billion $3 billion Closed 1997 SmallCap Value $217 million $1.5 billion $1.3 billion 2004 AllCap Value $402 million $10 billion $9.6 billion 2002 Dividend Growth $182 million $20 billion $19.8 billion 2001 Income Opportunity $1.7 billion $5 billion $3.3 billion 2003 MLP $236 million $1.5 billion $1.3 billion 2003 Total Seasoned $11.2 billion $74 billion $62.6 billion New & Unseasoned (R&D) & Legacy Products Emerging Markets $538 million $4 billion $3.5 billion 2012 Emerging Markets Plus $104 million $4 billion $3.9 billion 2012 Global Equity $226 million $10 billion $9.8 billion 2012 Global Dividend $20 million $7 billion $6.9 billion 2012 Short Duration High Yield $54 million N/A N/A 2011 Balanced / Fixed Income / REIT / Global Strategic Diversification $614 million N/A N/A Various Note: Table reflects Westwood Management AUM as of 12/31/12 (including Westwood Trust commingled funds); excludes approximately $912 million in Westwood Trust separately managed accounts, agency assets and subadvised commingled funds and $581 million of additional assets managed by Omaha office 7 |
 Growth Opportunities Sub-Advisory Brands 8 • Access to established distribution channels • Generally lower average fee, but high profitability due to low incremental costs |
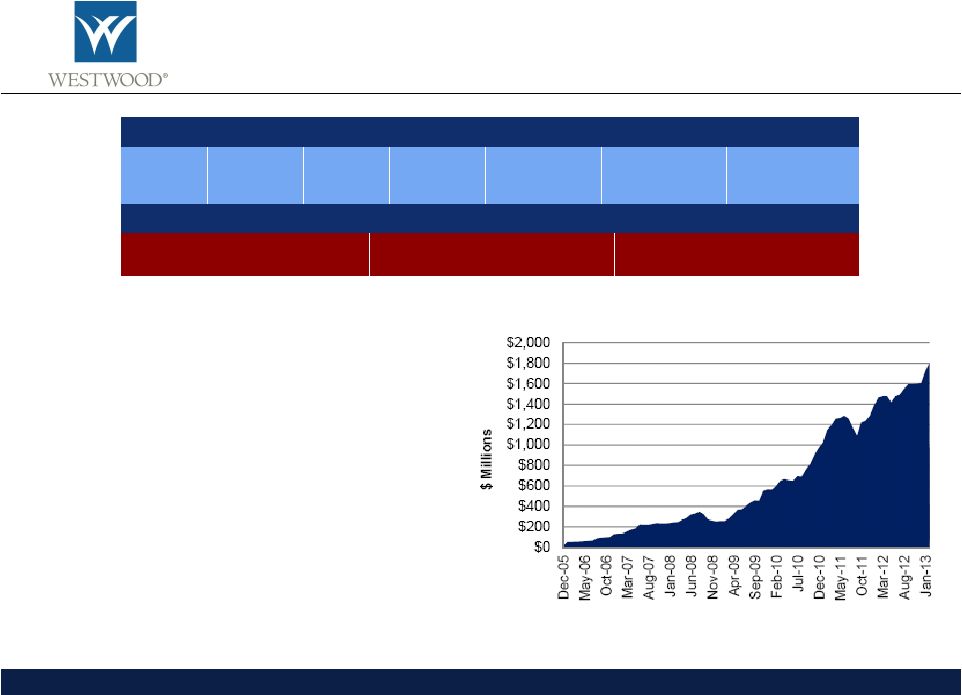 Growth Opportunities – Westwood Funds Mutual Funds Now Represent 12% of AUM • Mutual Fund Assets have grown to $1.8 billion from initial two fund launch in December 2005 • Six funds added last two years: - 2011: Dividend Growth, SMidCap Plus+, Short Duration High Yield - 2012: Emerging Markets, Global Equity, and Global Dividend • Targeted to institutional, defined contribution and RIA markets Growth in Westwood Funds Assets 1 Domestic Value & Income Strategies LargeCap Value WHGLX SMidCap WHGMX SMidCap Plus+ WHGPX SmallCap Value WHGSX Dividend Growth WHGDX Income Opportunity WHGIX Short Duration High Yield WHGHX International Strategies Emerging Markets WWEMX Global Dividend WWGDX Global Equity WWGEX Note: Short Duration High Yield is subadvised by SKY Harbor Capital Management, LLC 9 1 thru February 28, 2013 |
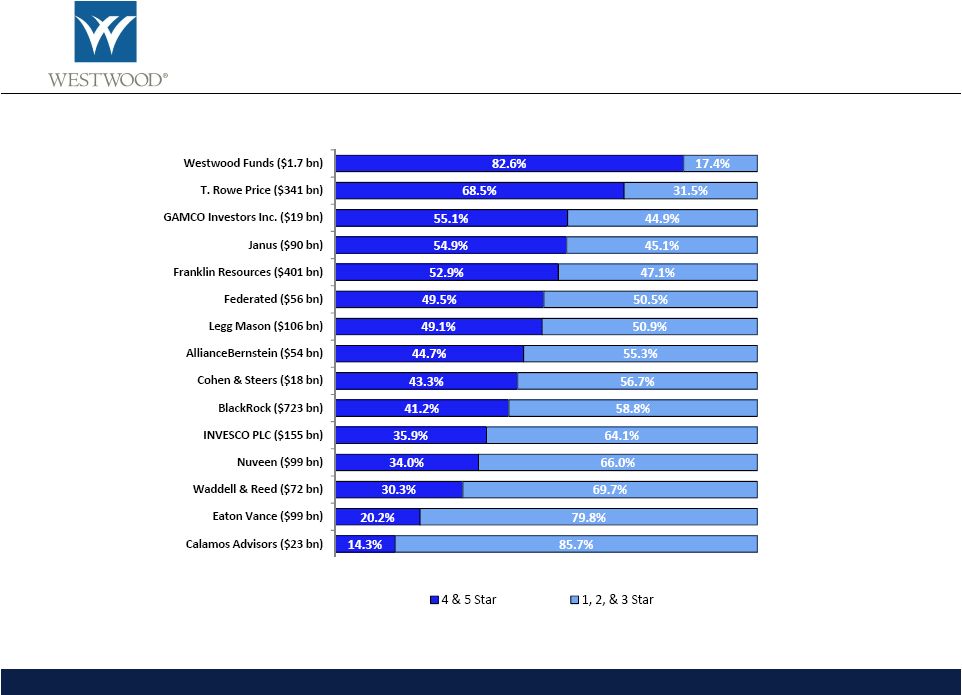 Growth Opportunities – Westwood Funds Substantial Proportion of 4 & 5 Star Rated Funds Proportion of Assets Rated Four or Five Star by Morningstar (Asset Weighted) Source: JPMorgan U.S. Asset Managers – North America Equity Research dated February14 ,2013; Strategic Insight. Westwood Funds AUM as of 1/31/13 10 |
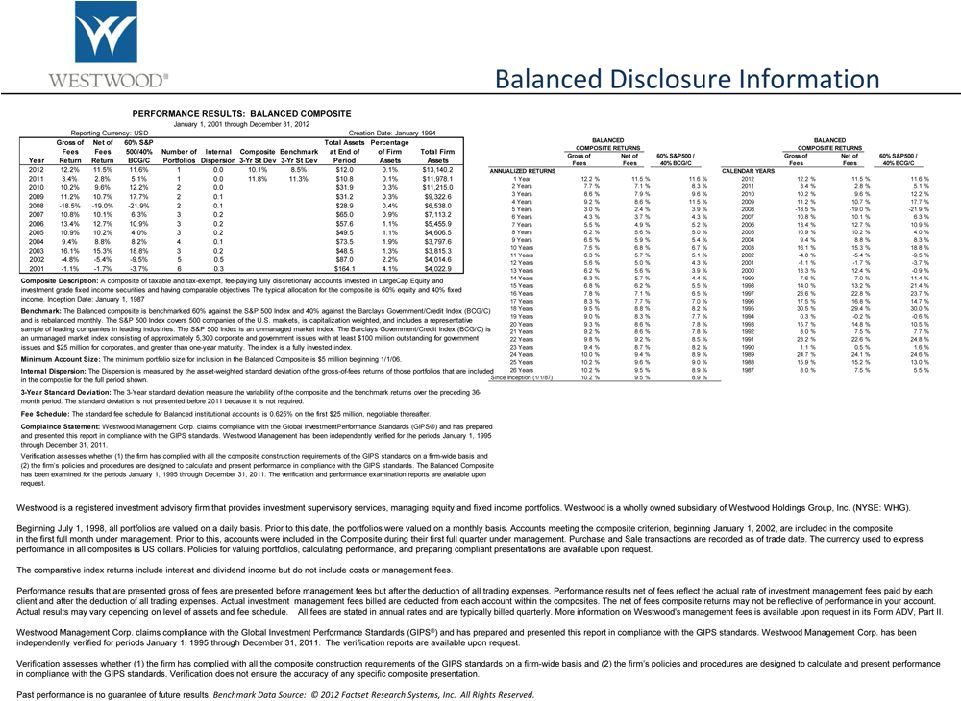
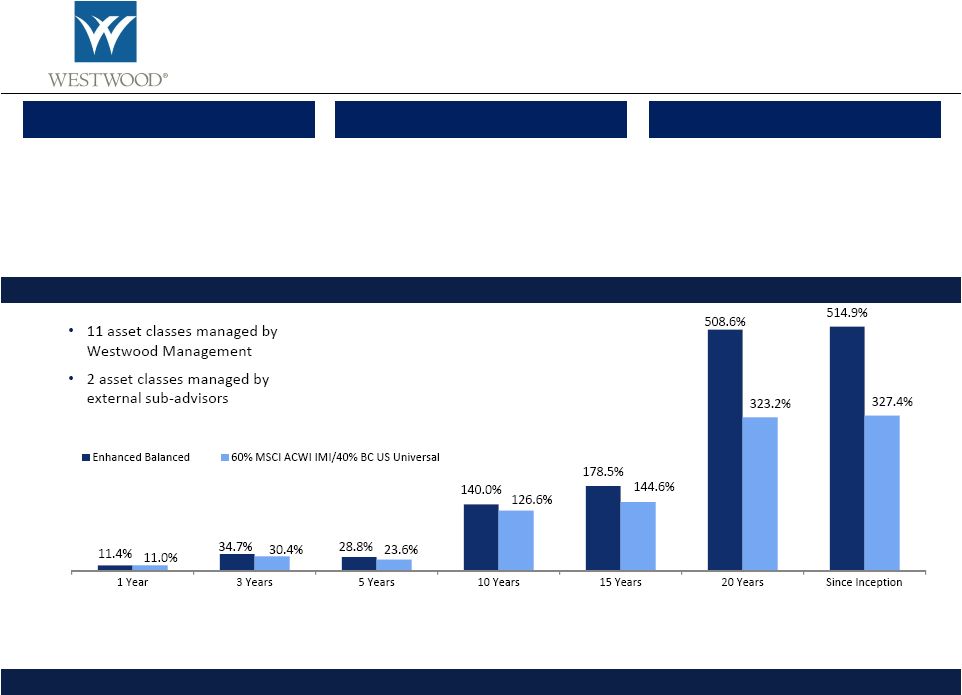 Westwood Trust – Private Wealth Focused on Organic Growth and Selective Acquisitions • Low cost, efficient solution • Asset gathering platform • “Best Ideas” • Consultative approach 1 For the period from 1/1/93 to 12/31/12, the Enhanced Balanced performance shown is that of a representative client who has been diversified among the available Westwood commingled funds throughout their term with Westwood. Since 12/31/12, the Enhanced Balanced performance shown is a composite of several clients who have been diversified among the available Westwood commingled funds throughout their term with Westwood.. 2 The Enhanced Balanced strategy is benchmarked 60% against the MSCI ACWI IMI Index and 40% against the Barclays US Universal Index. The MSCI ACWI IMI Index is an unmanaged market index consisting of Large, Mid and Small Cap equities in 24 Developed Markets and 21 Emerging Markets Countries. The Barclays US Universal Index is an unmanaged market index consisting of US Dollar denominated taxable bonds that are rated either investment grade or highyield. Since the inception of the MSCI ACWI IMI index is June 1, 1994,the MSCI ACWI index was used from January 1, 1993 – May 31, 1994. Westwood discontinued the use of the 60% S&P 500 and 40% Barclays Government Credit benchmark on 7/31/12 and the change was made retroactively. The new benchmark is more representative of the characteristics of the strategy because it represents both a global equity focus and a US investment grade and US high yield bond allocation. The 60% S&P 500 and 40% Barclays Government Credit benchmark does not accurately represents the characteristics of the strategy. Past performance is not indicative of future results. Stock market conditions vary from year toyear and can result in a decline in market value. This information is provided for clients and prospective clients of Westwood Management Corp. and Westwood Trust only. This is not an offer or recommendation to buy or sell a security or an economic sector. 11 • Establishes long-term trust relationship • Capable of serving multiple generations Enhanced Balanced Trust Services Continuity of Leadership Comprehensive Allocation Strategy • Randy Root, President Westwood Trust Dallas (20 yrs) • Art Burtscher, President Westwood Trust Western Region (13 yrs) • Kallie Myers, Board Certified Attorney |
 1 Team members are listed from left to right as shown in picture above. Westwood International Advisors Investment Team Global Team with Impressive Track Record Team Members¹ Sector Coverage Industry Experience Patricia Perez-Coutts, CFA – Senior Vice President, Portfolio Manager Lead Portfolio Manager 27 Years Thomas Pinto Basto, CFA – Vice President, Portfolio Manager Technology, Telecommunications 19 Years Alice Popescu, CFA, CMT, DMS – Associate Portfolio Manager Consumer Discretionary, Energy 10 Years Richard Dolhun, MBA – Global Equity Analyst Consumer Staples, Health Care 17 Years Martin Pradier, CFA – Global Equity Analyst Materials, Industrials 23 Years Max El-Sokkary, CFA – Global Equity Analyst Financials 18 Years Gerald Loo, CIM – Vice President Portfolio Specialist 15 Years 12 |
 Growth Opportunities Westwood International Advisors 13 • Internationally diverse team – 10 languages spoken fluently • Collectively lived or worked in 10 countries • Global research coverage of all GICS sectors – developed and emerging economies • Average 18 years of industry experience • Focus on Economic Value Added (EVA) • Risk management incorporated at every step of the process • Long-term focus with very low turnover (< 20% annualized on average) Diversity Experience Investment Approach |
 Financial Highlights |
 Total Return Since 2002 WHG Spin-off Data as of 12/31/12 Track Record of Shareholder Value Creation 14 |
 2012 Highlights • AUM increased 8% to $14.2 billion • Average asset based fee increased from 53 bps to 55 bps • Income Opportunity strategy, with its focus on current income and lower volatility, experienced high demand, nearly doubling its assets to over $1.7 billion • SmallCap and MLP products experiencing high levels of interest • Global and Emerging Market Strategies surpassed $1B AUM • Record 2012 revenue of $77.5 million, a 12.5% increase over the prior year • Net income decreased to $12.1 million, reflecting WIA start-up costs • Economic earnings increased 15% to $29.2 million¹ • Increased quarterly dividend to $0.40 per share; dividend yield of 3.9% at February 28, 2013 • Repurchased $3.8 million (97,724 shares) of our common stock • Liquid cash and investments of $63.7 million at December 31, 2012 vs. $57 million in 2011 Assets Under Management Investment Strategies Operating Results Capital Management 15 1 Excludes $5.9 million of Westwood International Advisors related losses |
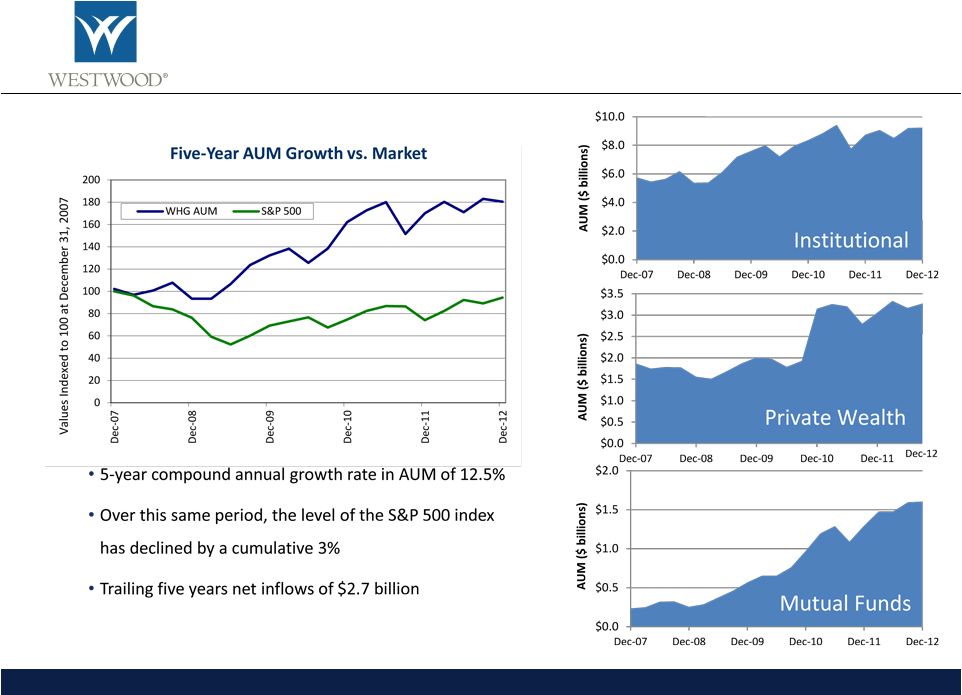 16 Growth in Assets Under Management |
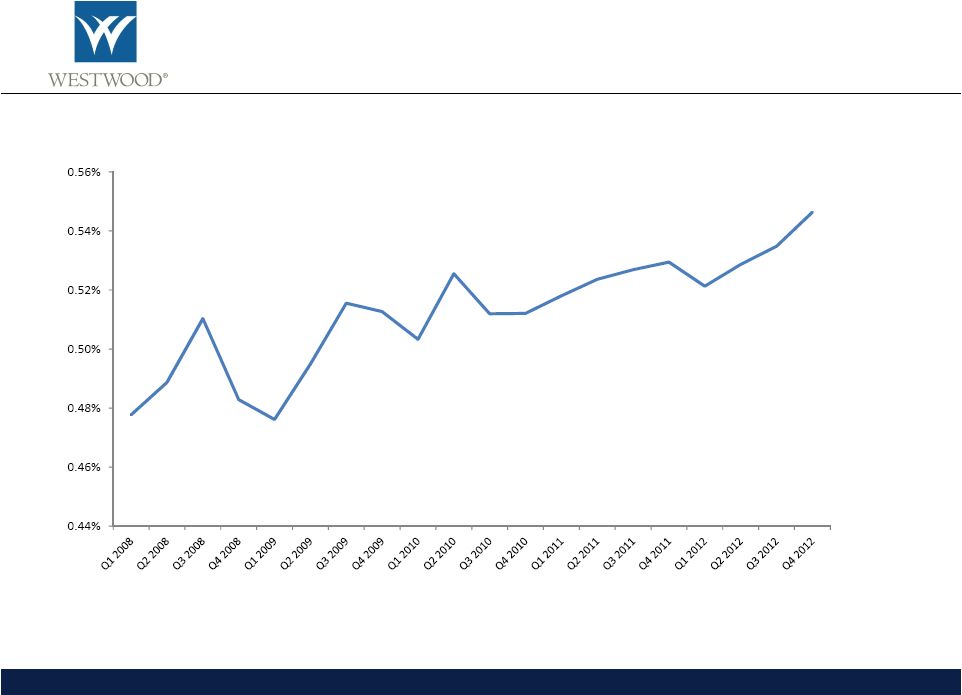 Average Asset-Based Fees 17 Note: excludes impact of performance-based fees Westwood Average Asset-Based Fee |
 Quarterly Revenue Growth – Trailing Five Years 1 Excluding performance-based fees 18 |
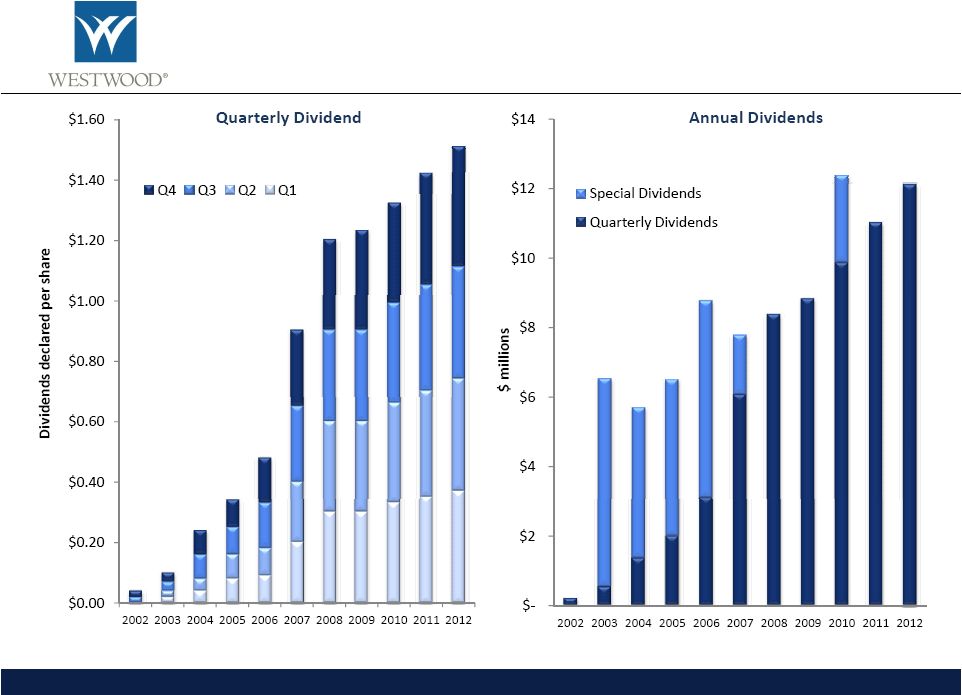 Attractive Dividend Returns $91 Million of Dividends Declared Since Becoming Public *Data as of 12/31/12, excludes special dividends 19 |
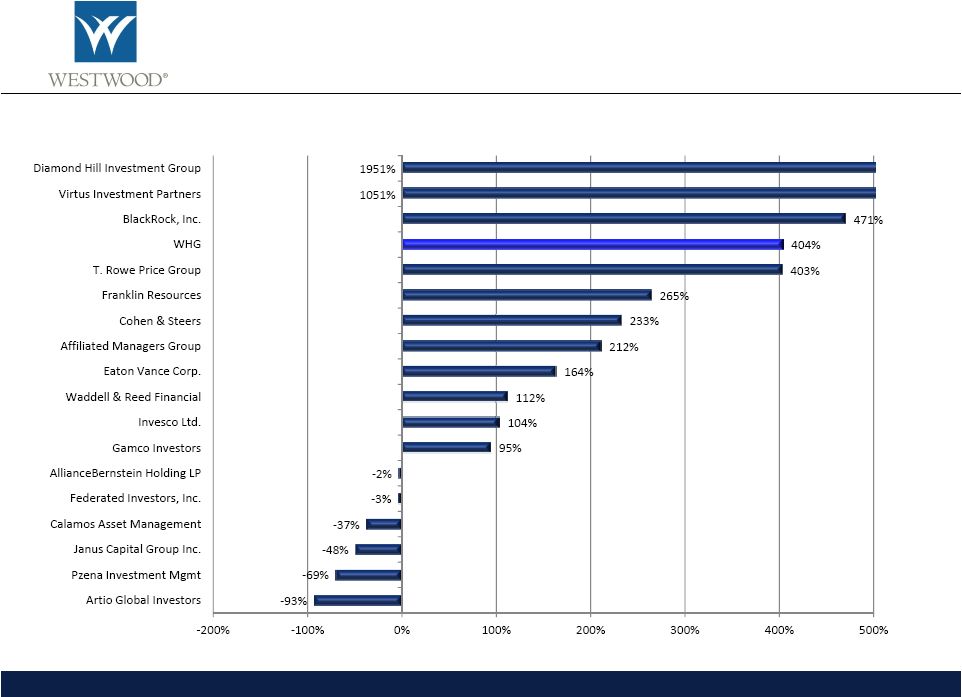
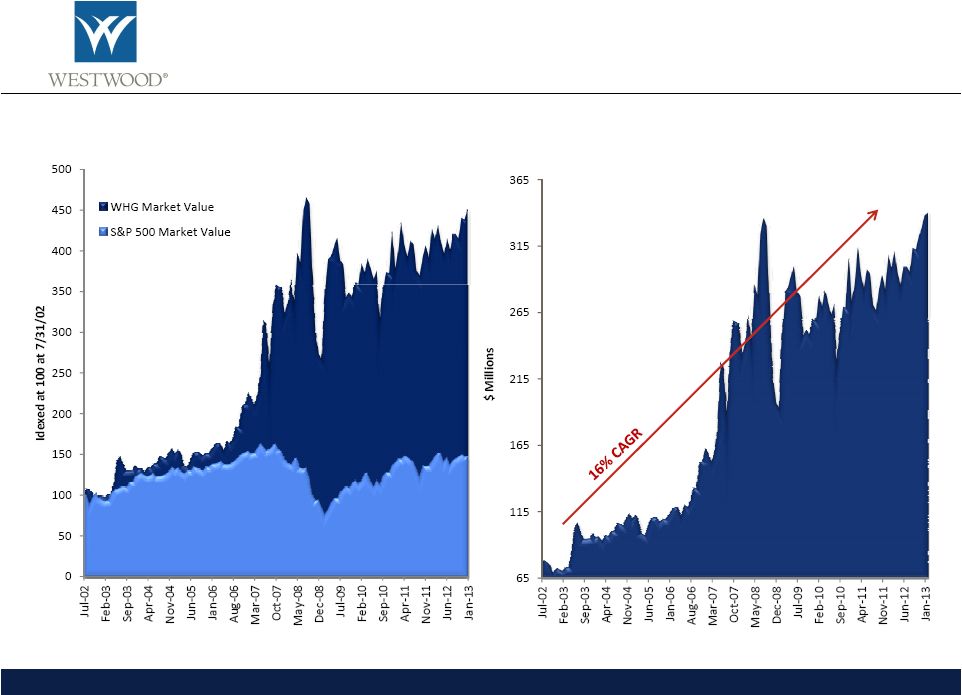 Shareholder Value Creation WHG vs. S&P 500 Market Capitalization 20 WHG Market Capitalization |
 Equity Based Compensation |
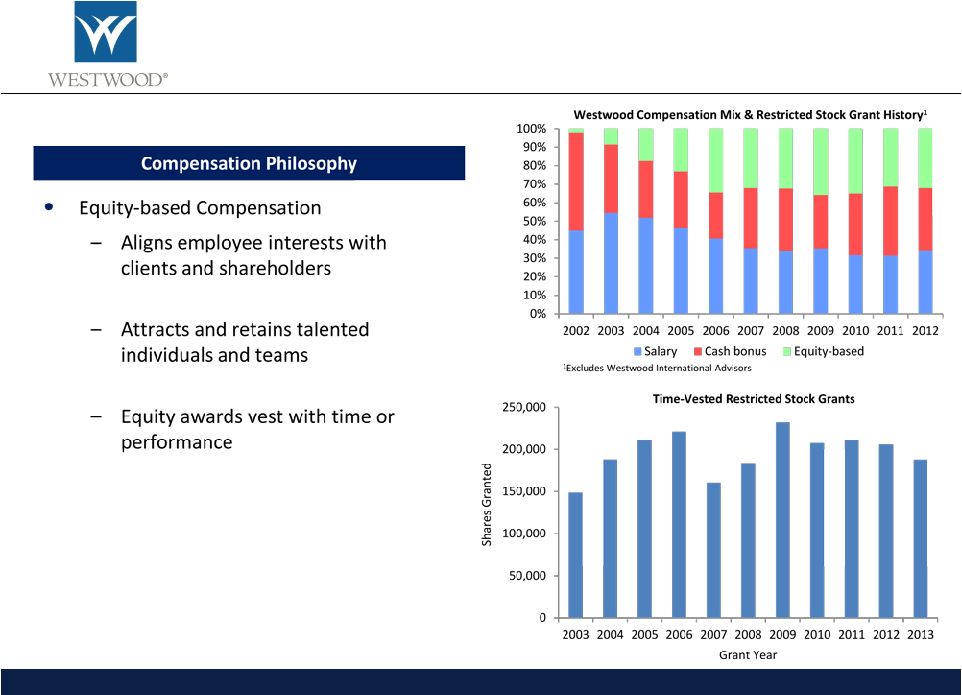 21 Equity Based Compensation |
 • Annual Cash Performance Awards funded into an Employee Benefit Trust • RBC as Trustee invests funds in WHG common stock • WHG common stock acquired in open market transactions by the Trust • Stock held in trust until employee vests in the Award • Awards cliff vest 3 years after performance period • 2013 Cash Awards approximate $880,000 – all of which will be used to purchase WHG stock • Share Award Plan is Anti-Dilutive Canadian Share Award Plan Share Award Plan 22 |
 • Granted 188,124 restricted shares in February 2013 • 291,079 shares currently available for future grants • Proposal to increase shares available for future grants by 500,000 • Total represents 4 years based on 2013 grant levels Equity Based Compensation 23 |
 Summary |
 Strategic Priorities 24 • Focus on Improving LargeCap and SMidCap performance • Broaden Institutional Sales • Fill remaining capacity of existing products • Cultivate new relationships with strong global partners • Hired first mutual fund and managed account sales professional • Continue to expand sales and marketing platforms • Create commingled and UCITS Funds for global prospects • Add Sales and Relationship Managers • Corporate Development Opportunities • Focus on Performance • Capitalize on existing pipelines • Leverage National Bank of Canada relationship Improve Performance & Fill Capacity Sub-Advisory Mandates Westwood Funds Expand Private Wealth Platforms Westwood International Advisors |
 www.westwoodgroup.com 200 Crescent Court Suite 1200 Dallas, Texas 75201 T. 214.756.6900 * * * * * * * * * * * * * * * * * |
 Disclosures |
 Economic Earnings Reconciliation Economic Earnings Reconciliation ($ thousands) 2007 2008 2009 2010 2011 2012 GAAP net income $ 7,944 $ 10,543 $ 7,895 $ 11,280 $ 14,686 $ 12,090 Add: Restricted stock expense 5,316 6,735 7,666 9,269 9,969 10,515 Add: Intangible amortization - - 13 155 498 472 Add: Tax benefit from goodwill amortization - - 5 59 189 154 Economic Earnings $ 13,260 $ 17,278 $ 15,579 $ 20,763 $ 25,342 $ 23,231 |
 |
 |
 |
 |
 |
 |
 |
 |
 |
 |
 |
 |
 IMPORTANT INFORMATION ABOUT YOUR PRIVACY BECAUSE YOUR TRUST IS SO IMPORTANT Your trust is the cornerstone of our relationship. That is why we work so diligently to safeguard your privacy. The information that you provide us is kept in the strictest of confidence. We have no intentions of selling personal information about our clients to third-party businesses. We are proud to make that commitment to you, because your trust is the foundation of our business. The following privacy policy explains how we use and protect the information about our clients. We ask that you read it carefully. A nonaffiliated third party is a person we do not employ or a company that is not an affiliate of ours. This is also known as nonaffiliated third party, or simply, an “other party.” THE INFORMATION WE COLLECT We collect information about you from the following sources: • Information you give us on applications or other forms • Information about your transactions with us • Information about your transactions with our affiliates INFORMATION WE DISCLOSE ABOUT YOU We do NOT disclose any information about you to anyone, except as permitted by law. This might include disclosures necessary to service your account, perform joint marketing or prevent unauthorized transactions. Destruction of Sensitive Data. All records and data are properly shredded prior to disposal. Destruction of documents is handled by authorized employees and/or bonded companies when the shredding of large quantities of documents is required. THE CONFIDENTIALITY, SECURITY, AND INTEGRITY OF YOUR INFORMATION We restrict access to information about you to those employees who need to know that information to provide products or services to you. We maintain physical, electronic, and procedural safeguards to protect this information. INFORMATION ABOUT FORMER CLIENTS We have the same policy about disclosing information about former clients as we do about current clients. We do not retrieve account or personal information from visitors who browse the public areas of our website. Westwoodgroup.com does use “HTTP cookies” – tiny pieces of information that we ask your browser to store. However, we make very limited use of these cookies for website statistical information only. We do NOT use them to learn your e-mail address, or to view data in cookies created by other websites. We will not share the information in our cookies or give others access to it. WESTWOOD TRUST DEPARTMENT OF BANKING DISCLAIMER Westwood Trust is chartered under the laws of the State of Texas and by state law is subject to regulatory oversight by the Texas Department of Banking. Any consumer wishing to file a complaint against Westwood Trust should contact the Texas Department of Banking through one of the means indicated below: In Person or U.S. Mail: 2601 North Lamar Boulevard, Suite 300, Austin, Texas 78705-4294 Fax No.: (512) 475-1313 E-mail: consumer.complaints@banking.state.tx.us Website: www.banking.state.tx.us NOTICE OF YOUR FINANCIAL PRIVACY RIGHTS We, our, and us, when used in this notice, mean Westwood Management Corp., Westwood Trust, and Westwood Holdings Group, Inc. This is our privacy notice for our clients. When we use the words “you” and “your” we mean the following types of clients: •Our consumer clients who have a continuing relationship by purchasing or holding financial products or services such as a(n): •Self-directed Individual Retirement Account •Financial, investment, or economic advisory services •Mutual fund shares •All persons who use our trust department •All IRA accounts for which we act as custodian •Former clients We will tell you the sources of the information we collect about you. We willtell you what measures we take to secure that information. We first define some terms. Nonpublic personal information means information about you that we collect in connection with providing a financial product or service to you. To help the government fight the funding of terrorism and money laundering activities, Federal law requires all financial institutions to obtain, verify, and record information that identifies each person who opens an account. Therefore, when you open an account, we will ask for your name, address, date of birth, and other information that will allow us to identify you. We may also ask to see your driver’s license or other identifying documents. Federal law requires us to screen new clients through the Office of Foreign Assets Control “Specially Designated National & Blocked Persons” list and/or the Financial Crimes Enforcement Network (FinCEN). Nonpublic personal information does not include information that is available from public sources, such as telephone directories or government records. Hereafter, we will use the term “information” to mean nonpublic personal information as defined in this section. An affiliate is a company we own or control, a company that owns or controls us, or a company that is owned or controlled by the same company that owns or controls us. Ownership does not mean complete ownership, but means owning enough to have control. |