For the transition period from to.
Indicate by check mark whether the registrant is a large accelerated filer, an accelerated filer, a non-accelerated filer, or a smaller reporting company. See the definitions of “large accelerated filer,” “accelerated filer” and “smaller reporting company” in Rule12b-2 of the Exchange Act. (Check one):
The aggregate market value of the voting stock held by non-affiliates of the registrant on June 30, 2012, based upon the closing price of common stock on such date as reported on the NASDAQ Global Market, was approximately $434,352,386. Shares of voting stock held by directors, officers and stockholders or stockholder groups whose beneficial ownership exceeds 5% of the registrant’s common stock outstanding have been excluded in that such persons may be deemed to be affiliates. The number of shares owned by stockholders whose beneficial ownership exceeds 5% was determined based upon information supplied by such persons and upon Schedules 13D and 13G, if any, filed with the Securities and Exchange Commission. This assumption regarding affiliate status is not necessarily a conclusive determination for other purposes.
The number of shares of common stock outstanding as of March 12, 2013 was 20,534,985.
Portions of the Registrant’s definitive Proxy Statement for its 2013 Annual Stockholders’ Meeting are incorporated by reference into Part III of this Annual Report on Form 10-K, to be filed within 120 days of the registrant’s fiscal year ended December 31, 2012.
PROCERA NETWORKS, INC.
In addition to historical information, this Annual Report on Form 10-K contains forward-looking statements regarding our strategy, financial performance and revenue sources that involve a number of risks and uncertainties, including those discussed under the title “RISK FACTORS” in Item 1A. Forward-looking statements in this report include, but are not limited to, those relating to our potential for future revenues, revenue growth and profitability; markets for our products; our ability to continue to innovate and obtain intellectual property protection; operating expense targets; liquidity; new product development; the possibility of acquiring (and our ability to consummate any acquisition of) complementary businesses, products, services and technologies; the geographical dispersion of our sales; expected tax rates; our international expansion plans; and our development of relationships with providers of leading Internet technologies. In some cases, you can identify forward-looking statements by terms such as “believe”, “expects”, “anticipates”, “intends”, “estimates”, “projects”, “target”, “goal”, “plans”, “objective”, “should”, or similar expressions or variations on such expressions.
While these forward-looking statements represent our current judgment on the future direction of our business, such statements are subject to many risks and uncertainties which could cause actual results to differ materially from any future performance suggested in this Annual Report on Form 10-K due to a number of factors, including, without limitation, our ability to produce and commercialize new product introductions, particularly our acceleration-related technologies; our ability to successfully compete in an increasingly competitive market; the perceived need for our products; our ability to convince potential customers of the value of our products; the costs of competitive solutions; our reliance on third party contract manufacturers; continued capital spending by prospective customers and macro-economic conditions. Readers are cautioned not to place undue reliance on the forward-looking statements, which speak only as of the date of this Annual Report on Form 10-K. We undertake no obligation to publicly release any revisions or updates to forward-looking statements to reflect events, information or circumstances arising after the date of this document, except as required by federal securities laws. See “RISK FACTORS” appearing in Item 1A. Investors may access our filings with the Securities and Exchange Commission, including our annual reports on Form 10-K, our quarterly reports on Form 10-Q, our current reports on Form 8-K and amendments to such reports on our website, free of charge, at www.proceranetworks.com, but the information on our website does not constitute part of this Annual Report on Form 10-K and is not incorporated by reference.
Throughout this Annual Report on Form 10-K, we refer to Procera Networks, Inc., a Nevada corporation, as “Procera” or the “Company” and, together with its consolidated subsidiaries, as “we,” “our” and “us,” unless otherwise indicated. Any reference to “Netintact” refers collectively to our wholly owned subsidiaries, Netintact, AB, a Swedish corporation and Netintact, PTY, an Australian corporation.
PART I
We are a leading provider of Intelligent Policy Enforcement, or IPE, solutions that enable mobile and broadband network operators and entities managing private networks, including higher education institutions, businesses and government entities (collectively referred to as network operators), to gain enhanced visibility into, and control of, their networks. Our solutions provide granular network intelligence intended to enable network operators to improve the quality and longevity of their networks, better monetize their network infrastructure investments, control security hazards and create, commercialize and deploy new applications and services for their users. We believe that the intelligence our products provide about users and their usage enables our network operator customers to make qualified business decisions. Our network operator customers include mobile service providers, broadband service providers, cable multiple system operators, or MSOs, Internet Service Providers, or ISPs, educational institutions, enterprises and government agencies.
Our IPE products are part of the growing market for mobile packet and broadband core products. According to Infonetics Research, the market for IPE products was expected to reach $601.7 million in 2012 and currently is expected to grow to $1.8 billion in 2016, a 2011–2016 compounded annual growth rate, or CAGR of 30.4%. Our bundled products deliver a solution that is a key element of the mobile packet and broadband core ecosystems. Our solutions are often integrated with additional elements in the mobile packet and broadband core including Policy Management, Charging and Network Monitoring, Optimization and Assurance functions and are compliant with the widely adopted 3rd Generation Partnership Program, or 3GPP, standard. In order to respond to rapidly increasing demand for network capacity due to increasing subscribers and usage, network operators are seeking higher degrees of intelligence, optimization, network management, service creation delivery and monetization in order to differentiate their offerings and deliver a high Quality of Experience, or QoE, to their subscribers. We believe the need to create more intelligent and innovative mobile and broadband networks will continue to drive demand for our products.
Our products are marketed under the PacketLogic brand name. We have a broad spectrum of products delivering IPE at the access, edge and core layers of the network. Our products are designed to offer maximum flexibility to our customers and enable differentiated services and revenue-enhancing applications, all while delivering a high Quality of Service, or QoS, for subscribers.
We were incorporated in 2002 and became a public company in October 2003 following our merger with Zowcom, Inc., a publicly-traded Nevada corporation. In 2006, we completed acquisitions of the Netintact entities and in 2013, we acquired Vineyard Networks, Inc., a leader in the Enterprise OEM DPI market. Our Company is headquartered in Fremont, California, and we have regional headquarters in Varberg, Sweden and Singapore. We sell our products through our direct sales force, resellers, distributors and systems integrators in the Americas, Asia Pacific and Europe.
Industry Background
Network traffic has risen sharply in recent years as a result of the advent of ubiquitous broadband Internet Protocol, or IP, and mobile networks covering an increasing portion of the world’s population, the proliferation of sophisticated edge devices including smartphones, tablets and laptops and the rise in connections, communications, social networking and data-intensive applications. We refer to this new era of hyper-connectivity as the New Digital Lifestyle. According to the Cisco Visual Networking Index, globally, mobile data traffic may reach 11,155,531 Terabytes (11.16 Exabytes) per month in 2017, the equivalent of 2,789 million DVDs each month or 30,742 million text messages each second.
Mobile data networks are an essential tool in the New Digital Lifestyle for streaming video, social networking and collaboration. Consumers are accessing content from multiple mobile broadband connections and have high expectations on this information being available in real-time. Social networking, applications and entertainment content resides in the cloud in real-time and without quality access to the Internet, the New Digital Lifestyle can be disrupted. As networks advance in capabilities in both speed and capacity, new advanced devices and applications will spur more competition for scarce bandwidth. This results in greater network congestion, causing network operators to balance subscriber demand for network bandwidth with the cost of building additional capacity. In addition, network providers must be able to adapt to evolving user behavior by rapidly introducing new services and business models to keep pace with demand, which we call service personalization. IPE enables mobile and broadband network operators to provide unprecedented levels of personalization, service optimization, network assurance and rapid service creation to monetize network investments. Personalization is tailoring service plans to the needs of the consumer. For example, social networking users may judge QoE (“Quality of Experience”) through their Facebook experience and Video Streamers may judge QoE by the speed and quality of Netflix or YouTube video downloads. A critical element for network operators to keep pace with demand and cope with evolving user behavior is to gain as much insight as possible into network activity at levels of detail that are not possible with existing routers, switches and broadband termination devices.
3GPP Policy Ecosystem
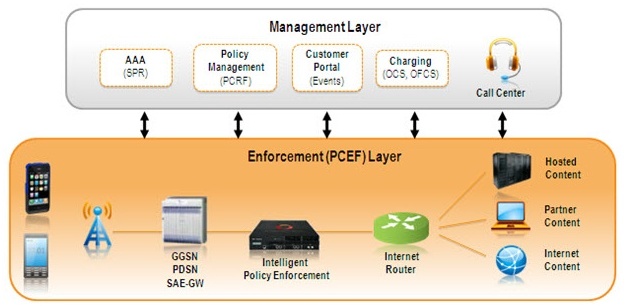
Within 3GPP, a framework has been defined for Policy Management and Policy Enforcement:
With the policy framework established by 3GPP, a management layer and an enforcement layer were created to control user behavior and network provisioning. The Policy and Charging Rules Function, or PCRF, was established as the policy decision point that establishes the policies that are applied to subscribers and mobile data traffic on the network. The management layer on the network has specifically defined protocols for interacting with the network layer to translate the policy decisions into policy enforcement.
The policy enforcement layer on the network is designed to enforce policies as instructed by the policy management layer. However, different devices on the network have different levels of visibility and intelligence, translating to different capabilities for enforcing policies. More intelligent network elements can implement more sophisticated policies. Sophisticated policies go far beyond simple byte counters or session timers and can include subscriber, location, device and application awareness. Awareness gives a powerful advantage in the policy enforcement and billing ecosystem in that policy enforcement “instructions” for highly aware network elements can be much simpler than for “unaware” enforcement points. A contrasting example of this scenario would be if a PCRF is informed of congestion on a specific location, an intelligent policy enforcement point could be passed an instruction to “prioritize real-time applications at Site A”, where an un-aware enforcement point would need to pass a number of new rules that might match specific devices and flows using access control lists, or a much less sophisticated congestion management policy that might make all users equally unsatisfied. The signaling load on the network normally will be considerably lower on an intelligent network than on an unaware network, as intelligent systems have a greater awareness of location, devices and applications for each active subscriber on the network.
IPE enables mobile and broadband network operators to provide exceptional levels of personalization, service optimization, network assurance and rapid creation of business models to monetize network investments. IPE uses Deep Packet Inspection, or DPI, technology as the core technology to gain awareness of subscribers, location, devices and applications. This awareness can then be used with the 3GPP policy ecosystem to deliver superior collection of services and applications to mobile and broadband networks. Features of IPE include:
Business Intelligence – Monitors application and usage trends in order to offer more compelling service packages to subscribers in a timely fashion. The ability to innovate applications and service bundles includes creating new services targeted to specific consumer groups, age groups or application users with fast time to market with minimal cost.
Service Personalization – Enables policy-based services designed to provide each individual subscriber with a service that meets their pricing, service and quality needs. Services include delivering prioritization during congestion, minimum bandwidth, usage limits, differentiated pricing, zero-rated content and time-based or value-added services such as Parental Control.
Network Optimization – Ensures that network resources are used most effectively throughout the network, including high touch services for high usage subscribers and formatted for specific device types. Included in network optimization is the ability to manage network congestion by understanding the root cause for the congestion and effectively resolving it to deliver higher QoE to subscribers without excessive capital expenditures.
Network Protection – Reacts quickly to network threats and attacks to minimize subscriber impact and QoE, as well as protects network integrity. This can be accomplished directly by the IPE solution or through integration with other security systems that leverage the visibility of the IPE system.
Bill Shock Prevention – Prevents user churn due to excessive roaming charges, data usage or distributed denial of service attacks that can inflate a subscriber’s bill. These notifications need to be proactive and function in real-time to notify subscribers as they approach service limits or pre-defined limits.
Industry Growth Catalysts
According to Infonetics Research, the market for IPE products was expected to reach $601.7 million in 2012 and is expected to grow to $1.8 billion in 2016, a 2011–2016 CAGR of 30.4%. The increasing necessity for Policy Management and IPE will be spurred by growing subscriber demand for mobile content and applications, coupled with the network operators’ need to control usage, cost and create new personalized services. Growth will be aided in part by:
Increase in global broadband users – Broadband connectivity has become globally ubiquitous, particularly as underdeveloped and developing markets continue to gain increased broadband access. Ericsson, in November 2012, forecasted that global mobile broadband subscriptions would reach 1.5 billion at the end of 2012, and will reach 6.5 billion in 2018. We believe that the mobile phone will continue to be the dominant mobile broadband access device. This increase in the number of broadband users is placing significant stress on bandwidth capacity. Operators need to implement new tiered service plans and business models that utilize Policy Management and IPE solutions in order to effectively manage their user growth and sustain a high level of QoS.
Device penetration – Mobile network operators have made significant investments in new technology to increase network performance and alleviate bandwidth congestion. At the same time, new mobile devices, including smartphones and tablets, are being introduced to take advantage of higher capacity 3G and LTE networks. Gartner forecasts that smartphone production and purchases will reach 1.2 billion devices worldwide in 2013. It also forecasts sales of 821 million smart phones in 2012 — which Garter predicts will account for 70 percent of total devices sold in 2012. Tablet purchases by businesses will reach 13 million in 2013, estimates Gartner, more than tripling by 2016 to reach 53 million units. Consumers are increasingly buying tablets in preference to netbooks and even entry-level notebooks or desktops. Unlike legacy devices, new smartphones and tablets are designed to take advantage of data-intensive services, like video and gaming, which will deplete available capacity. Mobile network operators will need to continue to adopt Policy Management and IPE solutions that provide more sophisticated network control and include subscriber, location, device and application awareness.
Competitive pressure across network operators – The competition among network operators continues to increase as they battle for the latest generation of broadband users and seek to capture new revenue opportunities. It is incumbent upon network operators to upgrade their networks while they simultaneously improve user QoS and QoE to grow their subscriber bases. Operators who adapt best to the evolving requirements of their users with more flexible business models and service plans should be well positioned to attract and retain subscribers. In order to do so, we believe that operators will need to integrate Policy Management and IPE solutions into their existing network infrastructure.
Industry Challenges
The industry also faces a number of challenges as an increasing amount of bandwidth is necessary to run increasingly sophisticated and data-intense applications. These network operator challenges include:
De-coupling of usage and revenue – In recent years, network capacity and service speeds have increased along with progressively sophisticated edge devices connected to the network such as smartphones, tablets and laptops, resulting in a tremendous surge of network traffic. A large catalyst of this surge is the ease of capture, ingestion and delivery of video, coupled with emerging business models for video publishing. In addition, new business models and the increasing popularity of applications have turned mobile handsets into mobile entertainment devices. However, this surge in traffic has not been accompanied by a similar rise in revenue in large part due to unlimited usage subscriptions and application models that have circumvented the carrier billing system, excluding the service providers’ revenue participation.
Multiple devices per user – As the New Digital Lifestyle becomes more pervasive, users in developed markets are increasingly adopting sophisticated devices. In addition to smartphones, a typical user can have multiple devices connected to the network, including tablets, e-readers, netbooks, laptops, televisions, gaming devices, digital music players, cameras and more. This incremental device population is increasing traffic on the network, often without associated revenue.
New data-intensive applications – The advent of smartphones and tablets has enabled an ecosystem of applications that are increasing in popularity among users. Many of these applications are free to download and use, but are very data-intensive. Social networking applications in particular have led to constant subscriber connectivity and frequent information synchronization, which translates to higher session counts per user. Apple’s Siri and iCloud applications have dramatically increased background mobile data traffic for Apple devices and the increasing use of cloud-based services will only continue to drive bandwidth usage up on a per user basis.
Limited service differentiation – Mobile and broadband network operators have been limited in their ability to view and identify network traffic, which has therefore limited their ability to appropriately charge and differentiate themselves by offering advanced services.
Our Technology
The foundational element of our IPE solutions is our Datastream Recognition Definition Language, or DRDL, DPI technology. DRDL facilitates a broad range of criteria to properly identify the application of each individual datastream. The identification relies on bidirectional information including header information, protocol, actual payload and other distinguishing characteristics of an application. This allows DRDL to properly identify even encrypted applications.
The standard-syntax language of DRDL enables rapid development of new signatures. The DRDL database currently consists of over 2,000 signatures. DRDL interconnects control and data sessions of protocols like File Transfer Protocol, or FTP. During the identification process, DRDL aggregates detailed traffic properties like Multipurpose Internet Mail Extensions, or MIME, type, filename, chat channel and Session Initiation Protocol, or SIP, caller ID. A unique and integral feature of DRDL is the classification function. Connection flags classify the traffic based on its behavior. Typical classifications are “interactive”, “streaming”, “random-looking” and “bulky”. This classification system enables operators to set preferences on unidentifiable traffic or when they need to be application agnostic.
We believe that our technology has several advantages that we extend to our mobile and broadband network operator customers, including:
Radical Simplicity - We believe our solutions are more powerful for service creation and service delivery than competitive solutions without sacrificing ease-of-use. Our report studio products allow our customers the flexibility and ease of creating virtual charging solutions while delivering a faster rollout of services.
Service Flexibility – Our DRDL technology allows for a high degree of service flexibility. Our subscriber model is highly configurable to meet the varying needs of our customer base. We also enable our customers to provide mass personalization for their subscriber base, creating and delivering services based on individual customer needs and behaviors. Lastly, we allow our customers to provide tiered service levels based on usage or by application.
Granular Accuracy – We also provide deep visibility into our customers’ networks, enabling visibility to a subscriber level to determine location and device usage to enable a high degree of personalization and customer service. It also allows our customers to enforce policies on their network.
Performance & Scalability – We believe that our DRDL technology is robust and has industry-leading performance that supports millions of subscribers and tens of thousands of transactions per second.
Real-Time Analytics – All of our analytics are delivered in real-time, providing up-to-the-second visibility to our customers of subscriber location, behavior and activity. This allows our customers to deliver a high degree of QoS to their subscribers and manage network capacity. Our report studio technology delivers detailed business intelligence and reports, and has deep application visibility.
Our Products & Solutions
We deliver IPE solutions for network operators, leveraging our industry-leading DRDL DPI technology. We believe our family of PacketLogic solutions is one of the engines that can drive the New Digital Lifestyle. Our solutions empower broadband providers with the ability to support more subscribers and services on their network with high performing and highly-scalable IPE systems. Our IPE solutions support deep levels of awareness and a broad universe of applications, enabling richer services to be offered to consumers. Our analytics provide highly relevant business intelligence reports that enable broadband and mobile operators to better understand consumer trends and rapidly respond to the dynamic application landscape.
Product Lines
Our IPE solutions are powered by our three main product lines:
PacketLogic Subscriber Manager (PSM) – The PacketLogic Subscriber Manager, or PSM, integrates PacketLogic with network management and operation systems including AAA, OSS, BSS, provisioning and policy managers. This integration enables policy enforcement and per-user tracking, also known as user awareness, as well as knowledge of where in the network the user connects (location awareness). User awareness can be leveraged to create personalized offerings that attract new customers, minimize churn and increase average revenue per user, or ARPU, through value-add services. Location awareness makes it possible to resolve, or even avoid, congestion, enhancing the user-experience. It can also control roaming costs through automatic policy enforcement.
PacketLogic Intelligence Center (PIC) The PacketLogic Intelligence Center, or PIC, with PacketLogic Report Studio provides the visualization of the application and subscriber intelligence gathered by deployed PacketLogic systems. Leveraging the subscriber and location awareness provided by the PSM and the application intelligence provided by the PRE, the PIC is able to present a wealth of information to the network operator based on the behavior of their network. The intelligence can be presented in a multi-dimensional format, with per user, application, location, and device views available for business intelligence and planning. The PIC gives network managers access to relevant network traffic intelligence that enables network optimization, creation of appealing services and protection against malicious behavior.
PacketLogic Real-Time Enforcement Platform (PRE) – The PacketLogic Real-Time Enforcement platforms, or PRE, utilize multiple hardware platforms that run the same operating software offering very high performance and capacity. Each of the platforms offers consistent, rich features enabled through the different PacketLogic software modules: LiveView, Filtering, Traffic Shaping and Statistics. The PacketLogic hardware platforms offer a range of configurations beginning with the entry-level PL7810, a 1RU unit with up to 5Gbps throughput. The mid-range PL8720 is a 2RU unit with up to 10Gbps throughput. At the top of the line are the PL8820 with 30 Gbps throughput and the PL8920 with 50 Gbps throughput, both appliances in compact 2RU form factors, and the PL10024 with capacity up to 120 Gbps and 10 million subscribers per system ATCA chassis solution. The newest addition to the PacketLogic family is the PL20000, the industry's first 100GE capable IPE platform, with support for up 320 Gbps of throughput in a single system, and multi-system performance scaling up to 5 Tbps.
Product Features
Our IPE solutions provide a deep visualization of network traffic and subscriber behavior that enables our customers to provide high QoS to their subscribers, both by maintaining network integrity and performance, as well as deploying new services demanded by their subscribers and creating additional revenue opportunities. Our product features include the following:
Awareness – Enabling the New Digital Lifestyle requires superior awareness of subscribers’ characteristics and behaviors to ensure that a high level of QoE is delivered. These characteristics and behaviors include subscriber location, device and application usage. Our solutions provide a high level of visibility through our DRDL traffic classification engine and the interaction with our PSM, which delivers comprehensive subscriber, location and device awareness.
Analysis – Mobile and broadband network operators require detailed reporting of subscriber behavior and evolving consumer trends. Our PIC is designed to ensure that mobile and broadband network operators understand what applications are most prevalent among their user base, where those applications are utilized most frequently and how changes in service plans affect network congestion. PIC delivers succinct, digestible and customizable reports through our report studio that drive profitable services and efficient network management.
Control – Through our IPE solution we provide alternative service creation and congestion management for mobile and broadband network operators. Our solutions are designed for maximum implementation flexibility, and can be customized for each deployment to fit the business, financial and regulatory needs of each network operator.
Product Benefits
Our solutions provide many benefits to our customers, including the following:
Superior Accuracy – Our proprietary DRDL software solution allows us to provide our customers with a high degree of application identification accuracy and the flexibility to regularly update our software to keep up with the rapid introduction of new applications.
Higher Scalability – Our family of products is scalable from a few hundred megabits to 320 gigabits of traffic per second, up to 10 million subscribers and up to 120 million simultaneous data flows, which is critical to service providers as they upgrade to LTE (enabling higher bandwidth mobile phone networks), FTTX (high bandwidth fiber to the home or neighborhood used by telecom broadband network providers) and DOCSIS 3.0 (a high bandwidth broadband cable standard) technologies in the access network.
Platform Flexibility – Our products are deployable in many locations in the network and leverage off-the-shelf hardware. Our products can rapidly leverage advances in computing technology which we believe to be a better solution than those that are dependent upon specific network silicon processors or hardware platforms.
Global Services
Our products and solutions are supported by our Global Services team that provides a suite of services that include both pre- and post-sales technical support to our direct field sales organization, channel partners and customers; professional services for planning, implementation and deployment; customer services for support post-deployment; training for our customers to maximize use of our IPE products and solutions; and consulting services to assist in all service phases from initial planning and evaluation to onsite testing and operation. Customers also have access to the technical support team via a web-based partner portal, email and interactive chat forum. Issues are logged and tracked using a computerized tracking system that provides automatic levels of escalation and quick visibility into problems by our Research and Development organization. This tracking system also provides input to our development team for new feature requests from our worldwide customer base.
Limitations of Alternative Solutions
We believe that first-generation IPE products have significant deficiencies, perhaps the greatest of which is their limited ability to accurately identify traffic types and applications. Because the first-generation IPE products provide limited visibility into traffic flows, they provide a limited ability to manage network traffic. First-generation IPE products were a good start at introducing network operators to the value of network visibility, and introduced the opportunity to provide some level of differentiated services. As applications have become more complex and increasingly web-based, differentiating between applications has become more challenging to products that have limited application signatures used to identify network traffic and less sophisticated application identification mechanisms.
Growth Strategy
Our goal is to become the leading provider of IPE solutions to mobile and broadband network operators on a global scale. We believe our PacketLogic solutions position us to capture an increasing share of the growing IPE market. We plan to achieve our strategic growth objectives through the following efforts:
Expand our technology advantage – Our technology was designed with the ability to rapidly identify new application signatures, and thereby adapt to a dynamic IP network environment across multiple hardware platforms. We are further developing our products and solutions based on feedback from our customers and industry experts as well as our ongoing research and development of technology, products and solutions that we believe will add value to our customers. We currently intend to build upon our innovations, continue to release leading-edge products with state-of-the-art capabilities and regularly release new solution features and performance upgrades.
Expand our customer footprint with leading mobile and broadband network operators – Our PacketLogic product line provides us with a solution that can address the network needs of leading mobile and broadband network operators. We have built a team with deep network operator experience, both from a technology perspective and from selling to network operators. We have experienced significant traction in the network operator space, and these achievements have provided us with improved access to potential customers and valuable references, which we believe will continue to enhance our sales growth effort. In addition, we intend to increase our indirect distribution channel. We currently intend to utilize existing value added reseller partners and to add new partners to increase our ability to address geographic regions and a greater quantity of customers.
Pursue new partnerships – We currently intend to establish partnerships with complementary mobile packet core ecosystem vendors to increase the value we can provide and gain additional access to leading mobile and broadband network operators. Where feasible from a business as well as technical perspective, we intend to provide broader solutions by bundling our products with complementary products and technologies from other solution providers. We believe that the flexibility of our software platform gives us the potential to efficiently integrate with complementary solutions and thereby deliver greater benefits to our customers and enhance our ability to compete against competitors whose solutions are more hardware constrained.
Maximize opportunities with existing customers by increasing our share within their network footprint – We will continue to seek to increase our market share within our existing customers’ networks by expanding our product footprint within these networks. Typically, our first order from a new network operator represents a small portion of their total network as measured by either a single product function or by geography. We believe we can successfully sell additional solutions to our existing customers following their initial purchase as they realize the benefits of our products and seek to extend their IPE capabilities throughout their networks. In addition, many service providers operate dual networks (i.e., mobile and broadband) and in these instances, we believe there are opportunities for us to offer our solutions for each network. We have many captive mobile and broadband network operators that are well positioned to increase service creation and network performance. We believe we are well positioned to experience tremendous growth with these customers as they build out their capabilities and infrastructure.
Customers
We sell our products and solutions both directly and indirectly to our end-customers. As of December 31, 2012, we had over 600 customers throughout North America, Europe and Asia. Our customers are mobile and broadband network operators. Broadband network operators include MSOs, telecommunications companies, ISPs and private network operators. Our customers either serve subscriber customers or operate private networks such as a university campus, or enterprise or government agency networks.
Our current customers and anticipated future customers include the following:
Mobile Network Operators – Mobile network operators are constrained by the bandwidth of their wireless signals and infrastructure. Additional upgrades in bandwidth and network infrastructure are immediately consumed by new applications and devices that place greater stress on the network. Managing network traffic and broadband usage more intelligently can greatly improve QoS and QoE for subscribers and save significant resources for operators.
MSOs – MSOs are constrained by the bandwidth of their network and the varying number of users connecting to any given loop in the network. Controlling network traffic by application type can greatly improve the quality of the experience of the average subscriber.
Fixed-Line Telecommunications Network Operators – Fixed-line telecommunications network operators use fiber infrastructure or digital subscriber lines (commonly referred to as “DSL”) to offer broadband services to end customers. Many fixed-line telecommunications network operators also operate mobile networks and provide either bundled service to end customers or mobile and broadband service on a stand-alone basis. These service bundles are increasingly including video services as networks increase in capacity and capabilities. Adding intelligence to their networks can help them offer differentiated services.
ISPs – ISPs generally lease, rather than own, access infrastructure. They compete by attempting to offer the best of breed Internet service. ISPs' greatest competitive advantages are brand and customer relationships. IPE solutions can improve the performance of ISPs by making the use of their bandwidth more efficient and by allowing them to offer best of breed quality.
Education, Business and Government Entities – Universities generally provide Internet access to students, faculty and employees. Universities are particularly vulnerable to low QoS for legitimate educational purposes because students frequently have made extensive use of high-bandwidth applications such as peer-to-peer services. Businesses and government entities rely on large and complex networks for communication infrastructure. They typically rely on service providers for Internet access and interconnectivity, and can use IPE to optimize the use of their expensive network resources, prioritize business critical applications and limit leisure or unauthorized use of expensive network resources.
Our revenue has historically been dependent on a small number of large customers. For the year ended December 31, 2012, revenue from one customer, Shaw Communications, Inc., represented 16% of net revenue, with no other single customer accounting for more than 10% of net revenues. For the year ended December 31, 2011, revenues from two customers, Shaw Communications, Inc. and Jet Infosystems, represented 27% and 12% of net revenues, respectively, with no other single customer accounting for more than 10% of net revenues. For the year ended December 31, 2010, revenue from one customer, Cox Communications, Inc., represented 11% of net revenues, with no other single customer accounting for more than 10% of net revenue.
Foreign Operations
Sales made to customers located outside the United States as a percentage of total net revenues were 51%, 49% and 41% for the years ended December 31, 2012, 2011 and 2010, respectively. Revenues derived from foreign sales generally are subject to additional risks such as fluctuations in exchange rates, tariffs, the imposition of other trade barriers, and potential currency restrictions. To date, however, we have experienced no notable negative impact from such risks. Further information regarding our foreign operations, as required by Item 101(d) of Regulation S-K, can be found in the Consolidated Financial Statements and related notes herein.
Partners
We have established critical technology, distribution and business partnerships to further promote our brand and suite of solutions for network operators. We believe these partnerships provide an immediate opportunity to extend our capabilities into adjacent, complementary points within the mobile packet core and broadband core. For example, we recently announced a joint solution with one of our key technology partners that provides integrated policy management and PCRF functionality on top of our IPE platform.
Competition
The market for our products and services is highly competitive as mobile and broadband network operators seek to manage the rapid growth of data on both broadband and mobile networks. Our primary competitors include:
| | ● | Allot Communications Ltd.; |
| | ● | Tektronix (acquired Arbor Networks); |
| | ● | Brocade Communications Systems; |
| | ● | Citrix Systems (acquired Bytemobile); |
| | ● | SAIC (acquired Cloudshield Technologies); |
| | ● | Huawei Technologies Company; and |
We also face competition from vendors supplying platform products with some limited IPE functionality, such as switches and routers, session border controllers and VoIP switches. In addition, we face competition from large integrators that package third-party IPE solutions into their products, including Alcatel-Lucent, Ericsson, Huawei Technologies Company and Nokia Siemens. It is possible that these companies will develop their own IPE solutions or strategically acquire existing competitor IPE vendors in the future.
Most of our competitors are larger and have greater access to capital than we do. Nevertheless, we do not believe there is an entrenched dominant supplier in our market. We believe that our technological advantages provide an opportunity for us to capture increased market share and benefit from the expected growth in the IPE market. Given the lack of an established leader and the potential growth in the market, we expect competition to intensify.
Our primary method of differentiation from our competition is our IPE DRDL technology, which we believe to be a superior solution that enables service providers advanced identification of network traffic. However, we also believe we effectively compete with respect to price and service. Our products now address service provider requirements ranging from 100 megabit (edge applications) to the 320 gigabit per second market (core applications).
Backlog
Our sales are made primarily pursuant to standard purchase orders for the delivery of products. Quantities of our products to be delivered and delivery schedules may vary based on changes in customers’ needs or circumstances. Customer orders generally can be cancelled, modified or rescheduled on short notice without significant penalty to the customer. In addition, most of our revenue in any quarter depends on customer orders for our products that we receive and fill in the same quarter. For these reasons, our backlog as of any particular date is not representative of actual sales for any succeeding period, and therefore we believe that backlog is not necessarily a reliable indicator of our future revenue trends.
Sales and Marketing
We use a combination of direct sales and channel partnerships to sell our products and services. As of December 31, 2012, we had 49 employees in sales and many independent channel partners worldwide. We also engage a worldwide network of value added resellers to reach particular geographic regions and markets.
Our marketing organization is focused on building our brand awareness, managing channel marketing efforts and supporting our sales force in additional capacities. As of December 31, 2012, we had 11 marketing professionals globally.
Research and Development
We have built a team of skilled software programmers who continue to develop enhancements to our PacketLogic modules and proprietary DRDL processing software engine. We have enhanced our products with features and functionality to address the needs of mobile and broadband network operators, as well as to provide new functionality for network protection and subscriber management. As of December 31, 2012, we had 41 employees in research and development. While to date, substantially all of our research and development has been performed by our employees in Sweden, we are currently developing plans to expand and integrate the research and development personnel from our January 9, 2013 acquisition of Vineyard Networks, Inc. in Canada. Our research and development costs were $7.5 million, $4.6 million and $3.3 million for the years ended December 31, 2012, 2011 and 2010, respectively.
Intellectual Property
Our intellectual property is central to our competitive position and our future success will depend on our continued ability to protect our core technologies. We believe that our DRDL signature compiler, and the inherent complexity of our software-based PacketLogic solution, makes it difficult to copy or replicate our features. We rely primarily on trademark law, copyright law, trade secret law and contractual rights to protect our intellectual property rights in our proprietary software. To help ensure this protection, we include proprietary information and confidentiality provisions in our agreements with customers, third parties and employees.
Manufacturing
We outsource the manufacturing of our hardware and software to a select group of contract manufacturing partners. We have negotiated minimum production quantities and lead times in our contracts to prevent supply shortages. Our manufacturing partners will then load our proprietary software for specific orders, final testing and fulfillment. We believe that our manufacturing process allows us to focus on development of our PacketLogic software solution, reduce manufacturing costs and more quickly adjust to changes in demand. We have not historically experienced any production capacity shortages and do not foresee a need to alter our manufacturing process in the future.
We source completed hardware boards and chassis included in our products from leading industry suppliers, including Continuous Computing Corporation, Advantech Technologies Inc, and Lanner Electronics, Inc. All of the hardware used in our products is comprised of standard components which are less susceptible to supply shortages and significant lead times. We believe our reliance on standard hardware components facilitates quicker time to market, rapid design cycles and the ability to take advantage of the latest semiconductor industry advances.
Employees
As of December 31, 2012, we had 136 full-time employees and 15 full-time independent contractors, including 23 operations and technical support employees, 41 research and development employees, 60 sales and marketing employees and 12 general and administrative employees. As of December 31, 2012, our headcount was 52 employees in the United States, 58 employees in Sweden, six employees in the United Kingdom, and a total of 20 employees in Malaysia, Hong Kong, Japan, Singapore, Austria, Australia, Germany, Korea, Mexico, Russia, Spain, Taiwan, and the United Arab Emirates.
Executive Officers of the Company
Set forth below are the name, age, position(s), and a description of the business experience of each of our executive officers as of December 31, 2012:
| Name | | Age | | Position(s) | | Employee Since |
| James F. Brear | | 47 | | President, Chief Executive Officer and Director (Principal Executive Officer) | | 2008 |
| Charles Constanti | | 49 | | Vice President, Chief Financial Officer and Secretary (Principal Financial & Accounting Officer) | | 2009 |
James F. Brear joined us as our President, Chief Executive Officer and a member of our Board of Directors in February 2008. Mr. Brear is an industry veteran with more than 20 years of experience in the networking industry, most recently as Vice President of Worldwide Sales and Support for Bivio Networks, a maker of deep packet inspection platform technology, from July 2006 to January 2008. From September 2004 to July 2006, Mr. Brear was Vice President of Worldwide Sales for Tasman Networks, a maker of converged WAN solutions for enterprise branch offices and service providers for managed WAN services. From April 2004 to July 2004, Mr. Brear served as Vice President of Sales at Foundry Networks, a provider of switching, routing, security and application traffic management solutions. Earlier in his career, Mr. Brear was the Vice President of Worldwide Sales for Force10 Networks from March 2002 to April 2004, during which time the company grew from a pre-revenue start-up to the industry leader in switch routers for high performance Gigabit and 10 Gigabit Ethernet. In addition, he spent five years with Cisco Systems from July 1997 to March 2002 where he held senior management positions in Europe and North America with responsibility for delivering more than $750 million in annual revenues selling into the world's largest service providers. Previously, Mr. Brear held a variety of sales management positions at both IBM and Sprint Communications. He holds a Bachelor of Arts degree from the University of California at Berkeley.
Charles Constanti joined us as our Chief Financial Officer in May 2009 and has over 25 years of public company financial experience. Most recently, Mr. Constanti was the vice president and CFO of Netopia, Inc., a NASDAQ-listed telecommunications equipment and software company, from April 2005 until its acquisition in February 2007 by Motorola, Inc., where he subsequently held a senior finance position until May 2009. From May 2001 to April 2005, Mr. Constanti was the vice president and corporate controller of Quantum Corporation, for which he earlier served in different accounting and finance positions since January 1997. Previously, Mr. Constanti held various finance positions at BankAmerica Corporation and was an auditor for PricewaterhouseCoopers. Mr. Constanti is a certified public accountant. He earned a B.S., magna cum laude, in Accounting from Binghamton University.
Significant Employees of the Company
Set forth below are the name, age, position, and a description of the business experience of each of our significant employees as of December 31, 2012:
| Name | | Age | | Position(s) | | Employee Since |
| Alexander Haväng | | 34 | | Chief Technical Officer | | 2006 |
| Jon Lindйn | | 38 | | Chief Strategy Officer | | 2006 |
Alexander Haväng has been our Chief Technology Officer since August 2006 when we acquired Netintact AB. Mr. Haväng was a founder of Netintact AB, which was formed in August 2000. Mr. Haväng is responsible for our strategic technology direction. Mr. Haväng is widely known and a respected authority in the open source community, and is the lead architect for PacketLogic. Earlier in his career, Mr. Haväng was one of the chief architects for the open source streaming server software Icecast, along with the secure file transfer protocol GSTP. Mr. Haväng studied computer science at the Linköping University in Sweden.
Jon Lindén has been our Chief Strategy Officer since September 2011 and was our Vice President of Marketing from January 2008 to September 2011. Mr. Lindén joined us in August 2006 as part of the acquisition of Netintact AB, a company he joined in 2001. Mr. Lindén has a background in sales and business development with experience in managing networking products throughout their lifecycle. Prior to joining Netintact, Mr. Lindén was the Chief Executive Officer of the venture-funded company TheSchoolbook.com from 1999 to 2001, and managed sales and marketing at a content management software company from 1998 to 1999. He was project manager at the Swedish Trade Council in Chicago from 1997 to 1998.
Available information
Our annual reports on Form 10-K, our quarterly reports on Form 10-Q and our current reports on Form 8-K, and all amendments to those reports, filed or furnished pursuant to Section 13(a) or 15(d) of the Securities Exchange Act of 1934, as amended, are available free of charge on our website at www.proceranetworks.com as soon as reasonably practicable after we file such reports with the Securities and Exchange Commission, or the SEC. Information contained in, or accessible through, our website is not incorporated by reference into and does not form a part of this report.
The SEC also maintains a website containing reports, proxy and information statements, annual filings and other relevant information available free of charge to the public at www.sec.gov.
You should carefully consider the risks described below, together with all of the other information included in this Annual Report on Form 10-K, in considering our business and prospects. Set forth below and elsewhere in this report and in other documents we file with the SEC are descriptions of the risks and uncertainties that could cause our actual results to differ materially from the results contemplated by the forward-looking statements contained in this report. Additional risks and uncertainties not presently known to us or that we currently deem immaterial also may impair our business operations. Each of these risk factors could adversely affect our business, operating results and financial condition, as well as adversely affect the value of an investment in our common stock.
Risks Related to Our Business
We have a limited operating history on which to evaluate our company.
The products we sell today are derived primarily from the acquisition of the Netintact companies in 2006. We are continually working to improve our operations on a combined basis.
Furthermore, we have only recently launched many of our products and services on a worldwide basis, and we are continuing to develop relationships with distribution partners and otherwise exploit sales channels in new markets. Therefore, investors should consider the risks and uncertainties frequently encountered by companies in new and rapidly evolving markets, which include the following:
| | ● | successfully introducing new products and entering new markets; |
| | ● | successfully servicing and upgrading new products once introduced; |
| | ● | increasing brand recognition; |
| | ● | developing strategic relationships and alliances; |
| | ● | managing expanding operations and sales channels; |
| | ● | successfully responding to competition; and |
| | ● | attracting, retaining and motivating qualified personnel. |
If we are unable to address these risks and uncertainties, our results of operations and financial condition may be adversely affected.
Our actual operating results may differ significantly from our guidance and investor expectations.
From time to time, we may release guidance in our earnings releases, earnings conference calls or otherwise, regarding our future performance that represents our management’s estimates as of the date of release. If released, this guidance, which will include forward-looking statements, will be based on projections prepared by our management.
Projections are based upon a number of assumptions and estimates that, while presented with numerical specificity, are inherently subject to significant business, economic and competitive uncertainties and contingencies, many of which are beyond our control. These projections are also based upon specific assumptions with respect to future business decisions, some of which will change. We may state possible outcomes as high and low ranges, which are intended to provide a sensitivity analysis as variables are changed but are not intended to represent that actual results could not fall outside of the suggested ranges. The principal reason that we release guidance is to provide a basis for our management to discuss our business outlook with analysts and investors. With or without our guidance, analysts and other investors may publish expectations regarding our business, financial performance and results of operations. We do not accept any responsibility for any projections or reports published by any such third persons.
Guidance is necessarily speculative in nature, and it can be expected that some or all of the assumptions underlying the guidance furnished by us will not materialize or will vary significantly from actual results. Accordingly, our guidance is only an estimate of what our management believes is realizable as of the date of release. Actual results will vary from our guidance, and the variations may be material. If our actual performance does not meet or exceed our guidance or investor expectations, the trading price of our common stock is likely to decline.
Our PacketLogic family of products is our only product line. All of our current revenues and a significant portion of our future growth depend on our ability to continue its commercialization.
All of our current revenues and much of our anticipated future growth depend on the development, introduction and market acceptance of new and enhanced products in our PacketLogic product line that address additional market requirements in a timely and cost-effective manner. In the past, we have experienced delays in product development and such delays may occur in the future. We do not currently have plans or resources to develop additional product lines, and as a result, our future growth will largely be determined by market acceptance and continued development of our PacketLogic product line.
If additional customers do not adopt, purchase and deploy our PacketLogic products, our revenues will not grow and may decline. In addition, should our prospective customers fail to recognize, or our current customers lose confidence in, the value or effectiveness of our PacketLogic product line, the demand for our products and services will likely decline. Any significant price compression in our targeted markets as a result of newly introduced solutions could have a material adverse effect on our business. Moreover, when we announce new products or product enhancements that have the potential to replace or shorten the life cycle of our existing products, customers may defer purchasing our existing products. These actions could harm our operating results by unexpectedly decreasing sales and exposing us to greater risk of product obsolescence.
Sales of our products to large broadband service providers often involve a lengthy sales cycle, which may cause our revenues to fluctuate from period to period and could result in us expending significant resources without making any sales.
Our sales cycles often are lengthy, because our prospective customers generally follow complex procurement procedures and undertake significant testing to assess the performance of our products within their networks. As a result, we may invest significant time from initial contact with a customer before that end-customer decides to purchase and incorporate our products in its network. We may also expend significant resources attempting to persuade large broadband service providers to incorporate our products into their networks without any measure of success. Even after deciding to purchase our products, initial network deployment and acceptance testing of our products by a large broadband service provider may last several years. Carriers, especially in North America, often require that products they purchase meet Network Equipment Building System, or “NEBS” certification requirements, which relate to the reliability of telecommunications equipment. While our PacketLogic products and future products are and are expected to be designed to meet NEBS certification requirements, they may fail to do so.
Due to our lengthy sales cycle, particularly to larger customers, and our revenue recognition practices, we expect our revenue may fluctuate significantly from period to period. In pursuing sales opportunities with larger enterprises, we expect that we will make fewer sales to larger entities, but that the magnitude of individual sales will be greater. We may report substantial revenue growth in the period that we recognize the revenue from a large sale, which may not be repeated in an immediately subsequent period. Because our revenues may fluctuate materially from period to period, the price of our common stock may decline. In addition, even after we have received commitments from a customer to purchase our products, in accordance with our revenue recognition practices we may not be able to recognize and report the revenue from that purchase for months or years after the time of purchase. As a result, there could be significant delays in our receipt and recognition of revenue following sales orders for our products.
Historically, we have received, and in the future we may receive, a number of a quarter’s sales orders during the last two weeks of the quarter. Accordingly, there is a risk that our revenue may move from one quarter to the next if we cannot fulfill all of the orders and satisfy all of the revenue recognition criteria under our accounting policies before the quarter ends. In addition, if expected revenue at the end of any quarter is delayed because anticipated purchase orders fail to materialize, our products are not shipped on time, we fail to manage our inventory properly, we fail to release new products on schedule, or for any other reason, our revenue for that quarter could fall below our expectations or those of securities analysts and investors, resulting in a decline in our stock price.
In addition, if a competitor succeeds in convincing a large broadband service provider to adopt that competitor’s product, it may be difficult for us to displace the competitor at a later time because of the cost, time, effort and perceived risk to network stability involved in changing solutions. As a result, we may incur significant sales and marketing expenses without generating any sales.
A substantial portion of our revenues may be dependent on a small number of Tier 1 service providers that purchase in large quantities. If we are unable to maintain or replace our relationships with these customers, our revenues may fluctuate and our growth may be limited.
Since 2008, when we first established customer relations with Tier 1 service providers, a significant portion of our revenues has come from a limited number of customers. There can be no guarantee that we will be able to continue to achieve revenue growth from these customers because their capacity requirements have become or will become fulfilled. For this reason, we do not expect that any single customer will remain a significant customer from year to year, and we will need to attract new customers in order to sustain our revenues.
For the year ended December 31, 2012, revenues from one customer, Shaw Communications, Inc., represented 16% of net revenues, with no other single customer accounting for more than 10% of net revenues. For the year ended December 31, 2011, revenues from two customers, Shaw Communications, Inc. and Jet Infosystems, represented 27% and 12% of net revenues, respectively, with no other single customer accounting for more than 10% of net revenues. For the year ended December 31, 2010, revenue from one customer, Cox Communications, Inc., represented 11% of net revenues, with no other single customer accounting for more than 10% of net revenues. The proportion of our revenues derived from a limited number of customers may be even higher in any future year or quarter. If we cannot maintain or replace the customers that purchase large amounts of our products, or if they do not purchase products at the levels or at the times that we anticipate, our ability to maintain or grow our revenues will be adversely affected.
If we are unable to effectively manage our anticipated growth, we may experience operating inefficiencies and have difficulty meeting demand for our products.
We seek to manage our growth so as not to exceed our available capital resources. If our customer base and market grow rapidly, we would need to expand to meet this demand. This expansion could place a significant strain on our management, products and support operations, sales and marketing personnel and other resources, which could harm our business.
If demand for our products and services grows rapidly, we may experience difficulties meeting the demand. For example, the installation and use of our products require customer training. If we are unable to provide adequate training and support for our products, the implementation process will be longer and customer satisfaction may be lower. In addition, we may not be able to exploit fully the growing market for our products and services, and our competitors may be better able to satisfy this demand. We cannot assure you that our systems, procedures or controls will be adequate to support the anticipated growth in our operations. The failure to meet the challenges presented by rapid customer and market expansion could cause us to miss sales opportunities and otherwise have a negative impact on our sales and profitability.
We may not be able to install management information and control systems in an efficient and timely manner, and our current or planned personnel, systems, procedures and controls may not be adequate to support our future operations.
Acquisitions may disrupt or otherwise have a negative impact on our business.
We may seek to acquire or make investments in complementary businesses, products, services or technologies on an opportunistic basis when we believe they will assist us in executing our business strategy. Growth through acquisitions has been a viable strategy used by other network control and management technology companies. We acquired the Netintact entities in 2006, and its products have formed the core of our current product offering. In addition, in January 2013 we acquired Vineyard Networks in Canada, which will require time and cost to integrate into our organizational structure. Any failure to properly integrate the personnel and or technology we acquire into Procera, including successfully maintaining cohesive technology development in distant locations could have an adverse effect on us and our results of operations. Any future acquisitions that we may pursue could distract our management and employees and increase our expenses.
Following any acquisition, the integration of the acquired business, product, service or technology is complex, time consuming and expensive, and may disrupt our business. These challenges include the timely and efficient execution of a number of post-transaction integration activities, including:
| | ● | integrating the operations and technologies of the two companies; |
| | ● | retaining and assimilating the key personnel of each company; |
| | ● | retaining existing customers of both companies and attracting additional customers; |
| | ● | leveraging our existing sales channels to sell new products into new markets; |
| | ● | developing an appropriate sales and marketing organization and sales channels to sell new products into new markets; |
| | ● | retaining strategic partners of each company and attracting new strategic partners; and |
| | ● | implementing and maintaining uniform standards, internal controls, processes, procedures, policies and information systems. |
The process of integrating operations and technology could cause an interruption of, or loss of momentum in, our business and the loss of key personnel. The diversion of management’s attention and any delays or difficulties encountered in connection with an acquisition and the integration of our operations and technology could have an adverse effect on our business, results of operations or financial condition. Furthermore, the execution of these post-transaction integration activities will involve considerable risks and may not come to pass as we envision. The inability to integrate the operations, technology and personnel of an acquired business with ours, or any significant delay in achieving integration, could have a material adverse effect on results of operations and financial condition and, as a result, on the market price of our common stock.
We may not achieve the desired benefits from our acquisitions, including the revenue and other synergies and growth that we anticipate from the acquisition in the timeframe that we currently expect, and the costs of achieving these benefits may be higher than what we currently expect, because of a number of risks, including, but not limited to the possibility that the acquisition may not further our business strategy as we expected and the possibility that we may not be able to expand the reach and customer base for current and future products as expected. As a result of these risks, our acquisitions may not immediately contribute to our earnings as expected, or at all, we may not achieve expected revenue synergies or realization of efficiencies related to the integration of the businesses when expected, or at all, and we may not achieve the other anticipated strategic and financial benefits of the acquisitions.
Mergers or other strategic transactions involving our competitors could weaken our competitive position, limit our growth prospects or reduce our revenues.
We believe that there is likely to be consolidation in our industry, which could lead to increased price competition and other forms of competition. Increased competition may cause pricing pressure and loss of market share, either of which could have a material adverse effect on our business, limit our growth prospects or reduce our revenues. Our competitors may establish or strengthen cooperative relationships with strategic partners or other parties. Established companies may not only develop their own products but may also merge with or acquire our current competitors. It is also possible that new competitors or alliances among competitors may emerge and rapidly acquire significant market share. Any of these circumstances could materially and adversely affect our business and operating results.
We may be unable to compete effectively with competitors which are substantially larger and more established and have greater resources.
In our rapidly evolving and highly competitive market, we compete on the price as well as the performance of our products. We expect competition to remain intense in the future. Increased competition could result in reduced prices and gross margins for our products and could require increased spending by us on research and development, sales and marketing and customer support, any of which could have a negative financial impact on our business. We compete with Allot Communications Ltd., Tektronix (acquired Arbor Networks), Blue Coat Systems, Brocade Communications Systems, Cisco Systems, Inc., Citrix Systems (acquired Bytemobile), SAIC (acquired Cloudshield Technologies), Ericsson, F5 Networks, Huawei Technologies Company and Sandvine Corporation, as well as other companies which sell products incorporating competing technologies. In addition, our products and technology compete with other types of products that offer monitoring capabilities, such as probes and related software. We also face indirect competition from companies that offer broadband service providers increased bandwidth and infrastructure upgrades that increase the capacity of their networks, which may lessen or delay the need for bandwidth management solutions.
Most of our competitors are substantially larger than we are and have significantly greater name recognition and financial, sales and marketing, technical, manufacturing and other resources and more established distribution channels than we do. In addition, some prospective customers have in the past advised us that their concerns about our financial condition disqualified us from competing successfully for their business. While the additional capital we recently raised through a public sale of our common stock has substantially enhanced our balance sheet, it is possible that one or more prospective customers could raise similar concerns in the future. Our competitors may be able to respond more rapidly to new or emerging technologies and changes in customer requirements or devote greater resources to the development, promotion and sale of their products than we can. Furthermore, prospective customers often have expressed greater confidence in the product offerings of our competitors. Some of our competitors may make acquisitions or establish strategic relationships that may increase their ability to rapidly gain market share by addressing the needs of our prospective customers. Additional competitors may enter our existing or future markets with solutions that may be less expensive, provide higher performance or provide additional features than our solutions. Given the opportunities in the bandwidth management solutions market, we also expect that other companies may enter with alternative products and technologies, which could reduce the sales or market acceptance of our products and services, perpetuate intense price competition or make our products obsolete. If any technology that is competing with ours is or becomes more reliable, higher performing, less expensive or has other advantages over our technology, then the demand for our products and services would decrease, which would harm our business.
We need to increase the functionality of our products and offer additional features in order to be competitive.
The market in which we operate is highly competitive and unless we continue to enhance the functionality of our products by adding additional features, our competitive position may deteriorate and the average selling prices for our products may decrease over time. Such a decrease also could result from the introduction of competing products or from the standardization of deep packet inspection (“DPI”) technology. To counter this trend, we endeavor to enhance our products by offering higher system speeds and additional performance features, such as additional protection functionality, supporting additional applications and enhanced reporting tools. We may also need to reduce our per unit manufacturing costs at a rate equal to or faster than the rate at which selling prices may decline. If we are unable to reduce these costs or to offer increased functionally and features, our results of operations and financial condition may be adversely affected.
If our products contain undetected software or hardware errors or performance deficiencies, we could incur significant unexpected expenses, experience purchase order cancellations and lose sales.
Network products frequently contain undetected software or hardware errors, failures or bugs when new products or new versions or updates of existing products are released to the marketplace. Because we frequently introduce new versions and updates to our product line, previously unaddressed errors in the accuracy or reliability of our products, or issues with their performance, may arise. We expect that such errors or performance deficiencies will be found from time to time in the future in new or existing products, including the components incorporated therein, after the commencement of commercial shipments. These problems may have a material adverse effect on our business by requiring us to incur significant warranty repair costs and support related replacement costs, diverting the attention of our engineering personnel from new product development efforts, delaying the recognition of revenue and causing potentially significant customer relations problems.
In addition, if our products are not accepted by customers due to software or hardware defects or performance deficiencies, orders contingent upon acceptance may be cancelled or deferred until we have remedied the defects, which could result in lost sales opportunities or delayed revenue recognition. In this circumstance, or if warranty returns exceed the amount we have accrued for defect returns based on our historical experience, our results of operations and financial condition may be adversely affected.
Our products must properly interface with products from other vendors. As a result, when problems occur in a computer or communications network, it may be difficult to identify the sources of these problems. The occurrence of hardware and software errors, whether or not caused by our products, could result in the delay or loss of market acceptance of our products and any necessary revisions may cause us to incur significant expenses. The occurrence of any such problems would likely have a material adverse effect on our results of operations and financial condition.
We have incurred losses in previous periods and may incur losses in future periods.
We had an accumulated deficit of $52.9 million as of December 31, 2012. We may incur losses from operations in future periods. The profitability we achieved in the years ended December 31, 2012 and 2011 were the first in our history and may not be indicative of sustained profitability in future periods. Any losses incurred in the future may result from increased costs related to continued investments in sales and marketing, product development and administrative expenses, and/or less than anticipated revenues. Furthermore, if our revenue growth does not continue or is slower than anticipated, or our operating expenses exceed expectations, our results of operations and financial condition may be adversely affected.
We may need to raise further capital, which could dilute or otherwise adversely affect your interest in our company.
We believe that our existing cash, cash equivalents and short term investments, along with the cash that we expect to generate from operations and any debt financing that management currently believes is available, will be sufficient to meet our anticipated cash needs for working capital and capital expenditures for the next twelve months.
On April 25, 2012, we completed a registered public offering of 4.5 million shares of our common stock through which we raised approximately $88.0 million in additional capital, net of underwriting commissions and offering expenses. As a result of this offering, our existing stockholders experienced dilution of their interest in the Company.
A number of factors may negatively impact our level of cash availability and working capital requirements, including, without limitation:
| | ● | lower than anticipated revenues; |
| | ● | higher than expected cost of goods sold or operating expenses; |
| | ● | our inability to liquidate short-term investments; or |
| | ● | the inability of our customers to pay for the goods and services ordered. |
We believe that the ability to obtain equity and debt financing in the future will depend on our operating results, general economic conditions and global credit market conditions. If additional funds are raised through the issuance of equity or convertible debt securities, the percentage ownership of our stockholders will be reduced and such securities may have rights, preferences and privileges senior to those of our common stock. There can be no assurance that additional financing will be available on terms favorable to us or at all. If adequate funds are not available on acceptable terms, we may not be able to fund expansion, take advantage of unanticipated growth or acquisition opportunities, develop or enhance services or products or respond to competitive pressures. In addition, we may be required to defer or cancel product development programs, lay-off employees and/or take other steps to reduce our operating expenses. Our inability to raise additional financing or the terms of any financing we do raise could have a material adverse effect on our business, results of operations and financial condition.
Competition for experienced and skilled personnel is intense and our inability to attract and retain qualified personnel could significantly damage our business.
Our future performance will depend to a significant extent on the ability of our management to operate effectively, both individually and as a group. We are dependent on our ability to attract, retain and motivate high caliber key personnel. We have recently hired new employees in many different positions and our plans to expand in all areas will require experienced personnel to augment our current staff. We expect to recruit experienced professionals in such areas as software and hardware development, sales, technical support, product marketing and management. We currently plan to expand our indirect channel partner program and we need to attract qualified business partners to broaden these sales channels. In our market, we have experienced significant competition for qualified personnel and we may not be able to attract and retain such personnel. Our business may suffer if we encounter material delays in hiring additional personnel.
Our performance is substantially dependent on the continued services and on the performance of our executive officers and other key employees, including our Chief Executive Officer, James Brear, and our Chief Technical Officer, Alexander Haväng. The loss of the services of any of our executive officers or other key employees could materially and adversely affect our business. In addition, our engineering department is located in Varberg, Sweden, and many of our engineers were formerly employees of Netintact, which we acquired in 2006. Subsequent to the date of our financial statements, we acquired Vineyard Networks, a company based in Canada, and we now employ many former Vineyard Networks engineers and product developers that are located in Kelowna, Canada. If some or all of our Sweden-based engineers or Canada-based engineers or product developers were no longer employed by us, our ability to develop new products and serve existing customers could be materially and adversely impacted, and our results of operations and financial condition could be negatively affected.
We believe we will need to attract, retain and motivate talented management and other highly skilled employees in order to execute on our business plan. We may be unable to retain our key employees or attract, assimilate and retain other highly qualified employees in the future. Competitors and others have in the past, and may in the future, attempt to recruit our employees. In California, where we are headquartered, non-competition agreements with employees generally are unenforceable. As a result, if an employee based in California leaves the Company for any reason, he or she will generally be able to begin employment with one of our competitors or otherwise to compete immediately against us.
We currently do not have key person insurance in place. If we lose one of our key officers, we would need to attract, hire, and retain an equally competent person to take his or her place. There is no assurance that we would be able to find such an employee in a timely fashion. If we fail to recruit an equally qualified replacement or incur a significant delay, our business plans may slow down. We could fail to implement our strategy or lose sales and marketing and development momentum.
Failure to expand our sales teams or educate them about technologies and our product families may harm our operating results.
The sale of our products requires a multi-faceted approach directed at several levels within a prospective customer’s organization. We may not be able to increase net revenue unless we expand our sales teams to address all of the customer requirements necessary to sell our products. We expect to continue hiring in sales and marketing, but there can be no assurance that personnel additions will have a positive effect on our business.
If we are not able to successfully integrate new employees into the Company or to educate current and future employees with regard to rapidly evolving technologies and our product families, our results of operations and financial condition may be adversely affected.
Increased customer demands on our technical support services may adversely affect our relationships with our customers and our financial results.
We offer technical support services with our products because they are complex and time consuming to implement. We may be unable to respond quickly enough to accommodate short-term increases in customer demand for support services. We also may be unable to modify the format of our support services to compete with changes in support services offered by our competitors. Further customer demand for these services, without increases in corresponding revenues, could increase costs and adversely affect our operating results. If we experience financial difficulties, do not maintain sufficiently skilled workers and resources to satisfy our contracts, or otherwise fail to perform at a sufficient level under these contracts, the level of support services to our customers may be significantly disrupted, which could materially harm our relationships with these customers and our results of operations.
We must continue to develop and increase the productivity of our indirect distribution channels to increase net revenue and improve our operating results.
A key focus of our distribution strategy is developing and increasing the productivity of our indirect distribution channels through resellers and distributors. If we fail to develop and cultivate relationships with significant resellers, or if these resellers are not able to execute on their sales efforts, sales of our products may decrease and our operating results could suffer. Many of our resellers also sell products from other vendors that compete with our products. We cannot assure you that we will be able to enter into additional reseller and/or distribution agreements or that we will be able to manage our product sales channels. Our failure to do any of these could limit our ability to grow or sustain revenue. In addition, our operating results will likely fluctuate significantly depending on the timing and amount of orders from our resellers. We cannot assure you that our resellers and/or distributors will continue to market or sell our products effectively or continue to devote the resources necessary to provide us with effective sales, marketing and technical support. Such failure would negatively affect revenue and our potential to achieve profitability.
We rely on a small number of contract manufacturers to build our hardware products. If we are unable to have our products manufactured quickly enough to keep up with demand or we experience manufacturing quality problems, our operating results could be harmed.
If the demand for our products grows, we will need to increase our capacity for material purchases, production, testing and quality control functions. Any disruptions in product flow could limit our revenue growth and adversely affect our competitive position and reputation, and result in additional costs or cancellation of orders under agreements with our customers.
While our PacketLogic products are software based, we rely on independent contract manufacturers to manufacture the hardware components on which our products are installed and operate. In certain circumstances, these contract manufacturers also provide logistics services, which may include loading our software products onto the hardware platforms, testing and inspecting the products, and then shipping them directly to our customers. If these contract manufacturers are unable to meet our demand, or fail to provide such logistics services as we may request in a timely manner, we may experience delays in product shipments. Other performance problems with contract manufacturers may arise in the future, such as inferior quality, insufficient quantity of products, or the interruption or discontinuance of operations of a manufacturer, any of which could have a material adverse effect on our business and operating results.
We do not know whether we will effectively manage our contract manufacturers or whether these manufacturers will meet our future requirements for timely delivery of product components of sufficient quality and quantity. If one or more of our contract manufacturers were to experience financial difficulties or decide not to continue its business relationship with us, we would need to identify other contract manufacturers to perform these services, and there could be product delivery delays while we seek to establish and implement the new relationship. We also plan to introduce new products and product enhancements, which will require that we rapidly achieve volume production by coordinating our efforts with those of our suppliers and contract manufacturers. Any delays in meeting customer demand or quality problems resulting from the inability of our contract manufacturers to provide us with adequate supplies of high-quality product components, including problems relating to logistic services, could result in lost or reduced future sales to key customers and could have a material adverse effect on our sales and results of operations.
As part of our cost management efforts, we endeavor to lower per unit product costs from our contract manufacturers by means of volume efficiencies and the utilization of manufacturing sites in lower-cost geographies. However, we cannot be certain when or if such cost reductions will occur. The failure to obtain such cost reductions would adversely affect our gross margins and operating results.
If our suppliers fail to adequately supply us with certain original equipment manufacturer, or OEM, sourced components, our product sales may suffer.
Reliance upon OEMs, as well as industry supply conditions, generally involves several additional risks, including the possibility of a shortage of components and reduced control over delivery schedules (which can adversely affect our distribution schedules), and increases in component costs (which can adversely affect our profitability). Most of our hardware products, or the components of our hardware components, are based on industry standards and are therefore available from multiple manufacturers. If our suppliers were to fail to deliver, alternative suppliers should be available, although qualification of the alternative manufacturers and establishment of reliable suppliers could result in delays and a possible loss of sales, which could affect operating results adversely. However, in some specific cases we have single-sourced components, because alternative sources are not currently available. If these components were not available for a period of time, we could experience product supply interruptions, delays or inefficiencies, which could have a material adverse effect on our results of operations and financial condition.
We have limited ability to protect our intellectual property and defend against claims which may adversely affect our ability to compete.
We rely primarily on trademark law, copyright law, trade secret law and contractual rights to protect our intellectual property rights in our PacketLogic product line. We cannot assure you that the actions we have taken will adequately protect our intellectual property rights or that other parties will not independently develop similar or competing products that do not infringe on our intellectual property rights. We enter into confidentiality or license agreements with our employees, consultants and corporate partners, and take appropriate measures to control access to and distribution of our software, documentation and other proprietary information. Despite our efforts to protect our proprietary rights, unauthorized parties may attempt to copy or otherwise misappropriate or use our products or technology.
In an effort to protect our unpatented proprietary technology, processes and know-how, we require our employees, consultants, collaborators and advisors to execute confidentiality agreements. These agreements, however, may not provide us with adequate protection against improper use or disclosure of confidential information. These agreements may be breached, and we may not become aware of, or have adequate remedies in the event of, any such breach. In addition, in some situations, these agreements may conflict with, or be subject to, the rights of third parties with whom our employees, consultants, collaborators or advisors have previous employment or consulting relationships. Furthermore, others may independently develop substantially equivalent proprietary information and techniques or otherwise gain access to our trade secrets. In addition, under our OEM Purchase and Sales Agreement with GENBAND LLC, we have granted GENBAND access to our source code, which is the human readable version of the computer code used in our products. Subject to a requirement to pay us royalties, GENBAND has the right to use our source code to develop derivative products that it may develop and market under GENBAND's business marks. Additionally, in some cases, customers have the right to request access to our source code upon demand. Some of our customers have obtained the source code for our products by exercising this right, and others may do so in the future. In addition, some of our customers have the right to require the source code of our products to be deposited into a source code escrow. Under certain circumstances, our source code could be released to our customers. The conditions triggering the release of our source code vary by customer, but include, among other things, breach of the applicable customer agreement, failure to provide required product support or maintenance, or if we are subject to a bankruptcy proceeding or otherwise fail to carry on our business in the ordinary course. Disclosing the content of our source code may limit the intellectual property protection we can obtain or maintain for that source code or the products containing that source code and may facilitate intellectual property infringement claims against us. It also could permit a customer to which a product’s source code is disclosed to support and maintain that software product without being required to purchase our support or maintenance services. Each of these could harm our business, results of operations and financial condition.
Our industry is characterized by the existence of a large number of patents and frequent claims and related litigation regarding patent and other intellectual property rights. This type of litigation often is very costly and can continue for a lengthy period of time. If we are found to infringe on the proprietary rights of others, or if we agree to settle any such claims, we could be compelled to pay damages or royalties and either obtain a license to those intellectual property rights or alter our products so that they no longer infringe upon such proprietary rights. Any license could be very expensive to obtain or may not be available at all. Similarly, changing our products or processes to avoid any claims of infringement may be costly or impractical. Litigation resulting from claims that we are infringing the proprietary rights of others, or litigation that we initiate to protect our intellectual property rights, could result in substantial costs and a diversion of resources from sales and/or development activities, and could have a material adverse effect on our results of operations and financial condition.
We have operations outside of the United States and a significant portion of our customers and suppliers are located outside of the United States, which subjects us to a number of risks associated with conducting international operations.
We market and sell our products throughout the world and have personnel in many parts of the world. In addition, we have sales offices and research and development facilities outside the United States and we conduct, and expect to continue to conduct, a significant amount of our business with companies that are located outside the United States, particularly in Europe and Asia. Any international expansion efforts that we may undertake may not be successful. In addition, conducting international operations subjects us to new risks that we have not generally faced in the United States. These risks include:
| | · | trade and foreign exchange restrictions; |
| | · | foreign currency exchange fluctuations; |
| | · | economic or political instability in foreign markets; |
| | · | greater difficulty in enforcing contracts, accounts receivable collection and longer collection periods; |
| | · | changes in regulatory requirements; |
| | · | difficulties and costs of staffing and managing foreign operations; |
| | · | the uncertainty and limitation of protection for intellectual property rights in some countries; |
| | · | costs of compliance with foreign laws and regulations and the risks and costs of non-compliance with such laws and regulations |
| | · | costs of complying with U.S. laws and regulations for foreign operations, including import and export control laws, tariffs, trade barriers, economic sanctions and other regulatory or contractual limitations on our ability to sell our products in certain foreign markets, and the risks and costs of non-compliance; |
| | · | heightened risks of unfair or corrupt business practices in certain geographies and of improper or fraudulent sales arrangements; |
| | · | the potential for political unrest, acts of terrorism, hostilities or war; |
| | · | longer accounts receivable payment cycles and difficulties in collecting accounts receivables; |
| | · | management communication and integration problems resulting from cultural differences and geographic dispersion; and |
| | · | multiple and possibly overlapping tax structures. |
Our product and service sales may be subject to foreign governmental regulations, which vary substantially from country to country and change from time to time. Failure to comply with these regulations could adversely affect our business. Further, in many foreign countries it is common for others to engage in business practices that are prohibited by our internal policies and procedures or U.S. regulations applicable to us. Although we implemented policies and procedures designed to ensure compliance with these laws and policies, there can be no assurance that all of our employees, contractors, distribution channels and agents will comply with these laws and policies. Violations of laws or key control policies by our employees, contractors, distribution channels or agents could result in delays in revenue recognition, financial reporting misstatements, fines, penalties or the prohibition of the importation or exportation of our products and services and could have a material adverse effect on our business and results of operations.
Unstable market and economic conditions may have serious adverse consequences on our business.
Our general business strategy may be adversely affected by the current volatile global business environment and continued unpredictable and unstable market conditions. If financial markets continue to experience volatility or deterioration, it may make any debt or equity financing that we require more difficult, more costly, and more dilutive. In addition, a renewed or deeper economic downturn may result in reduced demand for our products, or adversely impact our customers’ ability to pay for our products, which would harm our operating results. There is also a risk that one or more of our current service providers, manufacturers and other partners may not survive in the current economic environment, which would directly affect our ability to attain our operating goals on schedule and on budget. Failure to secure any necessary financing in a timely manner and on favorable terms could have a material adverse effect on our results of operations and financial condition.
Our operating results could be adversely affected by product sales occurring outside the United States and fluctuations in the value of the United States Dollar against foreign currencies.
A significant and increasing percentage of PacketLogic sales are generated outside of the United States. PacketLogic sales and operating expenses denominated in foreign currencies could affect our operating results as foreign currency exchange rates fluctuate. Changes in exchange rates between these foreign currencies and the U.S. Dollar will affect the recorded levels of our assets and liabilities because we translate foreign net sales, costs of goods, assets and liabilities into U.S. Dollars for presentation in our financial statements. The primary foreign currencies for which we currently have exchange rate fluctuation exposure are the European Union Euro, the Swedish Krona and the Australian Dollar. If our revenues continue to grow, in part because we have entered new foreign markets, we could be exposed to exchange rate fluctuations in other currencies. For example, during the year ended December 31, 2012, we established a sales office in Japan in order to attempt to penetrate the important Japanese marketplace in which we are a new competitor. Exchange rates between currencies such as the Japanese Yen and the U.S. Dollar have fluctuated significantly in recent years and may do so in the future. Hedging foreign currencies can be difficult, and other companies have incurred significant losses as a result of their foreign currency operations. We cannot predict the impact of future exchange rate fluctuations on our operating results. We currently do not hedge our foreign currency risk.
In addition, the current sovereign debt crisis concerning certain European countries, including Greece, Italy, Ireland, Portugal and Spain, and related European financial restructuring efforts, may cause the value of the Euro to decline. Recent rating agency downgrades on European sovereign debt and growing concern over the potential default of European government issuers has further contributed to this uncertainty. Because we are unlikely to be able to increase our selling prices to compensate for any deterioration in currencies, such currency fluctuations could adversely affect our operating results.
Accounting charges may cause fluctuations in our annual and quarterly financial results which could negatively impact the market price of our common stock.
Our financial results may be materially affected by non-cash and other accounting charges. Such accounting charges may include:
| | ● | amortization of intangible assets, including acquired product rights; |
| | ● | stock-based compensation expense; and |
| | ● | impairment of long-lived assets. |
The foregoing types of accounting charges may also be incurred in connection with or as a result of business acquisitions. The price of our common stock could decline to the extent that our financial results are materially affected by the foregoing accounting charges. Our effective tax rate may increase, which could increase our income tax expense and reduce our net income.
Our effective tax rate could be adversely affected by several factors, many of which are outside of our control, including:
| | ● | changes in the relative proportions of revenues and income before taxes in the various jurisdictions in which we operate that have differing statutory tax rates; |
| | ● | changing tax laws, regulations and interpretations in multiple jurisdictions in which we operate, as well as the requirements of certain tax rulings; |
| | ● | changes in accounting and tax treatment of stock-based compensation; |
| | ● | the tax effects of purchase accounting for acquisitions and restructuring charges that may cause fluctuations between reporting periods; and |
| | ● | tax assessments, or any related tax interest or penalties, which could significantly affect our income tax expense for the period in which the settlements take place. |
The price of our common stock could decline if our financial results are materially adversely affected by one or more of the foregoing factors.
Our internal controls may be insufficient to ensure timely and reliable financial information.
Pursuant to Section 404 of the Sarbanes-Oxley Act of 2002, as amended, or the Sarbanes-Oxley Act, we are required to evaluate and provide a management report of our systems of internal control over financial reporting and our independent registered public accounting firm is required to attest to our internal control over financial reporting. Effective internal controls over financial reporting are necessary for us to provide reliable financial reports and effectively prevent fraud. A company’s internal control over financial reporting is a process designed to provide reasonable assurance regarding the reliability of financial reporting and the preparation of financial statements for external purposes in accordance with accounting principles generally accepted in the United States, or U.S. GAAP. A company’s internal control over financial reporting includes those policies and procedures that:
| | ● | pertain to the maintenance of records that, in reasonable detail, accurately and fairly reflect the transactions and dispositions of the assets of the company; |
| | ● | provide reasonable assurance that transactions are recorded as necessary to permit preparation of financial statements in accordance with U.S. GAAP, and that receipts and expenditures of the company are being made only in accordance with authorizations of management and directors of the company; and |
| | ● | provide reasonable assurance regarding prevention or timely detection of unauthorized acquisition, use, or disposition of the company’s assets that could have a material effect on the financial statements. |
A material weakness is a control deficiency, or combination of control deficiencies, that results in more than a remote likelihood that a material misstatement of the annual or interim financial statements will not be prevented or detected.
For the years ended December 31, 2012, 2011 and 2010, we did not identify any material weaknesses in our internal controls.
Under the supervision of our Audit Committee, we are continuing the process of identifying and implementing corrective actions where required to improve the design and effectiveness of our internal control over financial reporting, including the enhancement of systems and procedures. We have a small finance and accounting staff and limited resources and expect that we will continue to be subject to the risk of material weaknesses and significant deficiencies.
Even after corrective actions are implemented, the effectiveness of our controls and procedures may be limited by a variety of risks including:
| | ● | faulty human judgment and simple errors, omissions or mistakes; |
| | ● | collusion of two or more people; |
| | ● | inappropriate management override of procedures; and |
| | ● | the risk that enhanced controls and procedures may still not be adequate to assure timely and reliable financial information. |
If we fail to have effective internal controls and procedures for financial reporting in place, we could be unable to provide timely and reliable financial information. Additionally, if we fail to have effective internal controls and procedures for financial reporting in place, it could adversely affect our ability to comply with financial reporting requirements under certain government contracts.
Legislative actions, higher insurance costs and new accounting pronouncements are likely to impact our future financial position and results of operations.
Legislative and regulatory changes and future accounting pronouncements and regulatory changes have, and will continue to have, an impact on our future financial position and results of operations. In addition, insurance costs, including health and workers’ compensation insurance premiums, have increased in recent years and are likely to continue to increase in the future. Recent and future pronouncements related to the accounting treatment of executive compensation and employee stock options may also impact operating results. These and other potential changes could materially increase the expenses we report under generally accepted accounting principles, and adversely affect our operating results.
Changes in accounting standards, especially those that relate to management estimates and assumptions, are unpredictable and subject to interpretation by management and our independent registered public accounting firm and may materially impact how we report and record our financial condition.
Our accounting policies and methods are fundamental to how we record and report our financial condition and results of operations. Some of these policies require use of estimates and assumptions that may affect the value of our assets or liabilities and financial results and are critical because they require management to make difficult, subjective and complex judgments about matters that are inherently uncertain. Under each of these policies, it is possible that materially different amounts would be reported under different conditions, using different assumptions, or as new information becomes available. From time to time, the Financial Accounting Standards Board (“FASB”) and the SEC change the financial accounting and reporting standards that govern the preparation of our financial statements. In addition, accounting standard setters and those who interpret the accounting standards (such as the FASB, the SEC, other regulators and our outside independent registered public accounting firm) may change or even reverse their previous interpretations or positions on how these standards should be applied. These changes can be hard to predict and can materially impact how we record and report our financial condition and results of operations. In addition, we recently dismissed PMB Helin Donovan, LLP as our independent registered public accounting firm and retained Ernst & Young LLP as our independent registered public accounting firm. Our new independent registered public accounting firm may view our estimates and assumptions, or interpret policies, differently than our prior independent registered public accounting firm. In some cases, we could be required to apply a new or revised standard retroactively, or apply an existing standard differently (and also retroactively), resulting in a change in our results on a going forward basis or a potential restatement of historical financial results.
Unauthorized disclosure of data or unauthorized access to our information systems could adversely affect our business.
We may experience interruptions in our information systems on which our global operations depend. Further, we may face attempts by others to gain unauthorized access through the Internet to our information technology systems, to intentionally hack, interfere with or cause physical or digital damage to or failure of such systems (such as significant viruses or worms), which attempts we may be unable to prevent. We could be unaware of an incident or its magnitude and effects until after it is too late to prevent it and the damage it may cause. Any security breaches, unauthorized access, unauthorized usage, virus or similar breach or disruption could result in loss of confidential information, personal data and customer content, damage to our reputation, early termination of our contracts, litigation, regulatory investigations or other liabilities. If our security measures, or those of our partners or service providers, are breached as a result of third-party action, employee error, malfeasance or otherwise and, as a result, someone obtains unauthorized access to confidential information, personal data or customer content, our reputation will be damaged, our business may suffer or we could incur significant liability. The theft, unauthorized use, or a cybersecurity attack that results in the publication of our trade secrets and other confidential business information as a result of such an incident could negatively affect our competitive position, the value of our investment in product or research and development, and third parties might assert against us or our customers claims related to resulting losses of confidential or proprietary information or end-user data and/or system reliability. In any such event, our business could be subject to significant disruption, and we could suffer monetary and other losses, including reputational harm.
Our headquarters are located in Northern California where disasters may occur that could disrupt our operations and harm our business.
Our corporate headquarters is located in Silicon Valley in Northern California. Historically, this region has been vulnerable to natural disasters and other risks, such as earthquakes, which at times have disrupted the local economy and posed physical risks to us and our local suppliers. In addition, terrorist acts or acts of war targeted at the United States, and specifically Silicon Valley, could cause damage or disruption to us, our employees, facilities, partners, suppliers, distributors and resellers, and customers, which could have a material adverse effect on our operations and financial results. Although we currently have significant redundant capacity in Sweden in the event of a natural disaster or other catastrophic event in Silicon Valley, our business could nonetheless suffer. Our operations in Sweden are subject to disruption by extreme winter weather.
The requirements of being a public company may strain our resources and divert management’s attention.
As a public company, we are subject to the reporting requirements of the Securities Exchange Act of 1934, as amended, or the Exchange Act, the listing requirements of The Nasdaq Stock Market LLC and other applicable securities rules and regulations. Compliance with these rules and regulations will increase our legal and financial compliance costs, make some activities more difficult, time-consuming or costly and increase demand on our systems and resources. The Exchange Act requires, among other things, that we file annual, quarterly and current reports with respect to our business and operating results and maintain effective disclosure controls and procedures and internal control over financial reporting. In order to maintain and, if required, improve our disclosure controls and procedures and internal control over financial reporting to meet this standard, significant resources and management oversight may be required. As a result, management’s attention may be diverted from other business concerns, which could harm our business and operating results. Although we have hired several employees to comply with these requirements, we may need to hire more employees in the future, which will increase our costs and expenses.
In addition, changing laws, regulations and standards relating to corporate governance and public disclosure, including the Sarbanes-Oxley Act, the Dodd-Frank Wall Street Reform and Consumer Protection Act, new regulations of the SEC and The Nasdaq Stock Market LLC, have and will create additional compliance requirements for companies such as ours. To maintain high standards of corporate governance and public disclosure, we have invested, and intend to continue to invest, in reasonably necessary resources to comply with evolving standards. These investments have resulted in increased general and administrative expenses and a diversion of management time and attention from revenue-generating activities and may continue to do so in the future.
Risks Related to Our Industry
The market for our products in the network provider market is still emerging and our growth may be harmed if carriers do not adopt DPI solutions.
The market for DPI technology is still emerging and the majority of our customers to date have been small and midsize broadband service providers and universities. We believe that the Tier 1 carriers, as well as cable and mobile operators, present a significant market opportunity and are an important element of our long term strategy, but they are still in the early stages of adopting and evaluating the benefits and applications of DPI technology. Carriers may decide that full visibility into their networks or highly granular control over content based applications is not critical to their business. They may also determine that certain applications, such as VoIP or Internet video, can be adequately prioritized in their networks by using router and switch infrastructure products without the use of DPI technology. They may also, in some instances, face regulatory constraints that could change the characteristics of the markets. Carriers may also seek an embedded DPI solution in capital equipment devices such as routers rather than the stand-alone solution offered by us. Furthermore, widespread adoption of our products by carriers will require that they migrate to a new business model based on offering subscriber and application-based tiered services. If carriers decide not to adopt DPI technology, our market opportunity would be reduced and our growth rate may be harmed, which could have a material adverse effect on our results of operations and financial condition.
If the bandwidth management solutions market fails to grow, our business will be adversely affected.
We believe that the market for bandwidth management solutions is in an early stage of development. We cannot accurately predict the future size of the market, the products needed to address the market, the optimal distribution strategy, or the competitive environment that will develop. In order for us to execute our strategy, our potential customers must recognize the value of more sophisticated bandwidth management solutions, decide to invest in the management of their networks and the performance of important business software applications and, in particular, adopt our bandwidth management solutions. The growth of the bandwidth management solutions market also depends upon a number of factors, including the availability of inexpensive bandwidth, especially in international markets, and the growth of wide area networks. The failure of the market to rapidly grow would adversely affect our sales and sales prospects, which could have a material adverse effect on our results of operations and financial condition and cause a decline in the price of our common stock.
Demand for our products depends, in part, on the rate of adoption of bandwidth-intensive broadband applications, such as peer-to-peer, and latency-sensitive applications, such as voice-over Internet protocol, or VoIP, Internet video and online video gaming applications.
Our products are used by broadband service providers and enterprises to provide awareness, control and protection of Internet traffic by examining and identifying packets of data as they pass an inspection point in the network, particularly bandwidth-intensive applications that cause congestion in broadband networks and impact the quality of experience of users. In addition to the general increase in applications delivered over broadband networks that require large amounts of bandwidth, such as peer-to-peer applications, demand for our products is driven particularly by the growth in applications which are highly sensitive to network delays and therefore require efficient network management. These applications include VoIP, Internet video and online video gaming applications. If the rapid growth in adoption of VoIP and in the popularity of Internet video and online video gaming applications does not continue, the demand for our products may not grow as anticipated, which could have a material adverse effect on our results of operations and financial condition.
The network equipment market is subject to rapid technological progress and to remain competitive, we must continually introduce new products or upgrades that achieve broad market acceptance.
The network equipment market is characterized by rapid technological progress, frequent new product introductions, changes in customer requirements and evolving industry standards. If we do not regularly introduce new products or upgrades in this dynamic environment, our product lines may become less competitive or obsolete. Developments in routers and routing software could also significantly reduce demand for our products. Alternative technologies could achieve widespread market acceptance and displace the technology on which we have based our product architecture. We cannot assure you that our chosen technological approaches will achieve broad market acceptance or that other technology or devices will not supplant our products and technology.
Our products must comply with evolving industry standards and complex government regulations or else our products may not be widely accepted, which may prevent us from growing our net revenue or achieving profitability.
The market for network equipment products is characterized by the need to support new standards as they emerge, evolve and achieve acceptance. We will not be competitive unless we continually introduce new products and product enhancements that meet these emerging standards. We may not be able to effectively address the compatibility and interoperability issues that arise as a result of technological changes and evolving industry standards. Our products must be compliant with various United States federal government requirements and regulations and standards defined by agencies such as the Federal Communications Commission (the “FCC”), in addition to standards established by governmental authorities in various foreign countries and recommendations of the International Telecommunication Union. If we do not comply with existing or evolving industry standards or if we fail to obtain timely domestic or foreign regulatory approvals or certificates, we will not be able to sell our products where these standards or regulations apply, which may prevent us from sustaining our net revenue or maintaining profitability.
Recently adopted regulatory actions may result in reduced capital spending by broadband service providers, which could adversely impact our opportunities for continued revenue growth.
In December 2010, the FCC adopted rules which, among other things, prohibit broadband service providers from preventing end-user customers from accessing lawful content or running applications of their choice over the Internet, and from connecting and using devices that do not harm the network; they also require facilities-based broadband service providers to treat lawful content, applications and services in a nondiscriminatory manner, and to make certain disclosures concerning their practices as they relate to the openness of their networks. However, the FCC’s rules permit broadband service providers to employ reasonable techniques to manage traffic on their networks. In addition, the FCC’s rules exempt from these rules (1) certain services provided to national or homeland security authorities, and (2) certain managed or specialized services provided to enterprise customers. Many of our services appear to fall within these categories of exempt services, and we do not believe that these rules have or will have a material impact on our operations. However, the rules have been challenged before the Court of Appeals for the District of Columbia Circuit, and we are unable to predict the outcome of these appeals. Moreover, if the FCC were to construe narrowly or eliminate existing exemptions, the impact of the rules on our operations could be different and while the issue remains unresolved, broadband service providers may lessen their capital investments in their networks. In such a circumstance, we may have fewer opportunities to sell our products to both current and prospective customers, and our opportunity for continued revenue growth could be adversely impacted. If our revenue growth slows or our revenues decrease, our results of operations and our financial condition also may be adversely impacted.
Risks Related to Ownership of Our Common Stock
Our common stock price is likely to continue to be highly volatile.
The market price of our common stock has been and is likely to continue to be highly volatile. The market for small cap technology companies, including us, has been particularly volatile in recent years. We cannot assure stockholders that our stock will trade at the same levels of other stocks in our industry or that in general, stocks in our industry will sustain their current market prices.
Factors that could cause such volatility may include, among other things:
| | ● | actual or anticipated fluctuations in our quarterly operating results; |
| | ● | announcements of technology innovations by our competitors; |
| | ● | changes in financial estimates by securities analysts; |
| | ● | conditions or trends in the network control and management industry; |
| | ● | the acceptance by institutional investors of our stock; |
| | ● | rumors, announcements or press articles regarding our operations, management, organization, financial condition or financial statements; |
| | ● | the gain or loss of a significant customer; or |
| | ● | the stock market in general, and the market prices of stocks of technology companies, in particular, have experienced extreme price volatility that has adversely affected, and may continue to adversely affect, the market price of our common stock for reasons unrelated to our business or operating results. |
Holders of our common stock may be diluted in the future.
We are authorized to issue up to 32.5 million shares of common stock and 15.0 million shares of preferred stock. Our Board of Directors has the authority, without seeking stockholder approval, to issue additional shares of common stock and/or preferred stock in the future for such consideration as our Board of Directors may consider sufficient. In addition, in connection with our acquisition of Vineyard Networks, we issued an aggregate of 825,000 shares of our common stock to the former shareholders of Vineyard Networks. If we were to issue equity securities as all or part of the purchase price for any future acquisitions, the issuance of such equity securities would have a dilutive effect on our existing stockholders. At December 31, 2012, there were 19,695,628 shares of our common stock outstanding and outstanding stock options to purchase 1,331,779 shares of our common stock, and we granted options to purchase an additional 412,000 shares of our common stock to new employees in connection with our acquisition of Vineyard Networks in January 2013. At December 31, 2012, we had an authorized reserve of 369,543 shares of common stock which we may grant as stock options, restricted stock or other equity awards pursuant to our existing equity incentive plan.
The issuance of additional common stock and/or preferred stock in the future would reduce the proportionate ownership and voting power of our common stock held by existing stockholders and also could cause the trading price of our common stock to decline.
If securities or industry analysts do not publish research or publish inaccurate or unfavorable research about our business, our stock price and trading volume could decline.
The trading market for our common stock will depend in part on the research and reports that securities or industry analysts publish about us or our business. If we do not establish and maintain adequate research coverage or if one or more of the analysts who covers us downgrades our stock or publishes inaccurate or unfavorable research about our business, our stock price would likely decline. If one or more of these analysts ceases coverage of our company or fails to publish reports on us regularly, demand for our stock could decrease, which could cause our stock price and trading volume to decline.
Nevada law and our articles of incorporation and bylaws contain provisions that may discourage, delay or prevent a change in our management team that our stockholders may consider favorable or otherwise have the potential to impact our stockholders’ ability to control our company.
Nevada law and our articles of incorporation and bylaws contain provisions that may have the effect of preserving our current management or may impact our stockholders’ ability to control our Company, such as:
| | ● | authorizing the issuance of “blank check” preferred stock without any need for action by stockholders; |
| | ● | eliminating the ability of stockholders to call special meetings of stockholders; |
| | ● | restricting the ability of stockholders to take action by written consent; and |
| | ● | establishing advance notice requirements for nominations for election to the Board of Directors or for proposing matters that can be acted on by stockholders at stockholder meetings. |
These provisions could allow our Board of Directors to affect your rights as a stockholder since our Board of Directors can make it more difficult for common stockholders to replace members of the Board of Directors. Because our Board of Directors is responsible for appointing the members of our management team, these provisions could in turn affect any attempt to replace our current management team. In addition, the issuance of preferred stock could make it more difficult for a third party to acquire us and may impact the rights of common stockholders. All of the foregoing could adversely impact the price of our common stock and your rights as a stockholder.
We do not pay and do not expect to pay cash dividends on our common stock.
We have not paid any cash dividends. We do not anticipate paying cash dividends on our common stock in the foreseeable future and we cannot assure investors that funds will be legally available to pay dividends, or that, even if the funds are legally available, dividends will be declared and paid.
| Item 1B. | Unresolved Staff Comments |
None.
Our corporate headquarters are located in Fremont, California, where we currently lease 10,716 square feet of office space housing administrative, sales and marketing, logistics and support functions. In August 2012, we entered into an amendment of the lease agreement with our landlord which extended the lease for an additional 2 years, and expanded this location by approximately 2,411 square feet.
Our European headquarters are located in Sweden, where we lease office space in Varberg and Malmo totaling 11,614 square feet. On January 1, 2013, we entered into an amendment of the lease agreement with our Landlord in Sweden to extend the lease for an additional 1 year, and add an additional 6,273 square feet. The amended lease agreement has a termination date of December 2017. These facilities are used primarily for research and development, sales and marketing and support.
Our offices in Japan are located in Tokyo where we lease office space totaling approximately 1,035 square feet. This facility is primarily used for sales, marketing and support. We also maintain small offices in other countries, primarily to support the sales and marketing support activities in those areas.
We believe that our facilities are adequate for our needs in 2013 and that, if required, additional suitable space will be available on acceptable terms.
We are at times involved in litigation and other legal claims in the ordinary course of business. When appropriate in management’s estimation, we may record reserves in our financial statements for pending litigation and other claims. Although it is not possible to predict with certainty the outcome of litigation, we do not believe that any of the current pending legal proceedings to which we are a party or to which any of our property is subject will have a material impact on our results of operations or financial condition.
| Item 4. | Mine Safety and Disclosures |
Not applicable.
PART II
| Item 5. | Market for Registrant’s Common Equity, Related Stockholder Matters and Issuer Purchases of Equity Securities |
Our common stock has traded on the NASDAQ Stock Market LLC, or NASDAQ, under the symbol “PKT” since December 29, 2011. Prior to December 29, 2011, our common stock traded on the NYSE Amex Equities, formerly known as the American Stock Exchange, under the symbol "PKT". The following table sets forth, for the periods indicated, the high and low intraday prices per share of our common stock as reported by the NYSE Amex Equities with respect to the period from January 1, 2011 through December 28, 2011 and by NASDAQ for the period from December 29, 2011 through December 31, 2012. These prices reflect the 1-for-10 reverse stock split effected on February 4, 2011.
| | | Common Stock | |
| | | 2012 | | | 2011 | |
| | | High | | | Low | | | High | | | Low | |
| First Quarter | | $ | 23.46 | | | $ | 14.18 | | | $ | 10.45 | | | $ | 5.30 | |
| Second Quarter | | | 24.65 | | | | 17.78 | | | | 13.00 | | | | 8.87 | |
| Third Quarter | | | 25.99 | | | | 20.91 | | | | 12.50 | | | | 7.12 | |
| Fourth Quarter | | | 24.86 | | | | 16.83 | | | | 18.20 | | | | 8.18 | |
On March 12, 2013, the closing price of our common stock was $13.27.
Dividend Policy
We have not declared or paid any cash dividends on our common stock or other securities and do not anticipate paying any cash dividends in the foreseeable future. Any future determination to pay cash dividends will be at the discretion of the Board of Directors and will be dependent upon our financial condition, results of operations, capital requirements and such other factors as the Board of Directors deems relevant.
Recent Sales of Unregistered Securities
None.
Issuer Purchases of Equity Securities
None.
Stockholders
There were 159 stockholders of record of our common stock as of March 12, 2013.
Performance Graph
The graph below compares the cumulative total return to security holders of our common shares with the comparable cumulative returns of the NASDAQ Composite Index and the NASDAQ Computer Index. The graph assumes the investment of $100 on December 31, 2007 and the reinvestment of all dividends, if any. Points on the graph represent the performance as of the last business day of each of the fiscal years indicated.
The information under the heading “Performance Graph” shall not be deemed filed for purposes of Section 18 of the Securities Exchange Act of 1934, as amended, or incorporated by reference in any filing under the Securities Act of 1933, as amended, or the Securities Exchange Act of 1934, as amended.
| | | | 12/07 | | | | 12/08 | | | | 12/09 | | | | 12/10 | | | | 12/11 | | | | 12/12 | |
| | | | | | | | | | | | | | | | | | | | | | | | | |
| Procera Networks Inc | | | 100.00 | | | | 64.99 | | | | 31.43 | | | | 44.29 | | | | 111.29 | | | | 132.50 | |
| NASDAQ Composite | | | 100.00 | | | | 59.10 | | | | 82.19 | | | | 97.23 | | | | 98.85 | | | | 110.91 | |
| NASDAQ Computer | | | 100.00 | | | | 56.53 | | | | 96.57 | | | | 112.55 | | | | 114.05 | | | | 129.97 | |
The following selected financial information has been derived from our audited consolidated financial statements. The information set forth below is not necessarily indicative of results of future operations and should be read in conjunction with Item 7, “Management’s Discussion and Analysis of Financial Condition and Results of Operations” and the Consolidated Financial Statements and notes thereto included in Item 8 of this Annual Report on Form 10-K in order to fully understand factors that may affect the comparability of the information presented below.
| | | Fiscal Year Ended December 31, | |
| | | 2012 (1) | | | 2011 (2) | | | 2010 (3) | | | 2009 | | | 2008 | |
| | | (in thousands, except per share data) | |
| STATEMENT OF OPERATIONS DATA: | | | | | | | | | | | | | | | | | | | | |
| Net sales | | $ | 59,627 | | | $ | 44,404 | | | $ | 20,323 | | | $ | 20,129 | | | $ | 11,524 | |
| Gross profit | | $ | 40,158 | | | $ | 26,323 | | | $ | 11,510 | | | $ | 8,184 | | | $ | 4,214 | |
| Total operating expenses | | $ | 34,853 | | | $ | 22,380 | | | $ | 14,247 | | | $ | 14,421 | | | $ | 19,198 | |
| Income (loss) from operations | | $ | 5,305 | | | $ | 3,943 | | | $ | (2,737 | ) | | $ | (6,237 | ) | | $ | (14,984 | ) |
| Net income (loss) | | $ | 5,331 | | | $ | 3,755 | | | $ | (2,894 | ) | | $ | (7,384 | ) | | $ | (13,902 | ) |
| Net income (loss) per share, basic | | $ | 0.30 | | | $ | 0.29 | | | $ | (0.27 | ) | | $ | (0.82 | ) | | $ | (1.76 | ) |
| Net income (loss) per share, diluted | | $ | 0.29 | | | $ | 0.28 | | | $ | (0.27 | ) | | $ | (0.82 | ) | | $ | (1.76 | ) |
| | | | | | | | | | | | | | | | | | | | | |
| BALANCE SHEET DATA: | | | | | | | | | | | | | | | | | | | | |
| Cash, cash equivalents and short-term investments | | $ | 131,695 | | | $ | 37,404 | | | $ | 7,876 | | | $ | 3,192 | | | $ | 1,721 | |
| Working capital | | $ | 144,195 | | | $ | 44,654 | | | $ | 12,607 | | | $ | 7,314 | | | $ | 5,273 | |
| Total assets | | $ | 167,038 | | | $ | 60,156 | | | $ | 24,517 | | | $ | 16,323 | | | $ | 15,991 | |
| Deferred revenue | | $ | 9,831 | | | $ | 6,378 | | | $ | 4,437 | | | $ | 2,103 | | | $ | 1,313 | |
| Long-term liabilities | | $ | 2,878 | | | $ | 873 | | | $ | 705 | | | $ | 452 | | | $ | 759 | |
| Total stockholders’ equity | | $ | 146,805 | | | $ | 46,567 | | | $ | 13,754 | | | $ | 8,515 | | | $ | 9,059 | |
| (1) | On April 25, 2012, we completed a registered offering of 4.5 million shares of common stock. The shares were sold to the public at $21.00 per share for gross proceeds of $94.5 million. We received net proceeds of approximately $88.0 million after deducting underwriting commissions and other offering expenses. |
| (2) | On June 24, 2011, we completed a registered offering of 3.0 million shares of our common stock, which included the exercise in full of the underwriters’ overallotment option to purchase 0.4 million additional shares of our common stock. The shares were sold to the public at $9.50 per share for gross proceeds of $28.8 million. We received net proceeds of approximately $26.5 million after deducting underwriting commissions and other offering expenses. |
| (3) | On March 4, 2010, we closed a registered placement of our common stock primarily to institutional investors. We sold 1.8 million shares of our common stock at an offering price to the public of $4.00 per share for gross proceeds of $7.2 million, and received net proceeds of approximately $6.5 million after deducting the placement agent’s commission and legal and other offering costs. |
The following Management’s Discussion and Analysis of Financial Condition and Results of Operations contains forward-looking statements that involve risks and uncertainties. We use words such as “may,” “will,” “expect,” “anticipate,” “estimate,” “intend,” “plan,” “predict,” “potential,” “believe,” “should” and similar expressions to identify forward-looking statements. These statements appearing throughout our Annual Report on Form 10-K are statements regarding our intent, belief, or current expectations, primarily regarding our operations. You should not place undue reliance on these forward-looking statements, which apply only as of the date of this Annual Report on Form 10-K. Our actual results could differ materially from those anticipated in these forward-looking statements for many reasons, including those set forth under “Business,” “Risk Factors” and elsewhere in this Annual Report on Form 10-K.
Overview
We are a leading provider of Intelligent Policy Enforcement (“IPE”) solutions that enable mobile and broadband network operators and entities managing private networks including higher education institutions, businesses and government entities (collectively referred to as network operators) to gain enhanced visibility into, and control of, their networks. Our solutions provide granular network intelligence intended to enable network operators to improve the quality and longevity of their networks, better monetize their network infrastructure investments, control security hazards and create and deploy new services for their users. We believe that the intelligence our products provide about users and their usage enables our network operator customers to make qualified business decisions. Our network operator customers include mobile service providers, broadband service providers, cable multiple system operators (“MSOs”), Internet Service Providers (“ISPs”), educational institutions, enterprises and government agencies. We sell our products directly to network operators; through partners, value added resellers and system integrators; and to other network solution suppliers for incorporation into their network solutions.
Our IPE products are part of the high-growth market for mobile packet and broadband core products. The market for IPE products was expected to reach $601.7 million in 2012 and is expected to grow to $1.8 billion in 2016, a 2011–2016 compounded annual growth rate of 30.4%. Our bundled products deliver a solution that is a key element of the mobile packet and broadband core ecosystems. Our solutions are often integrated with additional elements in the mobile packet and broadband core including Policy Management and Charging functions and are compliant with the widely adopted 3rd Generation Partnership Program (“3GPP”) standard. In order to respond to rapidly increasing demand for network capacity due to increasing subscribers and usage, network operators are seeking higher degrees of intelligence, optimization, network management, service creation and delivery in order to differentiate their offerings and deliver a high quality of experience to their subscribers. We believe the need to create more intelligent and innovative mobile and broadband networks will continue to drive demand for our products.
Our products are marketed under the PacketLogic and Network Application Visibility Library brand name. We have a broad spectrum of products delivering IPE at the access, edge and core layers of the network. Our products are designed to offer maximum flexibility to our customers and enable differentiated services and revenue-enhancing applications, all while delivering a high quality of service for subscribers.
We face competition from suppliers of standalone and integrated IPE and deep packet inspection (“DPI”) products including Allot Communications Ltd., Tektronix (acquired Arbor Networks), Blue Coat Systems, Brocade Communications Systems, Cisco Systems, Inc., Citrix Systems (acquired Bytemobile), SAIC (acquired Cloudshield Technologies), Ericsson, F5 Networks, Huawei Technologies Company, and Sandvine Corporation. Some of our competitors supply platform products with different degrees of DPI functionality, such as switch/routers, routers, session border controllers and VoIP switches. Some of our competitors are also our customer.
Most of our competitors are larger and more established enterprises with substantially greater financial and other resources. Some competitors may be willing to reduce prices and accept lower profit margins to compete with us. As a result of such competition, we could lose market share and sales, or be forced to reduce our prices to meet competition. However, we do not believe there is a dominant supplier in our market. Based on our belief in the superiority of our technology, we believe that we have an opportunity to increase our market share and benefit from what we believe will be growth in the DPI market.
We were incorporated in 2002 and became a public company in October 2003 following our merger with Zowcom, Inc., a publicly-traded Nevada corporation. In 2006, we completed acquisitions of the Netintact entities and in 2013, we acquired Vineyard Networks, Inc. Our Company is headquartered in Fremont, California and we have key operating entities in Kelowna, Canada and Varberg, Sweden, as well as a geographically dispersed sales force. We sell our products through our direct sales force, resellers, distributors, systems integrators and other equipment manufacturers in the Americas, Asia Pacific and Europe.
Critical Accounting Policies
Our discussion and analysis of our financial condition and results of operations are based upon financial statements which have been prepared in accordance with Generally Accepted Accounting Principles in the United States. The preparation of these financial statements requires us to make estimates and judgments that affect the reported amounts of assets, liabilities, revenue and expenses and related disclosure of contingent assets and liabilities. On an ongoing basis, we evaluate these estimates. We base our estimates on historical experience and on assumptions that are believed to be reasonable. These estimates and assumptions provide a basis for making judgments about the carrying values of assets and liabilities that are not readily apparent from other sources. Actual results may differ from these estimates under different assumptions or conditions, and these differences may be material. Our significant accounting policies are summarized in Note 2 of our Notes to Financial Statements.
In accordance with Securities and Exchange Commission guidance, those material accounting policies that we believe are the most critical to an investor’s understanding of our financial results and condition are discussed below.
Revenue Recognition
In October 2009, the Financial Accounting Standards Board (“FASB”) issued Accounting Standards Update (“ASU”) No. 2009-13, “Multiple-Deliverable Revenue Arrangements” and ASU No. 2009-14, “Certain Revenue Arrangements that Include Software Elements.” We adopted the new guidance on a prospective basis for new or materially modified revenue arrangements as of January 1, 2011. The adoption of this guidance did not have a material impact on our financial statements and is not expected to have a material impact in the future.
Our most common sale involves the integration of software and a hardware appliance, where the hardware and software work together to deliver the essential functionality of the product. We recognize product revenue when all of the following have occurred: (1) we have entered into a legally binding arrangement with a customer resulting in the existence of persuasive evidence of an arrangement; (2) delivery has occurred, evidenced when product title transfers to the customer; (3) customer payment is deemed fixed or determinable and free of contingencies and significant uncertainties; and (4) collection is probable.
Product revenue consists of revenue from sales of appliances and software licenses. Product sales include a perpetual license to our software that is essential to the functionality of the hardware, and on occasion include licenses to additional software. Shipping charges billed to customers are included in product revenue and the related shipping costs are included in cost of product revenue. Virtually all sales include post-contract support (“PCS”) services (included in support revenue) which consist of software updates and customer support. Software updates provide customers access to a constantly growing library of electronic Internet traffic identifiers (signatures) and rights to non-specific software product upgrades, maintenance releases and patches released during the term of the support period. Support includes Internet access to technical content, telephone and Internet access to technical support personnel and hardware support.
Receipt of a customer purchase order is the primary method of determining that persuasive evidence of an arrangement exists.
Delivery generally occurs when a product is delivered to a common carrier F.O.B. shipping point. However, product revenue based on channel partner purchase orders is recorded based on sell-through to the end user customers until such time as we have established significant experience with the channel partner’s ability to complete the sales process, which requires judgment. Additionally, when we introduce new products for which there is no historical evidence of acceptance history, revenue is recognized on the basis of end-user acceptance until such history has been established.
Fees are typically considered to be fixed or determinable at the inception of an arrangement, generally based on specific products and quantities to be delivered. Substantially all of our contracts do not include rights of return or acceptance provisions. To the extent that agreements contain such terms, we recognize revenue once the acceptance provisions or right of return lapses. Payment terms to customers generally range from net 30 to 90 days. In the event payment terms are provided that differ from standard business practices, the fees are deemed to not be fixed or determinable and revenue is recognized when the payments become due, provided the remaining criteria for revenue recognition have been met.
We assess the ability to collect from our customers based on a number of factors, including credit worthiness of the customer and past transaction history of the customer. If the customer is not deemed credit worthy, we defer all of the revenue from the arrangement until payment is received and all other revenue recognition criteria have been met.
Customer orders normally contain multiple items. The initial product delivery consists of the hardware and software elements and these elements have standalone value to the customer. Through the year ended December 31, 2012, in virtually all of our contracts, the only elements that remained undelivered at the time of product delivery were PCS services. Prior to January 1, 2011, the majority of our transactions were within the scope of the software revenue recognition guidance. We accordingly recognized revenue for delivered items using the residual method, after allocating revenue to PCS services based on vendor specific objective evidence of fair value (“VSOE”).
Under the revenue recognition guidance discussed in the first paragraph above, we allocate revenue to each element in an arrangement based on relative selling price using a selling price hierarchy. The selling price for a deliverable is based on its VSOE if available, third party evidence (“TPE”) if VSOE is not available, or our best estimate of selling price (“ESP”) if neither VSOE nor TPE is available. The maximum revenue recognized on a delivered element is limited to the amount that is not contingent upon the delivery of additional items. In arrangements that include non-essential software (“software deliverables”), revenue is allocated to each separate unit of accounting for the non-software deliverables and to the software deliverables as a group using the relative selling prices of each of the deliverables in the arrangement. Revenue allocated to the software deliverables as a group is then allocated first to the PCS services based on VSOE, and then to the software, using the residual method under the software revenue recognition guidance.
We determine VSOE for PCS based on the rate charged to customers based upon renewal pricing for PCS. Each contract or purchase order entered into includes a stated rate for PCS. The renewal rate is generally equal to the stated rate in the original contract. We have a history of such renewals, the vast majority of which are at the stated renewal rate on a customer by customer basis. PCS revenue is recognized ratably over the life of the contract. A small portion of service revenue is derived from providing training on products and we use the completed-contract method to recognize such revenue.
As our hardware and software products are rarely sold separately, we generally do not have VSOE for these products, and TPE is not available. We determine the ESP for hardware and software deliverables considering internal factors such as discounting and pricing policies and external factors such as market conditions in different geographies and competitive positioning.
In certain contracts, billing terms may be agreed upon based on performance milestones such as the execution of a measurement test, a partial delivery or the completion of a specified service. Payments received before the unconditional acceptance of a specific set of deliverables are recorded as deferred revenue until the conditional acceptance has been waived.
Valuation of Long-Lived Assets and Goodwill
We review our long-lived assets including property and equipment and purchased intangible assets for impairment whenever events or changes in circumstances indicate that the carrying amount may not be recoverable. Such events or circumstances that could trigger an impairment review include a significant disposal of a portion of such assets, an adverse change in the market involving the business employing the related asset, a significant decrease in the benefits realized from an acquired business, difficulties or delays in integrating the business or a significant change in the operations of an acquired business.
An impairment test involves a comparison of undiscounted cash flows from the use of the asset to the carrying value of the asset. Measurement of an impairment loss is based on the amount that the carrying value of the asset exceeds its fair value. No impairment losses were incurred in the periods presented.
We review our goodwill for impairment annually during the fourth quarter of the year or more frequently if an event or circumstance indicates that an impairment loss has occurred. The identification and measurement of goodwill impairment involves the estimation of fair value at a reporting unit level. We operate in one segment, which is considered to be the sole reporting unit, and therefore, we test our goodwill at the enterprise level.
Goodwill impairment is determined using a two-step process. The first step of the goodwill impairment test is used to identify potential impairment by comparing the fair value of a reporting unit with its carrying amount, including goodwill. If the fair value of a reporting unit exceeds its carrying amount, goodwill of the reporting unit is considered not impaired and the second step of the impairment test is unnecessary. If the carrying amount of a reporting unit exceeds its fair value, the second step of the goodwill impairment test is performed to measure the amount of impairment loss, if any.
The second step of the goodwill impairment test compares the implied fair value of the reporting unit’s goodwill with the carrying amount of that goodwill. If the carrying amount of the reporting unit’s goodwill exceeds the implied fair value of that goodwill, an impairment loss is recognized in an amount equal to that excess. The implied fair value of goodwill is determined in the same manner as the amount of goodwill recognized in a business combination. That is, the fair value of the reporting unit is allocated to all of the assets and liabilities of that unit (including any unrecognized intangible assets) as if the reporting unit had been acquired in a business combination and the fair value of the reporting unit was the purchase price paid to acquire the reporting unit.
As of December 31, 2012, we completed the first step of our annual impairment test which did not indicate impairment of goodwill. Therefore, the second step of the impairment test was not necessary.
Allowance for Doubtful Accounts
The allowance for doubtful accounts reduces trade receivables to the amount that is ultimately believed to be collectible. When evaluating the adequacy of the allowance for doubtful accounts, we consider factors such as historical experience, credit quality, age of the accounts receivable balances, geographic or country-specific risks and economic conditions that may affect a customer’s ability to pay. The allowance for doubtful accounts is reviewed regularly and adjusted if necessary based on our assessment of a customer’s ability to pay. Individual accounts receivable are written off when all collection efforts have been exhausted.
Stock-Based Compensation
We apply the provisions of FASB Accounting Standards Codification (“ASC”) Topic 718, which requires the measurement and recognition of compensation expense for all share-based payment awards made to employees and non-employee directors based on estimated fair values. Under the fair value recognition provisions of this statement, our stock-based compensation cost is measured at the grant date based on the fair value of the award and is recognized as an expense on a straight-line basis over the requisite service period, which is the vesting period. We calculate the fair value of stock options using the Black-Scholes option-pricing model. The determination of the fair value of stock-based payment awards using an option-pricing model is affected by our stock price as well as assumptions regarding a number of complex and subjective variables. These variables include our expected stock price volatility over the term of the awards, actual and projected employee stock option exercise behaviors, risk-free interest rate and expected dividends.
We estimate the expected volatility of our common stock-based on its historical volatility over a period equivalent to the expected term of the option. We estimate the expected term of stock options using historical exercise data. We use the exact number of days between the grant and the exercise dates to calculate a weighted average of the holding periods for all awards (i.e., the average interval between the grant and exercise or post-vesting cancellation dates), adjusted as appropriate. We determine the risk-free interest rate for a period equivalent to the expected term of the option by extrapolating from the U.S. Treasury yield curve in effect at the time of the grant. We have never paid cash dividends and do not anticipate paying cash dividends in the foreseeable future. We estimate forfeitures based on our historical experience.
Accounting for Income Taxes
We record a tax provision for the anticipated tax consequences of the reported results of operations. In accordance with ASC Topic 740, the provision for income taxes is computed using the asset and liability method, under which deferred tax assets and liabilities are recognized for the expected future tax consequences of temporary differences between the financial reporting and tax bases of assets and liabilities, and for the operating losses and tax credit carryforwards. Deferred tax assets and liabilities are measured using the currently enacted tax rates that apply to taxable income in effect for the years in which those assets are expected to be realized or settled. We record a valuation allowance to reduce deferred tax assets to the amount that is believed more likely than not to be realized. Management believes that sufficient uncertainty exists regarding the future realization of deferred tax assets and, accordingly, a full valuation allowance has been provided against net deferred tax assets. Tax expense has taken into account any change in the valuation allowance for deferred tax assets where the realization of various deferred tax assets is subject to uncertainty.
Recent Accounting Pronouncements
In February 2013, the FASB issued ASU No. 2013-02, “Comprehensive Income (Topic 220): Reporting of Amounts Reclassified Out of Accumulated Other Comprehensive Income,” (“ASU 2013-02”). ASU 2013-02 finalizes the requirements of ASU 2011-05 that ASU 2011-12 deferred, clarifying how to report the effect of significant reclassifications out of accumulated other comprehensive income. ASU 2013-02 is to be applied prospectively. We do not anticipate that the adoption of this ASU will materially change the presentation of our consolidated financial statements.
In May 2011, the FASB issued ASU No. 2011-04, “Fair Value Measurement (Topic 820): Amendments to Achieve Common Fair Value Measurement and Disclosure Requirements in U.S. GAAP and International Financial Reporting Standards (“IFRS”).” The amendments in this ASU generally represent clarification of Topic 820, but also include instances where a particular principle or requirement for measuring fair value or disclosing information about fair value measurements has changed. This update results in common principles and requirements for measuring fair value and for disclosing information about fair value measurements in accordance with GAAP and IFRS. The amendments are effective for interim and annual periods beginning after December 15, 2011 and are to be applied prospectively. Early application is not permitted. The adoption of ASU 2011-04 did not have a material impact on our consolidated financial statements.
In June 2011, the FASB issued ASU 2011-05, “Comprehensive Income (Topic 220): Presentation of Comprehensive Income.” Specifically, the new guidance allows an entity to present components of net income or other comprehensive income in one continuous statement, referred to as the statement of comprehensive income, or in two separate, but consecutive statements. The new guidance eliminates the current option to report other comprehensive income and its components in the statement of changes in equity. While the new guidance changes the presentation of comprehensive income, there are no changes to the components that are recognized in net income or other comprehensive income under current accounting guidance. The new guidance is effective for fiscal years and interim periods beginning after December 15, 2011 and is to be applied retrospectively. The adoption of ASU 2011-05 did not have a material impact on our consolidated financial statements.
Results of Operations
Revenue
| | | Year Ended December 31, | | | Year Ended December 31, | |
| | | 2012 | | | 2011 | | | Increase (Decrease) | | | 2011 | | | 2010 | | | Increase (Decrease) | |
| | | ($ in thousands) | | | | | | | | | ($ in thousands) | | | | | | | |
| | | | | | | | | | | | | | | | | | | | | | | | | |
| Net product revenue | | $ | 47,723 | | | $ | 37,450 | | | $ | 10,273 | | | | 27 | % | | $ | 37,450 | | | $ | 15,825 | | | $ | 21,625 | | | | 137 | % |
| Net support revenue | | | 11,904 | | | | 6,954 | | | | 4,950 | | | | 71 | % | | | 6,954 | | | | 4,498 | | | | 2,456 | | | | 55 | % |
| Total revenue | | $ | 59,627 | | | $ | 44,404 | | | $ | 15,223 | | | | 34 | % | | $ | 44,404 | | | $ | 20,323 | | | $ | 24,081 | | | | 118 | % |
Our revenue is derived from two sources: 1) product revenue, which includes sales of our hardware appliances bundled with software licenses, separate software licenses or software upgrades; and 2) service revenue, which consists primarily of software maintenance and customer support revenue and secondarily of professional services. Maintenance and customer support revenue is recognized over the support period, which is typically twelve months.
Total revenue in 2012 was $59.6 million, an increase of 34% compared with $44.4 million in 2011, and reflected a 27% increase in product revenue and a 71% increase in support revenue. The increase in product revenue in 2012 compared to 2011 reflected revenue from network operator customer relationships and follow-on orders from existing customers. During the year, we added a number of new large network operator customers, including mobile service providers, fixed line service providers, and cable multiple system operators; and we continued to add new higher education customers. In part, new network operator customers reflected our geographic sales expansion in Japan and the Middle East. Product revenue reflected increased sales of our mid-range PL8000 series products and PacketLogic Subscriber Management software, as well as initial sales of our high-end PL20000 series products. The increase in support revenue in 2012 reflected the continued expansion of the installed base of our product to which we have sold ongoing support services and an increase in professional services revenue. In 2012, revenue from one customer, Shaw Communications, Inc., represented 16% of net revenues.
Total revenue in 2011 was $44.4 million, an increase of 118% compared with $20.3 million in 2010, and reflected a 137% increase in product revenue and a 55% increase in support revenue. The increase in product revenue in 2011 compared to 2010 reflected revenue from new service provider relationships and follow-on orders from existing customers. During 2011, we added a number of new large network operator customers, including mobile service providers, fixed line service providers, and cable multiple system operators, and we also added new higher education customers. Product revenue reflected increased sales of our mid-range PL8000 series and high-end PL10000 series products. The increase in support revenue in 2011 reflected the expansion of the installed base of our product to which we have sold ongoing support services. In 2011, revenue from two customers, Shaw Communications, Inc. and Jet Infosystems, represented 27% and 12% of net revenues, respectively. For the year ended December 31, 2010, revenue from one customer, Cox Communications, Inc., represented 11% of net revenues.
Sales to customers located in the United States as a percentage of total revenues were 49%, 51% and 59% for the years ended December 31, 2012, 2011 and 2010, respectively.
For the year ending December 31, 2013, we expect total revenue to increase between 25% and 30% compared with total revenue for the year ended December 31, 2012.
Cost of Sales
Cost of sales includes: (i) material costs and direct labor for products sold, (ii) costs expected to be incurred for warranty, (iii) adjustments to inventory values, including the write-down of slow moving or obsolete inventory and (iv) costs for support and professional service personnel.
The following table presents the breakdown of cost of sales by category for the years ended December 31, 2012 and 2011:
| | | Year Ended December 31, | | | Year Ended December 31, | |
| | | 2012 | | | 2011 | | | Increase (Decrease) | | | 2011 | | | 2010 | | | Increase (Decrease) | |
| | | ($ in thousands) | | | | | | ($ in thousands) | | | | |
| | | | | | | | | | | | | | | | | | | |
| Product Costs | | $ | 17,720 | | | $ | 17,358 | | | $ | 362 | | | $ | 17,358 | | | $ | 8,313 | | | $ | 9,045 | |
| Percent of net product revenue | | | 37 | % | | | 46 | % | | | (9 | )% | | | 46 | % | | | 53 | % | | | (7 | )% |
| | | | | | | | | | | | | | | | | | | | | | | | | |
| Support costs | | | 1,749 | | | | 723 | | | | 1,026 | | | | 723 | | | | 500 | | | | 223 | |
| Percent of net support revenue | | | 15 | % | | | 10 | % | | | 5 | % | | | 10 | % | | | 11 | % | | | (1 | )% |
| | | | | | | | | | | | | | | | | | | | | | | | | |
| Total costs of sales | | $ | 19,469 | | | $ | 18,081 | | | $ | 1,388 | | | $ | 18,081 | | | $ | 8,813 | | | $ | 9,268 | |
| Percent of net total revenue | | | 33 | % | | | 41 | % | | | (8 | )% | | | 41 | % | | | 43 | % | | | (2 | )% |
2012 compared to 2011. Total cost of sales in 2012 increased by $1.4 million compared to 2011, and decreased as a percentage of revenue by 8 percentage points. The increase in cost of sales in 2012 reflected higher material costs associated with increased product sales and higher support costs for increased customer support and professional services headcount. The decrease in cost of sales as a percentage of revenue primary reflected increased sales of our PL8000 series products, which have lower material costs compared with our other bundled hardware products, and a greater proportion of software licenses bundled with hardware sales.
2011 compared to 2010. Total cost of sales in 2011 increased by $9.3 million compared to 2010, and decreased as a percentage of revenue by 2 percentage points. The increase in cost of sales in 2011 primarily reflected higher material costs associated with increased product sales. The decrease in cost of sales as a percentage of revenue primary reflected increased sales of our PL8000 series products, which have lower material costs compared with our other bundled hardware products.
Gross Profit
| | | Year Ended December 31, | | | Year Ended December 31, | |
| | | 2012 | | | 2011 | | | Increase (Decrease) | | | 2011 | | | 2010 | | | Increase (Decrease) | |
| | | ($ in thousands) | | | | | | | | | ($ in thousands) | | | | | | | |
| | | | | | | | | | | | | | | | | | | | | | | | | |
| Gross profit | | $ | 40,158 | | | $ | 26,323 | | | $ | 13,837 | | | | 53 | % | | $ | 26,323 | | | $ | 11,510 | | | $ | 14,813 | | | | 129 | % |
| Percent of total net revenue | | | 67 | % | | | 59 | % | | | | | | | | | | | 59 | % | | | 57 | % | | | | | | | | |
2012 compared to 2011. Our gross margin for 2012 increased by 8 percentage points to 67% from 59% in 2011. The improvement resulted primarily from a greater proportion of software licenses bundled with hardware sales and increased sales of our appliance-based PL8000 series products. In 2012, we sold increased quantities of our PacketLogic Subscriber Manager software licenses bundled with hardware and higher levels of license upgrades into existing customers. In addition, we introduced higher capacity PL8000 series products, which enabled the usage of a higher level of bundled software licenses. These items resulted in a higher proportion of software license sales in comparison to 2011. Revenue in 2012 also reflected increased sales of our appliance-based PL8000 series products which have a higher margin compared with our chassis-based products. Our gross margin rate in any given period is impacted by the product mix in that period, and we expect variability in our gross margin rate to continue in the future.
2011 compared to 2010. Our gross margin for 2011 increased by 2 percentage points to 59% from 57% in 2010. The improvement resulted from an increase in sales of our PL8000 series products, which have a higher margin compared with our other products.
Operating Expenses
| | | Year Ended December 31, | | | Year Ended December 31, | |
| | | 2012 | | | 2011 | | | Increase (Decrease) | | | 2011 | | | 2010 | | | Increase (Decrease) | |
| | | ($ in thousands) | | | | | | | | | ($ in thousands) | | | | | | | |
| | | | | | | | | | | | | | | | | | | | | | | | | |
| Research and development | | $ | 7,472 | | | $ | 4,647 | | | $ | 2,825 | | | | 61 | % | | $ | 4,647 | | | $ | 3,305 | | | $ | 1,342 | | | | 41 | % |
| Sales and marketing | | | 18,158 | | | | 12,026 | | | | 6,132 | | | | 51 | % | | | 12,026 | | | | 6,855 | | | | 5,171 | | | | 75 | % |
| General and administrative | | | 9,223 | | | | 5,707 | | | | 3,516 | | | | 62 | % | | | 5,707 | | | | 4,087 | | | | 1,620 | | | | 40 | % |
| Total | | $ | 34,853 | | | $ | 22,380 | | | $ | 12,473 | | | | 56 | % | | $ | 22,380 | | | $ | 14,247 | | | $ | 8,133 | | | | 57 | % |
In 2012, our total operating expenses have increased to support the scale of our operations and we have hired additional employees in each function of our company, invested in testing equipment for the development of our products, replaced our operating and accounting system, and increased the use of outside services, including legal, audit and accounting services.
We anticipate that this trend will continue in subsequent periods and that total operating expenses for the year ending December 31, 2013 will exceed those incurred in the year ended December 31, 2012.
Research and Development
Research and development expenses include costs associated with personnel focused on the development or improvement of our products, prototype materials, initial product certifications, testing equipment and software costs. Research and development costs include sustaining and enhancement efforts for products already released and development costs associated with planned new products.
| | | Year Ended December 31, | | | Year Ended December 31, | |
| | | 2012 | | | 2011 | | | Increase (Decrease) | | | 2011 | | | 2010 | | | Increase (Decrease) | |
| | | ($ in thousands) | | | | | | | | | ($ in thousands) | | | | | | | |
| | | | | | | | | | | | | | | | | | | | | | | | | |
| Research and development | | $ | 7,472 | | | $ | 4,647 | | | $ | 2,825 | | | | 61 | % | | $ | 4,647 | | | $ | 3,305 | | | $ | 1,342 | | | | 41 | % |
| As a percentage of net revenue | | | 12 | % | | | 10 | % | | | | | | | | | | | 10 | % | | | 16 | % | | | | | | | | |
2012 compared to 2011. Research and development expenses for 2012 increased by $2.8 million compared to 2011 as a result of increased research and development personnel hired during 2012, and corresponding additional employee compensation costs and higher depreciation related to testing equipment and software. Additional personnel are expected to allow us to enhance our core product features and functionality in order to support new sales and to achieve follow-on sales to our current customers. Stock-based compensation recorded to research and development expenses was $0.3 million in 2012 compared to $0.1 million in 2011.
2011 compared to 2010. Research and development expenses for 2011 increased by $1.3 million compared to 2010 as a result of increased research and development personnel hired during 2010 and the corresponding additional employee compensation costs. Stock-based compensation recorded to research and development expenses was $127,000 in 2011 compared to $34,000 in 2010.
Sales and Marketing
Sales and marketing expenses primarily include personnel costs, sales commissions and marketing expenses, such as trade shows, channel development and product marketing and promotional literature.
| | | Year Ended December 31, | | | Year Ended December 31, | |
| | | 2012 | | | 2011 | | | Increase (Decrease) | | | 2011 | | | 2010 | | | Increase (Decrease) | |
| | | ($ in thousands) | | | | | | | | | ($ in thousands) | | | | | | | |
| | | | | | | | | | | | | | | | | | | | | | | | | |
| Sales and marketing | | $ | 18,158 | | | $ | 12,026 | | | $ | 6,132 | | | | 51 | % | | $ | 12,026 | | | $ | 6,855 | | | $ | 5,171 | | | | 75 | % |
| As a percentage of net revenue | | | 31 | % | | | 27 | % | | | | | | | | | | | 27 | % | | | 34 | % | | | | | | | | |
2012 compared to 2011. Sales and marketing expenses for 2012 increased by $6.1 million compared to 2011. The increase reflected the addition of sales and marketing personnel in 2012 and the corresponding higher compensation costs and higher commission costs as a result of the increase in revenue. Stock-based compensation recorded to sales and marketing expense was $1.2 million in 2012 compared to $0.5 million in 2011.
2011 compared to 2010. Sales and marketing expenses for 2011 increased by $5.2 million compared to 2010. The increase reflected the addition of sales personnel in 2011 and the corresponding higher compensation costs and higher commission costs as a result of the increase in revenue. Stock-based compensation recorded to sales and marketing expense was $0.5 million in 2011 compared to $0.3 million in 2010.
General and Administrative
General and administrative expenses consist primarily of personnel costs related to our executives, our finance function, and outside fees for professional services. Professional services include costs for legal advice and services, independent auditors and investor relations.
| | | Year Ended December 31, | | Year Ended December 31, | |
| | | 2012 | | | 2011 | | | Increase (Decrease) | | 2011 | | | 2010 | | | Increase (Decrease) | |
| | | ($ in thousands) | | | | | | | | ($ in thousands) | | | | | | | |
| | | | | | | | | | | | | | | | | | | | | | | | |
| General and administrative | | $ | 9,223 | | | $ | 5,707 | | | $ | 3,516 | | | | 62 | % | | $ | 5,707 | | | $ | 4,087 | | | $ | 1,620 | | | | 40 | % |
| As a percentage of net revenue | | | 16 | % | | | 13 | % | | | | | | | | | | | 13 | % | | | 20 | % | | | | | | | | |
2012 compared to 2011. General and administrative expenses for 2012 increased by $3.5 million compared to 2011, reflecting increased accounting and human resource personnel and personnel related costs, business development expenses, increased legal and audit fees, and an increased use of contractors and outside services that related, in part, to the replacement of our operating and accounting system. During 2012, we incurred business development costs of approximately $1.2 million related to potential mergers, acquisitions and other significant partnership arrangements. Stock-based compensation recorded to general and administrative expense was $1.1 million in 2012, compared to $1.0 million in 2011.
2011 compared to 2010. General and administrative expenses for 2011 increased by $1.6 million compared to 2010, reflecting higher bonus costs associated with exceeding revenue targets that were established for 2011, as well as higher legal and audit fees, and increased use of contractors. Stock-based compensation recorded to general and administrative expense was $1.0 million in 2011, flat with $1.0 million in 2010.
Interest and Other Expense
| | | Year Ended December 31, | | | Year Ended December 31, | |
| | | 2012 | | | 2011 | | | Increase (Decrease) | | | 2011 | | | 2010 | | | Increase (Decrease) | |
| | | ($ in thousands) | | | | | | | | | ($ in thousands) | | | | | | | |
| | | | | | | | | | | | | | | | | | | | | | | | | |
| Interest income | | $ | 362 | | | | 73 | | | $ | 289 | | | | 397 | % | | $ | 73 | | | | 18 | | | $ | 55 | | | | 306 | % |
| Interest expense and other | | | (213 | ) | | | (216 | ) | | | 3 | | | | 2 | % | | | (216 | ) | | | (165 | ) | | | (51 | ) | | | 31 | % |
| Total interest and other income (expense), net | | $ | 149 | | | $ | (143 | ) | | $ | 292 | | | | 204 | % | | $ | (143 | ) | | $ | (147 | ) | | $ | 4 | | | | 3 | % |
Interest income increased in 2012 compared to 2011 due to higher cash and investment balances following our registered offering of common stock in the second quarter of 2012, for which we received net proceeds of approximately $88.0 million. Interest expense and other decreased in 2012 compared with 2011, reflecting reduced foreign currency transaction losses in 2012, compared with 2011.
Interest income increased in 2011 compared to 2010 due to higher cash balances following our registered offering of common stock in the second quarter of 2011, for which we received net proceeds of approximately $26.5 million. Interest expense and other increased in 2011 compared with 2010, reflecting foreign currency transaction losses of $78,000 in 2011, partially offset by reduced interest costs of $27,000 associated with reduced borrowings against our line of credit.
Provision for Income Taxes
| | | | Year Ended December 31, | | | | Year Ended December 31, | |
| | | | 2012 | | | | 2011 | | | | Increase (Decrease) | | | | 2011 | | | | 2010 | | | | Increase (Decrease) | |
| | | | ($ in thousands) | | | | | | | | | | | | ($ in thousands) | | | | | | | | | |
| Income tax provision | | $ | 123 | | | $ | 45 | | | $ | 78 | | | | 173 | % | | $ | 45 | | | $ | 10 | | | $ | 35 | | | | 350 | % |
We are subject to taxation primarily in the U.S., Australia, Japan, Singapore and Sweden as well as in a number of states, including California. The increase in income tax provision in 2012 compared to 2011 reflected higher state and foreign taxes.
We have established a valuation allowance for substantially all of our deferred tax assets. We calculated the valuation allowance in accordance with the provisions of ASC Topic 740, which requires that a valuation allowance be established or maintained when it is “more likely than not” that all or a portion of deferred tax assets will not be realized. During 2012 and 2011, we experienced significant growth and were able to utilize a significant portion of our net operating loss carry-forwards and to the extent utilized, we have reversed any previous reserve. We will continue to reserve for substantially all net deferred tax assets until there is sufficient evidence to warrant reversal.
Liquidity and Capital Resources
Cash, Cash Equivalents and Short-term Investments
The following table summarizes the changes in our cash balance for the periods indicated:
| | | Year Ended December 31, | |
| | | 2012 | | | 2011 | | | | 2010 | |
| | | (in thousands) | |
| | | | | | | | | | | |
| Net cash provided by (used in) operating activities | | $ | 7,157 | | | $ | 4,591 | | | $ | (54 | ) |
| Net cash used in investing activities | | | (92,087 | ) | | | (14,571 | ) | | | (714 | ) |
| Net cash provided by financing activities | | | 91,809 | | | | 25,880 | | | | 5,876 | |
| Effect of exchange rate changes on cash and cash equivalents | | | 154 | | | | 124 | | | | (424 | ) |
| Net increase in cash and cash equivalents | | $ | 7,033 | | | $ | 16,024 | | | $ | 4,684 | |
During 2012, we generated $7.2 million in cash from operating activities, primarily consisting of our net income of $5.3 million plus non-cash charges of $5.3 million, partially offset by net working capital uses of cash of $3.4 million. Non-cash charges consisted primarily of stock-based compensation of $2.8 million, depreciation expense of $0.9 million, inventory write-downs of $0.7 million, and amortization of premiums paid for investments of $0.8 million. Working capital uses of cash included an increase in inventories of $4.2 million, an increase in accounts receivables of $5.0 million, and an increase in prepaid expenses and other current assets of $1.1 million. The increase in inventories resulted from material purchases near the end of 2012 for the fulfillment of expected orders and an increase in inventories deployed at customer sites that are pending final customer acceptance. The increase in accounts receivables reflected an increase in the receivables balance associated with higher sales, as well as timing of shipments as large orders were shipped near year end. The increase in prepaid expenses and other current assets was due partially to interest receivable of $0.4 million from the company’s invested capital and to increased prepaid expenses due to the company’s growth as well as prepaid service agreements for the company’s accounting and operating systems. Working capital sources of cash included an increase in deferred revenues of $3.3 million, an increase in accounts payable of $2.6 million, and an increase in accrued liabilities of $1.0 million. The increase in deferred revenue reflected ongoing support orders from our growing customer base, as well as support purchased on new product shipments. The increase in accounts payable reflected increased inventory purchases. The increase in accrued liabilities reflected higher accrued bonuses and sales commissions as a result of increased revenue.
Net cash used in investing activities of $92.1 million in 2012 reflected purchases of short-term investments of $117.8 million using cash raised through our equity offering in the second quarter of 2012, and purchases of lab and testing equipment for use in research and development of $4.0 million, offset partially by maturities and sales of short-term investments of $22.7 million and $7.0 million, respectively. Net cash provided by financing activities of $91.9 million included net proceeds from the issuance of common stock of $88.0 million, and proceeds from the exercise of stock options and warrants of $3.8 million.
During 2011, we generated $4.6 million in cash from operating activities, primarily consisting of our net income of $3.8 million plus non-cash charges of $2.7 million, partially offset by net working capital uses of cash of $1.8 million. Non-cash charges consisted primarily of stock-based compensation of $1.7 million, depreciation expense of $0.4 million and inventory write-downs of $0.4 million. Working capital uses of cash included an increase in inventories of $5.5 million and an increase in accounts receivables of $0.3 million. The increase in inventories resulted from material purchases before 2011 year end in anticipation of 2012 sales. The increase in accounts receivables reflected an increase in the receivables balance associated with higher sales. Working capital sources of cash included increases in deferred revenues of $2.0 million, accrued liabilities of $1.2 million and accounts payable of $0.9 million. The increase in deferred revenue reflected ongoing support orders from our growing customer base, as well as support purchased on new product shipments. The increase in accounts payable reflected increased inventory purchases. The increase in accrued liabilities reflected higher accrued bonuses and sales commissions as a result of increased revenue, which exceeded established revenue targets.
Net cash used in investing activities of $14.6 million in 2011 reflected purchases of short-term investments of $13.6 million using cash raised through our equity offering in the second quarter of 2011, and purchases of lab and testing equipment for use in research and development of $1.0 million. Net cash provided by financing activities of $25.9 million included proceeds from the issuance of common stock of $26.5 million, and proceeds from the exercise of stock options and warrants of $1.1 million, offset by the net repayment of the borrowings against our line of credit of $1.7 million.
During 2010, we used $54,000 of cash in operating activities, primarily consisting of our net loss of $2.9 million offset by non-cash charges of $2.3 million and net working capital sources of cash of $0.6 million. Non-cash charges included stock-based compensation of $1.4 million, depreciation expense of $0.5 million and inventory write-downs of $0.3 million. Working capital sources of cash included an increase in deferred revenue of $2.2 million resulting from ongoing support orders from our increasing customer base and an increase in accounts payable of $0.9 million as a result of increased inventory purchases. Working capital uses of cash included an increase in accounts receivables of $2.1 million and an increase in inventory of $0.8 million. The increase in accounts receivables reflected the timing of shipments as large orders were shipped near year end. The increase in inventory reflected inventory purchases in anticipation of 2011 shipments. Net cash used in investing activities in 2010 consisted of purchases of testing equipment of $0.7 million. Net cash provided by financing activities in 2010 included proceeds from the issuance of common stock of $6.5 million, offset by the repayment of $0.5 million of notes and the net $0.2 million repayment of the borrowings against our line of credit.
Our cash, cash equivalents and short-term investments at December 31, 2012 consisted of bank deposits with third party financial institutions, money market funds, U.S. agency securities, certificates of deposit, commercial paper and corporate bonds. Our investments are intended to establish a high-quality portfolio that preserves principal, meets liquidity needs, avoids inappropriate concentrations and delivers an appropriate yield in relationship to our investment guidelines and market conditions. Cash equivalents consist of highly liquid investments with remaining maturities of three months or less at the date of purchase. Short-term investments have a remaining maturity of greater than three months at the date of purchase and an effective maturity of less than one year. All investments are classified as available for sale.
On December 10, 2009, we entered into a two-year loan and security agreement for a secured credit facility of $2.0 million for short-term working capital purposes with Silicon Valley Bank. Borrowings under the facility bore interest at the prime rate plus 1%, but not less than 5% per annum. On February 3, 2012, the agreement was amended and restated to increase the credit facility from $2.0 million to $10.0 million for an additional two-year period beginning on that date. Borrowings under the amended credit facility bear interest at the prime rate plus 1%, but not less than 4.25% on an annual basis. At December 31, 2012, we had no borrowings under this credit facility.
Based on our current cash, cash equivalents and short-term investment balances and anticipated cash flow from operations, we believe that our working capital will be sufficient to meet the cash needs of our business for at least the next twelve months. Our future capital requirements will depend on many factors, including our rate of growth, the expansion of our sales and marketing activities, development of additional channel partners and sales territories, the infrastructure costs associated with supporting a growing business and greater installed base of customers, introduction of new products, enhancement of existing products, and the continued acceptance of our products. We may also enter into arrangements that require investment such as complementary businesses, service expansion, technology partnerships or acquisitions.
In January 2013, we acquired Vineyard Networks in Canada. The aggregate consideration of approximately $27.4 million USD, consists of $12.5 million in cash and 825,000 shares of Procera common stock.
Off-Balance Sheet Arrangements
As of December 31, 2012, we had no off-balance sheet arrangements as described by Item 303(a)(4) of Regulation S-K. We have not entered into any transactions with unconsolidated entities whereby we have financial guarantees, subordinated retained interests, derivative instruments or other contingent arrangements that expose us to material continuing risks, contingent liabilities, or any other obligations under a variable interest in an unconsolidated entity that provide us with financing, liquidity, market risk or credit risk support.
Contractual Obligations
The following table summarizes the contractual obligations that we were reasonably likely to incur as of December 31, 2012 and the effect that such obligations are expected to have on our liquidity and cash flows in future periods.
| | | Payments Due by Period | |
| In thousands | | Total | | | < 1 Year | | | 1-3 Years | | | 3-5 Years | | | > 5 Years | |
| Operating leases | | $ | 2,033 | | | $ | 543 | | | $ | 915 | | | $ | 575 | | | $ | - | |
| Unconditional purchase obligations | | | 7,413 | | | | 7,413 | | | | - | | | | - | | | | - | |
| Total | | $ | 9,446 | | | $ | 7,956 | | | $ | 915 | | | $ | 575 | | | $ | - | |
We use third-party contract manufacturers to assemble and test our hardware products. In order to reduce manufacturing lead-times and ensure an adequate supply of inventories, our agreements with some of these manufacturers allow them to procure long lead-time component inventory based on rolling production forecasts provided by us. We may be contractually obligated to purchase long lead-time component inventory procured by certain manufacturers in accordance with our forecasts. In addition, we issue purchase orders to our third-party manufacturers that may not be cancelable at any time. As of December 31, 2012, we had open non-cancelable purchase orders amounting to approximately $7.4 million, primarily with our third-party contract manufacturers.
Foreign Currency Risk
Our sales contracts are denominated predominantly in U.S. Dollars, Swedish Krona, British Pound, Australian Dollars and the Euro. We incur operating expenses primarily in U.S. Dollars, Swedish Krona and Australian Dollars. Therefore, we are subject to fluctuations in these foreign currency exchange rates. To date, exchange rate fluctuations have had minimal impact on our revenues, operating results and cash flows, and we have not used derivative instruments to hedge our foreign currency exposures. However, the effect of a 10% change in foreign currency exchange rates could have a material effect on our future operating results or cash flows, depending on which foreign currency exchange rates change and the directional change against the U.S. Dollar.
Interest Rate Sensitivity
We had unrestricted cash, cash equivalents and short term investments totaling approximately $131.7 million at December 31, 2012. Cash equivalents and short-term investments are composed of money market funds, U.S. agency securities, commercial paper, certificates of deposit and corporate bonds. Our investment policy requires investments to be of high credit quality, primarily rated A/A2, with the objective of minimizing the potential risk of principal loss. All short-term investments have an effective maturity of less than one year and are classified as available-for sale, and consequently, are recorded on the balance sheet at fair value with unrealized gains or losses reported as a separate component of accumulated other comprehensive income (loss). Because of the short weighted-average maturity of our investment portfolio at December 31, 2012, we believe that the fair value of our investment portfolio would not be significantly impacted by either a hypothetical 100 basis point increase or decrease in market interest rates.
| Item 8. | Financial Statements and Supplementary Data |
INDEX TO CONSOLIDATED FINANCIAL STATEMENTS
| | Page |
| | |
| Report of Independent Registered Public Accounting Firm | 43 |
| Report of Independent Registered Public Accounting Firm | 44 |
| Consolidated Balance Sheets as of December 31, 2012 and 2011 | 45 |
| Consolidated Statements of Operations for the years ended December 31, 2012, 2011 and 2010 | 46 |
| Consolidated Statements of Comprehensive Income (Loss) for the years ended December 31, 2012, 2011 and 2010 | 47 |
| Consolidated Statements of Stockholders’ Equity for the years ended December 31, 2012, 2011 and 2010 | 48 |
| Consolidated Statements of Cash Flows for the years ended December 31, 2012, 2011 and 2010 | 49 |
| Notes to Consolidated Financial Statements | 50 |
REPORT OF INDEPENDENT REGISTERED PUBLIC ACCOUNTING FIRM
The Board of Directors and Stockholders of Procera Networks, Inc.
We have audited the accompanying consolidated balance sheet of Procera Networks, Inc. as of December 31, 2012, and the related consolidated statements of operations, comprehensive income (loss), stockholders' equity, and cash flows for the year then ended. Our audit also included the financial statement schedule listed in the Index at Item 15(b)2 for the year ended December 31, 2012. These financial statements and schedule are the responsibility of the Company's management. Our responsibility is to express an opinion on these financial statements and schedule based on our audit.
We conducted our audit in accordance with the standards of the Public Company Accounting Oversight Board (United States). Those standards require that we plan and perform the audit to obtain reasonable assurance about whether the financial statements are free of material misstatement. An audit includes examining, on a test basis, evidence supporting the amounts and disclosures in the financial statements. An audit also includes assessing the accounting principles used and significant estimates made by management, as well as evaluating the overall financial statement presentation. We believe that our audit provides a reasonable basis for our opinion.
In our opinion, the financial statements referred to above present fairly, in all material respects, the consolidated financial position of Procera Networks, Inc., at December 31, 2012, and the consolidated results of its operations and its cash flows for the year ended December 31, 2012, in conformity with U.S. generally accepted accounting principles. Also, in our opinion, the related financial statement schedule, when considered in relation to the basic financial statements taken as a whole, presents fairly in all material respects the information set forth therein.
We also have audited, in accordance with the standards of the Public Company Accounting Oversight Board (United States), Procera Networks, Inc.'s internal control over financial reporting as of December 31, 2012, based on criteria established in Internal Control-Integrated Framework issued by the Committee of Sponsoring Organizations of the Treadway Commission and our report dated March 14, 2013 expressed an unqualified opinion thereon.
/s/ Ernst & Young LLP
Redwood City, California
March 14, 2013
REPORT OF INDEPENDENT REGISTERED PUBLIC ACCOUNTING FIRM
To the Board of Directors and Stockholders
Procera Networks, Inc.
We have audited the accompanying consolidated balance sheet of Procera Networks, Inc. (the “Company”) as of December 31, 2011, and the related consolidated statements of operations, comprehensive income (loss), stockholders’ equity and cash flows for the fiscal years ended December 31, 2011 and 2010. Our audits also included the financial statement schedule as of December 31, 2011 and 2010 listed in the accompanying index at Item 15(b)2. These consolidated financial statements and financial statement schedule are the responsibility of the Company’s management. Our responsibility is to express an opinion on these consolidated financial statements and financial statement schedule based on our audits.
We conducted our audits in accordance with the standards of the Public Company Accounting Oversight Board (United States). Those standards require that we plan and perform the audit to obtain reasonable assurance about whether the financial statements are free of material misstatement. An audit includes examining, on a test basis, evidence supporting the amounts and disclosures in the financial statements. An audit also includes assessing the accounting principles used and significant estimates made by management, as well as evaluating the overall financial statement presentation. We believe that our audits provide a reasonable basis for our opinion.
In our opinion, the consolidated financial statements referred to above present fairly, in all material respects, the financial position of Procera Networks, Inc. as of December 31, 2011, and the results of its operations and its cash flows for each of the years in the two-year period ended December 31, 2011, in conformity with generally accepted accounting principles in the United States. Also in our opinion, the related financial statement schedule as of December 31, 2011 and 2010 present fairly, in all material respects, the information set therein when considered in relation to the basic consolidated financial statements.
/s/ PMB Helin Donovan, LLP
PMB Helin Donovan, LLP
San Francisco, California
March 15, 2012
PROCERA NETWORKS, INC.
CONSOLIDATED BALANCE SHEETS
(in thousands, except par value)
| | | December 31, | |
| | | 2012 | | | 2011 | |
| | | | | | | |
| ASSETS | | | | | | |
| Current assets: | | | | | | |
| Cash and cash equivalents | | $ | 30,933 | | | $ | 23,900 | |
| Short-term investments | | | 100,762 | | | | 13,504 | |
| Accounts receivable, net of allowance of $96 and $98 at December 31, 2012 and 2011, respectively | | | 16,603 | | | | 11,403 | |
| Inventories, net | | | 11,240 | | | | 7,625 | |
| Prepaid expenses and other | | | 2,012 | | | | 938 | |
| Total current assets | | | 161,550 | | | | 57,370 | |
| | | | | | | | | |
| Property and equipment, net | | | 4,474 | | | | 1,806 | |
| Goodwill | | | 960 | | | | 960 | |
| Other non-current assets | | | 54 | | | | 20 | |
| Total assets | | $ | 167,038 | | | $ | 60,156 | |
| | | | | | | | | |
| LIABILITIES AND STOCKHOLDERS' EQUITY | | | | | | | | |
| Current liabilities: | | | | | | | | |
| Accounts payable | | $ | 5,453 | | | $ | 3,366 | |
| Deferred revenue | | | 6,953 | | | | 5,505 | |
| Accrued liabilities | | | 4,949 | | | | 3,845 | |
| Total current liabilities | | | 17,355 | | | | 12,716 | |
| | | | | | | | | |
| Non-current liabilities: | | | | | | | | |
| Deferred revenue | | | 2,878 | | | | 873 | |
| Total liabilities | | | 20,233 | | | | 13,589 | |
| | | | | | | | | |
| Commitments and contingencies (Note 9) | | | | | | | | |
| | | | | | | | | |
| Stockholders' equity: | | | | | | | | |
| Preferred stock, $0.001 par value; 15,000 shares authorized: none issued and outstanding | | | - | | | | - | |
| Common stock, $0.001 par value; 32,500 shares authorized; 19,696 and 14,628 shares issued and outstanding at December 31, 2012 and 2011, respectively | | | 20 | | | | 15 | |
| Additional paid-in capital | | | 199,793 | | | | 105,205 | |
| Accumulated other comprehensive loss | | | (76 | ) | | | (390 | ) |
| Accumulated deficit | | | (52,932 | ) | | | (58,263 | ) |
| Total stockholders' equity | | | 146,805 | | | | 46,567 | |
| Total liabilities and stockholders' equity | | $ | 167,038 | | | $ | 60,156 | |
The accompanying notes are an integral part of these consolidated financial statements.
PROCERA NETWORKS, INC.
CONSOLIDATED STATEMENTS OF OPERATIONS
(in thousands, except per share data)
| | | Year Ended December 31, | |
| | | 2012 | | | 2011 | | | 2010 | |
| | | | | | | | | | |
| Sales: | | | | | | | | | |
| Product sales | | $ | 47,723 | | | $ | 37,450 | | | $ | 15,825 | |
| Support sales | | | 11,904 | | | | 6,954 | | | | 4,498 | |
| Total sales | | | 59,627 | | | | 44,404 | | | | 20,323 | |
| Cost of sales: | | | | | | | | | | | | |
| Product cost of sales | | | 17,720 | | | | 17,358 | | | | 8,313 | |
| Support cost of sales | | | 1,749 | | | | 723 | | | | 500 | |
| Total cost of sales | | | 19,469 | | | | 18,081 | | | | 8,813 | |
| | | | | | | | | | | | | |
| Gross profit | | | 40,158 | | | | 26,323 | | | | 11,510 | |
| | | | | | | | | | | | | |
| Operating expenses: | | | | | | | | | | | | |
| Research and development | | | 7,472 | | | | 4,647 | | | | 3,305 | |
| Sales and marketing | | | 18,158 | | | | 12,026 | | | | 6,855 | |
| General and administrative | | | 9,223 | | | | 5,707 | | | | 4,087 | |
| Total operating expenses | | | 34,853 | | | | 22,380 | | | | 14,247 | |
| | | | | | | | | | | | | |
| Income (loss) from operations | | | 5,305 | | | | 3,943 | | | | (2,737 | ) |
| | | | | | | | | | | | | |
| Interest and other income (expense): | | | | | | | | | | | | |
| Interest income | | | 362 | | | | 73 | | | | 18 | |
| Interest and other expense | | | (213 | ) | | | (216 | ) | | | (165 | ) |
| Total other income (expense) | | | 149 | | | | (143 | ) | | | (147 | ) |
| | | | | | | | | | | | | |
| Income (loss) before income taxes | | | 5,454 | | | | 3,800 | | | | (2,884 | ) |
| Income tax provision | | | 123 | | | | 45 | | | | 10 | |
| Net income (loss) | | $ | 5,331 | | | $ | 3,755 | | | $ | (2,894 | ) |
| | | | | | | | | | | | | |
| Net income (loss) per share - basic | | $ | 0.30 | | | $ | 0.29 | | | $ | (0.27 | ) |
| Net income (loss) per share - diluted | | $ | 0.29 | | | $ | 0.28 | | | $ | (0.27 | ) |
| | | | | | | | | | | | | |
| Shares used in computing net income (loss) per share: | | | | | | | | | | | | |
| Basic | | | 17,842 | | | | 12,932 | | | | 10,898 | |
| Diluted | | | 18,337 | | | | 13,219 | | | | 10,898 | |
The accompanying notes are an integral part of these consolidated financial statements.
PROCERA NETWORKS, INC.
CONSOLIDATED STATEMENTS OF COMPREHENSIVE INCOME (LOSS)
(in thousands)
| | | Year Ended December 31, | |
| | | 2012 | | | 2011 | | | 2010 | |
| | | | | | | | | | |
| Net income (loss) | | $ | 5,331 | | | $ | 3,755 | | | $ | (2,894 | ) |
| Unrealized gain (loss) on short-term investments, net of tax | | | 21 | | | | (1 | ) | | | - | |
| Foreign currency translation adjustments, net of tax | | | 293 | | | | (57 | ) | | | (63 | ) |
| Other comprehensive income (loss) | | | 314 | | | | (58 | ) | | | (63 | ) |
| Comprehensive income (loss) | | $ | 5,645 | | | $ | 3,697 | | | $ | (2,957 | ) |
The accompanying notes are an integral part of these consolidated financial statements.
PROCERA NETWORKS, INC.
CONSOLIDATED STATEMENTS OF STOCKHOLDERS’ EQUITY
(in thousands)
| | | Common Stock | | | Additional Paid-In | | | Accumulated Other Comprehensive Income | | | Accumulated | | | Total Stockholders’ | |
| | | Shares | | | Amount | | | Capital | | | (Loss) | | | Deficit | | | Equity | |
| Balances at December 31, 2009 | | | 9,408 | | | $ | 9 | | | $ | 67,899 | | | $ | (269 | ) | | $ | (59,124 | ) | | $ | 8,515 | |
| Net loss | | | | | | | | | | | | | | | - | | | | (2,894 | ) | | | (2,894 | ) |
| Other comprehensive loss | | | | | | | | | | | | | | | (63 | ) | | | - | | | | (63 | ) |
| Exercise of stock options | | | 50 | | | | - | | | | 311 | | | | - | | | | - | | | | 311 | |
| Non-cash rescission of shares | | | (3 | ) | | | - | | | | - | | | | - | | | | - | | | | - | |
| Stock-based compensation | | | - | | | | - | | | | 1,414 | | | | - | | | | - | | | | 1,414 | |
| Issuance of common stock in registered placement, net of issuance costs | | | 1,800 | | | | 2 | | | | 6,469 | | | | - | | | | - | | | | 6,471 | |
| Issuance of restricted stock | | | 60 | | | | - | | | | - | | | | - | | | | - | | | | - | |
| Balances at December 31, 2010 | | | 11,315 | | | | 11 | | | | 76,093 | | | | (332 | ) | | | (62,018 | ) | | | 13,754 | |
| Net income | | | | | | | | | | | | | | | - | | | | 3,755 | | | | 3,755 | |
| Other comprehensive loss | | | | | | | | | | | | | | | (58 | ) | | | - | | | | (58 | ) |
| Exercise of stock options | | | 110 | | | | 1 | | | | 750 | | | | - | | | | - | | | | 751 | |
| Exercise of warrants | | | 100 | | | | - | | | | 183 | | | | - | | | | - | | | | 183 | |
| Stock-based compensation | | | - | | | | - | | | | 1,725 | | | | - | | | | - | | | | 1,725 | |
| Issuance of common stock in registered placement, net of issuance costs | | | 3,027 | | | | 3 | | | | 26,454 | | | | - | | | | - | | | | 26,457 | |
| Issuance of restricted stock | | | 76 | | | | - | | | | - | | | | - | | | | - | | | | - | |
| Balances at December 31, 2011 | | | 14,628 | | | | 15 | | | | 105,205 | | | | (390 | ) | | | (58,263 | ) | | | 46,567 | |
| Net income | | | | | | | | | | | | | | | - | | | | 5,331 | | | | 5,331 | |
| Other comprehensive income | | | | | | | | | | | | | | | 314 | | | | - | | | | 314 | |
| Exercise of stock options | | | 372 | | | | - | | | | 3,756 | | | | - | | | | - | | | | 3,756 | |
| Exercise of warrants | | | 44 | | | | - | | | | 27 | | | | - | | | | - | | | | 27 | |
| Stock-based compensation | | | - | | | | - | | | | 2,784 | | | | - | | | | - | | | | 2,784 | |
| Issuance of common stock in registered placement, net of issuance costs | | | 4,500 | | | | 5 | | | | 88,021 | | | | - | | | | - | | | | 88,026 | |
| Issuance of restricted stock | | | 152 | | | | - | | | | - | | | | - | | | | - | | | | - | |
| Balances at December 31, 2012 | | | 19,696 | | | $ | 20 | | | $ | 199,793 | | | $ | (76 | ) | | $ | (52,932 | ) | | $ | 146,805 | |
The accompanying notes are an integral part of these consolidated financial statements.
PROCERA NETWORKS, INC.
CONSOLIDATED STATEMENTS OF CASH FLOWS
(in thousands)
| | | Year Ended December 31, | |
| | | 2012 | | | 2011 | | | 2010 | |
| Cash flows from operating activities: | | | | | | | | | |
| Net income (loss) | | $ | 5,331 | | | $ | 3,755 | | | $ | (2,894 | ) |
| Adjustments to reconcile net income (loss) to net cash provided by (used in) operating activities: | | | | | | | | | | | | |
| Compensation related to stock-based awards | | | 2,784 | | | | 1,725 | | | | 1,414 | |
| Amortization of premium on investments | | | 847 | | | | 106 | | | | - | |
| Depreciation | | | 910 | | | | 445 | | | | 477 | |
| Provision for bad debts | | | 6 | | | | - | | | | 34 | |
| Provision for excess and obsolete inventory | | | 723 | | | | 381 | | | | 339 | |
| Loss on retirement of property and equipment | | | - | | | | 17 | | | | - | |
| Changes in assets and liabilities: | | | | | | | | | | | | |
| Accounts receivable | | | (5,037 | ) | | | (255 | ) | | | (2,138 | ) |
| Inventories | | | (4,245 | ) | | | (5,453 | ) | | | (833 | ) |
| Prepaid expenses and other current assets | | | (1,129 | ) | | | (322 | ) | | | 190 | |
| Accounts payable | | | 2,604 | | | | 938 | | | | 925 | |
| Accrued liabilities | | | 1,039 | | | | 1,238 | | | | 281 | |
| Deferred revenue | | | 3,324 | | | | 2,016 | | | | 2,151 | |
| Net cash provided by (used in) operating activities | | | 7,157 | | | | 4,591 | | | | (54 | ) |
| | | | | | | | | | | | | |
| Cash flows from investing activities: | | | | | | | | | | | | |
| Purchase of property and equipment | | | (3,976 | ) | | | (960 | ) | | | (714 | ) |
| Purchase of short-term investments | | | (117,807 | ) | | | (17,927 | ) | | | - | |
| Sales of short-term investments | | | 7,001 | | | | 2,716 | | | | - | |
| Maturities of short-term investments | | | 22,695 | | | | 1,600 | | | | - | |
| Net cash used in investing activities | | | (92,087 | ) | | | (14,571 | ) | | | (714 | ) |
| | | | | | | | | | | | | |
| Cash flows from financing activities: | | | | | | | | | | | | |
| Proceeds from issuance of common stock | | | 88,026 | | | | 26,457 | | | | 6,471 | |
| Proceeds from exercise of stock options | | | 3,756 | | | | 958 | | | | 103 | |
| Proceeds from exercise of warrants | | | 27 | | | | 183 | | | | - | |
| Proceeds from line of credit | | | - | | | | 717 | | | | 2,741 | |
| Payments on notes payable | | | - | | | | - | | | | (500 | ) |
| Repayments on line of credit | | | - | | | | (2,435 | ) | | | (2,939 | ) |
| Net cash provided by financing activities | | | 91,809 | | | | 25,880 | | | | 5,876 | |
| | | | | | | | | | | | | |
| Effect of exchange rates on cash and cash equivalents | | | 154 | | | | 124 | | | | (424 | ) |
| | | | | | | | | | | | | |
| Net increase in cash and cash equivalents | | | 7,033 | | | | 16,024 | | | | 4,684 | |
| | | | | | | | | | | | | |
| Cash and cash equivalents, beginning of period | | | 23,900 | | | | 7,876 | | | | 3,192 | |
| | | | | | | | | | | | | |
| Cash and cash equivalents, end of period | | $ | 30,933 | | | $ | 23,900 | | | $ | 7,876 | |
| | | | | | | | | | | | | |
| SUPLEMENTAL CASH FLOW INFORMATION: | | | | | | | | | | | | |
| Cash paid for income taxes | | $ | 61 | | | $ | 50 | | | $ | 10 | |
| Cash paid for interest | | $ | 10 | | | $ | 70 | | | $ | 88 | |
| Receivable for option exercise | | $ | - | | | $ | - | | | $ | 208 | |
The accompanying notes are an integral part of these consolidated financial statements.
PROCERA NETWORKS, INC.
NOTES TO CONSOLIDATED FINANCIAL STATEMENTS
| 1. | Description of Business |
Procera Networks, Inc. (“Procera” or the ”Company”), is a leading provider of Intelligent Policy Enforcement (“IPE”), solutions based on Deep Packet Inspection technology, that enable mobile and broadband network operators and entities managing private networks including higher education institutions, businesses and government entities (collectively referred to as network operators) to gain enhanced visibility into, and control of, their networks and to create and deploy new services for their end user subscribers. The Company sells its products through its direct sales force, resellers, distributors and system integrators in the Americas, Asia Pacific and Europe.
Procera was incorporated in 2002 and currently trades on the NASDAQ Global Select Market under the trading symbol “PKT”. Prior to December 29, 2011, the Company’s common stock traded on the NYSE Amex Equities exchange under the same trading symbol.
| 2. | Summary of Significant Accounting Policies |
Basis of Presentation
The consolidated financial statements include the accounts of Procera and its wholly owned subsidiaries. All significant intercompany balances and transactions have been eliminated. We have prepared the accompanying consolidated financial statements in accordance with accounting principles generally accepted in the United States of America and pursuant to the rules and regulations of the Securities and Exchange Commission (“SEC”).
Use of Estimates
The preparation of consolidated financial statements in conformity with U.S. generally accepted accounting principles requires management to make estimates and judgments that affect the reported amounts of assets, liabilities, revenues and expenses and related disclosures of contingent assets and liabilities. Actual results could differ from those estimates. The accounting estimates that require management’s most significant and subjective judgments include the recognition of revenue and allowance for doubtful accounts, assessment of the recoverability of long-lived assets and goodwill, valuation and recognition of stock-based compensation, warranty estimates, and accounting for income taxes.
Fair Value of Financial Instruments
The carrying amounts of certain of the Company’s financial instruments including cash and cash equivalents, short-term investments, accounts receivable, accounts payable, and accrued liabilities approximate fair value due to their short maturities.
Concentration of Risk
The financial instruments utilized by the Company that potentially subject the Company to a concentration of credit risk consist of cash and cash equivalents, short-term investments and accounts receivable. Cash and cash equivalents are deposited in demand and money market accounts in major financial institutions in the United States, Sweden and Australia. Accounts at financial institutions in the United States are guaranteed by the Federal Deposit Insurance Corporation (“FDIC”) up to certain limits. At times, the Company’s deposits or investments may exceed federally insured limits. At December 31, 2012 and 2011, the Company had approximately $30.7 million and $5.7 million, respectively, at financial institutions in excess of FDIC insured limits. The Company has not experienced any losses in such accounts.
The Company’s investment policies limit investments to those that are low risk and restrict placement of these investments to issuers evaluated as creditworthy. As of December 31, 2012, the Company's investments were composed of money market funds, U.S. agency securities, certificates of deposit, commercial paper and corporate bonds.
The Company’s sales have at times been concentrated with certain large customers. The Company also sells to a geographically diverse base of customers. For the year ended December 31, 2012, revenue from one customer, Shaw Communications, Inc., represented 16% of net revenues. At December 31, 2012, three customers represented 14%, 12% and 12% of total accounts receivable, and 72% of accounts receivable were due from customers outside of the United States (see Note 15). For the year ended December 31, 2011, revenue from two customers, Shaw Communications and Jet Infosystems, represented 27% and 12% of net revenues, respectively. At December 31, 2011, two customers represented 45% and 20% of total accounts receivable, and 37% of accounts receivable were due from customers outside of the United States. For the year ended December 31, 2010, revenues from one customer, Cox Communications, Inc., represented 11% of net revenues. The Company maintains an allowance for uncollectible accounts receivable based upon expected collectability of all accounts receivable. The Company performs ongoing credit evaluations of certain customers’ financial condition and generally requires no collateral from its customers.
The Company is dependent on a limited number of third-party contract manufacturers and other suppliers for its hardware equipment. The Company is dependent on the ability of these suppliers to provide products on a timely basis and on favorable pricing terms. The loss of certain principal suppliers or a significant reduction in product availability from principal suppliers could have a material adverse effect on the Company. The Company believes that its relationships with its suppliers are satisfactory; and, the Company has not historically experienced inadequate supply issues from its contract manufacturer or other parts suppliers.
Cash and Cash Equivalents
The Company considers all highly liquid investments with original or remaining maturities of three months or less from the date of purchase to be cash equivalents.
Investments
The goals of the Company's investment policy are preservation of capital and maintenance of liquidity. The Company invests in instruments that are of high credit quality, primarily rated A/A2, and have a maturity of up to twelve months. Investments that have a remaining maturity of greater than three months at the date of purchase and an effective maturity of less than one year are classified as short-term investments.
Investments are carried at fair value based upon quoted market prices at the end of the reporting period where available. As of December 31, 2012, all investments were classified as available-for-sale with unrealized gains and losses recorded as a separate component of comprehensive income. The specific identification method is used to determine the cost of securities disposed of, with realized gains and losses reflected in interest and other income (expense).
The Company reviews its investments for impairment on a quarterly basis. For investments with an unrealized loss, the factors considered in the review include the credit quality of the issuer, the duration that the fair value has been less than the adjusted cost basis, severity of impairment, reason for the decline in value and potential recovery period, the financial condition and near-term prospects of the investees, and whether the Company would be required to sell an investment due to liquidity or contractual reasons before its anticipated recovery.
Allowance for Doubtful Accounts
Trade accounts receivable are recorded at the invoiced amount. The Company maintains an allowance for doubtful accounts for estimated losses resulting from the inability of its customers to make required payments. The Company considers factors such as historical experience, credit quality, age of the accounts receivable balances, geographic or country-specific risks and economic conditions that may affect a customer’s ability to pay. The allowance for doubtful accounts is reviewed regularly and adjusted if necessary based on management’s assessment of a customer’s ability to pay. Individual accounts receivable are written off when all collection efforts have been exhausted.
Inventory
Inventories consist primarily of finished goods and are stated at the lower of cost (on a first-in, first-out basis) or market. The Company records inventory write-downs for excess and obsolete inventories based on historical usage and forecasted demand, as well as determining what inventory, if any, is not saleable. Factors which could cause its forecasted demand to prove inaccurate include the Company’s reliance on indirect sales channels and the variability of its sales cycle; the potential of announcements of new products or enhancements to replace or shorten the life cycle of current products, or cause customers to defer their purchases; and the potential of new or alternative technologies achieving widespread market acceptance and thereby rendering the Company’s existing products obsolete. If future demand or market conditions are less favorable than projections, additional inventory write-downs may be required and would be reflected in cost of sales in the period the revision is made.
Property and Equipment
Property and equipment are stated at cost, less accumulated depreciation and amortization. Depreciation is calculated using the straight-line method over the estimated useful lives of the assets. Leasehold improvements are amortized using the straight-line method over the estimated useful lives of the improvements or the term of the lease, whichever is shorter. Whenever assets are retired or otherwise disposed of, the cost and related accumulated depreciation are removed from the accounts, and any resulting gain or loss is recognized in income for the period. The cost of maintenance and repairs is expensed as incurred; significant improvements are capitalized.
The estimated service lives of property and equipment are principally as follows:
| Leasehold improvements | Lesser of useful life or lease term |
| Machinery, office and computer equipment | 2–5 years |
| Computer software | 3 years |
| Transportation vehicles | 3–5 years |
Goodwill
Goodwill has been measured as the excess of the cost of acquisition over the amount assigned to tangible and identifiable intangible assets acquired less liabilities assumed. The Company reviews goodwill for impairment annually during the fourth quarter of the year or more frequently if an event or circumstance indicates that an impairment loss has occurred. The identification and measurement of goodwill impairment involves the estimation of fair value at the Company’s reporting unit level. The Company operates in one segment, which is considered to be the sole reporting unit, and therefore, goodwill was tested at the enterprise level.
Goodwill impairment is determined using a two-step process. The first step of the goodwill impairment test is used to identify potential impairment by comparing the fair value of a reporting unit with its carrying amount, including goodwill. If the fair value of a reporting unit exceeds its carrying amount, goodwill of the reporting unit is considered not impaired and the second step of the impairment test is unnecessary. If the carrying amount of a reporting unit exceeds its fair value, the second step of the goodwill impairment test is performed to measure the amount of impairment loss, if any.
The second step of the goodwill impairment test compares the implied fair value of the reporting unit’s goodwill with the carrying amount of that goodwill. If the carrying amount of the reporting unit’s goodwill exceeds the implied fair value of that goodwill, an impairment loss is recognized in an amount equal to that excess. The implied fair value of goodwill is determined in the same manner as the amount of goodwill recognized in a business combination. That is, the fair value of the reporting unit’s assets and liabilities (including any unrecognized intangible assets) are determined as if the reporting unit had been acquired in a business combination and the fair value of the reporting unit was the purchase price paid to acquire the reporting unit.
No goodwill impairment charges were recorded in the years ended December 31, 2012, 2011, and 2010.
Accounting for long-lived assets
The Company reviews its long-lived assets including property and equipment and purchased intangible assets for impairment whenever events or changes in circumstances indicate that the carrying amount may not be recoverable. Examples of such events could include a significant disposal of a portion of such assets, an adverse change in the market involving the business employing the related asset, a significant decrease in the benefits realized from an acquired business, difficulties or delays in integrating the business or a significant change in the operation or use of an asset or acquired business.
An impairment test involves a comparison of undiscounted cash flows from the use of the asset to the carrying value of the asset. Measurement of an impairment loss is based on the amount that the carrying value of the asset exceeds its fair value. No impairment losses were incurred in the periods presented.
Product Warranty
The Company warrants its products against material defects for a specific period of time, generally twelve months. The Company provides for the estimated future costs of warranty obligations in cost of sales when the related revenue is recognized. The accrued warranty costs represent the best estimate at the time of sale of the total costs that the Company expects to incur to repair or replace product parts, which fail while still under warranty. The amount of accrued estimated warranty costs are primarily based on current information on repair costs. The Company assesses the adequacy of the recorded warranty obligation quarterly and makes adjustments to the obligation based on actual experience and changes in estimated future rates of return.
Commitments and Contingencies
Certain conditions may exist on the date the financial statements are issued, which may result in a loss to the Company but which will only be resolved when one or more future events occur or fail to occur. The Company’s management and its legal counsel assess such contingent liabilities, and such assessment inherently involves an exercise of judgment. In assessing loss contingencies related to legal proceedings that are pending against the Company or unasserted claims that may result in such proceedings, the Company and its legal counsel evaluates the perceived merits of any legal proceedings or unasserted claims as well as the perceived merits of the amount of relief sought or expected to be sought therein.
If the assessment of a contingency indicates that it is probable that a material loss has been incurred and the amount of the liability can be estimated, then the estimated liability would be accrued in the Company’s financial statements. If the assessment indicates that a potentially material loss contingency is not probable, but is reasonably possible, or is probable but cannot be estimated, then the nature of the contingent liability, together with an estimate of the range of possible loss if determinable and material, would be disclosed.
Loss contingencies considered remote are generally not disclosed unless they involve guarantees, in which case the nature of the guarantee would be disclosed.
Stock and Warrants Issued to Third Parties
If none of the Company’s stock or warrant agreements with third parties has a disincentive for nonperformance, the Company records a charge for the fair value of the stock and the portion of the warrants earned from the point in time when vesting of the stock or warrants becomes probable.
Derivatives
A derivative is an instrument whose value is “derived” from an underlying instrument or index such as a future, forward, swap, option contract, or other financial instrument with similar characteristics, including certain derivative instruments embedded in other contracts (“embedded derivatives”), and for hedging activities. As a matter of policy, the Company does not invest in separable financial derivatives or engage in hedging transactions.
Derivatives and Embedded Derivatives, if applicable, are measured at fair value and marked to market through earnings. The pricing models used for valuation often incorporate significant estimates and assumptions, which may impact the level of precision in the financial statements.
Stock-Based Compensation
The Company accounts for all share-based payment transactions using a fair-value based measurement method. The Company calculates stock option-based compensation by estimating the fair value of each option as of its date of grant using the Black-Scholes option pricing model. The fair value of restricted stock grants is calculated based upon the closing stock price of the Company’s common stock on the date of the grant. These amounts are expensed over the requisite service period of each award, which is the vesting period, using the straight-line attribution method. Compensation expense is recognized only for those awards that are expected to vest, and as such, amounts have been reduced by estimated forfeitures. The Company has historically issued stock options and vested and nonvested stock grants to employees and outside directors whose only condition for vesting has been continued employment or service during the related vesting or restriction period.
Revenue Recognition
In October 2009, the Financial Accounting Standards Board (“FASB”), issued Accounting Standards Update (“ASU”), No. 2009-13, “Multiple-Deliverable Revenue Arrangements” and ASU No. 2009-14, “Certain Revenue Arrangements that Include Software Elements.” The Company adopted the new guidance on a prospective basis for new or materially modified revenue arrangements as of January 1, 2011. The adoption of this guidance did not have a material impact on the Company’s financial statements and is not expected to have a material impact in the future.
The Company’s most common sale involves the integration of software and a hardware appliance, where the hardware and software work together to deliver the essential functionality of the product. The Company recognizes product revenue when all of the following have occurred: (1) the Company has entered into a legally binding arrangement with a customer resulting in the existence of persuasive evidence of an arrangement; (2) delivery has occurred, evidenced when product title transfers to the customer; (3) customer payment is deemed fixed or determinable and free of contingencies and significant uncertainties; and (4) collection is probable.
Product revenue consists of revenue from sales of appliances and software licenses. Product sales include a perpetual license to the Company’s software that is essential to the functionality of the hardware, and on occasion include licenses to additional software. Shipping charges billed to customers are included in product revenue and the related shipping costs are included in cost of product revenue. Virtually all sales include post-contract support (“PCS”), services (included in support revenue) which consist of software updates and customer support. Software updates provide customers access to a constantly growing library of electronic Internet traffic identifiers (signatures) and rights to non-specific software product upgrades, maintenance releases and patches released during the term of the support period. Support includes Internet access to technical content, telephone and Internet access to technical support personnel and hardware support.
Receipt of a customer purchase order is the primary method of determining that persuasive evidence of an arrangement exists.
Delivery generally occurs when a product is delivered to a common carrier F.O.B. shipping point. However, product revenue based on channel partner purchase orders are recorded based on sell-through to the end user customers until such time as the Company has established significant experience with the channel partner’s ability to complete the sales process, which requires judgment. Additionally, when the Company introduces new products for which there is no historical evidence of acceptance history, revenue is recognized on the basis of end-user acceptance until such history has been established.
Fees are typically considered to be fixed or determinable at the inception of an arrangement, generally based on specific products and quantities to be delivered. Substantially all of the Company’s contracts do not include rights of return or acceptance provisions. To the extent that agreements contain such terms, the Company recognizes revenue once the acceptance provisions or right of return lapses. Payment terms to customers generally range from net 30 to 90 days. In the event payment terms are provided that differ from the Company’s standard business practices, the fees are deemed to not be fixed or determinable and revenue is recognized when the payments become due, provided the remaining criteria for revenue recognition have been met.
The Company assesses the ability to collect from its customers based on a number of factors, including credit worthiness of the customer and past transaction history of the customer. If the customer is not deemed credit worthy, the Company defers all revenue from the arrangement until payment is received and all other revenue recognition criteria have been met.
Customer orders normally contain multiple items. The initial product delivery consists of the hardware and software elements, and these elements have standalone value to the customer. Through the year ended December 31, 2012, in virtually all of the Company’s contracts, the only elements that remained undelivered at the time of product delivery were PCS services. Prior to January 1, 2011, the majority of the Company’s transactions were within the scope of the software revenue recognition guidance. The Company accordingly recognized revenue for delivered items using the residual method, after allocating revenue to PCS services based on vendor specific objective evidence of fair value (“VSOE”).
Under the revenue recognition guidance discussed in the first paragraph above, the Company allocates revenue to each element in an arrangement based on relative selling price using a selling price hierarchy. The selling price for a deliverable is based on its VSOE if available, third party evidence (“TPE”), if VSOE is not available, or the Company’s best estimate of selling price (“ESP”), if neither VSOE nor TPE is available. The maximum revenue recognized on a delivered element is limited to the amount that is not contingent upon the delivery of additional items. In arrangements that include non-essential software (“software deliverables”), revenue is allocated to each separate unit of accounting for the non-software deliverables and to the software deliverables as a group using the relative selling prices of each of the deliverables in the arrangement. Revenue allocated to the software deliverables as a group is then allocated first to the PCS services based on VSOE, and then to the software, using the residual method under the software revenue recognition guidance.
The Company determines VSOE for PCS based on the rate charged to customers based upon renewal pricing for PCS. Each contract or purchase order entered into includes a stated rate for PCS. The renewal rate is generally equal to the stated rate in the original contract. The Company has a history of such renewals, the vast majority of which are at the stated renewal rate on a customer by customer basis. PCS revenue is recognized ratably over the life of the contract. A small portion of service revenue is derived from providing training on products and the Company uses the completed-contract method to recognize such revenue.
As the hardware and software products are rarely sold separately, the Company generally does not have VSOE for these products, and TPE is not available. The Company determines the ESP for hardware and software deliverables considering internal factors such as discounting and pricing policies, and external factors such as market conditions in different geographies and competitive positioning.
In certain contracts, billing terms may be agreed upon based on performance milestones such as the execution of a measurement test, a partial delivery or the completion of a specified service. Payments received before the unconditional acceptance of a specific set of deliverables are recorded as deferred revenue until the conditional acceptance has been waived.
Income Taxes
The Company accounts for income taxes under an asset and liability approach. This process involves calculating the temporary and permanent differences between the carrying amounts of the assets and liabilities for financial reporting purposes and the amounts used for income tax purposes. The temporary differences result in deferred tax assets and liabilities, which are recorded on the Company’s consolidated balance sheets. The Company must assess the likelihood that its deferred tax assets will be recovered from future taxable income and, to the extent the Company believes that recovery is not likely, the Company must establish a valuation allowance. Changes in the Company’s valuation allowance in a period are recorded through the income tax provision on the consolidated statements of operations. The impact of an uncertain income tax position on the income tax return is recognized at the largest amount that is more-likely-than-not to be sustained upon audit by the relevant taxing authority. An uncertain income tax position will not be recognized if it has less than a 50% likelihood of being sustained.
Shipping and Handling Costs
The Company includes shipping and handling costs associated with inbound and outbound freight in costs of goods sold.
Research and Development
Research and development expenses include internal and external costs. Internal costs include salaries and employment related expenses, prototype materials, initial product certifications, equipment costs and allocated facility costs. External expenses consist of costs associated with outsourced software development activities.
Development costs incurred in the research and development of new products, other than software, and enhancements to existing products are expensed as incurred. Costs for the development of new software products and enhancements to existing products are expensed as incurred until technological feasibility has been established, at which time any additional development costs would be capitalized. To date, the Company's software has been available for general release shortly after being determined to be technologically feasible, which the Company defines as a working prototype. Accordingly, those costs have not been material.
Advertising Costs
Advertising expenses consist primarily of costs incurred in the design, development and printing of Company literature and marketing materials. Advertising costs are expensed as incurred. Advertising expenses were not significant for the years ended December 31, 2012, 2011 and 2010.
Comprehensive Income (Loss)
Comprehensive income (loss) consists of net income and other gains and losses affecting stockholders’ equity that, under generally accepted accounting principles are excluded from net income. For the Company, such items consist of unrealized gains and losses on available-for-sale short-term investments and foreign currency translation gains and losses. Accumulated other comprehensive income (loss) is presented in the accompanying consolidated balance sheets.
Foreign Operations
The accompanying balance sheets contain certain recorded Company assets in foreign countries, primarily Sweden and Australia. Although these countries are considered economically stable and the Company has experienced no notable burden from foreign exchange transactions, export duties, or government regulations, it is always possible that unanticipated events in foreign countries could have a material adverse effect on the Company’s operations.
Foreign Currency Translation
The functional currency of the Company’s foreign subsidiaries is the local currency. The revenue and expenses of such subsidiaries have been translated into U.S. dollars at average exchange rates prevailing during the period. Assets and liabilities have been translated at the rates of exchange on the balance-sheet date. The resulting cumulative translation adjustments are reported in comprehensive income (loss). Currency transaction gains and losses are recognized in current operations.
Business Segments
The Company operates in one reportable operating segment. Management uses one measurement of profitability and does not segregate its business for internal reporting (see Note 15).
| 3. | Recent Accounting Pronouncements |
In February 2013, the FASB issued ASU No. 2013-02, “Comprehensive Income (Topic 220): Reporting of Amounts Reclassified Out of Accumulated Other Comprehensive Income,” (“ASU 2013-02”). ASU 2013-02 finalizes the requirements of ASU 2011-05 that ASU 2011-12 deferred, clarifying how to report the effect of significant reclassifications out of accumulated other comprehensive income. ASU 2013-02 is to be applied prospectively. The Company does not anticipate that the adoption of this ASU will materially change the presentation of its consolidated financial statements.
In May 2011, the FASB issued ASU No. 2011-04, “Fair Value Measurement (Topic 820): Amendments to Achieve Common Fair Value Measurement and Disclosure Requirements in U.S. GAAP and International Financial Reporting Standards (“IFRS”).” The amendments in this ASU generally represent clarification of Topic 820, but also include instances where a particular principle or requirement for measuring fair value or disclosing information about fair value measurements has changed. This update results in common principles and requirements for measuring fair value and for disclosing information about fair value measurements in accordance with GAAP and IFRS. The amendments are effective for interim and annual periods beginning after December 15, 2011 and are to be applied prospectively. Early application is not permitted. The adoption of ASU 2011-04 did not have a material impact on the Company’s consolidated financial statements.
In June 2011, the FASB issued ASU 2011-05, “Comprehensive Income (Topic 220): Presentation of Comprehensive Income.” Specifically, the new guidance allows an entity to present components of net income or other comprehensive income in one continuous statement, referred to as the statement of comprehensive income, or in two separate, but consecutive statements. The new guidance eliminates the current option to report other comprehensive income and its components in the statement of changes in equity. While the new guidance changes the presentation of comprehensive income, there are no changes to the components that are recognized in net income or other comprehensive income under current accounting guidance. The new guidance is effective for fiscal years and interim periods beginning after December 15, 2011 and is to be applied retrospectively. The adoption of ASU 2011-05 did not have a material impact on the Company’s consolidated financial statements.
| 4. | Cash Equivalents and Short-term Investments |
The Company’s cash equivalents and short-term investments at December 31, 2012 are as follows (in thousands):
| | | Amortized Cost | | | Gross Unrealized Gains | | | Gross Unrealized Losses | | | Fair Value | |
| Money market funds | | $ | 13,505 | | | $ | - | | | $ | - | | | $ | 13,505 | |
| Commercial paper | | | 9,696 | | | | - | | | | - | | | | 9,696 | |
| U.S. agency securities | | | 51,276 | | | | 18 | | | | - | | | | 51,294 | |
| Corporate bonds | | | 34,751 | | | | 5 | | | | (5 | ) | | | 34,751 | |
| U.S. Government bonds | | | 5,019 | | | | 2 | | | | - | | | | 5,021 | |
| Total investments | | $ | 114,247 | | | $ | 25 | | | $ | (5 | ) | | $ | 114,267 | |
| | | | | | | | | | | | | | | | | |
| Reported as: | | | | | | | | | | | | | | | | |
| Cash equivalents | | $ | 13,505 | | | $ | - | | | $ | - | | | $ | 13,505 | |
| Short-term investments | | | 100,742 | | | | 25 | | | | (5 | ) | | | 100,762 | |
| Total | | $ | 114,247 | | | $ | 25 | | | $ | (5 | ) | | $ | 114,267 | |
The Company’s cash equivalents and short-term investments at December 31, 2011 are as follows (in thousands):
| | | Amortized Cost | | | Gross Unrealized Gains | | | Gross Unrealized Losses | | | Fair Value | |
| Money market funds | | $ | 9,388 | | | $ | - | | | $ | - | | | $ | 9,388 | |
| Certificate of deposit | | | 800 | | | | - | | | | (1 | ) | | | 799 | |
| Commercial paper | | | 3,247 | | | | - | | | | - | | | | 3,247 | |
| U.S. agency securities | | | 6,557 | | | | 3 | | | | - | | | | 6,560 | |
| Corporate bonds | | | 4,402 | | | | 1 | | | | (4 | ) | | | 4,399 | |
| Total investments | | $ | 24,394 | | | $ | 4 | | | $ | (5 | ) | | $ | 24,393 | |
| | | | | | | | | | | | | | | | | |
| Reported as: | | | | | | | | | | | | | | | | |
| Cash equivalents | | $ | 10,888 | | | $ | 1 | | | $ | - | | | $ | 10,889 | |
| Short-term investments | | | 13,506 | | | | 3 | | | | (5 | ) | | | 13,504 | |
| Total | | $ | 24,394 | | | $ | 4 | | | $ | (5 | ) | | $ | 24,393 | |
As of December 31, 2012, all investments were classified as available-for-sale with unrealized gains and losses recorded as a separate component of comprehensive income (loss). Cash equivalents consist of highly liquid investments with remaining maturities of three months or less at the date of purchase. Short-term investments have a remaining maturity of greater than three months at the date of purchase and an effective maturity of less than one year. None of our short-term investments have been at a continuous unrealized loss position for greater than 12 months.
The Company did not identify any investments that were other-than-temporarily impaired during the years ended December 31, 2012 and 2011.
The Company did not incur any material realized gains or losses in the year ended December 31, 2012, 2011 and 2010.
| 5. | Fair Value Measurements |
Fair value is the price that would be received from selling an asset or paid to transfer a liability in an orderly transaction between market participants at the measurement date. When determining fair value, the Company considers the principal or most advantageous market in which it would transact, and considers assumptions that market participants would use when pricing the asset or liability.
Fair Value Hierarchy
The three levels of inputs that may be used to measure fair value are as follows:
| | Level 1- | Quoted prices in active markets for identical assets or liabilities. |
| | Level 2- | Observable inputs other than Level 1 prices, such as quoted prices for similar assets or liabilities, quoted prices in markets with insufficient volume or infrequent transactions (less active markets), or model-derived valuations in which all significant inputs are observable or can be derived principally from or corroborated with observable market data for substantially the full term of the assets or liabilities. |
| | Level 3- | Unobservable inputs to the valuation methodology that are significant to the measurement of the fair value of assets or liabilities. |
The following tables represent the Company’s fair value hierarchy for its financial assets as of December 31, 2012 measured at fair value on a recurring basis (in thousands):
| | | Level 1 | | | Level 2 | | | Level 3 | | | Total | |
| Money market funds | | $ | 13,505 | | | $ | - | | | $ | - | | | $ | 13,505 | |
| Commercial paper | | | - | | | | 9,696 | | | | - | | | | 9,696 | |
| U.S. agency securities | | | - | | | | 56,315 | | | | - | | | | 56,315 | |
| Corporate bonds | | | - | | | | 34,751 | | | | - | | | | 34,751 | |
| Total assets measured at fair value | | $ | 13,505 | | | $ | 100,762 | | | $ | - | | | $ | 114,267 | |
The following tables represent the Company’s fair value hierarchy for its financial assets as of December 31, 2011 measured at fair value on a recurring basis (in thousands):
| | | Level 1 | | | Level 2 | | | Level 3 | | | Total | |
| Money market funds | | $ | 9,388 | | | $ | - | | | $ | - | | | $ | 9,388 | |
| Certificates of deposit | | | - | | | | 799 | | | | - | | | | 799 | |
| Commercial paper | | | - | | | | 3,247 | | | | - | | | | 3,247 | |
| U.S. agency securities | | | - | | | | 6,560 | | | | - | | | | 6,560 | |
| Corporate bonds | | | - | | | | 4,399 | | | | - | | | | 4,399 | |
| Total assets measured at fair value | | $ | 9,388 | | | $ | 15,005 | | | $ | - | | | $ | 24,393 | |
In general, and where applicable, the Company uses quoted market prices in active markets for identical assets to determine fair value. This pricing methodology applies to Level 1 investments which are comprised of money market funds. If quoted prices in active markets for identical assets are not available, then the Company uses quoted prices for similar assets or inputs other than quoted prices that are observable, either directly or indirectly. These investments are included in Level 2 and consist of certificates of deposit, commercial paper, U.S. agency securities and corporate bonds. U.S. agency securities and corporate bonds are valued at a consensus price, which is a weighted average price based on market prices from a variety of industry standard data providers used as inputs to a distribution-curve based algorithm. Certificates of deposit and commercial paper are valued using market prices where available, adjusting for accretion of the purchase price to face value at maturity.
During the year ended December 31, 2012, the Company did not have any transfers between Level 1 and Level 2 fair value instruments.
Inventory
Inventories are stated at the lower of cost, which approximates actual costs on a first in, first out basis, or market.
Inventories at December 31, 2012 and 2011 consisted of the following (in thousands):
| | | December 31, | |
| | | 2012 | | | 2011 | |
| Finished goods | | $ | 10,886 | | | $ | 7,386 | |
| Raw materials | | | 354 | | | | 239 | |
| Inventories, net | | $ | 11,240 | | | $ | 7,625 | |
Property and Equipment
The following is a summary of property and equipment as of December 31, 2012 and 2011 (in thousands):
| | | December 31, | |
| | | 2012 | | | 2011 | |
| Machinery and equipment | | $ | 6,300 | | | $ | 3,078 | |
| Computer equipment | | | 417 | | | | 316 | |
| Office furniture and equipment | | | 169 | | | | 68 | |
| Leasehold improvements | | | 117 | | | | 20 | |
| Software | | | 106 | | | | 7 | |
| Accumulated depreciation | | | (2,635 | ) | | | (1,683 | ) |
| Property and equipment, net | | $ | 4,474 | | | $ | 1,806 | |
Depreciation expense for the years ended December 31, 2012, 2011 and 2010 was $0.9 million, $0.4 million and $0.5 million, respectively.
Accrued Liabilities
Accrued liabilities at December 31, 2012 and 2011 consisted of the following (in thousands):
| | | December 31, | |
| | | 2012 | | | 2011 | |
| Payroll and related | | $ | 2,166 | | | $ | 1,668 | |
| Sales commissions | | | 1,112 | | | | 939 | |
| Warranty | | | 406 | | | | 565 | |
| Audit and legal services | | | 368 | | | | 181 | |
| Other | | | 897 | | | | 492 | |
| Total accrued liabilities | | $ | 4,949 | | | $ | 3,845 | |
Warranty Reserve
Changes in the warranty reserve during the years ended December 31, 2012 and 2011 were as follows (in thousands):
| | | December 31, | |
| | | 2012 | | | 2011 | |
| Warranty accrual, beginning of period | | $ | 565 | | | $ | 531 | |
| Provision for current period sales | | | 96 | | | | 84 | |
| Deductions for warranty claims processed during the period | | | (255 | ) | | | (50 | ) |
| Warranty accrual, end of period | | $ | 406 | | | $ | 565 | |
Accumulated Other Comprehensive Income (Loss)
The components of accumulated other comprehensive loss were as follows (in thousands):
| | | December 31, | |
| | | 2012 | | | 2011 | |
| Accumulated net unrealized loss on short-term investments | | $ | 20 | | | $ | (1 | ) |
| Accumulated foreign currency translation adjustments | | | (96 | ) | | | (389 | ) |
| Accumulated other comprehensive loss | | $ | (76 | ) | | $ | (390 | ) |
On December 10, 2009, the Company entered into a two-year loan and security agreement for a secured line of credit facility (“Secured Credit Facility”), for short-term working capital purposes with Silicon Valley Bank. The Secured Credit Facility provided borrowings of up to $2.0 million through December 10, 2011. Borrowings under the facility bore interest at the prime rate plus 1%, but not less than 5% per annum. Pursuant to the Secured Credit Facility, the Company issued a warrant to Silicon Valley Bank for the purchase of 50,000 shares of the Company’s common stock with an exercise price of $4.00 per share and a fair value of approximately $0.2 million, which was amortized to interest expense over the two-year term of the agreement.
On February 3, 2012, the loan and security agreement was amended and restated (the “Amended Secured Credit Facility”), to increase the secured line of credit facility from $2.0 million to $10.0 million and to provide for borrowings through February 2, 2014. Pursuant to the Amended Secured Credit Facility, borrowings bear interest at the prime rate plus 1%, but not less than 4.25% on an annual basis. The Company will pay Silicon Valley Bank a $35,000 commitment fee in each of the two years under the agreement. The Amended Secured Credit Facility is secured by substantially all of the Company’s assets. The terms of the Amended Secured Credit Facility include a financial covenant requiring a minimum company liquidity ratio and restrictions on the Company’s ability to incur certain additional indebtedness, pay dividends, create or permit liens on assets or engage in mergers, consolidations or dispositions. The Amended Secured Credit Facility may be terminated at any time by the Company during the term of the agreement, to take effect three business days after the Company provides written notice to Silicon Valley Bank. In connection with such termination, the Company would be obligated to pay Silicon Valley Bank a $50,000 termination fee. The Company was in compliance with the financial covenants as of December 31, 2012, 2011 and 2010.
At December 31, 2012 and 2011, the Company had no outstanding balance on its Amended Secured Credit Facility.
| 8. | Related Party Transactions |
On July 19, 2010, the Company entered into a Master OEM Purchase and Sales Agreement with GENBAND US LLC and GENBAND Ireland Ltd. (collectively, “GENBAND”), pursuant to which GENBAND may purchase any of the Company’s existing software and hardware products, as well as procure licenses and services related to such products from Procera. Pursuant to this agreement, the Company’s Board of Directors supported the election of Mark Pugerude, Chief Strategy Officer of GENBAND, as a director of the Company in fiscal 2012 through the Company’s 2012 annual stockholders’ meeting on August 27, 2012, and B.G. Kumar, Executive Vice President and President of the Networking and Applications Product Unit of GENBAND, as a director of the Company from the Company’s 2012 annual stockholders’ meeting on August 27, 2012.
During the years ended December 31, 2012, 2011 and 2010, the Company recognized revenue of approximately $1.7 million, $0.9 million and $1.5 million, respectively, on sales to GENBAND. At December 31, 2012 and 2011, the Company had accounts receivable of approximately $38,000 and $0.1 million, respectively, from GENBAND.
| 9. | Commitments and Contingencies |
Legal
The Company is periodically involved in legal actions and claims that arise as a result of events that occur in the normal course of operations. The Company does not believe that any of its legal actions and claims will have, individually or in the aggregate, a material adverse effect on the Company’s financial position or results of operations.
Operating Leases
The Company leases its operating and office facilities for various terms under long-term, non-cancelable operating lease agreements. The leases expire at various dates through 2017 and provide for renewal options ranging from month-to-month to three year terms. In the normal course of business, it is expected that these leases will be renewed or replaced by leases on other properties. The leases provide for increases in future minimum annual rental payments based on defined increases which are generally meant to correlate with the Consumer Price Index, subject to certain minimum increases. Also, the agreements generally require the Company to pay executory costs (real estate taxes, insurance and repairs).
As of December 31, 2012, future minimum lease payments due under operating leases are as follows (in thousands):
| Years ending December 31, | | | |
| 2013 | | $ | 543 | |
| 2014 | | | 508 | |
| 2015 | | | 407 | |
| 2016 | | | 326 | |
| 2017 | | | 249 | |
| Total minimum lease payments | | $ | 2,033 | |
Rent expense for operating leases was $0.4 million for the years ended December 31, 2012, 2011 and 2010, respectively.
Indemnification Agreements
The Company enters into standard indemnification arrangements with certain of its business partners and customers in the ordinary course of business. Pursuant to these arrangements, the Company indemnifies, holds harmless and agrees to reimburse the indemnified parties for losses suffered or incurred by the indemnified party, generally business partners or customers, in connection with any patent, or any copyright or other intellectual property infringement claim by any third party with respect to the Company’s products. The term of these indemnification agreements is generally perpetual any time after the execution of the agreement. The maximum potential amount of future payments the Company could be required to make under these agreements is unlimited. The Company has never been a party to an infringement claim with respect to its products or incurred costs to defend lawsuits or settle claims related to these indemnification agreements. As a result, the Company believes the estimated fair value of these agreements is minimal.
The Company has entered into indemnification agreements with its directors and officers that may require the Company to indemnify its directors and officers against liabilities that may arise by reason of their status or service as directors or officers, other than liabilities arising from willful misconduct of a culpable nature; to advance their expenses incurred as a result of any proceeding against them as to which they could be indemnified; and to obtain directors’ and officers’ insurance if available on reasonable terms, which the Company currently has in place.
Preferred Stock
The Company is authorized to issue up to 15.0 million shares of Preferred Stock, par value $0.001 per share. As of December 31, 2012 and 2011, no shares of preferred stock were issued and outstanding.
Common Stock Transactions
On April 25, 2012, we completed a registered offering of 4.5 million shares of common stock. The shares were sold to the public at $21.00 per share for gross proceeds of $94.5 million. We received net proceeds of approximately $88.0 million after deducting underwriting commissions and other offering expenses.
On June 24, 2011, the Company completed a registered offering of 3.0 million shares of common stock, which included the exercise in full of the underwriters’ overallotment option to purchase 0.4 million shares of common stock. The shares were sold to the public at $9.50 per share for gross proceeds of $28.8 million. The Company received net proceeds of approximately $26.5 million after deducting underwriting commissions and other offering expenses.
On March 4, 2010, the Company closed a registered placement of its common stock primarily to institutional investors. The offering price of the Company’s common stock to the public was $4.00 per share. The Company sold 1.8 million shares of common stock for gross proceeds of $7.2 million, and received net proceeds of approximately $6.5 million after deducting the placement agent’s commission and legal and other offering costs. The placement agent also received a warrant to purchase 18,000 shares of the Company’s common stock at an exercise price of $4.00 per share which was exercised during 2011. The warrant had an estimated fair value of approximately $45,000 calculated using the Black-Scholes option pricing model.
Stock Incentive Plans
In August 2003, October 2004 and October 2007, the Company’s Board of Directors (the “Board”), and subsequently its stockholders, adopted the 2003 Stock Option Plan, 2004 Stock Option Plan and 2007 Equity Incentive Plan, respectively (collectively referred to as the “Plan”). In March, 2011, the Board approved an increase of 400,000 shares of common stock that may be issued under the Plan to an aggregate of 1,100,000 shares. This increase was approved by the Company’s stockholders at the 2011 annual meeting of stockholders. In March 2012, the Board approved an increase of 800,000 shares of common stock under the Plan, which increase was approved by the Company’s stockholders at the 2012 annual meeting of stockholders. The aggregate number of shares reserved for issuance under the Plan at December 31, 2012 is 1,900,000.
The purpose of the Plan is to enable the Company to offer stock-based incentives to employees, directors and consultants with the objective of aligning those individuals’ interests with those of stockholders. The Plan authorizes the grant of options and other equity incentives to purchase shares of the Company’s common stock to employees, directors and consultants. Under the Plan, the Company is authorized to grant a wide variety of incentive awards, including incentive stock options, non-statutory stock options, restricted stock awards, restricted stock unit awards, stock appreciation rights, performance stock awards, and performance cash awards. Incentive stock options may only be granted to Company employees.
As of December 31, 2012, 369,543 shares were available for future grant under the Plan. The options under the Plan vest over varying lengths of time pursuant to various option agreements that the Company has entered into with the grantees of such options. The Plan is administered by the Board. Subject to the provisions of the Plan, the Board has authority to determine the employees, directors and consultants who are to be awarded options and the terms of such awards, including the number of shares subject to such option, the fair market value of the common stock subject to options, the exercise price per share and other terms.
Incentive stock options must have an exercise price equal to at least 100% of the fair market value of a share on the date of the award and generally cannot have a duration of more than 10 years. If the grant is to a stockholder holding more than 10% of the Company’s voting stock, the exercise price must be at least 110% of the fair market value on the date of grant. Options generally vest over a period of three to five years. Stock option exercises are settled with newly issued common shares approved by stockholders for inclusion under the Plan. Awards are set forth in written agreements between the Company and the respective option holders. Awards under the Plan may not be made after the tenth anniversary of the date of adoption of each respective stock option plan but awards granted before that date may extend beyond that date.
Optionees have no rights as stockholders with respect to shares subject to the option prior to the exercise thereof. An option becomes exercisable at such time and for such amounts as determined by the Board. An optionee may exercise a part of the option from the date that part first becomes exercisable until the option expires. The purchase price for shares to be issued to an employee upon his or her exercise of an option is determined by the Board on the date the option is granted. The Plan provides for adjustment as to the number and kinds of shares covered by the outstanding options and the option price therefore to give effect to any stock dividend, stock split, stock combination or other reorganization.
Restricted stock awards are awards of shares of our common stock that vest in accordance with terms and conditions established by the Board. Each restricted stock award is evidenced by an award agreement that sets forth the terms and conditions of the award. The Board sets the terms of the restricted stock awards including the size of the restricted stock award, the price to be paid by the recipient, the vesting schedule, and any performance criteria that may be required for the stock to vest. The award may vest based on continued employment and/or the achievement of performance goals. If a participant’s service terminates before the restricted stock is fully vested, all of the unvested shares will be forfeited by the participant unless otherwise provided in the restricted stock award agreement.
Stock Incentive Plan Activity
Stock Options
The following table summarizes the Company’s stock option activity for the three years ended December 31, 2012 (in thousands, except per share data):
| | | Years Ended December 31, | |
| | | 2012 | | | 2011 | | | 2010 | |
| | | Options | | | Weighted Average Exercise Price | | | Options | | | Weighted Average Exercise Price | | | Options | | | Weighted Average Exercise Price | |
| Outstanding at the beginning of the year | | | 1,198 | | | $ | 10.35 | | | | 975 | | | $ | 8.93 | | | | 908 | | | $ | 9.92 | |
| Granted | | | 629 | | | | 20.64 | | | | 371 | | | | 12.91 | | | | 234 | | | | 4.98 | |
| Exercised | | | (372 | ) | | | 10.24 | | | | (109 | ) | | | 6.94 | | | | (50 | ) | | | 5.20 | |
| Cancelled | | | (123 | ) | | | 14.67 | | | | (39 | ) | | | 11.24 | | | | (117 | ) | | | 10.82 | |
| Outstanding at the end of the year | | | 1,332 | | | $ | 14.65 | | | | 1,198 | | | $ | 10.35 | | | | 975 | | | $ | 8.93 | |
| Vested and expected to vest at the end of the year | | | 1,254 | | | $ | 14.66 | | | | 1,147 | | | $ | 10.29 | | | | 932 | | | $ | 9.04 | |
| Exercisable at the end of the year | | | 618 | | | $ | 11.58 | | | | 707 | | | $ | 10.21 | | | | 572 | | | $ | 9.93 | |
As of December 31, 2012, the aggregate intrinsic value of options outstanding, options vested and expected to vest and options exercisable was $6.3 million, $6.2 million and $4.6 million, respectively. As of December 31, 2012, the weighted average remaining contractual life of options outstanding, options vested and expected to vest and options exercisable was 8.17 years, 8.08 years and 6.82 years, respectively. The total intrinsic value of options exercised during the years ended December 31, 2012, 2011 and 2010 was $3.6 million, $0.8 million and $0.1 million, respectively. Total fair value of options vested during 2012, 2011, and 2010 was $1.9 million, $1.3 million, and $1.5 million, respectively.
Restricted Stock
The following is a summary of the Company’s restricted stock award activity for the two years ended December 31, 2012 (in thousands, except per share data):
| | | Years Ended December 31, | |
| | | 2012 | | | 2011 | |
| | | Awards | | | Weighted Average Grant Date Fair Value | | | Awards | | | Weighted Average Grant Date Fair Value | |
| Unvested outstanding at the beginning of the year | | | 136 | | | $ | 9.24 | | | | 60 | | | $ | 5.30 | |
| Granted | | | 152 | | | | 20.32 | | | | 76 | | | | 12.33 | |
| Vested | | | (35 | ) | | | 10.04 | | | | - | | | | - | |
| Unvested outstanding at the end of the year | | | 253 | | | $ | 15.79 | | | | 136 | | | $ | 9.24 | |
There were restricted stock awards amounting to 60,000 shares granted at a weighted average grant date fair value of $5.30 per share for the year ended December 2010, and no restricted stock awards vested during the year ended December 31, 2010.
Stock-Based Compensation
Stock-based employee compensation expense recognized pursuant to the Company’s stock incentive plans on the accompanying consolidated statements of operations is as follows (in thousands):
| | | Years Ended December 31, | |
| | | 2012 | | | 2011 | | | 2010 | |
| Cost of goods sold | | $ | 150 | | | $ | 105 | | | $ | 89 | |
| Research and development | | | 322 | | | | 127 | | | | 34 | |
| Sales and marketing | | | 1,175 | | | | 471 | | | | 321 | |
| General and administrative | | | 1,137 | | | | 1,022 | | | | 970 | |
| Total stock-based compensation expense | | $ | 2,784 | | | $ | 1,725 | | | $ | 1,414 | |
No income tax benefits were recognized in the years ended December 31, 2012 and 2011 due to operating loss carry-forwards available to offset current income. No income tax benefits were recognized in the year ended 2010 due to the Company’s losses. No stock-based compensation has been capitalized in inventory due to the immateriality of such amounts.
As of December 31, 2012, total unrecognized compensation cost related to unvested stock options was $7.1 million, net of estimated forfeitures, which is expected to be recognized over an estimated weighted average amortization period of 3.51 years, and total unrecognized compensation cost related to non-vested restricted stock awards was $3.0 million, net of estimated forfeitures, which is expected to be recognized over an estimated weighted average amortization period of 3.13 years.
Valuation Assumptions
The fair value of each option grant is estimated on the date of grant using the Black-Scholes option valuation model. The fair value of each restricted stock grant is calculated based upon the closing stock price of the Company’s common stock on the date of the grant. The expense for stock-based awards is recognized over the requisite service period using the straight-line attribution approach.
The following assumptions were used in determining the fair value of stock options granted during the years ended December 31, 2012, 2011 and 2010:
| | | Years Ended December 31, |
| | | 2012 | | 2011 | | 2010 |
| Expected term (in years) | | | 4.55 | | | | 5.28 | | | | 4.66 | |
| Expected volatility | | | 78 | % | | | 68 | % | | | 92 | % |
| Risk-free interest rate | | | 0.65 | % | | | 1.38 | % | | | 1.83 | % |
| Dividend yield | | | - | % | | | - | % | | | - | % |
The weighted average grant date fair value of options granted during the years ended December 31, 2012, 2011 and 2010 was $12.00, $7.41 and $3.05, respectively.
The Company calculated the expected term of stock options granted using historical exercise data. Expected volatilities were estimated using the historical share price performance over a period equivalent to the expected term of the option. The risk-free interest rate for a period equivalent to the expected term of the option was extrapolated from the U.S. Treasury yield curve in effect at the time of the grant. The Company has never paid cash dividends and does not anticipate paying cash dividends in the foreseeable future.
The components of income (loss) before income taxes are as follows (in thousands):
| | | Years Ended December 31, | |
| | | 2012 | | | 2011 | | | 2010 | |
| Domestic | | $ | 1,761 | | | $ | 3,001 | | | $ | (1,013 | ) |
| Foreign | | | 3,693 | | | | 799 | | | | (1,871 | ) |
| Income (loss) before income taxes | | $ | 5,454 | | | $ | 3,800 | | | $ | (2,884 | ) |
The Company’s income tax provision consists of the following (in thousands):
| | | Years Ended December 31, | |
| | | 2012 | | | 2011 | | | 2010 | |
| Current income taxes: | | | | | | | | | |
| Federal/state | | $ | 60 | | | $ | 39 | | | $ | 10 | |
| Foreign | | | 63 | | | | 6 | | | | - | |
| Total current income taxes | | | 123 | | | | 45 | | | | 10 | |
| | | | | | | | | | | | | |
| Deferred income taxes: | | | | | | | | | | | | |
| Foreign | | | - | | | | - | | | | - | |
| Total deferred income taxes | | | - | | | | - | | | | - | |
| Income tax provision | | $ | 123 | | | $ | 45 | | | $ | 10 | |
Deferred income taxes reflect the net tax effects of net operating loss and tax credit carryovers and temporary differences between the carrying amounts of assets and liabilities for financial reporting purposes and the amounts used for income tax purposes. Significant components of the Company’s deferred tax assets are as follows (in thousands):
| | | December 31, | |
| Deferred tax assets: | | 2012 | | | 2011 | |
| Federal, state and foreign net operating losses | | $ | 10,037 | | | $ | 12,356 | |
| Research credits | | | 350 | | | | 307 | |
| Other | | | 2,239 | | | | 2,079 | |
| Valuation allowance | | | (12,626 | ) | | | (14,742 | ) |
| Total deferred tax assets | | $ | — | | | $ | — | |
Reconciliation between the tax provision computed at the Federal statutory income tax rate of 34% and the Company’s actual effective income tax provision is as follows (in thousands):
| | | Years Ended December 31, | |
| | | 2012 | | | 2011 | | | 2010 | |
| Computed at statutory rate | | $ | 1,854 | | | $ | 1,292 | | | $ | (980 | ) |
| Research & development credits | | | - | | | | (2 | ) | | | (18 | ) |
| State income taxes | | | 132 | | | | 140 | | | | (5 | ) |
| Stock compensation | | | (107 | ) | | | 309 | | | | 38 | |
| Foreign tax | | | (1,264 | ) | | | 213 | | | | – | |
| Permanent and other | | | 229 | | | | 8 | | | | 14 | |
| Valuation allowance | | | (721 | ) | | | (1,915 | ) | | | 961 | |
| Total | | $ | 123 | | | $ | 45 | | | $ | 10 | |
Realization of deferred tax assets is dependent upon future earnings, if any, the timing and amount of which are uncertain. Accordingly, the net deferred tax assets have been fully offset by a valuation allowance. The valuation allowance decreased by $2.1 and $1.9 million for each of the years ended December 31, 2012 and 2011, respectively.
As of December 31, 2012, the Company had net operating loss carryforwards for federal income tax purposes of approximately $25.0 million which will begin to expire in 2021. The Company also has state net operating loss carryforwards of approximately $22.2 million which will begin to expire in 2013. The net operating loss carry forwards include $1.2 million which relates to stock option deductions that will be recognized through additional paid in capital when utilized. As such, these deductions are not reflected in deferred tax assets. The Company also has foreign net operating loss carry forwards of $3.1 million which have no expiration. The Company also has Federal and California research and development tax credits of $0.3 million and $0.2 million, respectively. The federal research credits will begin to expire in 2022 while the California research credits have no expiration date.
Utilization of the Company’s net operating loss carryforwards may be subject to substantial annual limitation due to the ownership change limitations provided by the Internal Revenue Code, and similar state provisions. Such an annual limitation could result in the expiration of the net operating loss carryforwards before utilization.
The Company files income tax returns in the U.S., various state jurisdictions and in the countries of Sweden, Australia, Singapore, and Japan. As of December 31, 2012, the federal returns for the years ended 2009 through the current period and most state returns for the years ended 2008 through the current period are still open to examination. In addition, all of the net operating losses and research and development credit carryforwards that may be used in future years are still subject to adjustment. The Company's Australian and Swedish income tax returns for the years ended 2006 through the current period are still open to examination.
The following table summarizes the activity related to unrecognized tax benefits (in thousands):
| Balance at January 1, 2012 | | $ | 245 | |
| Increase related to current year tax position | | | 3 | |
| Decrease related to tax position of prior year | | | (55 | ) |
| Balance at December 31, 2012 | | $ | 193 | |
A total of $0.2 million of the unrecognized tax benefits would affect our effective tax rate. The Company currently has a full valuation allowance against its U.S. net deferred tax assets which would impact the timing of the effective tax rate benefit should any of these uncertain tax positions be favorably settled in the future.
We recognize interest and penalties related to uncertain tax positions in income tax expense. As of December 31, 2012, we have no accrued interest or penalties related to uncertain tax positions. The Company does not anticipate that total unrecognized tax benefits will significantly change due to the settlement of audits and the expiration of statute of limitations prior to December 31, 2013.
| 13. | Net Income (Loss) Per Share |
Basic net income (loss) per share is computed by dividing net income (loss) by the weighted average number of common shares outstanding for the period. Diluted net income per share reflects the potential dilution that could occur from common shares issuable upon the exercise of outstanding stock options or warrants and the vesting of restricted stock awards, which are reflected in diluted earnings per share by application of the treasury stock method. Under the treasury stock method, the amount that the employee must pay for exercising stock options or warrants, the amount of stock-based compensation cost for future services that the Company has not yet recognized, and the amount of tax benefit that would be recorded in additional paid-in capital upon exercise are assumed to be used to repurchase shares.
The following table sets forth the computation of basic and diluted net income (loss) per share and potential shares of common stock that are not included in the diluted net income (loss) per share calculation because their effect is antidilutive:
| | | Years Ended December 31, | |
| (in thousands, except per share amounts) | | 2012 | | | 2011 | | | 2010 | |
| Numerator: | | | | | | | | | | | | |
| Net income (loss) | | $ | 5,331 | | | $ | 3,755 | | | $ | (2,894 | ) |
| Denominator: | | | | | | | | | | | | |
| Weighted average common shares - basic | | | 17,842 | | | | 12,932 | | | | 10,898 | |
| Dilutive effect of employee equity incentive plans | | | 484 | | | | 220 | | | �� | – | |
| Dilutive effect of warrants | | | 11 | | | | 67 | | | | – | |
| Weighted average common shares - diluted | | | 18,337 | | | | 13,219 | | | | 10,898 | |
| | | | | | | | | | | | | |
| Net income (loss) per share: | | | | | | | | | | | | |
| Basic | | $ | 0.30 | | | $ | 0.29 | | | $ | (0.27 | ) |
| Diluted | | $ | 0.29 | | | $ | 0.28 | | | $ | (0.27 | ) |
| | | | | | | | | | | | | |
| Anti-dilutive securities: | | | | | | | | | | | | |
| Options and restricted stock | | | 301 | | | | 455 | | | | 1,035 | |
| Warrants | | | - | | | | 114 | | | | 410 | |
| Total anti-dilutive securities | | | 301 | | | | 569 | | | | 1,445 | |
The Company allows eligible employees to participate in a 401(k) defined-contribution retirement plan, which allows contributions on a before-tax basis. Generally, all employees based in the U.S. are eligible to participate in the plan which allows voluntary contributions, subject to the annual maximum allowed by the U.S. Internal Revenue Service. The Company may contribute as much as determined by the Board of Directors. The Company did not make any contributions to the defined-contribution retirement plan for the years ended December 31, 2012, 2011 and 2010.
| 15. | Segment Information and Revenue by Geographic Region |
The Company operates in one segment, using one measure of profitability to manage its business. Sales for geographic regions were based upon the customer’s location. The location of long-lived assets is based on the physical location of the Company’s regional offices. The following are summaries of sales and long-lived assets by geographic region (in thousands):
| | | Year Ended December 31, | |
| | | 2012 | | | 2011 | | | 2010 | |
| Net sales: | | | | | | | | | |
| United States | | $ | 29,057 | | | $ | 22,695 | | | $ | 11,975 | |
| Asia Pacific and China | | | 13,751 | | | | 7,342 | | | | 3,537 | |
| Europe, Middle East and Africa | | | 16,819 | | | | 14,367 | | | | 4,811 | |
| Total | | $ | 59,627 | | | $ | 44,404 | | | $ | 20,323 | |
| | | December 31, | |
| | | 2012 | | | 2011 | |
| Long-lived assets: | | | | | | |
| United States | | $ | 1,750 | | | $ | 341 | |
| Europe | | | 2,719 | | | | 1,465 | |
| Australia | | | 5 | | | | 20 | |
| Total | | $ | 4,474 | | | $ | 1,826 | |
Sales made to customers located outside the United States as a percentage of total net revenues were 51%, 49% and 41% for the years ended December 31, 2012, 2011 and 2010, respectively.
For the year ended December 31, 2012, revenue from one customer, Shaw Communications, Inc., represented 16% of net revenues, with no other single customer accounting for more than 10% of net revenues. For the year ended December 31, 2011, revenue from two customers, Shaw Communications, Inc. and Jet Infosystems, represented 27% and 12% of net revenues, respectively, with no other single customer accounting for more than 10% of net revenues. For the year ended December 31, 2010, revenue from one customer, Cox Communications, Inc., represented 11% of net revenues, with no other single customer accounting for more than 10% of net revenues.
At December 31, 2012, accounts receivable from three customers represented 14%, 12% and 12%, respectively, of total accounts receivable with no other single customer accounting for more than 10% of the accounts receivable balance. At December 31, 2011, accounts receivable from two customers represented 45% and 20%, respectively, of total accounts receivable with no other single customer accounting for more than 10% of the accounts receivable balance. At December 31, 2012 and 2011, approximately 72% and 37%, respectively, of the Company’s total accounts receivable were due from customers outside the United States.
On January 7, 2013, the Company and Procera Networks Kelowna ULC, an indirect wholly-owned subsidiary of the Company, entered into a Share Purchase Agreement (the “Purchase Agreement”) with Vineyard Networks Inc. (“Vineyard”), the holders of all of the outstanding equity of Vineyard (the “Shareholders”) and John Drope & Associates Ltd., as representative of the Shareholders, to acquire all of the outstanding capital shares of Vineyard (the “Acquisition”). The Acquisition was completed on January 9, 2013. Pursuant to the Purchase Agreement, the Company paid a total aggregate consideration of approximately $27.4 million for the Acquisition, comprised of approximately $12.5 million in cash and approximately 825,000 shares of the Company’s common stock. The final Acquisition price is subject to adjustment based on a post-closing audit of Vineyard’s working capital as of the closing of the Acquisition. The Company believes that synergies of the technologies combined with the complimentary customer types will enable it to increase its addressable market share.
Additionally, in January 2013, we granted options to purchase an additional 412,000 shares of our common stock to the new employees obtained in connection with the Acquisition.
The Acquisition will be accounted for using the acquisition method of accounting in accordance with ASC 805 which requires, among other things, that the assets acquired and liabilities assumed be recognized at their fair values as of the merger date. The goodwill recorded in this transaction will not be tax deductible.
Supplemental Quarterly Financial Data (unaudited)
The following is a summary of quarterly results of operations for the years ended December 31, 2012 and 2011 (in thousands, except per share data):
| | | Year Ended December 31, 2012 | |
| | | March 31 | | | June 30 | | | September 30 | | | December 31 | |
| | | | | | | | | | | | | |
| Net sales | | $ | 12,332 | | | $ | 14,665 | | | $ | 16,061 | | | $ | 16,569 | |
| Gross profit | | $ | 8,663 | | | $ | 9,247 | | | $ | 11,521 | | | $ | 10,727 | |
| Net income | | $ | 579 | | | $ | 766 | | | $ | 2,763 | | | $ | 1,223 | |
| Basic net income per share (1) | | $ | 0.04 | | | $ | 0.04 | | | $ | 0.14 | | | $ | 0.06 | |
| Diluted net income per share (1) | | $ | 0.04 | | | $ | 0.04 | | | $ | 0.14 | | | $ | 0.06 | |
| | | | |
| | | Year Ended December 31, 2011 | |
| | | March 31 | | | June 30 | | | September 30 | | | December 31 | |
| | | | | | | | | | | | | |
| Net sales | | $ | 6,923 | | | $ | 9,656 | | | $ | 12,193 | | | $ | 15,632 | |
| Gross profit | | $ | 4,203 | | | $ | 5,968 | | | $ | 7,464 | | | $ | 8,687 | |
| Net income (loss) | | $ | (230 | ) | | $ | 181 | | | $ | 2,045 | | | $ | 1,759 | |
| Basic net income (loss) per share (1) | | $ | (0.02 | ) | | $ | 0.02 | | | $ | 0.14 | | | $ | 0.12 | |
| Diluted net income (loss) per share (1) | | $ | (0.02 | ) | | $ | 0.01 | | | $ | 0.14 | | | $ | 0.12 | |
| (1) | Basic and diluted net income (loss) per share is computed independently. Therefore, the sum of the quarterly net income (loss) per share may not equal the total computed for the fiscal year or any cumulative interim period. |
| Item 9. | Changes in and Disagreements With Accountants on Accounting and Financial Disclosure |
On March 30, 2012, the Audit Committee (the “Audit Committee”) of the Board of Directors of Procera Networks, Inc. (the “Company”) dismissed PMB Helin Donovan, LLP (“PMB”) as the Company’s independent registered public accounting firm effective immediately. Also on that date, the Audit Committee approved the engagement of Ernst & Young LLP (“E&Y”) as the Company’s independent registered public accounting firm for the fiscal year ending December 31, 2012, such appointment effective immediately.
The audit reports of PMB on the Company’s financial statements for each of the two fiscal years ended December 31, 2010 and 2011 did not contain an adverse opinion or a disclaimer of opinion and were not qualified or modified as to uncertainty, audit scope or accounting principles.
In connection with the audits of the Company’s financial statements for each of the two fiscal years ended December 31, 2010 and 2011 and the subsequent interim period through March 30, 2012, there were no disagreements and no reportable events with PMB on any matters of accounting principles or practices, financial statement disclosure, or auditing scope and procedure which, if not resolved to the satisfaction of PMB, would have caused PMB to make reference to the matter of such disagreements in their reports.
On March 30, 2012, the Audit Committee engaged E&Y as the Company’s new independent registered public accounting firm. During each of the two fiscal years ended December 31, 2010 and 2011 and the subsequent interim period through March 30, 2012, neither the Company nor anyone on its behalf has consulted with E&Y regarding either: (i) the application of accounting principles to a specified transaction, either completed or proposed, or the type of audit opinion that might be rendered on the Company’s financial statements, and neither a written report was provided to the Company nor oral advice was provided by E&Y that was an important factor considered by the Company in reaching a decision as to any accounting, auditing or financial reporting issue; or (ii) any matter that was the subject of a disagreement, as that term is defined in Item 304(a)(1)(iv) of Regulation S-K and the related instructions to Item 304 of Regulation S-K, or a reportable event, as that term is defined in Item 304(a)(1)(v) of Regulation S-K.
Evaluation of Disclosure Controls and Procedures
We have adopted and maintain disclosure controls and procedures that are designed to ensure that information required to be disclosed in our reports under the Securities Exchange Act of 1934, as amended, is recorded, processed, summarized and reported within the time periods specified in the SEC’s rules and forms and that such information is accumulated and communicated to our management, including our Chief Executive Officer and Chief Financial Officer, as appropriate, to allow for timely decisions regarding required disclosure. In designing and evaluating the disclosure controls and procedures, management recognizes that controls and procedures, no matter how well designed and operated, cannot provide absolute assurance of achieving the desired control objectives.
As required by Rule 13a-15(b), under the Securities Exchange Act of 1934, as amended, we carried out an evaluation, under the supervision and with the participation of management, including our Chief Executive Officer and Chief Financial Officer, of the effectiveness of the design and operation of our disclosure controls and procedures as of the end of the period covered by this report. Based on the foregoing, our Chief Executive Officer and Chief Financial Officer concluded that as of December 31, 2012, our disclosure controls and procedures were effective at the reasonable assurance level.
Management’s Report on Internal Control over Financial Reporting
We prepared the consolidated financial statements and other information in our Annual Report in accordance with accounting principles generally accepted in the United States of America and we are responsible for their accuracy. The financial statements necessarily include amounts that are based on our best estimates and judgments. In meeting our responsibility, we rely on internal accounting and related control systems. The internal control systems are designed to ensure that transactions are properly authorized and recorded in our financial records and to safeguard our assets from material loss or misuse. Such assurance cannot be absolute because of inherent limitations in any internal control system.
Our management is responsible for establishing and maintaining adequate internal control over financial reporting as defined in Rule 13a-15(f) of the Securities Exchange Act of 1934, as amended.
Because of inherent limitations, internal control over financial reporting may not prevent or detect misstatements. Also, projections of any evaluation of effectiveness to future periods are subject to the risk that controls may become inadequate because of changes in conditions, or that the degree of compliance with the policies or procedures may deteriorate.
In connection with the preparation of our annual financial statements, under the supervision and with the participation of our management, including our Chief Executive Officer and Chief Financial Officer, we completed an assessment of the effectiveness of our internal control over financial reporting as of December 31, 2012. The assessment was based upon the framework described in the “Integrated Control-Integrated Framework” issued by the Committee of Sponsoring Organizations of the Treadway Commission (“COSO”). Our assessment included an evaluation of the design of internal control over financial reporting and testing of the operational effectiveness of internal control over financial reporting. We have reviewed the results of the assessment with the Audit Committee of our Board of Directors.
Based on our assessment under the criteria set forth in COSO, management has concluded that, as of December 31, 2012, we maintained effective internal control over financial reporting.
The effectiveness of our internal control over financial reporting as of December 31, 2012 has been audited by Ernst & Young, LLP, an independent registered public accounting firm, as stated in their report which appears herein.
Changes in Internal Control over Financial Reporting
There was no change in our internal control over financial reporting during the quarter ended December 31, 2012, that has materially affected, or is reasonably likely to materially affect, our internal control over financial reporting.
Limitation on Effectiveness of Controls and Procedures
In designing and evaluating the disclosure controls and procedures, management recognizes that any controls and procedures, no matter how well designed and operated, can provide only reasonable assurance of achieving the desired control objectives. In addition, the design of disclosure controls and procedures must reflect the fact that there are resource constraints and that management is required to apply its judgment in evaluating the benefits of possible controls and procedures relative to their costs.
REPORT OF INDEPENDENT REGISTERED PUBLIC ACCOUNTING FIRM ON
INTERNAL CONTROL OVER FINANCIAL REPORTING
The Board of Directors and Stockholders of Procera Networks, Inc.
We have audited Procera Networks, Inc.'s internal control over financial reporting as of December 31, 2012, based on criteria established in Internal Control - Integrated Framework issued by the Committee of Sponsoring Organizations of the Treadway Commission (the COSO criteria). Procera Networks, Inc.'s management is responsible for maintaining effective internal control over financial reporting, and for its assessment of the effectiveness of internal control over financial reporting included in the accompanying Management's Report on Internal Control Over Financial Reporting. Our responsibility is to express an opinion on the company's internal control over financial reporting based on our audit.
We conducted our audit in accordance with the standards of the Public Company Accounting Oversight Board (United States). Those standards require that we plan and perform the audit to obtain reasonable assurance about whether effective internal control over financial reporting was maintained in all material respects. Our audit included obtaining an understanding of internal control over financial reporting, assessing the risk that a material weakness exists, testing and evaluating the design and operating effectiveness of internal control based on the assessed risk, and performing such other procedures as we considered necessary in the circumstances. We believe that our audit provides a reasonable basis for our opinion.
A company's internal control over financial reporting is a process designed to provide reasonable assurance regarding the reliability of financial reporting and the preparation of financial statements for external purposes in accordance with generally accepted accounting principles. A company's internal control over financial reporting includes those policies and procedures that (1) pertain to the maintenance of records that, in reasonable detail, accurately and fairly reflect the transactions and dispositions of the assets of the company; (2) pr006Fvide reasonable assurance that transactions are recorded as necessary to permit preparation of financial statements in accordance with generally accepted accounting principles, and that receipts and expenditures of the company are being made only in accordance with authorizations of management and directors of the company; and (3) provide reasonable assurance regarding prevention or timely detection of unauthorized acquisition, use or disposition of the company's assets that could have a material effect on the financial statements.
Because of its inherent limitations, internal control over financial reporting may not prevent or detect misstatements. Also, projections of any evaluation of effectiveness to future periods are subject to the risk that controls may become inadequate because of changes in conditions, or that the degree of compliance with the policies or procedures may deteriorate.
In our opinion, Procera Networks, Inc. maintained, in all material respects, effective internal control over financial reporting as of December 31, 2012, based on the COSO criteria.
We also have audited, in accordance with the standards of the Public Company Accounting Oversight Board (United States), the consolidated balance sheet of Procera Networks, Inc. as of December 31, 2012 and the related consolidated statements of operations, comprehensive income (loss), stockholders' equity, and cash flows for the year ended December 31, 2012, and our report dated March 14, 2013, expressed an unqualified opinion thereon.
/s/ Ernst & Young LLP
Redwood City, California
March 14, 2013
None.
PART III
| Item 10. | Directors, Executive Officers and Corporate Governance |
The information required by this item concerning our directors, the board of directors and its committees, and certain corporate governance matters is incorporated by reference to the information set forth in the section titled “Election of Directors” in our definitive Proxy Statement to be filed with the SEC in connection with the annual meeting of stockholders to be held in 2013 (the “2013 Proxy Statement”).. The information required by this item related to the executive officers can be found in the section captioned “Executive Officers of the Company” under Part I, “Item 1. Business” of this Annual Report on Form 10-K, and is also incorporated herein by reference.
The information required by this item regarding executive compensation is incorporated by reference to the information set forth in the section titled “Executive Compensation” in the 2013 Proxy Statement.
| Item 12. | Security Ownership of Certain Beneficial Owners and Management and Related Stockholder Matters |
The information required by this item regarding security ownership of certain beneficial owners and management is incorporated by reference to the information set forth in the sections titled “Security Ownership of Certain Beneficial Owners and Management” and “Equity Compensation Plan Information” in the 2013 Proxy Statement.
| Item 13. | Certain Relationships and Related Transactions, and Director Independence |
The information required by this item regarding certain relationships and related transactions is incorporated by reference to the information set forth in the section titled “Transactions with Related Persons” and “Information Regarding the Board of Directors and Corporate Governance” in the 2013 Proxy Statement.
| Item 14. | Principal Accounting Fees and Services |
The information required by this item regarding principal accounting fees and services is incorporated by reference to the information set forth in the section titled “Principal Account Fees and Services” in the 2013 Proxy Statement.
PART IV
| Item 15. | Exhibits, Financial Statement Schedules |
| | (a)(1) | Financial Statements |
The financial statements filed as part of this report are listed on the index to financial statements on page 40.
| | (b)(2) | Financial Statement Schedules |
PROCERA NETWORKS, INC.
SCHEDULE II: VALUATION AND QUALIFYING ACCOUNTS
| (in thousands) | | Balance at Beginning of Year | | | Additions Charged to Expense or Other Accounts | | | Deductions | | | Balance at End of Year | |
| Allowance for doubtful accounts: | | | | | | | | | | | | |
| Year ended December 31, 2012 | | $ | 98 | | | $ | 6 | | | $ | (8 | ) | | $ | 96 | |
| Year ended December 31, 2011 | | | 322 | | | $ | 2 | | | $ | (225 | ) | | $ | 98 | |
| Year ended December 31, 2010 | | | 281 | | | | 62 | | | | (21 | ) | | | 322 | |
All other schedules have been omitted because the required information is not present or not present in the amounts sufficient to require submission of the schedule or because the information required is included in the consolidated financial statements or notes thereto.
The following exhibits are incorporated by reference or filed herewith.
| 2.1*# Share Purchase Agreement, by and among the Company, Procera Networks Kelowna ULC, Vineyard Networks Inc., the shareholders of Vineyard Networks Inc. and John Drope & Associates Ltd., as representative of the shareholders of Vineyard Networks Inc., dated January 7, 2013, filed as Exhibit 2.1 to our current report on Form 8-K/A filed on February 13, 2013 and incorporated herein by reference. |
| 3.1* Articles of Incorporation, included as Exhibit 3.1 to our registration statement on form SB-2 filed on February 11, 2002 and incorporated herein by reference. |
| 3.2* Certificate of Amendment to Articles of Incorporation, included as Exhibit 99.1 to our current report on form 8-K filed on October 13, 2005 and incorporated herein by reference. |
| 3.3* Certificate of Amendment to Articles of Incorporation, included as Exhibit 3.3 to our quarterly report on form 10-Q filed on May 12, 2008 and incorporated herein by reference. |
| 3.4* Certificate of Amendment to Articles of Incorporation, included as Exhibit 3.1 to our current report on form 8-K filed on February 4, 2011 and incorporated herein by reference. |
| 3.5* Amended and Restated Bylaws, adopted on August 4, 2010, included as Exhibit 3.4 to our quarterly report on form 10-Q filed on August 9, 2010 and incorporated herein by reference. |
| 4.1* Form of Common Stock Certificate, included as Exhibit 4.1 to our current report on form 8-K filed on February 4, 2011 and incorporated herein by reference. |
| 10.1*‡ 2003 Stock Option Plan, included as Exhibit 10.1 to our registration statement on form SB-2 filed on January 8, 2004 and incorporated herein by reference. |
| 10.2*‡ Amended 2004 Stock Option Plan, included as Exhibit 99.3 to our current report on form 8-K filed on October 13, 2005 and incorporated herein by reference. |
| 10.3*‡ Restated Executive Employment Agreement for James F. Brear dated as of December 4, 2012 included as Exhibit 10.1 to our current report on form 8-K filed on December 5, 2012 and incorporated herein by reference. |
| 10.4*‡ Restated Executive Employment Agreement for Charles Constanti, dated as of December 3, 2012, included as Exhibit 10.2 to our current report on form 8-K filed on December 5, 2012 and incorporated herein by reference. |
| 10.5*‡ Form of Indemnity Agreement, included as Exhibit 10.6 to our quarterly report on form 10-Q filed on August 12, 2009 and incorporated herein by reference. |
| |
| 10.6* Amended and Restated Loan and Security Agreement by and between the Company and Silicon Valley Bank, dated February 3, 2012, included as Exhibit 10.1 to our current report on form 8-K filed on February 8, 2012 and incorporated herein by reference. |
| 10.7* Letter Agreement by and between the Company and GENBAND US LLC, dated July 19, 2010, included as Exhibit 10.2 to our quarterly report on form 10-Q filed on November 9, 2010 and incorporated herein by reference. |
| 10.8*† Master OEM Purchase and Sales Agreement among the Company, GENBAND US LLC and GENBAND Ireland Ltd., effective July 19, 2010, included as Exhibit 10.1 to our quarterly report on form 10-Q filed on November 9, 2010 and incorporated herein by reference. |
| 10.9*† Amendment No. 1 to Master OEM Purchase and Sales Agreement among the Company, GENBAND US LLC and GENBAND Ireland Ltd., dated November 19, 2010, included as Exhibit 10.17 to our annual report on form 10-K filed on March 16, 2011 and incorporated herein by reference. |
| 10.10*‡ Form of Restricted Stock Bonus Grant Notice (2007 Equity Incentive Plan), included as Exhibit 10.2 to our quarterly report on form 10-Q filed on May 10, 2011 and incorporated herein by reference. |
| 10.11*‡ Form of Restricted Stock Bonus Agreement (2007 Equity Incentive Plan), included as Exhibit 10.3 to our quarterly report on form 10-Q filed on May 10, 2011 and incorporated herein by reference. |
| 10.12*‡ Procera Networks, Inc. 2007 Equity Incentive Plan, as amended, included as Exhibit 10.1 to our current report form 8-K filed on August 28, 2012 and incorporated herein by reference. |
| 10.13*‡ Form of Inducement Grant Option Agreement entered into between the Company and certain Canadian employees, included as Exhibit 4.3 to our registration statement on Form S-8 filed on February 13, 2013 and incorporated herein by reference. |
| 10.14* Form of Inducement Grant Option Agreement entered into between the Company and certain U.S. employees, included as Exhibit 4.4 to our registration statement on Form S-8 filed on February 13, 2013 and incorporated herein by reference. |
| 21.1 List of Subsidiaries. |
| 23.1 Consent of Registered Public Accounting Firm – Ernst & Young LLP. |
| 23.2 Consent of Registered Public Accounting Firm – PMB Helin Donovan, LLP. |
| 24.1 Power of Attorney (included on signature page hereto). |
| 31.1 Certification of Principal Executive Officer pursuant to Rule 13a-14(a) and 15d-14(a) of the Securities Exchange Act of 1934, as adopted pursuant to Section 302 of the Sarbanes-Oxley Act of 2002. |
| 31.2 Certification of Principal Financial Officer pursuant to Rule 13a-14(a) and 15d-14(a) of the Securities Exchange Act of 1934, as adopted pursuant to Section 302 of the Sarbanes-Oxley Act of 2002. |
| 32.1 Certification of Principal Executive Officer and Principal Financial Officer pursuant to 18 U.S.C. Section 1350, as adopted pursuant to Section 906 of the Sarbanes-Oxley Act of 2002. |
| 101.INS+ XBRL Instance Document. |
| 101.SCH+ XBRL Taxonomy Extension Schema. |
| 101.CAL+ XBRL Taxonomy Extension Calculation Linkbase. |
| 101.DEF+ XBRL Taxonomy Extension Definition Linkbase. |
| 101.LAB+ XBRL Taxonomy Extension Label Linkbase. |
| 101.PRE+ XBRL Taxonomy Extension Presentation Linkbase. |
* Previously filed.
+ Pursuant to applicable securities laws and regulations, the Registrant is deemed to have complied with the reporting obligation relating to the submission of interactive data files in such exhibits and is not subject to liability under any anti-fraud provisions of the federal securities laws as long as the Registrant has made a good faith attempt to comply with the submission requirements and promptly amends the interactive data files after becoming aware that the interactive data files fail to comply with the submission requirements. These interactive data files are deemed not filed or part of a registration statement or prospectus for purposes of sections 11 or 12 of the Securities Act of 1933, as amended, are deemed not filed for purposes of section 18 of the Securities Exchange Act of 1934, as amended, and otherwise are not subject to liability under these sections.
# The schedules and certain exhibits to the Share Purchase Agreement have been omitted pursuant to Item 601(b) of Regulation S-K. A copy of the omitted schedules and exhibits will be furnished to the U.S. Securities and Exchange Commission supplementally upon request.
‡ Indicates management contract or compensatory plan or arrangement.
† Confidential treatment granted.
See Item 15(a)(3) above.
| | (c) Financial Statement Schedules |
See Item 15(a)(2) above.
Pursuant to the requirements of Section 13 or 15(d) of the Securities Exchange Act of 1934, as amended, the Registrant has duly caused this Annual Report on Form 10-K to be signed on its behalf by the undersigned, thereunto duly authorized, in the City of Fremont, State of California, on this 14th day of March 2013.
| | Procera Networks, Inc. |
| | | |
| Date: March 14, 2013 | By: | /s/ James Brear |
| | | James Brear |
| | | President and Chief Executive Officer |
| | | |
| Date: March 14, 2013 | By: | /s/ Charles Constanti |
| | | Charles Constanti |
| | | Chief Financial Officer |
POWER OF ATTORNEY
KNOW ALL PERSONS BY THESE PRESENTS, that each person whose signature appears below hereby constitutes and appoints, jointly and severally, James Brear and Charles Constanti, and each of them acting individually, as his attorney-in-fact, each with full power of substitution and resubstitution, for him or her in any and all capacities, to sign any and all amendments to this Annual Report on Form 10-, and to file the same, with exhibits thereto and other documents in connection therewith, with the Securities and Exchange Commission, granting unto said attorneys-in-fact full power and authority to do and perform each and every act and thing requisite and necessary to be done in connection therewith as fully to all intents and purposes as he might or could do in person, hereby ratifying and confirming all that said attorneys-in-fact, or their substitute or substitutes, may lawfully do or cause to be done by virtue hereof.
Pursuant to the requirements of the Securities Exchange Act of 1934, this Report has been signed below by the following persons on behalf of the Registrant and in the capacities and on the dates indicated.
| Name | | Title | | Date |
| |
| /s/ James Brear | | President and Chief Executive Officer | | March 14, 2013 |
| James Brear | | (Principal Executive Officer) and Director | | |
| | | | | |
| /s/ Charles Constanti | | Chief Financial Officer | | March 14, 2013 |
| Charles Constanti | | (Principal Accounting and Financial Officer) | | |
| | | | | |
| /s/ Thomas Saponas | | Director | | March 14, 2013 |
| Thomas Saponas | | | | |
| | | | | |
| /s/ Scott McClendon | | Director | | March 14, 2013 |
| Scott McClendon | | | | |
| | | | | |
| /s/ Mary Losty | | Director | | March 14, 2013 |
| Mary Losty | | | | |
| | | | | |
| /s/ Staffan Hillberg | | Director | | March 14, 2013 |
| Staffan Hillberg | | | | |
| | | | | |
| /s/ Elizabeth Huebner | | Director | | March 14, 2013 |
| Elizabeth Huebner | | | | |
| | | | | |
| /s/ B.G. Kumar | | Director | | March 14, 2013 |
| B.G. Kumar | | | | |
| | | | | |
| /s/ Alan Lefkof | | Director | | March 14, 2013 |
| Alan Lefkof | | | | |
| | | | | |
| /s/ William Slavin | | Director | | March 14, 2013 |
| William Slavin | | | | |
| 2.1*# Share Purchase Agreement, by and among the Company, Procera Networks Kelowna ULC, Vineyard Networks Inc., the shareholders of Vineyard Networks Inc. and John Drope & Associates Ltd., as representative of the shareholders of Vineyard Networks Inc., dated January 7, 2013, filed as Exhibit 2.1 to our current report on Form 8-K/A filed on February 13, 2013 and incorporated herein by reference. |
| 3.1* Articles of Incorporation, included as Exhibit 3.1 to our registration statement on form SB-2 filed on February 11, 2002 and incorporated herein by reference. |
| 3.2* Certificate of Amendment to Articles of Incorporation, included as Exhibit 99.1 to our current report on form 8-K filed on October 13, 2005 and incorporated herein by reference. |
| 3.3* Certificate of Amendment to Articles of Incorporation, included as Exhibit 3.3 to our quarterly report on form 10-Q filed on May 12, 2008 and incorporated herein by reference. |
| 3.4* Certificate of Amendment to Articles of Incorporation, included as Exhibit 3.1 to our current report on form 8-K filed on February 4, 2011 and incorporated herein by reference. |
| 3.5* Amended and Restated Bylaws, adopted on August 4, 2010, included as Exhibit 3.4 to our quarterly report on form 10-Q filed on August 9, 2010 and incorporated herein by reference. |
| 4.1* Form of Common Stock Certificate, included as Exhibit 4.1 to our current report on form 8-K filed on February 4, 2011 and incorporated herein by reference. |
| 10.1*‡ 2003 Stock Option Plan, included as Exhibit 10.1 to our registration statement on form SB-2 filed on January 8, 2004 and incorporated herein by reference. |
| 10.2*‡ Amended 2004 Stock Option Plan, included as Exhibit 99.3 to our current report on form 8-K filed on October 13, 2005 and incorporated herein by reference. |
| 10.3*‡ Restated Executive Employment Agreement for James F. Brear dated as of December 4, 2012 included as Exhibit 10.1 to our current report on form 8-K filed on December 5, 2012 and incorporated herein by reference. |
| 10.4*‡ Restated Executive Employment Agreement for Charles Constanti, dated as of December 3, 2012, included as Exhibit 10.2 to our current report on form 8-K filed on December 5, 2012 and incorporated herein by reference. |
| 10.5*‡ Form of Indemnity Agreement, included as Exhibit 10.6 to our quarterly report on form 10-Q filed on August 12, 2009 and incorporated herein by reference. |
| |
| 10.6* Amended and Restated Loan and Security Agreement by and between the Company and Silicon Valley Bank, dated February 3, 2012, included as Exhibit 10.1 to our current report on form 8-K filed on February 8, 2012 and incorporated herein by reference. |
| 10.7* Letter Agreement by and between the Company and GENBAND US LLC, dated July 19, 2010, included as Exhibit 10.2 to our quarterly report on form 10-Q filed on November 9, 2010 and incorporated herein by reference. |
| 10.8*† Master OEM Purchase and Sales Agreement among the Company, GENBAND US LLC and GENBAND Ireland Ltd., effective July 19, 2010, included as Exhibit 10.1 to our quarterly report on form 10-Q filed on November 9, 2010 and incorporated herein by reference. |
| 10.9*† Amendment No. 1 to Master OEM Purchase and Sales Agreement among the Company, GENBAND US LLC and GENBAND Ireland Ltd., dated November 19, 2010, included as Exhibit 10.17 to our annual report on form 10-K filed on March 16, 2011 and incorporated herein by reference. |
| 10.10*‡ Form of Restricted Stock Bonus Grant Notice (2007 Equity Incentive Plan), included as Exhibit 10.2 to our quarterly report on form 10-Q filed on May 10, 2011 and incorporated herein by reference. |
| 10.11*‡ Form of Restricted Stock Bonus Agreement (2007 Equity Incentive Plan), included as Exhibit 10.3 to our quarterly report on form 10-Q filed on May 10, 2011 and incorporated herein by reference. |
| 10.12*‡ Procera Networks, Inc. 2007 Equity Incentive Plan, as amended, included as Exhibit 10.1 to our current report form 8-K filed on August 28, 2012 and incorporated herein by reference. |
| 10.13*‡ Form of Inducement Grant Option Agreement entered into between the Company and certain Canadian employees, included as Exhibit 4.3 to our registration statement on Form S-8 filed on February 13, 2013 and incorporated herein by reference. |
| 10.14* Form of Inducement Grant Option Agreement entered into between the Company and certain U.S. employees, included as Exhibit 4.4 to our registration statement on Form S-8 filed on February 13, 2013 and incorporated herein by reference. |
21.1 List of Subsidiaries. |
23.1 Consent of Registered Public Accounting Firm – Ernst & Young LLP. |
23.2 Consent of Registered Public Accounting Firm – PMB Helin Donovan, LLP. |
| 24.1 Power of Attorney (included on signature page hereto). |
31.1 Certification of Principal Executive Officer pursuant to Rule 13a-14(a) and 15d-14(a) of the Securities Exchange Act of 1934, as adopted pursuant to Section 302 of the Sarbanes-Oxley Act of 2002. |
31.2 Certification of Principal Financial Officer pursuant to Rule 13a-14(a) and 15d-14(a) of the Securities Exchange Act of 1934, as adopted pursuant to Section 302 of the Sarbanes-Oxley Act of 2002. |
32.1 Certification of Principal Executive Officer and Principal Financial Officer pursuant to 18 U.S.C. Section 1350, as adopted pursuant to Section 906 of the Sarbanes-Oxley Act of 2002. |
| 101.INS+ XBRL Instance Document. |
| 101.SCH+ XBRL Taxonomy Extension Schema. |
| 101.CAL+ XBRL Taxonomy Extension Calculation Linkbase. |
| 101.DEF+ XBRL Taxonomy Extension Definition Linkbase. |
| 101.LAB+ XBRL Taxonomy Extension Label Linkbase. |
| 101.PRE+ XBRL Taxonomy Extension Presentation Linkbase. |
* Previously filed.
+ Pursuant to applicable securities laws and regulations, the Registrant is deemed to have complied with the reporting obligation relating to the submission of interactive data files in such exhibits and is not subject to liability under any anti-fraud provisions of the federal securities laws as long as the Registrant has made a good faith attempt to comply with the submission requirements and promptly amends the interactive data files after becoming aware that the interactive data files fail to comply with the submission requirements. These interactive data files are deemed not filed or part of a registration statement or prospectus for purposes of sections 11 or 12 of the Securities Act of 1933, as amended, are deemed not filed for purposes of section 18 of the Securities Exchange Act of 1934, as amended, and otherwise are not subject to liability under these sections.
# The schedules and certain exhibits to the Share Purchase Agreement have been omitted pursuant to Item 601(b) of Regulation S-K. A copy of the omitted schedules and exhibits will be furnished to the U.S. Securities and Exchange Commission supplementally upon request.
‡ Indicates management contract or compensatory plan or arrangement.
† Confidential treatment granted.
75