
SEPTEMBER 2021 Investor Presen t a t ion Exhibit 99.2
INVESTOR PRESENTATION SEPTEMBER 2021 Disclaimers 2 NON - GAAP FINANCIAL MEASURES As required by the rules of the Securities and Exchange Commission (“SEC”), we provide reconciliations of the non - GAAP financial measures contained in this presentation to the most directly comparable measure under GAAP or a pro forma measure prepared and presented in accordance with Article 11 of Regulation S - X, as applicable, which reconciliations are set forth in the financial tables attached to this presentation . This presentation contains the following non - GAAP financial measures : adjusted operating income, adjusted operating ratio, and adjusted earnings before interest, taxes, depreciation and amortization (“adjusted EBITDA”) for XPO’s North American less - than - truckload business for the trailing twelve months ended June 30 , 2021 , three months ended June 30 , 2021 and 2020 , six months ended June 30 , 2021 and June 30 , 2020 , the years ended December 31 , 2020 , 2019 , 2018 , 2017 , 2016 and 2015 ; pro forma adjusted EBITDA excluding the results of operations for GXO Logistics, Inc . (“ GXO ”) (“pro forma adjusted EBITDA”), pro forma adjusted net income (loss) attributable to common shareholders excluding the results of operations for GXO (“pro forma adjusted net income (loss)”), pro forma adjusted diluted earnings (loss) per share excluding the results of operations for GXO (“pro forma adjusted EPS”) and pro forma adjusted operating income (loss) on a consolidated basis and for our transportation segment and corporate for the three months ended June 30 , 2021 and 2020 ; pro forma adjusted EBITDA for the trailing twelve months ended June 30 , 2021 , twelve months ended December 31 , 2021 and six months ended June 30 , 2021 and 2020 ; and pro forma net debt and pro forma net leverage as of June 30 , 2021 . We believe that the above adjusted financial measures facilitate analysis of our ongoing business operations because they exclude items that may not be reflective of, or are unrelated to, XPO and its business segments' core operating performance, and may assist investors with comparisons to prior periods and assessing trends in our underlying businesses . Other companies may calculate these non - GAAP financial measures differently, and therefore our measures may not be comparable to similarly titled measures of other companies . These non GAAP financial measures should only be used as supplemental measures of our operating performance . Adjusted EBITDA, pro forma adjusted EBITDA, pro forma adjusted net income (loss) and pro forma adjusted EPS include adjustments for transaction and integration costs, as well as restructuring costs and other adjustments as set forth in the financial tables attached to this presentation . Transaction and integration adjustments are generally incremental costs that result from an actual or planned acquisition, divestiture or spin off and may include transaction costs, consulting fees, retention awards, and internal salaries and wages (to the extent the individuals are assigned full time to integration and transformation activities) and certain costs related to integrating and converging IT systems . Restructuring costs primarily relate to severance costs associated with business optimization initiatives . Management uses these non GAAP financial measures in making financial, operating and planning decisions and evaluating XPO's ongoing performance . We believe that adjusted EBITDA and pro forma adjusted EBITDA improve comparability from period to period by removing the impact of our capital structure (interest and financing expenses), asset base (depreciation and amortization), tax impacts and other adjustments as set out in the attached tables that management has determined are not reflective of core operating activities and thereby assist investors with assessing trends in our underlying businesses . We believe that pro forma adjusted net income (loss) and pro forma adjusted EPS improve the comparability of our operating results from period to period by removing the impact of certain costs and gains that management has determined are not reflective of our core operating activities, including amortization of acquisition related intangible assets . We believe that pro forma net debt and pro forma net leverage are important measures of our overall liquidity position . Pro forma net debt is calculated as total debt for XPO pre - spin ; less cash and cash equivalents ; less debt, primarily in the form of finance leases, attributed to GXO ; less net proceeds from GXO debt offering and XPO stock offering described in this presentation ; plus cash provided to GXO in connection with the spin - off . Pro forma net leverage is calculated as pro forma net debt divided by pro forma adjusted EBITDA for the trailing twelve months . With respect to our pro forma financial targets for the full year 2021 for adjusted EBITDA, adjusted diluted EPS and free cash flow ; our pro forma target for adjusted EBITDA for the last six months of 2021 ; and our pro forma net leverage, a reconciliation of these non - GAAP measures to the corresponding GAAP measures is not available without unreasonable effort due to the variability and complexity of the reconciling items described above that we exclude from these non - GAAP target measures . The variability of these items may have a significant impact on our future GAAP financial results and, as a result, we are unable to prepare the forward - looking statement of income and statement of cash flows prepared in accordance with GAAP that would be required to produce such a reconciliation .
INVESTOR PRESENTATION SEPTEMBER 2021 Disclaimers (cont.) 3 FORWARD - LOOKING STATEMENTS This document includes forward - looking statements within the meaning of Section 27 A of the Securities Act of 1933 , as amended, and Section 21 E of the Securities Exchange Act of 1934 , as amended, including our future growth prospects for adjusted EBITDA in our North American less - than - truckload business ; our pro forma full year 2021 financial targets for adjusted EBITDA, depreciation and amortization (excluding acquisition - related amortization expense), interest expense, effective tax rate, adjusted diluted EPS, net capital expenditures and free cash flow ; our pro forma adjusted EBITDA target for the last six months of 2021 ; and our pro forma net leverage . All statements other than statements of historical fact are, or may be deemed to be, forward - looking statements . In some cases, forward - looking statements can be identified by the use of forward - looking terms such as “anticipate,” “estimate,” “believe,” “continue,” “could,” “intend,” “may,” “plan,” “potential,” “predict,” “should,” “will,” “expect,” “objective,” “projection,” “forecast,” “goal,” “guidance,” “outlook,” “effort,” “target,” “trajectory” or the negative of these terms or other comparable terms . However, the absence of these words does not mean that the statements are not forward - looking . These forward - looking statements are based on certain assumptions and analyses made by us in light of our experience and our perception of historical trends, current conditions and expected future developments, as well as other factors we believe are appropriate in the circumstances . These forward - looking statements are subject to known and unknown risks, uncertainties and assumptions that may cause actual results, levels of activity, performance or achievements to be materially different from any future results, levels of activity, performance or achievements expressed or implied by such forward - looking statements . Factors that might cause or contribute to a material difference include the risks discussed in our filings with the SEC and the following : economic conditions generally ; the severity, magnitude, duration and aftereffects of the COVID - 19 pandemic and government responses to the COVID - 19 pandemic ; our ability to align our investments in capital assets, including equipment and service centers, to our customers' demands ; our ability to implement our cost and revenue initiatives ; our ability to successfully integrate and realize anticipated synergies, cost savings and profit improvement opportunities with respect to acquired companies ; matters related to our intellectual property rights ; fluctuations in currency exchange rates ; fuel price and fuel surcharge changes ; natural disasters, terrorist attacks or similar incidents ; risks and uncertainties regarding the August 2021 spin - off of GXO Logistics, including the impact of the spin - off on the size and business diversity of our company ; the ability of the spin - off to qualify for tax - free treatment for U . S . federal income tax purposes ; our ability to develop and implement suitable information technology systems and prevent failures in or breaches of such systems ; our substantial indebtedness ; our ability to raise debt and equity capital ; fluctuations in fixed and floating interest rates ; our ability to maintain positive relationships with our network of third - party transportation providers ; our ability to attract and retain qualified drivers ; labor matters, including our ability to manage our subcontractors, and risks associated with labor disputes at our customers and efforts by labor organizations to organize our employees ; litigation, including litigation related to alleged misclassification of independent contractors and securities class actions ; risks associated with our self - insured claims ; risks associated with defined benefit plans for our current and former employees ; and governmental regulation, including trade compliance laws, as well as changes in international trade policies and tax regimes ; governmental or political actions, including the United Kingdom's exit from the European Union ; and competition and pricing pressures . All forward - looking statements set forth in this deck are qualified by these cautionary statements and there can be no assurance that the actual results or developments anticipated by us will be realized or, even if substantially realized, that they will have the expected consequences to or effects on us or our business or operations . Forward - looking statements set forth in this deck speak only as of the date hereof, and we do not undertake any obligation to update forward - looking statements to reflect subsequent events or circumstances, changes in expectations or the occurrence of unanticipated events, except to the extent required by law .
INVESTOR PRESENTATION SEPTEMBER 2021 Table of contents 4 INVESTMENT HIGHLIGHTS 5 LESS - THAN - TRUCKLOAD (LTL) 13 TRUCK BROKERAGE 20 SUPPLEMENTAL MATERIALS 28
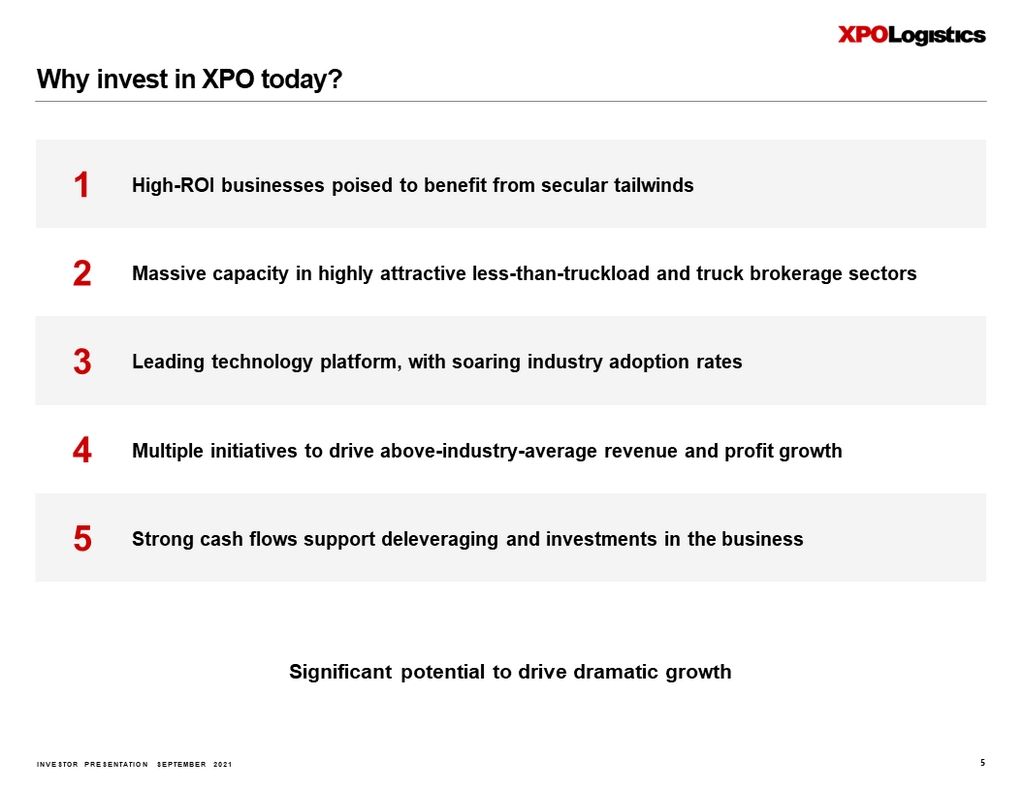
INVESTOR PRESENTATION SEPTEMBER 2021 Why invest in XPO today? 1 High - ROI businesses poised to benefit from secular tailwinds 2 Massive capacity in highly attractive less - than - truckload and truck brokerage sectors 3 Leading technology platform, with soaring industry adoption rates 4 Multiple initiatives to drive above - industry - average revenue and profit growth 5 Strong cash flows support deleveraging and investments in the business Significant potential to drive dramatic growth 5
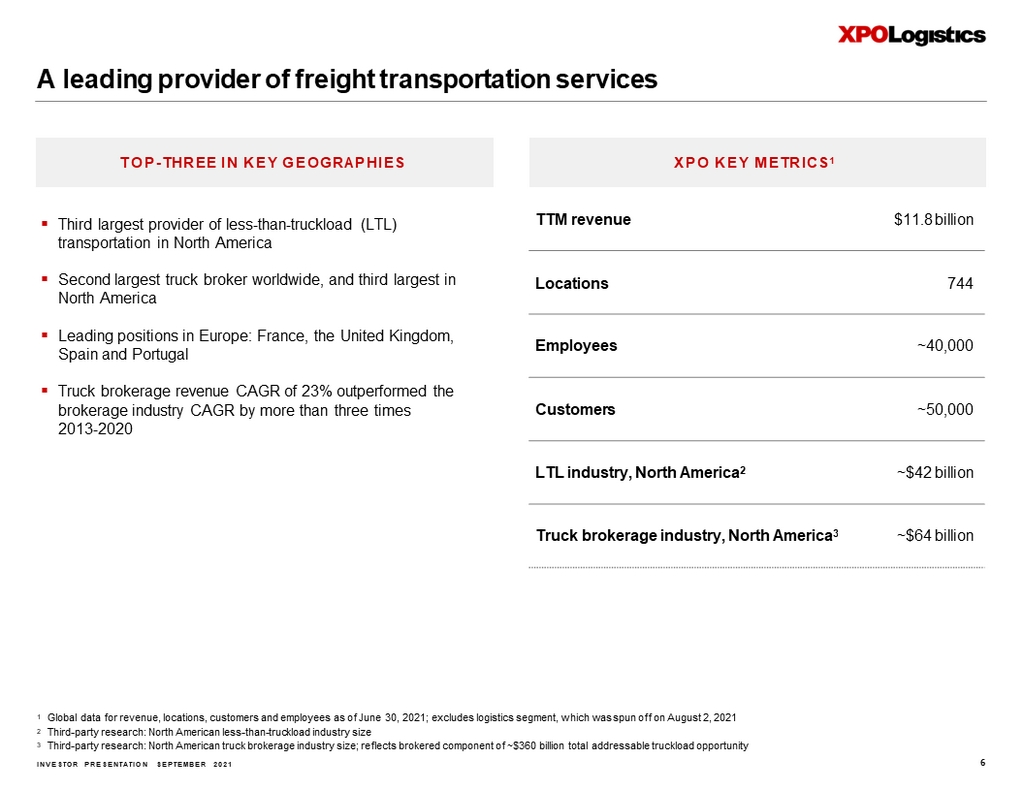
INVESTOR PRESENTATION SEPTEMBER 2021 TTM revenue $11.8 billion Locations 744 Employees ~40,000 Customers ~50,000 LTL industry, North America 2 ~$42 billion Truck brokerage industry, North America 3 ~$64 billion 1 Global data for revenue, locations, customers and employees as of June 30, 2021; excludes logistics segment, which was spun off on August 2, 2021 2 Third - party research: North American less - than - truckload industry size 3 Third - party research: North American truck brokerage industry size; reflects brokered component of ~$360 billion total addressable truckload opportunity ▪ Third largest provider of less - than - truckload (LTL) transportation in North America ▪ Second largest truck broker worldwide, and third largest in North America ▪ Leading positions in Europe: France, the United Kingdom, Spain and Portugal ▪ Truck brokerage revenue CAGR of 23% outperformed the brokerage industry CAGR by more than three times 2013 - 2020 XPO KEY METRICS 1 A leading provider of freight transportation services TOP - THREE IN KEY GEOGRAPHIES 6
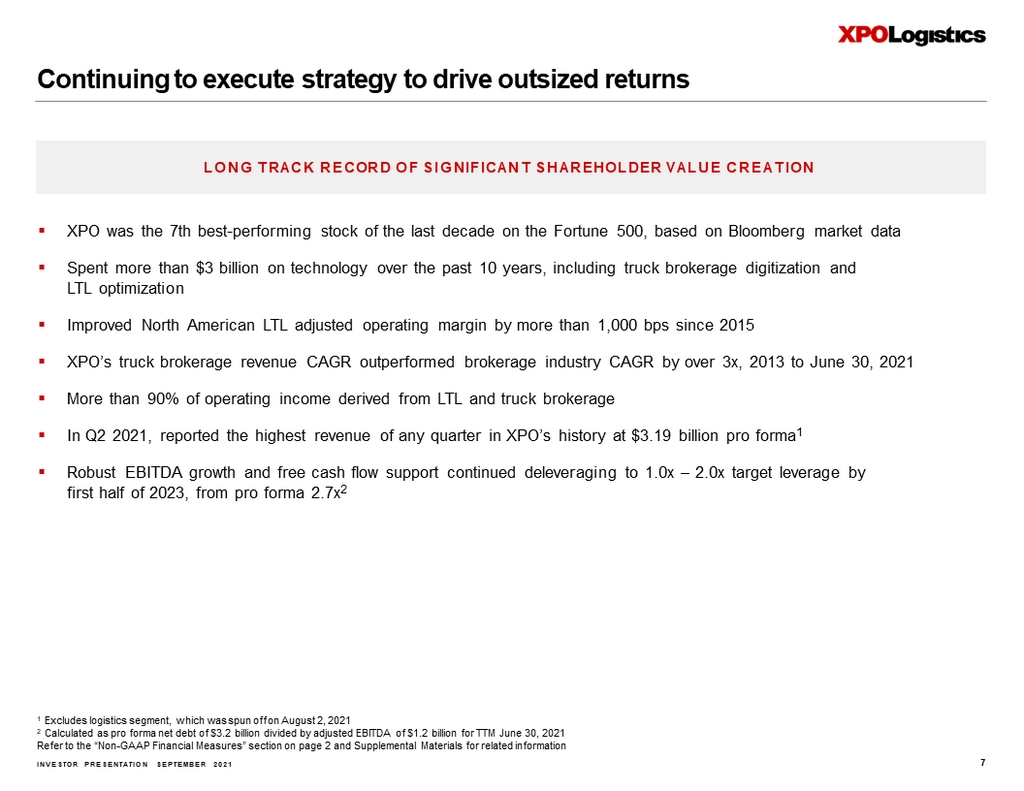
INVESTOR PRESENTATION SEPTEMBER 2021 Continuing to execute strategy to drive outsized returns ▪ XPO was the 7th best - performing stock of the last decade on the Fortune 500, based on Bloomberg market data ▪ Spent more than $3 billion on technology over the past 10 years, including truck brokerage digitization and LTL optimization ▪ Improved North American LTL adjusted operating margin by more than 1,000 bps since 2015 ▪ XPO’s truck brokerage revenue CAGR outperformed brokerage industry CAGR by over 3x, 2013 to June 30, 2021 ▪ More than 90% of operating income derived from LTL and truck brokerage ▪ In Q2 2021, reported the highest revenue of any quarter in XPO’s history at $3.19 billion pro forma 1 ▪ Robust EBITDA growth and free cash flow support continued deleveraging to 1.0x – 2.0x target leverage by first half of 2023, from pro forma 2.7x 2 LONG TRACK RECORD OF SIGNIFICANT SHAREHOLDER VALUE CREATION 1 Excludes logistics segment, which was spun off on August 2, 2021 2 Calculated as pro forma net debt of $3.2 billion divided by adjusted EBITDA of $1.2 billion for TTM June 30, 2021 Refer to the “Non - GAAP Financial Measures” section on page 2 and Supplemental Materials for related information 7
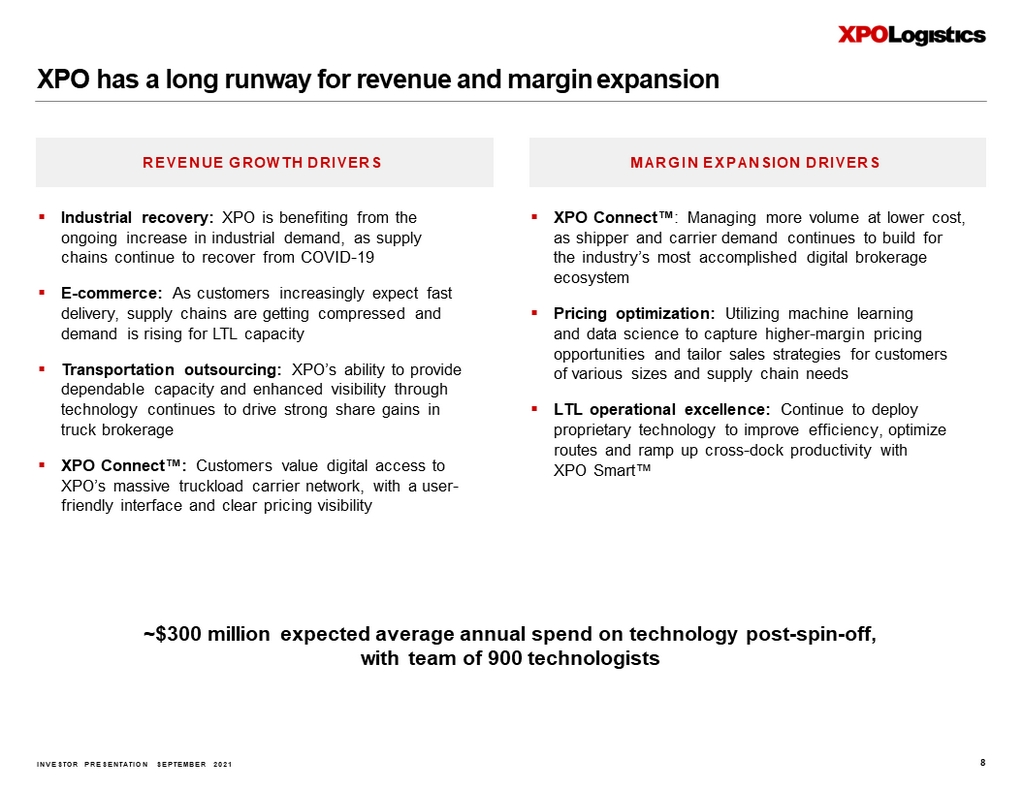
INVESTOR PRESENTATION SEPTEMBER 2021 XPO has a long runway for revenue and margin expansion REVENUE GROWTH DRIVERS ▪ Industrial recovery: XPO is benefiting from the ongoing increase in industrial demand, as supply chains continue to recover from COVID - 19 ▪ E - commerce: As customers increasingly expect fast delivery, supply chains are getting compressed and demand is rising for LTL capacity ▪ Transportation outsourcing: XPO’s ability to provide dependable capacity and enhanced visibility through technology continues to drive strong share gains in truck brokerage ▪ XPO Connect Œ : Customers value digital access to XPO’s massive truckload carrier network, with a user - friendly interface and clear pricing visibility MARGIN EXPANSION DRIVERS ƒ ;32&RQQHFW Œ 0DQDJLQJPRUHYROXPHDWORZHUFRVW DVVKLSSHUDQGFDUULHUGHPDQGFRQWLQXHVWREXLOGIRU WKHLQGXVWU\ ¶ VPRVWDFFRPSOLVKHGGLJLWDOEURNHUDJH HFRV\VWHP ƒ 3ULFLQJRSWLPL]DWLRQ 8WLOL]LQJPDFKLQHOHDUQLQJ DQGGDWDVFLHQFHWRFDSWXUHKLJKHU PDUJLQSULFLQJ RSSRUWXQLWLHVDQGWDLORUVDOHVVWUDWHJLHVIRUFXVWRPHUV RIYDULRXVVL]HVDQGVXSSO\FKDLQQHHGV ƒ /7/RSHUDWLRQDOH[FHOOHQFH &RQWLQXHWRGHSOR\ SURSULHWDU\WHFKQRORJ\WRLPSURYHHIILFLHQF\RSWLPL]H URXWHVDQGUDPSXSFURVV GRFNSURGXFWLYLW\ZLWK ;326PDUW Œ ~$300 million expected average annual spend on technology post - spin - off, with team of 900 technologists 8
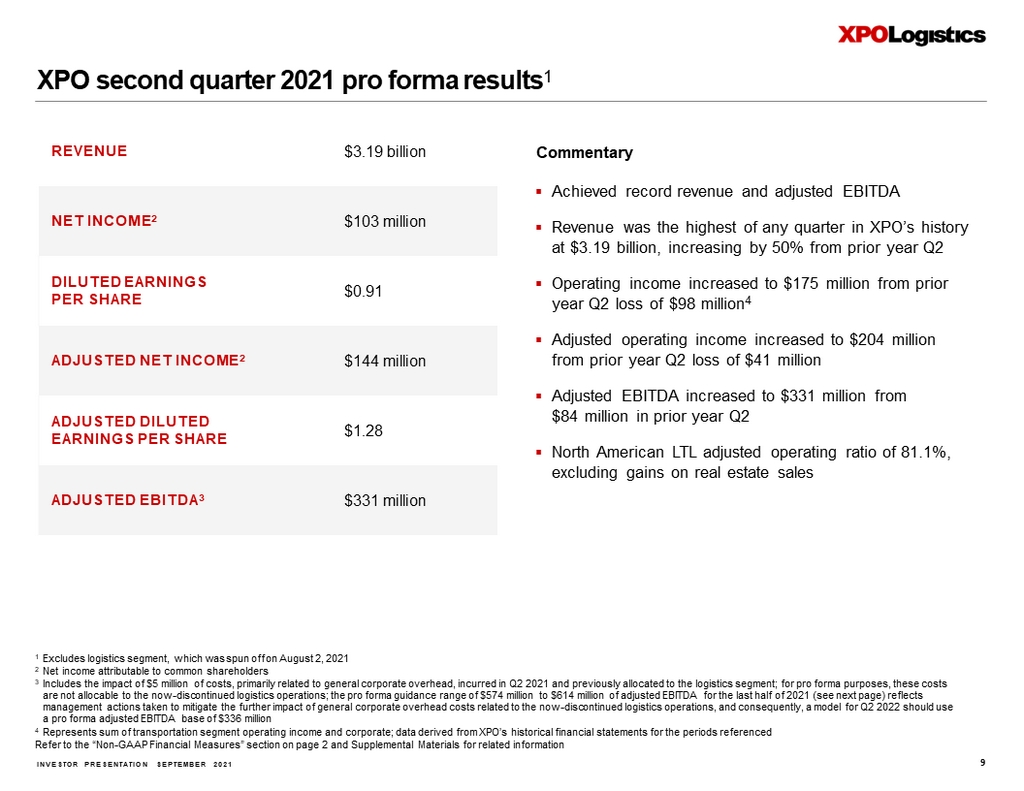
INVESTOR PRESENTATION SEPTEMBER 2021 Commentary ▪ Achieved record revenue and adjusted EBITDA ▪ Revenue was the highest of any quarter in XPO’s history at $3.19 billion, increasing by 50% from prior year Q2 ▪ Operating income increased to $175 million from prior year Q2 loss of $98 million 4 ▪ Adjusted operating income increased to $204 million from prior year Q2 loss of $41 million ▪ Adjusted EBITDA increased to $331 million from $84 million in prior year Q2 ▪ North American LTL adjusted operating ratio of 81.1%, excluding gains on real estate sales 1 Excludes logistics segment, which was spun off on August 2, 2021 2 Net income attributable to common shareholders 3 Includes the impact of $5 million of costs, primarily related to general corporate overhead, incurred in Q2 2021 and previous ly allocated to the logistics segment; for pro forma purposes, these costs are not allocable to the now - discontinued logistics operations; the pro forma guidance range of $574 million to $614 million of adjusted EBITDA for the last half of 2021 (see next page) reflects management actions taken to mitigate the further impact of general corporate overhead costs related to the now - discontinued logi stics operations, and consequently, a model for Q2 2022 should use a pro forma adjusted EBITDA base of $336 million 4 Represents sum of transportation segment operating income and corporate; data derived from XPO’s historical financial stateme nts for the periods referenced Refer to the “Non - GAAP Financial Measures” section on page 2 and Supplemental Materials for related information REVENUE $3.19 billion NET INCOME 2 $103 million DILUTED EARNINGS PER SHARE $0.91 ADJUSTED NET INCOME 2 $144 million ADJUSTED DILUTED EARNINGS PER SHARE $1.28 ADJUSTED EBITDA 3 $331 million XPO second quarter 2021 pro forma results 1

INVESTOR PRESENTATION SEPTEMBER 2021 1 Spin - off completed August 2, 2021 2 Pro forma for debt paid down in Q3 2021 Refer to the “Non - GAAP Financial Measures” section on page 2 XPO 2021 guidance ADJUSTED EBITDA $1.195 billion to $1.235 billion, including adjusted EBITDA of $574 million to $614 million generated in the last six months of 2021 DEPRECIATION AND AMORTIZATION $385 million to $395 million, excluding approximately $95 million of acquisition - related amortization expense ,17(5(67 (;3(16( $SSUR[LPDWHO\ PLOOLRQ EFFECTIVE TAX RATE 23% to 25% NET CAPITAL EXPENDITURES $250 million to $275 million ADJUSTED DILUTED EPS $4.00 to $4.30 , assumes 116 million shares outstanding FREE CASH FLOW $400 million to $450 million On July 28, 2021, XPO updated its pro forma full year financial targets in anticipation of the spin - off of its logistics segment 1 . These targets have been calculated as if the spin - off had been completed on January 1, 2021.
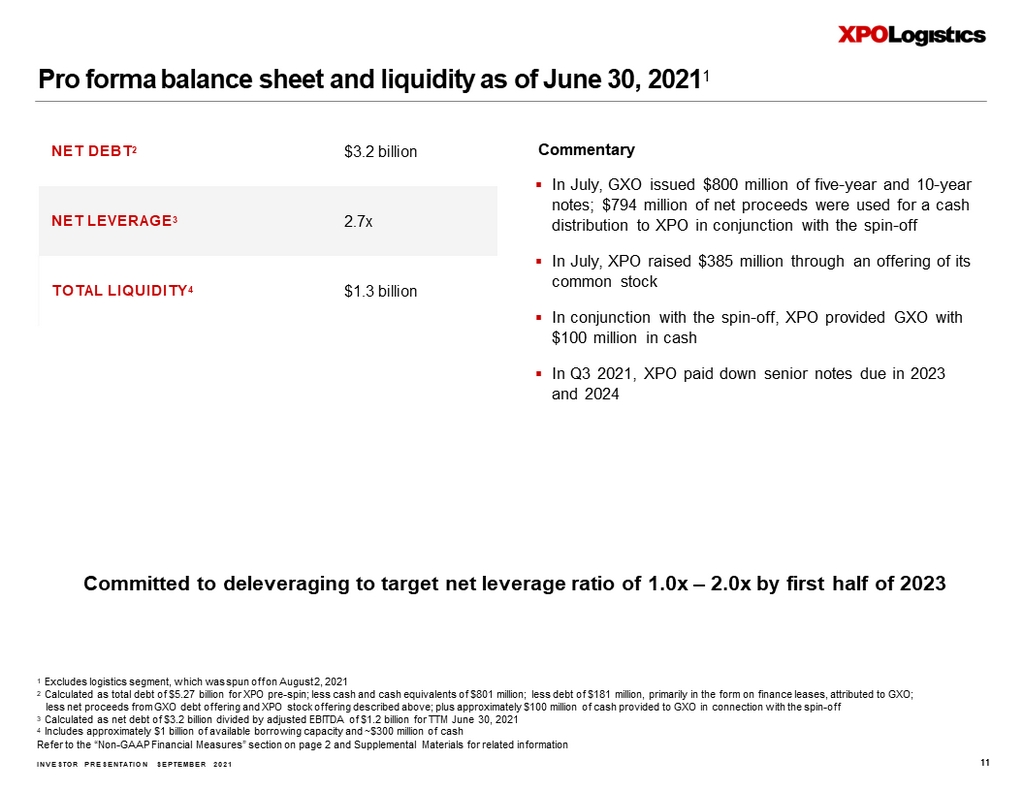
INVESTOR PRESENTATION SEPTEMBER 2021 Pro forma balance sheet and liquidity as of June 30, 2021 1 Commentary ▪ In July, GXO issued $800 million of five - year and 10 - year notes; $794 million of net proceeds were used for a cash distribution to XPO in conjunction with the spin - off ▪ In July, XPO raised $385 million through an offering of its common stock ▪ In conjunction with the spin - off, XPO provided GXO with $100 million in cash ▪ In Q3 2021, XPO paid down senior notes due in 2023 and 2024 NET DEBT 2 $3.2 billion NET LEVERAGE 3 2.7x TOTAL LIQUIDITY 4 $1.3 billion Committed to deleveraging to target net leverage ratio of 1.0x – 2.0x by first half of 2023 1 Excludes logistics segment, which was spun off on August 2, 2021 2 Calculated as total debt of $5.27 billion for XPO pre - spin; less cash and cash equivalents of $801 million; less debt of $181 million, primarily in the form on finance leases, attributed to GXO; less net proceeds from GXO debt offering and XPO stock offering described above; plus approximately $100 million of cash provided to GXO in connection with the spin - off 3 Calculated as net debt of $3.2 billion divided by adjusted EBITDA of $1.2 billion for TTM June 30, 2021 4 In cludes approximately $1 billion of available borrowing capacity and ~$300 million of cash Refer to the “Non - GAAP Financial Measures” section on page 2 and Supplemental Materials for related information 11

INVESTOR PRESENTATION SEPTEMBER 2021 Strong ESG culture, with chief diversity officer leading DE&I W o rk fo rc e and Talent Employee and Community Safety Diversity, Equity and Inclusion Info rma tion Security Environmental and Sustainability Governance ESG S c o r eca rd T a r g e t Ar ea s ESG targets tie to executive compensation program Core DE&I objectives relate to recruitment and retention ▪ Working to significantly increase the diversity of talent in the pipeline by collaborating with historically black colleges and universities (HBCUs) and others ▪ Promoting women and minority employees to middle and senior management roles ▪ Communicating culture of belonging to an expanded range of underrepresented groups, replicating XPO’s success with hiring LGBTQ+ community members and military veterans XPO’s proprietary CO 2 calculator, CarbonNET , helps document emissions activity data XPO extended its decade - long commitment to the CO 2 Charter in France 12
L e s s - th a n - t r u ckl o a d ( L TL)

INVESTOR PRESENTATION SEPTEMBER 2021 Note: LTL is the transportation of a quantity of freight that is larger than a parcel but too small to require an entire truc k, often shipped on pallets. Freight for different customers is consolidated in the same trailer. XPO is a top three provider of LTL transportation in North America ▪ Significant competitive advantages from one of the few national LTL networks, and ~20,000 customer accounts, including many longstanding relationships ▪ Favorable industry trends, including the recovery in industrial demand and the rapid growth of e - commerce ▪ North American LTL industry characterized by rational pricing dynamics ▪ Company - specific technology initiatives and significant economies of scale ▪ Self - learning LTL technology optimizes routing, load - building and labor productivity ▪ Over 12,000 professional XPO truck drivers, particularly valued by customers in the current truck driver shortage, which is predicted to continue DRIVERS OF XPO’S LTL REVENUE AND MARGIN GROWTH 14
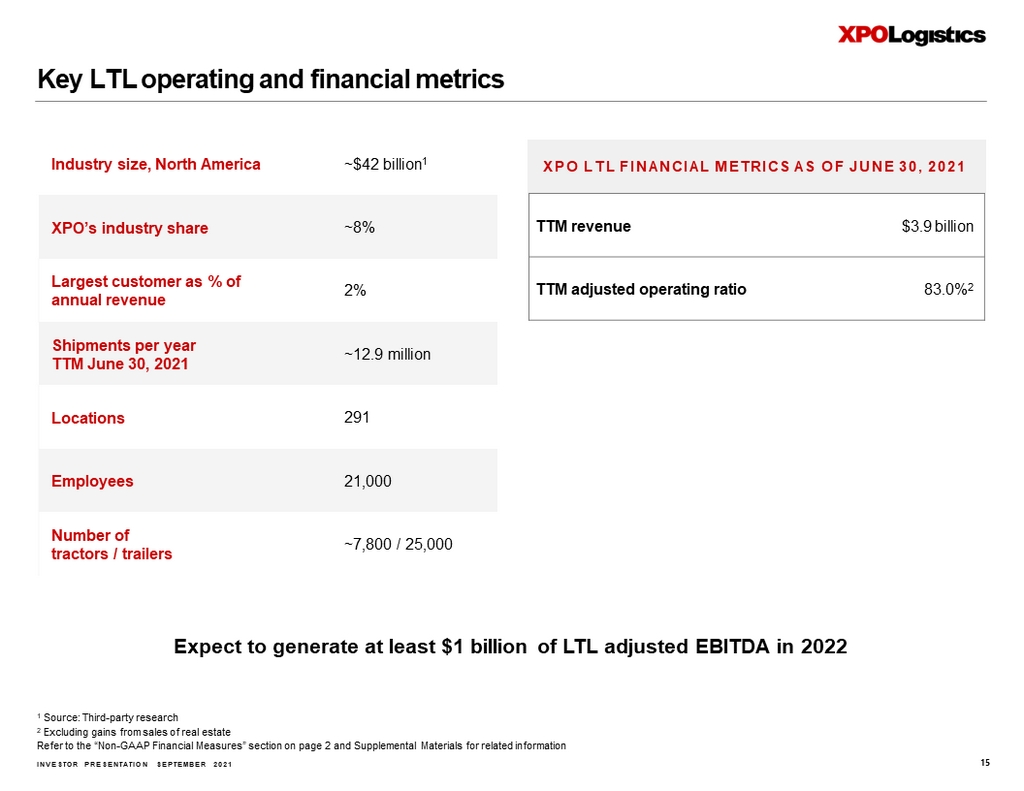
INVESTOR PRESENTATION SEPTEMBER 2021 TTM r evenue $3.9 billion TTM adjusted operating ratio 83.0% 2 Key LTL operating and financial metrics 1 Source: Third - party research 2 Excluding gains from sales of real estate Refer to the “Non - GAAP Financial Measures” section on page 2 and Supplemental Materials for related information Industry size, North America ~$42 billion 1 XPO’s industry share ~8% Largest customer as % of annual revenue 2% Shipments per year TTM June 30, 2021 ~12.9 million Locations 291 Employees 21,000 Number of tractors / trailers ~7,800 / 25,000 Expect to generate at least $1 billion of LTL adjusted EBITDA in 2022 XPO LTL FINANCIAL METRICS AS OF JUNE 30, 2021 15
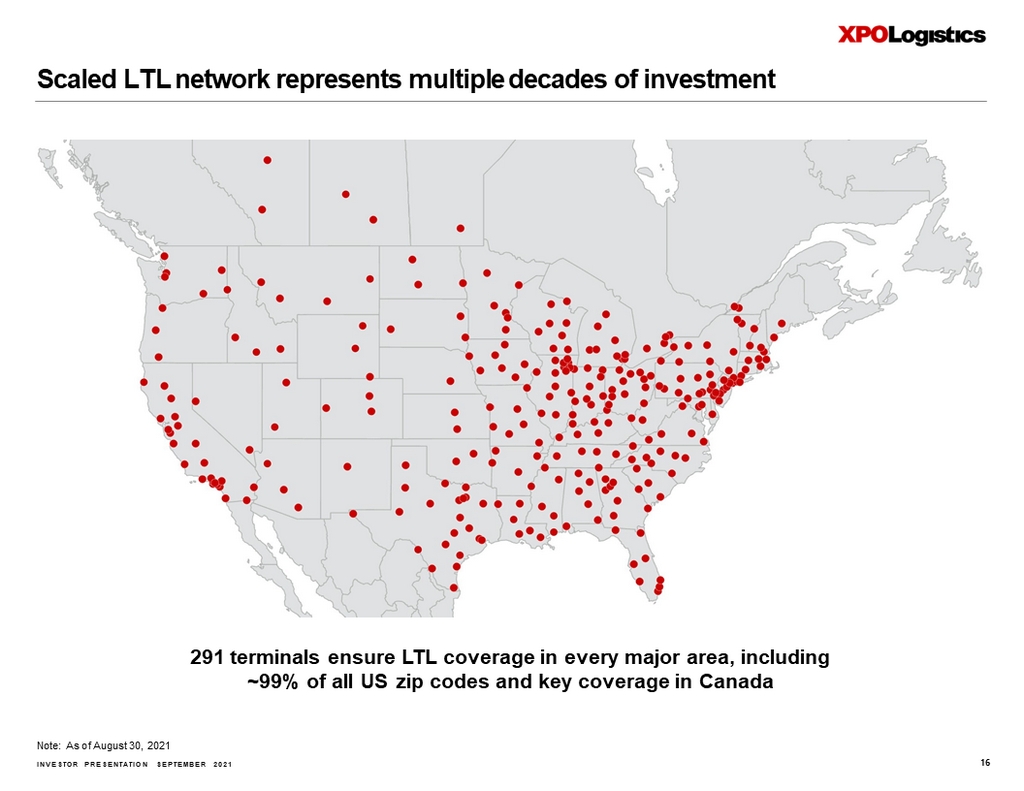
INVESTOR PRESENTATION SEPTEMBER 2021 Scaled LTL network represents multiple decades of investment Note: As of August 30, 2021 291 terminals ensure LTL coverage in every major area, including ~99% of all US zip codes and key coverage in Canada 16
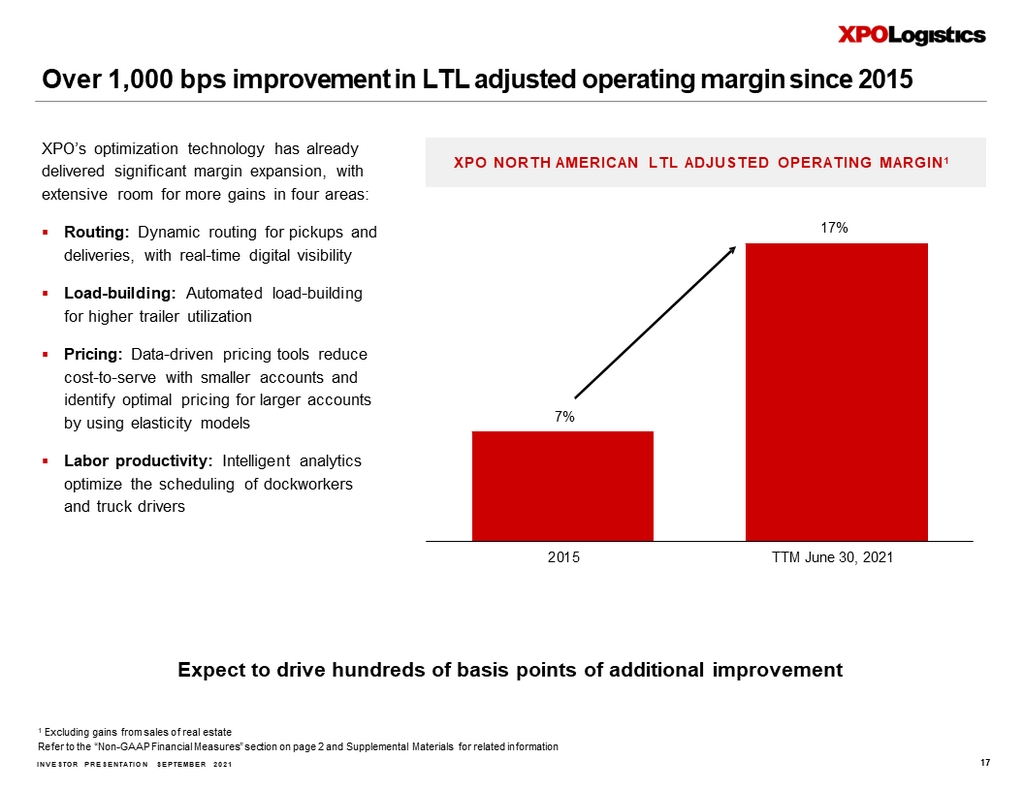
INVESTOR PRESENTATION SEPTEMBER 2021 Over 1,000 bps improvement in LTL adjusted operating margin since 2015 7% 1 7 % 2 0 15 TTM J une 30, 2021 1 Excluding gains from sales of real estate Refer to the “Non - GAAP Financial Measures” section on page 2 and Supplemental Materials for related information Expect to drive hundreds of basis points of additional improvement XPO NORTH AMERICAN LTL ADJUSTED OPERATING MARGIN 1 XPO’s optimization technology has already delivered significant margin expansion, with extensive room for more gains in four areas: ▪ Routing: Dynamic routing for pickups and deliveries, with real - time digital visibility ▪ Load - building: Automated load - building for higher trailer utilization ▪ Pricing: Data - driven pricing tools reduce cost - to - serve with smaller accounts and identify optimal pricing for larger accounts by using elasticity models ▪ Labor productivity: Intelligent analytics optimize the scheduling of dockworkers and truck drivers 17
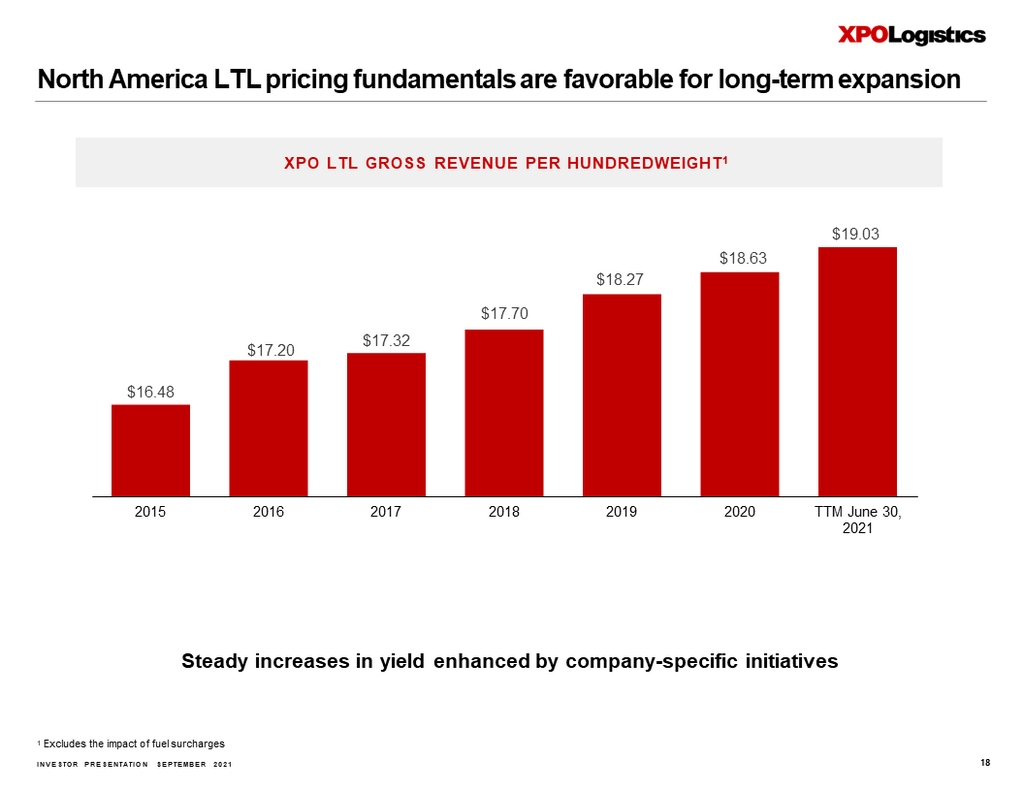
INVESTOR PRESENTATION SEPTEMBER 2021 North America LTL pricing fundamentals are favorable for long - term expansion $ 16 . 48 $ 17 . 20 $ 17 . 32 $ 19 . 03 $ 18.63 $ 18.27 $ 17.70 2015 2016 2017 2018 2019 2020 TTM June 30, 2021 1 Excludes the impact of fuel surcharges XPO LTL GROSS REVENUE PER HUNDREDWEIGHT 1 Steady increases in yield enhanced by company - specific initiatives 18
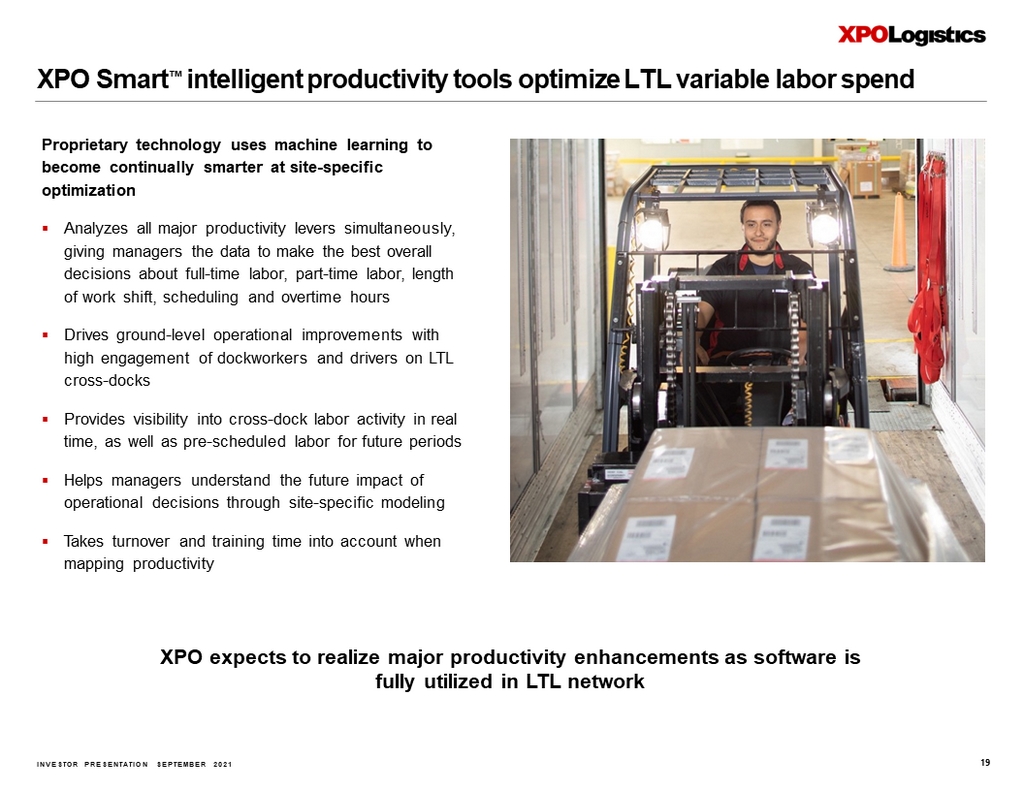
INVESTOR PRESENTATION SEPTEMBER 2021 XPO Smart Œ intelligent productivity tools optimize LTL variable labor spend XPO expects to realize major productivity enhancements as software is fully utilized in LTL network Proprietary technology uses machine learning to become continually smarter at site - specific optimization ▪ Analyzes all major productivity levers simultaneously, giving managers the data to make the best overall decisions about full - time labor, part - time labor, length of work shift, scheduling and overtime hours ▪ Drives ground - level operational improvements with high engagement of dockworkers and drivers on LTL cross - docks ▪ Provides visibility into cross - dock labor activity in real time, as well as pre - scheduled labor for future periods ▪ Helps managers understand the future impact of operational decisions through site - specific modeling ▪ Takes turnover and training time into account when mapping productivity 19

T ru c k b r o kera g e
INVESTOR PRESENTATION SEPTEMBER 2021 Note: Truck brokerage is a non - asset business that facilitates the movement of full truckloads of freight, typically from a sing le shipper. A broker purchases truck capacity from independent carriers. XPO is the second largest truck broker worldwide ▪ Massive capacity of 85,000 carriers globally, representing a total of one million trucks ▪ First - mover technology advantage with investments in automation starting in 2011, ahead of the curve ▪ Proprietary, cutting - edge digital brokerage platform with soaring adoption rates ▪ Proven ability of XPO Connect Œ to drive profit growth with more volume at less cost ▪ Blue - chip customer base across diverse verticals ▪ Agile, non - asset model designed to make money in any market environment ▪ Highly experienced leadership team that has worked together for many years, bringing unmatched agility and expertise to the business DRIVERS OF XPO’S BROKERAGE REVENUE AND MARGIN GROWTH 21
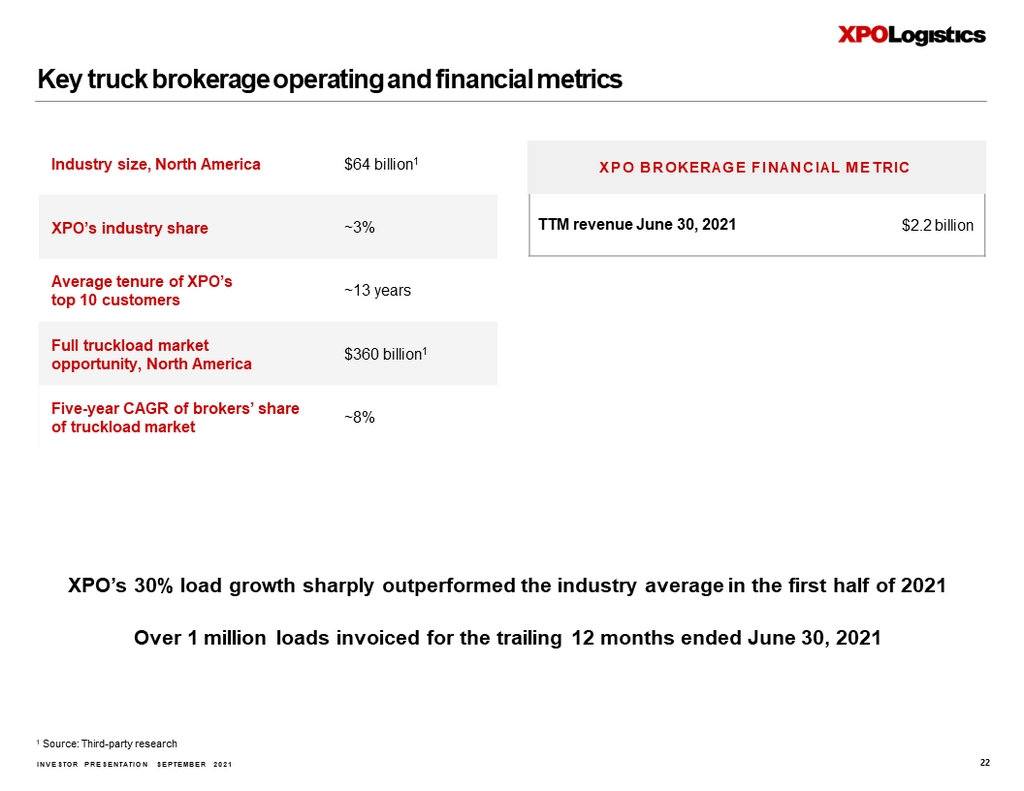
INVESTOR PRESENTATION SEPTEMBER 2021 T TM revenue June 30, 2021 $2.2 billion Key truck brokerage operating and financial metrics 1 Source: Third - party research XPO BROKERAGE FINANCIAL METRIC Industry size, North America $64 billion 1 XPO’s industry share ~3% Average tenure of XPO’s top 10 customers ~13 years Full truckload market opportunity, North America $360 billion 1 Five - year CAGR of brokers’ share of truckload market ~8% XPO’s 30% load growth sharply outperformed the industry average in the first half of 2021 Over 1 million loads invoiced for the trailing 12 months ended June 30, 2021 22
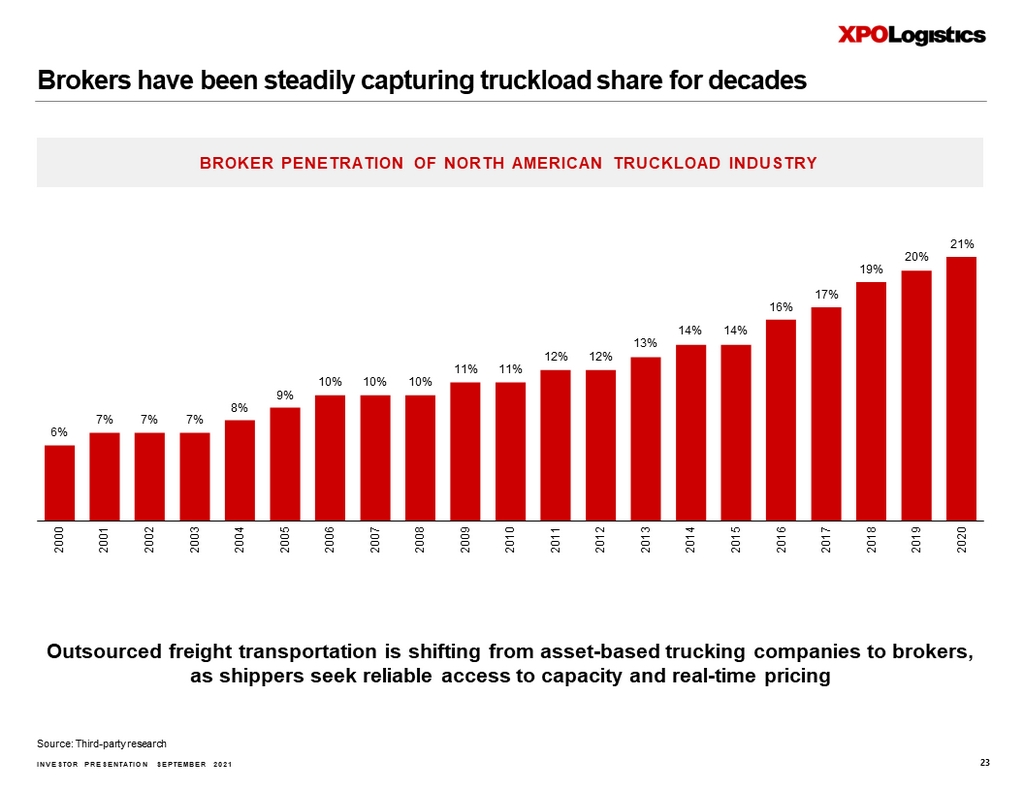
INVESTOR PRESENTATION SEPTEMBER 2021 6% 7% 7% 7% 21% 20% 19% 17% 16% 14% 14% 13% 12% 12% 11% 11% 10% 10% 10% 9% 8% 2000 2001 2002 2003 2004 2005 2006 2007 2008 2009 2010 2011 2012 2013 2014 2015 2016 2017 2018 2019 2020 Source: Third - party research Brokers have been steadily capturing truckload share for decades BROKER PENETRATION OF NORTH AMERICAN TRUCKLOAD INDUSTRY Outsourced freight transportation is shifting from asset - based trucking companies to brokers, as shippers seek reliable access to capacity and real - time pricing 23

INVESTOR PRESENTATION SEPTEMBER 2021 XPO’s brokerage revenue CAGR has outperformed industry by more than 3x 1 Third - party research: North American truck brokerage industry size; reflects brokered component of ~$360 billion total addressable truckload opportunity $39 billion $64 billion 2013 2020 $397 million $1.66 billion 2013 2020 US BROKERAGE INDUSTRY GROWTH 2013 - 2020 1 XPO BROKERAGE REVENUE GROWTH 2013 - 2020 24
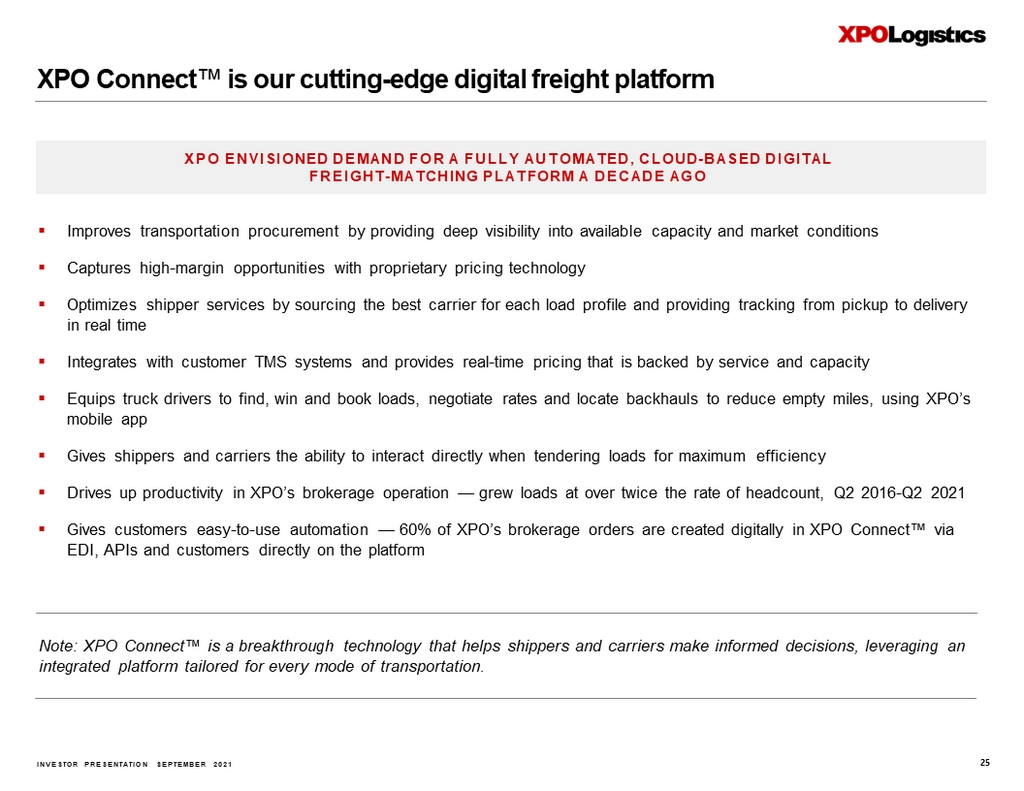
INVESTOR PRESENTATION SEPTEMBER 2021 XPO Connect Œ is our cutting - edge digital freight platform ▪ Improves transportation procurement by providing deep visibility into available capacity and market conditions ▪ Captures high - margin opportunities with proprietary pricing technology ▪ Optimizes shipper services by sourcing the best carrier for each load profile and providing tracking from pickup to delivery in real time ▪ Integrates with customer TMS systems and provides real - time pricing that is backed by service and capacity ▪ Equips truck drivers to find, win and book loads, negotiate rates and locate backhauls to reduce empty miles, using XPO’s mobile app ▪ Gives shippers and carriers the ability to interact directly when tendering loads for maximum efficiency ▪ Drives up productivity in XPO’s brokerage operation — grew loads at over twice the rate of headcount, Q2 2016 - Q2 2021 ▪ Gives customers easy - to - use automation — 60% of XPO’s brokerage orders are created digitally in XPO Connect Œ via EDI, APIs and customers directly on the platform XPO ENVISIONED DEMAND FOR A FULLY AUTOMATED, CLOUD - BASED DIGITAL FREIGHT - MATCHING PLATFORM A DECADE AGO Note: XPO Connect Œ is a breakthrough technology that helps shippers and carriers make informed decisions, leveraging an integrated platform tailored for every mode of transportation. 25
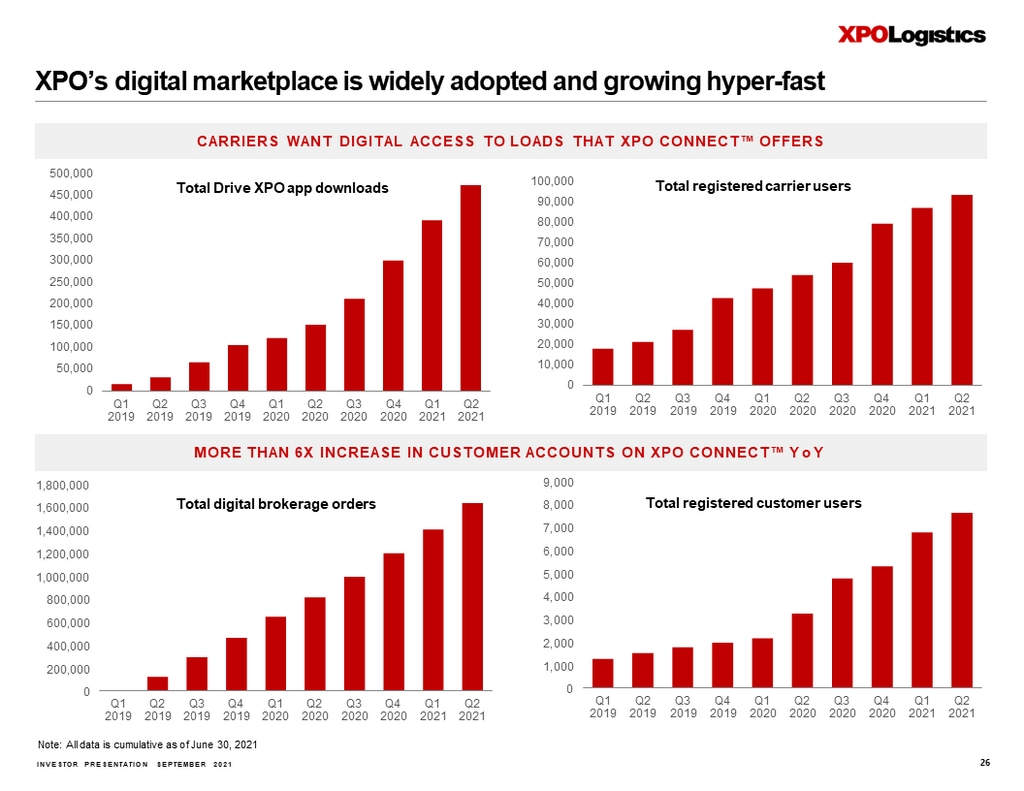
INVESTOR PRESENTATION SEPTEMBER 2021 Total Drive XPO app downloads Total registered carrier users Total registered customer users CARRIERS WANT DIGITAL ACCESS TO LOADS THAT XPO CONNECT Œ OFFERS Total digital brokerage orders Note: All data is cumulative as of June 30, 2021 MORE THAN 6X INCREASE IN C USTOMER ACCOUNTS ON XPO CONNECT Œ YoY 500,000 450,000 400,000 350,000 300,000 250,000 200,000 150,000 100,000 50,000 0 Q1 Q2 Q3 Q4 Q1 Q2 Q3 201 9 201 9 201 9 201 9 202 0 202 0 2020 Q4 Q1 Q2 202 0 202 1 2021 100,000 90,000 80,000 70,000 60,000 50,000 40,000 30,000 20,000 10,000 0 Q1 Q2 Q3 Q4 Q1 Q2 Q3 Q4 Q1 Q2 201 9 201 9 201 9 201 9 202 0 202 0 202 0 202 0 202 1 2021 9 , 000 8 , 000 7 , 000 6 , 000 5 , 000 4 , 000 3 , 000 2 , 000 1 , 000 0 Q1 Q2 Q3 Q4 Q1 Q2 Q3 Q4 Q1 Q2 201 9 201 9 201 9 201 9 202 0 202 0 202 0 202 0 202 1 2021 1,800,000 1,600,000 1,400,000 1,200,000 1,000,000 800,000 600,000 400,000 200,000 0 Q1 Q2 Q3 Q4 Q1 Q2 Q3 Q4 Q1 Q2 201 9 201 9 201 9 201 9 202 0 202 0 202 0 202 0 202 1 2021 XPO’s digital marketplace is widely adopted and growing hyper - fast 26
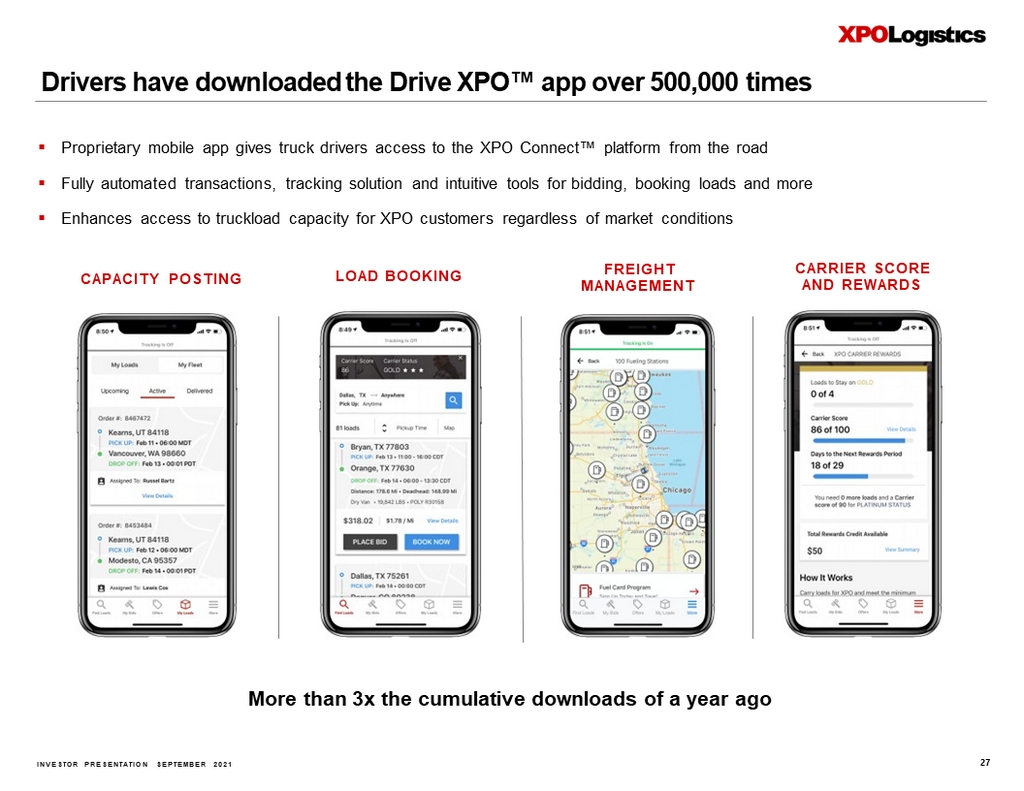
INVESTOR PRESENTATION SEPTEMBER 2021 FREIGHT M ANA G E M E N T CARRIER SCORE AND REWARDS CAPACITY POSTING LOAD BOOKING Drivers have downloaded the Drive XPO Œ app over 500,000 times More than 3x the cumulative downloads of a year ago ▪ Proprietary mobile app gives truck drivers access to the XPO Connect Œ platform from the road ▪ Fully automated transactions, tracking solution and intuitive tools for bidding, booking loads and more ▪ Enhances access to truckload capacity for XPO customers regardless of market conditions 27

Supplemen t al materials
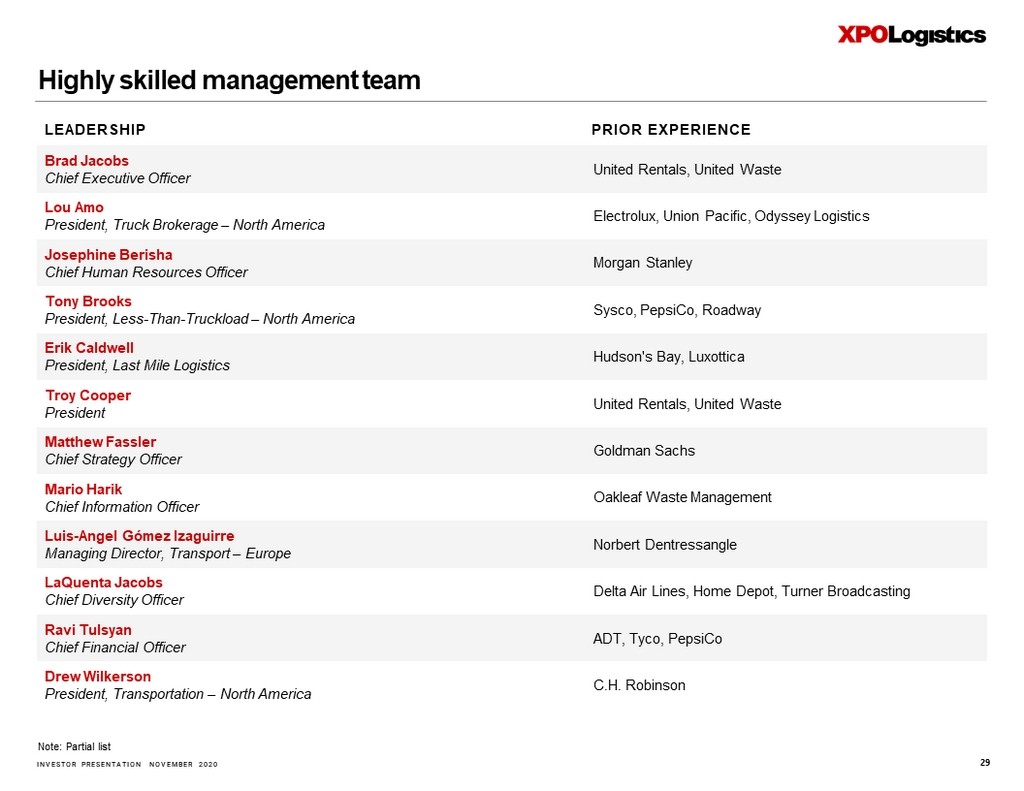
INVESTOR PRESENTATION NOVEMBER 2020 Highly skilled management team Brad Jacobs Chief Executive Officer United Rentals, United Waste Lou Amo President, Truck Brokerage – North America Electrolux, Union Pacific, Odyssey Logistics Josephine Berisha Chief Human Resources Officer Morgan Stanley Tony Brooks President, Less - Than - Truckload – North America Sysco, PepsiCo, Roadway Erik Caldwell President, Last Mile Logistics Hudson's Bay, Luxottica Troy Cooper President United Rentals, United Waste Matthew Fassler Chief Strategy Officer Goldman Sachs Mario Harik Chief Information Officer Oakleaf Waste Management Luis - Angel Gómez Izaguirre Managing Director, Transport – Europe Norbert Dentressangle LaQuenta Jacobs Chief Diversity Officer Delta Air Lines, Home Depot, Turner Broadcasting Ravi Tulsyan Chief Financial Officer ADT, Tyco, PepsiCo Drew Wilkerson President, Transportation – North America C.H. Robinson LEADERSHIP Note: Partial list PRIOR EXPERIENCE 29
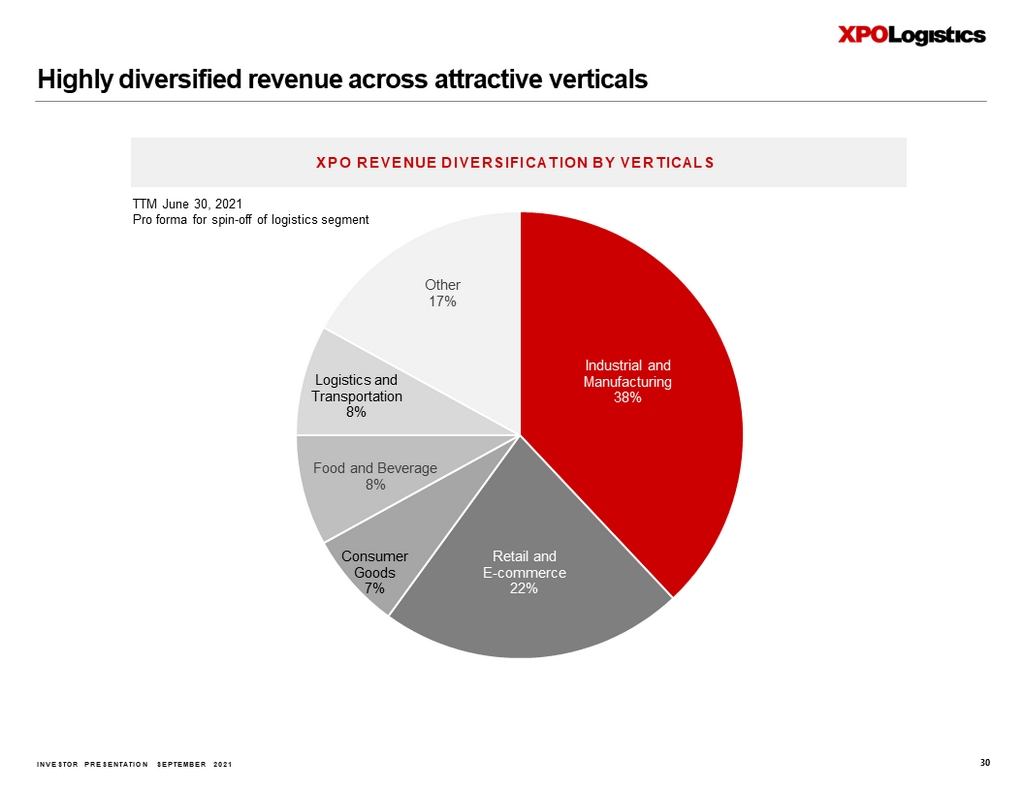
INVESTOR PRESENTATION SEPTEMBER 2021 Industrial and Manufacturing 38% Retail and E - commerce 22% Consumer Goods 7% Food and Beverage 8% Logistics and Transportation 8% Other 17% TTM June 30, 2021 Pro forma for spin - off of logistics segment XPO REVENUE DIVERSIFICATION BY VERTICALS Highly diversified revenue across attractive verticals 30

INVESTOR PRESENTATION SEPTEMBER 2021 142 146 170 200 232 263 302 346 397 459 520 598 840 914 1,006 1,105 1,210 2008A 2009A 2010A 2011A 2012A 2013A 2014A 2015A 2016A 2017A 2018A 2019A 2020A 2021E 2022E 2023E 2024E #1 last mile logistics provider for heavy goods TTM revenue $1 billion Hub locations 85 Employees 3 ~1 , 80 0 Carriers / trucks ~1,800 / ~4,300 TTM deliveries and installations per year Ov e r 1 1 m illio n ▪ XPO is the largest last mile provider for heavy goods ▪ Outstanding customer satisfaction levels resulting from in - house expertise, digital consumer engagement via XPO technology and high - quality network of independent contractors ▪ Customers include omnichannel retail, e - commerce and direct - to - consumer manufacturers ▪ Asset - light platform positioned within 125 miles of 90% of the US population; independent contractor network ▪ XPO Connect Œ tools balance route efficiency with consumer at - home availability A cce l e r a ti n g g r o w t h o f e - c o mm e r ce i n c l ud e s tr e n d t o w a r d m o r e b i g a n d bu l k y good s bough t on li ne US e - commerce, $ in billions Note: Last mile logistics is the facilitation of deliveries to consumer homes, often with white - glove service. XPO specializes in last mile logistics for heavy goods, such as appliances, furniture and large electronics. North American industry size: ~$13 billion 1 . XPO KEY METRICS 2 INDUSTRY LEADER IN NORTH AMERICA 1 Source: Third - party research 2 Data as of June 30, 2021, North America 3 Additionally ~800 temporary workers 31
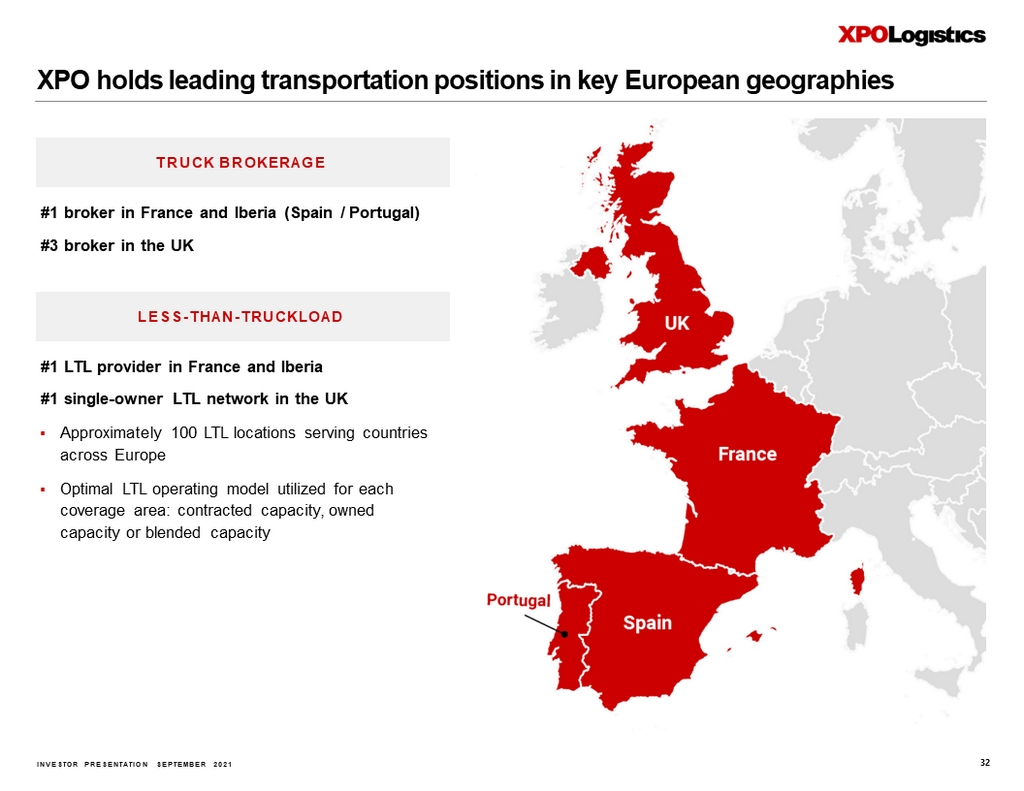
INVESTOR PRESENTATION SEPTEMBER 2021 XPO holds leading transportation positions in key European geographies TRUCK BROKERAGE #1 LTL provider in France and Iberia #1 single - owner LTL network in the UK ▪ Approximately 100 LTL locations serving countries across Europe ▪ Optimal LTL operating model utilized for each coverage area: contracted capacity, owned capacity or blended capacity LESS - THAN - TRUCKLOAD #1 broker in France and Iberia ( Spain / Portugal) #3 broker in the UK 32

INVESTOR PRESENTATION SEPTEMBER 2021 XPO is widely recognized for performance and culture ▪ Named one of the World’s Most Admired Companies by Fortune, 2018, 2019, 2020, 2021 ▪ Ranked #1 in the Fortune 500 category of Transportation and Logistics, 2017, 2018, 2019, 2020, 2021 ▪ Named one of Spain’s Best Companies to Work For by Forbes, 2019, 2020, 2021 ▪ Named a Leader in the Magic Quadrant for 3PL Providers by Gartner, 2017, 2018, 2019, 2020, 2021 ▪ Received Intel’s Supplier Achievement Award for COVID response, 2021 ▪ Recognized by General Motors with Supplier of the Year Award for aftermarket distribution 2019, managed transportation 2020, 2021 ▪ Named a Top 100 3PL by Inbound Logistics, 2014, 2015, 2016, 2017, 2018, 2019, 2020, 2021 ▪ Named one of Best Leadership Teams and Best CEOs for Diversity by Comparably, 2021 ▪ Winner of Dow Chemical’s Sustainability Award for road transportation, 2021 ▪ Named LTL Collaborator of the Year by GlobalTranz, 2021 ▪ Recognized as one of the Most Socially Responsible Companies in France by Statista, 2020 ▪ Honored with Whirlpool Corporation Intermodal Carrier of the Year Award and Maytag Dependability Award, 2020 ▪ Ranked #7 of the Top 20 UK Companies for Quality of Workplace Culture by the Chartered Management Institute, 2020 ▪ Ranked in top three of the Top 100 Transport Companies in France by l’Officiel des Transporteurs, 2019, 2020 ▪ Recognized by Ford Motor Company with World Excellence Awards, 2019 silver - level, 2020 gold - level ▪ Recognized by Owens Corning as Supplier of the Year Award, 2020 ▪ Recognized by Raytheon Company with EPIC Supplier Excellence Award for on - time delivery, 2019 ▪ Named a European Diversity Leader by the Financial Times, 2019 ▪ Ranked in top 100 of America's Most Responsible Companies by Newsweek, 2019 ▪ Named a Winning “W” Company by 2020 Women on Boards for gender diversity of the board of directors, 2019 ▪ Named a Disruptive Technology Leader on the Freight.Tech 25 by FreightWaves, 2019 ▪ Recognized by Nissan Manufacturing UK for excellence at Operational Logistics Awards, 2014, 2015, 2016, 2017, 2018, 2019 ▪ Ranked #3 of the Glassdoor Top 20 UK companies with the best leadership and culture, 2018, 2019 ▪ Awarded Best Employer Practice Award for partnership with DS Workfit by British Association for Supported Employment, 2019 ▪ CEO Jacobs ranked #10 on Barron's readers list of World's Best CEOs, 2018 ▪ Named to the Fortune Future 50 list of US companies best positioned for breakout growth, 2018 33

INVESTOR PRESENTATION SEPTEMBER 2021 Select ed highlights of XPO’s people - first culture ▪ Road to Zero program helped decrease the percentages of distracted driving, lost work days and crashes by double - digits in 2020 ▪ Appointed a Chief Diversity Officer and launched a Diversity and Inclusion Council in 2020 ▪ Launched a Sustainability Steering Committee and a Diversity and Inclusion Steering Committee in Europe in 2020 ▪ Named 2021 transportation partner of 3 - Day Walks ® for Susan G. Komen Foundation in its fight against breast cancer ▪ Partnered with Hispanic Association of Colleges and Universities to provide financial support for HACU’s objectives ▪ Partnered with Truckers Against Trafficking to help combat human trafficking ▪ Recognized by Human Rights Campaign on the Corporate Equality Index (CEI) for LGBTQ+ inclusion, 2020, 2021 ▪ Recognized by Disability:IN and the American Association of People with Disabilities on the Disability Equality Index, 2021 ▪ Donated services to Soles4Souls, a non - profit committed to disrupting the cycle of poverty ▪ Partnered with a leading virtual clinic for women and families to provide supplemental health services for employees ▪ Tuition benefit reimburses employees up to $5,250 annually for pursuing continuing education ▪ Robust recruitment initiatives emphasize diversity hiring; awarded Viqtory’s bronze - level Military - Friendly Employer ® ▪ Company celebrates Black History, Women’s History, Hispanic Heritage, LGBTQ+ Pride and Military Appreciation months Progressive Pregnancy Care and Family Bonding benefits ▪ Any XPO employee, male or female, receives up to six weeks of 100% paid postnatal leave as primary caregiver; women receive up to 20 days of 100% paid prenatal leave for health and wellness ▪ “Automatic yes" pregnancy accommodations granted on request; more extensive accommodations easily arranged ▪ XPO guarantees that a woman will continue to be paid her regular base wage rate, and remain eligible for wage increases, while her pregnancy accommodations are in effect 34
INVESTOR PRESENTATION SEPTEMBER 2021 XPO is strongly committed to sustainability ▪ CarbonNET, XPO’s proprietary, cloud - based calculator, helps document emission sources, activity data and CO 2 calculations ▪ Named a Top 75 Green Supply Chain Partner by Inbound Logistics for 2016, 2017, 2018, 2019, 2020, 2021 ▪ Awarded Trophées EVE 2020 for implementing an “urban river” solution to reduce CO 2 emissions during inner - city deliveries in Paris, in cooperation with the Ports of Paris, City of Paris, Île - de - France region and Voies Navigables de France ▪ Renewed three - year commitment to the CO 2 Charter in France, extending 10 - year commitment to sustainability ▪ Expanded fleet with 80 liquified natural gas (LNG) trucks in Europe in 2020; now over 250 natural gas trucks in Europe ▪ Invested in fuel - efficient Freightliner Cascadia tractors in North America (EPA - compliant and GHG14 - compliant technology), and Stralis Natural Power Euro VI tractors in Europe ▪ European fleet has reduced fuel consumption by 10% since 2015 ▪ Partnered with ENGIE Solutions, a leading provider of sustainable mobility, to transport natural gas in cryogenic tanks capable of maintaining extremely low temperatures ▪ XPO mega - trucks in Spain can reduce CO 2 emissions by up to 20% by transporting more freight per trip ▪ XPO drivers train in responsible eco - driving and fuel usage reduction techniques ▪ North American LTL locations implementing phased upgrades to LED lighting ▪ Experimenting in Europe with diesel - electric hybrids and zero - emission electric vans for last mile service ▪ Utilizing electronic waybills and documentation in global operations to reduce paper and other waste The latest XPO Sustainability Report is available online at sustainability.xpo.com 35
INVESTOR PRESENTATION SEPTEMBER 2021 Business glossary XPO SERVICES ▪ Less - than - truckload (LTL): LTL is the transportation of a quantity of freight that is larger than a parcel but too small to require an entire truck, and is often shipped on a pallet. LTL shipments are priced according to the weight of the freight, its commodity class (generally determined by cube/weight ratio and type of product), and mileage within designated lanes. An LTL carrier typically operates a hub - and - spoke network that allows for the consolidation of multiple shipments for different customers in single trucks. XPO is the third largest LTL provider in North America, with a national network that provides customers with geographic density and day - definite regional, inter - regional and transcontinental LTL freight services, including cross - border US service to and from Mexico and Canada, and intra - Canada service. The company also has one of the largest LTL networks in Western Europe, using a blended model of owned and contracted capacity to provide customers with domestic and pan - European solutions. ▪ Truck brokerage: Truck brokerage is a variable - cost business that facilitates the trucking of freight by procuring carriers through the use of technology, typically referred to as a TMS (transportation management system). Brokerage net revenue is the spread between the price to the shipper and the cost of purchased transportation. The vast majority of truck brokerage shipments are full truckload; cargo is provided by a single shipper in an amount that requires the full limit of the trailer, either by dimension or weight. XPO is the second largest freight broker globally and the third largest in North America. The company matches shippers’ loads with third - party independent contractors that have the ability to interact directly on the company’s proprietary XPO Connect Œ digital platform (see below). Truck brokers have steadily increased their share of the for - hire trucking market throughout cycles, and shippers and carriers increasingly value automation, making digital truck brokerage one of the strongest trends in the freight transportation industry. XPO TECHNOLOGY ▪ XPO Connect Œ : XPO’s proprietary, fully automated, self - learning digital freight marketplace connects shippers and carriers directly, as well as through company operations. XPO Connect Œ gives shippers comprehensive visibility into current market conditions, including fluctuations in capacity, spot rates by geography and digital negotiating through an automated counteroffer feature. Carriers can post available truck capacity and bid on loads, and shippers can tender loads and track their freight in real time. Drivers use the Drive XPO Œ app for mobile access to XPO Connect Œ from the road. The app also serves as a geo - locator and supports voice - to - text communications. The cloud - based XPO Connect Œ platform is deployed globally. ▪ XPO Smart Œ : XPO’s proprietary, intelligent labor optimization tools improve productivity in cross - dock operations at XPO’s LTL network terminals. 36

INVESTOR PRESENTATION SEPTEMBER 2021 Financial reconciliations The following table reconciles XPO’s pro forma net income (loss) attributable to common shareholders for the periods ended June 30, 2021 and 2020 to pro forma adjusted EBITDA for the same periods. Note: NM = not meaningful 1 Relates to Series A Preferred Stock and comprises actual preferred stock dividends and non - cash allocation of undistributed earnings 2 Calculated by applying the overall estimated effective tax rate to the pre - tax amount, unless the nature of the item and/or tax jurisdiction in which the item has been recorded require(s) a specific tax rate and/or treatment, in which case the required tax rate or treatment is used to calculate the tax effect Note: Adjusted EBITDA was prepared assuming 100% ownership of XPO Logistics Europe in all periods Refer to the “Non - GAAP Financial Measures” section on page 2 of this document RECONCILIATION OF PRO FORMA ADJUSTED EBITDA $ in millions (unaudited) 2021 2020 Change % Pro forma net income (loss) attributable to common shareholders $ 103 $ ( 123 ) NM Distributed and undistributed net income (1) - 1 Net income (loss) attributable to noncontrolling interests (1) (3) Net income (loss) 102 ( 125 ) NM Debt extinguishment loss - - Interest expense 49 70 Income tax provision (benefit) (2) 30 (39) Depreciation and amortization expense 119 118 Unrealized (gain) loss on foreign currency option and forward contracts 2 3 Transaction and integration costs 28 28 Restructuring costs 1 29 Pro forma adjusted EBITDA $ 331 $ 84 294.0% T h r e e M o n t hs E n d e d J u n e 30 , 37
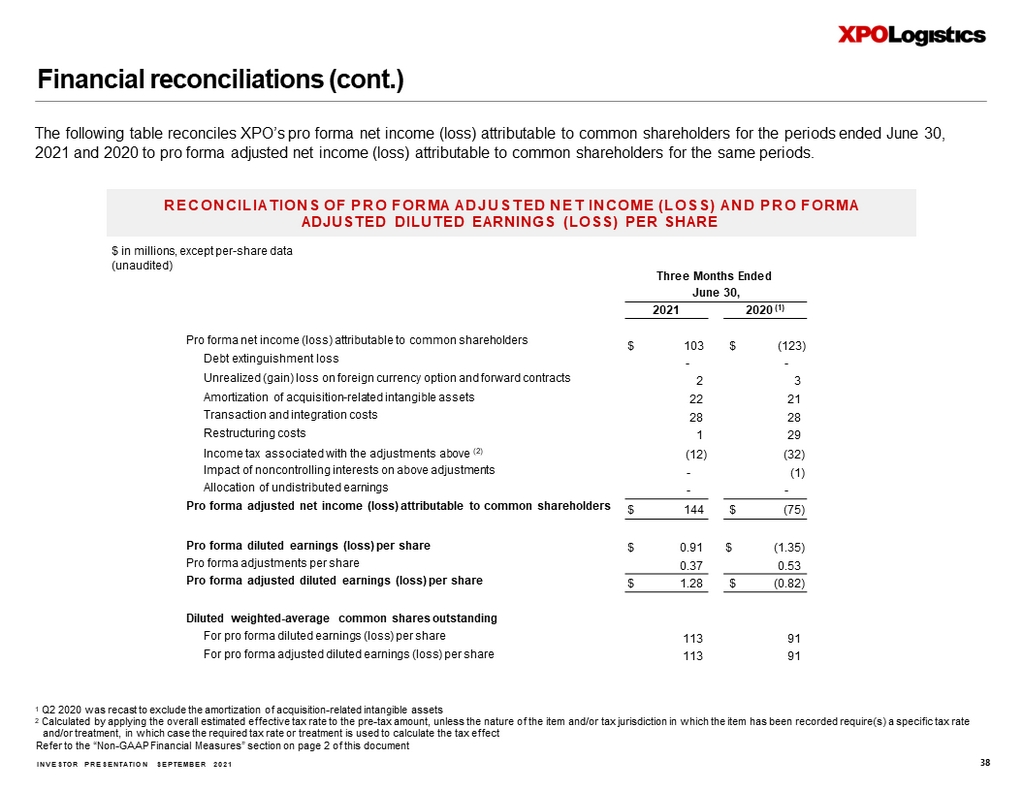
INVESTOR PRESENTATION SEPTEMBER 2021 Financial reconciliations (cont.) 1 Q2 2020 was recast to exclude the amortization of acquisition - related intangible assets 2 Calculated by applying the overall estimated effective tax rate to the pre - tax amount, unless the nature of the item and/or tax jurisdiction in which the item has been recorded require(s) a specific tax rate and/or treatment, in which case the required tax rate or treatment is used to calculate the tax effect Refer to the “Non - GAAP Financial Measures” section on page 2 of this document The following table reconciles XPO’s pro forma net income (loss) attributable to common shareholders for the periods ended June 30, 2021 and 2020 to pro forma adjusted net income (loss) attributable to common shareholders for the same periods. R E C O NC I L I A T IO N S O F P R O F O R M A AD J U STE D N E T I NC O M E ( L O SS ) AN D P R O F O R M A ADJUSTED DILUTED EARNINGS ( LOSS) PER SHARE $ in millions, except per - share data (unaudited) 2021 2020 (1) Pro forma net income (loss) attributable to common shareholders Debt extinguishment loss Unrealized (gain) loss on foreign currency option and forward contracts $ 103 - 2 $ (123) - 3 Amortization of acquisition - related intangible assets 22 21 Transaction and integration costs 28 28 Restructuring costs 1 29 Income tax associated with the adjustments above (2) (12) (32) Impact of noncontrolling interests on above adjustments Allocation of undistributed earnings - - (1) - Pro forma adjusted net income (loss) attributable to common shareholders $ 144 $ (75) Pro forma diluted earnings (loss) per share $ 0.91 $ (1.35) Pro forma adjustments per share 0.37 0.53 Pro forma adjusted diluted earnings (loss) per share $ 1.28 $ (0.82) Diluted weighted - average common shares outstanding For pro forma diluted earnings (loss) per share 113 91 For pro forma adjusted diluted earnings (loss) per share 113 91 Th r e e M on t hs E nd e d June 30, 38
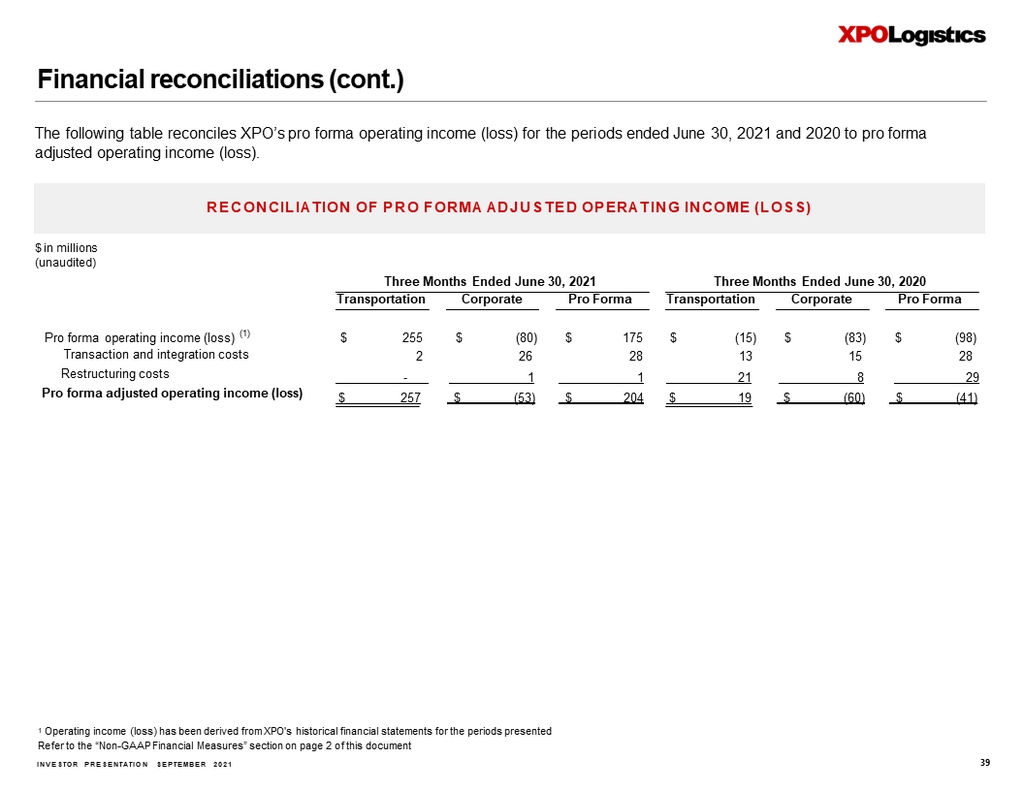
INVESTOR PRESENTATION SEPTEMBER 2021 1 Operating income (loss) has been derived from XPO's historical financial statements for the periods presented Refer to the “Non - GAAP Financial Measures” section on page 2 of this document The following table reconciles XPO’s pro forma operating income (loss) for the periods ended June 30, 2021 and 2020 to pro forma adjusted operating income (loss). R E C O NC I L I A T IO N O F P R O F O R M A AD J U STE D O PE RA T I N G I NC O M E ( L O SS ) $ in millions (unaudited) Pro forma operating income (loss) (1) $ 255 $ (80) $ 175 $ (15) $ (83) $ (98) Transaction and integration costs 2 26 28 13 15 28 Restructuring costs Pro forma adjusted operating income (loss) - 1 1 21 8 29 $ 257 $ (53) $ 204 $ 19 $ (60) $ (41) Three Months Ended June 30, 2021 Transportation Corporate Pro Forma Three Months Ended June 30, 2020 Transportation Corporate Pro Forma Financial reconciliations (cont.) 39

INVESTOR PRESENTATION SEPTEMBER 2021 Financial reconciliations (cont.) The following table reconciles XPO’s operating income attributable to the company’s North American less - than - truckload business for the trailing twelve months ended June 30, 2021, the quarters ended June 30, 2021 and 2020, the six - month periods ended June 30, 2021 and 2020, and the years ended December 31, 2020, 2019, 2018, 2017, 2016 and 2015 to adjusted operating income, adjusted operating ratio and adjusted EBITDA for the same periods. 1 Operating income, adjusted operating income and adjusted EBITDA include real estate gains of $5 million and $10 million for t he three months ended June 30, 2021 and 2020, respectively, and $62 million for the trailing twelve months ended June 30, 2021 2 Operating ratio is calculated as (1 - (operating income divided by revenue)) 3 Other income primarily consists of pension income 4 Adjusted operating ratio is calculated as (1 - (adjusted operating income divided by revenue)); adjusted operating margin is th e inverse of adjusted operating ratio 5 Excluding the impact of gains on real estate transactions from both periods, adjusted operating ratio improved by 1,030 basis p oints, from 91.4% in Q2 2020 to 81.1% in Q2 2021 6 Excluding the impact of gains on real estate transactions, adjusted operating ratio is 83.0% for the trailing twelve months e nd ed June 30, 2021 Note: Refer to the “Non - GAAP Financial Measures” section on page 2 of this document RECONCILIATIONS OF NORTH AMERICAN LESS - THAN - TRUCKLOAD ADJUSTED OPERATING RATIO AND ADJUSTED EBITDA $ in millions (unaudited) Revenue (excluding fuel surcharge revenue) $ 3,375 $ 917 $ 700 $ 1,744 $ 1,475 $ 3,106 $ 3,259 $ 3,230 $ 3,140 $ 3,035 $ 3,081 Fuel surcharge revenue 517 164 92 299 215 433 532 552 455 370 448 Revenue 3,892 1,081 792 2,043 1,690 3,539 3,791 3,782 3,595 3,405 3,529 Salaries, wages and employee benefits 1,834 486 416 939 853 1,748 1,786 1,754 1,697 1,676 1,741 Purchased transportation 387 116 70 210 157 334 397 400 438 438 508 Fuel and fuel-related taxes 228 71 35 134 92 186 264 293 234 191 230 Other operating expenses 509 145 147 279 265 495 471 590 574 538 635 Depreciation and amortization 222 57 58 112 114 224 227 243 233 203 164 Rents and leases 72 19 15 37 30 65 49 44 42 41 49 Operating income (1) 640 187 51 332 179 487 597 458 377 318 202 Operating ratio (2) 83.6% 82.7% 93.6% 83.7% 89.4% 86.2% 84.3% 87.9% 89.5% 90.7% 94.3% Transaction, integration and rebranding costs - - 3 - 5 5 - - 19 24 21 Restructuring costs (1) - 5 - 5 4 3 3 - - - Amortization expense 34 9 9 17 17 34 34 33 34 34 10 Other income (3) 50 14 10 28 21 43 22 29 12 - - Depreciation adjustment from updated purchase price allocation of acquired assets - - - - - - - - - (2) - Adjusted operating income (1) $ 723 $ 210 $ 78 $ 377 $ 227 $ 573 $ 656 $ 523 $ 442 $ 374 $ 233 Adjusted operating ratio (4) (5) (6) 81.4% 80.6% 90.1% 81.5% 86.6% 83.8% 82.7% 86.2% 87.7% 89.0% 93.4% Depreciation expense 188 48 49 95 97 190 193 210 199 169 154 Other 1 - - - - 1 2 - 6 4 (6) Adjusted EBITDA (1) $ 912 $ 258 $ 127 $ 472 $ 324 $ 764 $ 851 $ 733 $ 647 $ 547 $ 381 2021 20202021 2020 2020 2019 2018 2017 2016 Trailing Twelve Months Ended June 30, 2021 2015 Three Months Ended June 30, Years Ended December 31,Six Months Ended June 30, 40
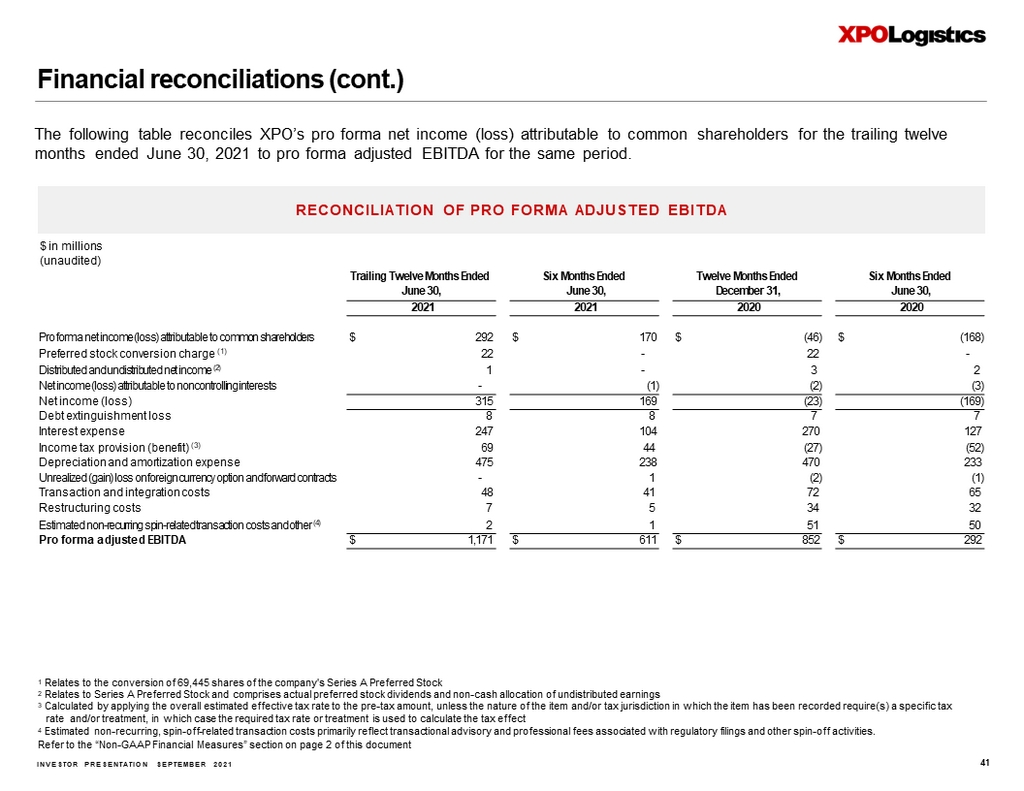
INVESTOR PRESENTATION SEPTEMBER 2021 1 Relates to the conversion of 69,445 shares of the company's Series A Preferred Stock 2 Relates to Series A Preferred Stock and comprises actual preferred stock dividends and non - cash allocation of undistributed earnings 3 Calculated by applying the overall estimated effective tax rate to the pre - tax amount, unless the nature of the item and/or tax jurisdiction in which the item has been recorded require(s) a specific tax rate and/or treatment, in which case the required tax rate or treatment is used to calculate the tax effect 4 Estimated non - recurring, spin - off - related transaction costs primarily reflect transactional advisory and professional fees associated with regulatory filings and other spin - off activities. Refer to the “Non - GAAP Financial Measures” section on page 2 of this document The following table reconciles XPO’s pro forma net income (loss) attributable to common shareholders for the trailing twelve months ended June 30, 2021 to pro forma adjusted EBITDA for the same period. RECONCILIATION OF PRO FORMA ADJUSTED EBITDA $ in millions (unaudited) 2021 2021 2020 2020 Pro forma net income (loss) attributable to common shareholders $ 292 $ 170 $ (46) $ (168) P r e f e rr e d s t o c k c on v e r s i o n c ha r g e ( 1 ) 22 - 22 - Distributed and undistributed net income (2) 1 - 3 2 Net income (loss) attributable to noncontrolling interests - (1) (2) (3) N e t i n c o m e ( l o ss ) 315 169 (23) (169) D eb t e x t i ngu i s h m en t l o s s 8 8 7 7 I n t e r e s t e x pen s e 247 104 270 127 I n c o m e t a x p r o v i s i o n ( bene f i t ) ( 3 ) 69 44 (27) (52) D ep r e c i a t i o n an d a m o r t i z a t i o n e x pen s e 475 238 470 233 Unrealized (gain) loss on foreign currency option and forward contracts - 1 (2) (1) T r an s a c t i o n an d i n t eg r a t i o n c o s t s 48 41 72 65 R e s t r u c t u r i n g c o s t s 7 5 34 32 Estimated non - recurring spin - related transaction costs and other (4) 2 1 51 50 P r o f or m a a d j u s t e d E B I T D A $ 1,171 $ 611 $ 852 $ 292 Tr a ili ng T w e l v e M on t hs E nd e d J une 30 , S i x M on t hs E nd e d J une 30 , T w e l v e M on t hs E nd e d D e c e m b e r 31 , S i x M on t hs E nd e d J une 30 , Financial reconciliations (cont.) 41