
INVESTOR PRESENTATION MARCH 2022 v XPO to create two standalone industry leaders: less - than - truckload and tech - enabled brokered transportation MARCH 2022 Spin - Off and Divestitures Exhibit 99.2

INVESTOR PRESENTATION MARCH 2022 Disclaimers 2 NON - GAAP FINANCIAL MEASURES As required by the rules of the Securities and Exchange Commission ("SEC"), we provide reconciliations of the non - GAAP financial measures contained in this presentation to the most directly comparable measure under GAAP, which are set forth in the financial tables attached to this document . This document contains the following non - GAAP financial measures : adjusted earnings before interest, taxes, depreciation and amortization (“adjusted EBITDA”), adjusted operating income, including and excluding gains on real estate transactions, adjusted operating margin, adjusted operating ratio and net cash generated from adjusted EBITDA for our North American less - than - truckload business ; adjusted EBITDA for the proposed spin - off operations ; and margin for our North American truck brokerage business . We believe that the above adjusted financial measures facilitate analysis of our ongoing business operations because they exclude items that may not be reflective of, or are unrelated to, XPO and its business segments’ core operating performance, and may assist investors with comparisons to prior periods and assessing trends in our underlying businesses . Other companies may calculate these non - GAAP financial measures differently, and therefore our measures may not be comparable to similarly titled measures of other companies . These non - GAAP financial measures should only be used as supplemental measures of our operating performance . Adjusted EBITDA includes adjustments for transaction and integration costs, as well as restructuring costs and other adjustments as set forth in the attached tables . Transaction and integration adjustments are generally incremental costs that result from an actual or planned acquisition, divestiture or spin - off and may include transaction costs, consulting fees, retention awards, and internal salaries and wages (to the extent the individuals are assigned full - time to integration and transformation activities) and certain costs related to integrating and converging IT systems . Restructuring costs primarily relate to severance costs associated with business optimization initiatives . Management uses these non - GAAP financial measures in making financial, operating and planning decisions and evaluating XPO's and each business segment's ongoing performance . We believe that adjusted EBITDA improves comparability from period to period by removing the impact of our capital structure (interest and financing expenses), asset base (depreciation and amortization), tax impacts and other adjustments as set out in the attached tables that management has determined are not reflective of core operating activities and thereby assist investors with assessing trends in our underlying businesses . We believe that adjusted operating income and adjusted operating ratio improve the comparability of our operating results from period to period by ( i ) removing the impact of certain transaction and integration costs and restructuring costs, as well as amortization expenses and (ii) including the impact of pension income incurred in the reporting period as set out in the attached tables . We believe that net cash generated from adjusted EBITDA is an important measure of our ability to fund uses of capital that we believe will enhance stockholder value . With respect to our financial target for full year 2022 adjusted EBITDA for our North American less - than - truckload business, a reconciliation of this non - GAAP measures to the corresponding GAAP measure is not available without unreasonable effort due to the variability and complexity of the reconciling items described above that we exclude from these non - GAAP target measures . The variability of these items may have a significant impact on our future GAAP financial results and, as a result, we are unable to prepare the forward - looking statement of income and statement of cash flows prepared in accordance with GAAP that would be required to produce such a reconciliation .

INVESTOR PRESENTATION MARCH 2022 Disclaimers (cont.) 3 FORWARD - LOOKING STATEMENTS This presentation includes forward - looking statements within the meaning of Section 27 A of the Securities Act of 1933 , as amended, and Section 21 E of the Securities Exchange Act of 1934 , as amended, including statements relating to the planned spin - off and divestitures, the expected timing of the transactions and the anticipated benefits of the transactions . All statements other than statements of historical fact are, or may be deemed to be, forward - looking statements . In some cases, forward - looking statements can be identified by the use of forward - looking terms such as “anticipate,” “estimate,” “believe,” “continue,” “could,” “intend,” “may,” “plan,” “potential,” “predict,” “should,” “will,” “expect,” “objective,” “projection,” “forecast,” “goal,” “guidance,” “outlook,” “effort,” “target,” “trajectory” or the negative of these terms or other comparable terms . However, the absence of these words does not mean that the statements are not forward - looking . These forward - looking statements are based on certain assumptions and analyses made by us in light of our experience and our perception of historical trends, current conditions and expected future developments, as well as other factors we believe are appropriate in the circumstances . These forward - looking statements are subject to known and unknown risks, uncertainties and assumptions that may cause actual results, levels of activity, performance or achievements to be materially different from any future results, levels of activity, performance or achievements expressed or implied by such forward - looking statements . Factors that might cause or contribute to a material difference include our ability to effect the spin - off and meet the related conditions noted herein, our ability to complete the divestitures of our European freight transportation business and intermodal business, the expected timing of the completion of the transactions and the terms of the transactions, our ability to achieve the expected benefits of the transactions, our ability to retain and attract key personnel for the separate businesses, the risks discussed in our filings with the SEC, and the following : economic conditions generally ; the severity, magnitude, duration and aftereffects of the COVID - 19 pandemic, including supply chain disruptions due to plant and port shutdowns and transportation delays, the global shortage of certain components such as semiconductor chips, strains on production or extraction of raw materials, cost inflation and labor and equipment shortages, which may lower levels of service, including the timeliness, productivity and quality of service, and government responses to these factors ; our ability to align our investments in capital assets, including equipment, service centers and warehouses, to our customers’ demands ; our ability to implement our cost and revenue initiatives ; the effectiveness of our action plan, and other management actions, to improve our North American LTL business ; our ability to benefit from a sale, spin - off or other divestiture of one or more business units, and the impact of anticipated material compensation and other expenses, including expenses related to the acceleration of equity awards, to be incurred in connection with a substantial disposition ; our ability to successfully integrate and realize anticipated synergies, cost savings and profit improvement opportunities with respect to acquired companies ; goodwill impairment, including in connection with a business unit sale, spin - off or other divestiture ; matters related to our intellectual property rights ; fluctuations in currency exchange rates ; fuel price and fuel surcharge changes ; natural disasters, terrorist attacks, wars or similar incidents ; risks and uncertainties regarding the expected benefits of the spin - off of our logistics segment or a future spin - off of a business unit, the impact of the spin - off of our logistics segment or a future spin - off of a business unit on the size and business diversity of our company ; the ability of the spin - off of our logistics segment or a future spin - off of a business unit to qualify for tax - free treatment for U . S . federal income tax purposes ; our ability to develop and implement suitable information technology systems and prevent failures in or breaches of such systems ; our indebtedness ; our ability to raise debt and equity capital ; fluctuations in fixed and floating interest rates ; our ability to maintain positive relationships with our network of third - party transportation providers ; our ability to attract and retain qualified drivers ; labor matters, including our ability to manage our subcontractors, and risks associated with labor disputes at our customers and efforts by labor organizations to organize our employees and independent contractors ; litigation, including litigation related to alleged misclassification of independent contractors and securities class actions ; risks associated with our self - insured claims ; risks associated with defined benefit plans for our current and former employees ; the impact of potential sales of common stock by our chairman ; governmental regulation, including trade compliance laws, as well as changes in international trade policies and tax regimes ; governmental or political actions, including the United Kingdom’s exit from the European Union ; and competition and pricing pressures . All forward - looking statements set forth in this presentation are qualified by these cautionary statements and there can be no assurance that the actual results or developments anticipated by us will be realized or, even if substantially realized, that they will have the expected consequences to or effects on us or our business or operations . Forward - looking statements set forth in this presentation speak only as of the date hereof, and we do not undertake any obligation to update forward - looking statements to reflect subsequent events or circumstances, changes in expectations or the occurrence of unanticipated events, except to the extent required by law . Where required by law, no binding decision will be made with respect to the divestiture of the European business other than in compliance with applicable employee information and consultation requirements .

INVESTOR PRESENTATION MARCH 2022 4 Highlights of the plan XPO’s spin - off of its tech - enabled brokered transportation services to its shareholders would transform the remaining business into a pure - play less - than - truckload (LTL) company ▪ The company is planning a spin - off of its asset - light brokered transportation services to separate XPO into two publicly traded transportation powerhouses in North America. The transaction is intended to be tax - free to XPO shareholders. ▪ In addition, XPO expects to divest its European business and North American intermodal operation to simplify its transportation service offering. ▪ The planned spin - off would create two focused, publicly traded companies at the top of their industries: ▪ The LTL business would become a pure - play industry leader — the third largest provider of domestic and cross - border LTL shipping in North America, with extensive scale and assets. ▪ The spin - off business would encompass XPO’s best - in - class, tech - enabled truck brokerage platform, and complementary services for last mile logistics, managed transportation and global forwarding. ▪ XPO currently expects to complete the spin - off in the fourth quarter of 2022, subject to various conditions, including final approval of the XPO board of directors. XPO Remaining Company Will Be a Pure - Play LTL Leader Spin - Off of Tech - Enabled Truck Brokerage Platform European Transportation Intermodal / Drayage
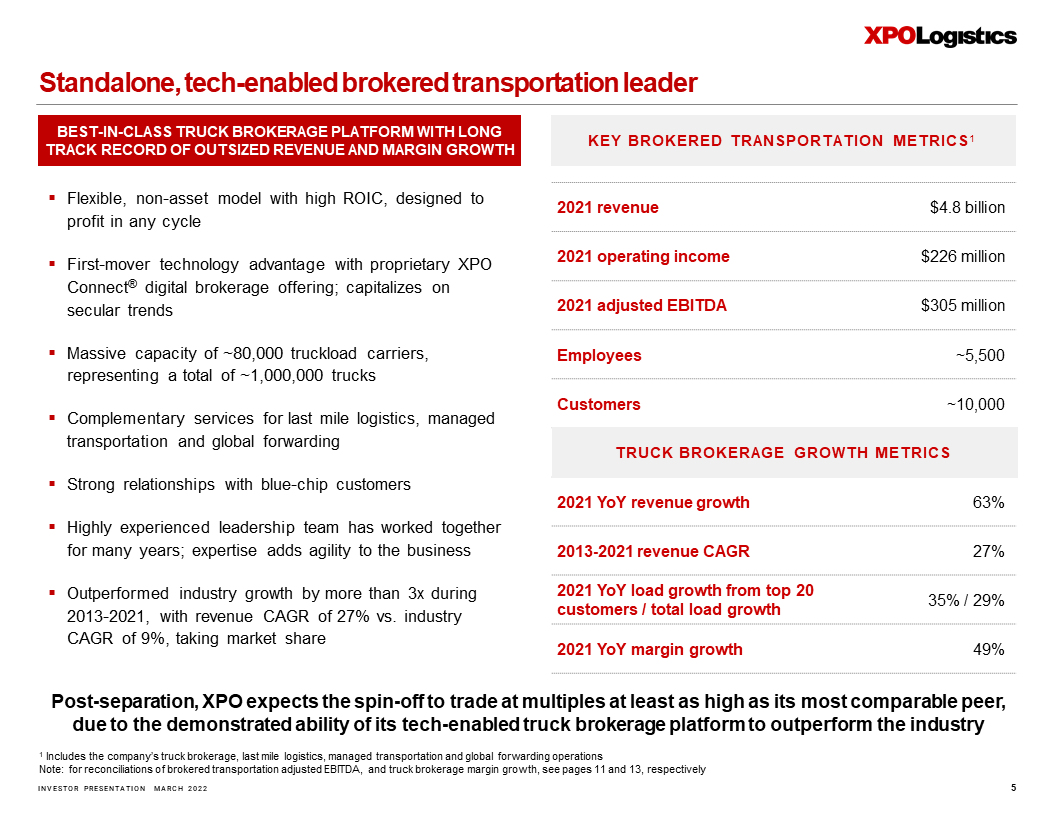
INVESTOR PRESENTATION MARCH 2022 5 Standalone, tech - enabled brokered transportation leader 1 Includes the company’s truck brokerage, last mile logistics, managed transportation and global forwarding operations Note: for reconciliations of brokered transportation adjusted EBITDA, and truck brokerage margin growth, see pages 11 and 13, re spectively BEST - IN - CLASS TRUCK BROKERAGE PLATFORM WITH LONG TRACK RECORD OF OUTSIZED REVENUE AND MARGIN GROWTH ▪ Flexible, non - asset model with high ROIC, designed to profit in any cycle ▪ First - mover technology advantage with proprietary XPO Connect ® digital brokerage offering; capitalizes on secular trends ▪ Massive capacity of ~80,000 truckload carriers, representing a total of ~1,000,000 trucks ▪ Complementary services for last mile logistics, managed transportation and global forwarding ▪ Strong relationships with blue - chip customers ▪ Highly experienced leadership team has worked together for many years; expertise adds agility to the business ▪ Outperformed industry growth by more than 3x during 2013 - 2021, with revenue CAGR of 27% vs. industry CAGR of 9%, taking market share 2021 revenue $4.8 billion 2021 operating income $226 million 2021 adjusted EBITDA $305 million Employees ~5,500 Customers ~10,000 2021 YoY revenue growth 63% 2013 - 2021 revenue CAGR 27% 2021 YoY load growth from top 20 customers / total load growth 35% / 29% 2021 YoY margin growth 49% KEY BROKERED TRANSPORTATION METRICS 1 Post - separation, XPO expects the spin - off to trade at multiples at least as high as its most comparable peer, due to the demonstrated ability of its tech - enabled truck brokerage platform to outperform the industry TRUCK BROKERAGE GROWTH METRICS

INVESTOR PRESENTATION MARCH 2022 6 Standalone, pure - play less - than - truckload (LTL) leader Note: for reconciliations of less - than - truckload adjusted EBITDA, adjusted operating margin improvement and net cash, see page 1 2 1 Excluding gains from sales of real estate SIGNIFICANT COMPETITIVE ADVANTAGES AS THE THIRD LARGEST LTL PROVIDER, WITH A NATIONAL US NETWORK ▪ High ROIC from capital allocated to grow network density, expand fleet and talent base, and enhance technology ▪ Favorable industry dynamics, including a firm pricing environment; strong demand driven by rapid growth in e - commerce and ongoing recovery in industrial ▪ Differentiated by proprietary technology; in - house trailer manufacturing and ~130 truck driver training schools ▪ Many longstanding customer relationships among ~25,000 accounts served ▪ Large opportunity to enhance profitability through numerous company - specific initiatives ▪ Second best adjusted operating ratio in the industry in 2021 2021 revenue $4.1 billion 2021 operating income $618 million 2021 adjusted EBITDA $904 million 2022E adjusted EBITDA Over $1 billion 2015 - 2021 adjusted operating margin improvement 1 910 bps 2016 - 2021 net cash generated Over $3 billion Terminals 291 Drivers ~12,000 Tractors ~7,900 Trailers ~25,800 KEY LTL METRICS Post - separation, as an LTL pure - play, XPO expects the company’s stock to reflect its demonstrated success in improving operations to drive value creation

INVESTOR PRESENTATION MARCH 2022 7 Greater focus on strategic priorities ▪ Each company will benefit from an undiluted focus on strategic priorities, customer requirements and stakeholder interests, with its own management team and culture, and greater flexibility to tailor strategic decision - making. High ROIC and improved flexibility to allocate capital ▪ Both companies are expected to generate a high return on invested capital and robust free cash flow based on the historical performance of the core businesses they encompass, and both will have greater flexibility in allocating capital. Dedicated investor base ▪ Each company will have an investor base aligned with a clear - cut value proposition and be valued separately by the investment community, benefiting each company in executing its growth strategy. Equity currency ▪ Each company will have its own equity currency to pursue strategic objectives, including acquisitions, and to significantly increase the long - term attractiveness of its equity compensation programs, with less dilution to existing stockholders. Investment - grade credit rating at each company ▪ Each company will have a robust balance sheet with low net leverage and strong financial characteristics on day one of the spin - off, and will pursue an investment - grade credit rating. Focused, customer - centric technology ▪ Each company will be able to deepen its differentiation as a customer - centric innovator by focusing technology resources on enhancing proprietary software developed for its specific services and end - markets. Attract and retain talent unique to each business ▪ Both companies will be better situated to attract and retain world - class talent by offering meaningful equity - based compensation that correlates more closely to performance and the interests of their respective stockholders. Compelling strategic and financial rationale for the spin - off The aggregate trading price of the stocks of the two standalone companies is expected to be higher than the price that XPO’s stock would trade at if the two businesses remained combined
INVESTOR PRESENTATION MARCH 2022 XPO’s spin - off of its GXO logistics segment in 2021 was a highly successful strategy, unlocking significant stakeholder value as a contract logistics pure - play 8 Solving the valuation discount Many of XPO’s industry peers trade at significant valuation premiums to XPO, with higher multiples of adjusted EBITDA and EPS, even though XPO outperforms many peers in key metrics: ▪ The company’s outperformance needs to be more obvious ⏤ and it would be as two, focused, independent pure - plays without the conglomerate overhang. ▪ The planned spin - off will create a clear - cut separation of XPO’s two core businesses: North American LTL and North American brokered transportation, primarily the company’s tech - enabled truck brokerage platform. ▪ Each core business is an industry - leading platform in its own right, with competitive advantages of scale and company - specific value drivers, including high - ROIC models, strong free cash generation, proprietary technology and long - tenured, blue - chip customer relationships. ▪ XPO believes that the separate companies would be benchmarked to the right industry peers ⏤ other LTL and brokerage pure - plays ⏤ making their undervaluation more apparent to the investment community. – The spin - off should also attract new technology - focused investors as a large, non - asset, tech - enabled truck brokerage platform with a strong track record of creating value through automation. ▪ XPO believes that the separation would increase the aggregate trading price of the stock of the two standalone companies above the price that XPO’s stock would have traded at if the separated businesses had remained combined.
INVESTOR PRESENTATION MARCH 2022 XPO intends to divest its European business through either a sale or a listing on a European stock exchange, and is under an exclusivity agreement in connection with a potential sale of its North American intermodal operation 9 Profiles of planned divestitures XPO expects to divest its European business and North American intermodal operation, simplifying its transportation service offering: EUROPEAN FREIGHT TRANSPORTATION BUSINESS ▪ Provides truckload, LTL, managed transportation, last mile logistics and global forwarding services ▪ No. 1 truck broker and No. 1 LTL provider in France and Iberia (Spain and Portugal); No. 3 truck broker in UK; largest single - owner LTL network in UK ▪ At year - end 2021, had 207 total locations in 14 countries and ~13,700 employees ▪ For full year 2021, the business generated $3.1 billion of revenue NORTH AMERICAN INTERMODAL OPERATION ▪ A leading provider of drayage and rail brokerage services in North America ▪ At year - end 2021, the business had 44 locations, including 36 drayage terminals, and ~425 employees ▪ For full year 2021, the business generated $1.2 billion of revenue

Appendix

INVESTOR PRESENTATION MARCH 2022 RECONCILIATION OF ADJUSTED EBITDA ATTRIBUTABLE TO THE PLANNED SPIN - OFF Financial reconciliations The following table reconciles XPO’s operating income attributable to the planned spin - off operations (1) for the year ended December 31, 2021 to adjusted EBITDA for the same period. 1 The planned spin - off is expected to include the company’s truck brokerage business, as well as last mile logistics, managed tran sportation and global forwarding operations 2 Excludes unallocated corporate costs Note: Refer to the “Non - GAAP Financial Measures” section on page 2 of this document 11 $ in millions (unaudited) Spin-Off Operations Operating income $ 226 Other expense (2) Depreciation and amortization 79 Transaction and integration costs 2 Adjusted EBITDA (2) $ 305 Year Ended Dec. 31, 2021

INVESTOR PRESENTATION MARCH 2022 Financial reconciliations (cont.) The following table reconciles XPO’s operating income attributable to its North American less - than - truckload business for the ye ars ended December 31, 2021, 2020, 2019, 2018, 2017 and 2016 to adjusted operating income, adjusted operating ratio, adjusted EBITDA and net cas h f or the same periods, as well as adjusted operating income and adjusted operating ratio for the year ended December 31, 2015. 1 Operating ratio is calculated as (1 – (operating income divided by revenue)) 2 Other income primarily consists of pension income 3 Excludes unallocated corporate costs 4 Adjusted operating ratio is calculated as (1 – (adjusted operating income divided by revenue)); adjusted operating margin is the inverse of adjusted operating ratio 5 Net cash generated from operating income is calculated as operating income less payments for purchases of property and equipm ent 6 Net cash generated from adjusted EBITDA is calculated as adjusted EBITDA, excluding gains on real estate transactions, less p aym ents for purchases of property and equipment; the company also refers to this measure as net cash from LTL 7 2015 represents full year results; the company acquired North American LTL in Q4 2015 Note: Refer to the “Non - GAAP Financial Measures” section on page 2 of this document 12 RECONCILIATIONS OF NORTH AMERICAN LTL ADJUSTED OPERATING RATIO, ADJUSTED EBITDA AND NET CASH $ in millions (unaudited) Revenue (excluding fuel surcharge revenue) $ 3,486 $ 3,106 $ 3,259 $ 3,230 $ 3,140 $ 3,035 $ 3,081 Fuel surcharge revenue 632 433 532 552 455 370 448 Revenue 4,118 3,539 3,791 3,782 3,595 3,405 3,529 Salaries, wages and employee benefits 1,907 1,740 1,783 1,751 1,697 1,676 1,726 Purchased transportation 452 334 397 400 438 438 508 Fuel and fuel-related taxes 282 186 264 293 234 191 230 Other operating expenses 553 494 471 590 555 514 629 Depreciation and amortization 226 224 227 243 233 203 164 Rents and leases 79 65 49 44 42 41 49 Transaction, integration and rebranding costs 1 5 - - 19 24 21 Restructuring costs - 4 3 3 - - Operating income 618 487 597 458 377 318 202 Operating ratio (1) 85.0% 86.2% 84.3% 87.9% 89.5% 90.7% 94.3% Other income (2) 58 43 22 29 12 - - Amortization expense 33 34 34 33 34 34 10 Transaction, integration and rebranding costs 1 5 - - 19 24 21 Restructuring costs - 4 3 3 - - - Depreciation adjustment from updated purchase price allocation of acquired assets - - - - - (2) - Adjusted operating income (3) $ 710 $ 573 $ 656 $ 523 $ 442 $ 374 $ 233 Adjusted operating ratio (4) 82.7% 83.8% 82.7% 86.2% 87.7% 89.0% 93.4% Depreciation expense 193 190 193 210 199 169 154 Other 1 1 2 - 6 4 (6) Adjusted EBITDA (3) $ 904 $ 764 $ 851 $ 733 $ 647 $ 547 $ 381 Gains on real estate transactions (62) (77) (88) (2) (5) - - Adjusted EBITDA, excluding gains on real estate transactions (3) $ 842 $ 687 $ 763 $ 731 $ 642 $ 547 $ 381 Adjusted operating income, excluding gains on real estate transactions (3) $ 648 $ 233 Adjusted operating ratio, excluding gains on real estate transactions (4) 84.3% 93.4% Payment for purchases of property and equipment $ (155) $ (102) $ (153) $ (112) $ (88) $ (130) Net cash generated from operating income (5) $ 463 $ 385 $ 444 $ 346 $ 289 $ 188 Net cash generated from adjusted EBITDA (6) $ 687 $ 585 $ 610 $ 619 $ 554 $ 417 2021 2020 2019 2018 2017 2016 2015 (7) Years Ended December 31,

INVESTOR PRESENTATION MARCH 2022 $ in millions (unaudited) Change % Revenue $ 2,749 $ 1,684 63.2% Cost of transportation and services (exclusive of depreciation and amortization) 2,322 1,398 Margin (2) $ 427 $ 286 49.3% Years Ended December 31, 2021 2020 RECONCILIATION OF NORTH AMERICAN TRUCK BROKERAGE MARGIN 1 The planned spin - off is expected to include the company’s truck brokerage business, as well as last mile logistics, managed tran sportation and global forwarding operations 2 Margin is calculated as revenue less cost of transportation and services (exclusive of depreciation and amortization) for the t ruck brokerage business only Note: Refer to the “Non - GAAP Financial Measures” section on page 2 of this document The following table reconciles XPO’s revenue attributable to its North American truck brokerage business (1) for the years ended December 31, 2021 and 2020 to margin for the same periods. Financial reconciliations (cont.) 13
