 Investor Presentation August 2014 Exhibit 99.2 |
 1 1 Forward-Looking Statements Disclaimer This document contains “forward-looking statements” within the meaning of Section 27A of the Securities Act, and Section 21E of the Exchange Act, including such things as the anticipated closing date of the acquisition of New Breed, and the related financing, the expected impact of the acquisition of New Breed and New Breed’s anticipated growth, the projected satisfaction of closing conditions to the acquisition of New Breed, the retention of the New Breed management team, the expected ability to integrate operations and technology platforms and to cross-sell services, future capital expenditures (including the amount and nature thereof), finding other suitable merger or acquisition candidates, expansion and growth of the Company’s business and operations and other such matters. All statements, other than statements of historical facts, included or incorporated by reference in this offering memorandum, are forward-looking statements. In some cases, forward-looking statements can be identified by the use of forward-looking terms such as “anticipate,” “estimate,” “believe,” “continue,” “could,” “intend,” “may,” “plan,” “potential,” “predict,” “should,” “will,” “expect,” “objective,” “projection,” “forecast,” “goal,” “guidance,” “outlook,” “effort,” “target” or the negative of these terms or other comparable terms. However, the absence of these words does not mean that the statements are not forward-looking. These statements are based on certain assumptions and analyses made by us in light of our experience and our perception of historical trends, current conditions and expected future developments, as well as other factors we believe are appropriate in the circumstances. These forward-looking statements are subject to known and unknown risks, uncertainties and assumptions that may cause actual results, levels of activity, performance or achievements to be materially different from any future results, levels of activity, performance or achievements expressed or implied by such forward-looking statements. Factors that could adversely affect actual results and performance include, but are not limited to, those discussed elsewhere in this offering memorandum, including the section entitled “Risk Factors”, the risks set forth in our filings with the SEC and the following: economic conditions generally; competition; our ability to find other suitable acquisition candidates and execute our acquisition strategy; the expected impact of the acquisition of New Breed, including the expected impact on XPO’s results of operations; the ability to obtain the requisite regulatory approvals and the satisfaction of other conditions to consummation of the transaction; the expected closing date for the acquisition of New Breed; our ability to raise debt and equity capital; our ability to attract and retain key employees to execute our growth strategy; litigation, including litigation related to alleged misclassification of independent contractors; our ability to develop, implement and maintain a suitable information technology system; our ability to maintain positive relationships with our network of third party transportation providers; our ability to retain our and New Breed’s largest customers; XPO’s ability to successfully integrate New Breed and other acquired businesses and realize anticipated synergies and cost savings; rail and other network changes; weather and other service disruptions; and governmental regulation. All forward-looking statements included in this offering memorandum, or in any document incorporated by reference herein or therein speak only as of the date of this offering memorandum or the document incorporated by reference, as the case may be. All of the forward-looking statements made or incorporated by reference in this offering memorandum are qualified by these cautionary statements and there can be no assurance that the actual results or developments anticipated by XPO will be realized or, even if substantially realized, that they will have the expected consequence to, or effects on, XPO or its respective businesses or operations and XPO will not undertake any obligation to update forward-looking statements to reflect subsequent events or circumstances, changes in expectations or the occurrence of unanticipated events except to the extent required by law. This presentation contains certain non-GAAP financial measures. A “non-GAAP financial measure” is defined as a numerical measure of a company’s financial performance that excludes or includes amounts so as to be different than the most directly comparable measure calculated and presented in accordance with GAAP in the statement of income, balance sheet or statement of cash flows of the company. Pursuant to the requirements of Regulation G, the company has provided a reconciliation of non-GAAP financial measures to the most directly comparable GAAP financial measure. The non-GAAP financial measures used are: EBITDA, Adjusted EBITDA and Unlevered Free Cash Flow. These measures are presented because management uses this information to monitor and evaluate financial results and trends. Therefore, management believes this information is also useful for investors. |
 2 2 Management Team Presenters Bradley Jacobs Chairman and Chief Executive Officer – XPO Logistics John Hardig Chief Financial Officer – XPO Logistics Scott Malat Chief Strategy Officer – XPO Logistics |
 3 3 Agenda Transaction Overview 1 2 XPO Logistics Overview 3 Financial Overview 4 Appendix |
 1. Transaction Overview |
 5 5 Executive Summary XPO Logistics, Inc. (NYSE: XPO) (the “Company” or “XPO”) is a leading asset-light provider of transportation logistics services, including truck brokerage, intermodal, expedited transportation, last mile logistics and freight forwarding services – Current equity market capitalization of $2.5 billion as of August 8, 2014 (1) XPO announced on July 29, 2014 that it has agreed to acquire New Breed Holding Company (“New Breed”) for a purchase price of $615 million – The acquisition of New Breed expands XPO’s service offerings to include desirable sectors of contract logistics services and provides the Company with significant additional scale, diversified revenue, complementary services and an enhanced value proposition for blue chip customers – Pro forma for the acquisition, XPO will have LTM June 30, 2014 revenues and adjusted EBITDA of $2.7 billion and $144 million (2) , respectively To finance the acquisition, the Company intends to use proceeds from a $500 million senior unsecured notes offering, as well as an ABL draw and available cash The New Breed transaction is subject to HSR clearance and other customary conditions and is expected to close in the third quarter (1) Assumes conversion of the convertible senior notes into equity (2) EBITDA reconciliation is located in the Appendix |
 6 6 Sources and Uses and Pro Forma Capitalization (1) Atlantic Central Logistics (“ACL”), a last mile logistics provider, was acquired on July 28, 2014 in an all cash purchase of $36.5 million (~6.1x purchase multiple); ACL has LTM EBITDA of $6 million (2) Subsequent to June 30, 2014, $14 million of restricted cash was released after certain letters of credit were secured by the Company (3) ABL is secured by all assets and matures on October 17, 2018; availability of $243 million as of June 30, 2014 (4) Convertible Senior Notes due October 1, 2017 have conversion price of $16.43 per share of common stock; current XPO share price is $30.74 as of August 8, 2014; Convertible Senior Notes do not have any subsidiary guarantees (5) As of August 8, 2014; Assumes the conversion of convertible senior notes into equity (4) (3) (1) (2) (5) (5) ($ in millions) June 30, 2014 Cum. Mult. EBITDA % of Actual Adj. PF, as Adjusted LTM 6/30/14 total cap Cash and Cash Equivalents $112 ($82) $30 Restricted Cash 17 (14) 3 $415m ABL Revolving Credit Facility – 48 48 Senior Unsecured Notes – 500 500 Miscellaneous Debt 2 – 2 Total Debt (excl. convert) $2 $550 3.8x 18% Net Debt (excl. convert) (110) 520 3.6x Convertible Senior Notes 121 – 121 Total Debt $123 $671 4.7x Net Debt 11 641 4.5x Equity market capitalization 2,450 – 2,450 82% Total market capitalization $2,452 $3,000 100% PF Adj. LTM EBITDA $144 ($ in millions) Sources Uses ABL draw $48 New Breed Acquisition $615 Senior Unsecured Notes 500 ACL acquisition 37 Equity investment by New Breed CEO 30 Fees and Expenses 22 Cash from Balance Sheet 96 Total sources $674 Total uses $674 |
 2. XPO Logistics Overview |
 8 8 One of the Largest 3PLs in North America We facilitate over 31,000 deliveries per day #4 freight brokerage firm and Top 50 logistics company #3 provider of intermodal services #1 provider of cross-border Mexico intermodal #1 manager of expedited shipments #1 provider of last mile logistics for heavy goods International and domestic freight forwarder Growing presence in managed transportation and less-than-truckload (LTL) After the New Breed acquisition, leading provider of engineered outsourced logistics Sources for rankings: Transport Topics, Journal of Commerce and company data |
 9 9 Clearly Defined Strategy for Value Creation Acquire companies that bring value and are highly scalable Significantly scale up and optimize existing operations Open cold-starts where sales recruitment can drive revenue We are ahead of plan in transforming XPO Logistics into a leading, multi-modal supply chain logistics provider |
 10 10 Precise Execution of Growth Plan Completed 12 strategic acquisitions and established 23 cold-starts in less than three years Created leading-edge recruiting and training programs Introduced scalable IT platform Added national operations centers for shared services, carrier procurement and last mile operations Created a culture of passionate on-time performance Disciplined focus on operational excellence |
 11 11 Massive Commitment to Shipper Satisfaction Integrated network with cross-company visibility 148 locations in the U.S., Canada, Mexico, Asia and Europe Approximately 3,100 employees More than 3,600 owner-operator trucks under contract for drayage, expedited and last mile subsidiaries Relationships with an additional 27,000 vetted carriers Access to 60,000 miles of network rail routes New Breed will add approximately 7,300 employees and 70 locations |
 12 Founded and led four highly successful companies, including two world-class public corporations, prior to XPO United Rentals: – Grew EBITDA from $50 million at initial bond offering in May 1998 to $1.1 billion in 2007 – Issued over $4 billion in high yield debt through 2007 United Waste Systems: – Sold in 1997 for $2.5 billion Hamilton Resources: Amerex Oil Associates: Chairman and CEO Bradley S. Jacobs Global oil trading company with ~$1 billion revenue Fifth largest solid waste management business in North America World’s largest equipment rental company (NYSE: URI) One of world’s largest oil brokerage firms |
 13 13 Brad Jacobs led a $75 million cash investment to assume control of XPO Logistics in September 2011 Build a multi-billion dollar, non-asset based, third party logistics business Large and underpenetrated $1 trillion U.S. transportation logistics industry Scale is a competitive advantage with customers and carriers Fragmented industry with many quality acquisition targets Highly skilled management team with talents that fit the Company’s growth strategy Intense focus on world-class operations to create value for all stakeholders XPO Investment Premise |
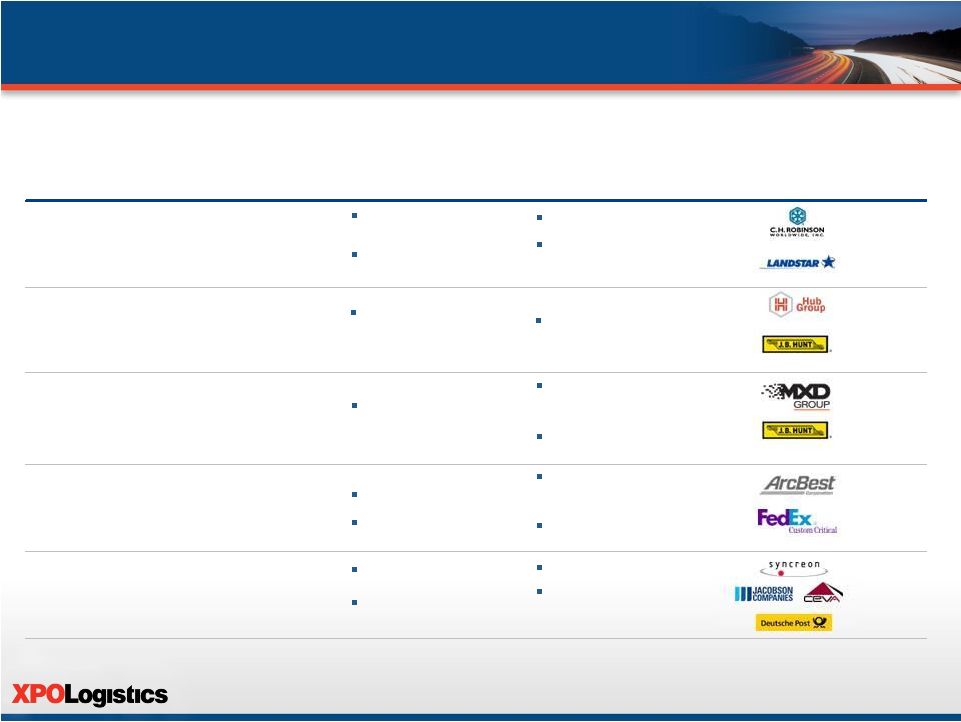 14 14 Sector North American Market Size ($ billions) Projected Growth (x GDP) Key Competitors XPO Position Truck Brokerage ~$50 2-3 times #4 Intermodal ~$15 3-5 times #3 Last Mile – Heavy Goods ~$13 5-6 times #1 Expedited Transportation ~$5 3-4 times #1 Contract Logistics ~$55 ~3 times Top 10 (Pro Forma) Outsourcing and technology Driver shortages increase brokers’ value proposition Long-haul rail efficiencies and near-sourcing of manufacturing in Mexico Outsourcing and e-commerce Outsourcing trend Technology advances Just-in-time management Supply chain complexity Highly fragmented market Technology advances favor larger players with scale Intermodal growth takes volume from trucking sector XPO is clear market leader in heavy goods home delivery logistics Differentiated by end-consumer experience management Highly fragmented; top-10 players account for less than 25% of global market Scale is less of a competitive advantage Highly fragmented Highly-engineered services create sticky, stable customer relationships Source: Armstrong & Associates, Norbridge, Inc., EVE Partners LLC, FTR Associates, SJ Consulting Group, Inc., Bureau of Economic Analysis, US Department of Commerce. Strong Fundamentals Across Operating Sectors Growth Drivers Competitive Dynamic |
 15 15 Services includes truckload, less-than-truckload (LTL) and related over-the-road logistics For-hire U.S. trucking is a $350 billion industry – Estimated 15% ($50 billion) penetration by brokers Growing at two to three times GDP – Favorable shipper trend toward outsourcing – Regulatory pressure on shippers – Favorable carrier trend toward using brokers to eliminate in-house sales cost – Driver shortages are beneficial to brokers Truck Brokerage: An Underpenetrated Sector Sources: Armstrong & Associates and EVE Partners LLC |
 16 16 Generated organic revenue growth of 67% in truck brokerage in Q2 2014 YOY 11 brokerage cold-starts on an annual revenue run-rate of more than $220 million – Up from $90 million 12 months ago – Low capital investment can deliver outsized returns Proprietary IT platform provides cross-company visibility of market conditions, capacity and carrier performance – Sophisticated analytical tools for pricing and load-covering – Sales force productivity climbing with technology investments and increase in tenure Truck Brokerage: Strong Organic Growth Lane densities and pricing histories added to database with each acquisition |
 17 17 XPO facilitates freight movements by rail, typically with truck components at both ends $15 billion sector in North America One of the fastest-growing areas of transportation logistics – Growing at three to five times GDP Can lower transportation costs for freight traveling 600 miles or more – Rail is more fuel-efficient than truckload for long haul – Intermodal can lower shipper’s cost by up to 20% Intermodal: A Major Market Opportunity Sources: SJ Consulting Group, Inc. and FTR Associates |
 18 18 XPO gained instant scale in North American intermodal – Third largest provider of intermodal services – – Decades-deep relationships with the railroads enhance customer service Transaction added $980 million of revenue (FY 2013), 31 locations and approximately 800 employees Asset-light model: XPO controls over 17,000 containers with access to more capacity through rails XPO now manages approximately 10% of all domestic intermodal loads in North America Intermodal: Acquired Pacer in March 2014 Sources: Bureau of Economic Analysis and US Department of Commerce #1 provider of cross-border Mexico intermodal, with 30 years’ experience On track to realize $15 million of targeted synergies from Pacer integration |
 19 19 Mexico is fast-becoming the country of choice for manufacturing near-shoring, compared with China – Competitively priced labor force – Favorable regulatory and tax environment – Faster speed-to-market than overseas locales – Supports just-in-time lean production trend Growth driven by billions of dollars invested by major manufacturers, Mexican government and the rails Large opportunity to convert to intermodal: an estimated 2.8 million trucks move cross- border each year Intermodal: Cross-Border Mexico Growth Sources: AlixPartners |
 20 20 Arranges delivery and installation of heavy goods to residences and workplace – Customers include nearly all of the top 30 big-box retailers $13 billion market for heavy goods home deliveries One of the fastest-growing sectors of non-asset, third party logistics – Heavy goods home delivery growing at five to six times GDP – Strong tailwinds from e-commerce and outsourcing – Only 30% currently going through 3PLs Highly fragmented with many small, regional providers Last Mile: XPO Leads Fast-Growing Sector Source: Norbridge, Inc. and EVE Partners LLC |
 21 21 Extremely high level of end-customer satisfaction – Leading proprietary software for workflow and customer experience management – Real-time visibility into customer satisfaction Strong customer-centric culture built by experienced leaders who now run the business for XPO Acquired Optima Service Solutions in November 2013 – Highly scalable, leading facilitator of complex installations for appliances and electronics Acquired Atlantic Central Logistics in July 2014 – Moves high volumes of e-commerce purchases for mega-companies Last Mile: Acquired 3PD in August 2013 |
 22 22 Estimated $5 billion market Benefits from toward just-in-time inventories, supply chain disruptions XPO manages more expedited shipments than any other provider in North America – XPO Express – over-the-road logistics, three decades of experience as Express-1 – XPO NLM – #1 proprietary web-based auction technology – XPO Air Charter – auction-driven, last-minute freight movements Expedited: #1 Manager of Urgent Shipments Source: Company data |
 23 23 XPO arranges domestic and international shipments, typically by air and ocean Currently a $200 million player in a $150 billion market Significant opportunity to grow market share through network of dedicated offices – 19 Company-owned offices – 16 independently-owned stations Provides air transport support to expedited operations Integrated former Pacer operations in US, Asia and Europe Freight Forwarding: Global Network Source: Company data |
 24 24 Compelling reasons for the transaction, expected to close in Q3 2014 Contract Logistics: Acquisition of New Breed Source: XPO Logistics and New Breed company data Will be transformational for XPO’s scale and value proposition Capitalizes on outsourcing trends for reverse logistics, omni-channel distribution, transportation management, lean manufacturing and aftermarket support, and supply chain optimization Will create significant cross-selling opportunities with XPO strategic accounts, New Breed customers and their vendors – Combined company of approximately 10,400 union-free employees and over 200 locations – XPO will gain over 300 IT professionals from the combination, doubling XPO’s IT workforce – Gives XPO the industry’s most differentiated supply chain offering |
 New Breed Is a Preeminent Provider Source: New Breed company data 25 Leads the most desirable sector of contract logistics Complex, highly engineered solutions for blue chip customers Targets industries with growing demand for outsourced logistics – Technology/telecom, e-commerce/retail, aerospace and defense, medical equipment, and select areas of manufacturing Very stable relationships with low cyclicality – performed well in Great Recession – Approximately 99% contractual revenue renewal rate over the past three years – Weighted average remaining term of existing contracts is 5.5 years (6.5 years for five largest customers) 25 |
 26 26 New Breed’s Attractive Financial Model 38% return on invested capital (FY 2013) (1) 71% free cash flow conversion (FY 2013) (2) Low capex required to maintain business: approximately 2% of sales (total including growth capex was 4.2% of revenue in FY 2013) and devoted primarily to IT Majority of facility leases expire at the same time as the customer contracts Asset-light based model in line with XPO’s strategy (1) Return on invested capital equals ongoing operations EBIT divided by the sum of net working capital and net PP&E (2) Free cash flow conversion equals EBITDA minus capex, divided by EBITDA Source: New Breed company data |
 27 27 Integrated Multi-Modal Growth Model Offers Attractive Earnings Diversification No single division accounts for more than 30% of gross revenue XPO’s broad service portfolio mitigates cyclicality, adapts to changes in demand Large shippers increasingly favor single source providers with a broad array of capabilities (1) Figures reflect inclusion of New Breed for the full LTM June 30, 2014 period on a PF basis Truck Brokerage 23% Last Mile 13% Intermodal 30% Expedited 5% Freight Forwarding 7% Contract Logistics 22% LTM Pro Forma Gross Revenue (1) |
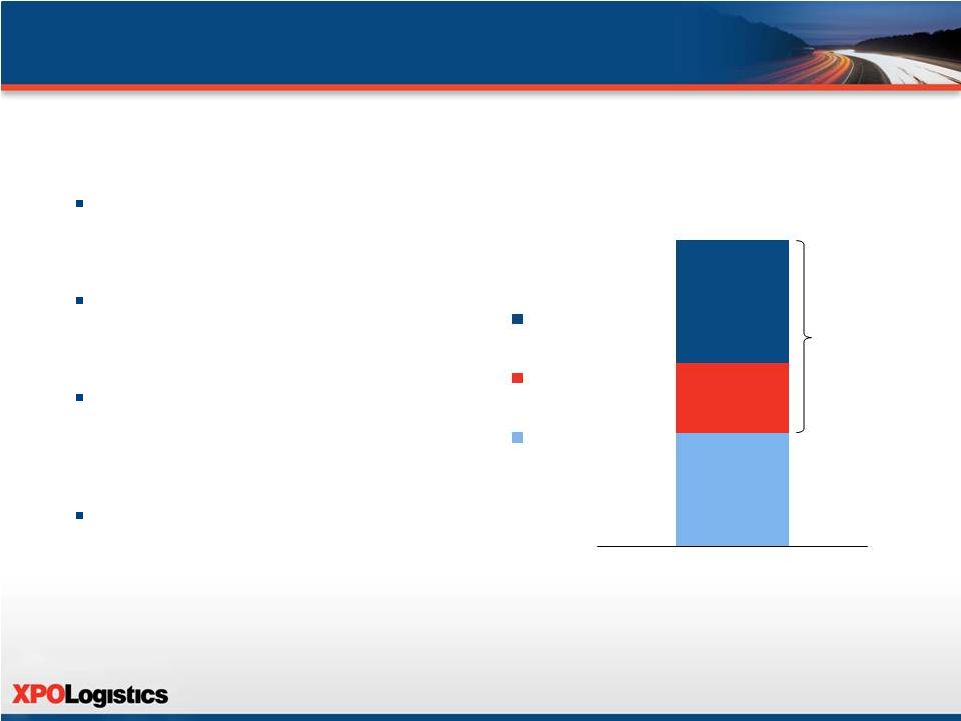
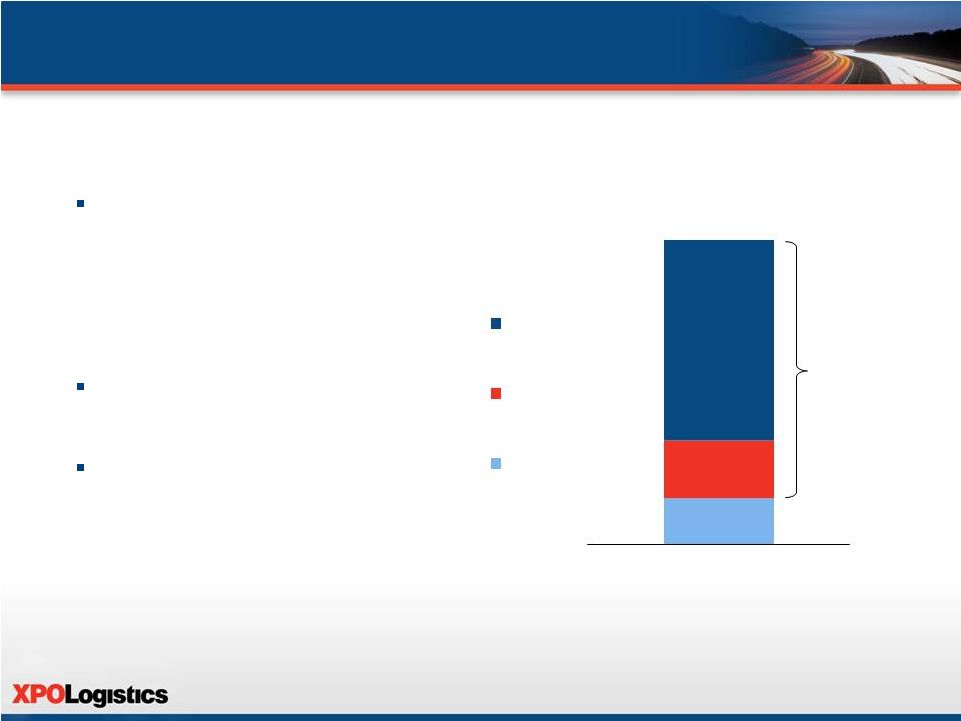 Asset-light model allows flexibility to manage costs in changing economic climates – 85% of cash operating costs are variable Operating facility rents largely co- terminus with customer contracts 67% of New Breed contracts are either fixed-variable or cost plus arrangements PF Q2 2014 (1) Cash Operating Expenses Total Variable 85% Highly Variable Cost Base XPO has a highly variable cost base (1) PF for New Breed acquisition 28 15% 19% 66% Purchased Transportation Other Variable Fixed 28 |
 29 29 PF 2013 Capex (1) Growth 63% Low Maintenance Capex Requirements 63% of capex is invested in customer growth Growth investments enhance service offerings and customer retention Investment in contract logistics customers only occurs after securing long-term contract Maintenance capex represents ~$4.5 million per quarter (~0.7% of sales) The majority of XPO’s capital expenditures are used to fuel growth (1) PF for New Breed acquisition 37% 23% 40% Capitalized Software Other Growth Maintenance |
 30 30 Resilient to Economic Cycles Freight brokerage, last mile and contract logistics resistant to economic downturns Freight brokerage net revenue margins typically expand in economic downturns XPO Last Mile gained market share as smaller providers struggled New Breed grew sales and earnings during the Great Recession |
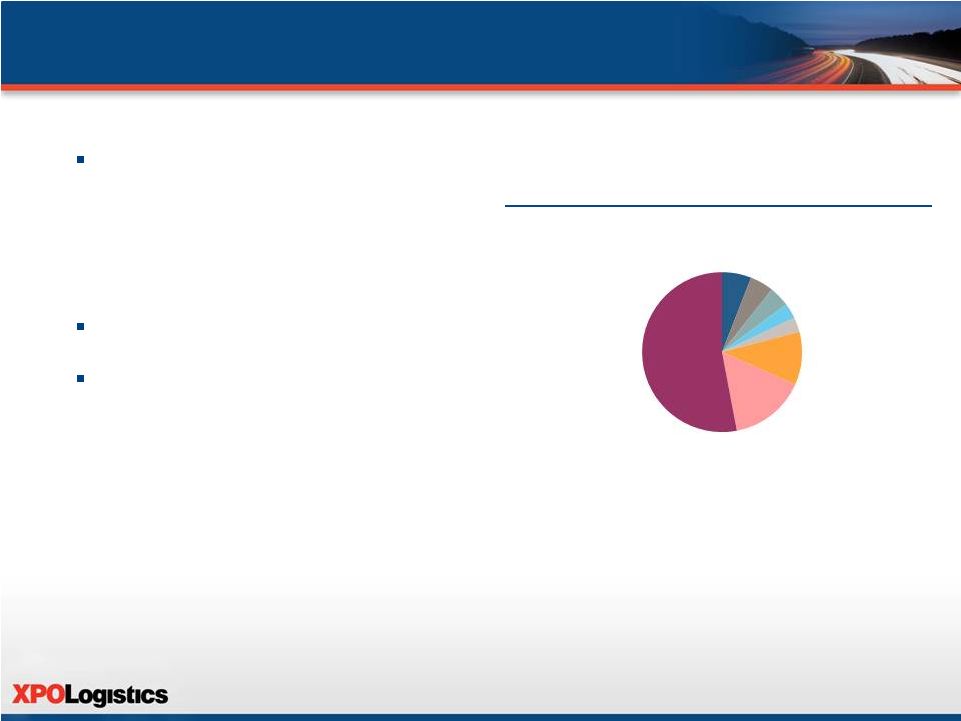 Longstanding and stable relationships with a large, diversified base of blue-chip customers – More than 14,000 active customer accounts ranging from Fortune 100 global leaders to small, privately-held companies Recognized by customers as leading provider New Breed’s revenue is 100% contracted for the rest of 2014 and 88% for 2015 – Contract renewal has averaged ~99% since 2007 Diversified Account Base with Low Customer Concentration Pro Forma Customers as % of Total Revenue (1) (1) PF for the New Breed acquisition 31 Customer 1, 6% Customer 2, 5% Customer 3, 4% Customer 4, 3% Customer 5, 3% Customers 6-10, 11% Customers 11-20, 15% All other customers, 53% 31 |
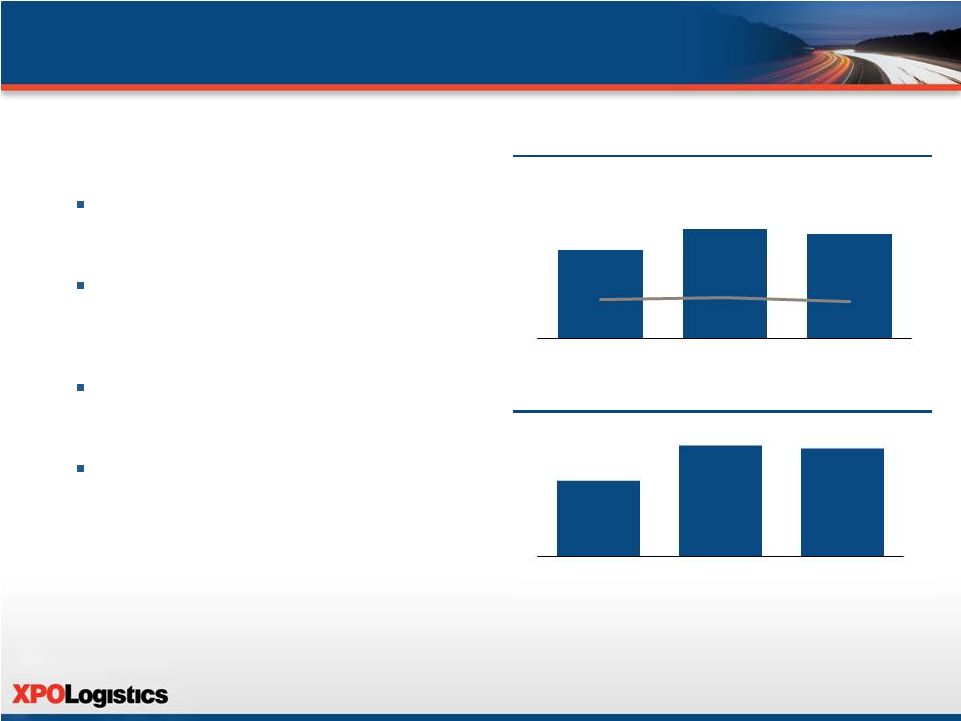 32 32 Attractive cash flow fundamentals Combined and PF Adjusted EBITDA (1) and Margin Significant FCF Conversion (2) Asset-Light Model Generates Strong Cash Flow ($ in millions) (1) 2012 calculated based on combined Company and New Breed metrics. Such metrics do not represent Regulation S-X compliant metrics, and accordingly do not take account of any PF adjustments thereof. PF metrics (and actual results should New Breed have been owned by the Company during the period shown) could substantially differ (2) Represents Combined and PF Adjusted EBITDA less total capex as a percentage of EBITDA $122 $151 $144 5% 6% 5% 2012 2013 LTM 46% 68% 65% 2012 2013 LTM Asset-light 3PL business model has high returns and high free cash flow conversion Low capex requirements and a flexible cost structure allow the Company to adapt to prevailing market conditions Cold-starts require limited initial investment, typically less than $1 million Investments in infrastructure and IT have positioned the Company for continued growth without significant increase in capex |
 33 33 Common Shares 52.6 million Preferred Shares 10.5 million Warrants 7.8 million dilutive (2) Convertible Senior Notes 7.3 million shares (3) Stock Options and RSUs 1.2 million dilutive (4) Fully Diluted Shares Outstanding 79.4 million Fully Diluted Market Capitalization $2,450 million (5) New Senior Notes $500 million Debt-to-Cap 18.3% (6) Significant Equity Cushion: Low Debt to Capitalization Incentivized management team with ~29% ownership of the company (1) Equity ownership aligns management team with investors Significant junior capital cushion Substantial equity value creation since Brad Jacobs’ investment in 2011 as company delivered on its plan – Over 500% increase in market cap since September 2011 investment (5) (1) Based on SEC beneficial ownership calculation as of June 30, 2014; includes management and directors (2) Dilutive effect of warrants calculated using treasury method (avg. closing price of $26.41 for the 3 months ending 6/30/14); total warrant proceeds of $74.0 million (3) Assumes conversion in full of $120.7 million in aggregate principal amount of outstanding 4.50% convertible senior notes due 2017 (4) Dilutive effect of outstanding RSUs and stock options calculated using treasury method (avg. closing price of $26.41 for the 3 months ending 6/30/14) (5) As of 8/8/14 (6) Includes $48 million ABL draw and $2 million other debt Common Stock Equivalent Capitalization as of 6/30/14 |
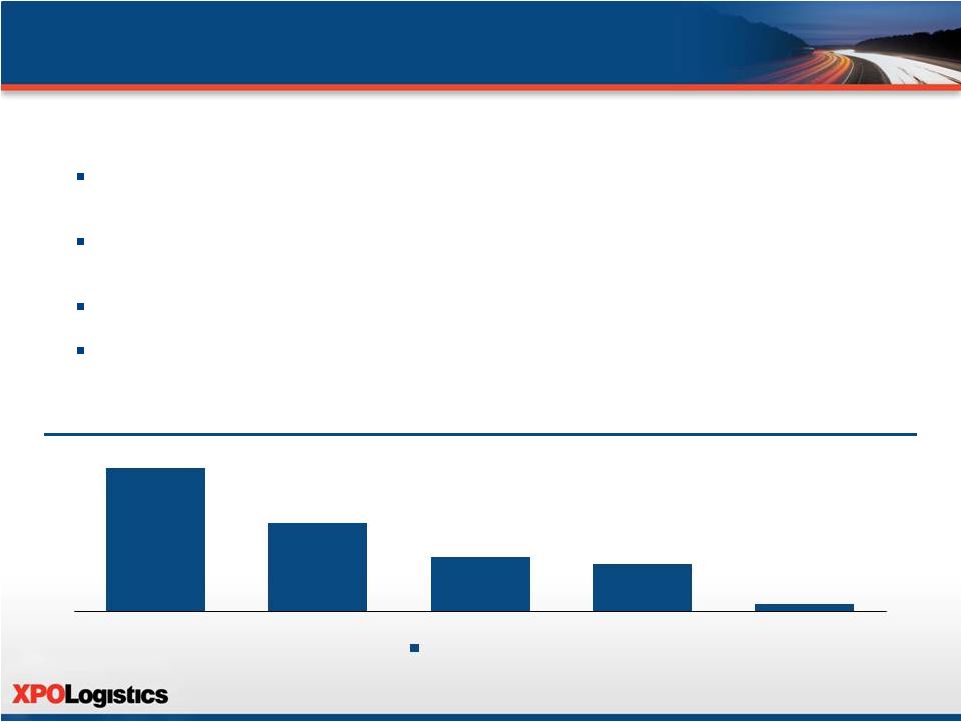 Management Excels at Efficient Integrations Disciplined process for integration with minimal disruption to operations Move acquired operations onto the Company’s IT platform to connect with carrier and customer bases Identify synergies in technology, real estate, sales and administrative functions and duplicative personnel Go to market as one integrated offering and cross-sell services Maintain strong communications with employees, customers and carriers XPO Service Offerings Used by Top 50 Customers 34 21 13 8 7 1 1 Service 2 Services 3 Services 4 Services 5 Services Number of companies 34 |
 3. Financial Overview |
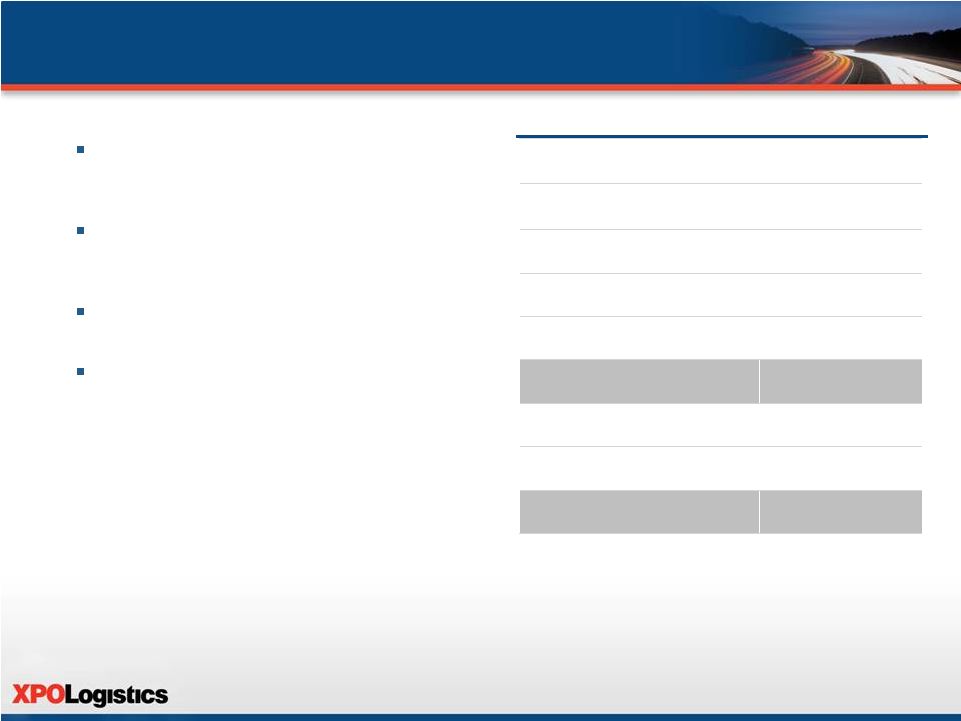
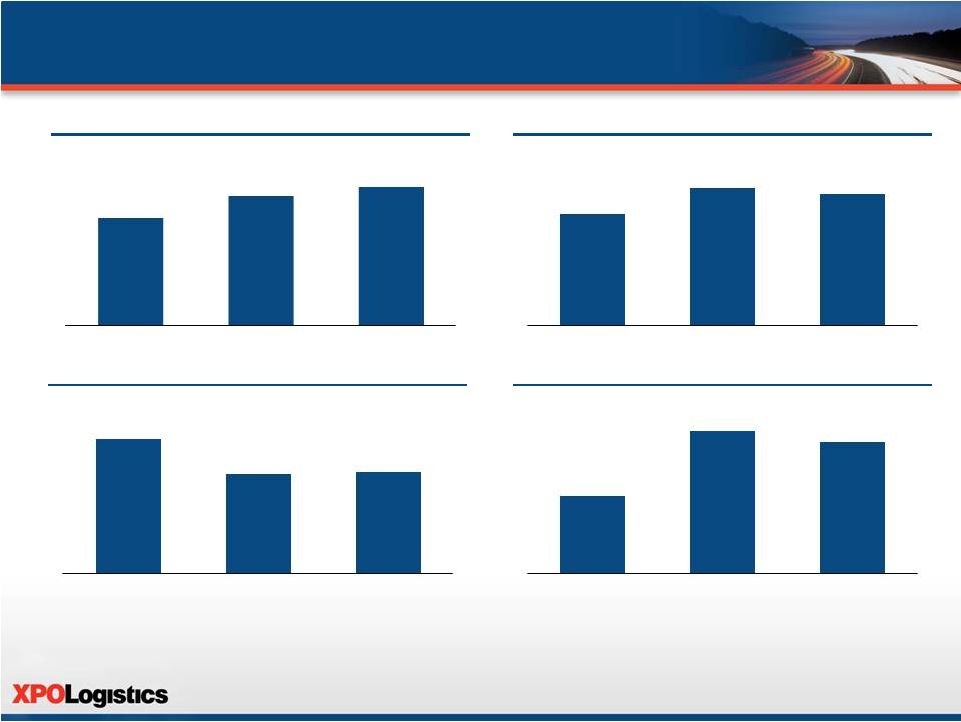 Combined and Pro Forma Historical Financials EBITDA Revenue Unlevered FCF (2) Capex (1) Note: 2012 calculated based on combined Company and New Breed metrics. Such metrics do not represent Regulation S-X compliant metrics, and accordingly do not take account of any PF adjustments thereof. PF metrics (and actual results should New Breed have been owned by the Company during the period shown) could substantially differ (1) Does not reflect capex from ACL (2) Unlevered FCF calculated based on Combined and PF Adjusted EBITDA less capex ($ in millions) ($ in millions) ($ in millions) ($ in millions) 36 $2,257 $2,623 $2,769 2012 2013 LTM 6/30/14 $122 $151 $144 2012 2013 LTM 6/30/14 $66 $49 $50 2012 2013 LTM 6/30/14 $56 $102 $94 2012 2013 LTM 6/30/14 36 |
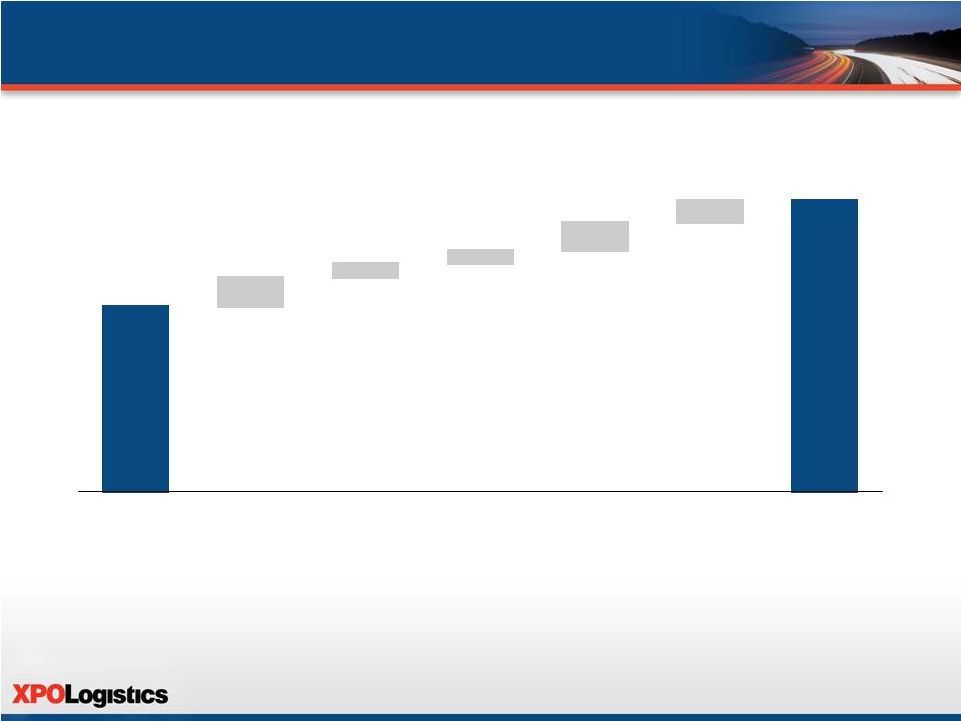 37 37 LTM 6/30/14 EBITDA Bridge ($ in millions) (1) Note: Detailed EBITDA reconciliation located in the Appendix; components do not sum to totals due to rounding (1) PF for acquisitions of 3PD, Pacer and New Breed, as well as associated expenses $91 $144 $14 $7 $6 $14 $11 Adjusted Full-year impact of EBITDA certain other acquisitions Pacer restructuring charges Non -cash equity compensation Cost savings and operational improvement at Pacer, Optima and NLM Non-recurring costs at New Breed Pro Forma Combined EBITDA |
 38 38 Financial Policy Overview Strong liquidity – Access to a $415 million revolving credit facility secured by the Company’s assets (1) No current plans for dividend or return of capital Low capital intensity – Asset-light model and flexible cost structure allow the Company to more easily adapt to prevailing market conditions Modest leverage appetite – Targeted long-term view of total leverage below 3.0x – Outstanding debt of $121 million convertible senior notes are trading deep in the money (1) Borrowing capacity was $243 million prior to New Breed acquisition |
 4. Appendix |
 40 40 Adjusted EBITDA Reconciliation 12 Months Ended 6 Months Ended 6 Months Ended 12 Months Ended ($ in thousands) 12/31/2013 6/30/2013 6/30/2014 6/30/2014 Net loss available to common shareholders ($51,502) ($33,392) ($43,372) ($96,240) Preferred dividends 2,972 1,486 1,475 2,961 Net loss ($48,530) ($31,906) ($41,897) ($93,279) Pacer debt commitment fee – – 4,624 4,624 Other interest expense 18,169 6,170 8,837 60,597 Income tax (benefit) provision expense (22,442) 296 (5,070) (21,940) Accelerated amortization of Express-1 trade name – – 3,346 3,346 Other depreciation and amortization 20,795 3,349 33,197 137,529 EBITDA ($32,008) ($22,091) $3,037 $90,877 Pacer transaction and restructuring costs – – 11,408 – XPO Express and XPO Last Mile rebranding costs – – 321 321 Adjusted EBITDA ($32,008) ($22,091) $14,766 $91,198 |
 41 41 Pro Forma Adjusted EBITDA Reconciliation (1) Includes Adjusted EBITDA from ACL of $6.2 million, from Optima of $1.7 million and from NLM of $9.6 million prior to their respective dates of acquisition (2) Direct, transaction costs related to the acquisitions described in footnote (1) above and acquisitions not consummated (3) Restructuring charges related to the termination of employees and closure of facilities primarily related to the Pacer acquisition in the six months ended June 30, 2014 and other acquisitions in the year ended December 31, 2103 (4) XPO employee non-cash stock compensation expense related to stock options and restricted stock units (5) Cost reductions attributable to Pacer for public company costs, executive headcount reductions, IT headcount reductions; cost reductions have been fully implemented at the time of this transaction (6) Advisor costs related to New Breed's attempts at an initial public offering and other capital market activities (7) Non-cash compensation expense related to distributions to option holders (8) Losses on contracts that will be either terminated or amended such that they are profitable (9) Costs related to a single, large claim that is not normal in the ordinary course of business, as well as non-recurring legal fees associated with two legal cases 12 Months Ended 6 Months Ended 6 Months Ended 12 Months Ended ($ in thousands) 12/31/2013 6/30/2013 6/30/2014 6/30/2014 Adjusted EBITDA $100,740 $50,901 $41,359 $91,198 XPO Adjustments EBITDA from certain acquisitions (1) $17,482 $9,060 $3,301 $11,724 Other acquisitions-related transaction costs (2) 2,991 1,560 1,094 2,525 Restructuring charges (3) 365 – 6,546 6,911 Non-cash stock compensation (4) 4,746 2,147 3,843 6,442 Net cost savings, operating improvement synergies (5) 17,328 8,354 4,704 13,677 New Breed Adjustments Aborted capital markets transactions (6) $1,459 $62 $1,678 $3,075 Option-holder distribution (7) – – 2,691 2,691 Contract losses (8) 3,635 1,306 2,221 4,550 Other (9) 2,054 1,347 – 707 Pro Forma Adjusted EBITDA $150,800 $74,737 $67,437 $143,500 |
 42 42 Combined EBITDA Reconciliation 12 Months Ended ($ in thousands) 12/31/2012 Net loss available to common shareholders ($23,332) Preferred dividends 2,993 Net loss ($20,339) Interest expense 3,207 Income tax (benefit) provision expense (11,195) Depreciation and amortization 2,508 Non-cash equity compensation expense 4,398 Adjusted EBITDA ($21,421) Optima Adjusted EBITDA 2,982 NLM Adjusted EBITDA 6,789 ACL Adjusted EBITDA 2,559 New Breed Adjusted EBITDA 83,822 Pacer Adjusted EBITDA 16,841 3PD Adjusted EBITDA 30,492 Pro Forma Adjusted EBITDA $122,064 Note: 2012 calculated based on combined Company and New Breed metrics. Such metrics do not represent Regulation S-X compliant metrics, and accordingly do not take account of any PF adjustments thereof. PF metrics (and actual results should New Breed have been owned by the Company during the period shown) could substantially differ |
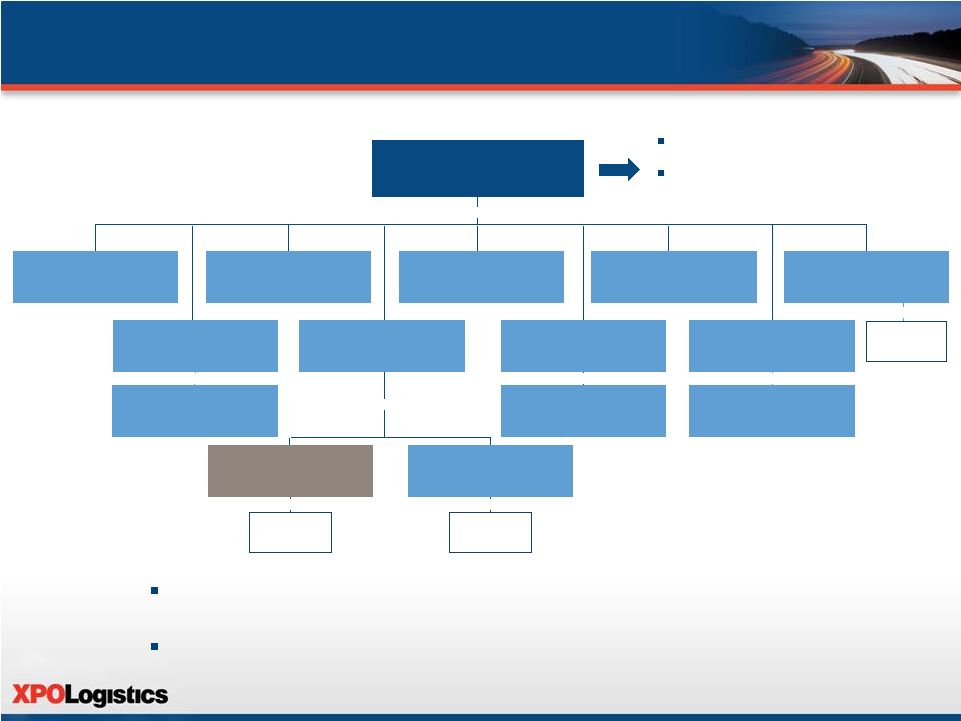 43 43 XPO Logistics Corporate Structure XPO Logistics, Inc. (DE) XPO Global Logistics Inc. (Canada, Federal) Approximately 27 operating subsidiaries 100% 100% 100% 100% Approximately 7 operating subsidiaries Approximately 12 operating subsidiaries 100% 100% All of the Company’s domestic subsidiaries (subject to certain customary exceptions) will be guarantors of the Notes Foreign subsidiaries account for less than 4% of total revenues and EBITDA Note: The senior convertible notes due 2017 do not benefit from any subsidiary guarantees Will be the issuer of the notes Is the borrower under the ABL revolver and issuer of the convertible notes New Breed Holding Co. (DE) 3PD Holding, Inc. (DE) Concert Group Logistics, Inc. d/b/a XPO Global Logistics (DE) XPO Express, Inc. (fka Express-1, Inc.) (MI) Bounce Logistics, Inc. (DE) XPO Logistics Canada Inc. (Canada, ON) Pacer International, Inc. (TN) XPO NLM, Inc. (DE) XPO Air Charter, LLC (DE) XPO Dedicated, LLC (DE) XPO NLM, LLC (DE) XPO AQ, Inc. (DE) XPO Logistics, LLC (DE) 100% 100% |
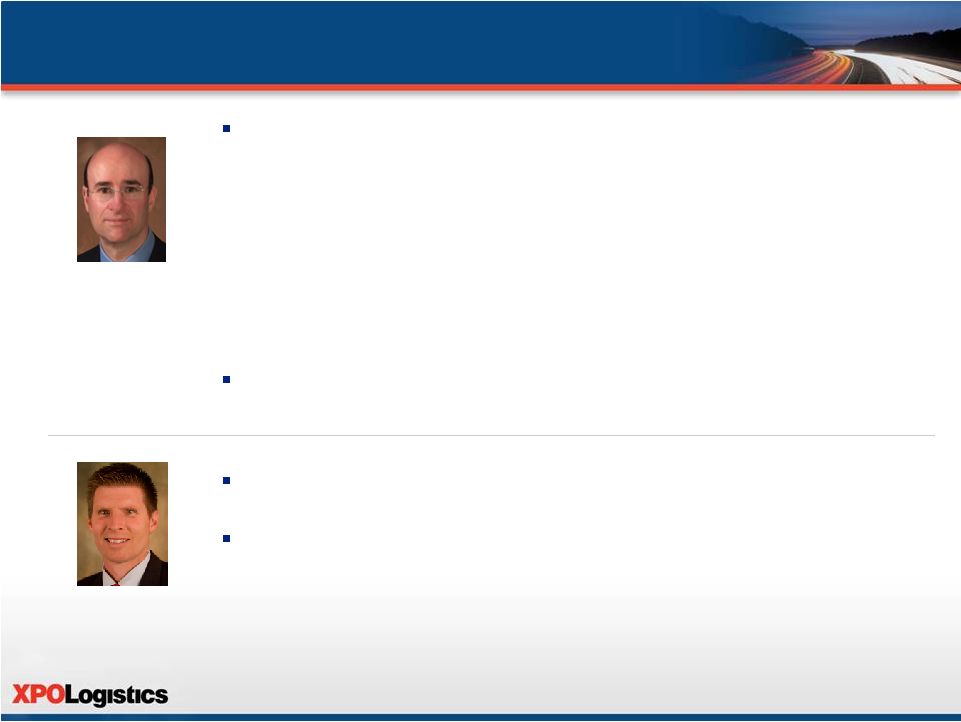 44 44 Skilled Management Team Driving Performance-Based Culture Brad Jacobs Chairman & CEO Unique track record of building well-run organizations that create dramatic shareholder value – started four highly successful companies from scratch and built each into a billion dollar or multi-billion dollar enterprise: – United Rentals (NYSE: URI): current market cap of $10.8 billion – United Waste Systems: sold for $2.5 billion in 1997 – Hamilton Resources: annual revenue of $1 billion; Amerex Oil Associates: annual gross contract volume of approximately $4.7 billion Success generated by integrating large numbers of acquisitions and cold-starts, focusing on organic growth, and delivering on a culture of world-class service Vice President for United Rentals where he successfully integrated over 200 acquisitions in the United States, Canada and Mexico For United Waste Systems he worked with Mr. Jacobs to build an integrated organization of 86 collection companies and 119 facilities in 25 states Troy Cooper COO |
 45 45 Skilled Management Team Driving Performance-Based Culture (Cont’d) Managing Director in the Transportation & Logistics investment banking group with Stifel Nicolaus Weisel Investment banker in the Transportation and Telecom groups at Alex. Brown & Sons (now Deutsche Bank) Has completed over 60 M&A transactions and his teams have raised billions of dollars of capital for many of the industry's leading logistics companies Senior transportation analyst covering air, rail, trucking and shipping at Goldman Sachs Analyst with UBS, and internal strategy manager with JPMorgan Chase, where he worked with several of the bank's business units Global advisor for The Sharma Group, focused on M&A opportunities Scott Malat Chief Strategy Officer John Hardig CFO Vice President – Corporate Development with AutoNation, Inc., where he previously held positions as Vice President – Associate General Counsel and Senior Counsel for its Retail Automotive Group Associate at the law firm of Skadden, Arps, Slate, Meagher & Flom LLP, specializing in M&A and securities law Gordon Devens General Counsel |
 Skilled Management Team Driving Performance-Based Culture (Cont’d) Will join XPO upon the acquisition to lead the contract logistics operations Transformed New Breed from a regional business with 10 employees into the preeminent U.S. provider of complex, industry-defining contract logistics services Created outsized value by positioning New Breed as an innovator of customized solutions for world-class companies Louis DeJoy CEO, New Breed Responsible for New Breed’s overall financial management and human resource function Former Managing Partner for the Greensboro office of Ernst & Young Over 35 years of experience with both private and public companies across diverse industries Rick Wimmer CFO, New Breed Global Controller with GE Energy Services, Inc., a $16 billion revenue division of General Electric Company Assistant Corporate Controller with The Home Depot, Inc., and Senior Manager with PricewaterhouseCoopers Kent Renner Chief Accounting Officer 46 46 |
 47 47 Skilled Management Team Driving Performance-Based Culture (Cont’d) Vice President of Network Profitability and Management for Pacer International Responsible for optimizing Pacer’s intermodal network Led capacity flow and asset management, market-based pricing, and capacity planning for rail relationships More than 30 years' experience in leadership positions with some of the most prominent expediters, serving the most demanding verticals in the transportation industry President and CEO of Active Aero, senior management positions with Boyd Brothers Transportation, Caliber Logistics (now FedEx Supply Chain Services) and Roberts Express (now FedEx Custom Critical) Paul Smith President, Intermodal Chris Healy President, Expedited Founded 3PD and built it into an industry leader with an intense commitment to innovation and service Developed some of the last mile industry’s most groundbreaking mobile technologies for real-time visibility and customer experience management Led Home Depot’s multi-billion dollar delivery business and successfully transitioned the operations from an in-house to an outsourced model Karl Meyer CEO, XPO Last Mile |
 48 48 Skilled Management Team Driving Performance-Based Culture (Cont’d) More than 25 years' experience in the transportation and logistics industry, most recently as Executive Vice President of Sales and Marketing for Pacer International's Intermodal Business, acquired by XPO Logistics in 2014 Held senior positions in sales and marketing and national account management with Union Pacific Railroad Julie Luna Chief Commercial Officer |