Exhibit 99.2
XPO Investor Presentation
June 2015
Acquires Norbert Dentressangle and Bridge Terminal Transport
Disclaimers
Forward-Looking Statements
This presentation includes forward-looking statements within the meaning of Section 27A of the Securities Act of 1933, as amended, and Section 21E of the Securities Exchange Act of 1934, as amended, including 2015 performance targets, the expected impact of the acquisitions of Norbert Dentressangle SA (ND) and Bridge Terminal Transport Services, Inc. (BTT), and the related financing, including the expected impact on XPO Logistics’ results of operations and EBITDA, the retention of the management teams of Norbert Dentressangle and BTT, the expected ability to integrate operations and technology platforms and to cross-sell services, and the expected ability to retain acquired companies’ businesses and to grow XPO’s and the acquired companies’ businesses. All statements other than statements of historical fact are, or may be deemed to be, forward-looking statements. In some cases, forward-looking statements can be identified by the use of forward-looking terms such as “anticipate,” “estimate,” “believe,” “continue,” “could,” “intend,” “may,” “plan,” “potential,” “predict,” “should,” “will,” “expect,” “objective,” “projection,” “forecast,” “goal,” “guidance,” “outlook,” “effort,” “target” or the negative of these terms or other comparable terms. However, the absence of these words does not mean that the statements are not forward-looking. These forward-looking statements are based on certain assumptions and analyses made by us in light of our experience and our perception of historical trends, current conditions and expected future developments, as well as other factors we believe are appropriate in the circumstances.
These forward-looking statements are subject to known and unknown risks, uncertainties and assumptions that may cause actual results, levels of activity, performance or achievements to be materially different from any future results, levels of activity, performance or achievements expressed or implied by such forward-looking statements. Factors that might cause or contribute to a material difference include those discussed in XPO’s filings with the SEC and the following: economic conditions generally; competition; XPO’s ability to find suitable acquisition candidates and execute its acquisition strategy; the expected impact of the Norbert Dentressangle and BTT acquisitions, including the expected impact on XPO’s results of operations; XPO’s ability to successfully complete the tender offer of Norbert Dentressangle’s publicly held shares; the ability to successfully integrate and realize anticipated synergies and cost savings with respect to Norbert Dentressangle, BTT and other acquired companies; XPO’s ability to raise debt and equity capital; XPO’s ability to attract and retain key employees to execute its growth strategy, including retention of Norbert Dentressangle’s and BTT’s management teams; litigation, including litigation related to alleged misclassification of independent contractors; the ability to develop and implement a suitable information technology system; the ability to maintain positive relationships with XPO’s, Norbert Dentressangle’s and BTT’s networks of third-party transportation providers; the ability to retain XPO’s, Norbert Dentressangle’s, BTT’s and other acquired companies’ largest customers; rail and other network changes; weather and other service disruptions; and governmental regulation. All forward-looking statements set forth in this press release are qualified by these cautionary statements and there can be no assurance that the actual results or developments anticipated will be realized or, even if substantially realized, that they will have the expected consequences to, or effects on, XPO or its businesses or operations. Forward-looking statements set forth in this document speak only as of the date hereof, and XPO undertakes no obligation to update forward-looking statements to reflect subsequent events or circumstances, changes in expectations or the occurrence of unanticipated events except to the extent required by law.
Information concerning Norbert Dentressangle contained in this presentation has been sourced from publicly available information. The public tender offer that will be filed by XPO on Norbert Dentressangle shares will be described in an information memorandum, which will be subject to the review and approval of the French Autorité des marchés financiers.
Non-GAAP Financial Measures
This presentation contains certain non-GAAP financial measures as defined under Securities and Exchange Commission (“SEC”) rules, such as adjusted earnings (loss) before interest, taxes, depreciation and amortization (“adjusted EBITDA”), in each case for the quarters ended March 31, 2015 and 2014, and pro formal adjusted EBITDA for 2014 and the 12-month period ended March 31, 2015. As required by SEC rules, we provide reconciliations of these measures to the most directly comparable measure under United States generally accepted accounting principles (“GAAP”), which are set forth in the attachments to this release. We believe that adjusted EBITDA and pro forma adjusted EBITDA improve comparability from period to period by removing the impact of our capital structure (interest expense from our outstanding debt), asset base (depreciation and amortization) and tax consequences, in addition to reflecting anticipated pro forma adjustments relating to recent acquisitions as permitted by the instruments governing our credit facility and senior notes. In addition to its use by management, we believe that adjusted EBITDA is a measure widely used by securities analysts, investors and others to evaluate the financial performance of companies in our industry. Other companies may calculate adjusted EBITDA differently, and therefore our measure may not be comparable to similarly titled measures of other companies. Adjusted EBITDA is not a measure of financial performance or liquidity under GAAP and should not be considered in isolation or as an alternative to net income, cash flows from operating activities and other measures determined in accordance with GAAP. Items excluded from adjusted EBITDA are significant and necessary components of the operations of our business, and, therefore, adjusted EBITDA should only be used as a supplemental measure of our operating performance.
2 | XPO Investor Presentation June 2015
Contents
Growth strategy and execution First quarter 2015 financial results Acquisition of Norbert Dentressangle Acquisition of Bridge Terminal Transport Summary
3 | XPO Investor Presentation June 2015
XPO is One of the Largest 3PLs in the World
Top ten worldwide logistics company
#2 global freight brokerage firm by net revenue
#3 provider of intermodal services in North America
#1 last mile logistics provider for heavy goods in North America
#1 manager of expedited shipments in North America
One of the world’s largest contract logistics companies
Leading ground transportation network in Europe
Growing presence in global freight forwarding (ocean and air)
Leading outsourced European e-fulfillment platform
Many robust avenues for growth
Source: Industry publications and company filings
4 | XPO Investor Presentation June 2015
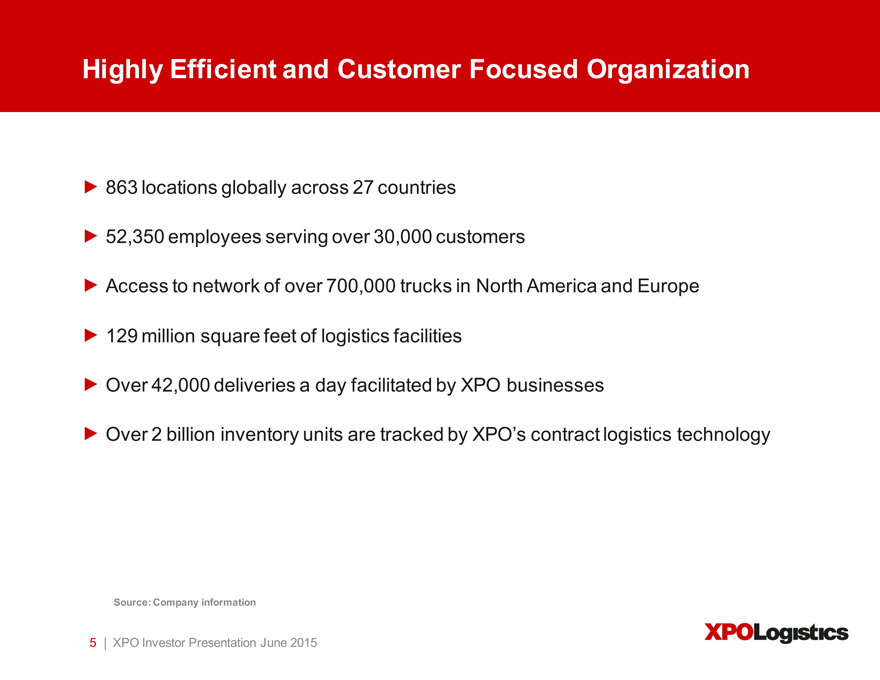
Highly Efficient and Customer Focused Organization
863 locations globally across 27 countries
52,350 employees serving over 30,000 customers
Access to network of over 700,000 trucks in North America and Europe 129 million square feet of logistics facilities Over 42,000 deliveries a day facilitated by XPO businesses
Over 2 billion inventory units are tracked by XPO’s contract logistics technology
Source: Company information
5 | XPO Investor Presentation June 2015
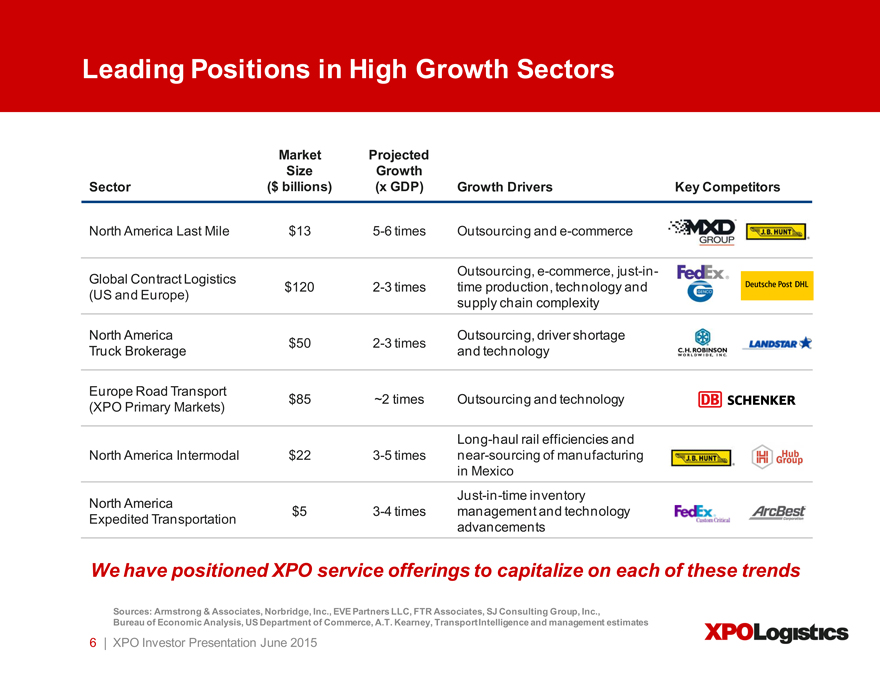
Leading Positions in High Growth Sectors
Market Projected Size Growth
Sector ($ billions) (x GDP) Growth Drivers Key Competitors
North America Last Mile $13 5-6 times Outsourcing and e-commerce
Outsourcing, e-commerce, just-in-Global Contract Logistics $120 2-3 times time production, technology and (US and Europe) supply chain complexity
North America Outsourcing, driver shortage
$50 2-3 times
Truck Brokerage and technology
Europe Road Transport
$85 ~2 times Outsourcing and technology (XPO Primary Markets)
Long-haul rail efficiencies and North America Intermodal $22 3-5 times near-sourcing of manufacturing in Mexico Just-in-time inventory North America
$5 3-4 times management and technology Expedited Transportation advancements
We have positioned XPO service offerings to capitalize on each of these trends
Sources: Armstrong & Associates, Norbridge, Inc., EVE Partners LLC, FTR Associates, SJ Consulting Group, Inc.,
Bureau of Economic Analysis, US Department of Commerce, A.T. Kearney, TransportIntelligence and management estimates
6 | XPO Investor Presentation June 2015
CEO Bradley S. Jacobs
Prior to XPO, founded and led four highly successful companies, including two world-class publicly-traded corporations
United Rentals: Built world’s largest equipment rental company
United Waste: Created 5th largest solid waste business in North America Hamilton Resources: Grew global oil trading company to ~$1 billion
Amerex Oil Associates: Built one of world’s largest oil brokerage firms
United Rentals stock outperformed S&P 500 by 2.2x from 1997 to 2007 United Waste stock outperformed S&P 500 by 5.6x from 1992 to 1997
7 | XPO Investor Presentation June 2015
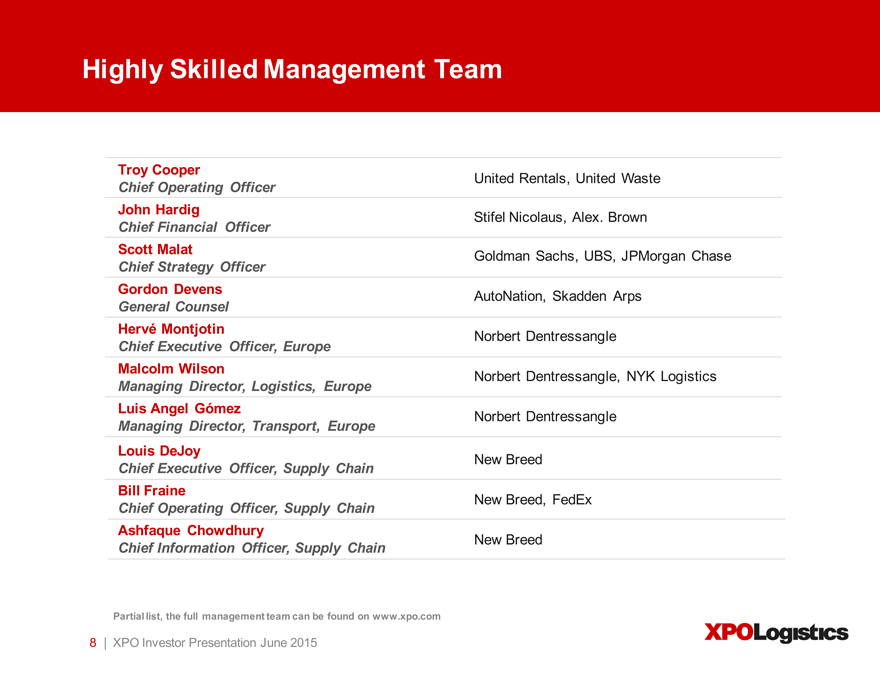
Highly Skilled Management Team
Troy Cooper United Rentals, United Waste
Chief Operating Officer
John Hardig Stifel Nicolaus, Alex. Brown
Chief Financial Officer
Scott Malat Goldman Sachs, UBS, JPMorgan Chase
Chief Strategy Officer
Gordon Devens AutoNation, Skadden Arps
General Counsel
Hervé Montjotin Norbert Dentressangle
Chief Executive Officer, Europe
Malcolm Wilson Norbert Dentressangle, NYK Logistics
Managing Director, Logistics, Europe
Luis Angel Gómez Norbert Dentressangle
Managing Director, Transport, Europe
Louis DeJoy New Breed
Chief Executive Officer, Supply Chain
Bill Fraine
Chief Operating Officer, Supply Chain New Breed, FedEx
Ashfaque Chowdhury
Chief Information Officer, Supply Chain New Breed
Partial list, the full management team can be found on www.xpo.com
8 | XPO Investor Presentation June 2015
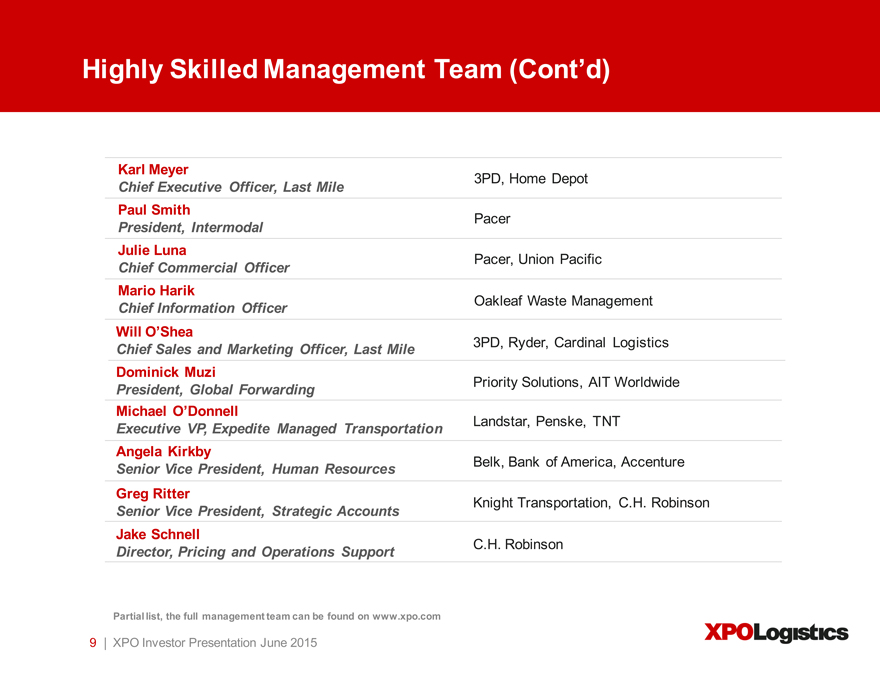
Highly Skilled Management Team (Cont’d)
Karl Meyer
3PD, Home Depot
Chief Executive Officer, Last Mile
Paul Smith
Pacer
President, Intermodal
Julie Luna
Pacer, Union Pacific
Chief Commercial Officer
Mario Harik
Oakleaf Waste Management
Chief Information Officer
Will O’Shea
3PD, Ryder, Cardinal Logistics
Chief Sales and Marketing Officer, Last Mile
Dominick Muzi
Priority Solutions, AIT Worldwide
President, Global Forwarding
Michael O’Donnell
Landstar, Penske, TNT
Executive VP, Expedite Managed Transportation
Angela Kirkby
Belk, Bank of America, Accenture
Senior Vice President, Human Resources
Greg Ritter
Knight Transportation, C.H. Robinson
Senior Vice President, Strategic Accounts
Jake Schnell
C.H. Robinson
Director, Pricing and Operations Support
Partial list, the full management team can be found on www.xpo.com
9 | XPO Investor Presentation June 2015
First Quarter 2015 Financial Results
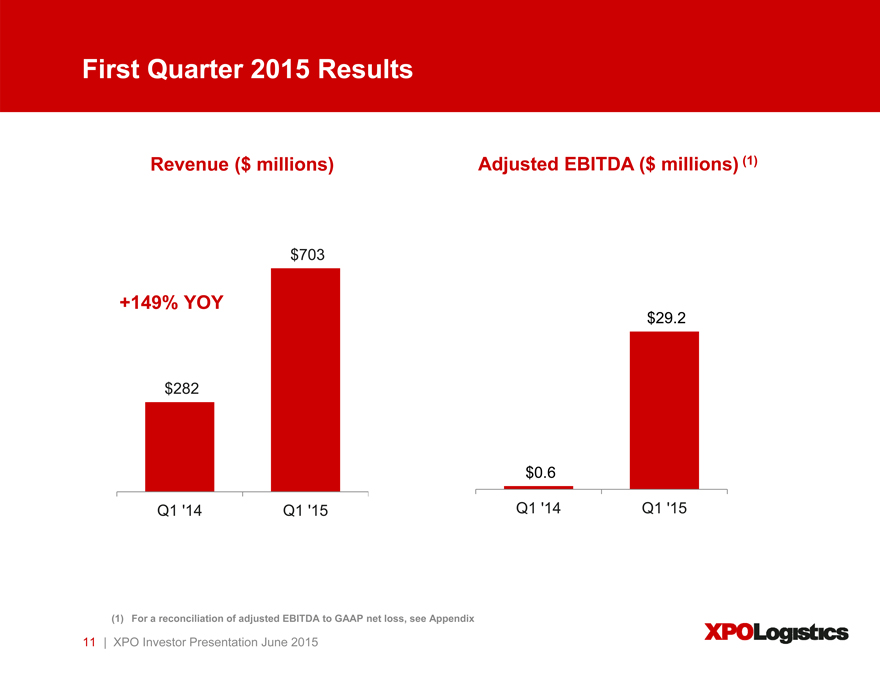
First Quarter 2015 Results
Revenue ($ millions) Adjusted EBITDA ($ millions) (1)
$703
+149% YOY
$29.2
$282
$0.6
Q1 ‘14 Q1 ‘15 Q1 ‘14 Q1 ‘15
(1) For a reconciliation of adjusted EBITDA to GAAP net loss, see Appendix
11 | XPO Investor Presentation June 2015
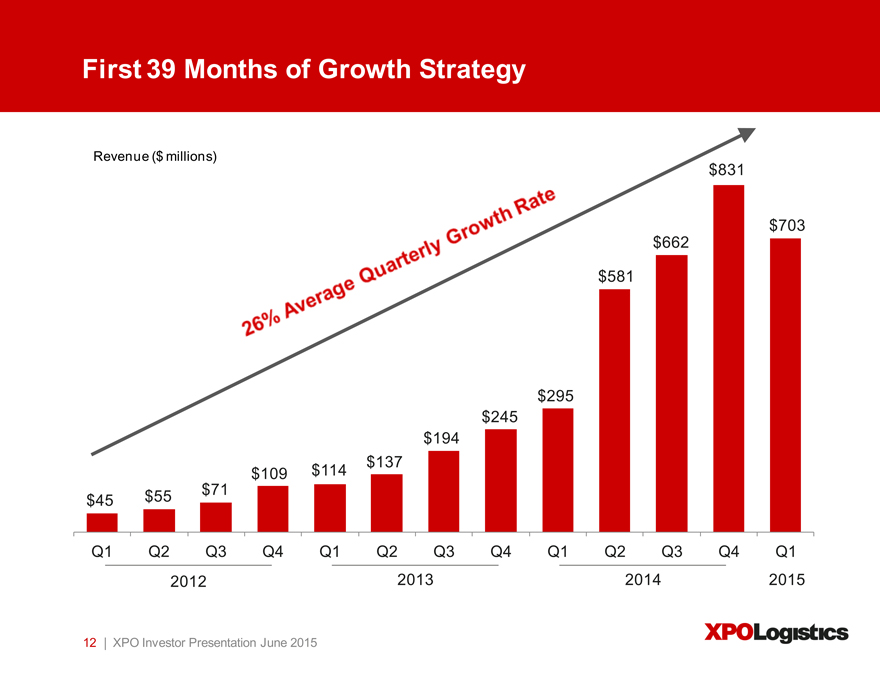
First 39 Months of Growth Strategy
Revenue ($ millions) $831
$703 $662
$581
$295 $245 $194 $137 $109 $114
$55 $71
$45
Q1 Q2 Q3 Q4 Q1 Q2 Q3 Q4 Q1 Q2 Q3 Q4 Q1 2012 2013 2014 2015
12 | XPO Investor Presentation June 2015
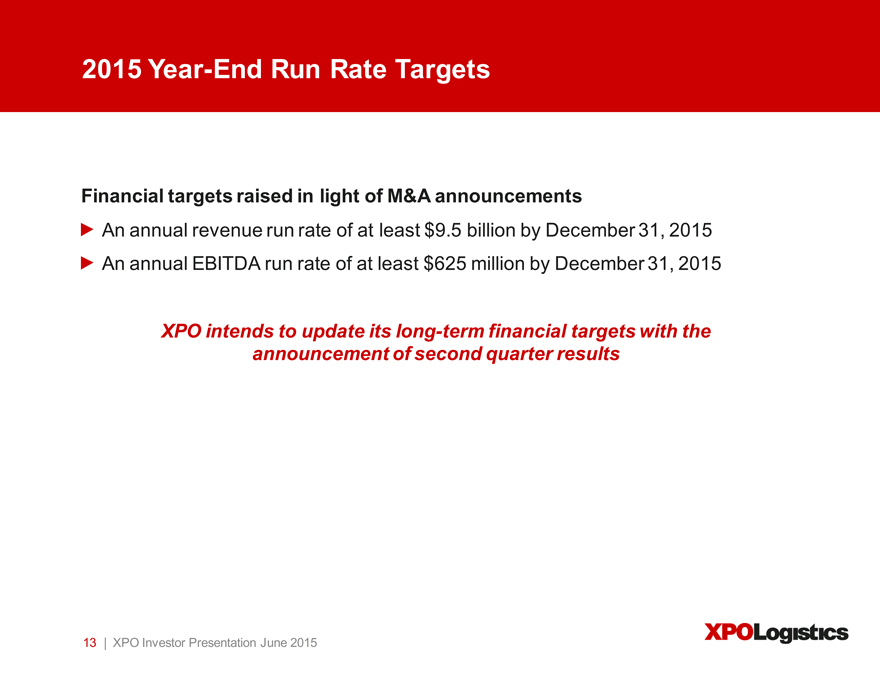
2015 Year-End Run Rate Targets
Financial targets raised in light of M&A announcements
An annual revenue run rate of at least $9.5 billion by December 31, 2015 An annual EBITDA run rate of at least $625 million by December 31, 2015
XPO intends to update its long-term financial targets with the announcement of second quarter results
13 | XPO Investor Presentation June 2015
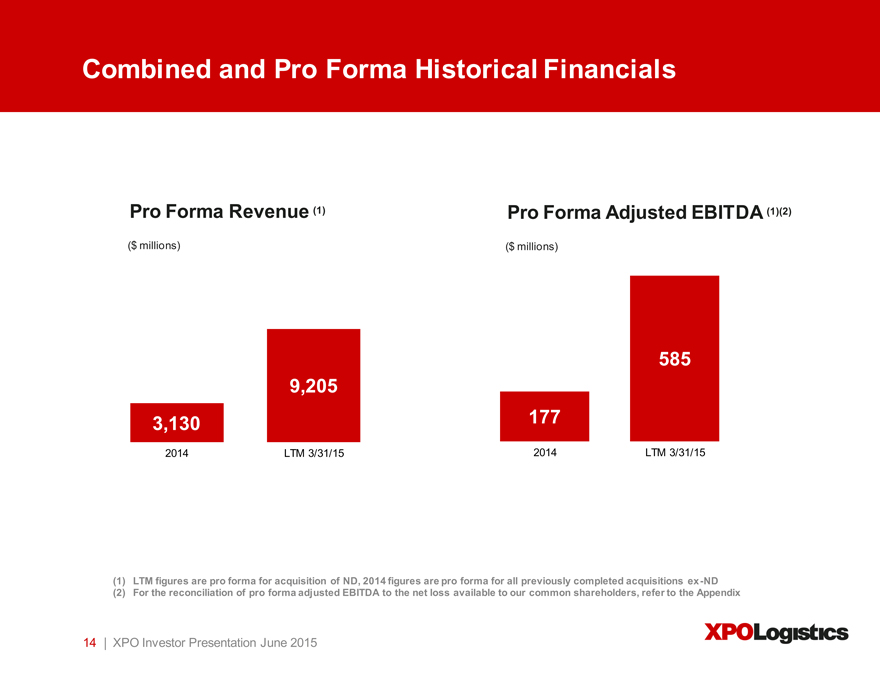
Combined and Pro Forma Historical Financials
Pro Forma Revenue (1) Pro Forma Adjusted EBITDA (1)(2)
($ millions) ($ millions)
585 9,205 3,130 177
2014 LTM 3/31/15 2014 LTM 3/31/15
(1) LTM figures are pro forma for acquisition of ND, 2014 figures are pro forma for all previously completed acquisitions ex-ND (2) For the reconciliation of pro forma adjusted EBITDA to the net loss available to our common shareholders, refer to the Appendix
14 | XPO Investor Presentation June 2015
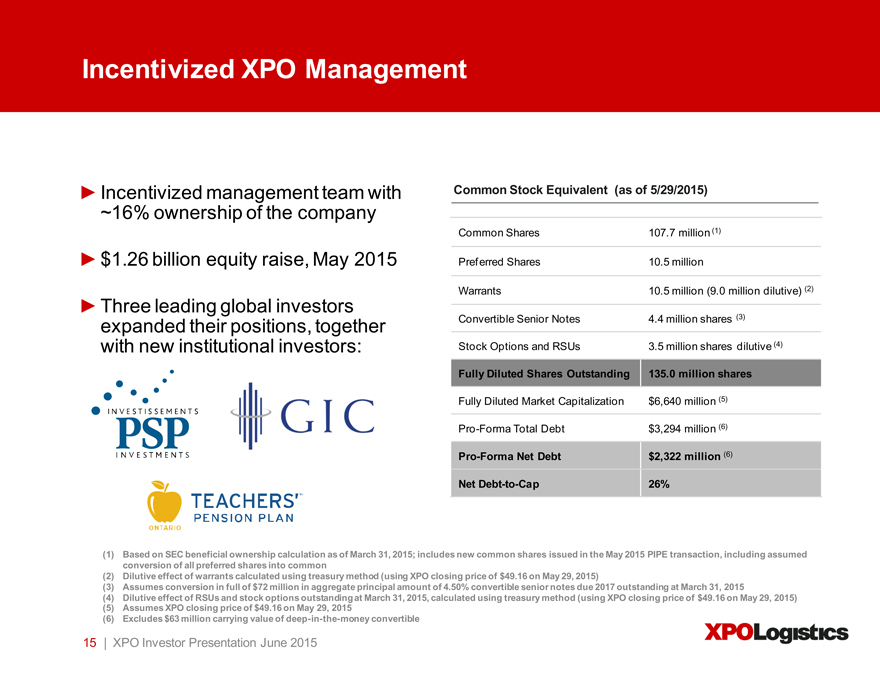
Incentivized XPO Management
Incentivized management team with ~16% ownership of the company
$1.26 billion equity raise, May 2015
Three leading global investors expanded their positions, together with new institutional investors:
Common Stock Equivalent (as of 5/29/2015)
Common Shares 107.7 million (1)
Preferred Shares 10.5 million
Warrants 10.5 million (9.0 million dilutive) (2) Convertible Senior Notes 4.4 million shares (3) Stock Options and RSUs 3.5 million shares dilutive (4)
Fully Diluted Shares Outstanding 135.0 million shares
Fully Diluted Market Capitalization $6,640 million (5)
Pro-Forma Total Debt $3,294 million (6)
Pro-Forma Net Debt $2,322 million (6)
Net Debt-to-Cap 26%
(1) Based on SEC beneficial ownership calculation as of March 31, 2015; includes new common shares issued in the May 2015 PIPE transaction, including assumed conversion of all preferred shares into common (2) Dilutive effect of warrants calculated using treasury method (using XPO closing price of $49.16 on May 29, 2015) (3) Assumes conversion in full of $72 million in aggregate principal amount of 4.50% convertible senior notes due 2017 outstanding at March 31, 2015
(4) Dilutive effect of RSUs and stock options outstanding at March 31, 2015, calculated using treasury method (using XPO closing price of $49.16 on May 29, 2015)
(5) | | Assumes XPO closing price of $49.16 on May 29, 2015 |
(6) | | Excludes $63 million carrying value of deep-in-the-money convertible |
15 | XPO Investor Presentation June 2015
Acquired Norbert Dentressangle (ND)
June 8, 2015
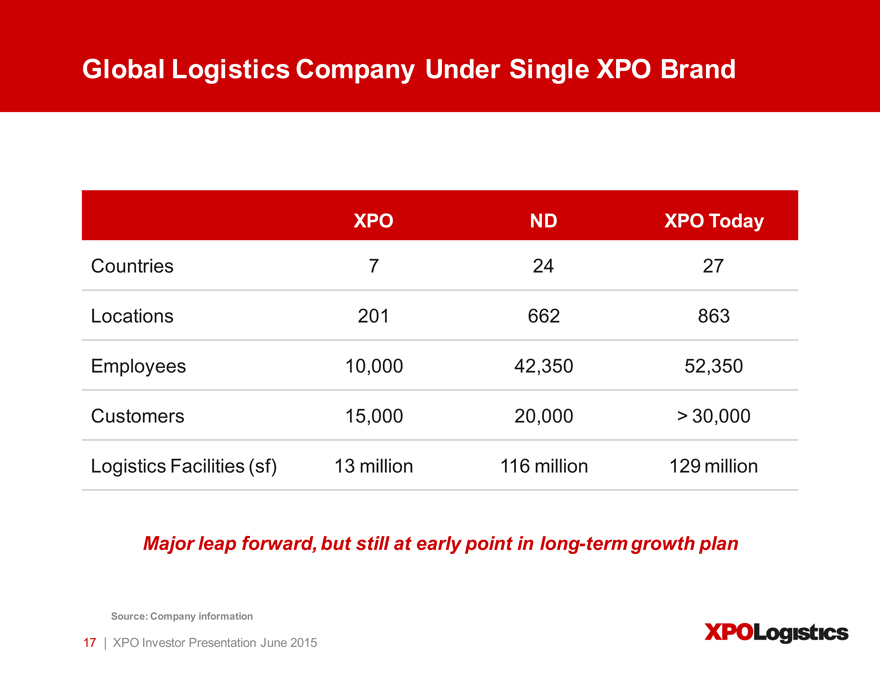
Global Logistics Company Under Single XPO Brand
XPO ND XPO Today
Countries 7 24 27
Locations 201 662 863
Employees 10,000 42,350 52,350
Customers 15,000 20,000 > 30,000
Logistics Facilities (sf) 13 million 116 million 129 million
Major leap forward, but still at early point in long-term growth plan
Source: Company information
17 | XPO Investor Presentation June 2015
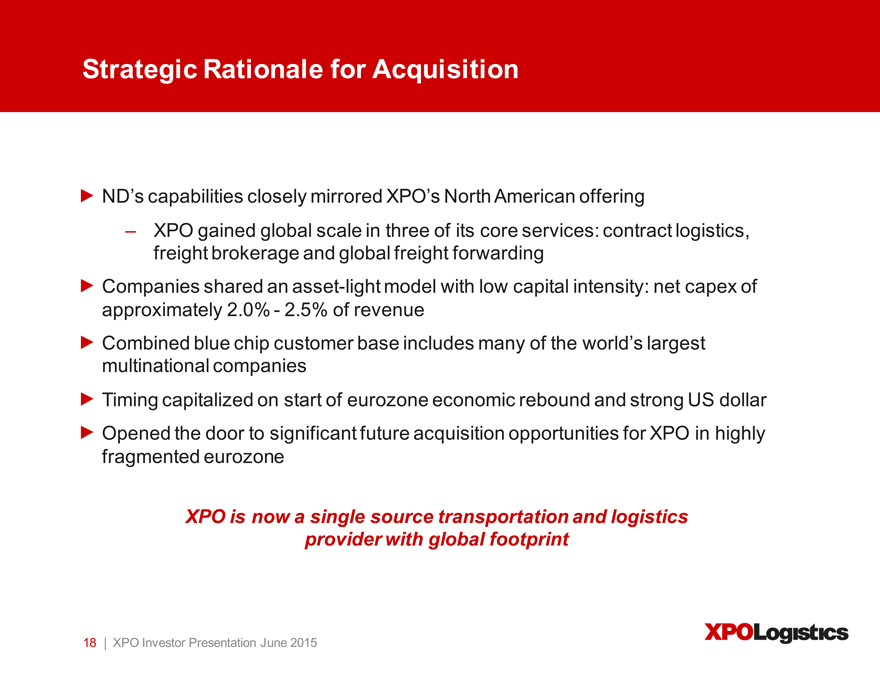
Strategic Rationale for Acquisition
ND’s capabilities closely mirrored XPO’s North American offering
– XPO gained global scale in three of its core services: contract logistics, freight brokerage and global freight forwarding Companies shared an asset-light model with low capital intensity: net capex of approximately 2.0%—2.5% of revenue Combined blue chip customer base includes many of the world’s largest multinational companies Timing capitalized on start of eurozone economic rebound and strong US dollar Opened the door to significant future acquisition opportunities for XPO in highly fragmented eurozone
XPO is now a single source transportation and logistics provider with global footprint
18 | XPO Investor Presentation June 2015
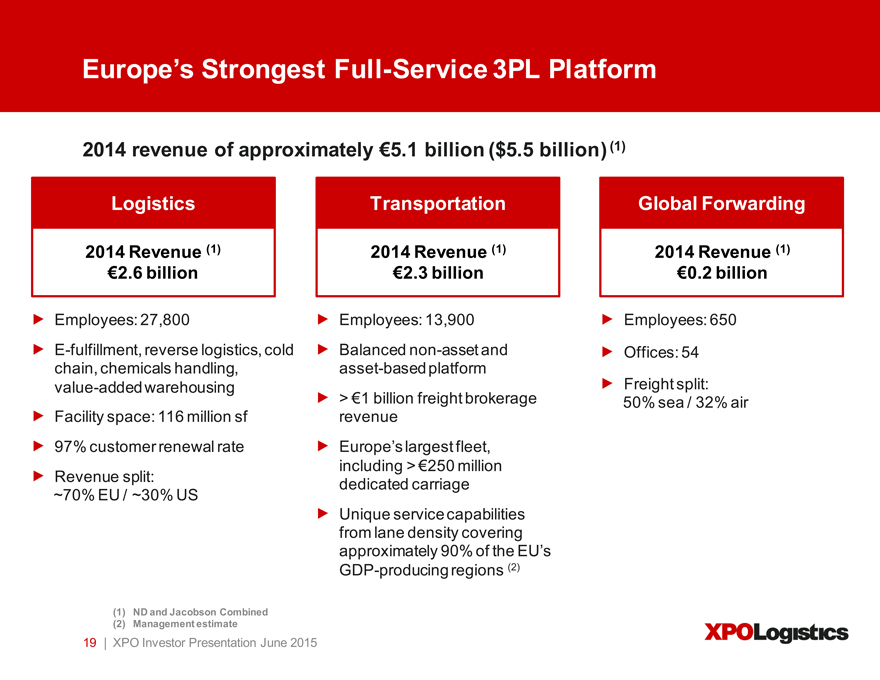
Europe’s Strongest Full-Service 3PL Platform
2014 revenue of approximately €5.1 billion ($5.5 billion) (1)
Logistics Transportation Global Forwarding
2014 Revenue (1) 2014 Revenue (1) 2014 Revenue (1) €2.6 billion €2.3 billion €0.2 billion
Employees: 27,800
E-fulfillment, reverse logistics, cold chain, chemicals handling, value-added warehousing Facility space: 116 million sf 97% customer renewal rate Revenue split: ~70% EU / ~30% US
Employees: 13,900 Balanced non-asset and asset-based platform
> €1 billion freight brokerage revenue
Europe’s largest fleet, including > €250 million dedicated carriage Unique service capabilities from lane density covering approximately 90% of the EU’s
GDP-producing regions (2)
Employees: 650
Offices: 54
Freight split: 50% sea / 32% air
(1) ND and Jacobson Combined (2) Management estimate
19 | XPO Investor Presentation June 2015
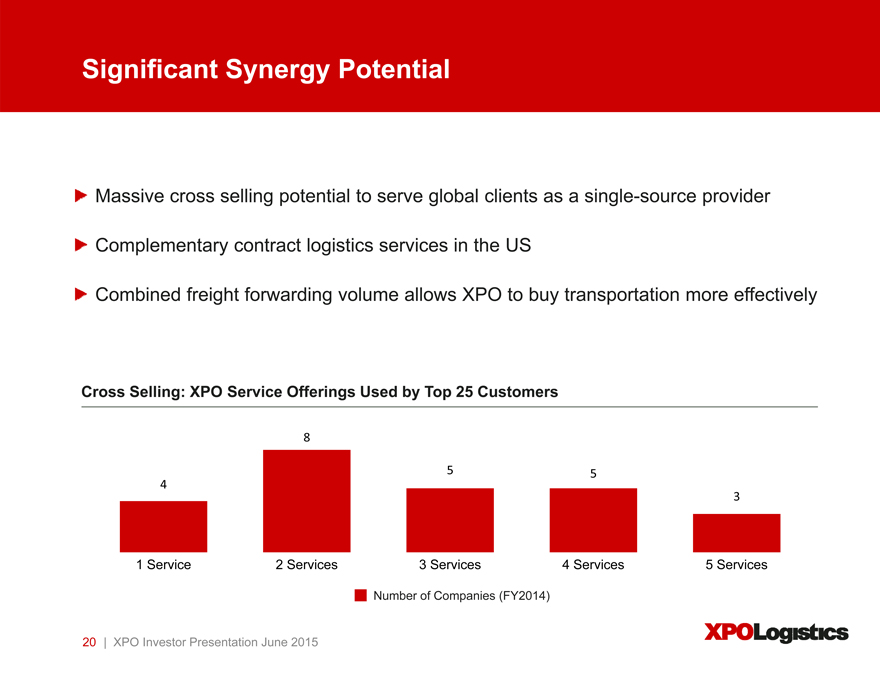
Significant Synergy Potential
Massive cross selling potential to serve global clients as a single-source provider
Complementary contract logistics services in the US
Combined freight forwarding volume allows XPO to buy transportation more effectively
Cross Selling: XPO Service Offerings Used by Top 25 Customers
8
5 5
4
3
1 Service 2 Services 3 Services 4 Services 5 Services
Number of Companies (FY2014)
20 | XPO Investor Presentation June 2015
Combination is a Growth Accelerator
Deploy cutting-edge technology to turbocharge growth in freight brokerage
Pricing and truck matching algorithms to accelerate growth and margins
Combined annual technology spend of $225 million, among highest in the industry
Combine leading businesses in fast growth e-commerce
Top outsourced e-fulfillment provider in Europe, handling >200 million units per year Leading capabilities in reverse logistics Expand leadership position in last-mile logistics for heavy goods to Europe
Sharing best practices and capabilities across new global platform
21 | XPO Investor Presentation June 2015
European Leader in E-Commerce Fulfillment
Favorable historical performance and future growth opportunities
€242 million revenue in e-commerce logistics in 2014
31% organic growth compared to 2013
Business focused in the UK, Spain and France
Strong growth potential with approximately 5% market share in estimated €5 billion European e-fulfillment market
Expected to increase at 9% to 10% CAGR over the next several years
Increasingly complex supply chains and customer requirements demand scale, which ND has and few others can match
Serves both B2B and B2C customers
Leading capabilities in high-growth reverse logistics
Source: Company information
22 | XPO Investor Presentation June 2015
Preeminent European Transportation Network
36-year history as global partner to blue chip customers Combines non-asset, asset-light and asset-based operations
Rapid growth in freight brokerage, asset-light palletized service and dedicated carriage Unique service capabilities from lane density covering approximately 90% of the
EU’s GDP-producing regions
Ground transportation in primary markets of the UK, Spain and France is an estimated €95 billion market
Source: Company information
23 | XPO Investor Presentation June 2015
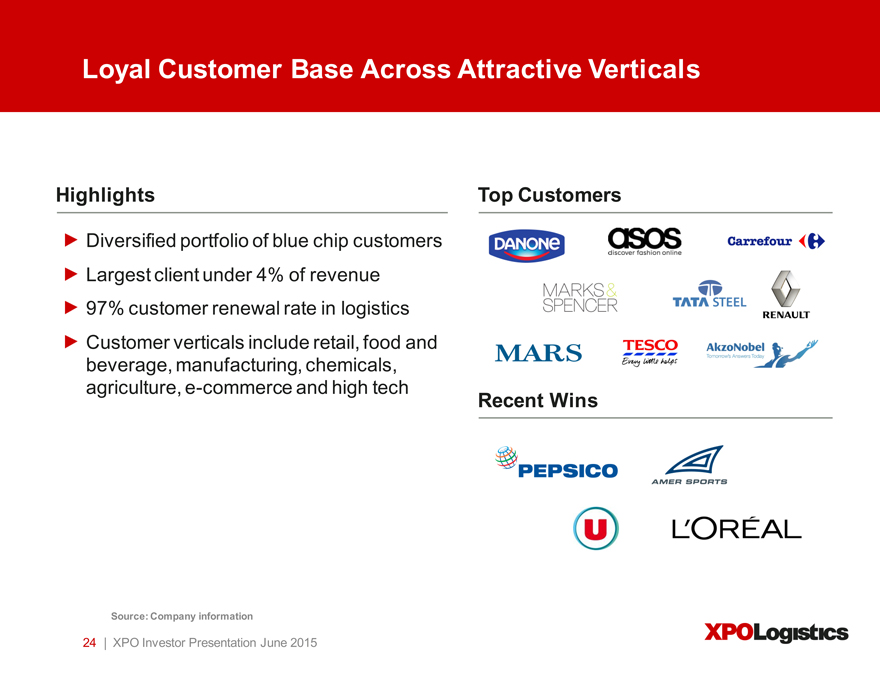
Loyal Customer Base Across Attractive Verticals
Highlights Top Customers
Diversified portfolio of blue chip customers Largest client under 4% of revenue 97% customer renewal rate in logistics Customer verticals include retail, food and beverage, manufacturing, chemicals, agriculture, e-commerce and high tech
Recent Wins
Source: Company information
24 | XPO Investor Presentation June 2015
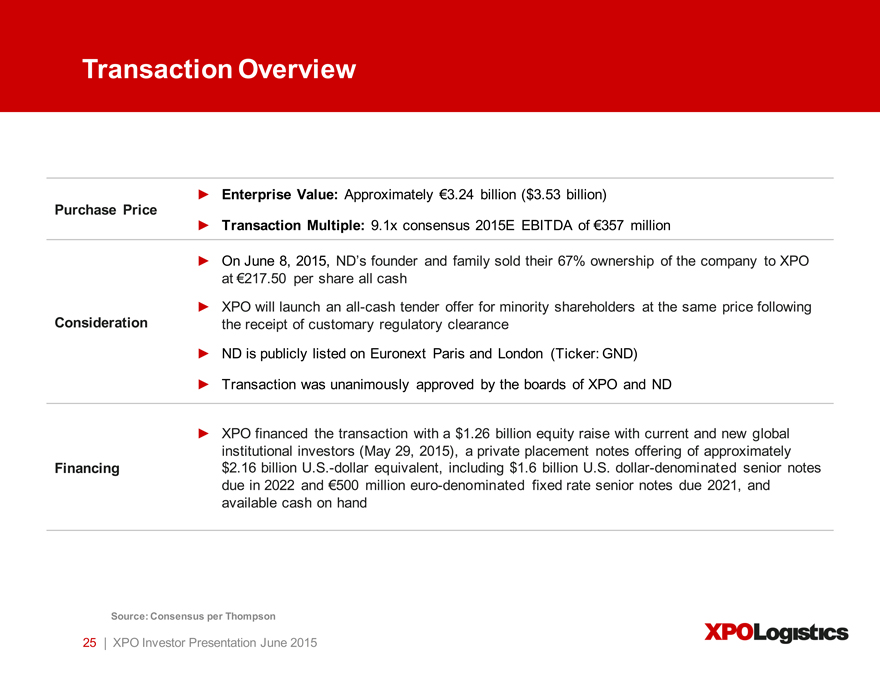
Transaction Overview
Purchase Price Consideration Financing
Enterprise Value: Approximately €3.24 billion ($3.53 billion)
Transaction Multiple: 9.1x consensus 2015E EBITDA of €357 million
On June 8, 2015, ND’s founder and family sold their 67% ownership of the company to XPO at €217.50 per share all cash
XPO will launch an all-cash tender offer for minority shareholders at the same price following the receipt of customary regulatory clearance
ND is publicly listed on Euronext Paris and London (Ticker: GND)
Transaction was unanimously approved by the boards of XPO and ND
XPO financed the transaction with a $1.26 billion equity raise with current and new global institutional investors (May 29, 2015), a private placement notes offering of approximately $2.16 billion U.S.-dollar equivalent, including $1.6 billion U.S. dollar-denominated senior notes due in 2022 and €500 million euro-denominated fixed rate senior notes due 2021, and available cash on hand
Source: Consensus per Thompson
25 | XPO Investor Presentation June 2015
Acquired Bridge Terminal Transport (BTT)
June 1, 2015
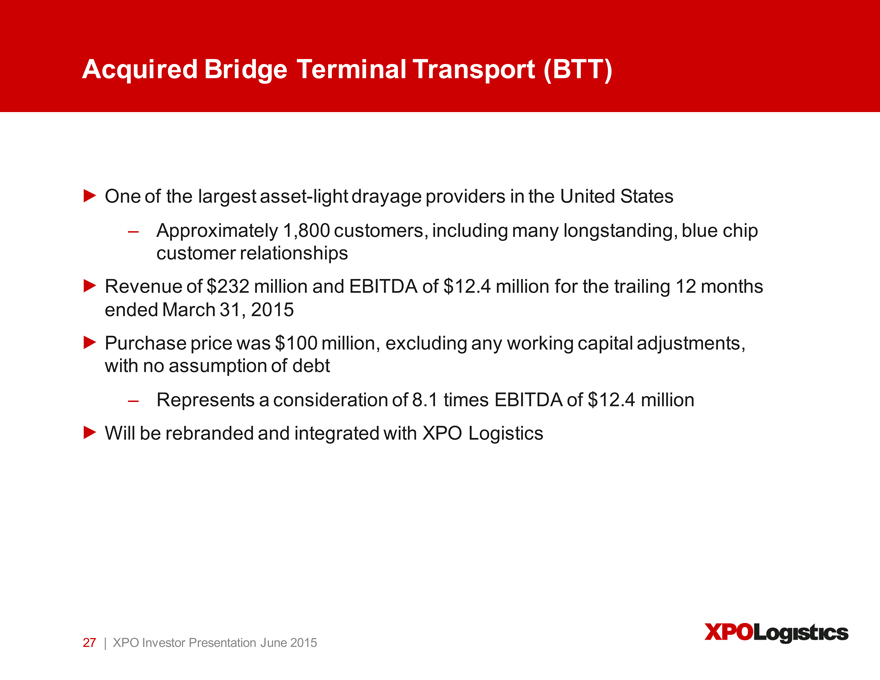
Acquired Bridge Terminal Transport (BTT)
One of the largest asset-light drayage providers in the United States
Approximately 1,800 customers, including many longstanding, blue chip customer relationships Revenue of $232 million and EBITDA of $12.4 million for the trailing 12 months ended March 31, 2015 Purchase price was $100 million, excluding any working capital adjustments, with no assumption of debt
Represents a consideration of 8.1 times EBITDA of $12.4 million Will be rebranded and integrated with XPO Logistics
27 | XPO Investor Presentation June 2015
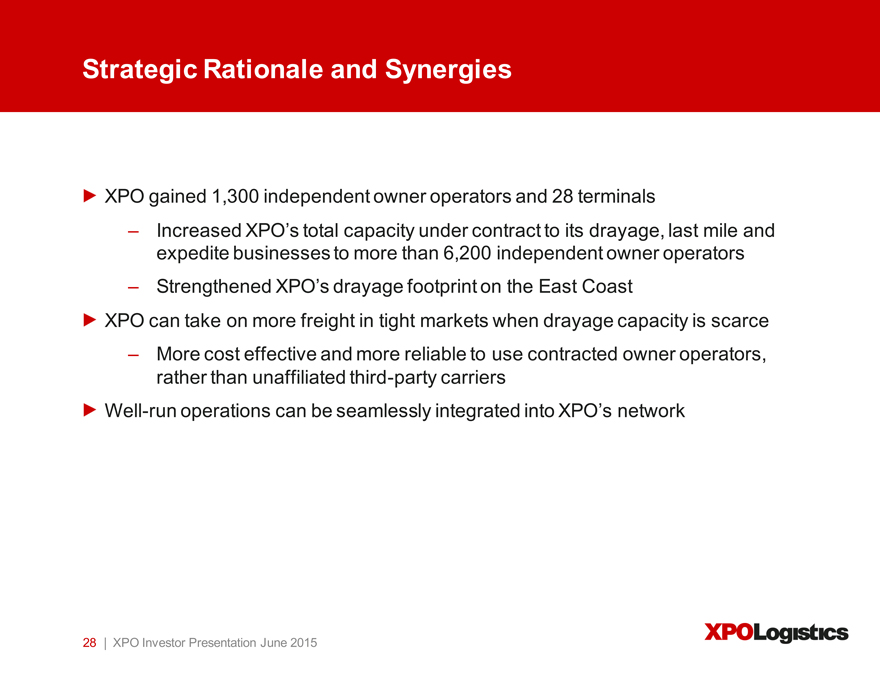
Strategic Rationale and Synergies
XPO gained 1,300 independent owner operators and 28 terminals
Increased XPO’s total capacity under contract to its drayage, last mile and expedite businesses to more than 6,200 independent owner operators
Strengthened XPO’s drayage footprint on the East Coast
XPO can take on more freight in tight markets when drayage capacity is scarce
More cost effective and more reliable to use contracted owner operators, rather than unaffiliated third-party carriers
Well-run operations can be seamlessly integrated into XPO’s network
28 | XPO Investor Presentation June 2015
Clear Path for Significant Value Creation
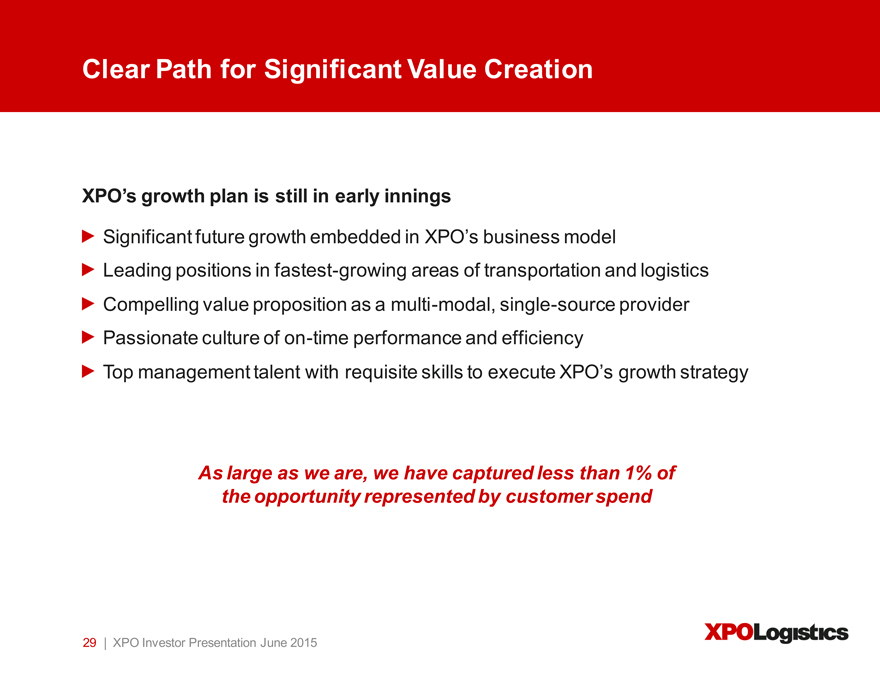
XPO’s growth plan is still in early innings
Significant future growth embedded in XPO’s business model
Leading positions in fastest-growing areas of transportation and logistics Compelling value proposition as a multi-modal, single-source provider Passionate culture of on-time performance and efficiency
Top management talent with requisite skills to execute XPO’s growth strategy
As large as we are, we have captured less than 1% of the opportunity represented by customer spend
29 | XPO Investor Presentation June 2015
Supplemental Material
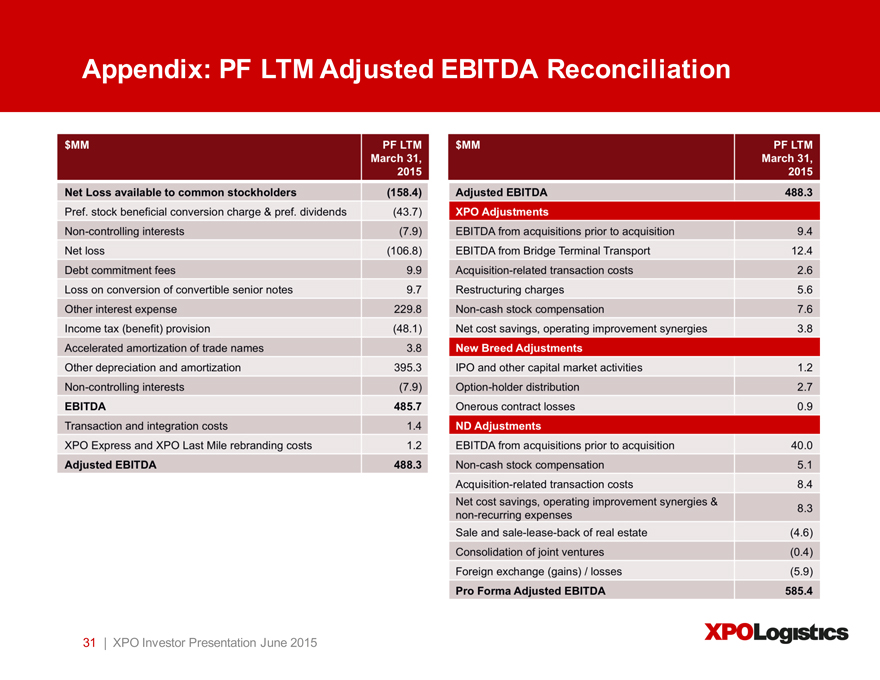
Appendix: PF LTM Adjusted EBITDA Reconciliation
31 | XPO Investor Presentation June 2015
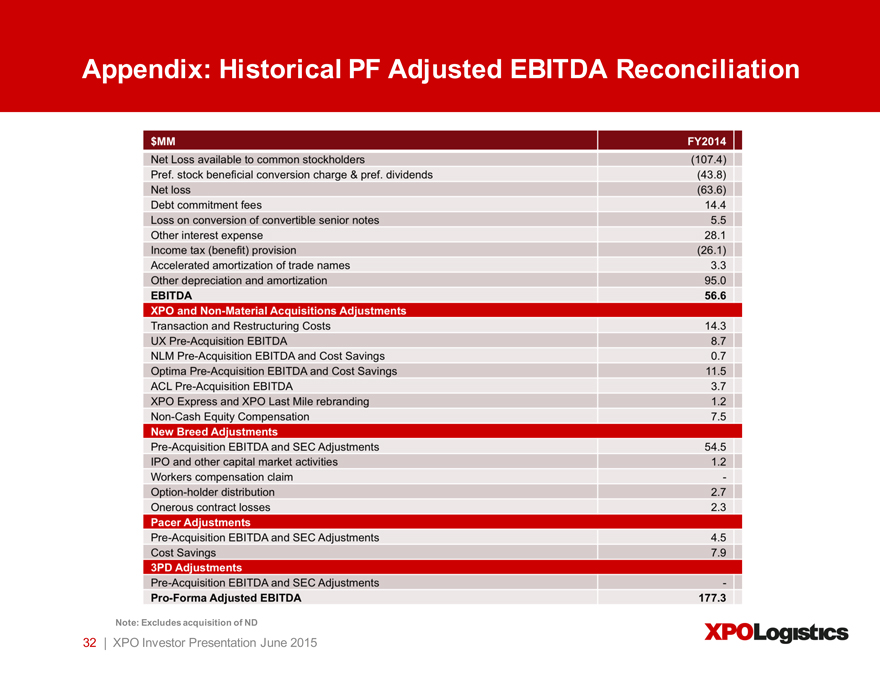
Appendix: Historical PF Adjusted EBITDA Reconciliation
Note: Excludes acquisition of ND
32 | XPO Investor Presentation June 2015
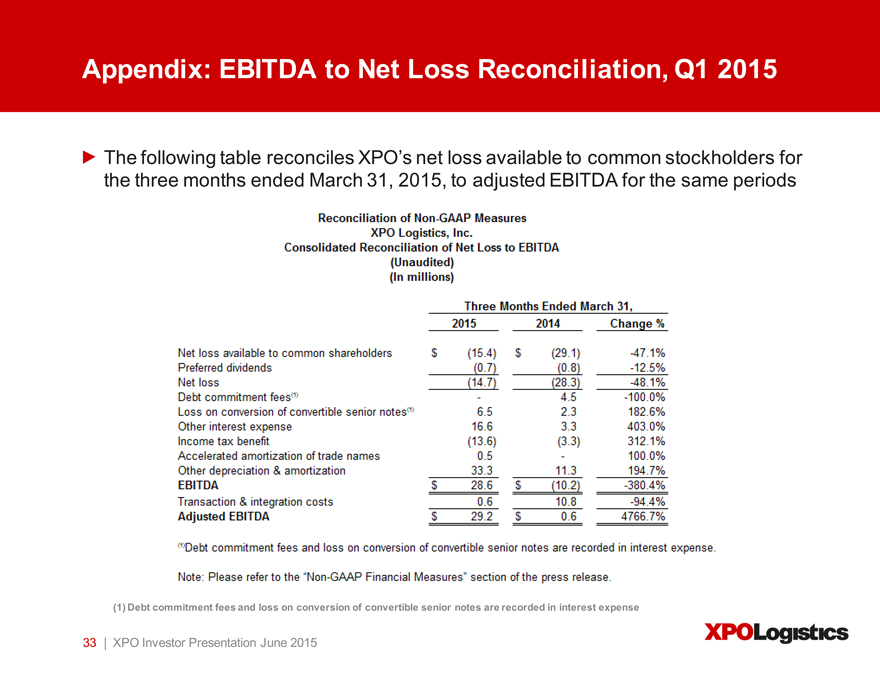
Appendix: EBITDA to Net Loss Reconciliation, Q1 2015
The following table reconciles XPO’s net loss available to common stockholders for the three months ended March 31, 2015, to adjusted EBITDA for the same periods
(1) | | Debt commitment fees and loss on conversion of convertible senior notes are recorded in interest expense |
33 | XPO Investor Presentation June 2015