Exhibit 99.1
XPO Investor Presentation and Transcript
August 2015
Disclaimers
Forward-Looking Statements
This presentation includes forward-looking statements within the meaning of Section 27A of the Securities Act of 1933, as amended, and Section 21E of the Securities Exchange Act of 1934, as amended, including the company’s full year 2019 financial targets. All statements other than statements of historical fact are, or may be deemed to be, forward-looking statements. In some cases, forward-looking statements can be identified by the use of forward-looking terms such as “anticipate,” “estimate,” “believe,” “continue,” “could,” “intend,” “may,” “plan,” “potential,” “predict,” “should,” “will,” “expect,” “objective,” “projection,” “forecast,” “goal,” “guidance,” “outlook,” “effort,” “target” or the negative of these terms or other comparable terms. However, the absence of these words does not mean that the statements are not forward-looking. These forward-looking statements are based on certain assumptions and analyses made by us in light of our experience and our perception of historical trends, current conditions and expected future developments, as well as other factors we believe are appropriate in the circumstances.
These forward-looking statements are subject to known and unknown risks, uncertainties and assumptions that may cause actual results, levels of activity, performance or achievements to be materially different from any future results, levels of activity, performance or achievements expressed or implied by such forward-looking statements. Factors that might cause or contribute to a material difference include those discussed in XPO’s filings with the SEC and the following: economic conditions generally; competition; XPO’s ability to find suitable acquisition candidates and execute its acquisition strategy; the expected impact of the Norbert Dentressangle acquisition and other acquisitions, including the expected impact on XPO’s results of operations; the ability to successfully integrate and realize anticipated synergies and cost savings with respect to Norbert Dentressangle and other acquired companies; XPO’s ability to raise debt and equity capital; XPO’s ability to attract and retain key employees to execute its growth strategy, including retention of Norbert Dentressangle’s and other acquired companies’ management teams; litigation, including litigation related to alleged misclassification of independent contractors; the ability to develop and implement a suitable information technology system; the ability to maintain positive relationships with XPO’s, Norbert Dentressangle’s and other acquired companies’ networks of third-party transportation providers; the ability to retain XPO’s, Norbert Dentressangle’s and other acquired companies’ largest customers; rail and other network changes; weather and other service disruptions; and governmental regulation. All forward-looking statements set forth in this presentation are qualified by these cautionary statements and there can be no assurance that the actual results or developments anticipated will be realized or, even if substantially realized, that they will have the expected consequences to, or effects on, XPO or its businesses or operations. Forward-looking statements set forth in this document speak only as of the date hereof, and XPO undertakes no obligation to update forward-looking statements to reflect subsequent events or circumstances, changes in expectations or the occurrence of unanticipated events except to the extent required by law.
Non-GAAP Financial Measures
This presentation contains certain non-GAAP financial measures as defined under Securities and Exchange Commission (“SEC”) rules, such as adjusted earnings (loss) before interest, taxes, depreciation and amortization (“adjusted EBITDA”) for the quarters ended June 30, 2015 and 2014. As required by SEC rules, we provide reconciliations of these measures to the most directly comparable measures under United States generally accepted accounting principles (“GAAP”), which are set forth in the attachments to this presentation. We believe that adjusted EBITDA improves comparability from period to period by removing the impact of our capital structure (interest expense from our outstanding debt), asset base (depreciation and amortization) and tax consequences, in addition to other specified nonrecurring expense items, including acquisition-related transaction and integration costs; debt commitment fees; costs related to the rebranding to XPO Logistics (including accelerated amortization of trade names); loss on the conversion of the company’s convertible senior notes; impact of non-controlling interests; and gain on sale of intermodal equipment. In addition to its use by management, we believe that EBITDA is a measure widely used by securities analysts, investors and others to evaluate the financial performance of companies in our industry. Other companies may calculate EBITDA differently, and therefore our measure may not be comparable to similarly titled measures of other companies. EBITDA is not a measure of financial performance or liquidity under GAAP and should not be considered in isolation or as an alternative to net income, cash flows from operating activities and other measures determined in accordance with GAAP. Items excluded from EBITDA are significant and necessary components of the operations of our business, and, therefore, EBITDA should only be used as a supplemental measure of our operating performance.
XPO Investor Presentation August 2015
A Global Top Ten Transportation and Logistics Provider
Many robust avenues for growth
One of the world’s largest contract logistics companies
#1 last mile logistics provider for heavy goods in North America #1 manager of expedited shipments in North America #2 global freight brokerage firm by net revenue
#3 provider of intermodal services in North America, and leader in cross-border Mexico Largest owned fleet in Europe Growing presence in global freight forwarding Largest European platform for outsourced e-fulfillment
An increasing number of large customers want to consolidate their 3PL relationships with multi-modal providers
Source: Industry publications and company filings
XPO Investor Presentation August 2015
Highly Efficient and Customer Focused Organization
887 locations globally across 27 countries
54,000 employees serving over 30,000 customers
Access to network of over 700,000 trucks in North America and Europe 129 million square feet (12 million square meters) of logistics facilities Over 45,000 deliveries a day facilitated by XPO businesses in North America Over 2 billion inventory units are tracked by XPO’s contract logistics technology
Operating worldwide under the single brand of XPO Logistics
Source: Company information
XPO Investor Presentation August 2015
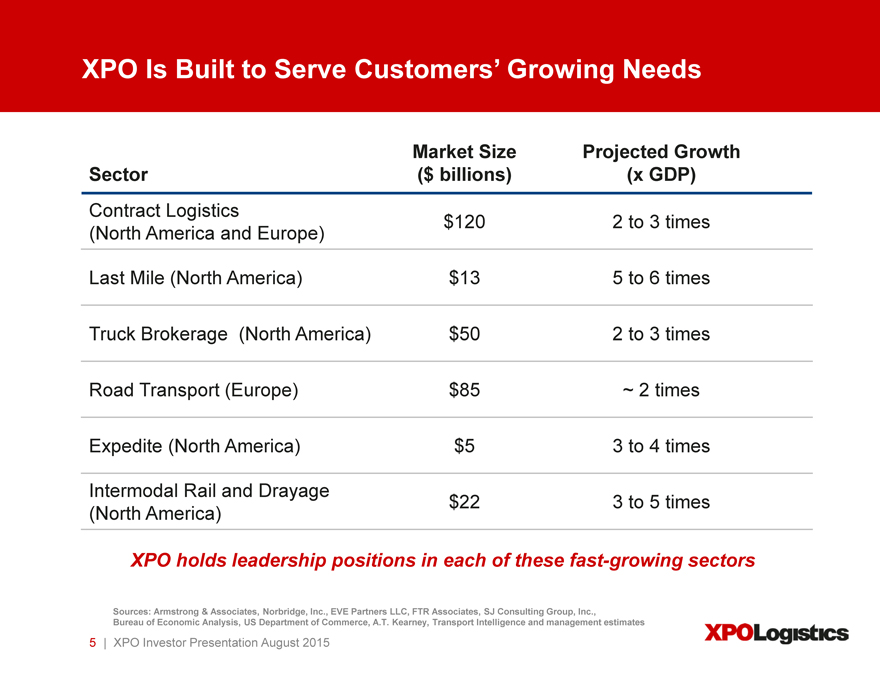
XPO Is Built to Serve Customers’ Growing Needs
Market Size Projected Growth
Sector ($ billions) (x GDP)
Contract Logistics $120 2 to 3 times
(North America and Europe)
Last Mile (North America) $13 5 to 6 times
Truck Brokerage (North America) $50 2 to 3 times
Road Transport (Europe) $85 ~ 2 times
Expedite (North America) $5 3 to 4 times
Intermodal Rail and Drayage $22 3 to 5 times
(North America)
XPO holds leadership positions in each of these fast-growing sectors
Sources: Armstrong & Associates, Norbridge, Inc., EVE Partners LLC, FTR Associates, SJ Consulting Group, Inc.,
Bureau of Economic Analysis, US Department of Commerce, A.T. Kearney, Transport Intelligence and management estimates
| XPO Investor Presentation August 2015
Contract Logistics: Long-term, Sticky Relationships
Significant barriers to entry Largely non-commoditized High value-add component
In Europe: Full range of retail logistics, and specialized services for cold chain, chemicals and e-commerce
In North America: Deep relationships in technology, wireless, e-commerce, aerospace, medical equipment, and select areas of manufacturing Low cyclicality
Average contractual agreement is five years
Average contract renewal rate of over 97% Source: Company information
XPO Investor Presentation August 2015
Major Player in E-Commerce
Leading e-commerce capabilities in high-growth e-fulfillment, reverse logistics and last mile
Worldwide e-commerce is projected to grow at a rate of 13% to 21% through at least 2018 North American market leader in last mile for heavy goods, with approximately 5% market share in an estimated $13 billion North American market
Untapped last mile opportunity in Europe
European market leader with approximately 5% market share in an estimated ¬5 billion e-fulfillment market
242 million revenue in e-commerce logistics in 2014
31% year-over-year organic growth in 2014
Sources: Company and industry information
XPO Investor Presentation August 2015
Blue Chip Customers
Any trademarks or logos used in this presentation are the property of their respective owners
XPO Investor Presentation August 2015
Blue Chip Customers
Any trademarks or logos used in this presentation are the property of their respective owners
XPO Investor Presentation August 2015
9
High Productivity through Technology
IT team of about 1,000 professionals
Over 200 IT projects launching in 2015
Proprietary technology delivers world-class service
Sophisticated contract logistics solutions for complex supply chain requirements Rigorous inventory management technology Freight Optimizer for cutting-edge pricing and load-covering Real-time customer experience management solutions Online bidding software Powerful suite of Rail Optimizer tools
Global IT budget of $225 million this year
XPO Investor Presentation August 2015
10
Disciplined Selection Process from M&A Pipeline
Acquisition prospects must meet strategic criteria
Provide services our customers highly value Highly scalable
Technology-oriented, with a willingness to embrace additional technology Operations that can be tightly integrated into XPO’s network Experienced management and enthusiastic employees Focus on world-class customer service that mirrors XPO’s culture
Two-pronged pipeline of complementary prospects in both North America and Europe
XPO Investor Presentation August 2015
11
Rock Solid Financial Position
$1.2 billion in cash, in addition to an undrawn $415 million asset-backed loan Positive and accelerating free cash flow Low maintenance capex, with total net capex of about 2% of revenue Global access to the highest caliber institutional investors Raised total of $2 billion of equity in two private offerings
September 2014: three leading global investors endorsed XPO’s growth strategy May 2015: same three investors expanded their positions, together with new institutional investors
XPO Investor Presentation August 2015
12
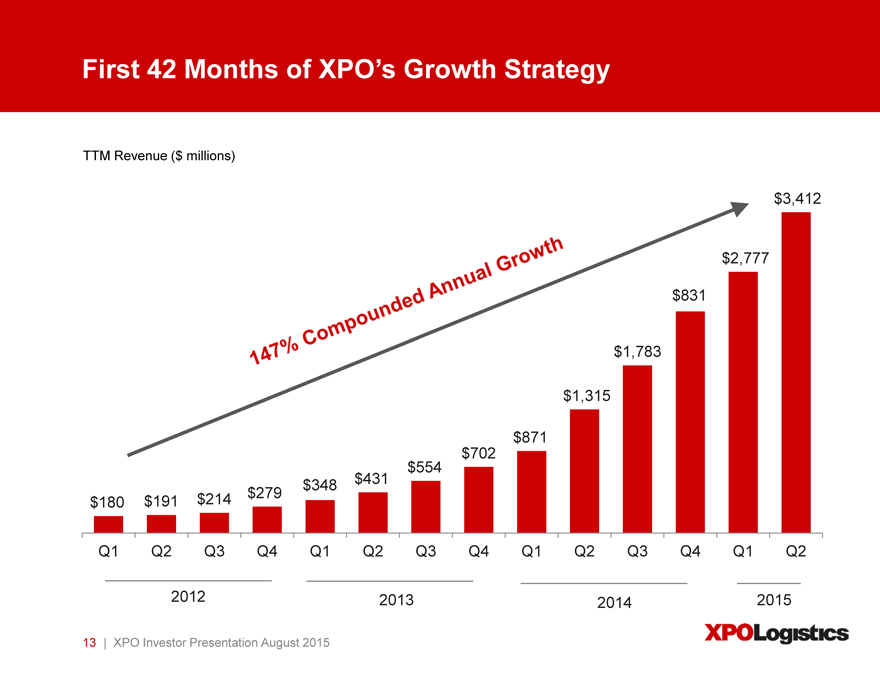
First 42 Months of XPO’s Growth Strategy
TTM Revenue ($ millions)
$3,412
$2,777
$831
$1,783
$1,315
$871 $554 $702 $279 $348 $431 $180 $191 $214
Q1 Q2 Q3 Q4 Q1 Q2 Q3 Q4 Q1 Q2 Q3 Q4 Q1 Q2
2012 2013 2014 2015
XPO Investor Presentation August 2015
13
CEO Bradley S. Jacobs
Prior to XPO, founded and led four highly successful companies, including two world-class publicly-traded corporations
United Rentals: Built world’s largest equipment rental company
United Waste: Created 5th largest solid waste business in North America Hamilton Resources: Grew global oil trading company to ~$1 billion Amerex Oil Associates: Built one of world’s largest oil brokerage firms
United Rentals stock outperformed S&P 500 by 2.2x from 1997 to 2007 United Waste stock outperformed S&P 500 by 5.6x from 1992 to 1997
XPO Investor Presentation August 2015
14
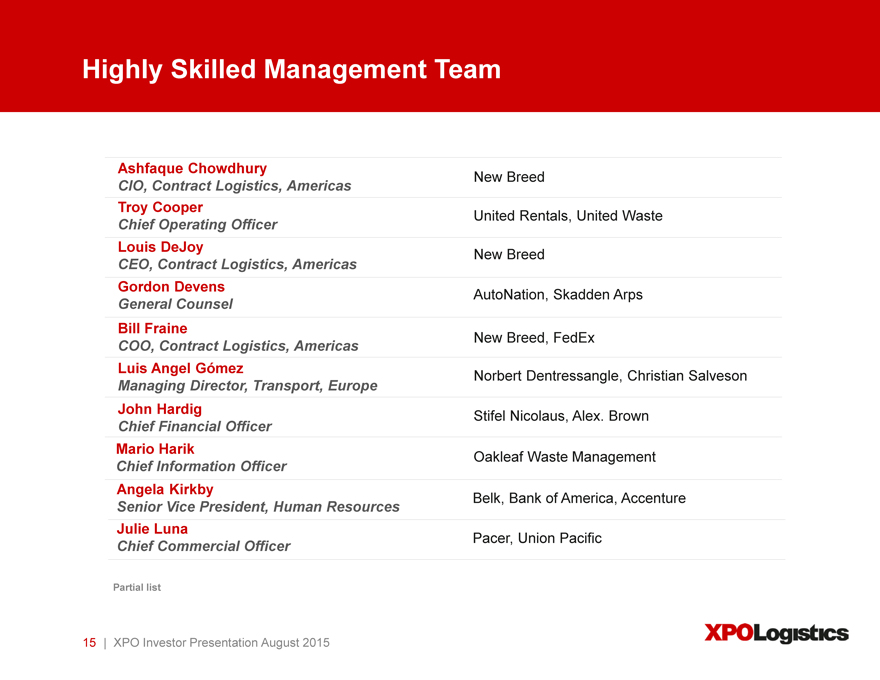
Highly Skilled Management Team
Ashfaque Chowdhury
CIO, Contract Logistics, Americas New Breed
Troy Cooper
Chief Operating Officer United Rentals, United Waste
Louis DeJoy New Breed
CEO, Contract Logistics, Americas
Gordon Devens AutoNation, Skadden Arps
General Counsel
Bill Fraine
COO, Contract Logistics, Americas New Breed, FedEx
Luis Angel Gómez Norbert Dentressangle, Christian Salveson
Managing Director, Transport, Europe
John Hardig Stifel Nicolaus, Alex. Brown
Chief Financial Officer
Mario Harik Oakleaf Waste Management
Chief Information Officer
Angela Kirkby
Senior Vice President, Human Resources Belk, Bank of America, Accenture
Julie Luna
Chief Commercial Officer Pacer, Union Pacific
Partial list
XPO Investor Presentation August 2015
15
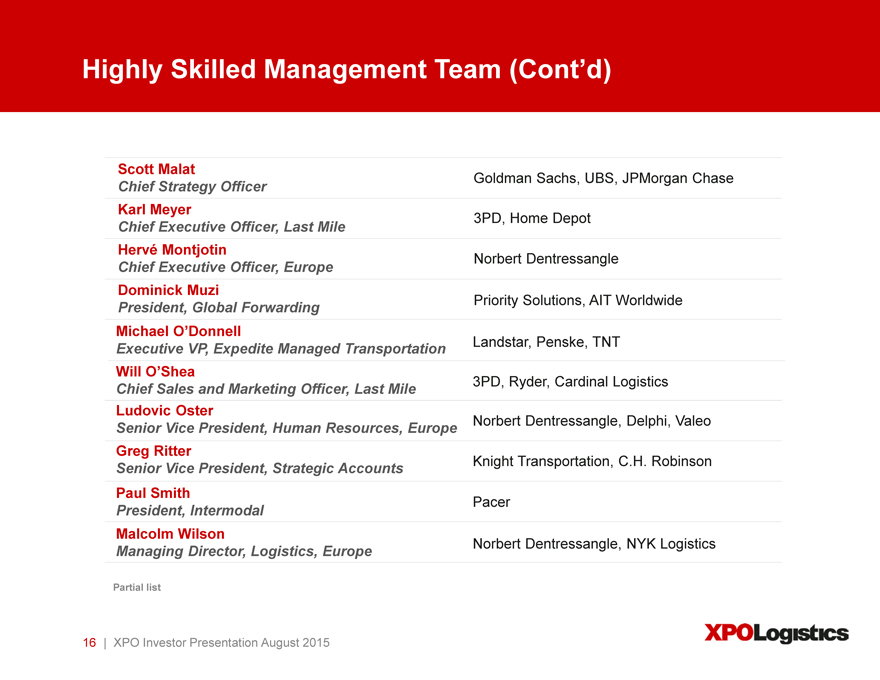
Highly Skilled Management Team (Cont’d)
Scott Malat
Chief Strategy Officer Goldman Sachs, UBS, JPMorgan Chase
Karl Meyer
Chief Executive Officer, Last Mile 3PD, Home Depot
Hervé Montjotin
Chief Executive Officer, Europe Norbert Dentressangle
Dominick Muzi
President, Global Forwarding Priority Solutions, AIT Worldwide
Michael O’Donnell
Executive VP, Expedite Managed Transportation Landstar, Penske, TNT
Will O’Shea
Chief Sales and Marketing Officer, Last Mile 3PD, Ryder, Cardinal Logistics
Ludovic Oster
Senior Vice President, Human Resources, Europe Norbert Dentressangle, Delphi, Valeo
Greg Ritter
Senior Vice President, Strategic Accounts Knight Transportation, C.H. Robinson
Paul Smith
President, Intermodal Pacer
Malcolm Wilson
Managing Director, Logistics, Europe Norbert Dentressangle, NYK Logistics
Partial list
XPO Investor Presentation August 2015
16
Second Quarter 2015 Financial Results
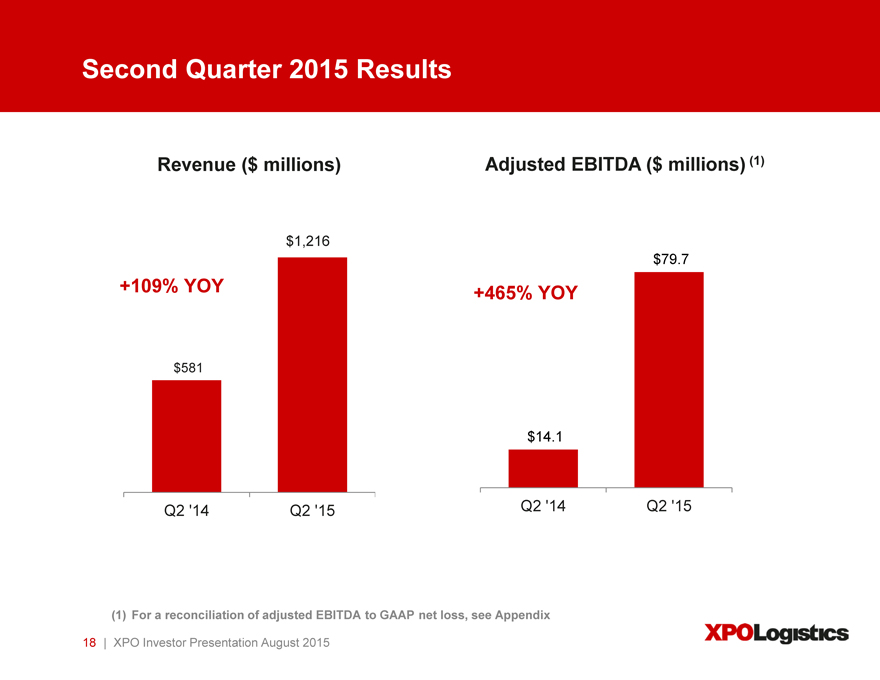
Second Quarter 2015 Results
Revenue ($ millions) Adjusted EBITDA ($ millions) (1)
$1,216 $79.7
+109% YOY
+465% YOY
$581
$14.1
Q2 ‘14 Q2 ‘15 Q2 ‘14 Q2 ‘15
(1) | | For a reconciliation of adjusted EBITDA to GAAP net loss, see Appendix |
XPO Investor Presentation August 2015
18
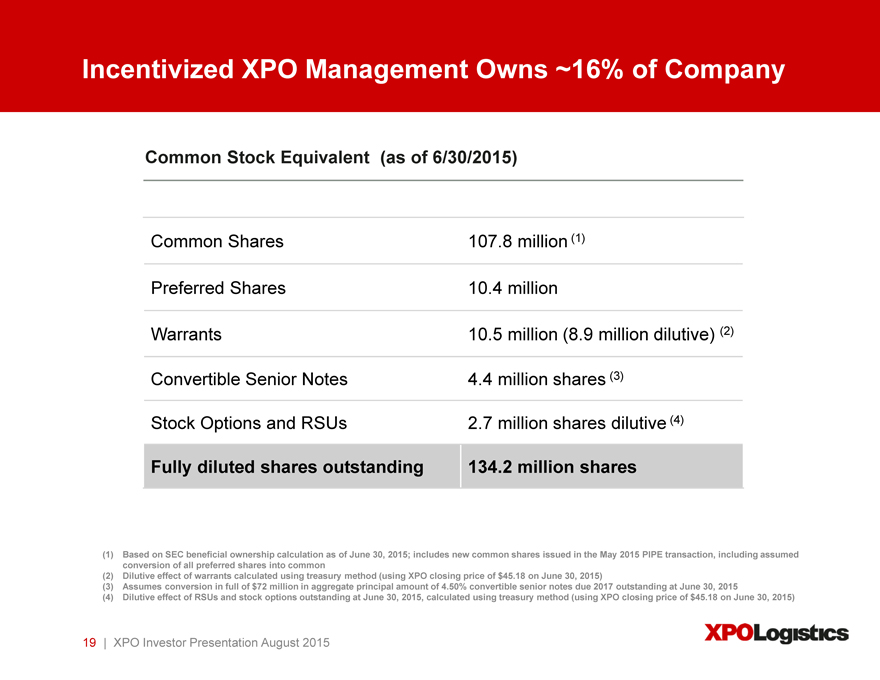
Incentivized XPO Management Owns ~16% of Company
Common Stock Equivalent (as of 6/30/2015)
Common Shares 107.8 million (1)
Preferred Shares 10.4 million
Warrants 10.5 million (8.9 million dilutive) (2)
Convertible Senior Notes 4.4 million shares (3)
Stock Options and RSUs 2.7 million shares dilutive (4)
Fully diluted shares outstanding 134.2 million shares
(1) Based on SEC beneficial ownership calculation as of June 30, 2015; includes new common shares issued in the May 2015 PIPE transaction, including assumed conversion of all preferred shares into common (2) Dilutive effect of warrants calculated using treasury method (using XPO closing price of $45.18 on June 30, 2015) (3) Assumes conversion in full of $72 million in aggregate principal amount of 4.50% convertible senior notes due 2017 outstanding at June 30, 2015 (4) Dilutive effect of RSUs and stock options outstanding at June 30, 2015, calculated using treasury method (using XPO closing price of $45.18 on June 30, 2015)
XPO Investor Presentation August 2015
19
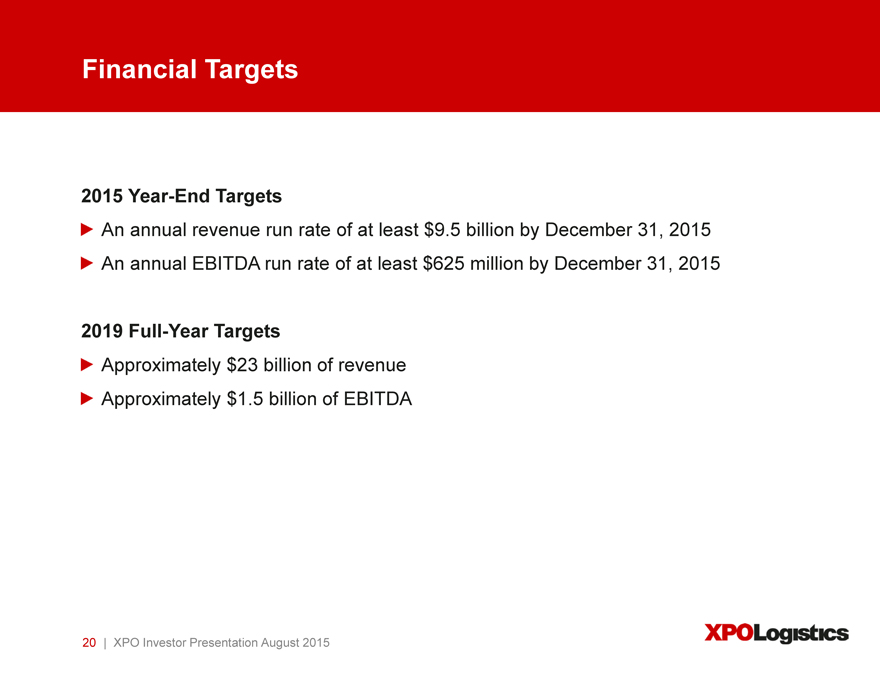
Financial Targets
2015 Year-End Targets
An annual revenue run rate of at least $9.5 billion by December 31, 2015 An annual EBITDA run rate of at least $625 million by December 31, 2015
2019 Full-Year Targets
Approximately $23 billion of revenue Approximately $1.5 billion of EBITDA
XPO Investor Presentation August 2015
20
XPO’s Growth Plan Is Still in Early Innings
Leading positions in fastest-growing areas of transportation and logistics Compelling value proposition as a multi-modal, single-source provider of end-to-end supply change solutions Significant potential to grow European platform High-growth positions in contract logistics and e-commerce Additional strategic acquisitions Rock solid financial position Culture driven by top talent for customer service, transportation and logistics operations, P&L performance and M&A integration
As large as we are, we have captured less than 1% of the opportunity represented by customer spend
XPO Investor Presentation August 2015
21
Acquired Norbert Dentressangle(ND)
June 8, 2015
Expansive Platform for Growth
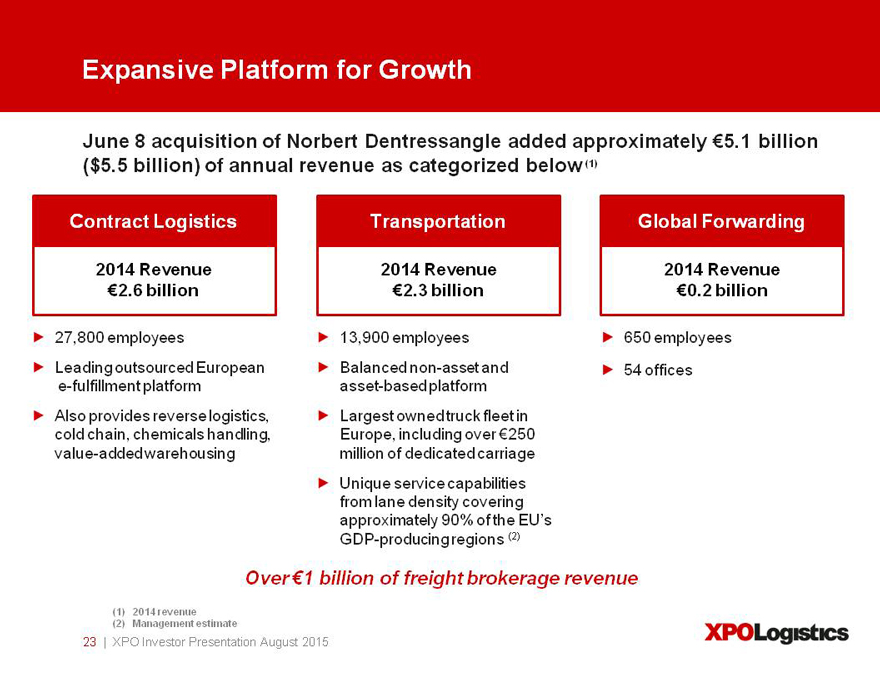
June 8 acquisition of Norbert Dentressangle added approximately €5.1 billion
($5.5 billion) of annual revenue as categorized below (1)
Contract Logistics Transportation Global Forwarding
2014 Revenue 2014 Revenue 2014 Revenue €2.6 billion €2.3 billion €0.2 billion
27,800 employees
Leading outsourced European e-fulfillment platform Also provides reverse logistics, cold chain, chemicals handling, value-added warehousing
13,900 employees Balanced non-asset and asset-based platform Largest owned truck fleet in Europe, including over ¬250 million of dedicated carriage Unique service capabilities from lane density covering approximately 90% of the EU’s GDP-producing regions (2)
employees
offices
Over €1 billion of freight brokerage revenue
XPO Investor Presentation August 2015
23
Strategic Rationale for Acquisition
ND’s capabilities closely mirrored XPO’s North American offering
XPO gained global scale in three of its core services: contract logistics, freight brokerage and global freight forwarding Companies shared an asset-light model with low capital intensity: total net capex of about 2% of revenue Combined blue chip customer base includes many of the world’s largest multinational companies Timing capitalized on start of eurozone economic rebound and strong US dollar Opened the door to significant future acquisition opportunities for XPO in highly fragmented eurozone
XPO Investor Presentation August 2015
24
Significant Synergy Potential
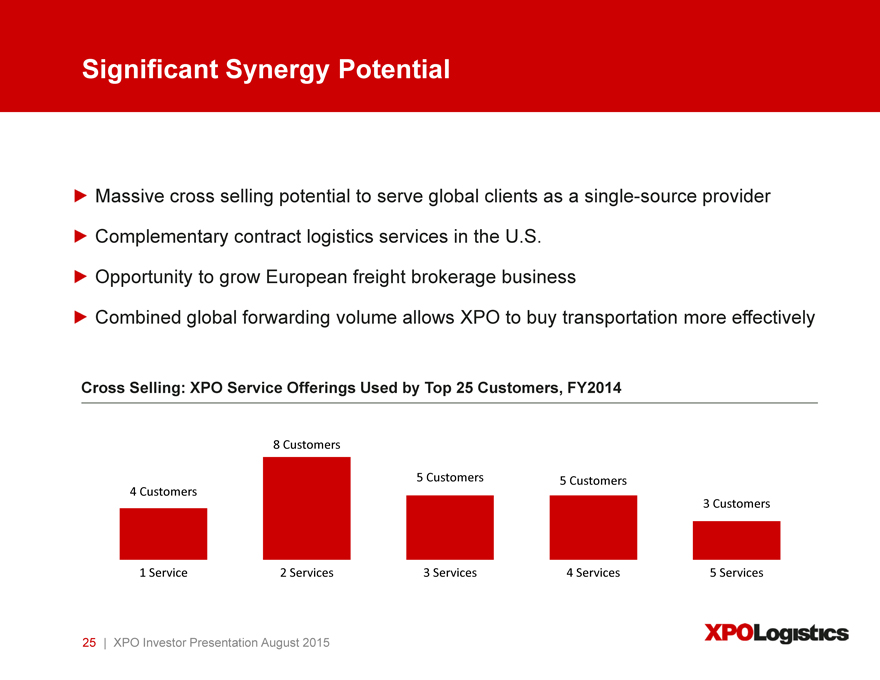
Massive cross selling potential to serve global clients as a single-source provider
Complementary contract logistics services in the U.S.
Opportunity to grow European freight brokerage business
Combined global forwarding volume allows XPO to buy transportation more effectively
Cross Selling: XPO Service Offerings Used by Top 25 Customers, FY2014
1 | | Service 2 Services 3 Services 4 Services 5 Services |
XPO Investor Presentation August 2015
25
XPO Gained Leadership in European E-Fulfillment
Favorable historical performance and future growth opportunities
242 million revenue in e-commerce logistics in 2014
31% organic growth compared to 2013
Business focused in the UK, Spain and France
Strong growth potential with approximately 5% market share in estimated 5 billion European e-fulfillment market
Expected to increase at 9% to 10% CAGR over the next several years Increasingly complex supply chains and customer requirements demand scale, which XPO has and few others can match
Serves both B2B and B2C customers
Leading capabilities in high-growth reverse logistics
Source: Company information
XPO Investor Presentation August 2015
26
Preeminent European Transportation Network
36-year history as global partner to blue chip customers Combines non-asset, asset-light and asset-based operations
Rapid growth in freight brokerage, asset-light palletized service and dedicated carriage Unique service capabilities from lane density covering approximately 90% of the EU’s GDP-producing regions Ground transportation in primary markets of the UK, Spain and France is an estimated ¬95 billion market
Source: Company information
XPO Investor Presentation August 2015
27
Combination is a Growth Accelerator
Deploy cutting-edge technology to turbocharge growth in freight brokerage
Pricing and truck matching algorithms to accelerate growth and margins
Combined annual technology spend is among the highest in the industry Combine leading businesses in fast growth e-commerce
Top outsourced e-fulfillment provider in Europe, handling over 200 million units per year
Leading capabilities in reverse logistics
Expand leadership position in last mile logistics for heavy goods to Europe
Sharing best practices and capabilities across new global platform
XPO Investor Presentation August 2015
28
Loyal European Customer Base in Attractive Verticals
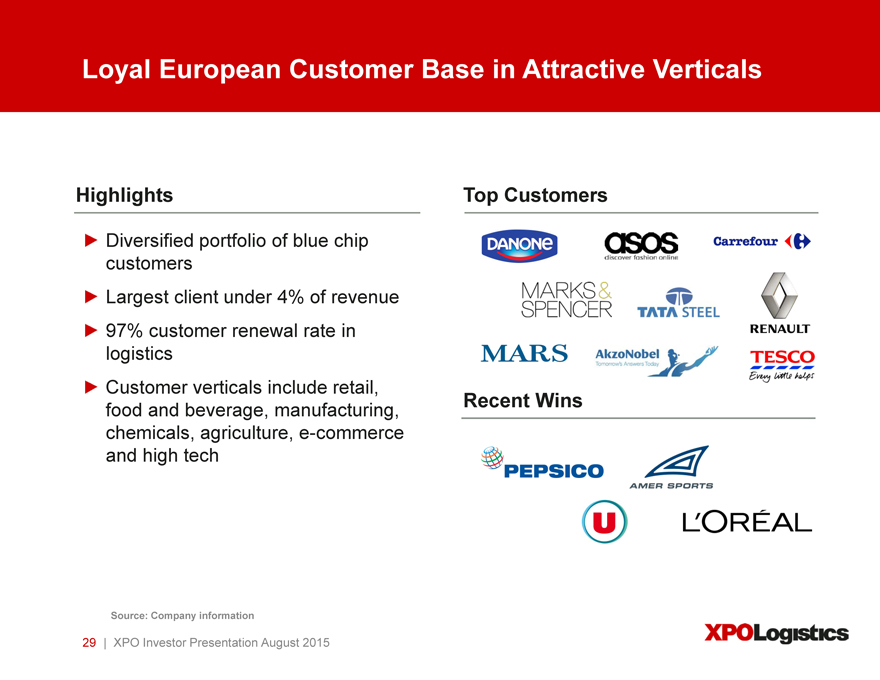
Highlights Top Customers
Diversified portfolio of blue chip customers Largest client under 4% of revenue 97% customer renewal rate in logistics Customer verticals include retail, food and beverage, manufacturing, chemicals, agriculture, e-commerce and high tech
Source: Company information
XPO Investor Presentation August 2015
29
Purchase Price
Consideration
Financing Sources
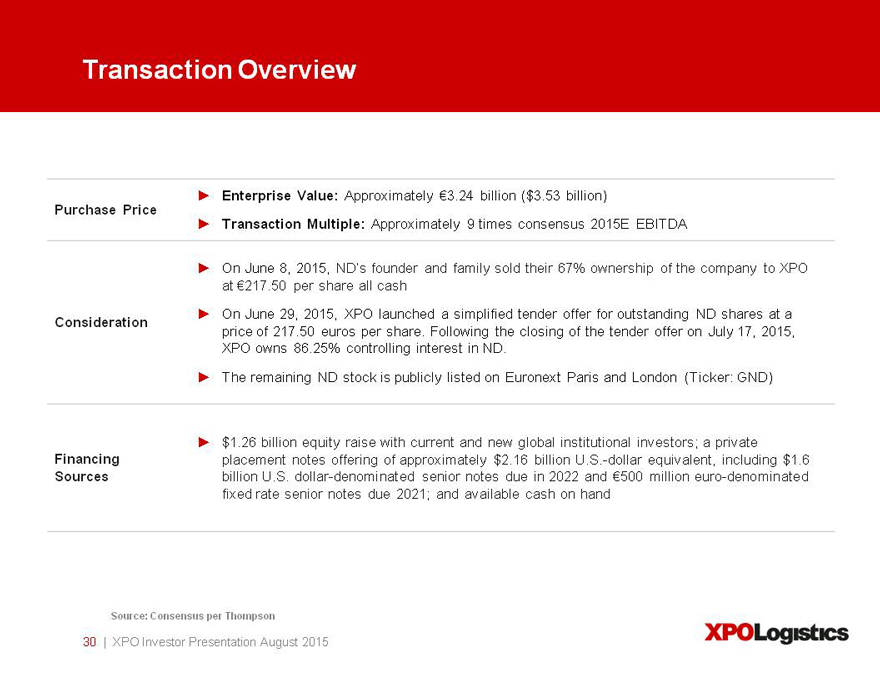
Enterprise Value: Approximately ¬3.24 billion ($3.53 billion)
Transaction Multiple: Approximately 9 times consensus 2015E EBITDA
On June 8, 2015, ND’s founder and family sold their 67% ownership of the company to XPO at ¬217.50 per share all cash On June 29, 2015, XPO launched a simplified tender offer for outstanding ND shares at a price of 217.50 euros per share. Following the closing of the tender offer on July 17, 2015, XPO owns 86.25% controlling interest in ND.
The remaining ND stock is publicly listed on Euronext Paris and London (Ticker: GND)
$1.26 billion equity raise with current and new global institutional investors; a private placement notes offering of approximately $2.16 billion U.S.-dollar equivalent, including $1.6 billion U.S. dollar-denominated senior notes due in 2022 and ¬500 million euro-denominated fixed rate senior notes due 2021; and available cash on hand
Source: Consensus per Thompson
XPO Investor Presentation August 2015
30
Acquired Bridge Terminal Transport (BTT)
June 1, 2015
Acquired Bridge Terminal Transport (BTT)
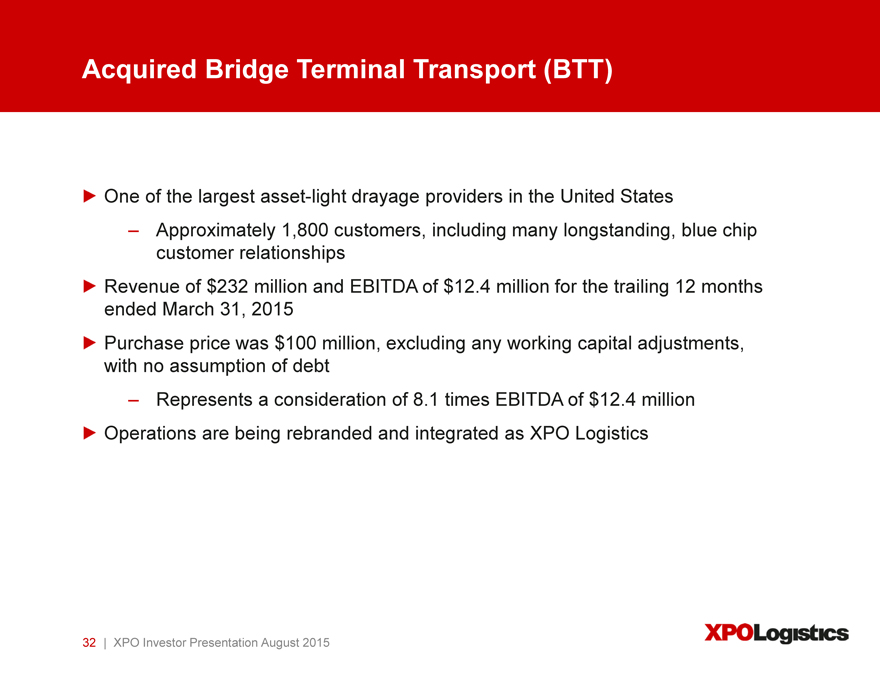
One of the largest asset-light drayage providers in the United States
Approximately 1,800 customers, including many longstanding, blue chip customer relationships Revenue of $232 million and EBITDA of $12.4 million for the trailing 12 months ended March 31, 2015 Purchase price was $100 million, excluding any working capital adjustments, with no assumption of debt
Represents a consideration of 8.1 times EBITDA of $12.4 million Operations are being rebranded and integrated as XPO Logistics
XPO Investor Presentation August 2015
32
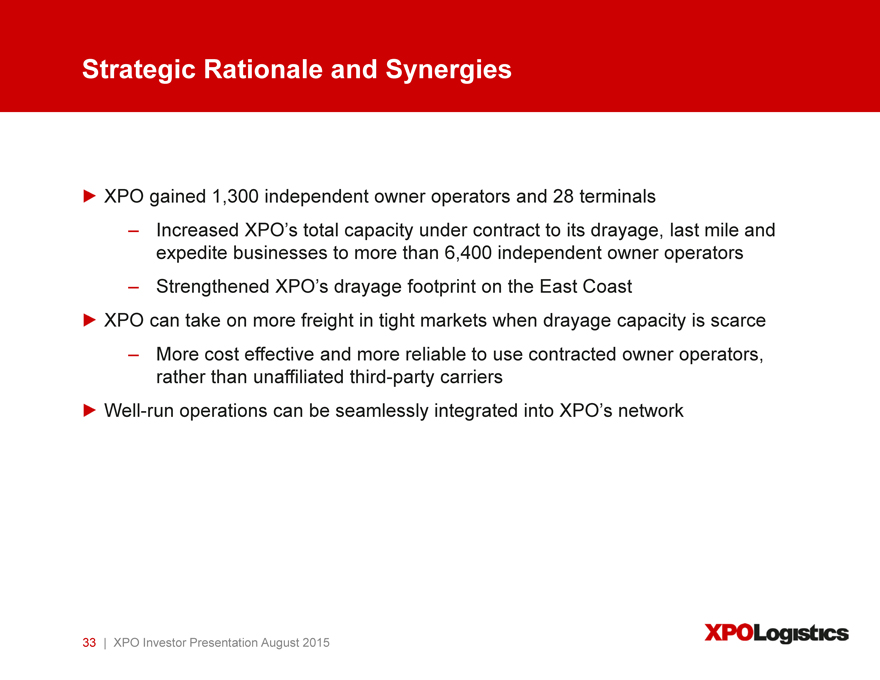
Strategic Rationale and Synergies
XPO gained 1,300 independent owner operators and 28 terminals
Increased XPO’s total capacity under contract to its drayage, last mile and expedite businesses to more than 6,400 independent owner operators
Strengthened XPO’s drayage footprint on the East Coast
XPO can take on more freight in tight markets when drayage capacity is scarce
More cost effective and more reliable to use contracted owner operators, rather than unaffiliated third-party carriers Well-run operations can be seamlessly integrated into XPO’s network
XPO Investor Presentation August 2015
33
Supplemental Materials
XPO Business Glossary
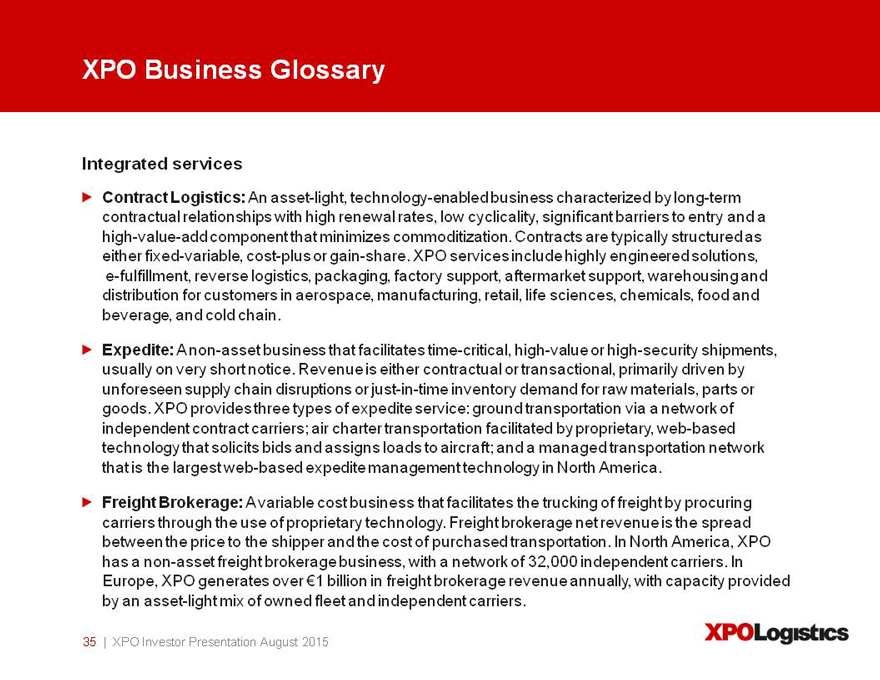
Integrated services
Contract Logistics: An asset-light, technology-enabled business characterized by long-term contractual relationships with high renewal rates, low cyclicality, significant barriers to entry and a high-value-add component that minimizes commoditization. Contracts are typically structured as either fixed-variable, cost-plus or gain-share. XPO services include highly engineered solutions, e-fulfillment, reverse logistics, packaging, factory support, aftermarket support, warehousing and distribution for customers in aerospace, manufacturing, retail, life sciences, chemicals, food and beverage, and cold chain.
Expedite: A non-asset business that facilitates time-critical, high-value or high-security shipments, usually on very short notice. Revenue is either contractual or transactional, primarily driven by unforeseen supply chain disruptions or just-in-time inventory demand for raw materials, parts or goods. XPO provides three types of expedite service: ground transportation via a network of independent contract carriers; air charter transportation facilitated by proprietary, web-based technology that solicits bids and assigns loads to aircraft; and a managed transportation network that is the largest web-based expedite management technology in North America.
Freight Brokerage: A variable cost business that facilitates the trucking of freight by procuring carriers through the use of proprietary technology. Freight brokerage net revenue is the spread between the price to the shipper and the cost of purchased transportation. In North America, XPO has a non-asset freight brokerage business, with a network of 32,000 independent carriers. In Europe, XPO generates over ¬1 billion in freight brokerage revenue annually, with capacity provided by an asset-light mix of owned fleet and independent carriers.
XPO Investor Presentation August 2015
35
XPO Business Glossary
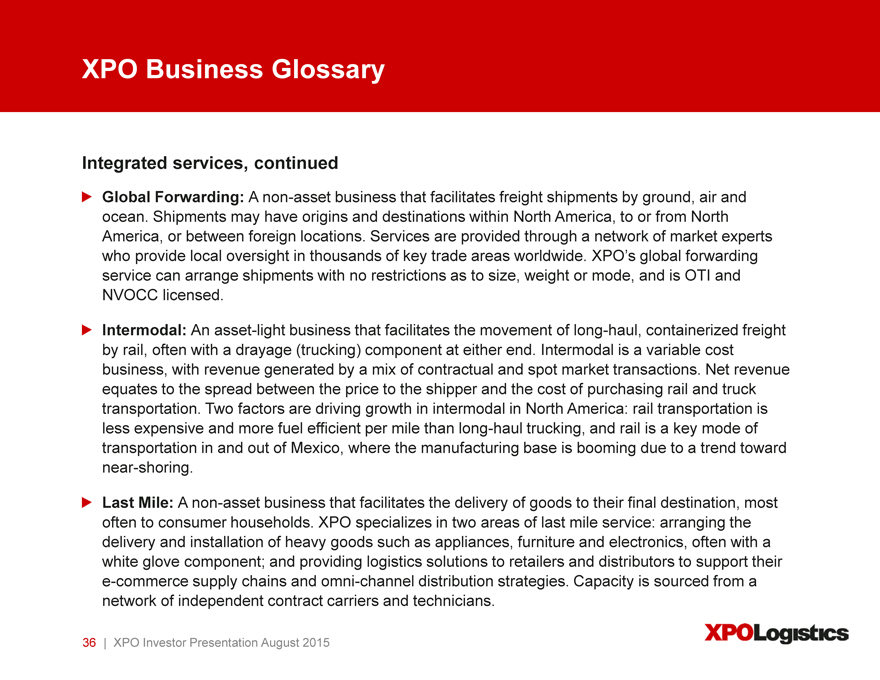
Integrated services, continued
Global Forwarding: A non-asset business that facilitates freight shipments by ground, air and ocean. Shipments may have origins and destinations within North America, to or from North America, or between foreign locations. Services are provided through a network of market experts who provide local oversight in thousands of key trade areas worldwide. XPO’s global forwarding service can arrange shipments with no restrictions as to size, weight or mode, and is OTI and NVOCC licensed.
Intermodal: An asset-light business that facilitates the movement of long-haul, containerized freight by rail, often with a drayage (trucking) component at either end. Intermodal is a variable cost business, with revenue generated by a mix of contractual and spot market transactions. Net revenue equates to the spread between the price to the shipper and the cost of purchasing rail and truck transportation. Two factors are driving growth in intermodal in North America: rail transportation is less expensive and more fuel efficient per mile than long-haul trucking, and rail is a key mode of transportation in and out of Mexico, where the manufacturing base is booming due to a trend toward near-shoring.
Last Mile: A non-asset business that facilitates the delivery of goods to their final destination, most often to consumer households. XPO specializes in two areas of last mile service: arranging the delivery and installation of heavy goods such as appliances, furniture and electronics, often with a white glove component; and providing logistics solutions to retailers and distributors to support their e-commerce supply chains and omni-channel distribution strategies. Capacity is sourced from a network of independent contract carriers and technicians.
XPO Investor Presentation August 2015
36
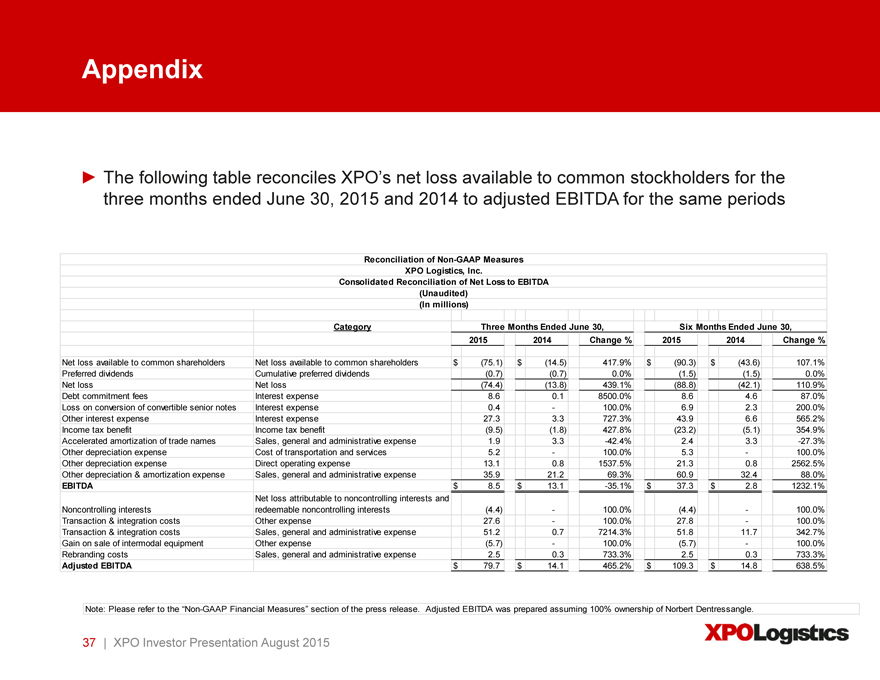
Appendix
Reconciliation of Non-GAAP Measures
XPO Logistics, Inc.
Consolidated Reconciliation of Net Loss to EBITDA
(Unaudited)
(In millions)
Category Three Months Ended June 30, Six Months Ended June 30,
2015 2014 Change % 2015 2014 Change %
Net loss available to common shareholders Net loss available to common shareholders $ (75.1) $ (14.5) 417.9% $ (90.3) $ (43.6) 107.1%
Preferred dividends Cumulative preferred dividends (0.7) (0.7) 0.0% (1.5) (1.5) 0.0%
Net loss Net loss (74.4) (13.8) 439.1% (88.8) (42.1) 110.9%
Debt commitment fees Interest expense 8.6 0.1 8500.0% 8.6 4.6 87.0%
Loss on conversion of convertible senior notes Interest expense 0.4 — 100.0% 6.9 2.3 200.0%
Other interest expense Interest expense 27.3 3.3 727.3% 43.9 6.6 565.2%
Income tax benefit Income tax benefit (9.5) (1.8) 427.8% (23.2) (5.1) 354.9%
Accelerated amortization of trade names Sales, general and administrative expense 1.9 3.3 -42.4% 2.4 3.3 -27.3%
Other depreciation expense Cost of transportation and services 5.2 — 100.0% 5.3 — 100.0%
Other depreciation expense Direct operating expense 13.1 0.8 1537.5% 21.3 0.8 2562.5%
Other depreciation & amortization expense Sales, general and administrative expense 35.9 21.2 69.3% 60.9 32.4 88.0%
EBITDA $ 8.5 $ 13.1 -35.1% $ 37.3 $ 2.8 1232.1%
Net loss attributable to noncontrolling interests and
Noncontrolling interests redeemable noncontrolling interests (4.4) — 100.0% (4.4) — 100.0%
Transaction & integration costs Other expense 27.6 — 100.0% 27.8 — 100.0%
Transaction & integration costs Sales, general and administrative expense 51.2 0.7 7214.3% 51.8 11.7 342.7%
Gain on sale of intermodal equipment Other expense (5.7) — 100.0% (5.7) — 100.0%
Rebranding costs Sales, general and administrative expense 2.5 0.3 733.3% 2.5 0.3 733.3%
Adjusted EBITDA $ 79.7 $ 14.1 465.2% $ 109.3 $ 14.8 638.5%
Note: Please refer to the “Non-GAAP Financial Measures” section of the press release. Adjusted EBITDA was prepared assuming 100% ownership of Norbert Dentressangle.
XPO Investor Presentation August 2015
37