Exhibit 99.1
XPO Investor Presentation and Transcript
August 2016
Disclaimers
Non-GAAP Financial Measures
This document contains certain non-GAAP financial measures as defined under rules of the Securities and Exchange Commission (“SEC”), including adjusted net income (loss) attributable to common shareholders for the three- and six-month periods ended June 30, 2016; adjusted earnings before interest, taxes, depreciation and amortization (“EBITDA”) for the three- and six-month periods ended June 30, 2016 and 2015, on a consolidated basis and for the company’s transportation and logistics segments; free cash flow for the three-month period ended June 30, 2016; and adjusted operating income for the North American LTL business for the three-month periods ended June 30, 2016 and 2015. As required by SEC rules, we provide reconciliations of these historical measures to the most directly comparable measure under United States generally accepted accounting principles (“GAAP”), which are set forth in the appendix to this document. With respect to our 2016 financial targets of adjusted EBITDA and free cash flow, and our 2018 financial target of EBITDA, each of which is a non-GAAP measure, a reconciliation of the non-GAAP measure to the corresponding GAAP measure is not available without unreasonable effort due to the variability and complexity of the non-cash and other items described below that we exclude from the non-GAAP target measure. The variability of these items may have a significant impact on our future GAAP financial results. We believe that free cash flow is an important measure of our ability to repay maturing debt or fund other uses of capital that we believe will enhance stockholder value. We believe that EBITDA and adjusted EBITDA improve comparability from period to period by removing the impact of our capital structure (interest expense from our outstanding debt), asset base (depreciation and amortization) tax consequences, and the nonrecurring items noted in the reconciliation. We believe that adjusted operating income (loss) improves comparability from period to period by removing the impact of nonrecurring expense items such as one-time transaction-related costs. In addition to its use by management, we believe that EBITDA and adjusted EBITDA are measures widely used by securities analysts, investors and others to evaluate the financial performance of companies in our industry. Other companies may calculate EBITDA and adjusted EBITDA differently, and therefore our measure may not be comparable to similarly titled measures of other companies. Free cash flow, EBITDA and adjusted EBITDA are not measures of financial performance or liquidity under GAAP and should not be considered in isolation or as an alternative to net income, cash flows from operating activities and other measures determined in accordance with GAAP. Items excluded from EBITDA and adjusted EBITDA are significant and necessary components of the operations of our business, and, therefore, EBITDA and adjusted EBITDA should only be used as a supplemental measure of our operating performance.
Forward-looking Statements
This document includes forward-looking statements within the meaning of Section 27A of the Securities Act of 1933, as amended, and Section 21E of the Securities Exchange Act of 1934, as amended, including our 2016 and 2018 financial targets, our expected ability to generate organic revenue growth and profit improvement opportunities, including through cost rationalization, global procurement and the cross-fertilization of best practices, expected performance of our businesses through economic cycles, our ability to cross-sell our services to our customers and expected growth of our industry segments. All statements other than statements of historical fact are, or may be deemed to be, forward-looking statements. In some cases, forward-looking statements can be identified by the use of forward-looking terms such as “anticipate,” “estimate,” “believe,” “continue,” “could,” “intend,” “may,” “plan,” “potential,” “predict,” “should,” “will,” “expect,” “objective,” “projection,” “forecast,” “goal,” “guidance,” “outlook,” “effort,” “target” or the negative of these terms or other comparable terms. However, the absence of these words does not mean that the statements are not forward-looking. These forward-looking statements are based on certain assumptions and analyses made by us in light of our experience and our perception of historical trends, current conditions and expected future developments, as well as other factors we believe are appropriate in the circumstances.
These forward-looking statements are subject to known and unknown risks, uncertainties and assumptions that may cause actual results, levels of activity, performance or achievements to be materially different from any future results, levels of activity, performance or achievements expressed or implied by such forward-looking statements. Factors that might cause or contribute to a material difference include those discussed in XPO’s filings with the SEC and the following: economic conditions generally; competition and pricing pressures; our ability to align our investments in capital assets, including equipment, service centers and warehouses, to our customers’ demands; our ability to successfully manage our growth, including by maintaining effective internal controls; our ability to successfully integrate and realize anticipated synergies, cost savings and profit improvement opportunities with respect to acquired companies; our ability to retain our and our acquired businesses’ largest customers; our ability to develop and implement suitable information technology systems; our substantial indebtedness; our ability to raise debt and equity capital; our ability to attract and retain key employees to execute our strategy, including retention of acquired companies’ key employees; our ability to maintain positive relationships with our network of third-party transportation providers; our ability to attract and retain qualified drivers; litigation, including litigation related to alleged misclassification of independent contractors; labor matters; risks associated with our self-insured claims; risks associated with defined benefit plans for our current and former employees; fluctuations in currency exchange rates; fluctuations in fixed and floating interest rates; our ability to execute our growth strategy through acquisitions; fuel price and fuel surcharge changes; weather and other service disruptions; governmental regulation; and governmental or political actions, including the United Kingdom’s likely exit from the European Union. All forward-looking statements set forth in this document are qualified by these cautionary statements and there can be no assurance that the actual results or developments anticipated will be realized or, even if substantially realized, that they will have the expected consequences to, or effects on, XPO or its businesses or operations. Forward-looking statements set forth in this document speak only as of the date hereof, and XPO undertakes no obligation to update forward-looking statements to reflect subsequent events or circumstances, changes in expectations or the occurrence of unanticipated events except to the extent required by law.
Investor Presentation August 2016
XPO Is at an Inflection Point for EBIDTA and Cash Generation
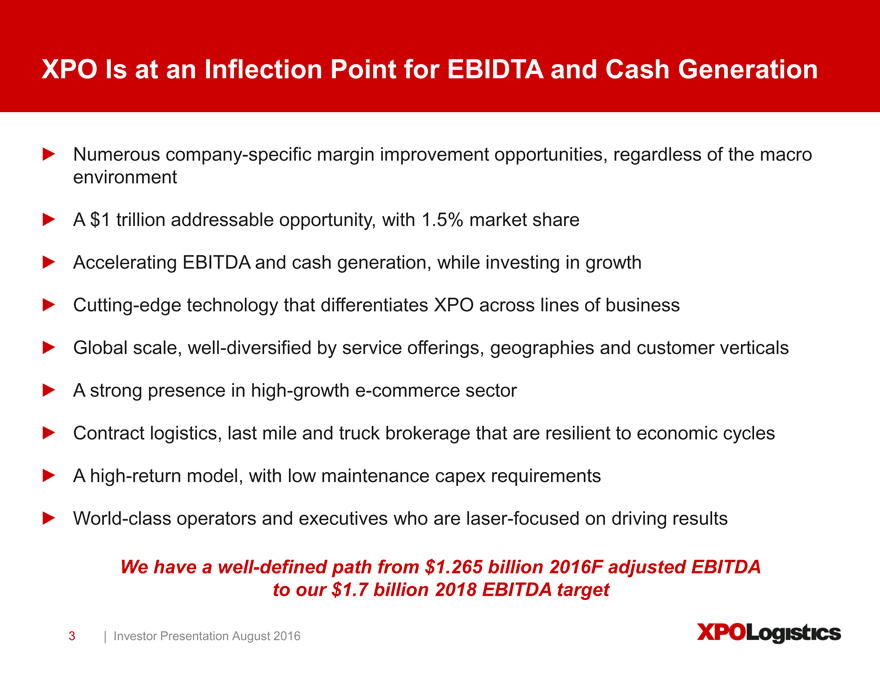
Numerous company-specific margin improvement opportunities, regardless of the macro environment
A $1 trillion addressable opportunity, with 1.5% market share
Accelerating EBITDA and cash generation, while investing in growth
Cutting-edge technology that differentiates XPO across lines of business
Global scale, well-diversified by service offerings, geographies and customer verticals A strong presence in high-growth e-commerce sector Contract logistics, last mile and truck brokerage that are resilient to economic cycles A high-return model, with low maintenance capex requirements World-class operators and executives who are laser-focused on driving results
We have a well-defined path from $1.265 billion 2016F adjusted EBITDA to our $1.7 billion 2018 EBITDA target
Investor Presentation August 2016
We Are a Top 10 Global Logistics Company
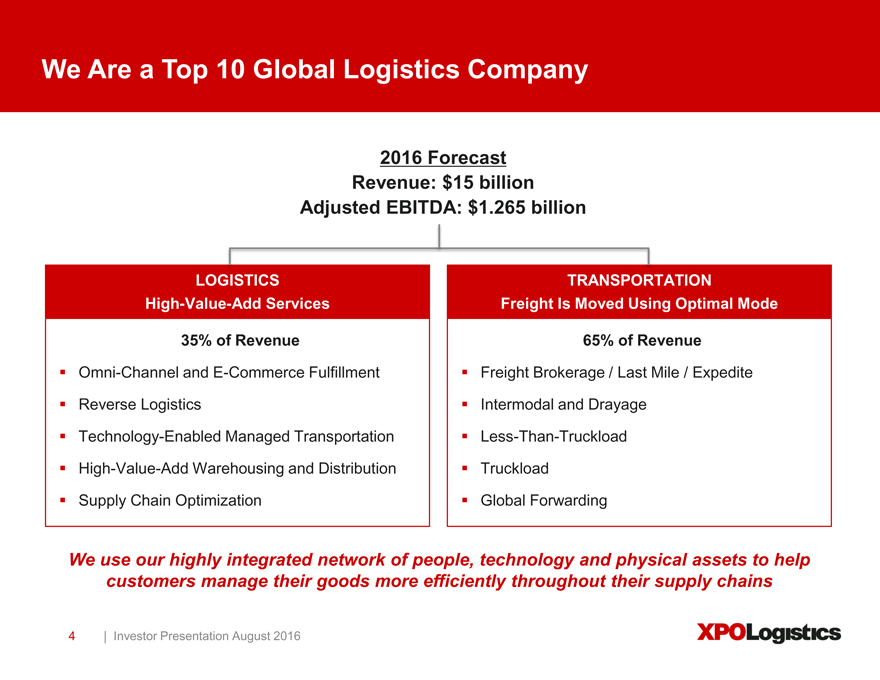
2016 Forecast Revenue: $15 billion Adjusted EBITDA: $1.265 billion
LOGISTICS High-Value-Add Services
35% of Revenue
Omni-Channel and E-Commerce Fulfillment Reverse Logistics Technology-Enabled Managed Transportation High-Value-Add Warehousing and Distribution Supply Chain Optimization
TRANSPORTATION
Freight Is Moved Using Optimal Mode
65% of Revenue
Freight Brokerage / Last Mile / Expedite Intermodal and Drayage Less-Than-Truckload Truckload Global Forwarding
We use our highly integrated network of people, technology and physical assets to help customers manage their goods more efficiently throughout their supply chains
Investor Presentation August 2016
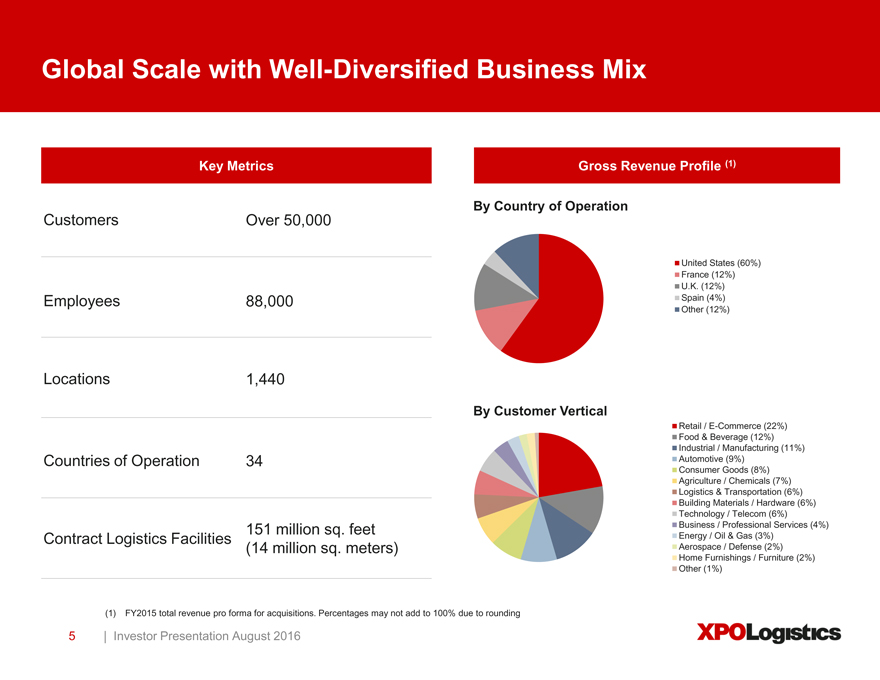
Global Scale with Well-Diversified Business Mix
Key Metrics
Customers Over 50,000 Employees 88,000 Locations 1,440 Countries of Operation 34
151 million sq. feet Contract Logistics Facilities (14 million sq. meters)
Gross Revenue Profile (1)
By Country of Operation
United States (60%) France (12%) U.K. (12%) Spain (4%) Other (12%)
By Customer Vertical
Retail / E-Commerce (22%) Food & Beverage (12%) Industrial / Manufacturing (11%) Automotive (9%) Consumer Goods (8%) Agriculture / Chemicals (7%) Logistics & Transportation (6%) Building Materials / Hardware (6%) Technology / Telecom (6%) Business / Professional Services (4%) Energy / Oil & Gas (3%) Aerospace / Defense (2%) Home Furnishings / Furniture (2%) Other (1%)
(1) | | FY2015 total revenue pro forma for acquisitions. Percentages may not add to 100% due to rounding |
Investor Presentation August 2016
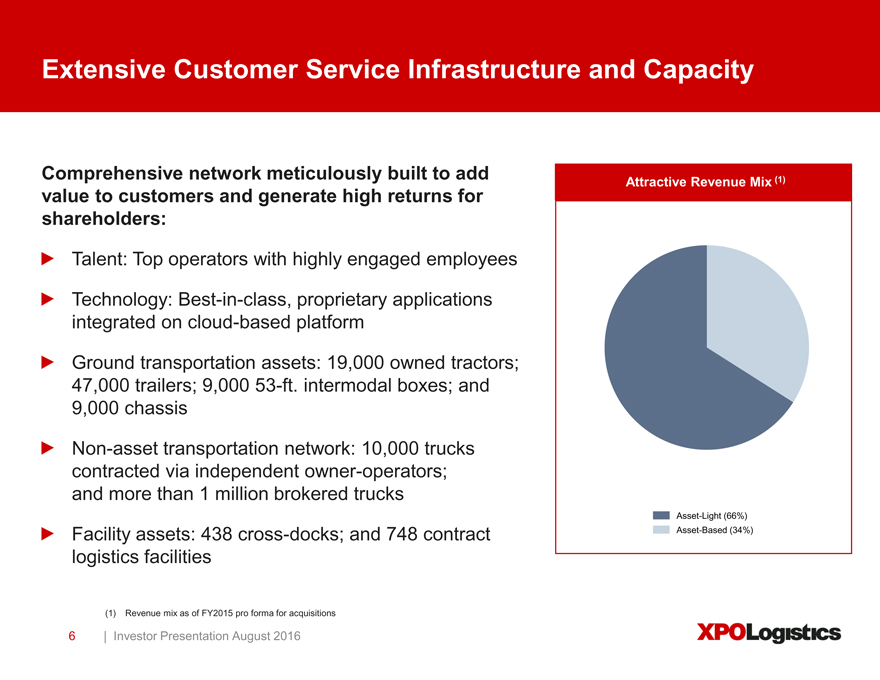
Extensive Customer Service Infrastructure and Capacity
Comprehensive network meticulously built to add value to customers and generate high returns for shareholders:
Talent: Top operators with highly engaged employees
Technology: Best-in-class, proprietary applications integrated on cloud-based platform
Ground transportation assets: 19,000 owned tractors; 47,000 trailers; 9,000 53-ft. intermodal boxes; and 9,000 chassis
Non-asset transportation network: 10,000 trucks contracted via independent owner-operators; and more than 1 million brokered trucks
Facility assets: 438 cross-docks; and 748 contract logistics facilities
(1) | | Revenue mix as of FY2015 pro forma for acquisitions |
Investor Presentation August 2016
Attractive Revenue Mix (1)
Asset-Light (66%) Asset-Based (34%)
XPO Leads the Industry in Rapid Technology Development
Highly scalable and integrated system
On-cloud technology leads to more agility and ease of enhancements Global IT team of over 1,500 professionals Differentiated competitive advantages:
– Proprietary Freight Optimizer (freight brokerage) and Rail Optimizer (intermodal) systems
– Patented last mile applications
– Proprietary bidding portal
– Sophisticated supply chain management technology $425 million IT budget in 2016 with over 160 IT projects completed in first half of the year
Our IT is a major reason why customers trust us each day with 150,000 ground shipments and more than 5 billion inventory units
Investor Presentation August 2016
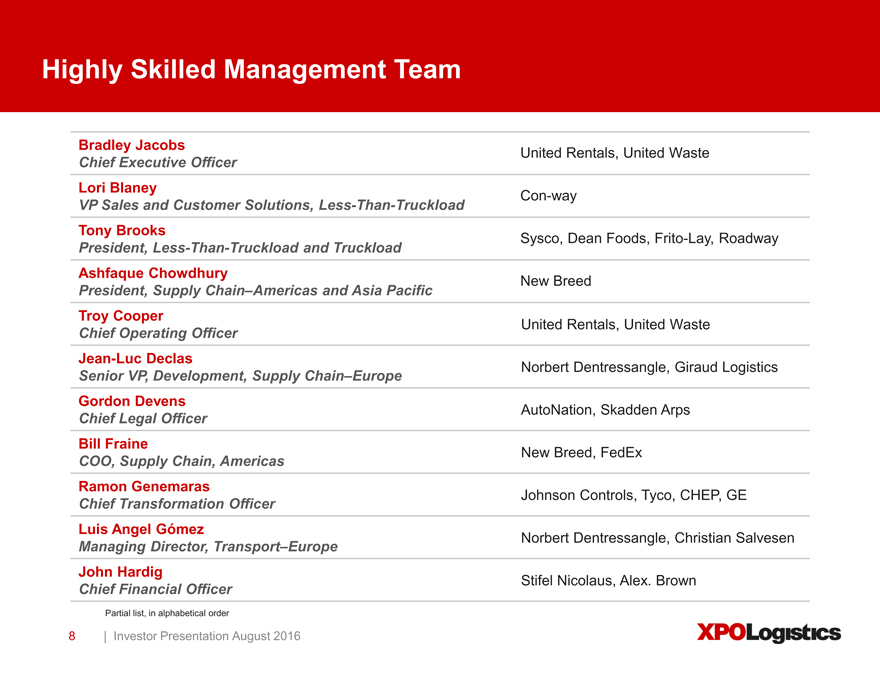
Highly Skilled Management Team
Bradley Jacobs United Rentals, United Waste
Chief Executive Officer
Lori Blaney Con-way
VP Sales and Customer Solutions, Less-Than-Truckload
Tony Brooks Sysco, Dean Foods, Frito-Lay, Roadway
President, Less-Than-Truckload and Truckload
Ashfaque Chowdhury New Breed
President, Supply Chain–Americas and Asia Pacific
Troy Cooper
Chief Operating Officer United Rentals, United Waste
Jean-Luc Declas Norbert Dentressangle, Giraud Logistics
Senior VP, Development, Supply Chain–Europe
Gordon Devens AutoNation, Skadden Arps
Chief Legal Officer
Bill Fraine New Breed, FedEx
COO, Supply Chain, Americas
Ramon Genemaras Johnson Controls, Tyco, CHEP, GE
Chief Transformation Officer
Luis Angel Gómez Norbert Dentressangle, Christian Salvesen
Managing Director, Transport–Europe
John Hardig
Chief Financial Officer Stifel Nicolaus, Alex. Brown
Partial list, in alphabetical order
Investor Presentation August 2016
Highly Skilled Management Team (Cont’d)
Mario Harik Oakleaf Waste Management
Chief Information Officer
Christophe Haviland DHL, American Express, Staples
Sales Director, Transport–Europe
Meghan Henson Chubb Group, PepsiCo
Chief Human Resources Officer
Scott Malat Goldman Sachs, UBS, JPMorgan Chase
Chief Strategy Officer
Karl Meyer
Chief Executive Officer, Last Mile 3PD, Home Depot
Will O’Shea 3PD, Ryder, Cardinal Logistics
Chief Sales and Marketing Officer, Last Mile
Greg Ritter Knight Transportation, C.H. Robinson
Chief Customer Officer
Lance Robinson General Electric, NBC Universal
Global Chief Accounting Officer
Paul Smith Pacer
President, Intermodal
Jennifer Warner Con-way
Global Chief Compliance Officer, General Counsel–Americas
Malcolm Wilson
Managing Director, Logistics–Europe Norbert Dentressangle, NYK Logistics
Partial list, in alphabetical order
Investor Presentation August 2016
9
Serving Blue Chip Customers in Every Major Vertical
Partial list. Any trademarks or logos used in this presentation are the property of their respective owners
Investor Presentation August 2016
10
Serving Blue Chip Customers in Every Major Vertical (Cont’d)
Partial list. Any trademarks or logos used in this presentation are the property of their respective owners
Investor Presentation August 2016
11
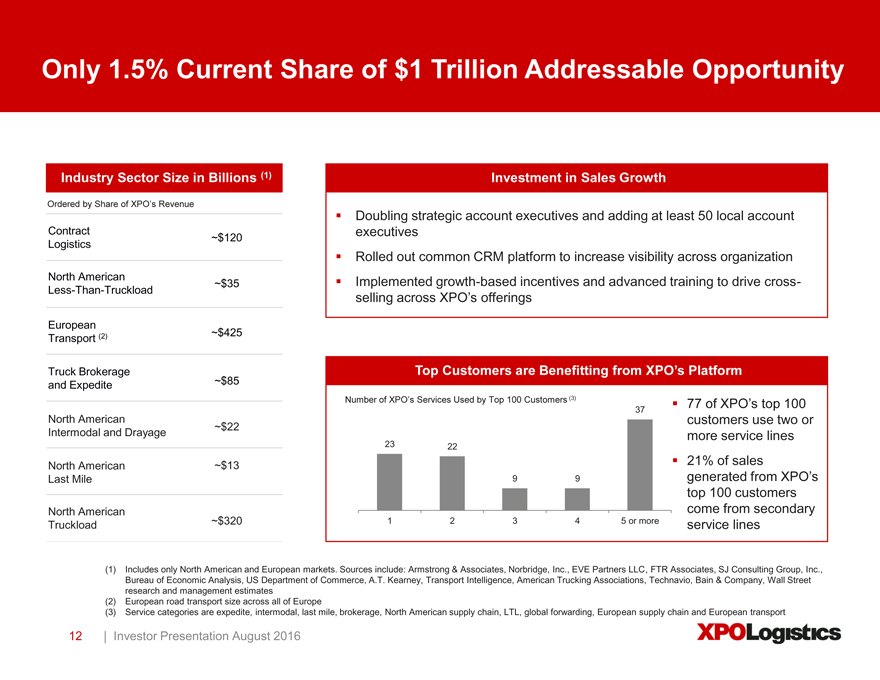
Only 1.5% Current Share of $1 Trillion Addressable Opportunity
Industry Sector Size in Billions (1)
Ordered by Share of XPO’s Revenue
Contract
Logistics ~$120
North American
Less-Than-Truckload ~$35
European
Transport (2) ~$425
Truck Brokerage
and Expedite ~$85
North American
Intermodal and Drayage ~$22
North American ~$13
Last Mile
North American
Truckload ~$320
Investment in Sales Growth
Doubling strategic account executives and adding at least 50 local account executives Rolled out common CRM platform to increase visibility across organization Implemented growth-based incentives and advanced training to drive cross-selling across XPO’s offerings
Top Customers are Benefitting from XPO’s Platform
Number of XPO’s Services Used by Top 100 Customers (3) 77 of XPO’s top 100
37 customers use two or more service lines
23 22
21% of sales
9 9 generated from XPO’s top 100 customers come from secondary
1 | | 2 3 4 5 or more service lines |
(1) Includes only North American and European markets. Sources include: Armstrong & Associates, Norbridge, Inc., EVE Partners LLC, FTR Associates, SJ Consulting Group, Inc., Bureau of Economic Analysis, US Department of Commerce, A.T. Kearney, Transport Intelligence, American Trucking Associations, Technavio, Bain & Company, Wall Street research and management estimates (2) European road transport size across all of Europe (3) Service categories are expedite, intermodal, last mile, brokerage, North American supply chain, LTL, global forwarding, European supply chain and European transport
Investor Presentation August 2016
12
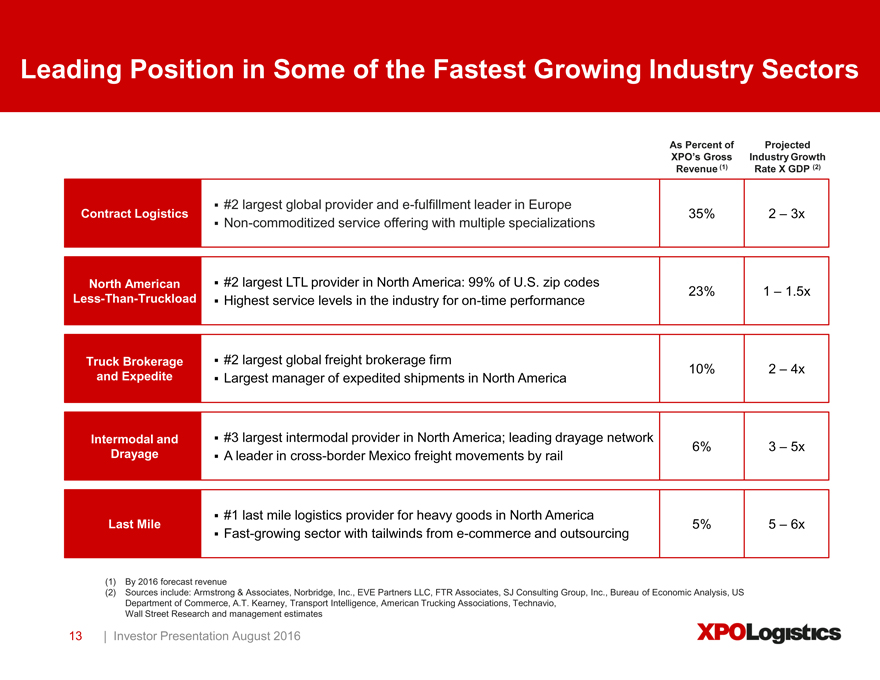
Leading Position in Some of the Fastest Growing Industry Sectors
As Percent of Projected
XPO’s Gross Industry Growth
Revenue (1) Rate X GDP (2)
#2 largest global provider and e-fulfillment leader in Europe
Contract Logistics 35% 2 – 3x
Non-commoditized service offering with multiple specializations
North American #2 largest LTL provider in North America: 99% of U.S. zip codes 23% 1 – 1.5x
Less-Than-Truckload Highest service levels in the industry for on-time performance
Truck Brokerage #2 largest global freight brokerage firm 10% 2 – 4x
and Expedite Largest manager of expedited shipments in North America
Intermodal and #3 largest intermodal provider in North America; leading drayage network 6% 3 – 5x
Drayage A leader in cross-border Mexico freight movements by rail
#1 last mile logistics provider for heavy goods in North America
Last Mile 5% 5 – 6x
Fast-growing sector with tailwinds from e-commerce and outsourcing
(1) | | By 2016 forecast revenue |
(2) Sources include: Armstrong & Associates, Norbridge, Inc., EVE Partners LLC, FTR Associates, SJ Consulting Group, Inc., Bureau of Economic Analysis, US Department of Commerce, A.T. Kearney, Transport Intelligence, American Trucking Associations, Technavio, Wall Street Research and management estimates
Investor Presentation August 2016
13
Well-Defined Path to 2018 Target of $1.7 Billion EBITDA
Company-Specific Initiatives Are Independent of Macro
$300 million of annual run rate profit improvement achievable in next 30 months
Equates to 200 basis points of margin improvement
Includes ~$120 million from original LTL profit improvement plan
Attacking ~$14 billion of addressable spend across purchased services, shared services, technology infrastructure and real estate
Benefiting from operating leverage of global fixed-cost infrastructure
Cross-fertilization of best practices to optimize network
Knowledge-sharing currently underway in supply chain, LTL, shared services
Large impact in areas like warehouse operations, cross dock operations, maintenance, safety, training and HR
XPO’s Chief Transformation Officer, Ramon Genemaras, has previously led $1 billion+ cost-outs at General Electric, Tyco and Johnson Controls
Investor Presentation August 2016
14
Key Lines of Business
Key Lines of Business
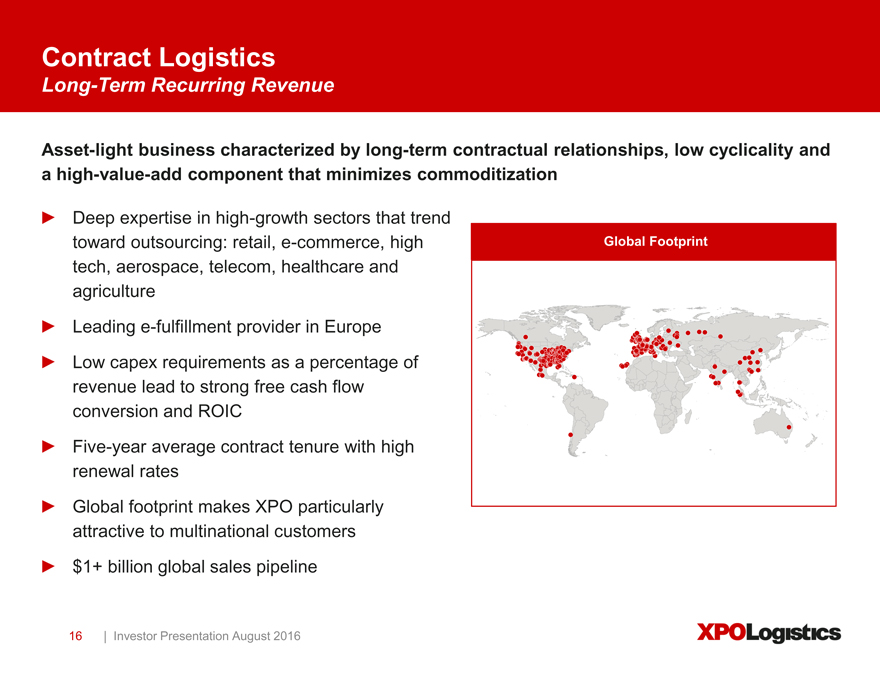
Asset-light business characterized by long-term contractual relationships, low cyclicality and a high-value-add component that minimizes commoditization
Deep expertise in high-growth sectors that trend toward outsourcing: retail, e-commerce, high tech, aerospace, telecom, healthcare and agriculture
Leading e-fulfillment provider in Europe
Low capex requirements as a percentage of revenue lead to strong free cash flow conversion and ROIC
Five-year average contract tenure with high renewal rates
Global footprint makes XPO particularly attractive to multinational customers
$1+ billion global sales pipeline
Investor Presentation August 2016
16
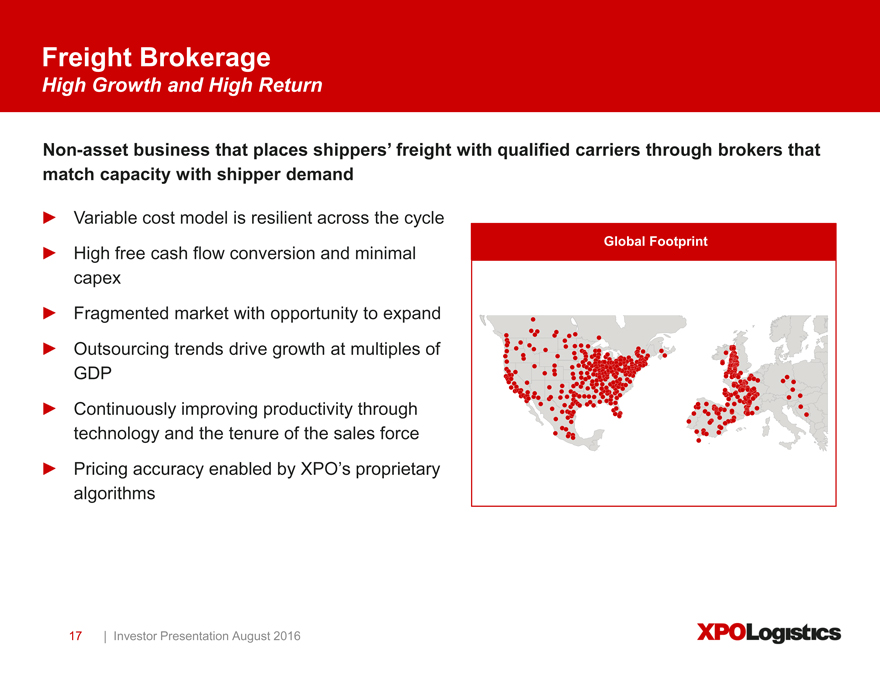
Freight Brokerage
High Growth and High Return
Non-asset business that places shippers’ freight with qualified carriers through brokers that match capacity with shipper demand
Variable cost model is resilient across the cycle
High free cash flow conversion and minimal capex
Fragmented market with opportunity to expand
Outsourcing trends drive growth at multiples of GDP
Continuously improving productivity through technology and the tenure of the sales force
Pricing accuracy enabled by XPO’s proprietary algorithms
Global Footprint
Investor Presentation August 2016
17
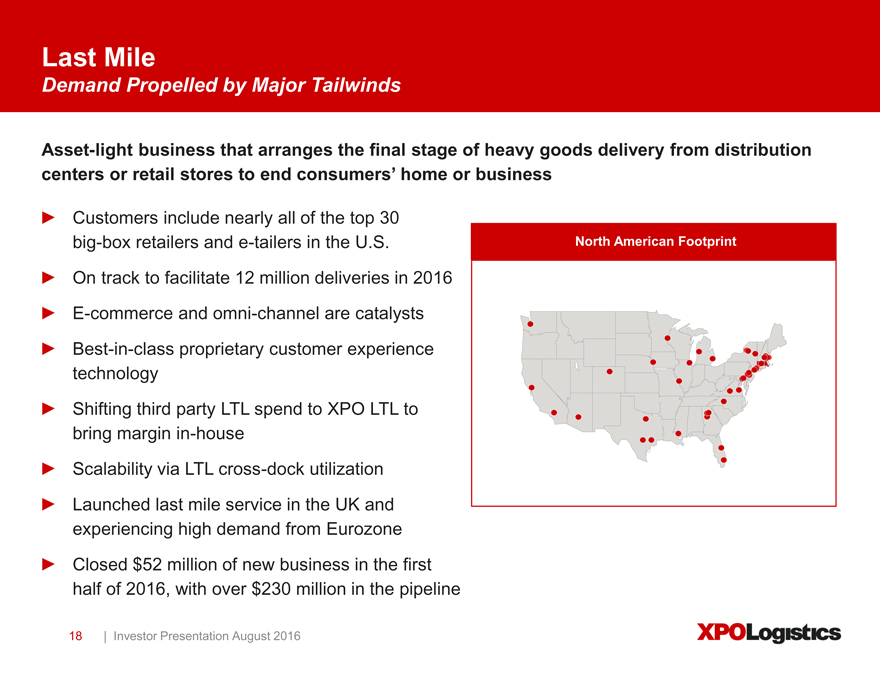
Last Mile
Demand Propelled by Major Tailwinds
North American Footprint
Asset-light business that arranges the final stage of heavy goods delivery from distribution centers or retail stores to end consumers’ home or business
Customers include nearly all of the top 30 big-box retailers and e-tailers in the U.S.
On track to facilitate 12 million deliveries in 2016
E-commerce and omni-channel are catalysts
Best-in-class proprietary customer experience technology
Shifting third party LTL spend to XPO LTL to bring margin in-house
Scalability via LTL cross-dock utilization
Launched last mile service in the UK and experiencing high demand from Eurozone
Closed $52 million of new business in the first half of 2016, with over $230 million in the pipeline
Investor Presentation August 2016
18
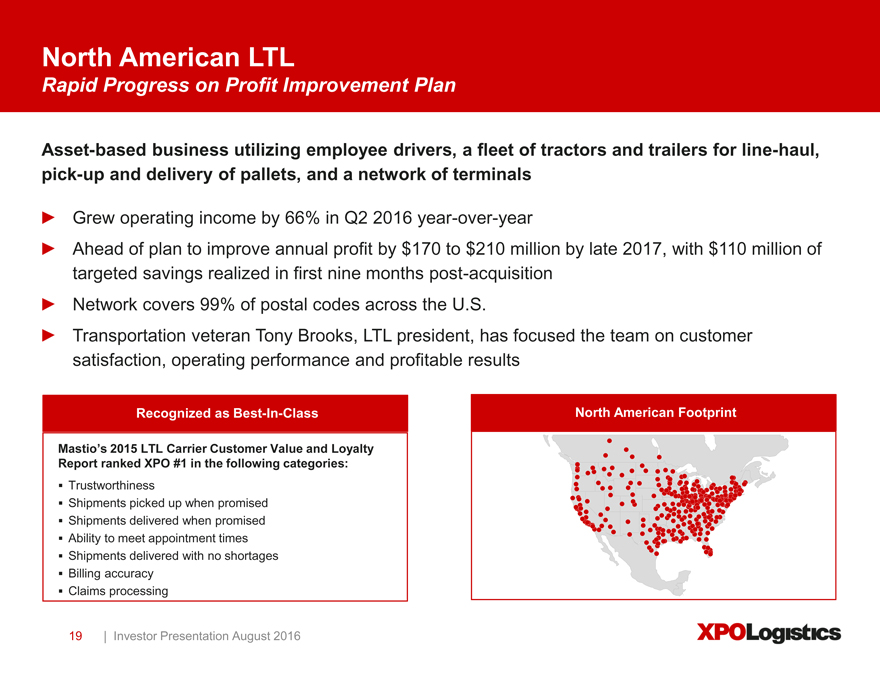
North American LTL
Rapid Progress on Profit Improvement Plan
Asset-based business utilizing employee drivers, a fleet of tractors and trailers for line-haul, pick-up and delivery of pallets, and a network of terminals
Grew operating income by 66% in Q2 2016 year-over-year
Ahead of plan to improve annual profit by $170 to $210 million by late 2017, with $110 million of targeted savings realized in first nine months post-acquisition Network covers 99% of postal codes across the U.S.
Transportation veteran Tony Brooks, LTL president, has focused the team on customer satisfaction, operating performance and profitable results
North American Footprint
Recognized as Best-In-Class
Mastio’s 2015 LTL Carrier Customer Value and Loyalty
Report ranked XPO #1 in the following categories:
Trustworthiness
Shipments picked up when promised Shipments delivered when promised Ability to meet appointment times Shipments delivered with no shortages Billing accuracy Claims processing
Investor Presentation August 2016
19
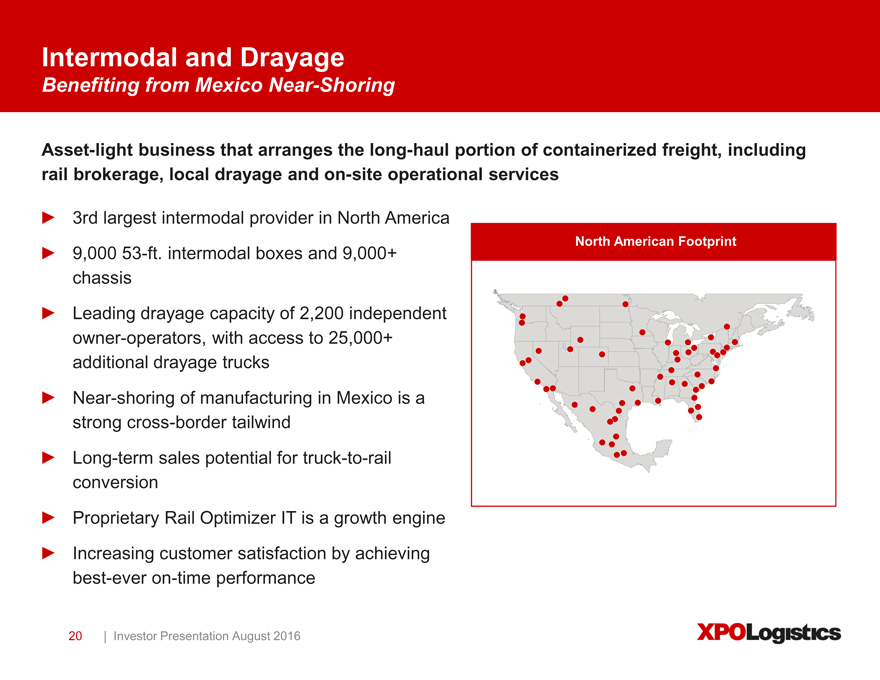
Intermodal and Drayage
Benefiting from Mexico Near-Shoring
Asset-light business that arranges the long-haul portion of containerized freight, including rail brokerage, local drayage and on-site operational services
North American Footprint
3rd largest intermodal provider in North America
9,000 53-ft. intermodal boxes and 9,000+ chassis
Leading drayage capacity of 2,200 independent owner-operators, with access to 25,000+ additional drayage trucks
Near-shoring of manufacturing in Mexico is a strong cross-border tailwind
Long-term sales potential for truck-to-rail conversion
Proprietary Rail Optimizer IT is a growth engine
Increasing customer satisfaction by achieving best-ever on-time performance
Investor Presentation August 2016
20
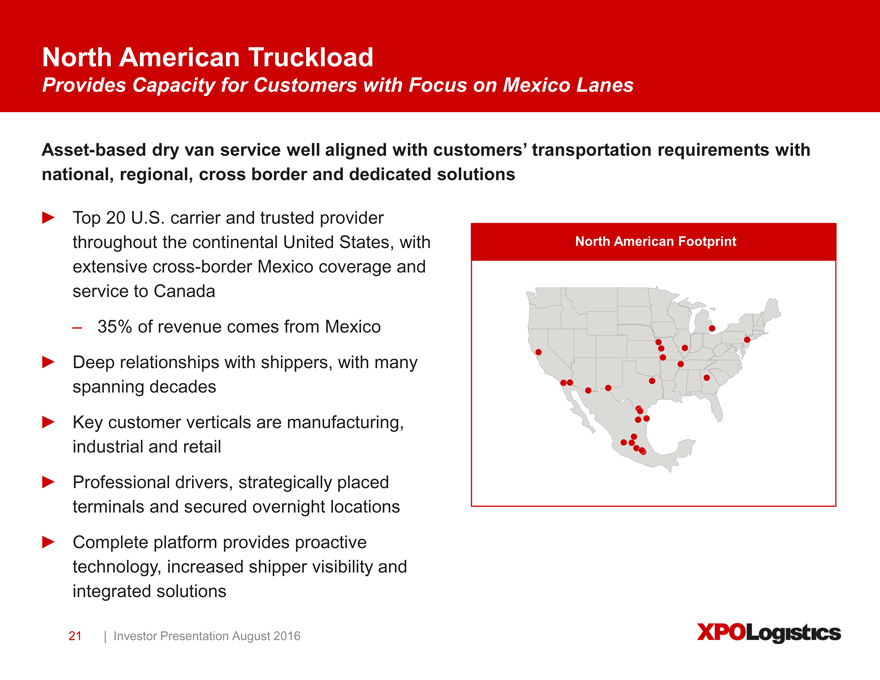
North American Truckload
Provides Capacity for Customers with Focus on Mexico Lanes
Asset-based dry van service well aligned with customers’ transportation requirements with national, regional, cross border and dedicated solutions
Top 20 U.S. carrier and trusted provider throughout the continental United States, with extensive cross-border Mexico coverage and service to Canada
– 35% of revenue comes from Mexico
Deep relationships with shippers, with many spanning decades
Key customer verticals are manufacturing, industrial and retail
Professional drivers, strategically placed terminals and secured overnight locations
Complete platform provides proactive technology, increased shipper visibility and integrated solutions
North American Footprint
Investor Presentation August 2016
21
European Transport
Largest Owned Fleet in Europe
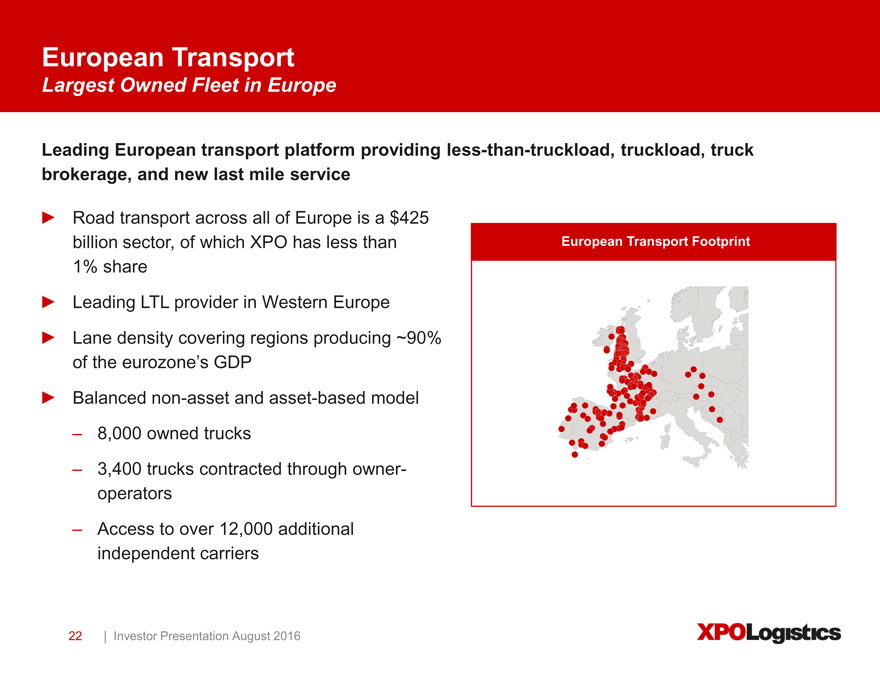
Leading European transport platform providing less-than-truckload, truckload, truck brokerage, and new last mile service
Road transport across all of Europe is a $425 billion sector, of which XPO has less than 1% share
Leading LTL provider in Western Europe
Lane density covering regions producing ~90% of the eurozone’s GDP
Balanced non-asset and asset-based model
– 8,000 owned trucks
– 3,400 trucks contracted through owner-operators
– Access to over 12,000 additional independent carriers
European Transport Footprint
Investor Presentation August 2016
22
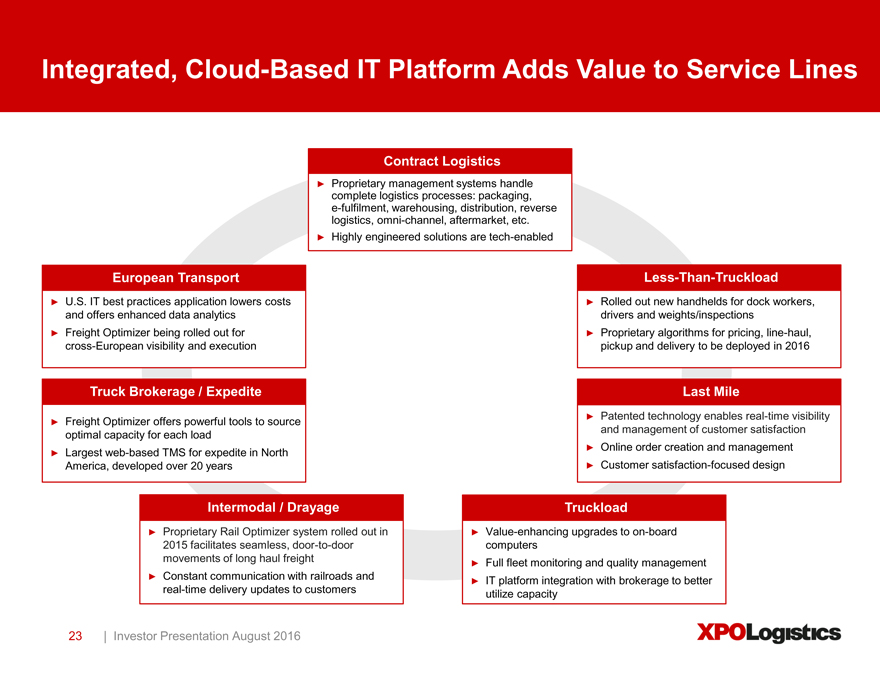
Integrated, Cloud-Based IT Platform Adds Value to Service Lines
Contract Logistics
Proprietary management systems handle complete logistics processes: packaging, e-fulfilment, warehousing, distribution, reverse logistics, omni-channel, aftermarket, etc.
Highly engineered solutions are tech-enabled
European Transport Less-Than-Truckload
U.S. IT best practices application lowers costs Rolled out new handhelds for dock workers, and offers enhanced data analytics drivers and weights/inspections
Freight Optimizer being rolled out for Proprietary algorithms for pricing, line-haul, cross-European visibility and execution pickup and delivery to be deployed in 2016
Truck Brokerage / Expedite Last Mile
Patented technology enables real-time visibility
Freight Optimizer offers powerful tools to source and management of customer satisfaction optimal capacity for each load
Online order creation and management
Largest web-based TMS for expedite in North
America, developed over 20 years Customer satisfaction-focused design
Intermodal / Drayage Truckload
Proprietary Rail Optimizer system rolled out in Value-enhancing upgrades to on-board 2015 facilitates seamless, door-to-door computers movements of long haul freight Full fleet monitoring and quality management
Constant communication with railroads and integration with brokerage to better
IT platform real-time delivery updates to customers utilize capacity
Investor Presentation August 2016
23
Financial Performance
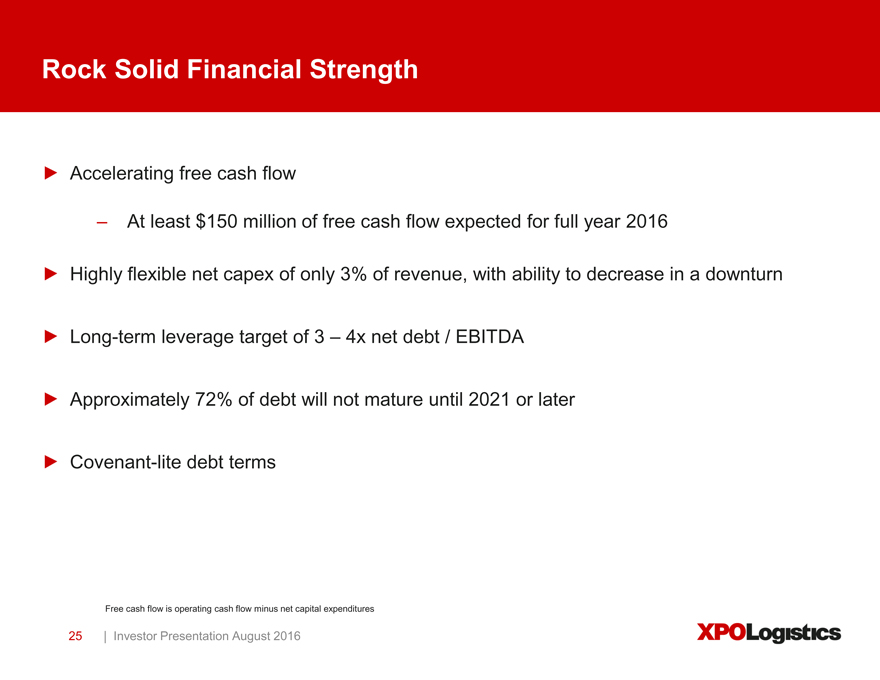
Rock Solid Financial Strength
Accelerating free cash flow
– At least $150 million of free cash flow expected for full year 2016
Highly flexible net capex of only 3% of revenue, with ability to decrease in a downturn
Long-term leverage target of 3 – 4x net debt / EBITDA
Approximately 72% of debt will not mature until 2021 or later
Covenant-lite debt terms
Free cash flow is operating cash flow minus net capital expenditures
Investor Presentation August 2016
25
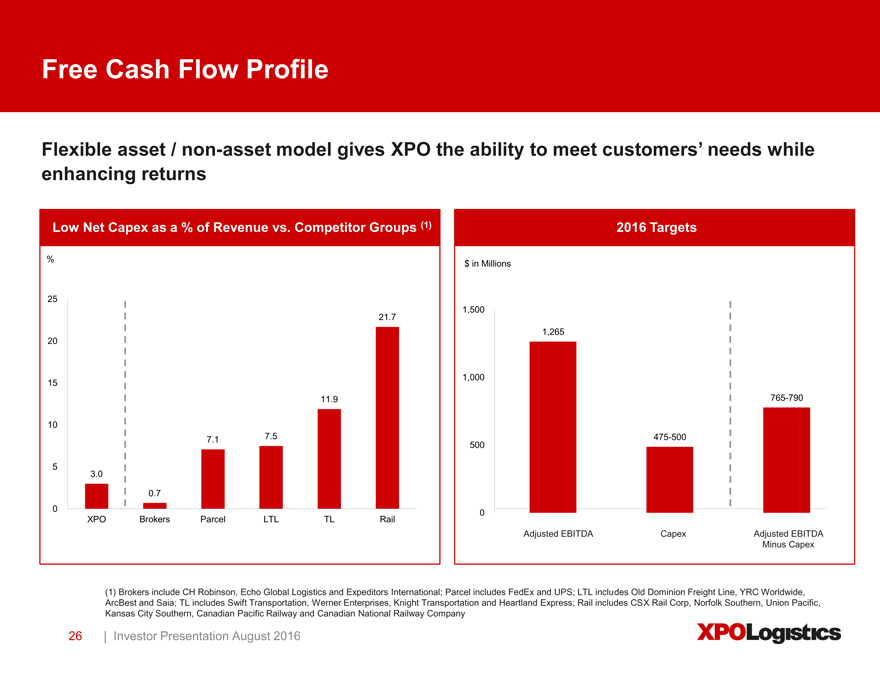
Free Cash Flow Profile
Flexible asset / non-asset model gives XPO the ability to meet customers’ needs while enhancing returns
Low Net Capex as a % of Revenue vs. Competitor Groups (1) 2016 Targets
% $ in Millions
25
21.7 1,500
1,265 20
1,000 15
11.9 765-790
10
7.1 7.5 475-500 500
3.0
0.7 0
0 XPO Brokers Parcel LTL TL Rail
Adjusted EBITDA Capex Adjusted EBITDA Minus Capex
(1) Brokers include CH Robinson, Echo Global Logistics and Expeditors International; Parcel includes FedEx and UPS; LTL includes Old Dominion Freight Line, YRC Worldwide, ArcBest and Saia; TL includes Swift Transportation, Werner Enterprises, Knight Transportation and Heartland Express; Rail includes CSX Rail Corp, Norfolk Southern, Union Pacific, Kansas City Southern, Canadian Pacific Railway and Canadian National Railway Company
Investor Presentation August 2016
26
Second Quarter 2016 Highlights
$3.7 billion of gross revenue $42.6 million of net income $354.9 million of adjusted EBITDA (1) $260.7 million of cash flow from operations $169.5 million of free cash flow (1)
29.1% transportation net revenue margin, compared with 22.5% in Q2 2015
66% increase in LTL operating income versus last year’s second quarter, pre-acquisition
Logistics results higher than expected, led by volume growth from e-commerce and high tech, and a strong performance in Europe
XPO named Fortune 500’s fastest-growing company
(1) See appendix for reconciliations of adjusted EBITDA to GAAP net loss, and free cash flow to cash flow from operations
Investor Presentation August 2016
27
Well-Positioned to Manage Through Brexit
Currency
Fully hedged foreign exchange risk through May 31, 2017
Only ~9% of global adjusted EBITDA in British pounds and 17% in euros (1)
Service Mix
Approximately 90% of U.K. EBITDA comes from contract logistics: long-term contracts and almost three quarters of the business is on cost-plus terms that lock in profit
Balanced Transportation Model
~20% of revenue from U.K. owned fleet from dedicated service: long-term, cost-plus contracts Buy-back options with truck manufacturers give XPO the flexibility to decrease fleet size by up to 25% per year at no penalty
(1) | | Based on annualized EBITDA. See appendix for a reconciliation of adjusted EBITDA to GAAP net loss |
Investor Presentation August 2016
28
Financial Outlook
On August 3, 2016, the company:
Increased its target for adjusted EBITDA to at least $1.265 billion, from $1.25 billion;
Increased its target for free cash flow to at least $150 million, from a range of $100 million to $150 million; and
Reaffirmed its full year 2018 target of approximately $1.7 billion of EBITDA
XPO has a well-defined path from $1.265 billion of adjusted EBITDA in 2016 to $1.7 billion of EBITDA in 2018
Investor Presentation August 2016
29
Supplemental Materials
Awards and Recognitions
Inbound Logistics (2016) names XPO a Top 75 Green Supply Chain Partner
Forbes (2016) ranks XPO #17 among innovative growth companies, and #263 among America’s best employers
French Ministry of the Environment and the French Environment and Energy Agency (2016) awards
XPO the label “Objectif CO2” for the outstanding environmental performance of XPO’s transport operations in Europe
Home Depot (2015) names XPO mid-size truckload carrier of the year
Whirlpool Corporation (2015) names XPO intermodal and LTL carrier of the year
SmartWay (2015) honors XPO for excellence in environmental improvement
Logistics dell’Anno Award (2015) honors XPO in Italy for supply chain innovation
Shippers surveyed in the LTL Carrier Customer Value and Loyalty Report (2015, Mastio & Company) ranked XPO #1 among national LTL carriers for: trustworthiness; shipments picked up when promised; shipments delivered when promised; ability to meet appointment times for pick-up; shipments delivered with no shortages; competitive transit times; billing accuracy; and claims processing
Investor Presentation August 2016
31
Business Glossary
Contract Logistics: An asset-light, technology-enabled business characterized by long-term contractual relationships with high renewal rates, low cyclicality and a high-value-add component that minimizes commoditization. Contracts are typically structured as either fixed-variable, cost-plus or gain-share. XPO services include highly engineered solutions, e-fulfillment, reverse logistics, packaging, factory support, aftermarket support, warehousing and distribution for customers in aerospace, manufacturing, retail, life sciences, chemicals, food and beverage, and cold chain.
Expedite: A non-asset business that facilitates time-critical, high-value or high-security shipments, usually on very short notice. Revenue is either contractual or transactional, primarily driven by unforeseen supply chain disruptions or just-in-time inventory demand for raw materials, parts or goods. XPO provides three types of expedite service: ground transportation via a network of independent contract carriers; air charter transportation facilitated by proprietary, web-based technology that solicits bids and assigns loads to aircraft; and a managed transportation network that is the largest web-based expedite management technology in North America.
Freight Brokerage: A variable cost business that facilitates the trucking of freight by procuring carriers through the use of proprietary technology. Freight brokerage net revenue is the spread between the price to the shipper and the cost of purchased transportation. In North America, XPO has a non-asset freight brokerage business, with a network of 32,000 independent carriers. In Europe, XPO generates over €1 billion in freight brokerage revenue annually, with capacity provided by an asset-light mix of owned fleet and independent carriers.
Global Forwarding: A non-asset business that facilitates freight shipments by ground, air and ocean. Shipments may have origins and destinations within North America, to or from North America, or between foreign locations. Services are provided through a network of market experts who provide local oversight in thousands of key trade areas worldwide. XPO’s global forwarding service can arrange shipments with no restrictions as to size, weight or mode, and is OTI and NVOCC licensed.
Investor Presentation August 2016
32
Business Glossary (Cont’d)
Intermodal: An asset-light business that facilitates the movement of long-haul, containerized freight by rail, often with a drayage (trucking) component at either end. Intermodal is a variable cost business, with revenue generated by a mix of contractual and spot market transactions. Net revenue equates to the spread between the price to the shipper and the cost of purchasing rail and truck transportation. Two factors are driving growth in intermodal in North America: rail transportation is less expensive and more fuel efficient per mile than long-haul trucking, and rail is a key mode of transportation in and out of Mexico, where the manufacturing base is booming due to a trend toward near-shoring.
Last Mile: A non-asset business that facilitates the delivery of goods to their final destination, most often to consumer households. XPO specializes in two areas of last mile service: arranging the delivery and installation of heavy goods such as appliances, furniture and electronics, often with a white glove component; and providing logistics solutions to retailers and distributors to support their e-commerce supply chains and omni-channel distribution strategies. Capacity is sourced from a network of independent contract carriers and technicians.
Less-Than-Truckload (LTL): The transportation of a quantity of freight that is larger than a parcel, but too small to require an entire truck, and is often shipped on a pallet. LTL shipments are priced according to the weight of the freight, its commodity class (which is generally determined by its cube/weight ratio and the description of the product), and mileage within designated lanes. An LTL carrier typically operates a hub-and-spoke network that allows for the consolidation of multiple shipments for different customers in single trucks.
Managed Transportation: A service provided to shippers who want to outsource some or all of their transportation modes, together with associated activities. This can include freight handling such as consolidation and deconsolidation, labor planning, inbound and outbound shipment facilitation, documentation and customs management, claims processing, and 3PL supplier management, among other things.
Truckload: The ground transportation of cargo provided by a single shipper in an amount that requires the full limit of a dry van trailer, either by dimension or weight. Cargo typically remains on a single vehicle from the point of origin to the destination, and is not handled en route. This can make truckload a cost-effective option when transit time is key but not urgent. Shippers who utilize truckload generally pay a lower cost per item or pallet compared with other over-the-road options, and see less damage to goods. Also known as long-haul trucking.
Investor Presentation August 2016
33
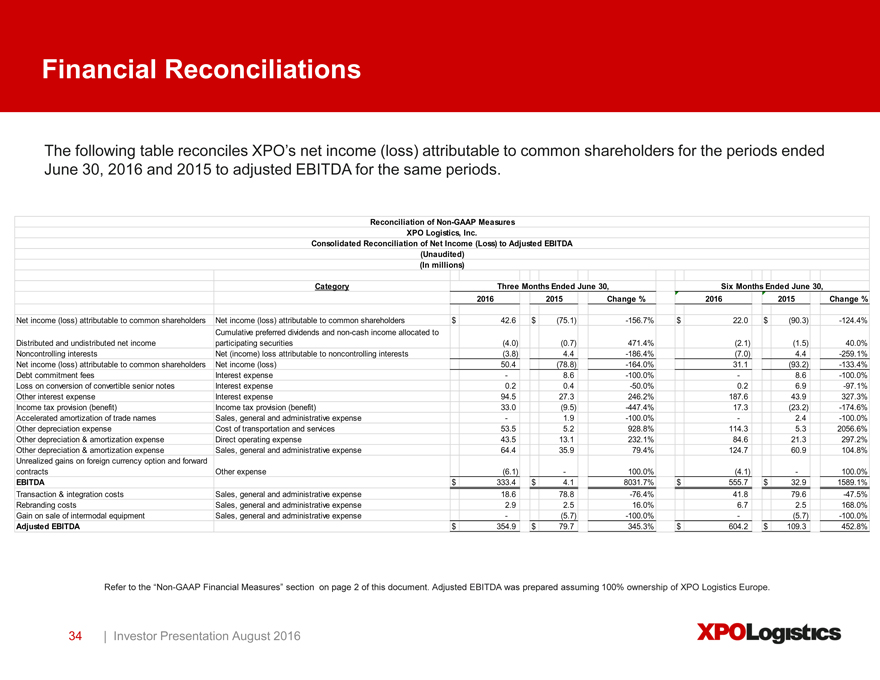
Financial Reconciliations
Reconciliation of Non-GAAP Measures
XPO Logistics, Inc.
Consolidated Reconciliation of Net Income (Loss) to Adjusted EBITDA
(Unaudited)
(In millions)
Category Three Months Ended June 30, Six Months Ended June 30,
2016 2015 Change % 2016 2015 Change %
Net income (loss) attributable to common shareholders Net income (loss) attributable to common shareholders $ 42.6 $(75.1) -156.7% $ 22.0 $(90.3) -124.4%
Cumulative preferred dividends and non-cash income allocated to
Distributed and undistributed net income participating securities(4.0)(0.7) 471.4%(2.1)(1.5) 40.0%
Noncontrolling interests Net (income) loss attributable to noncontrolling interests(3.8) 4.4 -186.4%(7.0) 4.4 -259.1%
Net income (loss) attributable to common shareholders Net income (loss) 50.4(78.8) -164.0% 31.1(93.2) -133.4%
Debt commitment fees Interest expense—8.6 -100.0%—8.6 -100.0%
Loss on conversion of convertible senior notes Interest expense 0.2 0.4 -50.0% 0.2 6.9 -97.1%
Other interest expense Interest expense 94.5 27.3 246.2% 187.6 43.9 327.3%
Income tax provision (benefit) Income tax provision (benefit) 33.0(9.5) -447.4% 17.3(23.2) -174.6%
Accelerated amortization of trade names Sales, general and administrative expense—1.9 -100.0%—2.4 -100.0%
Other depreciation expense Cost of transportation and services 53.5 5.2 928.8% 114.3 5.3 2056.6%
Other depreciation & amortization expense Direct operating expense 43.5 13.1 232.1% 84.6 21.3 297.2%
Other depreciation & amortization expense Sales, general and administrative expense 64.4 35.9 79.4% 124.7 60.9 104.8%
Unrealized gains on foreign currency option and forward
contracts Other expense(6.1)—100.0%(4.1)—100.0%
EBITDA $ 333.4 $ 4.1 8031.7% $ 555.7 $ 32.9 1589.1%
Transaction & integration costs Sales, general and administrative expense 18.6 78.8 -76.4% 41.8 79.6 -47.5%
Rebranding costs Sales, general and administrative expense 2.9 2.5 16.0% 6.7 2.5 168.0%
Gain on sale of intermodal equipment Sales, general and administrative expense -(5.7) -100.0% -(5.7) -100.0%
Adjusted EBITDA $ 354.9 $ 79.7 345.3% $ 604.2 $ 109.3 452.8%
Refer to the “Non-GAAP Financial Measures” section on page 2 of this document. Adjusted EBITDA was prepared assuming 100% ownership of XPO Logistics Europe.
Investor Presentation August 2016
34
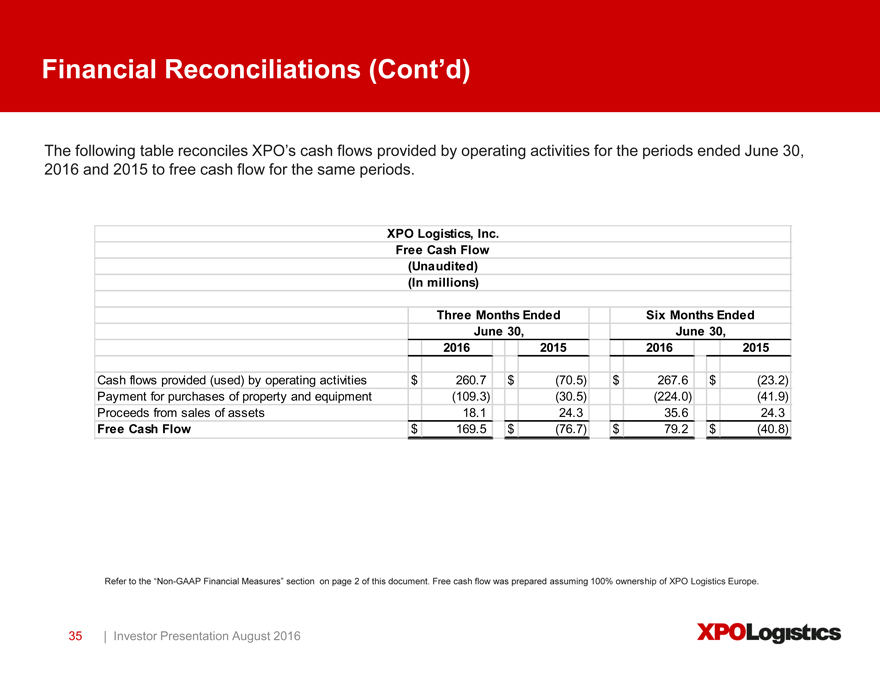
Financial Reconciliations (Cont’d)
The following table reconciles XPO’s cash flows provided by operating activities for the periods ended June 30,
2016 and 2015 to free cash flow for the same periods.
XPO Logistics, Inc.
Free Cash Flow
(Unaudited)
(In millions)
Three Months Ended Six Months Ended
June 30, June 30,
2016 2015 2016 2015
Cash flows provided (used) by operating activities $ 260.7 $(70.5) $ 267.6 $(23.2)
Payment for purchases of property and equipment(109.3)(30.5)(224.0)(41.9)
Proceeds from sales of assets 18.1 24.3 35.6 24.3
Free Cash Flow $ 169.5 $(76.7) $ 79.2 $(40.8)
Refer to the “Non-GAAP Financial Measures” section on page 2 of this document. Free cash flow was prepared assuming 100% ownership of XPO Logistics Europe.
Investor Presentation August 2016
35
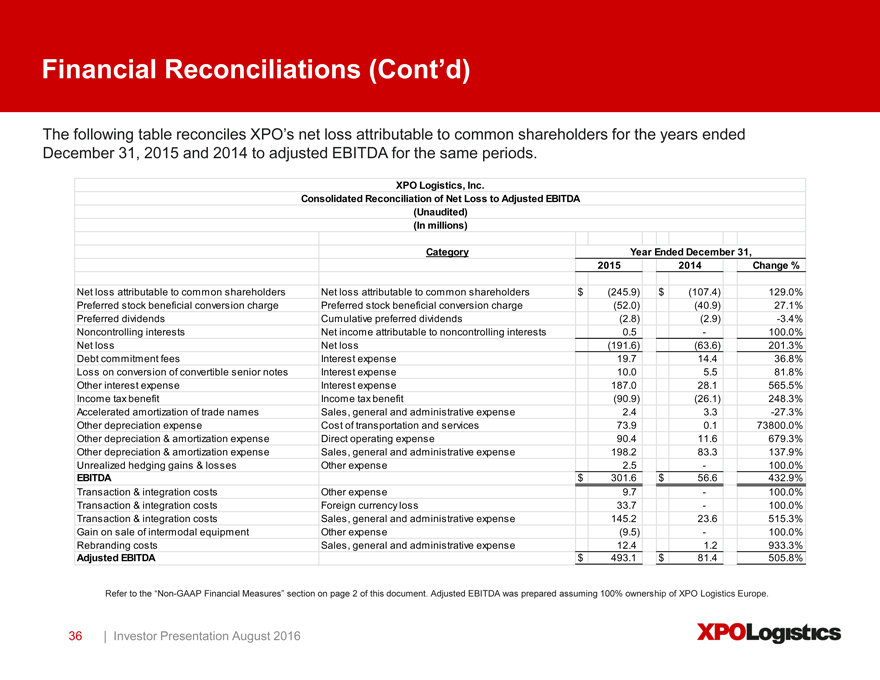
Financial Reconciliations (Cont’d)
The following table reconciles XPO’s net loss attributable to common shareholders for the years ended
December 31, 2015 and 2014 to adjusted EBITDA for the same periods.
XPO Logistics, Inc.
Consolidated Reconciliation of Net Loss to Adjusted EBITDA
(Unaudited)
(In millions)
Category Year Ended December 31,
2015 2014 Change %
Net loss attributable to common shareholders Net loss attributable to common shareholders $(245.9) $(107.4) 129.0%
Preferred stock beneficial conversion charge Preferred stock beneficial conversion charge(52.0)(40.9) 27.1%
Preferred dividends Cumulative preferred dividends(2.8)(2.9) -3.4%
Noncontrolling interests Net income attributable to noncontrolling interests 0.5—100.0%
Net loss Net loss(191.6)(63.6) 201.3%
Debt commitment fees Interest expense 19.7 14.4 36.8%
Loss on conversion of convertible senior notes Interest expense 10.0 5.5 81.8%
Other interest expense Interest expense 187.0 28.1 565.5%
Income tax benefit Income tax benefit(90.9)(26.1) 248.3%
Accelerated amortization of trade names Sales, general and administrative expense 2.4 3.3 -27.3%
Other depreciation expense Cost of transportation and services 73.9 0.1 73800.0%
Other depreciation & amortization expense Direct operating expense 90.4 11.6 679.3%
Other depreciation & amortization expense Sales, general and administrative expense 198.2 83.3 137.9%
Unrealized hedging gains & losses Other expense 2.5—100.0%
EBITDA $ 301.6 $ 56.6 432.9%
Transaction & integration costs Other expense 9.7—100.0%
Transaction & integration costs Foreign currency loss 33.7—100.0%
Transaction & integration costs Sales, general and administrative expense 145.2 23.6 515.3%
Gain on sale of intermodal equipment Other expense(9.5)—100.0%
Rebranding costs Sales, general and administrative expense 12.4 1.2 933.3%
Adjusted EBITDA $ 493.1 $ 81.4 505.8%
Refer to the “Non-GAAP Financial Measures” section on page 2 of this document. Adjusted EBITDA was prepared assuming 100% ownership of XPO Logistics Europe.
Investor Presentation August 2016
36
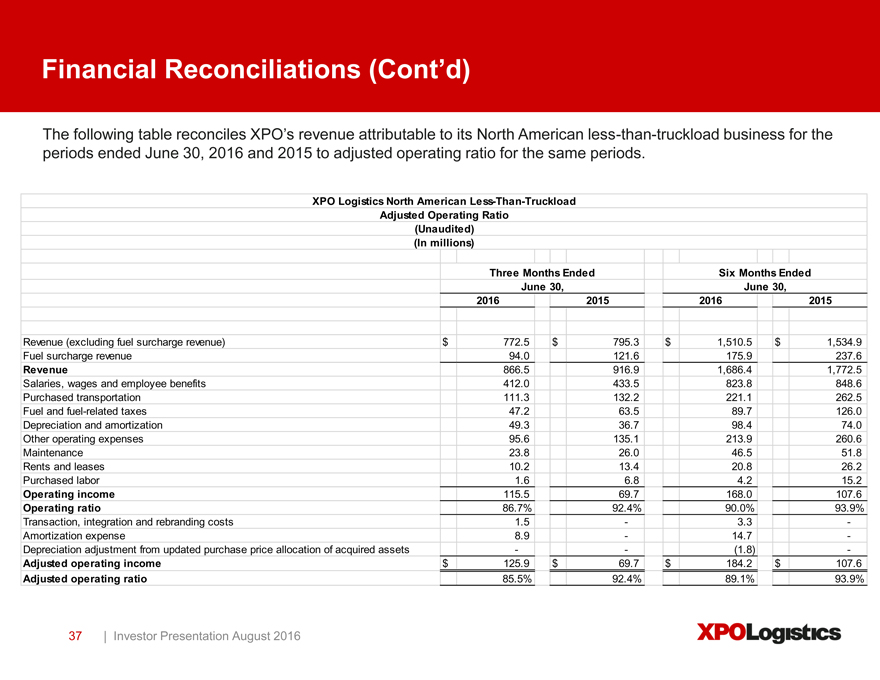
Financial Reconciliations (Cont’d)
The following table reconciles XPO’s revenue attributable to its North American less-than-truckload business for the
periods ended June 30, 2016 and 2015 to adjusted operating ratio for the same periods.
XPO Logistics North American Less-Than-Truckload
Adjusted Operating Ratio
(Unaudited)
(In millions)
Three Months Ended Six Months Ended
June 30, June 30,
2016 2015 2016 2015
Revenue (excluding fuel surcharge revenue) $ 772.5 $ 795.3 $ 1,510.5 $ 1,534.9
Fuel surcharge revenue 94.0 121.6 175.9 237.6
Revenue 866.5 916.9 1,686.4 1,772.5
Salaries, wages and employee benefits 412.0 433.5 823.8 848.6
Purchased transportation 111.3 132.2 221.1 262.5
Fuel and fuel-related taxes 47.2 63.5 89.7 126.0
Depreciation and amortization 49.3 36.7 98.4 74.0
Other operating expenses 95.6 135.1 213.9 260.6
Maintenance 23.8 26.0 46.5 51.8
Rents and leases 10.2 13.4 20.8 26.2
Purchased labor 1.6 6.8 4.2 15.2
Operating income 115.5 69.7 168.0 107.6
Operating ratio 86.7% 92.4% 90.0% 93.9%
Transaction, integration and rebranding costs 1.5—3.3 -
Amortization expense 8.9—14.7 -
Depreciation adjustment from updated purchase price allocation of acquired assets —(1.8) -
Adjusted operating income $ 125.9 $ 69.7 $ 184.2 $ 107.6
Adjusted operating ratio 85.5% 92.4% 89.1% 93.9%
Investor Presentation August 2016
37