Use these links to rapidly review the document
Table of Contents
ITEM 8. Financial Statements and Supplementary Data
Table of Contents
UNITED STATES
SECURITIES AND EXCHANGE COMMISSION
Washington, D.C. 20549
FORM 10-K
| | |
ý |
|
ANNUAL REPORT PURSUANT TO SECTION 13 OR 15(d) OF THE SECURITIES EXCHANGE ACT OF 1934 |
For the fiscal year ended December 31, 2013 |
or |
o |
|
TRANSITION REPORT PURSUANT TO SECTION 13 OR 15(d) OF THE SECURITIES EXCHANGE ACT OF 1934 |
for the transition period from to
|
Commission File Number 001-31239
MARKWEST ENERGY PARTNERS, L.P.
(Exact name of registrant as specified in its charter)
| | |
Delaware
(State or other jurisdiction of
incorporation or organization) | | 27-0005456
(I.R.S. Employer
Identification No.) |
1515 Arapahoe Street, Tower 1, Suite 1600, Denver, CO 80202-2137
(Address of principal executive offices)
Registrant's telephone number, including area code:303-925-9200
Securities registered pursuant to Section 12(b) of the Act:Common units representing limited partner interests, New York Stock Exchange
Securities registered pursuant to Section 12(g) of the Act:None
Indicate by check mark whether the registrant is a well-known seasoned issuer, as defined in Rule 405 of the Securities Act. Yesý Noo
Indicate by check mark if the registrant is not required to file reports pursuant to Section 13 or Section 15(d) of the Act. Yes o No ý
Indicate by check mark whether the registrant (1) has filed all reports required to be filed by Section 13 or 15(d) of the Securities Exchange Act of 1934 during the preceding 12 months (or for such shorter period that the registrant was required to file such reports), and (2) has been subject to such filing requirements for the past 90 days. Yes ý No o
Indicate by check mark whether the registrant has submitted electronically and posted on its corporate Web site, if any, every Interactive Data File required to be submitted and posted pursuant to Rule 405 of Regulation S-T (§232.405 of this chapter) during the preceding 12 months (or for such shorter period that the registrant was required to submit and post such files). Yes ý No o
Indicate by check mark if disclosure of delinquent filers pursuant to Item 405 of Regulation S-K is not contained herein, and will not be contained, to the best of registrant's knowledge, in definitive proxy or information statements incorporated by reference in Part III of this Form 10-K or any amendment to this Form 10-K.o
Indicate by check mark whether the registrant is a large accelerated filer, an accelerated filer, a non-accelerated filer or a smaller reporting company. See the definitions of "large accelerated filer," "accelerated filer" and "smaller reporting company" in Rule 12b-2 of the Exchange Act.
| | | | | | |
| Large accelerated filer ý | | Accelerated filer o | | Non-accelerated filer o
(Do not check if a
smaller reporting company) | | Smaller reporting company o |
Indicate by check mark whether the registrant is a shell company (as defined in Rule 12b-2 of the Act). Yes o No ý
The aggregate market value of common units held by non-affiliates of the registrant on June 30, 2013 was approximately $8.9 billion. As of February 19, 2014, the number of the registrant's common units and Class B units outstanding were 157,976,406 and 15,963,512, respectively.
DOCUMENTS INCORPORATED BY REFERENCE:
The information required by Part III of this Report, to the extent not set forth herein, is incorporated herein by reference from the registrant's definitive proxy statement relating to the Annual Meeting of Unitholders to be held in 2014, which definitive proxy statement shall be filed with the Securities and Exchange Commission within 120 days after the end of the fiscal year to which this Report relates.
Table of Contents
MarkWest Energy Partners, L.P.
Form 10-K
Table of Contents
| | | | |
| |
| |
|
|---|
PART I | | | | |
Item 1. | | Business | | 4 |
Item 1A. | | Risk Factors | | 37 |
Item 1B. | | Unresolved Staff Comments | | 61 |
Item 2. | | Properties | | 62 |
Item 3. | | Legal Proceedings | | 65 |
Item 4. | | Mine Safety Disclosures | | 66 |
PART II | | | | |
Item 5. | | Market for Registrant's Common Units, Related Unitholder Matters and Issuer Purchases of Equity Securities | | 67 |
Item 6. | | Selected Financial Data | | 69 |
Item 7. | | Management's Discussion and Analysis of Financial Condition and Results of Operations | | 72 |
Item 7A. | | Quantitative and Qualitative Disclosures About Market Risk | | 99 |
Item 8. | | Financial Statements and Supplementary Data | | 104 |
Item 9. | | Changes in and Disagreements with Accountants on Accounting and Financial Disclosure | | 176 |
Item 9A. | | Controls and Procedures | | 176 |
Item 9B. | | Other Information | | 178 |
PART III | | |
Item 10. | | Directors, Executive Officers and Corporate Governance | | 178 |
Item 11. | | Executive Compensation | | 178 |
Item 12. | | Security Ownership of Certain Beneficial Owners and Management and Related Unitholder Matters | | 178 |
Item 13. | | Certain Relationships and Related Transactions, and Director Independence | | 178 |
Item 14. | | Principal Accountant Fees and Services | | 178 |
PART IV | | |
Item 15. | | Exhibits and Financial Statement Schedules | | 178 |
SIGNATURES | | 186 |
Throughout this document we make statements that are classified as "forward- looking." Please refer to the "Forward-Looking Statements" included later in this section for an explanation of these types of assertions. Also, in this document, unless the context requires otherwise, references to "we," "us," "our," "MarkWest Energy" or the "Partnership" are intended to mean MarkWest Energy Partners, L.P., and its consolidated subsidiaries. References to "MarkWest Hydrocarbon" or the "Corporation" are intended to mean MarkWest Hydrocarbon, Inc., a wholly-owned taxable subsidiary of the Partnership. References to "General Partner" are intended to mean MarkWest Energy GP, L.L.C., the general partner of the Partnership.
2
Table of Contents
Glossary of Terms
The abbreviations, acronyms and industry technology used in this report are defined as follows.
| | |
Bbl | | Barrel |
Bbl/d | | Barrels per day |
Bcf/d | | Billion cubic feet per day |
Btu | | One British thermal unit, an energy measurement |
Condensate | | A natural gas liquid with a low vapor pressure mainly composed of propane, butane, pentane and heavier hydrocarbon fractions |
Credit Facility | | Revolving loan facility provided for under our Amended and Restated Credit Agreement dated July 1, 2010 |
DER | | Distribution equivalent right |
Dth/d | | Dekatherms per day |
EBITDA (a non-GAAP financial measure) | | Earnings Before Interest, Taxes, Depreciation and Amortization |
EPA | | United States Environmental Protection Agency |
ERCOT | | Electric Reliability Council of Texas |
FASB | | Financial Accounting Standards Board |
FERC | | Federal Energy Regulatory Commission |
GAAP | | Accounting principles generally accepted in the United States of America |
Gal | | Gallon |
Gal/d | | Gallons per day |
IFRS | | International Financial Reporting Standards |
LIBOR | | London Interbank Offered Rate |
Mcf | | One thousand cubic feet of natural gas |
Mcf/d | | One thousand cubic feet of natural gas per day |
MMBtu | | One million British thermal units, an energy measurement |
MMBtu/d | | One million British thermal units per day |
MMcf/d | | One million cubic feet of natural gas per day |
Net operating margin (a non-GAAP financial measure) | | Segment revenue, excluding any derivative gain (loss), less purchased product costs, excluding any derivative gain (loss) |
NGL | | Natural gas liquids, such as ethane, propane, butanes and natural gasoline |
N/A | | Not applicable |
OTC | | Over-the-Counter |
SEC | | Securities and Exchange Commission |
SMR | | Steam methane reformer, operated by a third party and located at the Javelina gas processing and fractionation facility in Corpus Christi, Texas |
TSR Performance Units | | Phantom units containing performance vesting criteria related to the Partnership's total shareholder return |
VIE | | Variable interest entity |
WTI | | West Texas Intermediate |
3
Table of Contents
Forward-Looking Statements
Certain statements and information included in this Annual Report on Form 10-K may constitute "forward-looking statements." The words "could," "may," "predict," "should," "expect," "hope," "continue," "potential," "plan," "intend," "anticipate," "project," "believe," "estimate" and similar expressions are intended to identify forward-looking statements, which are generally not historical in nature. These forward-looking statements are based on current expectations, estimates, assumptions and beliefs concerning future events impacting us and therefore involve a number of risks and uncertainties. While management believes that these forward-looking statements are reasonable as and when made, there can be no assurance that future developments affecting us will be those that we anticipate. All comments concerning our expectations for future revenues and operating results are based on our forecasts for our existing operations and do not include the potential impact of any future acquisitions. Our forward-looking statements involve significant risks and uncertainties (some of which are beyond our control) and assumptions that could cause actual results to differ materially from our historical experience and our present expectations or projections. Important factors that could cause actual results to differ materially from those in the forward-looking statements include those described in (i) Item 1A. Risk Factors of this Form 10-K and elsewhere in this report, (ii) our reports and registration statements filed from time to time with the SEC and (iii) other announcements we make from time to time. Investors are cautioned not to place undue reliance on forward-looking statements, which speak only as of the date hereof. We undertake no obligation to publicly update or revise any forward-looking statements after the date they are made, whether as a result of new information, future events or otherwise. Undue reliance should not be placed on forward-looking statements as many of these factors are beyond our ability to control or predict.
PART I
ITEM 1. Business
MarkWest Energy Partners, L.P. is a publicly-traded Delaware limited partnership formed in January 2002. We are a master limited partnership engaged in the gathering, processing and transportation of natural gas; the gathering, transportation, fractionation, storage and marketing of NGLs; and the gathering and transportation of crude oil. We have a leading presence in many unconventional gas plays including the Marcellus Shale, Utica Shale, Huron/Berea Shale, Haynesville Shale, Woodford Shale and Granite Wash formation. We conduct our operations in the following operating segments: Marcellus, Utica, Northeast and Southwest. The Marcellus segment was formerly known as the Liberty segment. Maps detailing the individual assets can be found on our Internet website,www.markwest.com. For more information on these segments, seeOur Operating Segments discussion below.
The following table summarizes the operating performance for each segment for the year ended December 31, 2013 (amounts in thousands). For further discussion of our segments and a reconciliation
4
Table of Contents
to our consolidated statement of operations, see Note 24 of the accompanying Notes to Consolidated Financial Statements included in Item 8 of this Form 10-K.
| | | | | | | | | | | | | | | | |
| | Marcellus | | Utica | | Northeast | | Southwest | | Total | |
|---|
Revenue | | $ | 527,073 | | $ | 26,442 | | $ | 204,326 | | $ | 935,426 | | $ | 1,693,267 | |
Purchased product costs | | | (100,262 | ) | | — | | | (65,192 | ) | | (525,711 | ) | | (691,165 | ) |
| | | | | | | | | | | | |
| | | | | | | | | | | | | | | | | |
Net operating margin(1) | | | 426,811 | | | 26,442 | | | 139,134 | | | 409,715 | | | 1,002,102 | |
Facility expenses | | | (108,781 | ) | | (35,081 | ) | | (28,425 | ) | | (127,112 | ) | | (299,399 | ) |
Portion of operating loss (income) attributable to non-controlling interests | | | — | | | 3,499 | | | — | | | (21 | ) | | 3,478 | |
| | | | | | | | | | | | |
| | | | | | | | | | | | | | | | | |
Operating income (loss) before items not allocated to segments | | $ | 318,030 | | $ | (5,140 | ) | $ | 110,709 | | $ | 282,582 | | $ | 706,181 | |
| | | | | | | | | | | | |
| | | | | | | | | | | | | | | | | |
| | | | | | | | | | | | | | | | | |
| | | | | | | | | | | | |
- (1)
- Net operating margin is a non-GAAP financial measure. For a reconciliation of net operating margin to income from operations, the most comparable GAAP financial measure, seeNon-GAAP Measures discussion below.
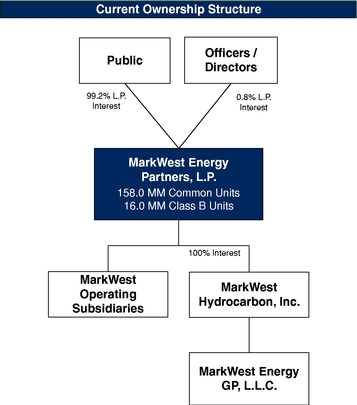
Organizational Structure
We are a master limited partnership with outstanding common units, Class A units and Class B units.
- •
- Our common units are publicly traded on the New York Stock Exchange under the symbol "MWE."
- •
- All of our Class A units are owned by MarkWest Hydrocarbon and our General Partner, which are wholly-owned subsidiaries, as a result of the ownership structure adopted after the February 2008 merger of the Partnership and MarkWest Hydrocarbon (the "Merger"). The Class A units generally share in our income or losses on a pro-rata basis with our common units and our Class B units, however the Class A units do not share in any income or losses that are attributable to our ownership interest (or disposition of such interest) in MarkWest Hydrocarbon. The only impact of the Class A units on our consolidated results of operations and financial position is that MarkWest Hydrocarbon pays income tax on its pro-rata share of our income or losses. The Class A units do not have voting rights, except as required by law.
- •
- All of our remaining Class B units were issued to and are held by M&R MWE Liberty LLC and certain of its affiliates ("M&R"), an affiliate of The Energy & Minerals Group ("EMG"), as part of our December 31, 2011 acquisition of the non-controlling interest in MarkWest Liberty Midstream & Resources, L.L.C. ("MarkWest Liberty Midstream"). Approximately 4.0 million Class B units converted to common units on July 1, 2013. The remaining Class B units will convert to common units on a one-for-one basis (the "Converted Units") in four equal installments beginning on July 1, 2014 and each of the next three anniversaries of such date. Class B units (i) share in our income and losses, (ii) are not entitled to participate in any distributions of available cash prior to their conversion and (iii) do not have the right to vote on, approve or disapprove, or otherwise consent to or not consent to any matter (including mergers, unit exchanges and similar statutory authorizations) other than those matters that disproportionately and adversely affect the rights and preferences of the Class B units. Upon conversion of the Class B units, the right of M&R and certain of its affiliates to vote as a common unitholder of the Partnership will be limited to a maximum of 5% of the Partnership's outstanding common units. Once converted, M&R will have the right to participate in the Partnership's underwritten offerings of our common units in an amount up to 20% of the total number of common units offered and will have comparable rights to participate in an amount up
5
Table of Contents
to 20% of the total number of common units sold pursuant to any continuous equity or similar program that is implemented or effective during any period after the conversion of Class B units. With respect to the first tranche of Converted Units that converted on July 1, 2013, M&R agreed to reduce its participation rights such that M&R will not exceed 10% for offerings under our continuous equity programs. In addition, M&R will have the right to demand that we conduct up to three underwritten offerings beginning in 2017, but restricted to no more than one offering in any twelve-month period. M&R also has limited rights to distribute an aggregate of 2,500,000 common units to its members and their limited partners beginning in 2016. Except as described above, M&R is not permitted to transfer its Class B units or Converted Units without the prior written consent of the General Partner's board of directors (the "Board").
The following table provides the aggregate number of units and relative ownership interests of the Class A and B units and common units as of February 19, 2014 (units in millions):
| | | | | | | |
| | Units | | % | |
|---|
Common units | | | 158.0 | | | 80.4 | % |
Class A units | | | 22.6 | | | 11.5 | % |
Class B units | | | 16.0 | | | 8.1 | % |
| | | | | | |
| | | | | | | | |
Total units | | | 196.6 | | | 100.0 | % |
| | | | | | |
| | | | | | | | |
| | | | | | | | |
| | | | | | |
The Class A units are not treated as outstanding common units in the accompanying Consolidated Balance Sheets as they are all held by our wholly owned subsidiaries and therefore eliminated in consolidation. The ownership percentages as of February 19, 2014 in the graphic depicted below reflect the Partnership structure from the basis of the consolidated financial statements with the Class A units eliminated in consolidation. All Class B units are owned by M&R and included in the public ownership percentage.
6
Table of Contents
The primary benefit of our organizational structure is the absence of incentive distribution rights, which represents a general partner's right to receive an increasing percentage of quarterly distributions of available cash after a minimum quarterly distribution and certain target distribution levels had been achieved. The absence of incentive distribution rights substantially lowers our cost of equity capital and increases the cash available to be distributed to our common unitholders. This enhances our ability to compete for organic growth projects and new acquisitions and improves the returns to our unitholders on all future expansion projects.
Key Developments
Expansion of Marcellus Shale
During 2013, we continued to expand our pipeline infrastructure in the liquids rich acreage of the Marcellus Shale. We finished construction of approximately 200 miles of additional pipeline bringing the total miles of gathering and NGL product pipelines to approximately 510 miles. During 2013, we gathered over 549 MMcf/d of gas for our producer customers.
During 2013, we completed construction and commenced operations of six new cryogenic facilities with a total processing capacity of 1.1 Bcf/d bringing our current processing capacity in the Marcellus Shale to over 2.2 Bcf/d. A summary of these processing expansions are included below.
- •
- At our processing complex in Marshall County, West Virginia ("Majorsville Complex"), we commenced operations of Majorsville III, a 200 MMcf/d processing facility, during the second quarter of 2013, and Majorsville V, another 200 MMcf/d processing facility, during the fourth quarter of 2013. Majorsville IV, an additional 200 MMcf/d processing facility, is expected to commence operations in the second quarter of 2014. Majorsville VI, an additional 200 MMcf/d processing facility, is expected to commence operations in 2016. With the completion of Majorsville III and Majorsville V, the 670 MMcf/d of current capacity at the Majorsville Complex is supported by long-term fee based agreements with Chesapeake Energy Corporation ("Chesapeake"), Consol Energy, Inc. ("CNX"), Noble Energy, Inc. ("Noble"), Range Resources Corporation ("Range"), and Statoil ASA ("Statoil").
- •
- At our processing complex in Wetzel County, West Virginia ("Mobley Complex"), we commenced operations of Mobley II during the first quarter 2013, a 120 MMcf/d processing facility, and Mobley III during the fourth quarter of 2013, a 200 MMcf/d processing facility. The Mobley Complex is supported by long-term, fee-based agreements with EQT Corporation ("EQT"), Magnum Hunter Resources Corporation ("Magnum Hunter") and Stone Energy Corporation ("Stone Energy"). With the completion of Mobley II and Mobley III, the total capacity of the Mobley Complex is currently 520 MMcf/d. In August 2013, we announced an additional expansion of the Mobley Complex to support EQT and other producers' rich-gas development. This new 200 MMcf/d processing facility is currently scheduled to begin operations in the fourth quarter of 2014.
- •
- At our processing complex in Doddridge County, West Virginia ("Sherwood Complex"), we commenced operations of Sherwood II, a 200 MMcf/d processing facility, during the second quarter of 2013 and Sherwood III, another 200 MMcf/d processing facility, during the fourth quarter of 2013. The Sherwood Complex is supported by long-term, fee-based agreements with Antero Resources Corporation ("Antero"). The total processing capacity at the Sherwood Complex is currently 600 MMcf/d. Antero has contractually committed to an additional expansion of the Sherwood Complex with two additional 200 MMcf/d processing facilities which will bring the total processing capacity at the Sherwood Complex to 1.0 Bcf/d by the third quarter of 2014.
7
Table of Contents
Expansion of Utica Shale
During 2013, Ohio Gathering Company, LLC ("Ohio Gathering"), a subsidiary of MarkWest Utica EMG, LLC ("MarkWest Utica EMG"), a joint venture between MarkWest and EMG, continued to expand its gathering system in the core acreage of the Utica Shale in eastern Ohio. Ohio Gathering ended 2013 with over 230 miles of gathering pipeline and gathered over 60 MMcf/d of gas for producer customers. The gathering system is expected to continue to grow significantly as Gulfport Energy Corporation ("Gulfport"), an anchor customer, further develops its 147,000 acres under lease in both the liquids rich and prolific dry gas areas of the Utica Shale. Summit Midstream Partners ("Summit") has an option to exercise its option to acquire a 40% interest in Ohio Gathering. If the option is exercised, the capital contributed by Summit will support the ongoing expansion of our Utica Shale operations through Ohio Gathering and MarkWest Utica EMG. See Note 3 to the accompanying Notes to Consolidated Financial Statements included in Item 8 of this Form 10-K for further discussion of Summit's option.
During 2013, MarkWest Utica EMG completed construction and commenced operation of two cryogenic processing facilities with a total capacity of 325 MMcf/d bringing the total processing capacity in the Utica Shale to 385 MMcf/d. The new processing capacity includes a 125 MMcf/d facility at a complex in Harrison County, Ohio ("Cadiz Complex") and a 200 MMcf/d processing facility at a complex in Noble County, Ohio ("Seneca Complex"). In January 2014, another 200 MMcf/d processing facility was completed at a Seneca Complex. In addition to the long-term fee based agreements executed in 2012 with Antero and Gulfport, MarkWest Utica EMG has executed several additional agreements supporting the growth of our Utica Shale operations in 2013 that are summarized below:
- •
- In the first quarter of 2013, MarkWest Utica EMG executed definitive agreements with Rex Energy Corporation ("Rex") and PDC Energy, Inc. ("PDC") to provide gathering, processing, fractionation and marketing services in the Utica Shale. MarkWest Utica EMG began providing comprehensive midstream services to Rex and PDC in the second half of 2013.
- •
- In May 2013, MarkWest Utica EMG executed definitive agreements with CNX and two additional producers to provide processing, fractionation and marketing services in the Utica Shale.
- •
- In June 2013, MarkWest Utica EMG executed additional agreements with Antero to support development of Seneca III, a 200 MMcf/d processing facility at the Seneca Complex. Seneca III is scheduled to be operational during the second quarter of 2014. Antero executed a new agreement in January 2014 for another 200 MMcf/d processing facility, Seneca IV, which is scheduled to be operational during the first quarter of 2015.
Commencement of Ethane Solutions for Marcellus and Utica Producers
During 2013, we commenced operations of two large scale de-ethanization facilities in the northeast United States with a 38,000 Bbl/d de-ethanization unit at our Houston Complex located in Washington County, Pennsylvania ("Houston Complex") and a 38,000 Bbl/d de-ethanization unit at our Majorsville Complex. These de-ethanization facilities are connected by a purity ethane pipeline and currently support deliveries of purity ethane into two downstream pipelines, one of which is Sunoco Logistics Partners, L.P.'s ("Sunoco") pipeline to Sarnia, Ontario, Canada markets ("Mariner West") that commenced operations in the fourth quarter of 2013, and the other of which is Enterprise Products Partners L.P.'s NGL pipeline from Appalachia to Texas ("ATEX Pipeline"). We are also constructing a 40,000 Bbl/d de-ethanization unit at our Cadiz Complex that is expected to commence operation in the second quarter of 2014 and will connect to the ATEX Pipeline. Our continued development of de-ethanization facilities will provide our Marcellus and Utica producer customers with access to all of the ethane pipeline projects in the northeast. This will be critical in supporting their
8
Table of Contents
ability to meet residue gas pipeline specifications as well as helping them meet their downstream obligations to deliver purity ethane.
Additional Fractionation Capacity for Marcellus and Utica Segments
In January 2014, we completed construction and commenced operation of a 60,000 Bbl/d propane and heavier fractionation facility in Harrison County, Ohio approximately 11 miles from our Cadiz processing facility ("Hopedale Fractionation Facility"). The Hopedale Fractionation Facility is currently owned 60% and 40% by MarkWest Liberty Midstream and MarkWest Utica EMG, respectively. The Hopedale Fractionation Facility also has over 230,000 barrels of purity product storage, a 24-bay rail car loading facility with slots to accommodate 200 rail cars and truck loading and off loading facilities. An NGL pipeline network connecting the Hopedale Fractionation Facility to the Marcellus and Utica processing complexes allows us to fractionate NGLs produced in both shale plays and, combined with our 60,000 Bbl/d fractionation facility in Washington County, Pennsylvania ("Houston Fractionation Facility"), allows for the operation of the largest integrated fractionation facilities in the northeast United States. By integrating two industry-leading midstream systems, we have expanded the fractionation capacity for our Marcellus and Utica producers.
Condensate Stabilization Joint Venture
In December 2013, we and EMG announced the execution of definitive agreements with Gulfport to provide stabilization services and potential gathering services for condensate produced within an area that includes Belmont, Harrison, Guernsey, Noble and Monroe counties, Ohio. Gulfport is developing their acreage within the wet gas, retrograde condensate and oil windows of the emerging Utica Shale and currently has over 147,000 net acres under lease. In conjunction with these agreements, we formed a new joint venture with EMG called MarkWest Utica EMG Condensate, L.L.C. ("MarkWest Utica EMG Condensate") and its subsidiary, Ohio Condensate Company, LLC ("Ohio Condensate") which are related to the development of industry-leading facilities and services to support the rapid growth of condensate production occurring in the liquids-rich areas of the Utica Shale. Discussions regarding Ohio Condensate's condensate solutions are also underway with numerous other Utica producers. Summit also has an option to acquire a 40% interest in Ohio Condensate. See Note 3 to the accompanying Notes to Consolidated Financial Statements included in Item 8 of this Form 10-K for further discussion of Summit's option.
The initial infrastructure development will consist of a new condensate stabilization facility, with associated logistics and storage terminal capabilities to be constructed in Harrison County, Ohio and is expected to be placed in service by the third quarter of 2014. The facility will have initial stabilization capacity of 23,000 Bbl/d. The facility will be co-located and fully integrated with condensate storage, and a truck and rail loading terminal that will be constructed and operated by a subsidiary of Toledo, Ohio-based Midwest Terminals of Toledo International, Inc. and will exclusively serve Ohio Condensate. Raw condensate will be trucked to and stabilized at the facility. Once stabilized, the condensate will be transported by truck and rail to local refinery markets and Canadian export markets. The stabilization facility will serve as the origin for a planned third-party condensate pipeline project that is expected to terminate near Canton, Ohio.
Kinder Morgan NGL Pipeline Joint Venture
In August 2013, Kinder Morgan Energy Partners, L.P. ("Kinder Morgan") and MarkWest Utica EMG signed a non-binding letter of intent regarding the parties' negotiations to form a midstream joint venture to pursue three potential projects to support producers in the Utica and Marcellus shales in Ohio, Pennsylvania and West Virginia. One project would consist of the development of a 400 MMcf/d cryogenic processing complex in Tuscarawas County, Ohio ("Tuscarawas Complex"), utilizing an existing 220-acre site that Kinder Morgan has an option to acquire. The second project would consist of the
9
Table of Contents
development of a C2+ NGL pipeline that would originate at the Tuscarawas Complex in Ohio and transport NGLs to Gulf Coast fractionation facilities. The third joint project would involve the development of new fractionation facilities as well as the utilization of third-party fractionation facilities throughout the Gulf Coast region.
Expansion of Southwest Operations
In May 2013, we acquired midstream assets in the Texas Panhandle and western Oklahoma from a wholly owned subsidiary of Chesapeake for consideration of $225.2 million in cash ("Buffalo Creek Acquisition"). In conjunction with the Buffalo Creek Acquisition, the Partnership executed long-term, fee-based agreements with Chesapeake for gas gathering and processing services. As part of the fee-based gas processing agreement, Chesapeake has dedicated to the Partnership approximately 130,000 acres throughout the Anadarko Basin.
In May 2013, we executed a long-term fee-based agreement with Newfield Exploration Co. ("Newfield") to develop rich-gas gathering facilities in the Eagle Ford Shale. The Partnership will construct gathering pipelines, field compression and terminalling facilities to support production from Newfield's West Asherton project in Dimmit County, Texas.
SeeOur Operating Segments below for additional discussion of our existing operations and planned expansions.
Business Strategy
Our primary business strategy is to provide top-tier midstream services by developing and operating high-quality, strategically located assets in the liquids-rich areas of six core natural gas producing resource plays in the United States. We plan to accomplish this through the following:
- •
- Developing long-term integrated relationships with our producer customers. As the top-rated midstream service provider according to three of the last four surveys completed by an independent research company, we work to develop long-term, integrated relationships with key producer customers as evidenced by our relationships with the primary producers in the Marcellus Shale, Utica Shale, Huron/Berea Shale, Haynesville Shale, Woodford Shale and Granite Wash formations. We continue to build relationships characterized by joint planning for the development of liquids-rich resource plays and our commitment to grow to meet the specific needs of our customers, including the development of advantageous marketing strategies for our producer customers' NGLs and natural gas.
- •
- Expanding operations through organic growth projects. By expanding our existing infrastructure and customer relationships, we intend to continue growing in our primary areas of operation to meet the anticipated demand for additional midstream services. From January 1, 2011 through December 31, 2013, we have spent approximately $4.9 billion on capital expenditures to develop midstream infrastructure in the Marcellus and Utica Shale regions, have placed into service approximately 2.6 Bcf/d of processing capacity and have constructed hundreds of miles of gathering lines. During that time, we also executed long-term agreements with producers that have supported or will support the construction of 22 new processing plants primarily in the Marcellus and Utica Shale regions, which we expect will increase our total company-wide processing capacity by the end of 2014 by approximately 468% since the end of 2010.
- •
- Expanding operations through strategic acquisitions. We have completed a significant strategic acquisition in each of the last three years to support our growth in the Marcellus, Northeast and Southwest segments. We intend to continue pursuing strategic acquisitions of assets and businesses in our existing areas of operation that leverage our current asset base, personnel and customer relationships. We may also seek to acquire assets in regions outside of our current areas of operation.
10
Table of Contents
- •
- Maintaining our financial flexibility. Our goal is to maintain a capital structure that provides us flexibility to achieve our long-term growth strategy and ultimately achieve investment grade metrics. We currently have access to the capital markets through short term borrowings on our Credit Facility, long-term debt, and access to equity financing. Since January 1, 2011, we have raised over $4.4 billion of equity financing and over $1.6 billion of long-term debt financing, net of redemptions. We plan to continue to strategically access the debt and equity markets. During 2013, we accessed the equity markets through a series of continuous offering programs whereby common units are sold periodically, generally through ordinary brokers' transactions at market prices or in block transactions ("ATM" programs). As of February 19, 2014, we have the ability to raise approximately $275.4 million under our September 2013 ATM program. In addition, we filed a registration statement with the SEC on February 18, 2014 in order to register up to $1.2 billion of additional common units which may be sold under a new ATM program. The registration statement is expected be effective pending review and approval by the SEC. See Note 16 and Note 17 of the accompanying Notes to Consolidated Financial Statements included in Item 8 of this Form 10-K for further discussion of the recent transactions related to our senior notes and common unit offerings. As of December 31, 2013, we and our wholly-owned subsidiaries had approximately $85.3 million of cash and cash equivalents and we had approximately $1,188.7 million of unused capacity under our Credit Facility, of which approximately $704.8 million was available for borrowing based on financial covenant requirements. Additionally, the full amount of unused capacity is available for borrowing on a short-term basis to provide financial flexibility within a given fiscal quarter. We believe that our Credit Facility, our ability to issue additional partnership units and long-term debt, our strong relationships with our existing joint venture partners, the ability to develop additional joint venture relationships and the sale of non-strategic assets will provide us with the financial flexibility to facilitate the execution of our business strategy.
- •
- Reducing the sensitivity of our cash flows to commodity price fluctuations. We intend to continue to secure long-term, fee-based contracts in order to further reduce our exposure to short-term changes in commodity prices. During 2013, fee based contracts accounted for approximately 61% of our net operating margin and we estimate that this percentage will increase to approximately 70% for the full year ended December 31, 2014. For the remaining part of our business that is subject to commodity price exposure, we engage in risk management activities in order to reduce the effect of volatility in future natural gas, NGL and crude oil prices. We generally utilize swaps and options traded on the OTC market and fixed-price forward contracts. We monitor these activities to ensure compliance with our commodity risk management policy. See Note 7 of the accompanying Notes to the Consolidated Financial Statements included in Item 8 of this Form 10-K for further discussion of our commodity risk management policy.
- •
- Increasing utilization of our facilities. We seek to increase the utilization of our existing facilities by providing additional services to our existing customers and by establishing relationships with new customers.
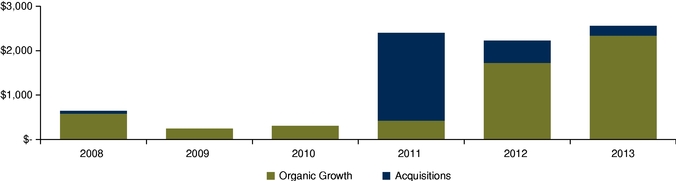
Execution of our business strategy has allowed us to grow substantially since our inception. The majority of our growth since 2007 has focused on the development of midstream services to support the increase in NGL production and natural gas supply in liquids-rich resource plays. As a result, we now have a strong presence in the Marcellus Shale, Utica Shale, Huron/Berea Shale, Haynesville Shale, Woodford Shale and Granite Wash formation; six critical resource plays that are a significant source of domestic natural gas and NGL production. The following table summarizes the magnitude of our expenditures over time on acquisitions of businesses and non-controlling interests and on internally developed projects, including equity investments (in millions). The amounts include the portion of our growth projects funded by contributions from our current and former joint venture partners.
11
Table of Contents
We believe that the following competitive strengths position us to continue to successfully execute our primary business strategy:
- •
- Leading position in the liquids-rich areas of the northeast United States. Since our inception, we have been the largest processor and fractionator in the northeast United States and we continue to strengthen our position in the critical growth areas that are driven by the development of the Marcellus, Utica, and Huron/Berea shale formations. As of February 19, 2014, our Marcellus, Utica and Northeast segments have combined processing capacity in excess of 3.4 Bcf/d and combined fractionation capacity of approximately 220,000 Bbl/d which includes de-ethanization capacity of 76,000 Bbl/d, as well as an integrated NGL pipeline, storage and marketing infrastructure. Our processing and fractionation capacity is supported by strategic long-term agreements that include significant acreage dedications from key producers. We believe our significant presence and asset base provide us with a competitive advantage in capturing and contracting for new supplies of natural gas as the production from these shale formations continues to be developed. From now until 2040, shale gas production is expected to increase by 55% and will account for 53% of the total United States natural gas supply by 2040 according to the U.S. Energy Information Administration,Annual Energy Outlook. We plan to continue to focus our business in these resource plays.
- •
- Strategic and growing position with high-quality assets in the Southwestern United States. Our internally developed growth projects have allowed us to expand our presence in several long-lived natural gas supply basins in the southwest, particularly in Texas and Oklahoma. All of our major operating assets and growth projects in this region have been characterized by several common critical success factors that include:
- •
- an existing strong competitive position;
- •
- access to a significant reserve or customer base with a stable or growing production profile;
- •
- ample opportunities for long-term continued organic growth;
- •
- ready access to markets; and
- •
- close proximity to other expansion opportunities.
Specifically, our East Texas and Appleby gathering systems are located in East Texas, producing from or with direct access to the Cotton Valley, Pettit and Travis Peak reservoirs as well as the Haynesville and Bossier shales. Our Foss Lake gathering system and the associated expanded Arapaho gas processing plants are located in the Anadarko Basin in Oklahoma and Texas and are connected to the Granite Wash area in the Texas panhandle. Additionally, we have a significant gathering system located in the Woodford Shale reservoir. Our gathering systems have been constructed within the last 15 years and provide producers with low-pressure and fuel-efficient service, a significant competitive advantage for us over many competing gathering systems in those areas. We also provide high quality processing and fractionation service to six
12
Table of Contents
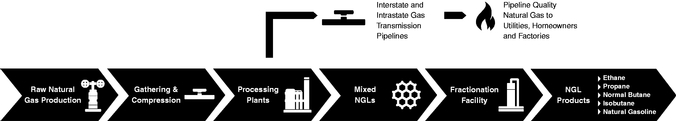
Industry Overview
We provide services in the midstream sector of the natural gas industry. The midstream natural gas industry is the link between the exploration for and production of natural gas and the delivery of its hydrocarbon components to end-use markets. Operators within this industry create value at various stages along the natural gas value chain by gathering raw natural gas from producers at the wellhead, separating the hydrocarbons into dry gas (primarily methane) and NGLs, and then routing the separated dry gas and NGL streams for delivery to end-use markets or to the next intermediate stage of the value chain. The following diagram illustrates the assets and processes found along the natural gas value chain:
Service Types
The services provided by us and other midstream natural gas companies are generally classified into the categories described below.
- •
- Gathering. The natural gas production process begins with the drilling of wells into gas-bearing rock formations. At the initial stages of the midstream value chain, a network of typically smaller diameter pipelines known as gathering systems directly connect to wellheads in the production area. These gathering systems transport raw, or untreated, natural gas to a central location for treating and processing. A large gathering system may involve thousands of miles of gathering lines connected to thousands of wells. Gathering systems are typically designed to be highly
13
Table of Contents
Historically, the majority of the domestic on-shore natural gas supply has been produced from conventional reservoirs that are characterized by large pockets of natural gas that are accessed using vertical drilling techniques. In the past decade, the supply of natural gas production from the conventional sources has declined as these reservoirs are being depleted. Due to advances in well completion technology and horizontal drilling techniques, unconventional sources such as shale and tight sand formations, have become the most significant source of current and expected future natural gas production. The industry as a whole is characterized by regional competition, based on the proximity of gathering systems and processing plants to producing natural gas wells, or to facilities that produce natural gas as a byproduct of refining crude oil. Due to the shift in the source of natural gas production, midstream providers with a significant presence in the shale plays will likely have a competitive advantage. From now until 2040, shale gas production is expected to increase by 55% and will account for 53% of the total United States natural gas supply by 2040 according to the U.S. Energy Information Administration,Annual Energy Outlook.
14
Table of Contents
Basic NGL products and their typical uses are discussed below. The basic products are sold in all of our segments except as noted.
- •
- Ethane is used primarily as feedstock in the production of ethylene, one of the basic building blocks for a wide range of plastics and other chemical products.
- •
- Propane is used for heating, engine and industrial fuels, agricultural burning and drying and as a petrochemical feedstock for the production of ethylene and propylene. Propane is principally used as a fuel in our operating areas.
- •
- Normal butane is mainly used for gasoline blending, as a fuel gas, either alone or in a mixture with propane, and as a feedstock for the manufacture of ethylene and butadiene, a key ingredient of synthetic rubber.
- •
- Isobutane is primarily used by refiners to enhance the octane content of motor gasoline.
- •
- Natural gasoline is principally used as a motor gasoline blend stock or petrochemical feedstock.
The other primary products produced and sold from our Javelina facility are discussed below.
- •
- Ethylene is primarily used in the production of a wide range of plastics and other chemical products.
- •
- Propylene is primarily used in manufacturing plastics, synthetic fibers and foams. It is also used in the manufacture of polypropylene, which has a variety of end-uses including packaging film, carpet and upholstery fibers and plastic parts for appliances, automobiles, housewares and medical products.
Our Operating Segments
We conduct our operations in the following operating segments: Marcellus, Utica, Northeast and Southwest. Our assets and operations in each of these segments are described below.
Marcellus Segment
In our Marcellus segment, we provide fully integrated natural gas midstream services in southwestern Pennsylvania and northern West Virginia through our wholly owned subsidiary, MarkWest Liberty Midstream. With a total current processing capacity of over 2.2 Bcf/d, we are the largest processor of natural gas in the Marcellus Shale, and have fully integrated gathering, processing, fractionation, storage and marketing operations that support the growing the liquids-rich natural gas production in the northeast United States.
We currently operate five processing complexes in our Marcellus segment that include the Houston Complex located in Washington County, Pennsylvania: the Majorsville Complex located in Marshall County, West Virginia; the Mobley Complex located in Wetzel County, West Virginia; the Sherwood Complex located in Doddridge County, West Virginia; and the Keystone Complex located in Butler County, Pennsylvania. In addition, we operate two gathering systems: one currently delivering over 475 MMcf/d of natural gas to our Houston and Majorsville Complexes and the other delivering over 74 MMcf/d of natural gas to our Keystone complex. The gathering and processing capacity at these
15
Table of Contents
facilities are supported by long-term fee-based agreements with ten major producer customers. The following table summarizes our current and planned operations at these facilities:
| | | | | | | | | | |
Complex | | Existing
capacity
(MMcf/d) | | Expansion
capacity under
construction
(MMcf/d) | | Expected
in-service of
expansion
capacity | | Key producer
customers |
|---|
Houston Complex | | |
355 | | |
200 | | Q1 2015 | | Range |
Majorsville Complex | | |
670 | | |
400 | | 200—Q2 2014
200—2016 | | Chesapeake
CNX
Noble
Range
Statoil |
Mobley Complex | | |
520 | | |
200 | | Q4 2014 | | CNX
EQT
Magnum Hunter
Noble
Stone Energy |
Sherwood Complex | | |
600 | | |
400 | | 200—Q2 2014
200—Q3 2014 | | Antero
CNX
Noble |
Keystone Complex | | |
90 | | |
120 | | Q2 2014 | | Rex |
| | | | | | | | | |
| | | | | | | | | | | |
Total | | | 2,235 | | | 1,320 | | | | |
| | | | | | | | | |
| | | | | | | | | | | |
| | | | | | | | | | | |
| | | | | | | | | |
NGL Gathering and Fractionation Facilities and Market Outlets
We currently operate 120,000 Bbl/d of combined propane and heavier fractionation capacity at the Houston Fractionation Facility and the Hopedale Fractionation Facility.
The NGLs produced at our Majorsville Complex, Mobley Complex, Sherwood Complex and a third-party's Fort Beeler processing facility are gathered to the Houston Fractionation Facility or to the Hopedale Fractionation Facility through a system of NGL pipelines to allow for fractionation into purity NGL products. We also operate a truck loading facility that allows for the receipt and fractionation of NGLs from other facilities. Our Houston Complex also has the following infrastructure to provide our customers with marketing and storage services:
- •
- An interconnect with a key interstate pipeline provides a market outlet and storage for the propane produced from this region.
- •
- A large-scale railcar loading facility that expands our market access and allows for long-haul, cost-effective transportation of purity NGLs.
- •
- Significant truck loading facilities that allow for regional marketing of purity NGLs.
- •
- Our access to international markets provides additional outlets. Propane is currently being transported by truck or rail to Sunoco's terminal near Philadelphia, Pennsylvania where it is loaded onto marine vessels and delivered to international markets. We expect to have the ability to deliver propane to Sunoco's terminal in Philadelphia via pipeline once Sunoco's Mariner East project ("Mariner East"), a pipeline and marine project that is expected to originate at our Houston Complex, is placed into service. We expect to begin delivering propane to the marine terminal via pipeline in the second half of 2014.
16
Table of Contents
In January 2014, we commenced operation of our Hopedale Fractionation Facility, a 60,000 Bbl/d facility in Harrison County, Ohio. The Hopedale Fractionation Facility is connected to our extensive processing system in our Marcellus segment via a NGL gathering pipeline from the Majorsville Complex and is utilized to fractionate NGLs produced in both our Marcellus and Utica segment. The Hopedale Fractionation Facility is currently owned 60% by the Marcellus segment and 40% by the Utica segment. A large-scale rail car loading facility and truck loading and unloading facility at the Hopedale Fractionation Facility was completed in the first quarter of 2014, and we currently market NGLs by truck and rail.
We are also constructing additional partial fractionation capacity of 10,000 Bbl/d at our Keystone Complex for propane and rail facilities that will transport heavier NGL products for further fractionation at our other fractionation facilities. We expect to begin operations of the propane fractionation at our Keystone Complex in the second quarter of 2014.
Our fractionation facilities are supported by long-term fee-based agreements with our key producer customers.
Ethane Recovery and Associated Market Outlets
Due to increased natural gas production from the liquids-rich area of the Marcellus Shale, natural gas processors must begin to recover a significant amount of ethane from the gas stream to meet the pipeline gas quality specifications for residue gas and to allow for the ability to benefit from the potential price uplift received from the sale of ethane. We have commenced operations of two large scale de-ethanization facilities in the northeastern United States and plan to continue to expand our de-ethanization capabilities. The following table summarizes our current and planned de-ethanization facilities, which are expected to be connected by a network of purity ethane pipelines:
| | | | | | |
Location | | Status/
Expected in Service | | Capacity
(Bbl/d) | |
|---|
Houston Complex | | In service | | | 38,000 | |
Majorsville Complex | | In service | | | 38,000 | |
Mobley Complex | | Q3 2015 | | | 40,000 | |
Keystone Complex | | Q2 2014 | | | 10,000 | |
| | | | | | |
| | | | | | | |
Total | | | | | 126,000 | |
| | | | | | |
| | | | | | | |
| | | | | | | |
| | | | | | |
Market Outlets
- •
- We began delivering ethane to the Mariner West pipeline in the fourth quarter of 2013.
- •
- We began delivering ethane to the ATEX Pipeline as line fill in the fourth quarter of 2013, and began commercial deliveries in February 2014.
- •
- Sunoco's Mariner East project discussed above is also intended to deliver Marcellus purity ethane to the Gulf Coast and international markets via Sunoco's marine terminal near Philadelphia, Pennsylvania. Mariner East is expected to begin delivering ethane in the first half of 2015.
Revenue earned from gathering and processing fees from Range are significant to the segment, accounting for 34.9% of the segment revenue and 10.9% of consolidated revenue. We perform substantially all of our gathering and processing services for Range under a long-term contract which expires in April 2024.
17
Table of Contents
Utica Segment
MarkWest Utica EMG provides gathering, processing, fractionation and marketing services in the liquids-rich corridor of the Utica Shale in eastern Ohio. MarkWest Utica EMG Condensate was formed in December 2013 and is expected to begin providing condensate stabilization and terminaling services in late 2014.
The Utica segment operates two processing complexes in the Utica Shale with a total capacity of approximately 585 MMcf/d; the Cadiz Complex and the Seneca Complex in Noble County, Ohio. In addition, we continue to expand our gathering system which currently spans more than 230 miles and delivers natural gas to both of the processing complexes. Our gathering and processing facilities are supported by long-term fee based agreements with several key producers in the Utica Shale. The following table summarizes our current and planned operations at these facilities:
| | | | | | | | | | | |
Complex | | Existing
capacity
(MMcf/d) | | Expansion
capacity under
construction
(MMcf/d) | | Expected
in-service of
expansion
capacity | | Key
producer
customers(1) |
|---|
Cadiz Complex(2) | | | 185 | | | 200 | | | 200—Q3 2014 | | Antero
Gulfport
PDC
Rex |
Seneca Complex(3) | | | 400 | | | 400 | | | 200—Q2 2014
200—Q1 2015 | | |
| | | | | | | | | | |
| | | | | | | | | | | | |
Total | | | 585 | | | 600 | | | | | |
| | | | | | | | | | |
| | | | | | | | | | | | |
| | | | | | | | | | | | |
| | | | | | | | | | |
- (1)
- We have the operational flexibility to process for each of the key customers at either complex.
- (2)
- The existing capacity of the Cadiz Complex includes 60 MMcf/d of refrigeration capacity that is expected to be taken out of service as the additional cryogenic facilities are placed into service.
- (3)
- Seneca II was completed in January 2014.
Fractionation Facility and Market Outlets
Both the Cadiz Complex and Seneca Complex are connected via a NGL gathering pipeline system to the Hopedale Fractionation Facility. As discussed above, Hopedale Fractionation is a 60,000 Bbl/d facility that provides fractionation services for NGLs produced in the Utica and the Marcellus segments. A large-scale rail car loading facility and truck loading and unloading facility at the Hopedale Fractionation Facility were completed in the first quarter of 2014, and we currently market NGLs by truck, rail and pipeline.
Ethane Recovery and Associated Market Outlets
We are currently constructing a 40,000 Bbl/d de-ethanization facility at our Cadiz Complex that is expected to be complete in the second quarter of 2014. Ethane produced at our Cadiz Complex will be committed to the ATEX Pipeline.
The Utica segment has three individual customers that account for 67.4%, 16.8% and 11.5% of its segment revenue, respectively. None of these customers account for a significant portion of our consolidated revenues.
18
Table of Contents
Northeast Segment
- •
- Kentucky and southern West Virginia. Our Northeast segment assets include the Kenova, Boldman, Cobb, Kermit and Langley natural gas processing complexes, a NGL pipeline and the Siloam fractionation facility. The Siloam fractionation facility can also be used to provide fractionation services to customers in the Marcellus and Utica Shales. In addition, we have two caverns for storing propane at our Siloam facility and we have additional propane storage capacity under a firm-capacity agreement with a third-party.
- •
- Michigan. We own and operate a FERC-regulated crude oil pipeline in Michigan ("Michigan Crude Pipeline") providing interstate transportation service.
The Northeast segment has three customers that account for 19.7%, 10.3% and 10.1% of its segment revenue, respectively, but these customers do not account for a significant portion of our consolidated revenue. Additionally, all of the natural gas processed in the segment is attributable to three producers. The contract with one producer whose volumes accounted for approximately 28% of the segments net operating margin for the year ended December 31, 2013, expires on December 31, 2015.
Southwest Segment
- •
- East Texas. We own a system that consists of natural gas gathering pipelines, centralized compressor stations, two natural gas processing complexes and two NGL pipelines (the "East Texas System"). The East Texas system is located in Panola, Harrison and Rusk Counties. Producing formations in Panola County consist of the Cotton Valley, Pettit, Travis Peak, Haynesville and Bossier formations. An additional 120 MMcf/d processing facility is under construction and expected to be completed in the first quarter of 2015 which will bring our total East Texas processing capacity to 520 MMcf/d.
- •
- Oklahoma. We own gas gathering systems in the Granite Wash formation of western Oklahoma and the Texas panhandle, which are both connected to a natural gas processing complex in western Oklahoma. The gathering system includes centralized compression facilities. The majority of the gathered gas is ultimately compressed and delivered to the processing complex. In addition, we own an extensive natural gas gathering system in the Woodford Shale play in the Arkoma Basin of southeast Oklahoma. The liquids-rich natural gas gathered in the Woodford system is processed through Centrahoma Processing, LLC ("Centrahoma"), our equity investment, or other third-party processors. We have agreed to fund our share of a 120 MMcf/d processing plant expansion at Centrahoma in order to support the drilling programs in the Woodford Shale. The expansion is expected to be operational in the second quarter of 2014.
In May 2013, we completed the Buffalo Creek Acquisition. The acquired assets included a 200 MMcf/d cryogenic gas processing plant, 22 miles of gas gathering pipeline in Hemphill County, Texas and approximately 30 miles of rights-of-way for the construction of a high pressure gathering pipeline. Additional assets consist of an amine treating facility and a five-mile gas gathering pipeline in Washita County, Oklahoma. We entered into a long-term fee-based agreement to provide treating and processing and certain gathering and compression services for natural gas produced by Chesapeake from 130,000 dedicated acres throughout the Anadarko Basin. The Buffalo Creek processing facility and high pressure gathering pipeline commenced operation in February 2014.
- •
- Javelina. We own and operate the Javelina processing and fractionation facility in Corpus Christi, Texas that treats, processes and fractionates off-gas from six local refineries operated by three different refinery customers. We have a product supply agreement creating a long-term contractual obligation for the payment of processing fees in exchange for the entire product
19
Table of Contents
Approximately 71% of our Southwest segment volumes in 2013 resulted from contracts with ten producers. We sell substantially all of the NGLs produced in the western Oklahoma processing complex to ONEOK Hydrocarbon L.P. ("ONEOK") under a long-term contract. Such sales represented approximately 10.9% of our consolidated revenue in 2013. The initial term of the ONEOK agreement expires in October 2021.
The following summarizes the percentage of our revenue and net operating margin (a non-GAAP financial measure, seeNon-GAAP Measures discussion below) generated by our assets, by segment, for the year ended December 31, 2013:
| | | | | | | | | | | | | |
| | Marcellus | | Utica | | Northeast | | Southwest | |
|---|
Segment revenue | | | 31 | % | | 2 | % | | 12 | % | | 55 | % |
Net operating margin | | | 43 | % | | 3 | % | | 14 | % | | 40 | % |
For further financial information regarding our segments, see Item 7. Management's Discussion and Analysis of Financial Condition and Results of Operations and Item 8. Financial Statements and Supplementary Data included in this Form 10-K.
We own a 40% non-operating membership interest in Centrahoma, a joint venture with Atlas Pipeline Partners, L.P. ("Atlas") that is accounted for using the equity method. Centrahoma owns certain processing plants in the Arkoma Basin and Atlas operates an additional processing plant that is not owned by Centrahoma but is located adjacent to and operates in conjunction with the Centrahoma plants. We have signed long-term agreements to dedicate the processing rights for our natural gas gathering system in the Woodford Shale to Centrahoma and to Atlas' independently owned processing facility. The Centrahoma processing facility is being expanded by an additional 120 MMcf/d and the expansion is expected to be complete by the second quarter of 2014.
Through our joint venture, MarkWest Pioneer L.L.C. ("MarkWest Pioneer"), we operate the Arkoma Connector Pipeline, a 50-mile FERC-regulated pipeline in Oklahoma that is designed to provide approximately 638,000 Dth/d of Woodford Shale takeaway capacity and that interconnects with the Midcontinent Express Pipeline, Gulf Crossing Pipeline and Natural Gas Pipeline of America L.L.C.
20
Table of Contents
The financial results for Centrahoma and MarkWest Pioneer are included inEarnings from unconsolidated affiliates in our Consolidated Statements of Operations and are not included in our segment results. For a complete discussion of the formation of, and the accounting treatment for, MarkWest Pioneer, see Note 3 of the accompanying Notes to Consolidated Financial Statements included in Item 8 of this Form 10-K.
Our Contracts
We generate the majority of our revenues and net operating margin (a non-GAAP financial measure, seeNon-GAAP Measures below for discussion and reconciliation of net operating margin) from natural gas gathering, transportation and processing; NGL gathering, transportation, fractionation, exchange, marketing and storage; and crude oil gathering and transportation. We enter into a variety of contract types. In many cases, we provide services under contracts that contain a combination of more than one of the arrangements described below. We provide services under the following types of arrangements:
- •
- Fee-based arrangements: Under fee-based arrangements, we receive a fee or fees for one or more of the following services: gathering, processing and transportation of natural gas; transportation, gathering, fractionation, exchange, marketing and storage of NGLs; and gathering and transportation of crude oil. The revenue we earn from these arrangements is generally directly related to the volume of natural gas, NGLs or crude oil that flows through our systems and facilities and is not directly dependent on commodity prices. If a sustained decline in commodity prices were to result in a decline in volumes, however, our revenues from these arrangements would be reduced. In certain cases, our arrangements provide for minimum annual payments, fixed demand charges or fixed returns on gathering system expenditures.
- •
- Percent-of-proceeds arrangements: Under percent-of-proceeds arrangements, we gather and process natural gas on behalf of producers, sell the resulting residue gas, condensate and NGLs at market prices and remit to producers an agreed-upon percentage of the proceeds. In other cases, instead of remitting cash payments to the producer, we deliver an agreed-upon percentage of the residue gas and NGLs to the producer and sell the volumes we keep to third parties at market prices. The percentage of volumes that we retain can be either fixed or variable. Generally, under these types of arrangements, our revenues and net operating margins increase as natural gas, condensate and NGL prices increase and our revenues and net operating margins decrease as natural gas, condensate and NGL prices decrease.
- •
- Keep-whole arrangements: Under keep-whole arrangements, we gather natural gas for the producer, process the natural gas and sell the resulting condensate and NGLs to third parties at market prices. Because the extraction of NGLs from the natural gas during processing reduces the Btu content of the natural gas, we must either purchase natural gas at market prices for return to producers or make cash payment to the producers equal to the energy content of this natural gas. Certain keep-whole arrangements also have provisions that require us to share a percentage of the keep-whole profits with the producers based on the oil to gas ratio or the relative price of NGLs to natural gas. Accordingly, under these arrangements our revenues and net operating margins increase as the price of condensate and NGLs increases relative to the price of natural gas and decrease as the price of condensate and NGLs decrease relative to the price of natural gas.
- •
- Percent-of-index arrangements: Under percent-of-index arrangements, we purchase natural gas at either (i) a percentage discount to a specified index price, (ii) a specified index price less a fixed amount or (iii) a percentage discount to a specified index price less an additional fixed amount. We then gather and deliver the natural gas to pipelines where we resell the natural gas at the index price, or at a different percentage discount to the index price. With respect to (i) and (iii) above, the net operating margins we realize under the arrangements decrease in periods of low natural gas prices because these net operating margins are based on a percentage of the index price. Conversely, our net operating margins increase during periods of high natural gas prices.
21
Table of Contents
Under certain contracts, we are allowed to retain a fixed percentage of the volume gathered to cover the compression fuel charges and deemed-line losses. To the extent that we operate our gathering systems more or less efficiently than specified per contract allowance, we retain the benefit or loss for our own account.
The terms of our contracts vary based on gas quality conditions, the competitive environment when the contracts are signed and customer requirements. Our contract mix and, accordingly, our exposure to natural gas and NGL prices may change as a result of changes in producer preferences, our expansion in regions where some types of contracts are more common and other market factors, including current market and financial conditions which have increased the risk of volatility in oil, natural gas and NGL prices. Any change in mix may influence our long-term financial results.
Non-GAAP Measures
In evaluating the Partnership's financial performance, management utilizes the segment performance measures, segment revenues and operating income before items not allocated to segments. These financial measures are presented in Note 24 to the accompanying consolidated financial statements and are considered non-GAAP financial measures when presented outside of the notes to the consolidated financial statements. The use of these measures allows investors to understand how management evaluates financial performance to make operating decisions and allocate resources. See Note 24 to the accompanying consolidated financial statements for the reconciliations of segment revenue and operating income before items not allocated to segments to the respective most comparable GAAP measure.
Management evaluates contract performance on the basis of net operating margin (a non-GAAP financial measure), which is defined as revenue, excluding any derivative gain (loss), less purchased product costs, excluding any derivative gain (loss). These charges have been excluded for the purpose of enhancing the understanding by both management and investors of the underlying baseline operating performance of our contractual arrangements, which management uses to evaluate our financial performance for purposes of planning and forecasting. Net operating margin does not have any standardized definition and, therefore, is unlikely to be comparable to similar measures presented by other reporting companies. Net operating margin results should not be evaluated in isolation of, or as a substitute for, our financial results prepared in accordance with GAAP. Our use of net operating margin and the underlying methodology in excluding certain charges is not necessarily an indication of the results of operations expected in the future, or that we will not, in fact, incur such charges in future periods.
22
Table of Contents
The following is a reconciliation of net operating margin to income from operations, the most comparable GAAP financial measure of this non-GAAP financial measure (in thousands):
| | | | | | | | | | |
| | Year ended December 31, | |
|---|
| | 2013 | | 2012(1) | | 2011(1) | |
|---|
Segment revenue | | $ | 1,693,267 | | $ | 1,389,214 | | $ | 1,536,539 | |
Purchased product costs | | | (691,165 | ) | | (530,328 | ) | | (682,370 | ) |
| | | | | | | | |
| | | | | | | | | | | |
Net operating margin | | | 1,002,102 | | | 858,886 | | | 854,169 | |
Facility expenses | | | (291,069 | ) | | (206,861 | ) | | (171,497 | ) |
Derivative (loss) gain | | | (25,770 | ) | | 69,126 | | | (75,515 | ) |
Revenue deferral adjustment and other | | | (6,182 | ) | | (5,935 | ) | | (13,947 | ) |
Selling, general and administrative expenses | | | (101,549 | ) | | (93,444 | ) | | (80,441 | ) |
Depreciation | | | (299,884 | ) | | (183,250 | ) | | (143,704 | ) |
Amortization of intangible assets | | | (64,644 | ) | | (53,320 | ) | | (43,617 | ) |
Gain (loss) on disposal of property, plant and equipment | | | 33,763 | | | (6,254 | ) | | (8,797 | ) |
Accretion of asset retirement obligations | | | (824 | ) | | (672 | ) | | (1,185 | ) |
| | | | | | | | |
| | | | | | | | | | | |
Income from operations | | $ | 245,943 | | $ | 378,276 | | $ | 315,466 | |
| | | | | | | | |
| | | | | | | | | | | |
| | | | | | | | | | | |
| | | | | | | | |
- (1)
- The non-GAAP financial measure has been restated to reflect the deconsolidation of MarkWest Pioneer as discussed in Note 3 of these consolidated financial statements. The adjustments to the amounts previously reported were not material.
The following table does not give effect to our active commodity risk management program. For further discussion of how we manage commodity price volatility for the portion of our net operating margin that is not fee-based, see Note 7 of the accompanying Notes to the Consolidated Financial Statements included in Item 8 of this Form 10-K. We manage our business by taking into account the partial offset of short natural gas positions primarily in our Southwest segment. The calculated percentages for net operating margin for percent-of-proceeds, percent-of-index and keep-whole contracts reflect the partial offset of our natural gas positions. The calculated percentages are less than one percent for percent-of-index due to the offset of our natural gas positions and, therefore, not meaningful to the table below. For the year ended December 31, 2013, we calculated the following approximate percentages of our segment net operating margin from the following types of contracts:
| | | | | | | | | | |
| | Fee-Based | | Percent-of-
Proceeds(1) | | Keep-Whole(2) | |
|---|
Marcellus | | | 80 | % | | 20 | % | | 0 | % |
Utica | | | 100 | % | | 0 | % | | 0 | % |
Northeast | | | 23 | % | | 16 | % | | 61 | % |
Southwest | | | 52 | % | | 38 | % | | 10 | % |
Total | | | 61 | % | | 26 | % | | 13 | % |
- (1)
- Includes condensate sales and other types of arrangements tied to NGL prices.
- (2)
- Includes condensate sales and other types of arrangements tied to both NGL and natural gas prices.
Competition
In each of our operating segments, we face competition for natural gas gathering, crude oil transportation and in obtaining natural gas supplies for our processing and related services; in obtaining unprocessed NGLs for gathering and fractionation; and in marketing our products and services.
23
Table of Contents
Competition for natural gas supplies is based primarily on the location of gas gathering facilities and gas processing plants, operating efficiency and reliability and the ability to obtain a satisfactory price for products recovered. Competitive factors affecting our fractionation services include availability of capacity, proximity to supply and industry marketing centers and cost efficiency and reliability of service. Competition for customers to purchase our natural gas and NGLs is based primarily on price, delivery capabilities, flexibility and maintenance of high-quality customer relationships.
Our competitors include:
- •
- natural gas midstream providers, of varying financial resources and experience, that gather, transport, process, fractionate, store and market natural gas and NGLs;
- •
- major integrated oil companies;
- •
- medium and large sized independent exploration and production companies; and
- •
- major interstate and intrastate pipelines.
Some of our competitors operate as master limited partnerships and may enjoy a cost of capital comparable to and, in some cases, lower than ours. Other competitors, such as major oil and gas and pipeline companies, have capital resources and contracted supplies of natural gas substantially greater than ours. Smaller local distributors may enjoy a marketing advantage in their immediate service areas.
We believe that our customer focus, demonstrated by our ability to offer an integrated package of services and our flexibility in considering various types of contractual arrangements, allows us to compete more effectively. Additionally, we have critical connections to the key market outlets for NGLs and natural gas in each of our segments. In the Marcellus and Utica segments, our early entrance in the liquids-rich corridors of the Marcellus and Utica Shales through our strategic gathering and processing agreements with key producers enhances our competitive position to participate in the further development of these resource plays. In the Northeast segment, our operational experience of more than 20 years as the largest processor and fractionator and our existing presence in the Appalachian Basin provide a significant competitive advantage. In the Southwest segment, our major gathering systems are less than 15 years old, located primarily in the heart of shale plays with significant long-term growth opportunities and provide producers with low-pressure and fuel-efficient service, which differentiates us from many competing gathering systems in those areas. The strategic location of our assets and the long-term nature of our contracts also provide a significant competitive advantage.
Seasonality
Our business can be affected by seasonal fluctuations in the demand for natural gas and NGLs and the related fluctuations in commodity prices caused by various factors such as changes in transportation and travel patterns and variations in weather patterns from year to year. Our Northeast segment could be particularly impacted by seasonality as the majority of its revenues are generated by NGL sales. However, we manage the seasonality impact through the execution of our marketing strategy. We have access to up to 50 million gallons of propane storage capacity in the northeast region provided by our own storage facilities and an arrangement with a third-party which provides us with flexibility to manage the seasonality impact. Overall, our exposure to the seasonal fluctuations in the commodity markets is declining due to our growth in fee-based business.
Regulatory Matters
Our operations are subject to extensive regulations. The failure to comply with applicable laws and regulations or to obtain, maintain and comply with requisite permits and authorizations can result in substantial penalties and other costs to the Partnership. The regulatory burden on our operations
24
Table of Contents
increases our cost of doing business and, consequently, affects our profitability. However, we do not believe that we are affected in a significantly different manner by these laws and regulations than are our competitors. Due to the myriad of complex federal, state, provincial and local regulations that may affect us, directly or indirectly, reliance on the following discussion of certain laws and regulations should not be considered an exhaustive review of all regulatory considerations affecting our operations.
FERC-Regulated Natural Gas Pipelines. Our natural gas pipeline operations are subject to federal, state and local regulatory authorities. Specifically, our Hobbs, New Mexico natural gas pipeline and the Arkoma Connector natural gas pipeline in Oklahoma in which we have an equity investment are subject to regulation by FERC, and it is possible that we may construct additional gas pipelines in the future that may be subject to such regulation. Federal regulation extends to various matters including:
- •
- rates and rate structures;
- •
- return on equity;
- •
- recovery of costs;
- •
- the services that our regulated assets are permitted to perform;
- •
- the acquisition, construction, expansion, operation and disposition of assets;
- •
- affiliate interactions; and
- •
- to an extent, the level of competition in that regulated industry.
Under the Natural Gas Act ("NGA"), FERC has authority to regulate natural gas companies that provide natural gas pipeline transportation services in interstate commerce. Its authority to regulate those services includes the rates charged for the services, terms and conditions of service, certification and construction of new facilities, the extension or abandonment of services and facilities, the maintenance of accounts and records, the acquisition and disposition of facilities, the initiation and discontinuation of services and various other matters. Natural gas companies may not charge rates that have been determined not to be just and reasonable by FERC. In addition, FERC prohibits FERC regulated natural gas facilities from unduly preferring, or unduly discriminating against, any person with respect to pipeline rates or terms and conditions of service or other matters. The rates and terms and conditions for our service will be found in FERC-approved tariffs. Pursuant to FERC's jurisdiction over rates, existing rates may be challenged by complaint and proposed rate increases may be challenged by protest. We also cannot be assured that FERC will continue to pursue its approach of pro-competitive policies as it considers matters such as pipeline rates and rules and policies that may affect rights of access to natural gas transportation capacity and transportation facilities. Any successful complaint or protest against our rates could have an adverse impact on our revenues associated with providing interstate gas transportation services.
Energy Policy Act of 2005. On August 8, 2005, President Bush signed into law the Domenici-Barton Energy Policy Act of 2005 ("2005 EPAct"). Under the 2005 EPAct, FERC may impose civil penalties of up to $1,000,000 per day for each current violation of the NGA. The 2005 EPAct also amends the NGA to add an anti-market manipulation provision, which makes it unlawful for any entity to engage in prohibited behavior in contravention of rules and regulations to be prescribed by FERC. FERC issued Order No. 670 to implement the anti-market manipulation provision of 2005 EPAct. This order makes it unlawful for gas pipelines and storage companies that provide interstate services to: (i) directly or indirectly, use or employ any device, scheme or artifice to defraud in connection with the purchase or sale of natural gas subject to the jurisdiction of FERC, or the purchase or sale of transportation services subject to the jurisdiction of FERC; (ii) make any untrue statement of material fact or omit to make any such statement necessary to make the statements made not misleading; or (iii) engage in any act or practice that operates as a fraud or deceit upon any person. The anti-market
25
Table of Contents
manipulation rule and enhanced civil penalty authority reflect an expansion of FERC's enforcement authority.
Standards of Conduct. In 2008, FERC issued standards of conduct for transmission providers in Order 717, as amended and clarified in subsequent orders on rehearing to regulate the manner in which interstate natural gas pipelines may interact with their marketing affiliates based on an employee separation approach. A "Transmission Provider" includes an interstate natural gas pipeline that provides open access transportation pursuant to FERC's regulations. Under these rules, a Transmission Provider's transmission function employees (including the transmission function employees of any of its affiliates) must function independently from the Transmission Provider's marketing function employees (including the marketing function employees of any of its affiliates).
Market Transparency Rulemakings. In 2007, FERC issued Order 704, as amended and clarified in subsequent orders on rehearing, whereby wholesale buyers and sellers of more than 2.2 million MMBtu of physical natural gas in the previous calendar year, including interstate and intrastate natural gas pipelines, natural gas gatherers, natural gas processors and natural gas marketers, are now required to report, on May 1 of each year, aggregate volumes of natural gas purchased or sold at wholesale in the prior calendar year to the extent such transactions utilize, contribute to or may contribute to the formation of price indices. It is the responsibility of the reporting entity to determine which transactions should be reported based on the guidance of Order 704. The Partnership typically files the report required by Order 704 on behalf of its subsidiaries that engage in reportable transactions. On November 15, 2012, FERC issued a Notice of Inquiry in which it requested comments on whether it should propose to require the quarterly reporting of certain data relating to next-day and next-month transactions.
Intrastate Natural Gas Pipeline Regulation. Some of our intrastate gas pipeline facilities are subject to various state laws and regulation that affect the rates we charge and terms of service. Although state regulation is typically less onerous than FERC, state regulation typically requires pipelines to charge just and reasonable rates and to provide service on a non-discriminatory basis. The rates and service of an intrastate pipeline generally are subject to challenge by complaint. Additionally, FERC has adopted certain regulations and reporting requirements applicable to intrastate natural gas pipelines (and Hinshaw natural gas pipelines) that provide certain interstate services subject to FERC's jurisdiction. We could become subject to such regulations and reporting requirements in the future to the extent that any of our intrastate pipelines were to begin providing, or were found to provide, such interstate services.
Additional proposals and proceedings that might affect the natural gas industry are pending before Congress, FERC and the courts. We cannot predict the ultimate impact of these or the above regulatory changes to our natural gas operations. We do not believe that we would be affected by any such FERC action materially differently than other midstream natural gas companies with whom we compete.
Natural Gas Gathering Pipeline Regulation. Section 1(b) of the NGA exempts natural gas gathering facilities from the jurisdiction of FERC if the primary function of the facilities is gathering natural gas. There is, however, no bright-line test for determining the jurisdictional status of pipeline facilities. We own a number of facilities that we believe meet the traditional tests FERC uses to establish a pipeline's status as a gatherer not subject to FERC jurisdiction. The distinction between FERC-regulated transmission services and federally unregulated gathering services is the subject of litigation from time to time, so we cannot provide assurance that FERC will not at some point assert that transportation on these facilities is within its jurisdiction or that such an assertion would not adversely affect our results of operations. In such a case, we would be required to file a tariff with FERC, provide a cost justification for the transportation charge and obtain certificate(s) of public convenience and necessity for the FERC-regulated pipelines.
26
Table of Contents
In the states in which we operate, regulation of gathering facilities and intrastate pipeline facilities generally includes various safety, environmental and, in some circumstances, open access, nondiscriminatory take requirement and complaint-based rate regulation. For example, some of our natural gas gathering facilities are subject to state ratable take and common purchaser statutes and regulations. Ratable take statutes and regulations generally require gatherers to take, without undue discrimination, natural gas production that may be tendered to the gatherer for handling. Similarly, common purchaser statutes and regulations generally require gatherers to purchase gas without undue discrimination as to source of supply or producer. These statutes are designed to prohibit discrimination in favor of one producer over another producer or one source of supply over another source of supply. Although state regulation is typically less onerous than at FERC, these statutes and regulations have the effect of restricting our right as an owner of gathering facilities to decide with whom we contract to purchase or transport natural gas.
Natural gas gathering may receive greater regulatory scrutiny at both the state and federal levels now that FERC has taken a less stringent approach to regulation of the gathering activities of interstate pipeline transmission companies and a number of such companies have transferred gathering facilities to unregulated affiliates. Our gathering operations could be adversely affected should they be subject in the future to the application of state or federal regulation of rates and services or regulated as a public utility. Our gathering operations also may be or become subject to safety and operational regulations and permitting requirements relating to the design, siting, installation, testing, construction, operation, replacement and management of gathering facilities. Additional rules and legislation pertaining to these matters are considered or adopted from time to time. We cannot predict what effect, if any, such changes might have on our operations, but the industry could be required to incur additional capital expenditures and increased costs depending on future legislative and regulatory changes.
Natural Gas Processing. Our natural gas processing operations are not presently subject to FERC or state regulation. There can be no assurance that our processing operations will continue to be exempt from regulation in the future. In addition, although the processing facilities may not be directly related, other laws and regulations may affect the availability of natural gas for processing, such as state regulation of production rates and maximum daily production allowables from gas wells, which could impact our processing business.
NGL Pipelines. We have constructed a common carrier NGL product pipeline to transport NGL products in interstate commerce, for which we comply with FERC requirements for such common carrier pipelines, including the filing of a tariff, and we may elect to construct additional common carrier NGL product pipelines in the future that may be subject to these requirements. Such common carrier NGL pipelines providing transportation of NGLs in interstate commerce are subject to the same regulatory requirements as common carrier crude oil pipelines. See "Common Carrier Crude Oil Pipeline Operations" below. We also have several other of our NGL pipelines that carry NGLs across state lines; however, we do not operate these pipelines as common carrier pipelines or hold them out for service to the public because they are not subject to FERC requirements for common carrier pipelines or would otherwise meet the qualifications for a waiver from FERC's applicable reporting and filing regulatory requirements. We cannot, however, provide assurance that FERC will not, at some point, either at the request of other entities or on its own initiative, assert that some or all of such gathering is subject to FERC requirements for common carrier pipelines or is otherwise not exempt from its filing or reporting requirements or that such an assertion would not adversely affect our results of operations. In the event FERC were to determine that these NGL pipelines are subject to FERC requirements for common carrier pipelines or otherwise would not qualify for a waiver from FERC's applicable regulatory requirements, we would likely be required to file a tariff with FERC, provide a cost justification for the transportation charge and provide service to all potential shippers without undue discrimination. Our NGL pipelines are subject to safety regulation by the Department of Transportation under 49 C.F.R. Part 195 for operators of hazardous liquid pipelines. Our NGL
27
Table of Contents
pipelines and operations may also be or become subject to state public utility or related jurisdiction which could impose additional safety and operational regulations relating to the design, siting, installation, testing, construction, operation, replacement and management of NGL gathering facilities.
Propane Regulation. National Fire Protection Association Pamphlets No. 54 and No. 58, which establish rules and procedures governing the safe handling of propane or comparable regulations, have been adopted as the industry standard in all of the states in which we operate. In some states these laws are administered by state agencies and in others they are administered on a municipal level. With respect to the transportation of propane by truck, we are subject to regulations promulgated under the Federal Motor Carrier Safety Act. These regulations cover the transportation of hazardous materials and are administered by the U.S. Department of Transportation ("DOT"). We conduct ongoing training programs to help ensure that our operations are in compliance with applicable regulations. We maintain various permits that are necessary to operate our facilities, some of which may be material to our propane operations. We believe that the procedures currently in effect at all of our facilities for the handling, storage and distribution of propane are consistent with industry standards and are in compliance in all material respects with applicable laws and regulations.
Common Carrier Crude Oil Pipeline Operations. Our Michigan Crude Pipeline is a crude oil pipeline that is a common carrier and subject to regulation by FERC under the October 1, 1977 version of the Interstate Commerce Act ("ICA") and the Energy Policy Act of 1992 ("EPAct 1992"). The ICA and its implementing regulations give FERC authority to regulate the rates charged for service on the interstate common carrier liquids pipelines and generally require the rates and practices of interstate liquids pipelines to be just and reasonable and nondiscriminatory. The ICA also requires these pipelines to keep tariffs on file with FERC that set forth the rates the pipeline charges for providing transportation services and the rules and regulations governing these services. EPAct 1992 and its implementing regulations allow interstate common carrier oil pipelines to annually index their rates up to a prescribed ceiling level. FERC retains cost-of-service ratemaking, market-based rates and settlement rates as alternatives to the indexing approach.
Pipeline Interconnections. One or more of our fractionation plants include pipeline interconnections to interstate liquids pipelines. These pipeline interconnections are an integral part of our fractionation plant facilities and are not currently being used, nor can they be used in the future, by any third party due to their origin points at our proprietary facilities. Therefore, we believe these pipeline interconnections are ancillary facilities to our fractionation plants and are not subject to the jurisdiction of FERC. In the event that FERC were to determine that these pipeline interconnections were subject to its jurisdiction, we believe the pipelines would qualify for a waiver from FERC's applicable reporting and filing requirements. In the event that FERC were to determine that the pipeline interconnections did not qualify for such a waiver, we would likely be required to file a tariff with FERC for the pipeline interconnections, provide a cost justification for the transportation charge and provide service to all potential shippers without undue discrimination. In such event, we may experience increased operating costs and reduced revenues.
Environmental Matters
Our processing and fractionation plants, pipelines and associated facilities are subject to multiple obligations and potential liabilities under a variety of stringent and comprehensive federal, regional, state and local laws and regulations governing discharges of materials into the environment or otherwise relating to environmental protection. Such laws and regulations affect many aspects of our present and future operations, such as requiring the acquisition of permits or other approvals to conduct regulated activities that may impose burdensome conditions or potentially cause delays, restricting the manner in which we handle or dispose of our wastes, limiting or prohibiting construction
28
Table of Contents
or other activities in environmentally sensitive areas such as wetlands or areas inhabited by endangered species, requiring us to incur capital costs to construct, maintain and/or upgrade processes, equipment and/or facilities, restricting the locations in which we may construct our compressor stations and other facilities, and/or requiring the relocation of existing stations and facilities and requiring remedial actions to mitigate pollution caused by our operations or attributable to former operations. Spills, releases or other incidents may occur in connection with our active operations or as a result of events outside of our reasonable control, and, in either case, may result in non-compliance with or violations of such laws and regulations. Any failure to comply with these requirements may expose us to the assessment of sanctions, including administrative, civil and criminal penalties, the imposition of remedial or corrective actions and the issuance of orders enjoining or limiting some or all of our operations.
We believe that our operations and facilities are in substantial compliance with applicable environmental laws and regulations and the cost of continued compliance with such laws and regulations will not have a material adverse effect on our results of operations or financial condition. We cannot assure, however, that existing environmental laws and regulations will not be reinterpreted or revised or that new environmental laws and regulations will not be adopted or become applicable to us. The trend in environmental law is to place more restrictions and limitations on activities that may be perceived to adversely affect the environment. Thus there can be no assurance as to the amount or timing of future expenditures for compliance with environmental laws and regulations, permits and permitting requirements, or remedial actions pursuant to such laws and regulations, and actual future expenditures may be different from the amounts we currently anticipate. Revised or additional environmental requirements that result in increased compliance costs or additional operating restrictions, particularly if those costs are not fully recoverable from our customers, could have a material adverse effect on our business, financial condition, results of operations and cash flow. We may not be able to recover some or any of these costs from insurance. Such revised or additional environmental requirements may also result in substantially increased costs and material delays in the construction of new facilities or expansion of our existing facilities, which may materially impact our ability to meet our construction obligations with our producer customers.
To a large extent, the environmental laws and regulations affecting our operations relate to the release of hazardous substances or non-hazardous or hazardous wastes into soils, groundwater and surface water and include measures to control pollution of the environment. For instance, the Comprehensive Environmental Response, Compensation, and Liability Act, as amended ("CERCLA"), also known as the "Superfund" law, and comparable state laws impose liability without regard to fault or the legality of the original conduct on certain classes of persons who are considered to be responsible for the release of a hazardous substance into the environment. These persons include current and prior owners or operators of a site where a release occurred and companies that transported or disposed or arranged for the transport or disposal of the hazardous substances released from the site. Under CERCLA, these persons may be subject to strict joint and several liabilities for the costs of removing or remediating hazardous substances that have been released into the environment, for restoration costs and damages to natural resources and for the costs of certain health studies. Additionally, it is not uncommon for neighboring landowners and other third parties to file claims for personal injury and property damage allegedly caused by hazardous substances or other pollutants released into the environment. While we generate materials in the course of our operations that are defined as hazardous substances under CERCLA or similar state statutes, we do not believe that we have any current material liability for cleanup costs under such laws, or for third party claims or personal injury or property damage. We also may incur liability under the Resource Conservation and Recovery Act, as amended ("RCRA"), and comparable state statutes, which impose requirements relating to the handling and disposal of nonhazardous and hazardous wastes. Under the authority of the EPA, most states administer some or all of the provisions of the RCRA, sometimes in conjunction
29
Table of Contents
with their own, more stringent requirements. We are required to comply with RCRA requirements relating to hazardous wastes, however, because our operations generate minimal quantities of hazardous wastes, we do not have substantial RCRA requirements. However, it is possible that some wastes generated by us that are currently classified as nonhazardous wastes may in the future be designated as hazardous wastes, resulting in the wastes being subject to more rigorous and costly transportation, storage, treatment and/or disposal requirements. In the course of our operations, we generate some amount of ordinary industrial wastes, such as paint wastes, waste solvents and waste oils that may be regulated as hazardous wastes.
We currently own or lease, and have in the past owned or leased, properties that have been used over the years for natural gas gathering, processing and transportation, for NGL fractionation or for the storage, gathering and transportation of crude oil. Although waste disposal practices within the NGL industry and other oil and natural gas related industries have improved over the years, it is possible that petroleum hydrocarbons and other nonhazardous wastes or hazardous wastes may have been disposed of on or under various properties owned or leased by us during the operating history of those facilities. In addition, a number of these properties may have been operated by third parties whose treatment and disposal or release of petroleum hydrocarbons or other wastes was not under our control. These properties and wastes disposed thereon may be subject to CERCLA, RCRA and analogous state laws. Under these laws, we could be required to remove or remediate previously disposed wastes or property contamination, including groundwater contamination or to perform remedial operations to prevent future contamination. We do not believe that there presently exists significant surface and subsurface contamination of our properties by petroleum hydrocarbons or other wastes for which we are currently responsible.
The prior third-party owner or operator of our Cobb, Boldman, Kenova and Majorsville facilities, who is also the prior owner and current operator of the Kermit facility, has been, or is currently involved in, investigatory or remedial activities with respect to the real property underlying these facilities. These investigatory and remedial obligations arise out of a September 1994 "Administrative Order by Consent for Removal Actions" with EPA Regions II, III, IV and V; and with respect to the Boldman facility, an "Agreed Order" entered into by the third-party owner/operator with the Kentucky Natural Resources and Environmental Protection Cabinet in October 1994. The third party has accepted sole liability and responsibility for, and indemnifies us against, any environmental liabilities associated with the EPA Administrative Order, the Kentucky Agreed Order or any other environmental condition related to the real property prior to the effective dates of our lease or purchase of the real property. In addition, the third party has agreed to perform all the required response actions at its expense in a manner that minimizes interference with our use of the properties. We understand that to date, all actions required under these agreements have been or are being performed and, accordingly, we do not believe that the remediation obligation of these properties will have a material adverse impact on our financial condition or results of operations.
In addition, the prior third-party owner and/or operator of certain facilities on the real property on which our rail facility is constructed near Houston, Pennsylvania has been, or is currently involved in, investigatory or remedial activities related to acid mine drainage ("AMD") with respect to the real property underlying these facilities. These investigatory and remedial obligations arise out of an arrangement entered into between the Pennsylvania Department of Environmental Protection and the third party, which has accepted liability and responsibility for, and indemnifies us against, any environmental liabilities associated with the AMD that are not exacerbated by us in connection with our operations. In addition, the third party has agreed to perform all of the required response actions at its expense in a manner that minimizes interference with our use of the property. We understand that to date, all actions required under these agreements have been or are being performed and,
30
Table of Contents
accordingly, we do not believe that the remediation obligation of these properties will have a material adverse impact on our financial condition or results of operations.
The Federal Water Pollution Control Act of 1972, as amended ("Clean Water Act") and analogous state laws impose restrictions and controls on the discharge of pollutants into federal and state waters. Such discharges are prohibited, except in accord with the terms of a permit issued by the EPA or the analogous state agency. Spill prevention, control and countermeasure requirements under federal law require appropriate containment berms and similar structures to help prevent the contamination of navigable waters in the event of a hydrocarbon tank spill, rupture or leak. Any unpermitted release of pollutants, including oil, natural gas liquids or condensates, could result in administrative, civil and criminal penalties as well as significant remedial obligations. In addition, the Clean Water Act and analogous state law may also require individual permits or coverage under general permits for discharges of storm water from certain types of facilities, but these requirements are subject to several exemptions specifically related to oil and natural gas operations and facilities. The Clean Water Act also prohibits the discharge of dredge and fill material in regulated waters, including wetlands, unless authorized by a permit. We conduct regular review of the applicable laws and regulations, and maintain discussions with the various federal, state and local agencies with regard to the application of those laws and regulations to our facilities, including the permitting process and categories of applicable permits for storm water or other discharges, stream crossings and wetland disturbances that may be required for the construction or operation of certain of our facilities in the various states. We believe that we are in substantial compliance with the Clean Water Act and analogous state laws. However, increased construction activities, potential inadvertent releases from borings for pipelines, new permitting requirements or reinterpretations or more stringent enforcement of existing requirements may be implemented that could materially increase our operating costs or materially delay the construction or expansion of our facilities.
We do not conduct hydraulic fracturing operations, but we do provide gathering, processing and fractionation services with respect to natural gas and NGLs produced by our producer customers as a result of such operations. Hydraulic fracturing is an important and common practice that is used to stimulate production of natural gas and/or oil from dense subsurface rock formations. The hydraulic fracturing process involves the injection of water, sand and additives under pressure into targeted subsurface formations to fracture the surrounding rock and stimulate production. Hydraulic fracturing typically is regulated by state oil and natural gas commissions, but the EPA has asserted federal regulatory authority over certain hydraulic fracturing activities involving the use of diesel fuel and has indicated it may seek to further expand its regulation of hydraulic fracturing. In addition, from time to time Congress considers legislation to provide for additional regulation of hydraulic fracturing. Some states have adopted, and other states are considering adopting, laws and/or regulations that could impose more stringent permitting, disclosure and well construction requirements on natural gas drilling activities. Local governments also may seek to adopt ordinances within their jurisdictions regulating the time, place and manner of drilling activities in general or hydraulic fracturing activities in particular. In the event that new or more stringent federal, state or local legal restrictions relating to natural gas drilling activities or to the hydraulic fracturing process are adopted in areas where our producer customers operate, those customers could incur potentially significant added costs to comply with such hydraulic fracturing-related requirements and experience delays or curtailment in the pursuit of production or development activities, which could reduce demand for our gathering, transportation and processing services and/or our NGL fractionation services.
31
Table of Contents
In addition, certain governmental reviews have been conducted or are underway that focus on potential environmental aspects of hydraulic fracturing practices. The White House Council on Environmental Quality is coordinating an administration-wide review of hydraulic fracturing practices, while the EPA has commenced a study of the potential environmental effects of hydraulic fracturing on drinking water and groundwater. A first progress report outlining work currently underway by the agency was released on December 21, 2012. A draft final report drawing conclusions about the potential impacts of hydraulic fracturing on drinking water resources is expected to be available for public comment and peer review in 2014. Moreover, the EPA is developing effluent limitations for the treatment and discharge of wastewater resulting from hydraulic fracturing activities and plans to propose these standards in 2014. Also, the federal Bureau of Land Management has proposed regulations applicable to hydraulic fracturing conducted on federal and Indian oil and natural gas leases. Other governmental agencies, including the U.S. Department of Energy and the U.S. Department of the Interior, have evaluated or are evaluating various other aspects of hydraulic fracturing. These ongoing or proposed studies, depending on their degree of pursuit and any meaningful results obtained, could spur initiatives to further regulate hydraulic fracturing that could delay or curtail production of natural gas, and thus reduce demand for our midstream services.
The Clean Air Act, as amended and comparable state laws restrict the emission of air pollutants from many sources in the United States, including processing plants and compressor stations, and also impose various monitoring and reporting requirements. These laws and any implementing regulations may require us to obtain pre-approval for the construction or modification of certain projects or facilities expected to produce or significantly increase air emissions, obtain and strictly comply with stringent air permit requirements, utilize specific equipment or technologies to control emissions, or aggregate two or more of our facilities into one application for permitting purposes. We may be required to incur capital expenditures in the future for installation of air pollution control equipment and encounter construction or operational delays while applying for, or awaiting the review, processing and issuance of new or amended permits, and we may be required to modify certain of our operations which could increase our operating costs. For example, in 2012, the EPA adopted a final rule applicable to the oil and natural gas industry, establishing New Source Performance Standards to address emissions of sulfur dioxide and volatile organic compounds and a separate set of emission standards to address hazardous air pollutants frequently associated with, among other things, processing and gathering activities, but we do not believe that this rule will have a material adverse effect on our operations. We have been in discussions with various state agencies in the areas in which we operate with respect to their guidance, policies, rules and regulations regarding the permitting process, source determination, categories of applicable permits and control technology that may be required for the construction or operation of certain of our facilities. We believe that our operations are in substantial compliance with applicable air permitting and control technology requirements.
As a consequence of an EPA administrative conclusion that emissions of carbon dioxide, methane and other greenhouse gases ("GHGs") into the ambient air endangers public health and welfare, the EPA has adopted regulations establishing the Prevention of Significant Deterioration ("PSD") construction and Title V operating permit programs for certain large stationary sources that are potential major sources of GHG emissions. We could become subject to these Title V and PSD permitting requirements and be required to install "best available control technology" to limit emissions of GHG's from any new or significantly modified facilities that we may seek to construct in the future if such facilities emitted volumes of GHGs in excess of threshold permitting levels. The EPA also adopted rules requiring the monitoring and reporting of GHG emissions from specified GHG emission sources in the United States on an annual basis, including, among others, certain onshore and offshore
32
Table of Contents
oil and natural gas production and onshore oil and natural gas processing, fractionation, transmission, storage and distribution facilities, which includes certain of our operations. We are monitoring GHG emissions from our operations and believe that our monitoring activities are in substantial compliance with applicable reporting obligations. As a result of these requirements, we may be required to incur potentially significant added costs to comply with the requirements or added capital expenditures for air pollution control equipment, or we may experience delays or possible curtailment of construction or projects in connection with applying for, obtaining or maintaining preconstruction and operating permits and we may encounter limitations on the design capacities or size of facilities.
While Congress has from time to time considered legislation to reduce emissions of GHGs, there has not been significant activity in the form of adopted legislation to reduce GHG emissions at the federal level in recent years. In the absence of federal climate legislation in the U.S., a number of state and regional efforts have emerged that are aimed at tracking and/or reducing GHG emissions by means of cap and trade programs that typically require major sources of GHG emissions, such as electric power plants, to acquire and surrender emission allowances in return for emitting those GHGs. If Congress were to undertake comprehensive tax reform in the coming year, it is possible that such reform may include a carbon tax, which could impose additional direct costs on operations and reduce demand for oil, natural gas, NGLs and products derived therefrom. Although it is not possible at this time to predict how legislation or new regulations that may be adopted to address GHG emissions would impact our business, any such future laws and regulations could require us to incur increased operating costs, such as costs to purchase and operate emissions control systems, to acquire emission allowances or comply with new regulatory or reporting requirements including the imposition of a carbon tax. Any such legislation or regulatory programs could also increase the cost of consuming, and thereby reduce demand for, oil and natural gas produced by our exploration and production customers that, in turn, could reduce the demand for our services and thus adversely affect our cash available for distribution to our unitholders.
The federal Endangered Species Act ("ESA") and analogous laws regulate activities that may affect endangered or threatened species or their habitats. Endangered species that are located in various states in which we operate include, without limitation, the Indiana Bat and the American Burying Beetle. If endangered species are located in areas where we propose to construct new gathering or transportation pipelines or processing or fractionation facilities, such work could be prohibited or delayed in certain of those locations or during certain times, such as breeding and nesting seasons, when our operations could have an adverse effect on the species. We also may be obligated to develop plans to avoid potential adverse effects to protected species and their habitats, the implementation of which could materially increase our operating and capital costs. Existing laws, regulations, policies and guidance relating to protected species may also be revised or reinterpreted in a manner that further increase our construction and mitigation costs or restricts our construction activities. Additionally, construction and operational activities could result in inadvertent impact to habitats of listed species and could result in alleged takings under the ESA, exposing the Partnership to civil or criminal enforcement actions and fines or penalties. Moreover, as a result of a settlement approved by the U.S. District Court for the District of Columbia in September 2011, the U.S. Fish and Wildlife Service is required to make a determination on listing numerous species as endangered or threatened under the ESA by completion of the agency's 2017 fiscal year. For example, the U.S. Fish and Wildlife Service is considering listing, or has issued a petition to list, the Northern Long Eared Bat and the Lesser Prairie Chicken as endangered species under the ESA, both of which are located in areas in which we operate. The designation of these species, or other previously unprotected species as threatened or endangered in areas where we conduct operations or plan to construct pipelines or facilities could cause us to incur increased costs arising from species protection measures or could result in delays in the construction of
33
Table of Contents
our facilities or limitations on our customer's exploration and production activities, which could have an adverse impact on demand for our midstream operations.
The Migratory Bird Treaty Act implements various treaties and conventions between the United States and certain other nations for the protection of migratory birds. In accordance with this law, the taking, killing or possessing of migratory birds covered under this act is unlawful without a permit. If there is the potential to adversely affect migratory birds as a result of our operations or construction activities, we may be required to obtain necessary permits to conduct those operations or construction activities, which may result in specified operating or construction restrictions on a temporary, seasonal, or permanent basis in affected areas and thus have an adverse impact on our ability to provide timely gathering, processing or fractionation services to our exploration and production customers.
Pipeline Safety Matters
Our pipelines are subject to regulation by the Pipeline and Hazardous Materials Safety Administration ("PHMSA") of the DOT under the Natural Gas Pipeline Safety Act of 1986, as amended ("NGPSA"), with respect to natural gas, and the Hazardous Pipeline Safety Act of 1979, as amended ("HLPSA"), with respect to crude oil, NGLs and condensates. The NGPSA and HLPSA govern the design, installation, testing, construction, operation, replacement and management of natural gas, oil and NGL pipeline facilities. The NGPSA and HLPSA require any entity that owns or operates pipeline facilities to comply with the regulations implemented under these acts, permit access to and allow copying of records and to make certain reports and provide information as required by the Secretary of Transportation. We believe that our pipeline operations are in substantial compliance with applicable existing NGPSA and HLPSA requirements; however, these laws are subject to further amendment, with the potential for more onerous obligations and stringent standards being imposed on pipeline owners and operators. For example, on January 3, 2012, President Obama signed the Pipeline Safety, Regulatory Certainty, and Job Creation Act of 2011 ("2011 Pipeline Safety Act"), which requires increased safety measures for gas and hazardous liquids transportation pipelines. Among other things, the 2011 Pipeline Safety Act directs the Secretary of Transportation to promulgate rules or standards relating to expanded integrity management requirements, automatic or remote-controlled valve use, excess flow valve use and leak detection system installation. The 2011 Pipeline Safety Act also directs owners and operators of interstate and intrastate gas transmission pipelines to verify their records confirming the maximum allowable pressure of pipelines in certain class locations and high consequence areas, requires promulgation of regulations for conducting tests to confirm the material strength of pipe operating above 30% of specified minimum yield strength in high consequence areas and increases the maximum penalty for violation of pipeline safety regulations from $100,000 to $200,000 per violation per day of violation and also from $1 million to $2 million for a related series of violations. The safety enhancement requirements and other provisions of the 2011 Pipeline Safety Act could require us to install new or modified safety controls, pursue additional capital projects or conduct maintenance programs on an accelerated basis, any or all of which tasks could result in our incurring increased operating costs that could be significant and have a material adverse effect on our results of operations or financial position.
Our pipelines are also subject to regulation by PHMSA under the Pipeline Safety Improvement Act of 2002, which was amended by the Pipeline Inspection, Protection, Enforcement and Safety Act of 2006. PHMSA has established a series of rules under 49 C.F.R. Part 192 that require pipeline operators to develop and implement integrity management programs for gas transmission pipelines that, in the event of a failure, could affect high consequence areas. "High consequence areas" are currently defined to include high population areas, areas unusually sensitive to environmental damage and commercially navigable waterways. Similar rules are also in place under 49 C.F.R. Part 195 for operators of hazardous liquid pipelines including lines transporting NGLs and condensates. PHMSA also has adopted rules that amend the pipeline safety regulations to extend regulatory coverage to certain rural
34
Table of Contents
onshore hazardous liquid gathering lines and low stress pipelines, including those pipelines located in non-populated areas requiring extra protection because of the presence of sole source drinking water resources, endangered species or other ecological sources. While we believe that our pipeline operations are in substantial compliance with applicable requirements, due to the possibility of new or amended laws and regulations, or reinterpretation of existing laws and regulations, there can be no assurance that future compliance with the requirements will not have a material adverse effect on our results of operations or financial position. For instance, in August 2011, PHMSA published an advance notice of proposed rulemaking in which the agency sought public comment on a number of changes to regulations governing the safety of gas transmission pipelines and gathering lines, including, for example, (i) revising the definitions of "high consequence areas" and "gathering lines"; (ii) strengthening integrity management requirements as they apply to existing regulated operators and to currently exempt operators should certain exemptions be removed; (iii) strengthening requirements on the types of gas transmission pipeline integrity assessment methods that may be selected for use by operators; (iv) imposing gas transmission integrity management requirements on onshore gas gathering lines; (v) requiring the submission of annual, incident and safety-related conditions reports by operators of all gathering lines; and (vi) enhancing the current requirements for internal corrosion control of gathering lines, and PHMSA continues to evaluate the public comments received on this rulemaking.
States are largely preempted by federal law from regulating pipeline safety for interstate lines but most are certified by the DOT to assume responsibility for enforcing federal intrastate pipeline regulations and inspection of intrastate pipelines. In practice, because states can adopt stricter standards for intrastate pipelines than those imposed by the federal government for interstate lines, states vary considerably in their authority and capacity to address pipeline safety. We believe that our operations are in substantial compliance with applicable state pipeline safety laws and regulations. However, new state pipeline safety requirements may be implemented in the future that could materially increase our operating costs.
Facility Safety
At manned facilities, the workplaces associated with the processing and storage facilities and the pipelines we operate are also subject to oversight pursuant to the federal Occupational Safety and Health Act, as amended, ("OSHA"), as well as comparable state statutes that regulate the protection of the health and safety of workers. In addition, the OSHA hazard-communication standard requires that we maintain information about hazardous materials used or produced in operations, and that this information be provided to employees, state and local government authorities and citizens. We believe that we have conducted our operations in substantial compliance with OSHA requirements, including general industry standards, record-keeping requirements and monitoring of occupational exposure to regulated substances.
At unmanned facilities, the EPA's Risk Management Planning requirements at regulated facilities are intended to protect the safety of the surrounding public. The application of these regulations, which are often unclear, can result in increased compliance expenditures.
In general, we expect industry and regulatory safety standards to become stricter over time, resulting in increased compliance expenditures. While these expenditures cannot be accurately estimated at this time, we do not expect such expenditures will have a material adverse effect on our results of operations.
Notwithstanding the foregoing, PHMSA and one or more state regulators, including the Texas Railroad Commission, have in the recent past, expanded the scope of their regulatory inspections to include certain in-plant equipment and pipelines found within NGL fractionation facilities and associated storage facilities, in order to assess compliance of such equipment and pipelines with hazardous liquid pipeline safety requirements. These recent actions by PHMSA are currently subject to
35
Table of Contents
judicial and administrative challenges by one or more midstream operators; however, to the extent that such legal challenges are unsuccessful, midstream operators of NGL fractionation facilities and associated storage facilities subject to such inspection may be required to make operational changes or modifications at their facilities to meet standards beyond current requirements. These changes or modifications may result in additional capital costs, possible operational delays and increased costs of operation.
Employees
Through our subsidiary MarkWest Hydrocarbon, we employ approximately 1,139 individuals to operate our facilities and provide general and administrative services as of February 19, 2014. We have no employees represented by unions.
Available Information
Our principal executive office is located at 1515 Arapahoe Street, Tower 1, Suite 1600, Denver, Colorado 80202-2137. Our telephone number is 303-925-9200. Our common units trade on the New York Stock Exchange under the symbol "MWE." You can find more information about us at our Internet website,www.markwest.com. Our annual reports on Form 10-K, our quarterly reports on Form 10-Q, our current reports on Form 8-K and any amendments to those reports are available free of charge on or through our Internet website as soon as reasonably practicable after we electronically file or furnish such material with the Securities and Exchange Commission. The filings are also available through the SEC at the SEC's Public Reference Room at 100 F Street, N.E., Washington, D.C. 20549 or by calling 1-800-SEC-0330. Also, these filings are available on the Internet websitewww.sec.gov.
36
Table of Contents
ITEM 1A. Risk Factors
In addition to the other information set forth elsewhere in this Form 10-K, you should carefully consider the following factors when evaluating us.
Risks Inherent in Our Business
Our substantial debt and other financial obligations could impair our financial condition, results of operations and cash flow, and our ability to fulfill our debt obligations.
We have substantial indebtedness and other financial obligations. Subject to the restrictions governing our indebtedness and other financial obligations, including the indentures governing our outstanding notes, we may incur significant additional indebtedness and other financial obligations.
Our substantial indebtedness and other financial obligations could have important consequences. For example, they could:
- •
- make it more difficult for us to satisfy our obligations with respect to our existing debt;
- •
- impair our ability to obtain additional financings in the future for working capital, capital expenditures, acquisitions or general partnership and other purposes;
- •
- have a material adverse effect on us if we fail to comply with financial and restrictive covenants in our debt agreements and an event of default occurs as a result of that failure that is not cured or waived;
- •
- require us to dedicate a substantial portion of our cash flow to payments on our indebtedness and other financial obligations, thereby reducing the availability of our cash flow to fund working capital, capital expenditures, distributions and other general partnership requirements;
- •
- limit our flexibility in planning for, or reacting to, changes in our business and the industry in which we operate; and
- •
- place us at a competitive disadvantage compared to our competitors that have proportionately less debt.
Furthermore, these consequences could limit our ability, and the ability of our subsidiaries, to obtain future financings, make needed capital expenditures, withstand any future downturn in our business or the economy in general, conduct operations or otherwise take advantage of business opportunities that may arise.
Our obligations under our Credit Facility are secured by our assets and guaranteed by all of our wholly-owned subsidiaries other than MarkWest Liberty Midstream and its subsidiaries (please read Item 7. Management's Discussion and Analysis of Financial Condition and Results of Operations—Liquidity and Capital Resources). Our Credit Facility and our indentures contain covenants requiring us to maintain specified financial ratios and satisfy other financial conditions, which may limit our ability to grant liens on our assets, make or own certain investments, enter into any swap contracts other than in the ordinary course of business, merge, consolidate or sell assets, incur indebtedness senior to our Credit Facility, make distributions on equity investments and declare or make, directly or indirectly, any distribution on our common units. Maintaining compliance with such covenants may be exacerbated from time to time to the extent that the fluctuations in our working capital needs are not consistent with the timing for our receipt of funds from our operations. Any future breach of any of these covenants or our failure to meet any of these ratios or conditions could result in a default under the terms of our Credit Facility, or our indentures, which could result in acceleration of our debt and other financial obligations. If we were unable to repay those amounts, the lenders could initiate a bankruptcy or liquidation proceeding or proceed against the collateral.
37
Table of Contents
Global economic conditions may have adverse impacts on our business and financial condition.
Changes in economic conditions could adversely affect our financial condition and results of operations. A number of economic factors, including, but not limited to, gross domestic product, consumer interest rates, government spending sequestration, strength of U.S. currency versus other international currencies, consumer confidence and debt levels, retail trends, inflation and foreign currency exchange rates, may generally affect our business. Recessionary economic cycles, higher unemployment rates, higher fuel and other energy costs and higher tax rates may adversely affect demand for natural gas, NGLs and crude oil. Also, any tightening of the capital markets could adversely impact our ability to execute our long-term organic growth projects and meet our obligations to our producer customers and limit our ability to raise capital and, therefore, have an adverse impact on our ability to otherwise take advantage of business opportunities or react to changing economic and business conditions. These factors could have a material adverse effect on our revenues, income from operations, cash flows and our quarterly distribution on our common units.
We may not have sufficient cash after the establishment of cash reserves and payment of our expenses to enable us to pay distributions at the current level.
The amount of cash we can distribute on our common units depends principally on the amount of cash we generate from our operations, which may fluctuate from quarter to quarter based on, among other things:
- •
- the fees we charge and the margins we realize for our services and sales;
- •
- the prices of, level of production of and demand for natural gas and NGLs;
- •
- the volumes of natural gas we gather, process and transport;
- •
- the level of our operating costs including repairs and maintenance;
- •
- prevailing economic conditions; and
- •
- the relative prices of NGLs and crude oil, which impact the effectiveness of our hedging program.
In addition, the actual amount of cash available for distribution may depend on other factors, some of which are beyond our control, including:
- •
- our debt service requirements;
- •
- fluctuations in our working capital needs;
- •
- our ability to borrow funds and access capital markets;
- •
- restrictions contained in our debt agreements;
- •
- restrictions contained in our joint venture agreements;
- •
- the level and timing of capital expenditures we make, including capital expenditures incurred in connection with our enhancement projects;
- •
- the cost of acquisitions, if any; and
- •
- the amount of cash reserves established by our general partner.
Unitholders should be aware that the amount of cash we have available for distribution depends primarily on our cash flow and not solely on profitability, which is affected by non-cash items. As a result, we may make cash distributions during periods when we record losses and may not make cash distributions during periods when we record net income.
38
Table of Contents
A significant decrease in natural gas production in our areas of operation would reduce our ability to make distributions to our unitholders.
Our operations are dependent upon production from natural gas reserves and wells, which will naturally decline over time, which means that our cash flows associated with these wells will also decline over time. To maintain or increase throughput levels on our gathering systems and the utilization rate at our processing plants, treating facilities and fractionation facilities, we must continually obtain new natural gas supplies. Our ability to obtain additional sources of natural gas depends in part on the level of successful drilling activity near ourgathering systemsand processing facilities.
We have no control over the level of drilling activity in the areas of our operations, the amount of reserves associated with the wells or the rate at which production from a well will decline. In addition, we have no control over producers or their production decisions, which are affected by, among other things, prevailing and projected energy prices, drilling costs per Mcf, demand for hydrocarbons, operational challenges, access to downstream markets, the level of reserves, geological considerations, governmental regulations and the availability and cost of capital. In addition, fluctuations in energy prices can greatly affect production rates and investments by third parties in the development of new oil and natural gas reserves. Drilling activity generally decreases as oil and natural gas prices decrease. During 2013 and 2012, natural gas prices remained relatively low, leading some producers to announce significant reductions to their drilling plans specifically in dry gas areas. If sustained over the long-term, low gas prices could lead to a material reduction in volumes in certain areas of our operations.
Because of these factors, even if new natural gas reserves are discovered in areas served by our assets, producers may choose not to develop those reserves. If we are not able to obtain new supplies of natural gas to replace the natural decline in volumes from existing wells due to reductions in drilling activity or competition, throughput on our pipelines and the utilization rates of our facilities would decline, which could have a material adverse effect on our business, results of operations, financial condition and ability to make cash distributions.
We may not always be able to accurately estimate hydrocarbon reserves and expected production volumes; therefore, volumes we service in the future could be less than we anticipate.
We work closely with our producer customers in an effort to understand hydrocarbon reserves and expected production volumes, and we periodically review or have outside consultants review hydrocarbon reserve information and expected production data that is publicly available or that is provided to us by our producer customers. However, we may not always be able to accurately estimate hydrocarbon reserves and production volumes expected to be delivered to us for a variety of reasons, including as a result of the unavailability of sufficiently detailed information and unanticipated changes in producers' expected drilling schedules. Accordingly, we may not have accurate estimates of total reserves serviced by our assets, the anticipated life of such reserves, or the expected volumes to be produced from those reserves. If the total reserves, estimated life of the reserves or anticipated volume to be produced from the reserves is less than we anticipate and we are unable to secure additional sources, then the volumes that we gather or process in the future could be less than anticipated. A decline in the volumes could have a material adverse effect on our results of operations and financial condition.
Growing our business by constructing new pipelines and processing and treating facilities subjects us to construction risks and risks that natural gas or NGL supplies may not be available upon completion of the facilities.
One of the ways we intend to grow our business is through the construction of, or additions to our existing gathering, treating, processing and fractionation facilities. The construction of gathering,
39
Table of Contents
processing, fractionation and treating facilities requires the expenditure of significant amounts of capital which may exceed our expectations. Construction involves many factors beyond our control including delays caused by third-party landowners, unavailability of materials, labor disruptions, environmental hazards, financing, accidents, weather and other factors. Additionally, we are subject to numerous regulatory, environmental, political, legal and inflationary uncertainties, as well as stringent, lengthy and occasionally unreasonable or impractical federal, state and local permitting, consent, or authorizations requirements, which may cause us to incur additional capital expenditures for meeting certain conditions or requirements or which may delay, interfere with or impair our construction activities. As a result, new facilities may not be constructed as scheduled or as originally designed, which may require redesign and additional equipment, relocations of facilities or rerouting of pipelines, which in turn could subject us to additional capital costs, additional expenses or penalties and may adversely affect our operations and cash flows available for distribution to unitholders. In addition, the coordination and monitoring of this diverse group of projects requires skilled and experienced labor. If we undertake these projects, we may not be able to complete them on schedule, or at all, or at the budgeted cost. In addition, certain agreements with our producer customers contain substantial financial penalties and/or give the producer the right to repurchase certain assets and terminate their contracts with us if construction deadlines are not achieved. Any such penalty or contract termination could have a material adverse effect on our income from operations, cash flows and quarterly distribution to common unitholders. Moreover, our revenues may not increase immediately upon the expenditure of funds on a particular project. For instance, if we build a new pipeline, the construction may occur over an extended period of time, and we may not receive any material increases in revenues until after completion of the project, if at all.
Furthermore, we may have only limited natural gas or NGL supplies committed to these facilities prior to their construction. Moreover, we may construct facilities to capture anticipated future growth in production or satisfy anticipated market demand in a region in which anticipated production growth or market demand does not materialize, the facilities may not operate as planned or may not be used at all. We may also rely on estimates of proved reserves in our decision to construct new pipelines and facilities, which may prove to be inaccurate because there are numerous uncertainties inherent in estimating quantities of proved reserves. As a result, new facilities may not be able to attract enough natural gas or NGLs to achieve our expected investment return, which could adversely affect our operations and cash flows available for distribution to our unitholders.
Due to capacity, market and other constraints relating to the growth of our business, we may experience difficulties in the execution of our business plan, which may increase our costs and reduce our revenues and our cash available for distribution.
The successful execution of our business strategy is impacted by a variety of factors, including our ability to grow our business and satisfy our producer customers' requirements for gathering, processing, fractionation and marketing services. Our ability to grow our business and satisfy our customers' requirements may be adversely affected by a variety of factors, including the following:
- •
- more stringent permitting and other regulatory requirements;
- •
- a limited supply of qualified fabrication and construction contractors, which could delay or increase the cost of the construction and installation of our facilities or increase the cost of operating our existing facilities;
- •
- unexpected increases in the volume of natural gas and NGLs being delivered to our facilities, which could adversely affect our ability to expand our facilities in a manner that is consistent with our customers' production schedules;
- •
- unexpected outages or downtime at our facilities or at upstream or downstream third party facilities, which could reduce the volumes of gas and NGLs that we receive; and
40
Table of Contents
- •
- market and capacity constraints affecting downstream natural gas and NGL facilities, including limited gas and NGL capacity downstream of our facilities, limited railcar and NGL pipeline facilities and reduced demand or limited markets for certain NGL products, which could reduce the volumes of gas and NGLs that we receive and adversely affect the pricing received for NGLs.
If we are unable to successfully execute our business strategy, then our operating and capital expenditures may materially increase and our revenues and our cash available for distribution to our common unitholders may be adversely affected.
Our profitability and cash flows are affected by the volatility of NGL product and natural gas prices.
We are subject to significant risks associated with frequent and often substantial fluctuations in commodity prices. In the past, the prices of natural gas and NGLs have been volatile and we expect this volatility to continue. The New York Mercantile Exchange ("NYMEX") daily settlement price of natural gas for the prompt month contract in 2012 ranged from a high of $3.90 per MMBtu to a low of $1.91 per MMBtu. In 2013, the same index ranged from a high of $4.46 per MMBtu to a low of $3.11 per MMBtu. Also as an example, the composite of the weighted monthly average NGLs price at our Appalachian facilities based on our average NGLs composition in 2012 ranged from a high of approximately $1.73 per gallon to a low of approximately $1.00 per gallon. In 2013, the same composite ranged from a high of approximately $1.43 per gallon to a low of approximately $1.02 per gallon. The markets and prices for natural gas and NGLs depend upon factors beyond our control. These factors include demand for oil, natural gas and NGLs, which fluctuate with changes in market and economic conditions and other factors, including:
- •
- the level of domestic oil, natural gas and NGL production;
- •
- demand for natural gas and NGL products in localized markets;
- •
- changes in interstate pipeline gas quality specifications;
- •
- imports and exports of crude oil, natural gas and NGLs;
- •
- seasonality and weather conditions;
- •
- the condition of the U.S. and global economies;
- •
- political conditions in other oil-producing and natural gas-producing countries; and
- •
- government regulation, legislation and policies.
Our net operating margins under various types of commodity-based contracts are directly affected by changes in NGL product prices and natural gas prices and thus are more sensitive to volatility in commodity prices than our fee-based contracts. Additionally, our purchase and resale of gas in the ordinary course of business exposes us to significant risk of volatility in gas prices due to the potential difference in the time of the purchases and sales and the potential existence of a difference in the gas price associated with each transaction. Significant declines in commodity prices could have an adverse impact on cash flows from operations that could result in noncash impairments of long-lived assets.
Relative changes in NGL product and natural gas prices may adversely impact our results due to frac spread, natural gas and NGL exposure.
Under our keep-whole arrangements, our principal cost is delivering dry gas of an equivalent Btu content to replace Btus extracted from the gas stream in the form of NGLs or consumed as fuel during processing. The spread between the NGL product sales price and the purchase price of natural gas with an equivalent Btu content is called the "frac spread." Generally, the frac spread and, consequently, the net operating margins are positive under these contracts. In the event natural gas becomes more
41
Table of Contents
expensive on a Btu equivalent basis than NGL products, the cost of keeping the producer "whole" results in operating losses.
Additionally, due to the timing of purchases and sales of natural gas and NGLs, direct exposure to changes in market prices of either gas or NGLs can be created because there is no longer an offsetting purchase or sale that remains exposed to market pricing. Direct exposure may occur naturally as a result of our production processes or we may create exposure through purchases of NGLs or natural gas. Given that we have derivative positions, adverse movement in prices to the positions we have taken may negatively impact results.
Our commodity derivative activities may reduce our earnings, profitability and cash flows.
Our operations expose us to fluctuations in commodity prices. We utilize derivative financial instruments related to the future price of crude oil, natural gas and certain NGLs with the intent of reducing volatility in our cash flows due to fluctuations in commodity prices.
The extent of our commodity price exposure is related largely to our contract mix and the effectiveness and scope of our derivative activities. We have a policy to enter into derivative transactions related to only a portion of the volume of our expected production or fuel requirements that are subject to commodity price volatility and, as a result, we expect to continue to have some direct commodity price exposure. Our actual future production or fuel requirements may be significantly higher or lower than we estimate at the time we enter into derivative transactions for such period. If the actual amount is higher than we estimate, we will have greater commodity price exposure than we intended. If the actual amount is lower than the amount that is subject to our derivative financial instruments, we might be forced to settle all or a portion of our derivative transactions without the benefit of the cash flow from our sale or purchase of the underlying physical commodity, which could result in a substantial diminution of our liquidity. Alternatively, we may seek to amend the terms of our derivative financial instruments, including the extension of the settlement date of such instruments. Additionally, because we may use derivative financial instruments relating to the future price of crude oil to mitigate our exposure to NGL price risk, the volatility of our future cash flows and net income may increase if there is a change in the pricing relationship between crude oil and NGLs. As a result of these factors, our risk management activities may not be as effective as we intend in reducing the downside volatility of our cash flows and, in certain circumstances, may actually increase the volatility of our cash flows. In addition, our risk management activities are subject to the risks that a counterparty may not perform its obligation under the applicable derivative instrument, the terms of the derivative instruments are imperfect and our risk management policies and procedures are not properly followed. It is possible that the steps we take to monitor our derivative financial instruments may not detect and prevent violations of our risk management policies and procedures, particularly if deception or other intentional misconduct is involved. For further information about our risk management policies and procedures, please read Note 7 of the accompanying Notes to the Consolidated Financial Statements included in Item 8 of this Form 10-K.
We conduct risk management activities but we may not accurately predict future commodity price fluctuations and, therefore, our risk management activities may expose us to financial risks and may reduce our opportunity to benefit from price increases.
We evaluate our exposure to commodity price risk from an overall portfolio basis. We have discretion in determining whether and how to manage the commodity price risk associated with our physical and derivative positions.
To the extent that we do not manage the commodity price risk relating to a position that is subject to commodity price risk and commodity prices move adversely, we could suffer losses. Such losses could be substantial and could adversely affect our operations and cash flows available for distribution to our unitholders. In addition, managing the commodity risk may actually reduce our opportunity to benefit from increases in the market or spot prices.
42
Table of Contents
The enactment of the Dodd-Frank Act and promulgation of regulations thereunder could have an adverse impact on our ability to manage risks associated with our business.
Congress has adopted comprehensive financial reform legislation that establishes federal oversight and regulation of the OTC derivatives market and entities. The legislation, known as the Dodd-Frank Wall Street Reform and Consumer Protection Act (the "Dodd-Frank Act"), was signed into law on July 21, 2010 and requires the Commodities Futures Trading Commission (the "CFTC"), the SEC and other regulators to promulgate rules and regulations implementing the legislation. Among the regulations the CFTC has finalized are regulations establishing criteria for firms that must register as a "Swap Dealer" or "Major Swap Participant" as well as those eligible for the end-user exemption to mandatory clearing, and regulations establishing the definition and criteria for transactions that qualify as "Swaps". However, the Dodd-Frank Act calls for a variety of other rules, some of which either have not been proposed or are pending in proposed form. The timing and content of these rules, and their effect on us, are uncertain. For example, we could be required to comply with margin requirements and with certain clearing and trade execution requirements in connection with our derivative activities either through direct regulation of us or indirectly through regulation of our derivative counterparties, although the specifics of those provisions are uncertain at this time. The rules may also require the counterparties to our derivative instruments to spin off some of their derivatives activities to separate entities, which may not be as creditworthy as our current counterparties. The Dodd-Frank Act and any new regulations could also significantly increase the cost of derivative contracts (including through requirements to post collateral which could adversely affect our available liquidity), materially alter the terms of derivative contracts, reduce the availability of derivatives to protect against risks that we encounter, reduce our ability to monetize or restructure our existing derivative contracts, increase the administrative burden and regulatory risk associated with entering into certain derivative contracts, and increase our exposure to less creditworthy counterparties. If we reduce our use of derivatives as a result of the Dodd-Frank Act and its implementing regulations, our results of operations may become more volatile and our cash flows may be less predictable, which could adversely affect our ability to plan for and fund capital expenditures. Any of these consequences could have a material adverse effect on our income from operations, cash flows and quarterly distribution to common unitholders.
Due to an increased domestic supply of NGLs, we may be required to find alternative NGL market outlets and to rely more heavily on the export of NGLs to foreign countries, which may increase our operating costs or reduce the price received for NGLs and thereby reduce our cash available for distribution.
Due to the increased production of natural gas in the United States, particularly in shale plays, there is an increased supply of NGLs, which is currently outpacing and could continue to outpace, demand for NGLs domestically. As a result, we and our producer customers may need to continue to find alternate NGL market outlets and to rely more heavily on the export of NGLs to foreign countries. Our ability to find alternative NGL market outlets is dependent upon a variety of factors, including the construction and installation of additional NGL transportation infrastructure necessary to transport NGLs to other markets. In order to obtain committed transportation capacity, it may be necessary to make significant minimum volume commitments, with take or pay payments or deficiency fees if the minimum volume is not delivered. In many cases, we market NGLs on behalf of our producer customers, and as a result, we may make such commitments on behalf of our producer customers. We expect to be able to pass such commitments through to our producer customers, but if we were unable to do so, our operating costs may increase significantly, which could have a material adverse effect on our results of operations and our ability to make cash distributions. Similarly, our ability to export NGLs to foreign countries on a competitive basis is impacted by various factors, including:
- •
- availability of sufficient terminalling facilities in the United States;
- •
- availability of sufficient rail car and tanker capacity;
43
Table of Contents
- •
- currency fluctuations, particularly to the extent sales are denominated in foreign currencies as we do not currently hedge against currency fluctuations;
- •
- compliance with additional governmental regulations and maritime requirements, including U.S. export controls and foreign laws, sanctions regulations and the Foreign Corrupt Practices Act;
- •
- risks of loss resulting from nonpayment or nonperformance by international purchasers; and
- •
- political and economic disturbances in the countries to which NGLs are being exported.
The above factors could increase our operating costs or adversely affect the price that we and our producer customers receive for NGLs, which in turn may have a material adverse effect on our volumes, revenues, income and cash available for distribution to our common unitholders.
We depend on third parties for the natural gas and refinery off-gas we process, and the NGLs we fractionate at our facilities, and a reduction in these quantities could reduce our revenues and cash flow.
Although we obtain our supply of natural gas, refinery off-gas and NGLs from numerous third-party producers, a significant portion comes from a limited number of key producers/suppliers who are committed to us under processing contracts. According to these contracts or other supply arrangements, however, the producers are usually under no obligation to deliver a specific quantity of natural gas or NGLs to our facilities. If these key suppliers, or a significant number of other producers, were to decrease the supply of natural gas or NGLs to our systems and facilities for any reason, we could experience difficulty in replacing those lost volumes. Because our operating costs are primarily fixed, a reduction in the volumes of natural gas or NGLs delivered to us would result not only in a reduction of revenues, but also a decline in net income and cash flow.
We may not be able to retain existing customers, or acquire new customers, which would reduce our revenues and limit our future profitability.
A significant portion of our natural gas supply comes from a limited number of key producers/suppliers. The renewal or replacement of existing contracts with our customers at rates sufficient to maintain current revenues and cash flows depends on a number of factors beyond our control, including competition from other gatherers, processors, pipelines, fractionators, and the price of, and demand for, natural gas, NGLs and crude oil in the markets we serve. Our competitors include large oil, natural gas, refining and petrochemical companies, some of which have greater financial resources, more numerous or greater capacity pipelines, processing and other facilities, and greater access to natural gas and NGL supplies than we do. Additionally, our customers that gather gas through facilities that are not otherwise dedicated to us may develop their own processing and fractionation facilities in lieu of using our services. Certain of our competitors may also have advantages in competing for acquisitions, or other new business opportunities, because of their financial resources and synergies in operations.
As a consequence of the increase in competition in the industry, and the volatility of natural gas prices, end-users and utilities are reluctant to enter into long-term purchase contracts. Many end-users purchase natural gas from more than one natural gas company and have the ability to change providers at any time. Some of these end-users also have the ability to switch between gas and alternative fuels in response to relative price fluctuations in the market. Because there are numerous companies of greatly varying size and financial capacity that compete with us in the marketing of natural gas, we often compete in the end-user and utilities markets primarily on the basis of price. The inability of our management to renew or replace our current contracts as they expire and to respond appropriately to changing market conditions could affect our profitability. For more information regarding our competition, please read Item 1. Business—Competition of Part I of this Form 10-K.
44
Table of Contents
The fees charged to third parties under our gathering, processing, transmission, transportation, fractionation and storage agreements may not escalate sufficiently to cover increases in costs, or the agreements may not be renewed or may be suspended in some circumstances.
Our costs may increase at a rate greater than the fees we charge to third parties. Furthermore, third parties may not renew their contracts with us. Additionally, some third parties' obligations under their agreements with us may be permanently or temporarily reduced due to certain events, some of which are beyond our control, including force majeure events wherein the supply of either natural gas, NGLs or crude oil are curtailed or cut-off. Force majeure events include (but are not limited to): revolutions, wars, acts of enemies, embargoes, import or export restrictions, strikes, lockouts, fires, storms, floods, acts of God, explosions and mechanical or physical failures of equipment affecting our facilities or facilities of third parties. If the escalation of fees is insufficient to cover increased costs, or if third parties do not renew or extend their contracts with us, or if third parties suspend or terminate their contracts with us, our financial results would suffer.
We may not be able to successfully execute our business plan and may not be able to grow our business, which could adversely affect our operations and cash flows available for distribution to our unitholders.
Our ability to successfully operate our business, generate sufficient cash to pay the quarterly cash distributions to our unitholders and to allow for growth, is subject to a number of risks and uncertainties. Similarly, we may not be able to successfully expand our business through acquiring or growing our assets, because of various factors, including economic and competitive factors beyond our control. If we are unable to grow our business, or execute on our business plan including increasing or maintaining distributions, the market price of the common units is likely to decline.
Alternative financing strategies may not be successful.
Periodically, we may consider the use of alternative financing strategies such as joint venture arrangements and the sale of non-strategic assets. Joint venture arrangements may not share the risks and rewards of ownership in proportion to the voting interests. Joint venture arrangements may require us to pay certain costs or to make certain capital investments and we may have little control over the amount or the timing of these payments and investments. Joint venture arrangements may not permit us to distribute cash attributable to joint venture operations when we would otherwise desire to do so. We may not be able to negotiate terms that adequately reimburse us for our costs to fulfill service obligations for those joint ventures where we are the operator. In addition, certain joint venture partners have the option not to make any capital investments or to cease making capital investments after a certain time period. See Note 3 to the accompanying Notes to the Financial Statements included in Item 8 of this Form 10-K. If our joint venture partners elect not to contribute as much as we anticipate or if our joint venture partners are unable to meet their economic or other obligations, we may be required to fulfill those obligations alone.
We may periodically sell assets or portions of our business. Separating the existing operations from our assets or operations of which we dispose may result in significant expense and accounting charges, disrupt our business or divert management's time and attention. We may not achieve expected cost savings from these dispositions or the proceeds from sales of assets or portions of our business may be lower than the net book value of the assets sold. We may not be relieved of all of our obligations related to the assets or businesses sold. These factors could have a material adverse effect on our revenues, income from operations, cash flows and our quarterly distribution on our common units.
45
Table of Contents
We are exposed to the credit risks of our key customers and derivative counterparties, and any material nonpayment or nonperformance by our key customers or derivative counterparties could reduce our ability to make distributions to our unitholders.
We are subject to risks of loss resulting from nonpayment or nonperformance by our customers, which risks may increase during periods of economic uncertainty. Furthermore, some of our customers may be highly leveraged and subject to their own operating and regulatory risks, which increases the risk that they may default on their obligations to us. In addition, our risk management activities are subject to the risks that a counterparty may not perform its obligation under the applicable derivative instrument, the terms of the derivative instruments are imperfect, and our risk management policies and procedures are not properly followed. Any material nonpayment or nonperformance by our key customers or our derivative counterparties could reduce our ability to make distributions to our unitholders.
Transportation on certain of our pipelines may be subject to federal or state rate and service regulation, and the imposition and/or cost of compliance with such regulation could adversely affect our operations and cash flows available for distribution to our unitholders.
Some of our natural gas, NGL and crude oil pipelines are, or may in the future be, subject to siting, public necessity, rate and service regulations by FERC and/or various state regulatory bodies, depending upon jurisdiction. FERC generally regulates the transportation of natural gas, NGLs and crude oil in interstate commerce and FERC's regulatory authority includes: facilities construction, acquisition, extension or abandonment of services or facilities (for natural gas pipelines only); rates; operations; accounts and records; and depreciation and amortization policies. FERC's action in any of these areas or modifications of its current regulations can adversely impact our ability to compete for business, the costs we incur in our operations, the construction of new facilities or our ability to recover the full cost of operating our pipelines. We own a common carrier pipeline to transport NGL products in interstate commerce, and a common carrier crude oil pipeline to transport crude oil in interstate commerce. For both of these pipelines we comply with FERC requirements for such common carrier pipelines, including the filing of a tariff, and we may elect to construct additional common carrier NGL product pipelines in the future that may be subject to these requirements. We also own and are constructing pipelines that are carrying or are expected to carry NGLs owned by us across state lines that are not subject to FERC's requirements for common carrier NGL pipelines or would otherwise meet the qualifications for a waiver from FERC's applicable reporting and filing requirements. However, we cannot provide assurance that FERC will not at some point find that some or all of such transportation is subject to FERC's requirements for common carrier pipelines or is otherwise not exempt from its reporting and filing requirements. Such a finding could subject us to potentially burdensome and expensive operational, reporting and other requirements.
Intrastate natural gas and liquids pipelines, as well as proprietary natural gas and liquids pipelines are generally not subject to regulation by FERC; in addition, the NGA specifically exempts natural gas gathering systems from FERC's jurisdiction. Yet, such operations may still be subject to regulation by various state agencies. The applicable statutes and regulations generally require that our rates and terms and conditions of service provide no more than a fair return on the aggregate value of the facilities used to render services and that we offer service to our shippers on a not unduly discriminatory basis. We cannot assure unitholders that FERC will not at some point determine that such gathering and/or intrastate and proprietary pipelines are within its jurisdiction, and regulate such services, which could limit the rates that we may charge and increase our costs of operation. FERC rate cases can involve complex and expensive proceedings. For more information regarding regulatory matters that could affect our business, please read Item 1. Business—Regulatory Matters as set forth in this Annual Report on Form 10-K.
46
Table of Contents
Some of our natural gas, NGL and crude oil transportation operations are subject to FERC's rate-making policies that could have an adverse impact on our ability to establish rates that would allow us to recover the full cost of operating our pipelines including a reasonable return.
Action by FERC could adversely affect our ability to establish reasonable rates that cover operating costs and allow for a reasonable return. An adverse determination in any future rate proceeding brought by or against us could have a material adverse effect on our business, financial condition and results of operations.
For example, one such matter relates to FERC's policy regarding allowances for income taxes in determining a regulated entity's cost of service. In May 2005, FERC adopted a policy statement ("Policy Statement"), stating that it would permit entities owning public utility assets, including oil and natural gas pipelines, to include an income tax allowance in such utilities' cost-of-service rates to reflect actual or potential tax liability attributable to their public utility income, regardless of the form of ownership. Pursuant to the Policy Statement, a tax pass-through entity seeking such an income tax allowance would have to establish that its partners or members have an actual or potential income tax obligation on the entity's public utility income. This tax allowance policy was upheld by the D.C. Circuit in May 2007. Whether a pipeline's owners have actual or potential income tax liability may be reviewed by FERC on a case-by-case basis. How the Policy Statement is applied in practice to pipelines owned by publicly traded partnerships could impose limits on our ability to include a full income tax allowance in cost of service.
If we are unable to obtain new rights-of-way or other property rights, or the cost of renewing existing rights-of-way or property rights increases, then we may be unable to fully execute our growth strategy, which may adversely affect our operations and cash flows available for distribution to unitholders.
The construction of additions to our existing gathering assets and the expansion of our gathering, processing and fractionation assets may require us to obtain new rights-of-way or other property rights prior to constructing new plants, pipelines and other transportation facilities. We may be unable to obtain such rights-of-way or other property rights to connect new natural gas supplies to our existing gathering lines, to connect our existing or future facilities to new natural gas or natural gas liquids markets, or capitalize on other attractive expansion opportunities. Additionally, it may become more expensive for us to obtain new rights-of-way or other property rights or to renew existing rights-of-way or property rights. If the cost of obtaining new or renewing existing rights-of-way or other property rights increases, it may adversely affect our operations and cash flows available for distribution to unitholders.
Increases in interest rates could increase our costs and reduce our cash available for distribution.
Interest rates may increase in the future. The interest rate charged under our Credit Facility is subject to fluctuation if interest rates increase. In addition, from time to time, we may seek to refinance existing long-term debt or to incur additional long-term debt, and increases in interest rates could cause the interest rate on any such refinanced or additional debt to increase. In such event, our costs may increase, which could reduce our cash available for distribution to our common unitholders.
We are indemnified for liabilities arising from an ongoing remediation of property on which certain of our facilities are located and our results of operation and our ability to make distributions to our unitholders could be adversely affected if an indemnifying party fails to perform its indemnification obligations.
�� Columbia Gas is the previous owner of the property on which our Kenova, Boldman, Cobb, Kermit and Majorsville facilities are located, and is the previous operator of our Boldman and Cobb facilities and current operator of our Kermit facility. Columbia Gas has been or is currently involved in investigatory or remedial activities with respect to the real property underlying the Boldman, Cobb and
47
Table of Contents
Majorsville facilities pursuant to an "Administrative Order by Consent for Removal Actions" entered into by Columbia Gas and the U.S. Environmental Protection Agency and, in the case of the Boldman facility, an "Agreed Order" with the Kentucky Natural Resources and Environmental Protection Cabinet.
Columbia Gas has agreed to retain sole liability and responsibility for, and to indemnify us against, any environmental liabilities associated with these regulatory orders or the real property underlying these facilities to the extent such liabilities arose prior to the effective date of the agreements pursuant to which such properties were acquired or leased from Columbia Gas.
In addition, Consol Coal is the previous owner and/or operator of certain facilities on the real property on which our rail facility is constructed near Houston, Pennsylvania, and has been or is currently involved in investigatory or remedial activities related to AMD with respect to the real property underlying these facilities. Consol Coal has accepted liability and responsibility for, and has agreed to indemnify us against, any environmental liabilities associated with the AMD that are not exacerbated by us in connection with our operations.
Our results of operation and our ability to make cash distributions to our unitholders could be adversely affected if in the future either Columbia Gas or Consol Coal fails to perform under the indemnification provisions of which we are the beneficiary.
Our business is subject to laws and regulations with respect to environmental, occupational safety and health, nuisance, zoning, land use and other regulatory matters, and the violation of, or the cost of compliance with, such laws and regulations could adversely affect our operations and cash flows available for distribution to our unitholders.
Numerous governmental agencies enforce comprehensive and stringent federal, regional, state and local laws and regulations on a wide range of environmental, occupational safety and health, nuisance, zoning, land use and other regulatory matters. We could be adversely affected by increased costs due to stricter pollution-control requirements or liabilities resulting from non-compliance with operating or other regulatory permits. Strict joint and several liability may be incurred without regard to fault, or the legality of the original conduct, under certain of the environmental laws for remediation of contaminated areas, including CERCLA, RCRA and analogous state laws. Private parties, including the owners of properties located near our storage, fractionation and processing facilities or through which our pipeline systems pass, also may have the right to pursue legal actions to enforce compliance, as well as seek damages for non-compliance with environmental laws and regulations or for personal injury or property damage. New, more stringent environmental laws, regulations and enforcement policies, and new, amended or re-interpreted permitting requirements, policies and processes, might adversely affect our operations and activities, and existing laws, regulations and policies could be reinterpreted or modified to impose additional requirements, delays or constraints on our construction of facilities or on our operations. For example, it is possible that future amendment or re-interpretation of existing air emission laws could impose more stringent permitting or pollution control equipment requirements on us if two or more of our facilities are aggregated into one air emissions permit or permit application, which could increase our costs. Federal, state and local agencies also could impose additional safety requirements, any of which could affect our profitability. Local governments may adopt more stringent local permitting and zoning ordinances that impose additional time, place and manner restrictions, delays or constraints on our activities to construct and operate our facilities, require the relocation of our facilities, prevent or restrict the expansion of our facilities, or increase our costs to construct and operate our facilities, including the construction of sound mitigation devices.
In addition, we face the risk of accidental releases or spills associated with our operations, which could result in material costs and liabilities, including those relating to claims for damages to property, natural resources and persons, environmental remediation and restoration costs, and governmental fines
48
Table of Contents
and penalties. Our failure to comply with or alleged non-compliance with environmental or safety-related laws and regulations could result in administrative, civil and criminal penalties, the imposition of investigatory and remedial obligations and even injunctions that restrict or prohibit some or all of our operations. For more information regarding the environmental, safety and other regulatory matters that could affect our business, please read Item 1. Business—Regulatory Matters, Item 1. Business—Environmental Matters, and Item 1. Business—Pipeline Safety Regulations, each as set forth in this Annual Report on Form 10-K.
Climate change legislation or regulations restricting emissions of GHGs could result in increased operating costs, reduced demand for our services, and adversely affect the cash flows available for distribution to our unitholders.
As a consequence to an EPA administrative conclusion that GHGs present an endangerment to public health and the environment, the EPA has adopted regulations establishing PSD construction and Title V operating permit requirements for GHG emissions from certain large stationary sources that are potential major sources of GHG emissions. Also, the EPA adopted rules regulating the monitoring and reporting of GHG emissions from specified large GHG emission sources in the United States on an annual basis, including, among others, certain onshore and offshore oil and natural gas production and onshore oil and natural gas processing, fractionation, transmission, storage and distribution facilities. In addition, Congress has from time to time considered legislation to reduce emissions of GHGs, but, in the absence of federal climate legislation in the United States in recent years, a number of state and regional efforts have emerged that are aimed at tracking and/or reducing GHG emissions by means of cap and trade programs that typically require major sources of GHG emissions to acquire and surrender emission allowances in return for emitting those GHGs. If Congress were to undertake comprehensive tax reform in the coming year, it is possible that such reform may include a carbon tax, which could impose additional direct costs on operations and reduce demand for oil, natural gas, NGLs and products derived therefrom. These requirements or the adoption of any new legislation or regulations that requires additional reporting, monitoring or recordkeeping of GHGs, limits emissions of GHGs from our equipment and operations, or imposes a carbon tax, could adversely affect our operations and materially restrict or delay our ability to obtain air permits for new or modified facilities, could require us to incur costs to reduce emissions of GHGs associated with our operations or could adversely affect demand for the oil and natural gas we process or fractionate. For example, in June 2013, utilizing his executive authority, President Obama announced a climate change plan for the EPA to regulate carbon emissions under the Clean Air Act. President Obama's plan is initially focused on emissions standards for existing power plants and instructs the EPA to issue a proposal by June 1, 2014 and a final rule by June 1, 2015. Under the plan, states will submit their implementation plans by June 30, 2016. It is unclear if and to what extent, the EPA may expand the scope of the plan to existing facilities in other industries, including the oil and natural gas industry. Such an expansion, taken together with the EPA's prior administrative conclusion that GHGs present an endangerment to public health and the environment and the rules previously adopted by the EPA regulating the monitoring and reporting of GHG emissions from specified large GHG emission sources, could have a material adverse effect on our ability to operate our existing gathering, compression, processing and fractionation facilities as well as to construct and install new facilities of this nature. We may experience delays in the construction and installation of new facilities due to more stringent permitting requirements, incur additional costs to reduce emissions of GHGs associated with our operations or be required to aggregate the emissions from separate facilities for permitting purposes or to relocate one or more of our facilities due to more stringent emissions standards. To the extent that we incur additional costs or delays, our cash available for distribution may be adversely affected. Our producer customers may also experience similar issues, which may adversely impact their drilling schedules and production volumes and reduce the volumes of natural gas that we receive for gathering and processing. For more
49
Table of Contents
information regarding greenhouse gas emission and regulation, please read Item 1. Business—Environmental Matters—Air and Greenhouse Gases.
Finally, for a variety of reasons, natural and/or anthropogenic, climate changes could occur which could have significant physical effects, such as increased frequency and severity of storms, droughts and floods and other climatic events; if any such effects were to occur, they could have an adverse effect on our assets and operations, which in turn could adversely affect our cash available for distribution to our unitholders.
Federal, state and local legislation and regulatory initiatives relating to hydraulic fracturing, as well as governmental reviews of such activities, could result in reduced volumes available for us to gather, process and fractionate.
We do not conduct hydraulic fracturing operations, but we do provide gathering, processing and fractionation services with respect to natural gas and NGLs produced by our producer customers as a result of such operations. Hydraulic fracturing is an important and common practice that is used to stimulate production of hydrocarbons, particularly natural gas, from tight formations such as shales. The process involves the injection of water, sand and chemicals under pressure into targeted subsurface formations to fracture the surrounding rock and stimulate production. The process is typically regulated by state oil and gas commissions but the EPA has asserted federal regulatory authority for certain hydraulic fracturing activities involving the use of diesel fuels and has indicated it may seek to further expand its regulation of hydraulic fracturing. In addition, from time to time Congress considers legislation to provide for additional regulation of hydraulic fracturing. At the state level, several states have adopted or are considering legal requirements that could impose more stringent permitting, disclosure, and well construction requirements on hydraulic fracturing activities. Local governments also may seek to adopt ordinances within their jurisdictions regulating the time, place and manner of drilling activities in general or hydraulic fracturing activities in particular. If new federal, state or local laws or regulations that significantly restrict hydraulic fracturing are adopted, such legal requirements could make it more difficult to complete natural gas wells in shale formations and increase our producers' costs of compliance. This could significantly reduce the volumes of natural gas that we gather and process and NGLs that we gather and fractionate which could adversely impact our earnings, profitability and cash flows. Also, certain governmental reviews have been conducted or are underway that focus on environmental aspects of hydraulic fracturing practices. Most notably, the EPA has commenced a study of the potential environmental effects of hydraulic fracturing on drinking water and groundwater, with a draft report drawing conclusions about the potential impacts of hydraulic fracturing on drinking water resources expected to be available for public comment and peer review by 2014, and has also announced the proposed development of effluent limitations for the treatment and discharge of wastewater resulting from hydraulic fracturing activities in 2014. Also, the federal Bureau of Land Management has proposed regulations applicable to hydraulic fracturing conducted on federal and Indian oil and natural gas leases. Other governmental agencies, including the U.S. Department of Energy have evaluated or are evaluating various other aspects of hydraulic fracturing. Moreover, the White House Council on Environmental Quality is coordinating an administration-wide review of hydraulic fracturing practices. These studies, depending on their degree of pursuit and any meaningful results obtained, could spur initiatives to further regulate hydraulic fracturing and reduce demand for our gathering, processing and fractionating services.
The amount of gas we process, gather and transmit, or the NGLs and crude oil we gather and transport, may be reduced if the pipelines to which we deliver the natural gas, NGLs or crude oil cannot, or will not, accept the gas, NGLs or crude oil.
All of the natural gas we process, gather and transmit is delivered into pipelines for further delivery to end-users. If these pipelines cannot, or will not, accept delivery of the gas due to
50
Table of Contents
downstream constraints on the pipeline, limits on or changes in or inability to meet interstate pipeline gas quality specifications, we may be forced to limit or stop the flow of gas through our pipelines and processing systems. In addition, interruption of pipeline service upstream of our processing facilities would limit or stop flow through our processing and fractionation facilities. Likewise, if the pipelines or other outlets into which we deliver NGLs or crude oil are interrupted, we may be limited in, or prevented from conducting, our crude oil or NGL transportation operations and our sales would be less. Any number of factors beyond our control could cause such interruptions or constraints on pipeline service, including necessary and scheduled maintenance, or unexpected damage to the upstream or downstream pipelines or to ours or other's facilities. Because our revenues and net operating margins depend upon (i) the volumes of natural gas we process, gather and transmit, (ii) the throughput of NGLs through our transportation, fractionation and storage facilities and (iii) the volume of crude oil we gather and transport, any reduction of volumes could adversely affect our operations and cash flows available for distribution to our unitholders.
We are subject to operating and litigation risks that may not be covered by insurance.
Our industry is subject to numerous operating hazards and risks incidental to gathering, processing, transporting, fractionating and storing natural gas and NGLs and to transporting and storing crude oil. These include:
- •
- damage to pipelines, plants, related equipment and surrounding properties caused by floods, hurricanes and other natural disasters and acts of terrorism;
- •
- inadvertent damage from vehicles and construction and farm equipment;
- •
- leakage of crude oil, natural gas, NGLs and other hydrocarbons into the environment, including groundwater;
- •
- fires and explosions; and
- •
- other hazards and conditions, including those associated with various hazardous pollutant emissions, high-sulfur content, or sour gas, and proximity to businesses, homes, or other populated areas, that could also result in personal injury and loss of life, pollution and suspension of operations.
As a result, we may be a defendant in various legal proceedings and litigation arising from our operations. We may not be able to maintain or obtain insurance of the type and amount we desire at reasonable rates and, even if we are able to obtain such insurance, we may not be able to recover amounts from the insurance carrier. Market conditions could cause certain insurance premiums and deductibles to become unavailable, or available only for reduced amounts of coverage. For example, insurance carriers now require broad exclusions for losses due to war risk and terrorist acts. If we were to incur a significant liability for which we were not fully insured, it could have a material adverse effect on our operations and cash flows available for distribution to our unitholders.
We may incur significant costs and liabilities resulting from performance of pipeline integrity programs and related repairs.
Pursuant to the Pipeline Safety Improvement Act of 2002, as reauthorized and amended by the Pipeline Inspection, Protection, Enforcement and Safety Act of 2006 and the Pipeline Safety, Regulatory Certainty and Job Creation Act of 2011, the DOT through the PHMSA has adopted regulations requiring pipeline operators to develop integrity management programs for gas transmission and hazardous liquids pipelines located where a leak or rupture could do the most harm. The regulations require the following of operators of covered pipelines to:
- •
- perform ongoing assessments of pipeline integrity;
51
Table of Contents
- •
- identify and characterize applicable threats to pipeline segments that could impact a high consequence area;
- •
- improve data collection, integration and analysis;
- •
- repair and remediate the pipeline as necessary; and
- •
- implement preventive and mitigating actions.
In addition, states have adopted regulations similar to existing PHMSA regulations for intrastate gathering and transmission lines. At this time, we cannot predict the ultimate cost of compliance with this regulation, as the cost will vary significantly depending on the number and extent of any repairs found to be necessary as a result of the pipeline integrity testing. The results of these tests could cause us to incur significant and unanticipated capital and operating expenditures or repairs or upgrades deemed necessary to ensure the continued safe and reliable operations of our gathering and transmission lines.
Pipeline safety laws and regulations expanding integrity management programs or requiring the use of certain safety technologies, or expanding to in-plant equipment and pipelines within NGL fractionation and storage facilities, could require us to use more comprehensive and stringent safety controls and subject us to increased capital and operating costs.
On January 3, 2012, President Obama signed the 2011 Pipeline Safety Act, which, among other things, increases the maximum civil penalty for pipeline safety violations and directs the Secretary of Transportation to promulgate rules or standards relating to expanded integrity management requirements, automatic or remote-controlled valve use, excess flow valve use, leak detection system installation and testing to confirm the material strength of pipe operating above 30% of specified minimum yield strength in high consequence areas. The 2011 Pipeline Safety Act also increases the maximum penalty for violation of the pipeline safety regulations from $100,000 to $200,000 per violation per day of violation and also from $1 million to $2 million for a related series of violations. In addition, the PHMSA published a final rule in May 2011 expanding pipeline safety requirements including added reporting obligations and integrity management standards to certain rural low-stress hazardous liquid pipelines that were not previously regulated in such manner. Also, in August 2011, the PHMSA published an advance notice of proposed rulemaking in which the agency is seeking public comment on a number of changes to regulations governing the safety of gas transmission pipelines, gathering lines and related facilities. In addition, PHMSA and other state regulators have in the recent past expanded the scope of their regulatory inspections to include certain in-plant equipment and pipelines found within NGL fractionation facilities and associated storage facilities, in order to assess compliance of such equipment and pipelines with hazardous liquid pipeline safety requirements. These recent actions by PHMSA are currently subject to judicial and administrative challenges by one or more midstream operators. The adoption of these and other laws or regulations that apply more comprehensive or stringent safety standards to gas or NGL lines, or the expansion of regulatory inspections by PHMSA and other state regulators described above, could require us to install new or modified safety controls, pursue added capital projects, make modifications or operational changes, or conduct maintenance programs on an accelerated basis, all of which could require us to incur increased capital and operational costs or operational delays that could be significant and have a material adverse effect on its financial position or results of operations and ability to make distributions to our unitholders.
Interruptions in operations at any of our facilities may adversely affect our operations and cash flows available for distribution to our unitholders.
Our operations depend upon the infrastructure that we have developed, including processing and fractionation plants, storage facilities, gathering facilities, various means of transportation and
52
Table of Contents
marketing services. Any significant interruption at these facilities or pipelines, or in our ability to transmit natural gas or NGLs, or to transport crude oil to or from these facilities or pipelines for any reason, or to market or transport the natural gas or NGL's, would adversely affect our operations and cash flows available for distribution to our unitholders.
Operations at our facilities could be partially or completely shut down, temporarily or permanently, as the result of circumstances not within our control, such as:
- •
- unscheduled turnarounds or catastrophic events at our physical plants or facilities;
- •
- restrictions imposed by governmental authorities or court proceedings;
- •
- labor difficulties that result in a work stoppage or slowdown;
- •
- a disruption in the supply of crude oil to our crude oil pipeline, natural gas to our processing plants or gathering pipelines, or a disruption in the supply of NGLs to our NGL pipelines and fractionation facilities;
- •
- disruption in our supply of water and other resources necessary to operate our facilities;
- •
- damage to our facilities resulting from gas or NGLs that do not comply with applicable specifications; and
- •
- inadequate fractionation, transportation or storage capacity or market access to support production volumes, including lack of availability of rail cars, trucks and pipeline capacity.
In addition, the construction and operation of certain of our facilities in our Marcellus, Utica and Northeast segments may be impacted by surface or subsurface mining operations. One or more third parties may have previously engaged in, may currently be engaged in, or may in the future engage in, subsurface mining operations near or under our facilities, which could cause subsidence or other damage to our facilities or adversely impact our construction activities. In such event, our operations at such facilities may be impaired or interrupted, and we may not be able to recover the costs incurred to repair our facilities from such third parties.
Due to our lack of asset diversification, adverse developments in our gathering, processing, transportation, transmission, fractionation and storage businesses could reduce our operations and cash flows available for distribution to our unitholders.
We rely exclusively on the revenues generated from our gathering, processing, transportation, transmission, fractionation and storage businesses. An adverse development in one of these businesses would have a significantly greater impact on our operations and cash flows available for distribution to our unitholders than if we maintained more diverse assets.
Our business may suffer if any of our key senior executives or other key employees discontinues employment with us or if we are unable to recruit and retain highly skilled staff.
Our future success depends to a large extent on the services of our key employees. Our business depends on our continuing ability to recruit, train and retain highly qualified employees, including accounting, field operations, finance and other key back-office and mid-office personnel. The competition for these employees is intense, and the loss of these employees could harm our business. Our equity based long-term incentive plans are a significant component of our strategy to retain key employees. Further, our ability to successfully integrate acquired companies or handle complexities related to managing joint ventures depends in part on our ability to retain key management and existing employees at the time of the acquisition.
53
Table of Contents
A shortage of qualified labor may make it difficult for us to maintain labor productivity and continue to grow our business, and competitive costs could adversely affect our operations and cash flows available for distribution to our unitholders.
The ability to hire, train and retain skilled and experienced personnel is required to manage and operate our growing business. In recent years, there has been a shortage of personnel trained in various skills associated with the operations and management of the midstream energy business. This shortage of trained workers is the result of the previous generation's experienced workers reaching the age for retirement, combined with the difficulty of attracting new laborers to the midstream energy industry. Thus, this shortage of skilled labor could continue over an extended period. If the shortage of experienced labor continues or worsens, it could have an adverse impact on our labor productivity and costs and our ability to expand production in the event there is an increase in the demand for our products and services, which could adversely affect our operations and cash flows available for distribution to our unitholders.
If we are unable to make strategic acquisitions on economically acceptable terms, our ability to implement our business strategy may be impaired.
In addition to organic growth, a component of our business strategy can include the expansion of our operations through strategic acquisitions. If we are unable to make accretive strategic acquisitions that increase the cash generated from operations per unit, whether due to an inability to identify attractive acquisition candidates, to negotiate acceptable purchase contracts, or to obtain financing for these acquisitions on economically acceptable terms, then our ability to successfully implement our business strategy may be impaired.
If we are unable to timely and successfully integrate our future acquisitions, our future financial performance may suffer, and we may fail to realize all of the anticipated benefits of the transaction.
Our future growth may depend in part on our ability to integrate our future acquisitions. We cannot guarantee that we will successfully integrate any acquisitions into our existing operations, or that we will achieve the desired profitability and anticipated results from such acquisitions. Failure to achieve such planned results could adversely affect our operations and cash flows available for distribution to our unitholders.
The integration of acquisitions with our existing business involves numerous risks, including:
- •
- operating a significantly larger combined organization and integrating additional midstream operations into our existing operations;
- •
- difficulties in the assimilation of the assets and operations of the acquired businesses, especially if the assets acquired are in a new business segment or geographical area;
- •
- the loss of customers or key employees from the acquired businesses;
- •
- the diversion of management's attention from other existing business concerns;
- •
- the failure to realize expected synergies and cost savings;
- •
- coordinating geographically disparate organizations, systems and facilities;
- •
- integrating personnel from diverse business backgrounds and organizational cultures; and
- •
- consolidating corporate and administrative functions.
Further, unexpected costs and challenges may arise whenever businesses with different operations or management are combined, and we may experience unanticipated delays in realizing the benefits of an acquisition. Following an acquisition, we may discover previously unknown liabilities including those
54
Table of Contents
under the same stringent environmental laws and regulations relating to releases of pollutants into the environment and environmental protection as are applicable to our existing plants, pipelines and facilities. If so, our operation of these new assets could cause us to incur increased costs to address these liabilities or to attain or maintain compliance with such requirements. If we consummate any future acquisition, our capitalization and results of operation may change significantly, and unitholders will not have the opportunity to evaluate the economic, financial and other relevant information that we may consider in determining the application of these funds and other resources.
We have partial ownership interests in a number of joint venture legal entities, including MarkWest Pioneer, MarkWest Utica EMG and its subsidiaries, MarkWest Utica EMG Condensate and its subsidiary, Bright Star Partnership, Wirth Gathering and Centrahoma, which could adversely affect our ability to control certain decisions of these entities. In addition, we may be unable to control the amount of cash we receive from the operation of these entities and where we do not have control, we could be required to contribute significant cash to fund our share of their operations, which could adversely affect our ability to distribute cash to our unitholders.
Our inability, or limited ability, to control certain aspects of management of joint venture legal entities that we have a partial ownership interest in may mean that we will not receive the amount of cash we expect to be distributed to us. In addition, for entities where we have a non-controlling ownership interest, such as in Centrahoma, we will be unable to control ongoing operational decisions, including the incurrence of capital expenditures that we may be required to fund. Specifically:
- •
- we may have limited ability to influence certain management decisions with respect to these entities and their subsidiaries, including decisions with respect to incurrence of expenses timing and amount of and distributions to us;
- •
- these entities may establish reserves for working capital, capital projects, environmental matters and legal proceedings, which would otherwise reduce cash available for distribution to us;
- •
- these entities may incur additional indebtedness, and principal and interest made on such indebtedness may reduce cash otherwise available for distribution to us; and
- •
- these entities may require us to make additional capital contributions to fund working capital and capital expenditures, our funding of which could reduce the amount of cash otherwise available for distribution.
All of these things could significantly and adversely impact our ability to distribute cash to our unitholders.
Our operations depend on the use of information technology ("IT") systems that could be the target of industrial espionage or cyber-attack.
Our operations depend on the use of sophisticated information technology systems for the gathering and processing of natural gas, the gathering, fractionation, transportation and marketing of NGLs, and the gathering and transportation of crude oil. Our systems and networks, as well as those of our customers, vendors and counterparties, may become the target of cyber-attacks or information security breaches, which in turn could result in the unauthorized release and misuse of confidential or proprietary information as well as disrupt our operations or damage our facilities or those of third parties, which could have a material adverse effect on our revenues and increase our operating and capital costs, which could reduce the amount of cash otherwise available for distribution. We may be required to incur additional costs to modify or enhance our systems or in order to try to prevent or remediate any such attacks.
55
Table of Contents
Certain changes in accounting and/or financial reporting standards issued by the FASB, the SEC or other standard-setting bodies could have a material adverse impact on our financial position or results of operations.
We are subject to the application of GAAP, which periodically is revised and/or expanded. As such, we periodically are required to adopt new or revised accounting and/or financial reporting standards issued by recognized accounting standard setters or regulators, including the FASB and the SEC. It is possible that future requirements, including the proposed adoption and implementation of, or convergence with, IFRS, could change our current application of GAAP. Changes in the application of GAAP and the costs of implementing such changes could result in a material adverse impact on our financial position or results of operations.
Risks Related to Our Partnership Structure
We may issue additional common units without unitholder approval, which would dilute current unitholder ownership interests.
The General Partner, without your approval, may cause us to issue additional common units or other equity securities of equal rank with or senior to the common units.
The issuance of additional common units or other equity securities of equal or senior rank will have the following effects:
- •
- the unitholders' proportionate ownership interest will decrease;
- •
- the amount of cash available for distribution on each common unit may decrease;
- •
- the relative voting strength of each previously outstanding common unit may be diminished;
- •
- the market price of the common units may decline; and
- •
- the ratio of taxable income to distributions may increase.
Unitholders have less ability to influence management's decisions than holders of common stock in a corporation.
Unlike the holders of common stock in a corporation, unitholders have more limited voting rights on matters affecting our business, and therefore a more limited ability to influence management's decisions regarding our business. Our amended and restated partnership agreement provides that the General Partner may not withdraw and may not be removed at any time for any reason whatsoever. Furthermore, if any person or group other than the General Partner and its affiliates acquires beneficial ownership of 20% or more of any class of units (without the prior approval of the Board), that person or group loses voting rights on all of its units. However, if unitholders are dissatisfied with the performance of our General Partner, they have the right to annually elect the Board.
Unitholders may not have limited liability if a court finds that unitholder action constitutes control of our business.
Under Delaware law, unitholders could be held liable for our obligations as a general partner if a court determined that the right or the exercise of the right by unitholders as a group to approve certain transactions or amendments to the agreement of limited partnership, or to take other action under our amended and restated partnership agreement, was considered participation in the "control" of our business. Unitholders elect the members of the Board, which may be deemed to be participation in the "control" of our business. This could subject unitholders to liability as a general partner.
56
Table of Contents
In addition, Section 17-607 of the Delaware Revised Uniform Limited Partnership Act provides that, under some circumstances, a unitholder may be liable to us for the amount of a distribution for a period of three years from the date of the distribution.
Tax Risks Related to Owning our Common Units
Our tax treatment depends on our status as a partnership for federal income tax purposes. If the Internal Revenue Service ("IRS") were to treat us as a corporation for federal income tax purposes or we were to become subject to a material amount of entity-level taxation for state purposes, then our cash available for distribution to unitholders would be substantially reduced.
The anticipated after-tax benefit of an investment in the common units depends largely on our being treated as a partnership for federal income tax purposes. Despite the fact that we are a limited partnership under Delaware law, we would be treated as a corporation for federal income tax purposes unless we satisfy a "qualifying income" requirement. Based on our current operations, we believe we satisfy the qualifying income requirement. However, we have not requested, and do not plan to request, a ruling from the IRS on this or any other matter affecting us. Failing to meet the qualifying income requirement or a change in current law could cause us to be treated as a corporation for federal income tax purposes or otherwise subject us to taxation as an entity.
If we were treated as a corporation for federal income tax purposes, we would pay federal income tax on our income at the corporate tax rate, which is currently a maximum of 35%, and would likely pay state income tax at varying rates. Distributions to our unitholders would generally be taxed again as corporate distributions, and no income, gains, losses, deductions or credits would flow through to our unitholders. Because a tax would be imposed upon us as a corporation, our cash available for distribution to our unitholders would be substantially reduced. Therefore, our treatment as a corporation would result in a material reduction in the anticipated cash flow and after-tax return to our unitholders, likely causing a substantial reduction in the value of the common units.
Our amended and restated partnership agreement provides that if a law is enacted or existing law is modified or interpreted in a manner that subjects us to taxation as a corporation or otherwise subjects us to entity-level taxation for federal, state or local income tax purposes, then the minimum quarterly distribution amount and the target distribution amounts may be reduced to reflect the impact of that law on us. At the state level, several states have been evaluating ways to subject partnerships to entity-level taxation through the imposition of state income, franchise or other forms of taxation. For example, the state of Texas has instituted an income-based tax that results in an entity level tax for us, and we are required to pay a Texas franchise tax of 1.0% of our gross margin that is apportioned to Texas in the prior year. Imposition of a similar tax on us in other jurisdictions in which we operate or in jurisdictions to which we may expand could substantially reduce our cash available for distribution to you.
The tax treatment of publicly traded partnerships or an investment in our units could be subject to potential legislative, judicial or administrative changes and differing interpretations, possibly on a retroactive basis.
The present U.S. federal income tax treatment of publicly traded partnerships, including us, or an investment in our common units may be modified by administrative, legislative or judicial changes or differing interpretations at any time. For example, from time to time, members of Congress propose and consider substantive changes to the existing federal income tax laws that affect publicly traded partnerships. One such legislative proposal would have eliminated the qualifying income exception to the treatment of all publicly traded partnerships as corporations upon which we rely for our treatment as a partnership for U.S. federal income tax purposes. We are unable to predict whether any of these changes or other proposals will be reintroduced or will ultimately be enacted. Any such changes could negatively impact the value of an investment in our common units. Any modification to the U.S.
57
Table of Contents
federal income tax laws may be applied retroactively and could make it more difficult or impossible to meet the exception for certain publicly traded partnerships to be treated as partnerships for U.S. federal income tax purposes.
If we were subjected to a material amount of additional entity-level taxation or other fees by individual states, it would reduce our cash available for distribution to unitholders.
Changes in current state law may subject us to additional entity-level taxation or fees imposed by individual states. Because of widespread state budget deficits and other reasons, several states are evaluating ways to subject partnerships to entity-level taxation through the imposition of state income, franchise, use, property, ad valorem and other forms of taxation or permit, impact, throughput and miscellaneous other fees. Imposition of any such taxes or fees may substantially reduce the cash available for distribution to our unitholders. For example, the state of Texas has instituted an income-based tax that results in an entity level tax for us. We are required to pay a Texas franchise tax of 1.0% of our gross margin that is apportioned to Texas in the prior year. The imposition of entity level taxes on us by any other state may reduce the cash available for distribution to our unitholders.
If the IRS contests the federal income tax positions we take, the market for our common units may be adversely impacted and the cost of any IRS contest will reduce our cash available for distribution to our unitholders.
We have not requested a ruling from the IRS with respect to our treatment as a partnership for federal income tax purposes or any other matter affecting us. The IRS may adopt positions that differ from the positions we take. It may be necessary to resort to administrative or court proceedings to sustain some or all of the positions we take. A court may not agree with some or all of the positions we take. Any contest with the IRS may materially and adversely impact the market for our common units and the price at which they trade. In addition, our costs of any contest with the IRS will be borne indirectly by our unitholders and the General Partner because the costs will reduce our cash available for distribution.
A unitholder may be required to pay taxes on his share of our income even if the unitholder does not receive any cash distributions from us.
Each unitholder will be required to pay federal income taxes and, in some cases, state and local income taxes on his or her share of our taxable income whether or not the unitholder receives cash distributions from us. A unitholder may not receive cash distributions from us equal to his share of our taxable income or even equal to the actual tax liability which results from that income.
Tax gain or loss on the disposition of our common units could be more or less than expected.
If a unitholder sells his or her common units, they will recognize a gain or loss equal to the difference between the amount realized and his tax basis in those common units. Because distributions in excess of the unitholder's allocable share of our net taxable income results in a decrease in the unitholder's tax basis in his or her common units, the amount, if any, of such prior excess distributions with respect to the common units the unitholder sells will, in effect, become taxable income to the unitholder if the unitholder sells such common units at a price greater than his or her tax basis in those common units, even if the price the unitholder receives is less than the original cost. Furthermore, a substantial portion of the amount realized, whether or not representing gain, may be taxed as ordinary income due to potential recapture items, including depreciation recapture. In addition, because the amount realized includes a unitholder's share of our nonrecourse liabilities, if a unitholder sells common units, the unitholder may incur a tax liability in excess of the amount of cash the unitholder receives from the sale.
58
Table of Contents
Tax-exempt entities and non-U.S. persons face unique tax issues from owning our common units that may result in adverse tax consequences to them.
Investment in our common units by tax-exempt entities, such as employee benefit plans, individual retirement accounts ("IRAs"), and non-U.S. persons raises issues unique to them. For example, virtually all of our income allocated to organizations that are exempt from federal income tax, including IRAs and other retirement plans, will be unrelated business taxable income and could be taxable to them. Allocations and/or distributions to non-U.S. persons will be reduced by withholding taxes at the highest effective tax rate applicable to non-U.S. persons, and non-U.S. persons will be required to file federal tax returns and pay tax on their share of our taxable income. If a unitholder is a tax exempt entity or a non-U.S. person, the unitholder should consult a tax advisor before investing in our common units.
We treat each purchaser of our common units as having the same tax benefits without regard to the actual common units purchased. The IRS may challenge this treatment, which could adversely affect the value of our common units.
To maintain the uniformity of the economic and tax characteristics of our common units and because of other reasons, we have adopted depreciation and amortization positions that may not conform to all aspects of existing Treasury Regulations. A successful IRS challenge to those positions could adversely affect the amount of tax benefits available to our unitholders. It also could affect the timing of these tax benefits or the amount of gain from a unitholder's sale of our common units and could have a negative impact on the value of our common units or result in audit adjustments to a unitholder's tax returns.
We prorate our items of income, gain, loss and deduction between transferors and transferees of our common units each month based upon the ownership of the common units on the first day of each month, instead of on the basis of the date a particular common unit is transferred. The IRS may challenge this treatment, which could change the allocation of items of income, gain, loss and deduction among our unitholders.
We generally prorate our items of income, gain, loss and deduction between transferors and transferees of our units each month based upon the ownership of the units on the first day of each month, instead of on the basis of the date a particular common unit is transferred. The use of this proration method may not be permitted under existing Treasury Regulations. The U.S. Treasury Department has issued proposed Treasury Regulations that provide a safe harbor pursuant to which a publicly-traded partnership may use a similar monthly simplifying convention to allocate tax items among transferor and transferee unitholders. Nonetheless, the proposed regulations do not specifically authorize the use of the proration method we have adopted. If the IRS were to successfully challenge our proration method or new Treasury Regulations were issued, we may be required to change the allocation of items of income, gain, loss and deduction among our unitholders.
A unitholder whose common units are the subject of a "securities loan" (e.g., a loan to a "short seller" to cover a short sale of common units) may be considered as having disposed of those common units. If so, the unitholder would no longer be treated, for tax purposes, as a partner with respect to those common units during the period of the loan and may recognize gain or loss from the disposition.
Because there are no specific rules governing the federal income tax consequence of loaning a partnership interest, a unitholder whose common units are the subject of a securities loan may be considered as having disposed of the loaned units. In that case, the unitholder may no longer be treated for tax purposes as a partner with respect to those common units during the period of the loan to the short seller and the unitholder may recognize gain or loss from such disposition. Moreover, during the period of the loan, any of our income, gain, loss or deduction with respect to those common units may not be reportable by the unitholder and any cash distributions received by the unitholder as
59
Table of Contents
to those common units could be fully taxable as ordinary income. Unitholders desiring to assure their status as partners and avoid the risk of gain recognition from a securities loan are urged to modify any applicable brokerage account agreements to prohibit their brokers from lending their common units.
We have adopted certain valuation methodologies that may result in a shift of income, gain, loss and deduction between the Class A and Class B unitholders and our common unitholders. The IRS may challenge this treatment, which could adversely affect the value of our common units.
When we issue additional common units or engage in certain other transactions, we determine the fair market value of our assets and allocate any unrealized gain or loss attributable to our assets to the capital accounts of our common unitholders, the Class A unitholders and Class B unitholders. Our methodology may be viewed as understating the value of our assets. In that case, there may be a shift of income, gain, loss and deduction between certain unitholders, which may have an unfavorable effect. Moreover, under our valuation methods, subsequent purchasers of common units may have a greater portion of their Internal Revenue Code ("IRC") Section 743(b) adjustment allocated to our tangible assets and a lesser portion allocated to our intangible assets. The IRS may challenge our valuation methods, or our allocation of the Section 743(b) adjustment attributable to our tangible and intangible assets, and allocations of income, gain, loss and deduction between our unitholders.
A successful IRS challenge to these methods or allocations could adversely affect the amount of taxable income or loss being allocated to our unitholders. It also could affect the amount of gain from the sale of common units by our unitholders and could have a negative impact on the value of our common units or result in audit adjustments to the tax returns of our unitholders without the benefit of additional deductions.
The sale or exchange of 50% or more of our capital and profits interests during any twelve-month period will result in the termination of our partnership for federal income tax purposes.
We will be considered to have terminated as a partnership, for federal income tax purposes, if there is a sale or exchange of 50% or more of the total interests in our capital and profits within a twelve-month period. For purposes of determining whether the 50% threshold has been met, multiple sales of the same interest will be counted only once. Our termination would, among other things, result in the closing of our taxable year for all unitholders, which would result in our filing two tax returns for one fiscal year and may result in a significant deferral of depreciation deductions allowable in computing our taxable income. In the case of a unitholder reporting on a taxable year other than a calendar year, the closing of our taxable year may also result in more than twelve months of our taxable income or loss being includable in his taxable income for the year of termination. Currently, our termination would not affect our classification as a partnership for federal income tax purposes, but would result in our being treated as a new partnership for tax purposes. If we were treated as a new partnership, we would be required to make new tax elections and could be subject to penalties if we were unable to determine that a termination occurred. The IRS has recently announced a relief procedure whereby if a publicly traded partnership that has technically terminated requests and the IRS grants special relief, among other things, the partnership may be permitted to provide only a single Schedule K-1 to unitholders for the tax years in which the termination occurs.
Our unitholders will likely be subject to state and local taxes and return filing requirements in states where the unitholders do not live as a result of investing in common units.
In addition to federal income taxes, our unitholders will likely be subject to other taxes, including foreign, state and local taxes, unincorporated business taxes and estate, inheritance or intangible taxes that are imposed by the various jurisdictions in which we conduct business or own property now or in the future, even if our unitholders do not live in any of those jurisdictions. Our unitholders will likely be required to file foreign, state and local income tax returns and pay state and local income taxes in
60
Table of Contents
some or all of these various jurisdictions. Further, our unitholders may be subject to penalties for failure to comply with those requirements. We currently do business or own property in ten states, most of which, other than Texas, impose personal income taxes. Most of these states also impose an income tax on corporations and other entities. As we make acquisitions or expand our business, we may own assets or conduct business in additional states that impose a personal income tax. It is our unitholder's responsibility to file all United States federal, foreign, state and local tax returns.
ITEM 1B. Unresolved Staff Comments
None.
61
Table of Contents
ITEM 2. Properties
The following tables set forth certain information relating to our gas processing facilities, fractionation facilities, natural gas gathering systems, NGL pipelines, natural gas pipeline and crude oil pipeline as of and for the year ended December 31, 2013.
Gas Processing Facilities:
| | | | | | | | | | | | | | | | | | |
| |
| |
| |
| | Year ended
December 31, 2013 | |
|---|
Facility | | Location | | Year of Initial
Construction | | Design
Throughput
Capacity | | Natural Gas
Throughput | | Utilization
of Design
Capacity(1) | | NGL
Throughput | |
|---|
| |
| |
| | (Mcf/d)
| | (Mcf/d)
| |
| | (Gal/d)
| |
|---|
Marcellus | | | | | | | | | | | | | | | | | | |
Marcellus Shale: | | | | | | | | | | | | | | | | | | |
Houston processing facility | | Washington County, PA | | | 2009 | | | 355,000 | | | 306,500 | | | 86 | % | | 716,900 | |
Majorsville processing facility | | Marshall County, WV | | | 2010 | | | 670,000 | | | 321,400 | | | 87 | % | | 734,900 | |
Mobley processing facility | | Wetzel County, WV | | | 2012 | | | 520,000 | | | 183,500 | | | 63 | % | | 273,800 | |
Sherwood processing facility | | Doddridge County, WV | | | 2012 | | | 600,000 | | | 216,300 | | | 62 | % | | 255,200 | |
Keystone processing facility | | Butler County, PA | | | 2012 | | | 90,000 | | | 74,200 | | | 82 | % | | 133,900 | |
Utica | | | | | | | | | | | | | | | | | | |
Utica Shale: | | | | | | | | | | | | | | | | | | |
Cadiz processing facility | | Harrison County, OH | | | 2012 | | | 185,000 | | | 70,800 | | | 65 | % | | 109,200 | |
Seneca processing facility(2) | | Noble County, OH | | | 2013 | | | 200,000 | | | 105,200 | | | 53 | % | | 172,200 | |
Northeast | | | | | | | | | | | | | | | | | | |
Appalachia: | | | | | | | | | | | | | | | | | | |
Kenova processing facility(3) | | Wayne County, WV | | | 1996 | | | 160,000 | | | 105,400 | | | 66 | % | | 194,400 | |
Boldman processing facility(3) | | Pike County, KY | | | 1991 | | | 70,000 | | | 32,000 | | | 46 | % | | 42,300 | |
Cobb processing facility | | Kanawha County, WV | | | 2005 | | | 65,000 | | | 30,300 | | | 47 | % | | 67,800 | |
Kermit processing facility(3)(4) | | Mingo County, WV | | | 2001 | | | 32,000 | | | N/A | | | N/A | | | N/A | |
Langley processing facility | | Langley, KY | | | 2000 | | | 325,000 | | | 128,400 | | | 40 | % | | 368,000 | |
Southwest | | | | | | | | | | | | | | | | | | |
East Texas: | | | | | | | | | | | | | | | | | | |
Carthage West processing facility | | Panola County, TX | | | 2005 | | | 280,000 | | | 248,700 | | | 89 | % | | 641,700 | |
Carthage East processing facility. | | Panola County, TX | | | 2012 | | | 120,000 | | | 106,400 | | | 89 | % | | 274,500 | |
Oklahoma: | | | | | | | | | | | | | | | | | | |
Western Oklahoma processing facility | | Custer County, OK | | | 2000 | | | 235,000 | | | 202,600 | | | 86 | % | | 659,900 | |
Gulf Coast: | | | | | | | | | | | | | | | | | | |
Javelina processing facility(5) | | Corpus Christi, TX | | | 1989 | | | 142,000 | | | 103,400 | | | 73 | % | | 791,300 | |
- (1)
- The utilization of design capacity has been calculated using the weighted average design throughput capacity.
- (2)
- During the fourth quarter of 2013, we began operations at the Seneca processing plant. The volume reported is the average daily rate for the days of operation.
- (3)
- A portion of the gas processed at the Boldman plant, and all of the gas processed at the Kermit plant, is further processed at the Kenova plant to recover additional NGLs.
- (4)
- The Kermit processing plant is operated by a third party solely to prevent liquids from condensing in the gathering and transmission pipelines upstream of our Kenova plant. We do not receive Kermit gas volume information but do receive all of the liquids produced at the Kermit facility.
- (5)
- Also includes fractionation capacity of 29,000 Bbl/d.
62
Table of Contents
Fractionation Facilities:
| | | | | | | | | | | | | | | |
| |
| |
| |
| | Year ended
December 31, 2013 | |
|---|
Facility | | Location | | Year of Initial
Construction | | Design
Throughput
Capacity | | NGL
Throughput | | Utilization
of Design
Capacity | |
|---|
| |
| |
| | (Bbl/d)
| | (Bbl/d)
| |
| |
|---|
Marcellus | | | | | | | | | | | | | | | |
Marcellus Shale: | | | | | | | | | | | | | | | |
Houston | | Washington County, PA | | | 2009 | | | 60,000 | | | 43,700 | | | 73 | % |
Houston Complex de-ethanization facility | | Washington County, PA | | | 2013 | | | 38,000 | | | 3,700 | | | 10 | % |
Majorsville Complex de-ethanization facility | | Wetzel County, WV | | | 2013 | | | 38,000 | | | 9,400 | | | 25 | % |
Northeast | | | | | | | | | | | | | | | |
Appalachia: | | | | | | | | | | | | | | | |
Siloam fractionation plant | | South Shore, KY | | | 1957 | | | 24,000 | | | 20,200 | | | 84 | % |
Our Siloam facility has both above ground, pressurized NGL storage facilities, with usable capacity of two million gallons, and underground storage facilities, with usable capacity of ten million gallons. Product can be received by truck, pipeline or rail car and can be transported from the facility by truck, rail car or barge. There are ten automated 24-hour-a-day truck loading and unloading slots, a rail loading/unloading rack with 14 unloading slots and a river barge facility capable of loading barges with a capacity of up to 840,000 gallons.
Our Houston facility has above ground NGL storage with a usable capacity of 5.9 million gallons, 12 automated 24-hour-a-day truck loading and unloading slots, and a rail loading facility with a capacity of 200 railcars per day. We also have access to up to an additional 38 million gallons of NGL storage capacity that can be utilized by our Marcellus, Utica and Northeast segments under an agreement with a third party that expires in 2018.
63
Table of Contents
Natural Gas Gathering Systems:
| | | | | | | | | | | | | | | |
| |
| |
| |
| | Year ended
December 31, 2013 | |
|---|
Facility | | Location | | Year of Initial
Construction | | Design
Throughput
Capacity | | Natural Gas
Throughput | | Utilization
of Design
Capacity | |
|---|
| |
| |
| | (Mcf/d)
| | (Mcf/d)
| |
| |
|---|
Marcellus | | | | | | | | | | | | | | | |
Marcellus Shale: | | | | | | | | | | | | | | | |
Houston gathering system | | Washington County, PA | | | 2008 | | | 525,000 | | | 475,300 | | | 91 | % |
Keystone gathering system | | Butler County, PA | | | 2012 | | | 90,000 | | | 74,200 | | | 82 | % |
Utica | | | | | | | | | | | | | | | |
Cadiz gathering system | | Harrison County, OH | | | 2012 | | | 385,000 | | | 62,400 | | | 16 | % |
Southwest | | | | | | | | | | | | | | | |
East Texas: | | | | | | | | | | | | | | | |
East Texas gathering system | | Panola County, TX | | | 1990 | | | 640,000 | | | 504,000 | | | 79 | % |
Oklahoma: | | | | | | | | | | | | | | | |
Western Oklahoma gathering system | | Wheeler County, TX and Roger Mills, Ellis, Custer and Beckham Counties, OK | | | 1998 | | | 540,000 | | | 219,800 | | | 41 | % |
Indian Corn gathering system(6) | | Washita County, OK | | | 2010 | | | 35,000 | | | 28,000 | | | 80 | % |
Southeast Oklahoma gathering system | | Hughes, Pittsburg and Coal Counties, OK | | | 2006 | | | 550,000 | | | 443,700 | | | 81 | % |
Other Southwest: | | | | | | | | | | | | | | | |
Eagle Ford gathering system | | West Asherton, TX | | | 2013 | | | 45,000 | | | 21,800 | | | 48 | % |
Other gathering systems(7) | | Various | | | Various | | | 121,500 | | | 18,600 | | | 15 | % |
- (6)
- The Indian Corn gathering system was acquired in May 2013. The throughput volumes represent the volumes from the date of acquisition.
- (7)
- Excludes lateral pipelines where revenue is not based on throughput.
NGL Pipelines:
| | | | | | | | | | | | | | | |
| |
| |
| |
| | Year ended
December 31, 2013 | |
|---|
Pipeline | | Location | | Year of Initial
Construction | | Design
Throughput
Capacity | | NGL
Throughput | | Utilization
of Design
Capacity | |
|---|
| |
| |
| | (Bbl/d)
| | (Bbl/d)
| |
| |
|---|
Marcellus | | | | | | | | | | | | | | | |
Marcellus Shale: | | | | | | | | | | | | | | | |
Sherwood to Houston | | Doddridge County, WVC to Washington County, PA | | | 2010 | | | 43,400 | | | 25,800 | | | 59 | % |
Utica | | | | |
| | |
| | |
| | |
| |
Utica Shale: | | | | | | | | | | | | | | | |
Seneca to Cadiz | | Noble County, OH to Harrison County, OH | | | 2013 | | | 97,000 | | | 4,100 | | | 4 | % |
Northeast | | | | |
| | |
| | |
| | |
| |
Appalachia: | | | | | | | | | | | | | | | |
Langley to Siloam(8) | | Langley, KY to South Shore, KY | | | 1957 | | | 19,000 | | | 13,200 | | | 69 | % |
Southwest | | | | | | | | | | | | | | | |
East Texas: | | | | | | | | | | | | | | | |
East Texas liquid line | | Panola County, TX | | | 2005 | | | 25,000 | | | 21,800 | | | 87 | % |
- (8)
- NGLs transported through the Langley to Ranger and Ranger to Kenova pipelines are combined with NGLs recovered at the Kenova facility. The volume reported for the Langley to Siloam pipeline represents the combined NGL stream.
64
Table of Contents
Crude Oil Pipeline:
| | | | | | | | | | | | | | | |
| |
| |
| |
| | Year ended
December 31, 2013 | |
|---|
Pipeline | | Location | | Year of Initial
Construction | | Design
Throughput
Capacity | | NGL
Throughput | | Utilization
of Design
Capacity | |
|---|
| |
| |
| | (Bbl/d)
| | (Bbl/d)
| |
| |
|---|
Northeast | | | | | | | | | | | | | | | |
Michigan: | | | | | | | | | | | | | | | |
Michigan crude pipeline | | Manistee County, MI to Crawford County, MI | | | 1973 | | | 60,000 | | | 9,700 | | | 16 | % |
Title to Properties
Substantially all of our pipelines are constructed on rights-of-way granted by the owners of record of the property. Lands over which pipeline rights-of-way have been obtained may be subject to prior liens that have not been subordinated to the right-of-way grants. We have obtained, where determined necessary, permits, leases, license agreements and franchise ordinances from public authorities to cross over or under, or to lay facilities in or along water courses, county roads, municipal streets and state highways, as applicable. We also have obtained easements and license agreements from railroad companies to cross over or under railroad properties or rights-of-way. Many of these authorizations and grants are revocable at the election of the grantor. Many of our processing and fractionation facilities, including our Siloam, Houston and Hopedale fractionation plants, and certain of our pipelines and other facilities, are on land that we either own in fee or are held under long-term leases.
Some of the leases, easements, rights-of-way, permits, licenses and franchise ordinances that were transferred to us required the consent of the then-current landowner to transfer these rights, which in some instances was a governmental entity. We believe that we have obtained sufficient third-party consents, permits and authorizations for the transfer of the assets necessary for us to operate our business. We also believe we have satisfactory title or other right to all of our material land assets. Title to these properties is subject to encumbrances in some cases; however, we believe that none of these burdens will materially detract from the value of these properties or from our interest in these properties, or will materially interfere with their use in the operation of our business.
We have pledged our assets and those of our wholly-owned subsidiaries, other than MarkWest Liberty Midstream and its subsidiaries, as collateral for borrowings under our Credit Facility.
ITEM 3. Legal Proceedings
We are subject to a variety of risks and disputes, and are a party to various legal and regulatory proceedings in the normal course of our business. We maintain insurance policies in amounts and with coverage and deductibles as we believe reasonable and prudent. However, we cannot be assured that the insurance companies will promptly honor their policy obligations or that the coverage or levels of insurance will be adequate to protect us from all material expenses related to future claims for property loss or business interruption to us, or for third-party claims of personal and property damage or that the coverages or levels of insurance we currently have will be available in the future at economical prices. While it is not possible to predict the outcome of the legal actions with certainty, management is of the opinion that appropriate provisions and accruals for potential losses associated with all legal actions have been made in the consolidated financial statements and that none of these actions, either individually or in the aggregate, will have a material adverse effect on our financial condition, liquidity or results of operation.
On February 11, 2013, MarkWest Liberty Midstream entered into a Consent Order with the West Virginia Department of Environmental Protection ("WVDEP") relating to alleged violations of West
65
Table of Contents
Virginia's storm water and erosion and sediment control regulations in connection with slips and landsides encountered during the construction of MarkWest Liberty Midstream's Mobley Complex in Wetzel County, West Virginia. Under the Consent Order, MarkWest Liberty Midstream agreed to pay a civil administrative penalty in the amount of $306,210 and to submit corrective action and stream restoration plans. Pursuant to WVDEP's rules and regulations, the Consent Order was subject to a thirty day public notice period, which ended on March 22, 2013. As a result, the Consent Order is final. MarkWest Liberty Midstream has paid the administrative penalty and has submitted the plans required by the Consent Order, which have been approved by the WVDEP.
In connection with construction activities in eastern Ohio, MarkWest Utica EMG has experienced, and continues to experience, incidents of inadvertent returns of a bentonite clay solution during construction of borings under areas primarily involving reclaimed strip coal mine lands. MarkWest Utica EMG self-reported these incidents to the Ohio Environmental Protection Agency ("OEPA") and has remediated any impacts from these bentonite-clay inadvertent returns. There was no adverse impact on human health from these incidents and the impact to the receiving areas was a temporary physical sedimentation impact, without any chemicals or additives involved. OEPA has initiated an administration enforcement action, although the amount of penalties or other administrative remedies has not yet been determined.
ITEM 4. Mine Safety Disclosures
Not applicable.
66
Table of Contents
PART II
ITEM 5. Market for Registrant's Common Units, Related Unitholder Matters and Issuer Purchases of Equity Securities
Our common units have been listed on the New York Stock Exchange ("NYSE"), under the symbol "MWE," since May 2, 2007. All of our Class B units were issued to and are held by M&R as part of our December 31, 2011 acquisition of the non-controlling interest in MarkWest Liberty Midstream. The remaining Class B units will convert to common units on a one-for-one basis in four equal installments beginning on July 1, 2014 and each of the first three anniversaries of such date.
The following table sets forth the high and low sales prices of the common units as reported by NYSE, as well as the amount of cash distributions paid per quarter for 2013 and 2012:
| | | | | | | | | | | | | | | | |
| | Unit Price | |
| |
| |
| |
|
|---|
| | Distributions Per
Common Unit | |
| |
| |
|
|---|
Quarter Ended | | High | | Low | | Declaration Date | | Record Date | | Payment Date |
|---|
December 31, 2013 | | $ | 75.79 | | $ | 62.56 | | $ | 0.86 | | | January 22, 2014 | | February 6, 2014 | | February 14, 2014 |
September 30, 2013 | | $ | 72.35 | | $ | 65.27 | | $ | 0.85 | | | October 23, 2013 | | November 7, 2013 | | November 14, 2013 |
June 30, 2013 | | $ | 71.20 | | $ | 56.90 | | $ | 0.84 | | | July 24, 2013 | | August 6, 2013 | | August 14, 2013 |
March 31, 2013 | | $ | 61.97 | | $ | 51.77 | | $ | 0.83 | | | April 25, 2013 | | May 7, 2013 | | May 15, 2013 |
December 31, 2012 | | $ | 55.95 | | $ | 46.03 | | $ | 0.82 | | | January 23, 2013 | | February 6, 2013 | | February 14, 2013 |
September 30, 2012 | | $ | 55.04 | | $ | 49.01 | | $ | 0.81 | | | October 25, 2012 | | November 7, 2012 | | November 14, 2012 |
June 30, 2012 | | $ | 60.32 | | $ | 45.36 | | $ | 0.80 | | | July 26, 2012 | | August 6, 2012 | | August 14, 2012 |
March 31, 2012 | | $ | 61.60 | | $ | 53.51 | | $ | 0.79 | | | April 26, 2012 | | May 7, 2012 | | May 15, 2012 |
December 31, 2011 | | $ | 56.82 | | $ | 42.18 | | $ | 0.76 | | | January 26, 2012 | | February 6, 2012 | | February 14, 2012 |
As of February 19, 2014, there were approximately 365 holders of record of our common units.
Distributions of Available Cash
Within 45 days after the end of each quarter, we distribute all of our "Available Cash," including the "Available Cash" of our subsidiaries, on a pro rata basis to common unitholders of record on the applicable record date. Class B unitholders do not receive cash distributions. Class A unitholders receive distributions of Available Cash (excluding the Available Cash attributable to MarkWest Hydrocarbon.) However, because all Class A unitholders are wholly-owned subsidiaries, these intercompany distributions do not impact the amount of Available Cash that can be distributed to common unitholders.
We define "Available Cash" in our amended and restated partnership agreement, and we generally mean, for each fiscal quarter:
- •
- all cash and cash equivalents on hand at the end of the quarter;
- •
- less the amount of cash that the General Partner determines, in its reasonable discretion, is necessary or appropriate to:
- •
- provide for the proper conduct of our business;
- •
- comply with applicable law, any of our debt instruments or other agreements; or
- •
- provide funds for distributions to unitholders for any one or more of the next four quarters;
- •
- plus all cash and cash equivalents on hand on the date of determination of available cash for the quarter resulting from working capital borrowings made after the end of the quarter. Working capital borrowings are generally borrowings that are made under our Credit Facility and in all cases are used solely for working capital purposes or to pay distributions to partners.
Our ability to distribute available cash is contractually restricted by the terms of our Credit Facility and our indentures. Our Credit Facility and indentures contain covenants requiring us to maintain
67
Table of Contents
certain financial ratios and a minimum net worth. We are prohibited from making any distribution to unitholders if such distribution would cause an event of default or otherwise violate a covenant under our credit agreement or indentures. There is no guarantee that we will pay a quarterly distribution on the common units in any quarter.
Distributions of Cash Upon Liquidation
If we dissolve in accordance with our amended and restated partnership agreement, we will sell or otherwise dispose of our assets in a process called liquidation. We will first apply the proceeds of liquidation to the payment of our creditors. We will distribute any remaining proceeds to the unitholders, which will include the holders of Class B units that convert upon liquidation, in accordance with their capital account balances, as adjusted to reflect any gain or loss upon the sale or other disposition of our assets in liquidation.
Securities Authorized for Issuance under Equity Compensation Plans
The following table provides information as of December 31, 2013, regarding our common units that may be issued upon conversion of outstanding phantom units granted under all of our existing equity compensation plans that have been approved by security holders. There are no active plans that have not been approved by security holders.
| | | | | | | | | | |
| | Number of securities
to be issued
upon exercise of
outstanding options,
warrants and rights | | Weighted average
exercise price of
outstanding options,
warrants and rights(1) | | Number of securities
remaining available
for future issuance
under equity
compensation plans | |
|---|
Equity compensation plans approved by security holders: | | | | | | | | | | |
2008 Long-Term Incentive Plan | | | 757,509 | | $ | — | | | 1,823,538 | |
- (1)
- Phantom units are granted with no exercise price.
Recent Sales of Unregistered Units
None.
Repurchase of Equity by MarkWest Energy Partners, L.P.
None.
68
Table of Contents
ITEM 6. Selected Financial Data
The following table sets forth selected consolidated historical financial and operating data for MarkWest Energy Partners (dollars in thousands, except per unit amounts). The selected financial data should be read in conjunction with the consolidated financial statements, including the notes thereto, and Item 7. Management's Discussion and Analysis of Financial Condition and Results of Operation in this Form 10-K.
| | | | | | | | | | | | | | | | |
| | Year ended December 31, | |
|---|
| | 2013 | | 2012(1) | | 2011(1) | | 2010(1) | | 2009(1) | |
|---|
Statement of Operations: | | | | | | | | | | | | | | | | |
Revenue: | | | | | | | | | | | | | | | | |
Revenue | | $ | 1,687,085 | | $ | 1,383,279 | | $ | 1,522,592 | | $ | 1,226,789 | | $ | 853,856 | |
Derivative (loss) gain(2) | | | (24,638 | ) | | 56,535 | | | (29,035 | ) | | (53,932 | ) | | (120,352 | ) |
| | | | | | | | | | | | |
| | | | | | | | | | | | | | | | | |
Total revenue | | | 1,662,447 | | | 1,439,814 | | | 1,493,557 | | | 1,172,857 | | | 733,504 | |
| | | | | | | | | | | | |
| | | | | | | | | | | | | | | | | |
Operating expenses: | | | | | | | | | | | | | | | | |
Purchased product costs | | | 691,165 | | | 530,328 | | | 682,370 | | | 578,627 | | | 408,826 | |
Derivative (gain) loss related to purchased product costs(2) | | | (1,737 | ) | | (13,962 | ) | | 52,960 | | | 27,713 | | | 68,883 | |
Facility expenses | | | 291,069 | | | 206,861 | | | 171,497 | | | 148,416 | | | 126,524 | |
Derivative loss (gain) related to facility expenses(2) | | | 2,869 | | | 1,371 | | | (6,480 | ) | | (1,295 | ) | | (373 | ) |
Selling, general and administrative expenses | | | 101,549 | | | 93,444 | | | 80,441 | | | 74,558 | | | 63,352 | |
Depreciation | | | 299,884 | | | 183,250 | | | 143,704 | | | 116,949 | | | 92,486 | |
Amortization of intangible assets | | | 64,644 | | | 53,320 | | | 43,617 | | | 40,833 | | | 40,831 | |
(Gain) loss on disposal of property, plant and equipment | | | (33,763 | ) | | 6,254 | | | 8,797 | | | 3,149 | | | 1,677 | |
Accretion of asset retirement obligations | | | 824 | | | 672 | | | 1,185 | | | 240 | | | 188 | |
Impairment of long-lived assets | | | — | | | — | | | — | | | — | | | 5,855 | |
| | | | | | | | | | | | |
| | | | | | | | | | | | | | | | | |
Total operating expenses | | | 1,416,504 | | | 1,061,538 | | | 1,178,091 | | | 989,190 | | | 808,249 | |
| | | | | | | | | | | | |
| | | | | | | | | | | | | | | | | |
Income (loss) from operations | | | 245,943 | | | 378,276 | | | 315,466 | | | 183,667 | | | (74,745 | ) |
Other income (expense): | | | | | | | | | | | | | | | | |
Earnings (loss) from unconsolidated affiliates | | | 1,422 | | | 2,328 | | | 158 | | | 3,823 | | | 5,307 | |
Impairment of unconsolidated affiliate | | | — | | | — | | | — | | | — | | | (39,200 | ) |
Gain on sale of unconsolidated affiliate | | | — | | | — | | | — | | | — | | | 6,801 | |
Interest income | | | 262 | | | 419 | | | 422 | | | 1,670 | | | 349 | |
Interest expense | | | (151,851 | ) | | (120,191 | ) | | (113,631 | ) | | (103,873 | ) | | (87,419 | ) |
Amortization of deferred financing costs and discount (a component of interest expense) | | | (6,726 | ) | | (5,601 | ) | | (5,114 | ) | | (10,264 | ) | | (9,718 | ) |
Derivative gain related to interest expense(2) | | | — | | | — | | | — | | | 1,871 | | | 2,509 | |
Loss on redemption of debt | | | (38,455 | ) | | — | | | (78,996 | ) | | (46,326 | ) | | — | |
Miscellaneous income (expense), net(2) | | | 2,519 | | | 62 | | | 144 | | | 1,189 | | | (256 | ) |
| | | | | | | | | | | | |
| | | | | | | | | | | | | | | | | |
Income (loss) before provision for income tax | | | 53,114 | | | 255,293 | | | 118,449 | | | 31,757 | | | (196,372 | ) |
Provision for income tax expense (benefit): | | | | | | | | | | | | | | | | |
Current | | | (11,208 | ) | | (2,366 | ) | | 17,578 | | | 7,655 | | | 8,072 | |
Deferred | | | 23,877 | | | 40,694 | | | (3,929 | ) | | (4,466 | ) | | (53,935 | ) |
| | | | | | | | | | | | |
| | | | | | | | | | | | | | | | | |
Total provision for income tax | | | 12,669 | | | 38,328 | | | 13,649 | | | 3,189 | | | (45,863 | ) |
| | | | | | | | | | | | |
| | | | | | | | | | | | | | | | | |
Net income (loss) | | | 40,445 | | | 216,965 | | | 104,800 | | | 28,568 | | | (150,509 | ) |
Net (income) loss attributable to non-controlling Interest | | | (2,368 | ) | | 3,437 | | | (44,105 | ) | | (28,101 | ) | | (3,512 | ) |
| | | | | | | | | | | | |
| | | | | | | | | | | | | | | | | |
Net income (loss) attributable to the Partnership's unitholders | | $ | 38,077 | | $ | 220,402 | | $ | 60,695 | | $ | 467 | | $ | (154,021 | ) |
| | | | | | | | | | | | |
| | | | | | | | | | | | | | | | | |
| | | | | | | | | | | | | | | | | |
| | | | | | | | | | | | |
Net income (loss) attributable to the Partnership's common unitholders per common unit(3): | | | | | | | | | | | | | | | | |
Basic | | $ | 0.26 | | $ | 1.98 | | $ | 0.75 | | $ | (0.01 | ) | $ | (2.55 | ) |
| | | | | | | | | | | | |
| | | | | | | | | | | | | | | | | |
| | | | | | | | | | | | | | | | | |
| | | | | | | | | | | | |
Diluted | | $ | 0.24 | | $ | 1.69 | | $ | 0.75 | | $ | (0.01 | ) | $ | (2.55 | ) |
| | | | | | | | | | | | |
| | | | | | | | | | | | | | | | | |
| | | | | | | | | | | | | | | | | |
| | | | | | | | | | | | |
Cash distribution declared per common unit | | $ | 3.34 | | $ | 3.16 | | $ | 2.75 | | $ | 2.56 | | $ | 2.56 | |
| | | | | | | | | | | | |
| | | | | | | | | | | | | | | | | |
| | | | | | | | | | | | | | | | | |
| | | | | | | | | | | | |
69
Table of Contents
| | | | | | | | | | | | | | | | |
| | Year ended December 31, | |
|---|
| | 2013 | | 2012(1) | | 2011(1) | | 2010(1) | | 2009(1) | |
|---|
Balance Sheet Data (at December 31): | | | | | | | | | | | | | | | | |
Working capital | | $ | (353,273 | ) | $ | (84,512 | ) | $ | 1,060 | | $ | (46,152 | ) | $ | 9,852 | |
Property, plant and equipment, net | | | 7,693,169 | | | 4,939,618 | | | 2,723,049 | | | 2,171,986 | | | 1,828,166 | |
Total assets | | | 9,396,423 | | | 6,728,362 | | | 3,959,874 | | | 3,220,156 | | | 2,897,660 | |
Total long-term debt | | | 3,023,071 | | | 2,523,051 | | | 1,846,062 | | | 1,273,434 | | | 1,170,072 | |
Total equity | | | 4,798,133 | | | 3,111,398 | | | 1,395,242 | | | 1,350,294 | | | 1,198,119 | |
Cash Flow Data: | | | | | | | | | | | | | | | | |
Net cash flow provided by (used in): | | | | | | | | | | | | | | | | |
Operating activities | | $ | 435,650 | | $ | 492,013 | | $ | 410,403 | | $ | 306,117 | | $ | 220,486 | |
Investing activities | | | (3,062,562 | ) | | (2,472,088 | ) | | (776,111 | ) | | (484,804 | ) | | (462,912 | ) |
Financing activities | | | 2,366,461 | | | 2,211,499 | | | 415,503 | | | 149,246 | | | 333,083 | |
Other Financial Data: | | | | | | | | | | | | | | | | |
Maintenance capital expenditures(4) | | $ | 18,985 | | $ | 16,782 | | $ | 15,909 | | $ | 10,286 | | $ | 7,458 | |
Growth capital expenditures(4) | | | 3,027,971 | | | 1,933,542 | | | 534,930 | | | 447,182 | | | 433,395 | |
| | | | | | | | | | | | |
| | | | | | | | | | | | | | | | | |
Total capital expenditures | | $ | 3,046,956 | | $ | 1,950,324 | | $ | 550,839 | | $ | 457,468 | | $ | 440,853 | |
| | | | | | | | | | | | |
| | | | | | | | | | | | | | | | | |
| | | | | | | | | | | | | | | | | |
| | | | | | | | | | | | |
- (1)
- Amounts have been restated to reflect the deconsolidation of MarkWest Pioneer as discussed in Note 3 of the accompanying Notes to Consolidated Financial Statements included in Item 8 of this Form 10-K. The adjustments to the amounts previously reported were not material.
- (2)
- As discussed further in Note 7 of the accompanying Notes to Consolidated Financial Statements included in Item 8 of this Form 10-K, volatility in any given period related to unrealized gains and losses on our derivative positions can be significant. The following table summarizes the realized and unrealized gains and losses impactingRevenue,Purchased product costs,Facility expenses,Interest expense andMiscellaneous income (expense), net (in thousands):
| | | | | | | | | | | | | | | | |
| | Year ended December 31, | |
|---|
| | 2013 | | 2012 | | 2011 | | 2010 | | 2009 | |
|---|
Realized (loss) gain—revenue | | $ | (3,534 | ) | $ | (6,508 | ) | $ | (48,093 | ) | $ | (33,560 | ) | $ | 87,289 | |
Unrealized (loss) gain—revenue | | | (21,104 | ) | | 63,043 | | | 19,058 | | | (20,372 | ) | | (207,641 | ) |
Realized loss—purchased product costs | | | (6,634 | ) | | (26,493 | ) | | (27,711 | ) | | (21,909 | ) | | (53,052 | ) |
Unrealized gain (loss)—purchased product costs | | | 8,371 | | | 40,455 | | | (25,249 | ) | | (5,804 | ) | | (15,831 | ) |
Unrealized (loss) gain—facility expenses | | | (2,869 | ) | | (1,371 | ) | | 6,480 | | | 1,295 | | | 373 | |
Realized gain—interest expense | | | — | | | — | | | — | | | 2,380 | | | 2,000 | |
Unrealized (loss) gain—interest expense | | | — | | | — | | | — | | | (509 | ) | | 509 | |
Unrealized gain—miscellaneous income (expense), net | | | — | | | — | | | — | | | 190 | | | 336 | |
| | | | | | | | | | | | |
| | | | | | | | | | | | | | | | | |
Total derivative (loss) gain | | $ | (25,770 | ) | $ | 69,126 | | $ | (75,515 | ) | $ | (78,289 | ) | $ | (186,017 | ) |
| | | | | | | | | | | | |
| | | | | | | | | | | | | | | | | |
| | | | | | | | | | | | | | | | | |
| | | | | | | | | | | | |
- (3)
- For the calculation of Net income attributable to the Partnership's common unitholders per common unit, see Note 23 of the accompanying Notes to Consolidated Financial Statements included in Item 8 of this Form 10-K.
- (4)
- Maintenance capital includes capital expenditures made to maintain our operating capacity and asset base. Growth capital includes expenditures made to expand the existing operating capacity, to increase the efficiency of our existing assets and to facilitate an increase in volumes within our operations. Growth capital also includes costs associated with new well connections. Growth capital excludes expenditures for third-party acquisitions and equity investment.
70
Table of Contents
Operating Data
| | | | | | | | | | | | | | | | |
| | Year ended December 31, | |
|---|
| | 2013 | | 2012 | | 2011 | | 2010 | | 2009 | |
|---|
Marcellus(1) | | | | | | | | | | | | | | | | |
Gathering system throughput (Mcf/d)(2) | | | 549,500 | | | 425,000 | | | 245,700 | | | 142,200 | | | 53,500 | |
Natural gas processed (Mcf/d) | | | 1,101,900 | | | 496,400 | | | 323,900 | | | 215,700 | | | 51,800 | |
NGLs fractionated (Bbl/d)(3) | | | 47,600 | | | 24,900 | | | 11,800 | | | 4,200 | | | 1,100 | |
NGL sales (gallons, in thousands)(4) | | | 820,400 | | | 393,600 | | | 241,200 | | | 119,900 | | | 34,400 | |
Utica(5) | | | | | | | | | | | | | | | | |
Gathering system throughput (Mcf/d) | | | 62,400 | | | 5,000 | | | N/A | | | N/A | | | N/A | |
Natural gas processed (Mcf/d) | | | 88,400 | | | 4,200 | | | N/A | | | N/A | | | N/A | |
Northeast(6) | | | | | | | | | | | | | | | | |
Natural gas processed (Mcf/d) | | | 296,100 | | | 320,500 | | | 305,900 | | | 188,700 | | | 194,600 | |
NGLs fractionated (Bbl/d)(7) | | | 20,200 | | | 17,300 | | | 20,300 | | | 20,700 | | | 18,300 | |
Keep-whole sales (gallons, in thousands) | | |
117,500 | | |
131,600 | | |
113,800 | | |
136,700 | | |
145,500 | |
Percent-of-proceeds sales (gallons, in thousands) | | | 134,300 | | | 139,700 | | | 130,300 | | | 120,300 | | | 99,900 | |
| | | | | | | | | | | | |
| | | | | | | | | | | | | | | | | |
Total NGL sales (gallons, in thousands)(8) | | | 251,800 | | | 271,300 | | | 244,100 | | | 257,000 | | | 245,400 | |
Crude oil transported for a fee (Bbl/d) | | | 9,700 | | | 9,300 | | | 10,300 | | | 12,800 | | | 12,300 | |
Southwest | | | | | | | | | | | | | | | | |
East Texas gathering systems throughput (Mcf/d) | | | 504,000 | | | 450,000 | | | 423,600 | | | 430,300 | | | 454,400 | |
East Texas natural gas processed (Mcf/d) | | | 355,100 | | | 270,800 | | | 228,300 | | | 233,100 | | | 246,600 | |
East Texas NGL sales (gallons, in thousands)(9) | | | 334,400 | | | 275,800 | | | 238,700 | | | 245,800 | | | 245,800 | |
Western Oklahoma gathering system throughput (Mcf/d)(10) | | | 238,600 | | | 235,600 | | | 237,900 | | | 191,100 | | | 185,600 | |
Western Oklahoma natural gas processed (Mcf/d) | | | 202,600 | | | 206,500 | | | 175,500 | | | 134,700 | | | 148,000 | |
Western Oklahoma NGL sales (gallons, in thousands) | | | 239,200 | | | 214,400 | | | 177,200 | | | 134,100 | | | 126,900 | |
Southeast Oklahoma gathering systems throughput (Mcf/d) | | | 443,700 | | | 487,900 | | | 511,900 | | | 521,400 | | | 416,800 | |
Southeast Oklahoma natural gas processed (Mcf/d)(11) | | | 153,800 | | | 121,800 | | | 103,400 | | | 81,600 | | | 39,400 | |
Southeast Oklahoma NGL sales (gallons, in thousands) | | | 159,600 | | | 163,300 | | | 125,100 | | | 102,300 | | | 48,400 | |
Other Southwest gathering system throughput (Mcf/d)(12) | | | 35,000 | | | 24,300 | | | 29,900 | | | 39,500 | | | 57,600 | |
Gulf Coast refinery off-gas processed (Mcf/d) | | | 103,400 | | | 118,400 | | | 113,300 | | | 118,600 | | | 120,200 | |
Gulf Coast liquids fractionated (Bbl/d) | | | 18,800 | | | 22,500 | | | 21,200 | | | 22,500 | | | 23,200 | |
Gulf Coast NGL sales (gallons excluding hydrogen, in thousands) | | | 288,800 | | | 345,300 | | | 325,700 | | | 345,500 | | | 356,300 | |
- (1)
- The 2009 volumes of NGLs fractionated and sold represent the average daily rate for the period of operation.
- (2)
- The 2013 volumes exclude Sherwood gathering as this system was sold to Summit in June 2013.
- (3)
- Amount includes all NGLs that were produced at the Marcellus processing facilities and fractionated into purity products at our Marcellus fractionation facility. Excludes 300 Bbl/d of ethane fractionated for 2013.
- (4)
- Includes sale of all purity products fractionated at the Marcellus facilities and sale of all unfractionated NGLs. Also includes the sale of purity products fractionated and sold at the Siloam facilities on behalf of Marcellus customers
71
Table of Contents
- (5)
- Utica operations began in August 2012. The volumes reported for 2012 are the average daily rate for the days of operation.
- (6)
- Includes throughput from the Kenova, Cobb, Boldman and Langley processing plants. We acquired the Langley processing plant in February 2011. The volumes reported for 2011 represent the average daily rates for the days of operation.
- (7)
- Amount includes 5,200 Bbl/d, 400 Bbl/d, 3,900 Bbl/d and 4,000 Bbl/d fractionated on behalf of Marcellus for 2013, 2012, 2011 and 2010, respectively.
- (8)
- Represents sales at the Siloam fractionator. The total sales exclude approximately 59,700,000 gallons, 6,500,000 gallons, 59,200,000 gallons and 60,900,000 gallons sold by the Northeast on behalf of Marcellus for 2013, 2012, 2011 and 2010, respectively. These volumes are included as part of NGLs sold at Marcellus.
- (9)
- Includes approximately 14,420,000 gallons produced in conjunction with take in kind contracts for the year ended December 31, 2013.
- (10)
- Includes natural gas gathered in western Oklahoma and from the Granite Wash formation in the Texas Panhandle as management considers this one integrated area of operations.
- (11)
- The natural gas processing in southeast Oklahoma is outsourced to Centrahoma or other third-party processors.
- (12)
- Excludes lateral pipelines where revenue is not based on throughput.
ITEM 7. Management's Discussion and Analysis of Financial Condition and Results of Operations
Management's Discussion and Analysis ("MD&A") contains statements that are forward-looking and should be read in conjunction withSelected Financial Data and our consolidated financial statements and accompanying notes included elsewhere in this Form 10-K. Statements that are not historical facts are forward-looking statements. We use words such as "could," "may," "predict," "should," "expect," "hope," "continue," "potential," "plan," "intend," "anticipate," "project," "believe," "estimate," and similar expressions to identify forward-looking statements. These statements are based on current expectations, estimates, assumptions and beliefs concerning future events impacting us and therefore involve a number of risks and uncertainties. Forward-looking statements are not guarantees and actual results could differ materially from those expressed or implied in the forward-looking statements as a result of a number of factors. We do not update publicly any forward-looking statement with new information or future events. Undue reliance should not be placed on forward-looking statements as many of these factors are beyond our ability to control or predict.
Overview
We are a master limited partnership engaged in the gathering, processing and transportation of natural gas; the gathering, transportation, fractionation, storage and marketing of NGLs; and the gathering and transportation of crude oil. We have a leading presence in many key unconventional natural gas plays including the Marcellus Shale, Utica Shale, Huron/Berea Shale, Haynesville Shale, Woodford Shale and Granite Wash formation.
Significant Financial and Other Highlights
Significant financial and other highlights for the year ended December 31, 2013 are listed below. Refer toResults of Operations andLiquidity and Capital Resources for further details.
72
Table of Contents
- •
- Total segment operating income before items not allocated to segments increased approximately $62.7 million, or 10%, for the year ended December 31, 2013 as compared to the same period in 2012. The increase consists of the following:
- •
- An increase of $138.0 million due to the continued growth in our Marcellus segment with a 122% increase in processed volumes and a 91% increase in fractionation volumes.
- •
- A decrease of $49.6 million in the Southwest segment. Despite a 14% increase in processed volumes primarily driven by growth in our East Texas and Southeast Oklahoma operations, operating income decreased due to lower NGL pricing, a reduction of frac spread margins and a shift in contract mix from keep-whole contracts to fee-based contracts partially offset by the operating income from the Buffalo Creek Acquisition.
- •
- A decrease of $22.6 million in the Northeast segment due to a reduction in the frac spread margin and lower sales volumes.
- •
- Realized losses from the settlement of our derivative instruments were $10.2 million for the year ended 2013 compared to $33.0 million for the same period in 2012 due primarily to lower NGL pricing throughout 2013.
- •
- We continued our expansion primarily in the Marcellus and Utica segments. We have both completed construction and placed into service eight new cryogenic processing facilities with a total capacity of over 1.4 Bcf/d.
- •
- In January 2013, we received net proceeds of approximately $986.0 million from a public offering of $1.0 billion in aggregate principal amount of our 4.5% senior unsecured notes due in 2023, which were issued at par. We used a portion of the proceeds from the January notes offering to repurchase $81.1 million aggregate principal amount of our 8.75% senior notes due April 2018, $175.0 million of outstanding principal amount of our 6.5% senior notes due August 2021 and $245.0 million of outstanding principal amount of our 6.25% senior notes due June 2022.
- •
- In February 2013, we entered into the Amended Utica LLC Agreement, pursuant to which the aggregate funding commitment of EMG Utica, LLC ("EMG Utica") increased from $500.0 million to $950.0 million.
- •
- In May 2013, we completed the Buffalo Creek Acquisition for total consideration of $225.2 million. The acquired assets included a 200 MMcf/d cryogenic gas processing plant that was under construction at the closing, 22 miles of gas gathering pipeline in Hemphill County, Texas and approximately 30 miles of rights-of-way associated with the future construction of a high-pressure trunk line. The Buffalo Creek Processing Facility and high pressure gathering pipeline was completed and placed into service in February 2014.
- •
- In June 2013, we completed the sale of certain gathering assets in Doddridge County, West Virginia (the "Sherwood Asset Sale") to Summit and received proceeds of approximately $207.9 million, net of third party transaction costs.
- •
- In December 2013, we and EMG announced the execution of definitive agreements with Gulfport to provide stabilization services and potential gathering services for condensate produced within an area that includes Belmont, Harrison, Guernsey, Noble and Monroe counties, Ohio. Gulfport is rapidly developing their acreage within the wet gas, retrograde condensate and oil windows of the emerging Utica Shale and currently has over 147,000 net acres under lease. In conjunction with these agreements, we formed a new joint venture with EMG called MarkWest Utica EMG Condensate and its subsidiary, Ohio Condensate which are related to the development of industry-leading facilities and services to support the rapid growth of condensate production occurring in the liquids-rich areas of the Utica Shale. Discussions
73
Table of Contents
Results of Operations
Segment Reporting
We classify our business in the following reportable segments: Marcellus, Utica, Northeast and Southwest . We capture information in MD&A by geographical segment. Items belowIncome from operations in the accompanying Consolidated Statements of Operations, certain compensation expense, certain other non-cash items and any unrealized gains (losses) from derivative instruments are not allocated to individual business segments. Management does not consider these items allocable to or controllable by any individual business segment and therefore excludes these items when evaluating segment performance. The segment results are also adjusted to exclude the portion of operating income attributable to the non-controlling interests. The Southwest segment results and the reconciliation of segment operating income to consolidating net income before provision for income tax presented below for the years ended December 31, 2012 and 2011 have been restated to reflect the deconsolidation of MarkWest Pioneer as discussed in Note 4 of the accompanying Notes to Consolidated Financial Statements included in Item 8 of this Form 10-K. The adjustments to the amounts previously reported were not material.
Year Ended December 31, 2013 Compared to Year Ended December 31, 2012
The tables below present financial information, as evaluated by management, for the reported segments for the years ended December 31, 2013 and 2012. The information includes net operating margin, a non-GAAP financial measure. For a reconciliation of net operating margin toIncome from
74
Table of Contents
operations, the most comparable GAAP financial measure, seeOur Contracts discussion in Item 1. Business. This section should be read in conjunction with ourOperating Data table that details volumes in Item 6. Selected Financial Data and our contract mix table found on page 23 of Item 1. Business.
Marcellus
| | | | | | | | | | | | | |
| | Year ended December 31, | |
| |
| |
|---|
| | 2013 | | 2012 | | $ Change | | % Change | |
|---|
| | (in thousands)
| |
| |
|---|
Segment revenue | | $ | 527,073 | | $ | 319,867 | | $ | 207,206 | | | 65 | % |
Purchased product costs | | | (100,262 | ) | | (74,024 | ) | | (26,238 | ) | | 35 | % |
| | | | | | | | | | | |
| | | | | | | | | | | | | | |
Net operating margin | | | 426,811 | | | 245,843 | | | 180,968 | | | 74 | % |
Facility expenses | | | (108,781 | ) | | (65,825 | ) | | (42,956 | ) | | 65 | % |
| | | | | | | | | | | |
| | | | | | | | | | | | | | |
Operating income before items not allocated to segments | | $ | 318,030 | | $ | 180,018 | | $ | 138,012 | | | 77 | % |
| | | | | | | | | | | |
| | | | | | | | | | | | | | |
| | | | | | | | | | | | | | |
| | | | | | | | | | | |
Segment Revenue. Revenue increased due to ongoing expansion of the Marcellus segment operations resulting in increased gathered, processed and fractionated volumes. Revenue increased approximately $157.3 million related to gathering, processing and fractionation fees, of which approximately $66.2 million is due to our acquisition of certain assets from Keystone Midstream Services, LLC ("Keystone") located in Butler County, Pennsylvania (the "Keystone Acquisition") and the opening of the Sherwood Complex and the Mobley Complex and the remainder of which is due to increased volumes at our Houston and Majorsville facilities. Revenue also increased by approximately $49.9 million related to an increase in NGL sales volumes partially offset by a decrease in NGL prices. These revenue increases were partially offset by the impact of several operational constraints discussed further in theNet Operating Margin section below.
Purchased Product Costs. Purchased product costs increased due to an increase of inventory sold, offset by a decrease in NGL prices.
Net Operating Margin. Net operating margin increased as the volume of natural gas gathered, processed and fractionated increased by 29%, 122% and 91%, respectively. Approximately 80% of the net operating margin in 2013 is earned under fee-based contracts (75% in 2012) and was not significantly impacted by the decline in commodity prices for the year ended December 31, 2013 compared to the same period in 2012. In total, the volumes of natural gas gathered and processed for one major customer account for a large amount of our consolidated net operating margin. Given the liquids rich acreage of the Marcellus Shale, if that customer's volumes decreased, we believe we could replace at least a reasonable portion of those volumes with volumes from other customers. Certain temporary capacity and other operational constraints that occurred during the second half of 2013 prevented us from realizing the full economic benefit of the significant growth in our producer customers' volumes. Our net operating margin was approximately $13.5 million lower than expected due to the following constraints:
- •
- The NGL production resulting from the increased volumes has exceeded our current fractionation capacity. Additional fractionation capacity commenced operation in January 2014. In response to this capacity constraint in 2013, we made arrangements for the excess NGLs to be fractionated by third-party facilities. As part of these arrangements and until the end of 2013, we incurred additional transportation costs and realized lower fractionation income;
- •
- We experienced a temporary shutdown of the Mobley processing facilities and partial curtailment of operations of the Sherwood processing facilities beginning in the middle of August 2013. The constraints on the processing operations were due to damage to a portion of
75
Table of Contents
the Marcellus NGL pipeline in Wetzel County, West Virginia which resulted from landslides that originated from significant run-off and saturation as a result of persistent rainfall ("Wetzel County Landslides"). The pipeline and processing facilities impacted by the Wetzel County Landslides safely resumed normal operations in mid-October 2013; and
- •
- The delay in the completion of Sunoco's Mariner West pipeline project resulted in lower than expected income during 2013. The Mariner West pipeline became operational in November 2013 and, together with the commencement of commercial deliveries to the ATEX Pipeline in 2014 and completion of the ethane service at Mariner East in 2015, we anticipate steady growth in utilization of the Marcellus segment's recently completed ethane fractionation facilities.
Facility Expenses. Facility expenses increased due to the ongoing expansion of the Marcellus segment operations, additional expenses of approximately $7.7 million, net of insurance recoveries, related to the Wetzel County Landslide and additional expenses caused by the limitations in fractionation capacity discussed above under Net Operating Margin.
Utica
| | | | | | | | | | | | | |
| | Year ended December 31, | |
| |
| |
|---|
| | 2013 | | 2012 | | $ Change | | % Change | |
|---|
| | (in thousands)
| |
| |
| |
| |
|---|
Segment revenue | | $ | 26,442 | | $ | 571 | | $ | 25,871 | | | 4,531 | % |
Purchased product costs | | | — | | | — | | | — | | | 0 | % |
| | | | | | | | | | | |
| | | | | | | | | | | | | | |
Net operating margin | | | 26,442 | | | 571 | | | 25,871 | | | 4,531 | % |
Facility expenses | | | (35,081 | ) | | (3,968 | ) | | (31,113 | ) | | 784 | % |
Portion of operating loss attributable to non-controlling interests | | | 3,499 | | | 1,359 | | | 2,140 | | | 157 | % |
| | | | | | | | | | | |
| | | | | | | | | | | | | | |
Operating loss before items not allocated to segments | | $ | (5,140 | ) | $ | (2,038 | ) | $ | (3,102 | ) | | 152 | % |
| | | | | | | | | | | |
| | | | | | | | | | | | | | |
| | | | | | | | | | | | | | |
| | | | | | | | | | | |
The results of operations for the year ended December 31, 2013 include our operations in Utica Shale areas of eastern Ohio. The increase in revenues is due to the increased processing volumes as we commenced operations of an additional 325 MMcf/d of processing capacity throughout the year. We expect that operations will continue to grow significantly as we add an additional 600 MMcf/d cryogenic capacity through the end of 2014 and increase the utilization of the facilities as our producer customers continue to execute their drilling programs. Facility expenses include start-up costs and other costs that cannot be capitalized, including approximately $5.9 million of amortization of costs to install temporary compression and treating facilities and approximately $4.8 million of costs related to the temporary constraints on our fractionation capacity discuss above in theMarcellus—Net Operating Margin section.
76
Table of Contents
Northeast
| | | | | | | | | | | | | |
| | Year ended
December 31, | |
| |
| |
|---|
| | 2013 | | 2012 | | $ Change | | % Change | |
|---|
| | (in thousands)
| |
| |
|---|
Segment revenue | | $ | 204,326 | | $ | 225,818 | | $ | (21,492 | ) | | (10 | )% |
Purchased product costs | | | (65,192 | ) | | (68,402 | ) | | 3,210 | | | (5 | )% |
| | | | | | | | | | | |
| | | | | | | | | | | | | | |
Net operating margin | | | 139,134 | | | 157,416 | | | (18,282 | ) | | (12 | )% |
Facility expenses | | | (28,425 | ) | | (24,106 | ) | | (4,319 | ) | | 18 | % |
| | | | | | | | | | | |
| | | | | | | | | | | | | | |
Operating income before items not allocated to segments | | $ | 110,709 | | $ | 133,310 | | | (22,601 | ) | | (17 | )% |
| | | | | | | | | | | |
| | | | | | | | | | | | | | |
| | | | | | | | | | | | | | |
| | | | | | | | | | | |
Segment Revenue. Revenue decreased by approximately $20.3 million due to lower NGL sales volumes and $6.1 million related to lower NGL prices. The decrease in revenue was partially offset by a $4.6 million increased fractionation fees from NGLs fractionated for our Marcellus segment.
Purchased Product Costs. Purchased product costs decreased primarily due to the 11% decline in keep-whole sales volumes. The decreases were partially offset by higher prices for natural gas that is purchased to satisfy the keep-whole arrangements.
Net Operating Margin. Net operating margin decreased due to a 7% decreased gallons sold and the narrowing of the spread between NGL and natural gas prices, as approximately 61% of the net operating margin in 2013 is derived from commodity sensitive keep-whole contracts. The overall frac spread margins declined by approximately 15% as compared to 2012. These variances were partially offset by improvement in margins in percent of proceeds contracts due to a contractual increase in the percentage retained beginning November 2012 and an increase in fractionation fees earned on NGL volumes produced by the Marcellus segment.
Facility Expenses. Facility expenses increased due primarily to a non-recurring prior year adjustment of approximately $1.3 million related to a reduction in property taxes resulting from a favorable rate determination related to one of our facilities. The remaining increase was for a non-recurring repair on our Michigan crude pipeline, as well as the timing of normal facility maintenance and repairs.
Southwest
| | | | | | | | | | | | | |
| | Year ended December 31, | |
| |
| |
|---|
| | 2013 | | 2012 | | $ Change | | % Change | |
|---|
| | (in thousands)
| |
| |
|---|
Segment revenue | | $ | 935,426 | | $ | 842,958 | | $ | 92,468 | | | 11 | % |
Purchased product costs | | | (525,711 | ) | | (387,902 | ) | | (137,809 | ) | | 36 | % |
| | | | | | | | | | | |
| | | | | | | | | | | | | | |
Net operating margin | | | 409,715 | | | 455,056 | | | (45,341 | ) | | (10 | )% |
Facility expenses | | | (127,112 | ) | | (122,691 | ) | | (4,421 | ) | | 4 | % |
Portion of operating income attributable to non-controlling interests | | | (21 | ) | | (176 | ) | | 155 | | | (88 | )% |
| | | | | | | | | | | |
| | | | | | | | | | | | | | |
Operating income before items not allocated to segments | | $ | 282,582 | | $ | 332,189 | | $ | (49,607 | ) | | (15 | )% |
| | | | | | | | | | | |
| | | | | | | | | | | | | | |
| | | | | | | | | | | | | | |
| | | | | | | | | | | |
Segment Revenue. Revenues increased due to approximately $42.3 million higher gas sales and approximately $1.9 million higher hydrogen revenue. The increase in gas sales revenue is primarily caused by higher prices and operating in ethane rejection in certain areas. Hydrogen revenue increased
77
Table of Contents
in our Javelina facility mainly due to a 32.0% increase in price. Processing fees increased approximately $20.7 million related to increases in East Texas related to the new Carthage east plant (the "Carthage East Processing Facility") completed at the end of 2012 and change in contract mix, which resulted in more volumes processed under fee-based arrangements and increases in processed volumes in southeast Oklahoma. NGL sales revenue increased by approximately $35.1 million resulting primarily from a $45.5 million increase from the full year of operation of the Carthage East Processing Facility. The increase was partially offset by an $7.3 million decrease caused by a planned shutdown of one customer's refinery operations from mid-January through mid-March in our Javelina area and shutdowns for other planned maintenance activities. Changes in contract mix, lower prices and reduced volumes of condensate sales in other areas also contributed.
Purchased Product Costs. Purchased product costs increased due to increases of approximately $118.4 million in higher NGL purchases, which consisted of approximately $34.1 million in southeast Oklahoma, approximately $54.8 million in East Texas and approximately $29.5 million in western Oklahoma. NGL purchases increased significantly more than NGL sales due to a shift in contract mix, which resulted in less volumes processed under keep-whole contracts and more volumes processed under fee-based or other arrangements in which NGLs are purchased from producer customers and resold. The remainder of the increase is due to gas purchases of approximately $16.8 million primarily due to higher gas prices.
Net Operating Margin. Net operating margin decreased as a percentage of revenue due to the change in contract mix discussed above. The decrease in net operating margin was partially offset by an approximately 14% increase in the volume of natural gas processed. Such increase was primarily due to producers increased production in the rich gas areas of the Haynesville Shale, Woodford Shale and Cotton Valley formations.
Facility Expenses. Facility expenses increased due primarily to repairs and maintenance at our Javelina facility caused by the overhaul of three inlet compressors and a plant turnaround in the fourth quarter of 2013, which was partially offset by savings in compressor rentals.
Reconciliation of Segment Operating Income to Consolidated Income
Before Provision for Income Tax
The following table provides a reconciliation of segment revenue to total revenue and operating income before items not allocated to segments to our consolidated income before provision for income tax for the years ended December 31, 2013 and 2012. The ensuing items listed below theTotal segment
78
Table of Contents
revenue andOperating income lines are not allocated to business segments as management does not consider these items allocable to any individual segment.
| | | | | | | | | | | | | |
| | Year ended December 31, | |
| |
| |
|---|
| | 2013 | | 2012 | | $ Change | | % Change | |
|---|
| | (in thousands)
| |
| |
|---|
Total segment revenue | | $ | 1,693,267 | | $ | 1,389,214 | | $ | 304,053 | | | 22 | % |
Derivative (loss) gain not allocated to segments | | | (24,638 | ) | | 56,535 | | | (81,173 | ) | | (144 | )% |
Revenue deferral adjustment and other | | | (6,182 | ) | | (5,935 | ) | | (247 | ) | | 4 | % |
| | | | | | | | | | | |
| | | | | | | | | | | | | | |
Total revenue | | $ | 1,662,447 | | $ | 1,439,814 | | $ | 222,633 | | | 15 | % |
| | | | | | | | | | | |
| | | | | | | | | | | | | | |
| | | | | | | | | | | | | | |
| | | | | | | | | | | |
Operating income before items not allocated to segments | | $ | 706,181 | | $ | 643,479 | | $ | 62,702 | | | 10 | % |
Portion of operating income attributable to non-controlling interests | | | (3,478 | ) | | (1,183 | ) | | (2,295 | ) | | 194 | % |
Derivative (loss) gain not allocated to segments | | | (25,770 | ) | | 69,126 | | | (94,896 | ) | | (137 | )% |
Revenue deferral adjustment and other | | | (6,182 | ) | | (5,935 | ) | | (247 | ) | | 4 | % |
Compensation expense included in facility expenses not allocated to segments | | | (2,421 | ) | | (1,022 | ) | | (1,399 | ) | | 137 | % |
Facility expenses adjustments | | | 10,751 | | | 10,751 | | | — | | | 0 | % |
Selling, general and administrative expenses | | | (101,549 | ) | | (93,444 | ) | | (8,105 | ) | | 9 | % |
Depreciation | | | (299,884 | ) | | (183,250 | ) | | (116,634 | ) | | 64 | % |
Amortization of intangible assets | | | (64,644 | ) | | (53,320 | ) | | (11,324 | ) | | 21 | % |
Gain (loss) on disposal of property, plant and equipment | | | 33,763 | | | (6,254 | ) | | 40,017 | | | (640 | )% |
Accretion of asset retirement obligations | | | (824 | ) | | (672 | ) | | (152 | ) | | 23 | % |
| | | | | | | | | | | |
| | | | | | | | | | | | | | |
Income from operations | | | 245,943 | | | 378,276 | | | (132,333 | ) | | (35 | )% |
Earnings from unconsolidated affiliates | | | 1,422 | | | 2,328 | | | (906 | ) | | (39 | )% |
Interest income | | | 262 | | | 419 | | | (157 | ) | | (37 | )% |
Interest expense | | | (151,851 | ) | | (120,191 | ) | | (31,660 | ) | | 26 | % |
Amortization of deferred financing costs and discount (a component of interest expense) | | | (6,726 | ) | | (5,601 | ) | | (1,125 | ) | | 20 | % |
Loss on redemption of debt | | | (38,455 | ) | | — | | | (38,455 | ) | | N/A | |
Miscellaneous income, net | | | 2,519 | | | 62 | | | 2,457 | | | 3,963 | % |
| | | | | | | | | | | |
| | | | | | | | | | | | | | |
Income before provision for income tax | | $ | 53,114 | | $ | 255,293 | | $ | (202,179 | ) | | (79 | )% |
| | | | | | | | | | | |
| | | | | | | | | | | | | | |
| | | | | | | | | | | | | | |
| | | | | | | | | | | |
Derivative (Loss) Gain Not Allocated to Segments. Unrealized loss from the change in fair value of our derivative instruments was $15.6 million for the year ended December 31, 2013 compared to an unrealized gain of $102.1 million for the same period in 2012. Realized loss from the settlement of our derivative instruments was $10.2 million for the year ended December 31, 2013 compared to a realized loss of $33.0 million for the same period in 2012. The total change of $94.9 million is due primarily to increased volatility in commodity prices.
Revenue Deferral Adjustment and Other. Revenue deferral adjustment relates primarily to certain contracts in which the cash consideration we receive for providing service is greater during the initial years of the contract compared to the later years. In accordance with GAAP, the revenue is recognized evenly over the term of the contract as we will perform a similar level of service for the entire term; therefore, the revenue recognized in the current reporting period is less than the cash received. However, the chief operating decision maker and management evaluate the segment performance based on the cash consideration received and therefore, the impact of the revenue deferrals is excluded for segment reporting purposes. For the year ended December 31, 2013, approximately $6.4 million and
79
Table of Contents
$0.8 million of the revenue deferral adjustment is attributable to the Northeast segment and Southwest segment, respectively. For the year ended December 31, 2012, approximately $6.6 million and $0.8 million of the revenue deferral adjustment is attributable to the Southwest segment and Northeast segment, respectively. Based on current commodity prices, management expects the revenue deferral in subsequent periods to approximate the amount for the twelve months ended December 31, 2013 until the beginning of 2015 when the cash consideration received from these contracts will decline and the reported segment revenue will be less than the revenue recognized for GAAP purposes. Other consists of management fee revenues from an unconsolidated affiliate of $1.0 million for the year ended December 31, 2013 compared to $1.5 million for the year ended December 31, 2012.
Facility Expense Adjustments. Facility expense adjustments consist of the reallocation of the interest expense related to SMR which is included in facility expenses for the purposes of evaluating the performance of the Southwest segment.
Selling, General and Administration Expenses. Selling, general and administrative expenses increased primarily due to higher labor, benefits, travel, office expense and professional services necessary to support the overall growth of our operations.
Depreciation. Depreciation increased due to additional projects completed at the end of 2012 and throughout 2013.
Amortization of Intangible Assets. Amortization increased due to the customer relationship intangibles acquired in the Keystone Acquisition and the Buffalo Creek Acquisition.
Gain (loss) on Disposal of Property, Plant and Equipment. Gain on disposal of property, plant and equipment relates primarily to a gain on our Sherwood Asset Sale in June 2013 of approximately $39.7 million.
Interest Expense. Interest expense increased due to the increased amount of outstanding debt. The increase was partially offset by an increase in capitalized interest of $9.0 million.
Loss on Redemption of Debt. The loss on redemption of debt was related to the redemption of the 2018 Senior Notes, a portion of the 2021 Senior Notes and a portion of the 2022 Senior Notes, which occurred in the first quarter of 2013, while no such redemptions of debt occurred in 2012.
Provision for Income Tax. The total provision for income tax for the year ended December 31, 2013 was $12.7 million. See Note 22 of the accompanying Notes to Consolidated Financial Statements included in Item 8 of this Form 10-K for details of the significant components of the provision.
MarkWest Hydrocarbon pays tax based on enacted and applicable corporate and state tax rates on its pro-rata share of income and deductions allocated to the Class A units by the Partnership.
The current provision for income tax was a tax benefit of $11.2 million for the year ended December 31, 2013 compared to a tax benefit of $2.4 million for the year ended December 31, 2012. The increase in the current tax benefit was primarily due to an increase in the bonus depreciation for tax purposes due to an increase in the value of assets placed into service. We expect the current provision for income tax to be near zero in 2014 due to expected increases in additional income allocated to MarkWest Hydrocarbon as a result of its ownership of Class A units due to increases in earnings, the unavailability of the bonus depreciation election and additional income expected to be allocated by the Partnership in accordance with the Internal Revenue Code. The expected increases in the current tax provision in 2014 are expected to be offset by the partial use of approximately $26.5 million of federal net operating loss ("NOL") carryforwards and $1.5 million of state NOL carryforwards.
80
Table of Contents
Year Ended December 31, 2012 Compared to Year Ended December 31, 2011
The tables below present financial information, as evaluated by management, for the reported segments for the years ended December 31, 2012 and 2011. The information includes net operating margin, a non-GAAP financial measure. For a reconciliation of net operating margin toIncome (loss) from operations, the most comparable GAAP financial measure, seeOur Contracts discussion in Item 1. Business.
Marcellus
| | | | | | | | | | | | | |
| | Year ended
December 31, | |
| |
| |
|---|
| | 2012 | | 2011 | | $ Change | | % Change | |
|---|
| | (in thousands)
| |
| |
|---|
Segment revenue | | $ | 319,867 | | $ | 248,949 | | $ | 70,918 | | | 28 | % |
Purchased product costs | | | (74,024 | ) | | (83,847 | ) | | 9,823 | | | (12 | )% |
| | | | | | | | | | | |
| | | | | | | | | | | | | | |
Net operating margin | | | 245,843 | | | 165,102 | | | 80,741 | | | 49 | % |
Facility expenses | | | (65,825 | ) | | (34,913 | ) | | (30,912 | ) | | 89 | % |
Portion of operating income attributable to non-controlling interests | | | — | | | (63,731 | ) | | 63,731 | | | (100 | )% |
| | | | | | | | | | | |
| | | | | | | | | | | | | | |
Operating income before items not allocated to segments | | $ | 180,018 | | $ | 66,458 | | $ | 113,560 | | | 171 | % |
| | | | | | | | | | | |
| | | | | | | | | | | | | | |
| | | | | | | | | | | | | | |
| | | | | | | | | | | |
Segment Revenue. Segment revenue increased due to ongoing expansion of the Marcellus operations resulting in increased gathered, processed and fractionated volumes. Revenue increased $66.2 million related to gathering, processing and fractionation fees and approximately $20.0 million related to increased NGL product sales under a percent of proceeds agreement with a producer, offset by a decrease of approximately $17.1 million in sales of propane from inventory purchased from producer customers. NGLs sales increased due to higher volumes but were partially offset by lower prices.
Purchased Product Costs. Purchased product costs decreased due to lower NGL prices and lower NGL volumes purchased from producer customers.
Net Operating Margin. Net operating margin increased as the volume of natural gas gathered, processed and fractionated increased by 73%, 53% and 110%, respectively. Approximately 75% of the net operating margin is earned under fee-based contracts and was not significantly impacted by the decline in commodity prices.
Facility Expenses. Facility expenses increased due to costs related to the expansion of Marcellus operations.
Portion of Operating Income Attributable to Non-controlling Interests. The portion of operating income attributable to non-controlling interests represents M&R's interest in net operating income of MarkWest Liberty Midstream. As a result of our acquisition of M&R's interest in MarkWest Liberty Midstream, no portion of its income is attributable to non-controlling interests for the year ended December 31, 2012.
81
Table of Contents
Utica
| | | | | | | | | | | |
| | Year ended
December 31, | |
| |
|
|---|
| |
| | % Change |
|---|
| | 2012 | | 2011 | | $ Change |
|---|
| | (in thousands)
| |
|
|---|
Segment revenue | | $ | 571 | | $ | — | | $ | 571 | | N/A |
Purchased product costs | | | — | | | — | | | — | | N/A |
| | | | | | | | | |
| | | | | | | | | | | | |
Net operating margin | | | 571 | | | — | | | 571 | | N/A |
Facility expenses | | | (3,968 | ) | | — | | | (3,968 | ) | N/A |
Portion of operating (loss) income attributable to non-controlling interests | | | 1,359 | | | — | | | 1,359 | | N/A |
| | | | | | | | | |
| | | | | | | | | | | | |
Operating (loss) income before items not allocated to segments | | $ | (2,038 | ) | $ | — | | $ | (2,038 | ) | N/A |
| | | | | | | | | |
| | | | | | | | | | | | |
| | | | | | | | | | | | |
| | | | | | | | | |
The results of operations for the year ended December 31, 2012 include our operations in Utica Shale areas of eastern Ohio. The first phase of operations began in third quarter 2012. The total planned cryogenic processing capacity is expected to be in operation in 2015. Facility expenses include start-up costs and other costs that cannot be capitalized.
Northeast
| | | | | | | | | | | | | |
| | Year ended
December 31, | |
| |
| |
|---|
| | 2012 | | 2011 | | $ Change | | % Change | |
|---|
| | (in thousands)
| |
| |
|---|
Segment revenue | | $ | 225,818 | | $ | 268,884 | | $ | (43,066 | ) | | (16 | )% |
Purchased product costs | | | (68,402 | ) | | (91,612 | ) | | 23,210 | | | (25 | )% |
| | | | | | | | | | | |
| | | | | | | | | | | | | | |
Net operating margin | | | 157,416 | | | 177,272 | | | (19,856 | ) | | (11 | )% |
Facility expenses | | | (24,106 | ) | | (27,126 | ) | | 3,020 | | | (11 | )% |
| | | | | | | | | | | |
| | | | | | | | | | | | | | |
Operating income before items not allocated to segments | | $ | 133,310 | | $ | 150,146 | | $ | (16,836 | ) | | (11 | )% |
| | | | | | | | | | | |
| | | | | | | | | | | | | | |
| | | | | | | | | | | | | | |
| | | | | | | | | | | |
Segment Revenue. Segment revenue decreased due to lower NGL prices, as well as a contract change related to the acquisition of certain assets from EQT facilities (the "Langley Acquisition") in the first quarter of 2011. Subsequent to the Langley Acquisition, we continue to market the NGLs related to natural gas processed at the natural gas processing facilities located near Langley, Kentucky ("Langley Processing Facilities"); however we are acting as an agent and therefore record revenue net of purchase product costs. Prior to the contract change, we were acting as the principal. The decrease in revenue was partially offset by increased NGL sales volumes, which was partly due to a key transmission pipeline feeding our processing plants that was damaged and had limited service capacity during 2011 but that was repaired and fully operational for 2012.
Purchased Product Costs. Purchased product costs decreased due to the contract change related to the Langley Acquisition discussed in theSegment Revenue section above. In addition, purchased product costs decreased due to lower prices for natural gas purchased to satisfy the keep-whole arrangements in the Appalachia area, which was partially offset by an increase in sales volumes.
Net Operating Margin. Net operating margin decreased due to the decline in NGL prices and narrowing of the spread between NGL and natural gas prices as approximately 70% of the net operating margin is derived from commodity sensitive keep-whole contracts. The decrease was partially offset by an 11% increase in the volume of NGLs sold.
82
Table of Contents
Facility Expenses. Facility expenses decreased primarily due to a reduction in property taxes resulting from a favorable rate determination related to one of our facilities.
Southwest
| | | | | | | | | | | | | |
| | Year ended December 31, | |
| |
| |
|---|
| | 2012 | | 2011 | | $ Change | | % Change | |
|---|
| | (in thousands)
| |
| |
|---|
Segment revenue | | $ | 842,958 | | $ | 1,018,706 | | $ | (175,748 | ) | | (17 | )% |
Purchased product costs | | | (387,902 | ) | | (506,911 | ) | | 119,009 | | | (23 | )% |
| | | | | | | | | | | |
| | | | | | | | | | | | | | |
Net operating margin | | | 455,056 | | | 511,795 | | | (56,739 | ) | | (11 | )% |
Facility expenses | | | (122,691 | ) | | (118,428 | ) | | (4,263 | ) | | 4 | % |
Portion of operating income attributable to non-controlling interests | | | (176 | ) | | (176 | ) | | — | | | 0 | % |
| | | | | | | | | | | |
| | | | | | | | | | | | | | |
Operating income before items not allocated to segments | | $ | 332,189 | | $ | 393,191 | | $ | (61,002 | ) | | (16 | )% |
| | | | | | | | | | | |
| | | | | | | | | | | | | | |
| | | | | | | | | | | | | | |
| | | | | | | | | | | |
Segment Revenue. Segment revenue decreased primarily due to lower NGL prices and a decrease in natural gas sales volumes. The decrease was partially offset by an increase in NGL sales volumes, primarily due to the expansion of western Oklahoma processing facilities completed at the end of the third quarter of 2011 and an increase of $20 million in processing and gathering fees in Oklahoma and Texas due to the 16% increase in volumes processed.
Purchased Product Costs. Purchased product costs decreased primarily due to lower NGL prices and reduction in the volume of natural gas purchased.
Net Operating Margin. Net operating margin decreased due to lower NGL prices as approximately 56% of the net operating margin is derived from commodity sensitive percent-of-proceeds and keep-whole arrangements. The decrease in NGL prices was partially offset by a 16% increase in the volume of natural gas processed as producers continue to increase production in the rich gas areas of the Woodford Shale, Haynesville Shale, Cotton Valley and Granite Wash formations.
Facility Expenses. Facility expenses increased primarily due to the expansion of our processing and gathering facilities in Oklahoma.
Reconciliation of Segment Operating Income to Consolidated Income
Before Provision for Income Tax
The following table provides a reconciliation of segment revenue to total revenue and operating income before items not allocated to segments to our consolidated income before provision for income tax for the years ended December 31, 2012 and 2011. The ensuing items listed below theTotal segment
83
Table of Contents
revenue andOperating income lines are not allocated to business segments as management does not consider these items allocable to any individual segment.
| | | | | | | | | | | | | |
| | Year ended December 31, | |
| |
| |
|---|
| | 2012 | | 2011 | | $ Change | | % Change | |
|---|
| | (in thousands)
| |
| |
|---|
Total segment revenue | | $ | 1,389,214 | | $ | 1,536,539 | | $ | (147,325 | ) | | (10 | )% |
Derivative gain (loss) not allocated to segments | | | 56,535 | | | (29,035 | ) | | 85,570 | | | (295 | )% |
Revenue deferral adjustment and other | | | (5,935 | ) | | (13,947 | ) | | 8,012 | | | (57 | )% |
| | | | | | | | | | | |
| | | | | | | | | | | | | | |
Total revenue | | $ | 1,439,814 | | $ | 1,493,557 | | $ | (53,743 | ) | | (4 | )% |
| | | | | | | | | | | |
| | | | | | | | | | | | | | |
| | | | | | | | | | | | | | |
| | | | | | | | | | | |
Operating income before items not allocated to segments | | $ | 643,479 | | $ | 609,795 | | $ | 33,684 | | | 6 | % |
Portion of operating income attributable to non-controlling interests | | | (1,183 | ) | | 63,907 | | | (65,090 | ) | | (102 | )% |
Derivative gain (loss) not allocated to segments | | | 69,126 | | | (75,515 | ) | | 144,641 | | | (192 | )% |
Revenue deferral adjustment and other | | | (5,935 | ) | | (13,947 | ) | | 8,012 | | | (57 | )% |
Compensation expense included in facility expenses not allocated to segments | | | (1,022 | ) | | (1,781 | ) | | 759 | | | (43 | )% |
Facility expenses adjustments | | | 10,751 | | | 10,751 | | | — | | | 0 | % |
Selling, general and administrative expenses | | | (93,444 | ) | | (80,441 | ) | | (13,003 | ) | | 16 | % |
Depreciation | | | (183,250 | ) | | (143,704 | ) | | (39,546 | ) | | 28 | % |
Amortization of intangible assets | | | (53,320 | ) | | (43,617 | ) | | (9,703 | ) | | 22 | % |
Loss on disposal of property, plant and equipment | | | (6,254 | ) | | (8,797 | ) | | 2,543 | | | (29 | )% |
Accretion of asset retirement obligations | | | (672 | ) | | (1,185 | ) | | 513 | | | (43 | )% |
| | | | | | | | | | | |
| | | | | | | | | | | | | | |
Income from operations | | | 378,276 | | | 315,466 | | | 62,810 | | | 20 | % |
Earnings from unconsolidated affiliates | | | 2,328 | | | 158 | | | 2,170 | | | 1,373 | % |
Interest income | | | 419 | | | 422 | | | (3 | ) | | (1 | )% |
Interest expense | | | (120,191 | ) | | (113,631 | ) | | (6,560 | ) | | 6 | % |
Amortization of deferred financing costs and discount (a component of interest expense) | | | (5,601 | ) | | (5,114 | ) | | (487 | ) | | 10 | % |
Loss on redemption of debt | | | — | | | (78,996 | ) | | 78,996 | | | (100 | )% |
Miscellaneous income, net | | | 62 | | | 144 | | | (82 | ) | | (57 | )% |
| | | | | | | | | | | |
| | | | | | | | | | | | | | |
Income before provision for income tax | | $ | 255,293 | | $ | 118,449 | | $ | 136,844 | | | 116 | % |
| | | | | | | | | | | |
| | | | | | | | | | | | | | |
| | | | | | | | | | | | | | |
| | | | | | | | | | | |
Derivative Gain (Loss) Not Allocated to Segments. Unrealized gain from the change in fair value of our derivative instruments was $102.1 million in 2012 compared to an unrealized gain of $0.3 million in 2011. Realized loss from the settlement of our derivative instruments was $33.0 million in 2012 compared to $75.8 million in 2011. The total change of $144.6 million is due mainly to volatility in commodity prices when comparing prices in 2012 with prices in 2011. Despite the decline in NGL prices in 2012 compared to 2011, we continued to experience realized losses on our derivative positions used to manage NGL price risk due to the decreased effectiveness of the crude oil positions we used as proxy contracts for NGLs prices.
Revenue Deferral Adjustment and Other. Revenue deferral adjustment relates primarily to certain contracts in which the cash consideration we receive for providing service is greater during the initial years of the contract compared to the later years. In accordance with GAAP, the revenue is recognized evenly over the term of the contract as we expect to perform a similar level of service for the entire term; therefore, the revenue recognized in the current reporting period is less than the cash received. However, the chief operating decision maker and management evaluate the segment performance based on the cash consideration received and therefore the impact of the revenue deferrals is excluded
84
Table of Contents
for segment reporting purposes. For the year ended December 31, 2012, approximately $6.6 million and $0.8 million of the revenue deferral adjustment is attributable to the Northeast segment and Southwest segment, respectively. For the year ended December 31, 2011, approximately $8.2 million and $7.2 million of the revenue deferral adjustment is attributable to the Northeast segment and Southwest segment, respectively. Beginning in 2015, the cash consideration received from these contracts will decline and the reported segment revenue will be less than the revenue recognized for GAAP purposes. Other consists of management fee revenues from an unconsolidated subsidiary of $1.5 million and $1.4 million for the years ended December 31, 2012 and 2011, respectively.
Selling, General and Administrative Expenses. Selling, general and administrative expenses increased primarily due to higher labor, benefits, travel, office expense and professional services necessary to support the overall growth of our operations.
Depreciation. Depreciation increased due to additional projects completed during 2012 and 2011, as well as the Keystone Acquisition.
Amortization of Intangible Assets. Amortization increased due to the intangible asset acquired in the Keystone Acquisition.
Interest Expense. Interest expense increased primarily due to increased borrowings resulting from our senior notes offerings in order to fund our capital plan, but was partially offset by lower interest rates and increased capitalized interest due to a number of significant expansion projects under construction.
Amortization of Deferred Financing Costs and Discount. The increase was due to the amortization of deferred financing costs related to notes issued in the third quarter of 2012 and the fourth quarter of 2011.
Loss on Redemption of Debt. The decrease in loss on redemption of debt was related to the redemption of debt which occurred in the first quarter of 2011, while no such redemptions of debt occurred during 2012.
Provision for Income Tax. The total provision for income tax for the year ended December 31, 2012 was $38.3 million. See Note 22 of the accompanying Notes to Consolidated Financial Statements included in Item 8 of this Form 10-K for details of the significant components of the provision.
MarkWest Hydrocarbon pays tax based on enacted and applicable corporate and state tax rates on its pro-rata share of income and deductions allocated to the Class A units by the Partnership.
The current provision for income tax was a tax benefit of $2.4 million for the year ended December 31, 2012 compared to a tax expense of $17.6 million for the year ended December 31, 2011. The decrease in the current provision was primarily due the election of bonus depreciation in 2012 for tax purposes. Approximately $2.7 million tax benefit for the year ended December 31, 2012 is attributable to MarkWest Hydrocarbon, Inc. Of this amount, a tax benefit of $10.5 million is attributable to MarkWest Hydrocarbon's ownership of Class A units and a tax expense of $7.8 million is related to MarkWest Hydrocarbon's NGL marketing activities. The remaining $0.3 million is related to taxes payable by the Partnership associated with the Texas Margin tax.
Liquidity and Capital Resources
Our primary strategy is to expand our asset base through organic growth projects and acquisitions that are accretive to our cash available for distribution per common unit.
85
Table of Contents
Our 2013 capital expenditures and our 2014 capital plan are summarized in the table below (in millions):
| | | | | | | | | | |
| | 2014 Full Year Plan | | Actual | |
|---|
| | Low | | High | | Year ended
December 31, 2013 | |
|---|
Consolidated growth capital(1) | | $ | 2,400 | | $ | 3,000 | | $ | 3,028 | |
Joint venture partner's estimated share of growth capital | | | (600 | ) | | (700 | ) | | (716 | ) |
| | | | | | | | |
| | | | | | | | | | | |
Partnership share of growth capital | | $ | 1,800 | | $ | 2,300 | | $ | 2,312 | |
| | | | | | | | |
| | | | | | | | | | | |
| | | | | | | | | | | |
| | | | | | | | |
- (1)
- Growth capital includes expenditures made to expand the existing operating capacity, to increase the efficiency of our existing assets and to facilitate an increase in volumes within our operations. Growth capital also includes costs associated with new well connections. Growth capital excludes expenditures for third-party acquisitions and equity investments.
Our primary sources of liquidity to meet operating expenses, pay distributions to our unitholders and fund capital expenditures are cash flows generated by our operations, our Credit Facility and access to debt and equity markets, both public and private. We may also consider the use of alternative financing strategies such as entering into additional joint venture arrangements or selling non-strategic assets.
Management believes that expenditures for our capital projects can be funded with current cash balances, proceeds from equity or debt offerings, contributions from joint venture partners including proceeds from exercise of the options held by Summit, cash flows from operations and our current borrowing capacity under the Credit Facility. Our access to capital markets can be impacted by factors outside our control, which include but are not limited to general economic conditions and the rights of our Class B unitholders to participate in any future equity offerings; however, we believe that our strong cash flows and balance sheet, our Credit Facility and our credit rating will provide us with adequate access to the capital markets to fund our expected cash needs. (SeeExpansion of Utica Shale in Item 1 and Note 3 to the accompanying Notes to Consolidated Financial Statements included in Item 8 of this Form 10-K for discussion of the Summit Option.) Any new borrowing cost would be affected by market conditions and long-term debt ratings assigned by independent rating agencies. As of February 19, 2014, our credit ratings were Ba2 with a Stable outlook by Moody's Investors Service, BB with a Stable outlook by Standard & Poor's and BB with a Negative outlook by Fitch Ratings. Changes in our operating results, cash flows or financial position could impact the ratings assigned by the various rating agencies. Should our credit ratings be adjusted downward, we may incur higher costs to borrow, which could have a material impact on our financial condition and results of operations.
Our Credit Facility has the borrowing capacity of $1.2 billion and a maturity date of September 7, 2017, providing us with the financial flexibility to continue to execute our growth strategy. Our Credit Facility has a maximum permissible total leverage ratio of 5.5 to 1 through December 31, 2014 at which time the maximum permissible leverage ratio will revert to 5.25 to 1. See Note 16 of the accompanying Notes to Consolidated Financial Statements included in Item 8 of this Form 10-K for further details of our Credit Facility.
As of February 19, 2014, we had $198.0 million borrowings outstanding and $11.3 million of letters of credit outstanding under the Credit Facility, leaving approximately $990.7 million available for borrowing, of which approximately $504.9 million was available for borrowing based on financial
86
Table of Contents
covenant requirements. Additionally, the full amount of unused capacity is available for borrowing on a short-term basis to provide financial flexibility within a given fiscal quarter.
In January 2013, we completed a public offering for $1.0 billion in aggregate principal amount of 4.5% senior unsecured 2023B Senior Notes, which were issued at par. We received net proceeds of approximately $986.0 million. A portion of the proceeds, together with cash on hand, was used to repurchase $81.1 million aggregate principal amount of 8.75% senior notes due April 2018, approximately $175.0 million of the outstanding principal amount of our 6.5% senior notes due August 2021 and approximately $245.0 million of the outstanding principal amount of our 6.25% senior notes due June 2022, with the remainder used to fund our capital expenditure program in 2013 and for general partnership purposes.
As of December 31, 2013, we had five series of senior notes outstanding: $500.0 million in aggregate principal issued in November 2010 and due November 2020; $325.0 million in aggregate principal amount on the senior notes issued in February and March 2011 and due August 2021; $455.0 million aggregate principal amount on senior notes issued in October 2011 and due June 2022; $750.0 million aggregate principal amount on senior notes issued in August 2012 and due in February 2023; and $1.0 billion aggregate principal amount on senior notes issued in January 2013 and due in July 2023 (altogether the "Senior Notes"). As of December 31, 2013, there were no minimum payments on the Senior Notes due during the next five years. For further discussion of the Senior Notes and the accounting impacts, see Note 16 of the accompanying Notes to Consolidated Financial Statements included in Item 8 of this Form 10-K.
The Credit Facility and indentures governing our Senior Notes require us to meet certain financial covenants and limit certain activities of the Partnership and its restricted subsidiaries as described below. The Credit Facility and indentures place limits on the ability of the Partnership and its restricted subsidiaries to incur additional indebtedness; declare or pay dividends or distributions or redeem, repurchase or retire equity interests or subordinated indebtedness; make investments; incur liens; create any consensual limitation on the ability of the Partnership's restricted subsidiaries to pay dividends or distributions, make loans or transfer property to the Partnership; engage in transactions with the Partnership's affiliates; sell assets, including equity interests of the Partnership's subsidiaries; make any payment on or with respect to, or purchase, redeem, defease or otherwise acquire or retire for value any subordinated obligation or guarantor subordination obligation (except principal and interest at maturity); and consolidate, merge or transfer assets.
The Credit Facility limits our ability to enter into transactions with parties that require margin calls under certain derivative instruments. Under the Credit Facility, neither we nor the bank can require margin calls for outstanding derivative positions. As of February 19, 2014, all of our derivative positions are with members of the participating bank group and are not subject to margin deposit requirements. We believe this arrangement gives us additional liquidity as it allows us to enter into derivative instruments without utilizing cash for margin calls or requiring the use of letters of credit. We do not believe that the recent Dodd-Frank legislation will change our ability to enter into derivatives without utilizing cash for margin calls.
In November 2012, we entered into an equity distribution agreement with Citigroup Global Markets Inc. that established a $600.0 million At the Market offering program (the "November 2012 ATM") which allowed us from time to time, through Citigroup Global Markets Inc. (the "Manager"),
87
Table of Contents
as our sales agent, to offer and sell common units representing limited partner interests in the Partnership having an aggregate offering price of up to $600.0 million. Sales of such common units were made by means of ordinary brokers' transactions on the NYSE at market prices, in block transactions or as otherwise agreed upon by us and the Manager. We could also sell common units to the Manager as principal for its own account at a price to be agreed upon at the time of such sale. For any such sales, we would enter into a separate agreement with the Manager. In the year ended December 31, 2013, we sold an aggregate of 9.3 million common units under the November 2012 ATM, receiving net proceeds of approximately $584.3 million after deducting $9.5 million in manager fees and other third-party expenses. Common units sold in 2013 totaled 0.1 million raising $6.3 million. The proceeds from sales were used to fund capital expenditures and for general partnership purposes. We completed this $600.0 million program in July 2013.
In August 2013, we and M&R entered into an equity distribution agreement with the Manager that established a $400.0 million At-the-Market offering program (the "August 2013 ATM"). In addition, the Selling Unitholder was permitted sell from time to time through the Manager up to 1,452,415 common units. During the year ended December 31, 2013, the Partnership sold an aggregate of 5.9 million common units under the August 2013 ATM, receiving net proceeds of approximately $396.0 million after deducting approximately $4.0 million in manager fees and other third-party expenses. The proceeds from sales were used to fund capital expenditures and for general partnership purposes.
In September 2013, we and M&R entered into an equity distribution agreement with the Manager that established an At-the-Market offering program (the "September 2013 ATM") pursuant to which we may sell from time to time through the Manager as our sales agent, common units having an aggregate offering price of up to $1.0 billion. In addition, M&R may sell from time to time through the Manager up to 794,761 common units. During the year ended December 31, 2013, we sold an aggregate of 10.9 million common units under the September 2013 ATM, receiving net proceeds of approximately $717.8 million after deducting approximately $29.8 million in manager fees and other third-party expenses. The proceeds from sales were used to fund capital expenditures and for general partnership purposes. As of February 19, 2014, we have approximately $275.4 million available for issuance under the September 2013 ATM. In addition, we filed a registration statement with the SEC on February 18, 2014 in order to register up to $1.2 billion of additional common units which may be sold under a new ATM program. The registration statement will be effective pending review and approval by the SEC.
Approximately 4.0 million Class B units converted to common units on July 1, 2013. The remaining Class B units will convert to common units on a one-for-one basis in four equal installments beginning on July 1, 2014 and each of the next three anniversaries of such date. Class B units share in our income and losses and are not entitled to participate in any distributions of available cash prior to their conversion.
Pursuant to the Amended Utica LLC Agreement, EMG was obligated to fund the first $950.0 million of capital required by MarkWest Utica EMG and they completed this funding commitment in May 2013. We began funding MarkWest Utica EMG in July 2013 and have contributed approximately $566.5 million as of December 31, 2013. We are required to contribute 100% of the additional capital required by MarkWest Utica EMG until the aggregate contributions from us and EMG equal $2.0 billion. For further discussion of the funding requirements after $2.0 billion has been contributed to MarkWest Utica EMG, see Note 3 of the Notes to the Consolidated Financial Statements included in Item 8 of our Annual Report on Form 10-K. In December 2013, we and EMG
88
Table of Contents
formed MarkWest Utica EMG Condensate. EMG is obligated to provide all of the initial funding to MarkWest Utica EMG Condensate and is expected to provide 45% of the total capital required during 2014. See Note 3 of the Notes to the Consolidated Financial Statements included in Item 8 of our Annual Report on Form 10-K for further discussion of the funding obligations for MarkWest Utica EMG Condensate. We anticipate additional funding in 2014 from joint venture partners due to the anticipated exercise by Summit of its options to acquire up to a 40% interest in both Ohio Gathering and Ohio Condensate.
Our ability to pay distributions to our unitholders, to fund planned capital expenditures and to make acquisitions depends upon our future operating performance. That, in turn, may be affected by prevailing economic conditions in our industry, as well as financial, business and other factors, some of which are beyond our control.
Due to our significant growth strategy and the length of the construction period for our assets, we spend a significant amount of capital prior to the realization of the revenues from our expansion projects. Many factors could impact our ability to generate the expected revenues and the timing of those revenues from our expansion projects including:
- •
- unexpected changes in the production from our producer customers' wells or changes in our producer customers' drilling schedules;
- •
- unexpected outages or downtime at our facilities or at upstream or downstream third party facilities;
- •
- market and capacity constraints affecting downstream natural gas and NGL facilities, including limited gas and NGL capacity downstream of our facilities, limited railcar and NGL pipeline facilities and reduced demand or limited markets for certain NGL products, which could reduce the volumes of gas and NGLs that we receive and adversely affect the pricing received for NGLs; and
- •
- restrictions on the ability of our joint ventures to distribute cash to the Partnership.
If we are unable to generate the expected revenues from our expansion projects, our liquidity would be adversely impacted, which may also impact our ability to meet our financial and other covenants under our Credit Facility and indentures governing our senior notes.
The following table summarizes cash inflows (outflows) (in thousands).
| | | | | | | | | | |
| | Year ended December 31, | |
| |
|---|
| | 2013 | | 2012 | | Change | |
|---|
Net cash provided by operating activities | | $ | 435,650 | | $ | 492,013 | | $ | (56,363 | ) |
Net cash used in investing activities | | | (3,062,562 | ) | | (2,472,088 | ) | | (590,474 | ) |
Net cash provided by financing activities | | | 2,366,461 | | | 2,211,499 | | | 154,962 | |
89
Table of Contents
Net cash provided by operating activities decreased primarily due to an approximately $97.5 million difference in the change in working capital, primarily as a result of a $117.9 million decrease related to the timing of collections of receivables compared to 2012; $33.3 million due to an increase in inventories in 2013 compared to 2012, and the timing of inventory sales which was partially offset by approximately $39.7 million increase in accounts payable and accrued liabilities related to the timing of payments of invoices compared to 2012. The decrease related to working capital adjustments was partially offset by a $62.7 million increase in segment income and improvement in realized settlement of derivative positions of $22.8 million offset by an increase in selling, general and administrative expense of $8.1 million and interest expense of $28.8 million.
Net cash used in investing activities increased due to an $1.1 billion increase in capital expenditures, primarily related to our expansion of our Marcellus and Utica segments as discussed in ourSegment Reporting section above, offset by proceeds from disposal of property plant and equipment of $208.7 million, net of cash paid for third party transaction fees, primarily from our Sherwood Asset Sale and a decrease in business acquisition purchases of $283.9 million compared to the same period in 2012.
Net cash provided by financing activities increased primarily due to a $420.4 million increase in contributions from non-controlling interest holders and a $122.5 million increase in distributions to common unitholders and an increase of $64.0 million in proceeds from public equity offerings, partially offset by a $208.6 million decrease in net borrowings.
Total Contractual Cash Obligations
A summary of our total contractual cash obligations as of December 31, 2013, is as follows (in thousands):
| | | | | | | | | | | | | | | | |
| | Payment Due by Period | |
|---|
Type of obligation | | Total
Obligation | | Due in
2014 | | Due in
2015 - 2016 | | Due in
2017 - 2018 | | Thereafter | |
|---|
Long-term debt | | $ | 3,030,000 | | $ | — | | $ | — | | $ | — | | $ | 3,030,000 | |
Interest payments on long-term debt(1) | | | 1,466,344 | | | 169,563 | | | 339,125 | | | 339,125 | | | 618,531 | |
Operating leases and long-term storage agreement(2) | | | 141,206 | | | 20,557 | | | 32,158 | | | 25,939 | | | 62,552 | |
Purchase obligations(3) | | | 681,783 | | | 681,783 | | | — | | | — | | | — | |
Natural gas purchase obligations(4) | | | 232,288 | | | 23,747 | | | 53,073 | | | 51,510 | | | 103,958 | |
SMR Liability(5) | | | 282,265 | | | 17,412 | | | 34,824 | | | 34,824 | | | 195,205 | |
Other long-term liabilities reflected on the Consolidated Balance Sheets: | | | | | | | | | | | | | | | | |
Asset retirement obligation(6) | | | 9,996 | | | — | | | — | | | — | | | 9,996 | |
| | | | | | | | | | | | |
| | | | | | | | | | | | | | | | | |
Total contractual cash obligations | | $ | 5,843,882 | | $ | 913,062 | | $ | 459,180 | | $ | 451,398 | | $ | 4,020,242 | |
| | | | | | | | | | | | |
| | | | | | | | | | | | | | | | | |
| | | | | | | | | | | | | | | | | |
| | | | | | | | | | | | |
- (1)
- Assumes that our outstanding borrowing at December 31, 2013 remain outstanding until their respective maturity dates.
- (2)
- Amounts relate primarily to a long-term propane storage agreement and our office and vehicle leases.
- (3)
- Represents purchase orders and contracts related to purchase or build out of property, plant and equipment. Purchase obligations exclude current and long-term unrealized losses on derivative instruments included on the accompanying Consolidated Balance Sheets, which represent the current fair value of various derivative contracts and do not represent future cash purchase obligations. These contracts are generally settled financially at the difference between the future
90
Table of Contents
market price and the contractual price and may result in cash payments or cash receipts in the future, but generally do not require delivery of physical quantities of the underlying commodity.
- (4)
- Natural gas purchase obligations consist primarily of a purchase agreement with a producer in the Northeast segment. The contract provides for the purchase of keep-whole volumes at a specific price and is a component of a broader regional arrangement. The contract price is designed to share a portion of the frac spread with the producer and as a result, the amounts reflected for the obligation exceed the cost of purchasing the keep-whole volumes at a market price. The contract is considered an embedded derivative (see Note 7 of the accompanying Notes to Consolidated Financial Statements included in Item 8 of this Form 10-K for the fair value of the frac spread sharing component). We use the estimated future frac spreads as of December 31, 2013 for calculating this obligation.
- (5)
- Represents amounts due under a product supply agreement (see Note 18 of the accompanying Notes to Consolidated Financial Statements included in Item 8 of this Form 10-K for further discussion of the product supply agreement).
- (6)
- Excludes estimated accretion expense of $18.4 million. The total amount to be paid is approximately $28.4 million.
Off-Balance Sheet Arrangements
We do not engage in off-balance sheet financing activities.
Effects of Inflation
Inflation did not have a material impact on our results of operations for the years ended December 31, 2013, 2012 or 2011. Although the impact of inflation has been insignificant in recent years, it is still a factor in the United States economy and may increase the cost to acquire, build or replace property, plant and equipment. It may also increase the costs of labor and supplies. To the extent permitted by competition, regulation and our existing agreements, we have and expect to continue to pass along all or a portion of increased costs to our customers in the form of higher fees.
Critical Accounting Policies and Estimates
The preparation of financial statements in conformity with GAAP requires management to make estimates and assumptions that affect the reported amounts of assets and liabilities, disclosure of contingent assets and liabilities at the date of the financial statements and the reported amounts of revenues and expenses during the reporting period. Actual results could differ from those estimates.
The policies and estimates discussed below are considered by management to be critical to an understanding of our financial statements, because their application requires the most significant judgments from management in estimating matters for financial reporting that are inherently uncertain. See Note 2 of the accompanying Notes to the Consolidated Financial Statements included in Item 8 of this Form 10-K for additional information on these policies and estimates, as well as a discussion of additional accounting policies and estimates.
91
Table of Contents
| | | | |
Description | | Judgments and Uncertainties | | Effect if Actual Results Differ from
Estimates and Assumptions |
|---|
| Intangible Assets | | | | |
Intangible assets are comprised of customer contracts and relationships acquired in business combinations, recorded under the acquisition method of accounting at their estimated fair values at the date of acquisition. Using relevant information and assumptions, management determines the fair value of acquired identifiable intangible assets. |
|
The fair value of customer contracts is generally calculated using an income approach based on discounted future cash flows. The key assumptions include contract renewals, historical volumes, current and future capacity of the gathering system or processing plants, pricing volatility and the discount rate.
Amortization of intangibles with definite lives is calculated using the straight-line method over the estimated useful life of the intangible asset. We consider alternative methods of amortization when the intangibles assets are initially recorded, however we have previously determined that alternative amortization methods do not create material differences in amortization expense each year and, therefore, concluded straight-line methodology to be appropriate. The estimated economic life is determined by assessing the life of the assets to which the contracts and relationships relate, likelihood of renewals, the projected reserves, competitive factors, regulatory or legal provisions and maintenance and renewal costs. |
|
If the actual results differ significantly from the assumptions used to determine the fair value and economic lives of intangible assets, the carrying value of the intangible asset may be over/understated resulting in an over/understatement of amortization expense as the over/understatement of the intangible assets would create an under/overstatement of other assets (i.e. goodwill). |
92
Table of Contents
| | | | |
Description | | Judgments and Uncertainties | | Effect if Actual Results Differ from
Estimates and Assumptions |
|---|
| Impairment of Long-Lived Assets | | | | |
Management evaluates our long-lived assets, including intangibles, for impairment when certain events have taken place that indicate that the carrying value may not be recoverable from the expected undiscounted future cash flows. Qualitative and quantitative information is reviewed in order to determine if a triggering event has occurred or an impairment indicator exists. If we determine that a triggering event has occurred we would complete a full impairment analysis. If we determine that the carrying value of an asset group is not recoverable, a loss is recorded for the difference between the fair value and the carrying value. We evaluate our property, plant and equipment and intangibles on at least a segment level and at lower levels where cash flows for specific assets can be identified. |
|
Management considers the volume of reserves dedicated to be processed by the asset and future NGL product and natural gas prices to estimate cash flows for each asset group. The amount of additional reserves developed by future drilling activity depends, in part, on expected commodity prices. Projections of reserves, drilling activity, ability to renew contracts of significant customers, and future commodity prices are inherently subjective and contingent upon a number of variable factors, many of which are difficult to forecast. |
|
As of December 31, 2013, there were no indicators of impairment for any of our material asset groups.
A significant variance in any of the assumptions or factors used to estimate future cash flows could result in the impairment of an asset. For certain asset groups that comprise less than 1% of total long-lived assets, a decrease in the estimated future cash flows used in our impairment analysis of 10% would indicate that the net book value of the asset groups may not be fully recoverable and further evaluation would be required to estimate a potential impairment. |
93
Table of Contents
| | | | |
Description | | Judgments and Uncertainties | | Effect if Actual Results Differ from
Estimates and Assumptions |
|---|
| Impairment of Goodwill | | | | |
Goodwill is the cost of an acquisition less the fair value of the net identifiable assets of the acquired business. We evaluate goodwill for impairment annually as of November 30 and whenever events or changes in circumstances indicate it is more likely than not that the fair value of a reporting unit is less than its carrying amount. The first step of the evaluation is a qualitative analysis to determine if it is "more likely than not" that the carrying value of a reporting unit with goodwill exceeds its fair value. The additional quantitative steps in the goodwill impairment test may be performed if we determine that it is more likely than not that the carrying value is greater than the fair value. |
|
Management performed a quantitative analysis and determined the fair value of our reporting units using the income and market approaches for our 2013 impairment analysis. These approaches are also used when allocating the purchase price to acquired assets and liabilities. These types of analyses require us to make assumptions and estimates regarding industry and economic factors such as relevant commodity prices, contract renewals, and production volumes. It is our policy to conduct impairment testing based on our current business strategy in light of present industry and economic conditions, as well as future expectations.
For the current year qualitative analysis, we analyzed the changes in the assumptions above in light of current economic conditions to determine if it was more likely than not that impairment exists. We looked at factors, including changes in the forecasted operating income and volumes for the three reporting units with goodwill, changes in the commodity price environment, changes in our per unit market value, changes in the our peers' market value and changes in industry EBITDA multiples.
Management is also required to make certain assumptions when identifying the reporting units and determining the amount of goodwill allocated to each reporting unit. The method of allocating goodwill resulting from the acquisitions involved estimating the fair value of the reporting units and allocating the purchase price for each acquisition to each reporting unit. Goodwill is then calculated for each reporting unit as the excess of the allocated purchase price over the estimated fair value of the net assets.
|
|
As a result of the goodwill impairment testing completed in 2013, we recorded no impairment expense. The fair value of our reporting units with goodwill would have to decline by more than 15% - 70% for there to be a potential indicator of impairment. |
94
Table of Contents
| | | | |
Description | | Judgments and Uncertainties | | Effect if Actual Results Differ from
Estimates and Assumptions |
|---|
| Impairment of Equity Investments | | | | |
We evaluate our equity method investments in Centrahoma, MarkWest Pioneer and MarkWest Utica EMG Condensate, including its subsidiary Ohio Condensate, for impairment whenever events or changes in circumstances indicate, in management's judgment, that the carrying value of such investment may have experienced a decline in value. When evidence of an other-than-temporary loss in value has occurred, we compare the estimated fair value of the investment to the carrying value of the investment to determine whether an impairment has occurred.
|
|
Our impairment assessment requires us to apply judgment in estimating future cash flows received from or attributable to our equity method investments. The primary estimates may include the expected volumes, the terms of related customer agreements and future commodity prices. We determined that there were no material events or changes in circumstances that would indicate an other-than-temporary loss in value has occurred for Centrahoma, MarkWest Pioneer or MarkWest Utica EMG Condensate.
|
|
Based on the current forecasts, our ownership in Centrahoma, MarkWest Pioneer and MarkWest Utica EMG Condensate will generate cash flows with a present value in excess of the current carrying value of the respective investments. Management determined that there were no material events or changes in circumstances that would indicate an other-than-temporary decline in value of our investment in Centrahoma, MarkWest Pioneer or MarkWest Utica EMG Condensate. |
Accounting for Risk Management Activities and Derivative Financial Instruments |
|
|
|
|
Our derivative financial instruments are recorded at fair value in the accompanying Consolidated Balance Sheets. Changes in fair value and settlements are reflected in our earnings in the accompanying Consolidated Statements of Operations as gains and losses related to revenue, purchased product costs, facility expenses and/or miscellaneous income.
|
|
When available, quoted market prices or prices obtained through external sources are used to determine a financial instrument's fair value. The valuation of Level 2 financial instruments is based on quoted market prices for similar assets and liabilities in active markets and other inputs that are observable. However, for other financial instruments for which quoted market prices are not available, the fair value is based on inputs that are largely unobservable such as option volatilities and NGL prices that are interpolated and extrapolated due to inactive markets. These instruments are classified as Level 3 under the fair value hierarchy. All fair value measurements are appropriately adjusted for nonperformance risk.
|
|
If the assumptions used in the pricing models for our Level 2 and 3 financial instruments are inaccurate or if we had used an alternative valuation methodology, the estimated fair value may have been different and we may be exposed to unrealized losses or gains that could be material. A 10% difference in our estimated fair value of Level 2 and 3 derivatives at December 31, 2013 would have affected net income before provision for income tax by approximately $6.9 million for the year ended December 31, 2013. |
95
Table of Contents
| | | | |
Description | | Judgments and Uncertainties | | Effect if Actual Results Differ from
Estimates and Assumptions |
|---|
| Accounting for Significant Embedded Derivative Instruments | | | | |
Identifying, valuing and determining the inception date of embedded derivatives is complex and requires significant judgment. We have a Gas Purchase Agreement with a producer customer in which we are required to purchase natural gas based on a complex formula designed to share some of the frac spread with the producer, through December 31, 2022. This contract has been identified as an embedded derivative ("Natural Gas Embedded Derivative") and requires a complex valuation based on significant judgment.
The agreement has a primary term that expires on December 31, 2022 and contains two successive term-extending options under which the producer can extend the purchase agreement an additional five years. Such options are part of the embedded feature and thus are required to be considered in the valuation of the embedded derivative. We are required to make a significant judgment about the probability that the options would be exercised when determining the value of the extension options. |
|
We carry the Natural Gas Embedded Derivative at fair value with changes in fair value recognized in income each period. The valuation requires significant judgment when forming the assumptions used. Third-party forward curves for certain commodity prices utilized in the valuation do not extend through the term of the arrangement. Thus, pricing is required to be extrapolated for those periods. We utilize multiple cash flow techniques to extrapolate NGL pricing. Due to the illiquidity of future markets, we do not believe one method is more indicative of fair value than the other methods. The fair value is also appropriately adjusted for nonperformance risk each period.
We evaluated various factors in order to determine the probability that the term-extending options would be exercised by the producer customer such as estimates of future gas reserves in the region, the competitive environment in which the contract operates, the commodity price environment and the producer's business strategy. We have asserted that the probability that the producer will exercise their option to extend the agreement is 0% as of December 31, 2013 based on the high degree of uncertainty. |
|
The Natural Gas Embedded Derivative is an instrument that is not exchange-traded. The valuation of the instrument is complex and requires significant judgment. The inputs used in the valuation model require specialized knowledge, as NGL price curves do not exist for the entire term of the arrangement.
The valuation is sensitive to NGL and natural gas future price curves. Holding the natural gas curves constant, a 10% increase (decrease) in NGL price curves causes a 39% increase (decrease) in the liability as of December 31, 2013. Holding the NGL curves constant, a 10% increase (decrease) in the natural gas curves causes a 13% (decrease) increase in the liability as of December 31, 2013.
The determination of the fair value of the option to extend is based on our judgment about the probability of the producer exercising the extension. If it were determined that the probability of exercise was not 0% as of December 31, 2013, the liability would be understated. |
96
Table of Contents
| | | | |
Description | | Judgments and Uncertainties | | Effect if Actual Results Differ from
Estimates and Assumptions |
|---|
| Variable Interest Entities | | | | |
We evaluate all legal entities in which we hold an ownership or other pecuniary interest to determine if the entity is a VIE.
Our interests in a VIE are referred to as variable interests. Variable interests can be contractual, ownership or other pecuniary interests in an entity that change with changes in the fair value of the VIE's assets.
When we conclude that we hold an interest in a VIE we must determine if we are the entity's primary beneficiary. A primary beneficiary is deemed to have a controlling financial interest in a VIE. This controlling financial interest is evidenced by both (a) the power to direct the activities of the VIE that most significantly impact the VIE's economic performance and (b) the obligation to absorb losses that could potentially be significant to the VIE or the right to receive benefits that could potentially be significant to the VIE.
We consolidate any VIE when we determine that we are the primary beneficiary. We must disclose the nature of any interests in a VIE that is not consolidated. |
|
Significant judgment is exercised in determining that a legal entity is a VIE and in evaluating our interest in a VIE.
We use primarily qualitative analysis to determine if an entity is a VIE. We evaluate the entity's need for continuing financial support; the equity holder's lack of a controlling financial interest; and/or if an equity holder's voting interests are disproportionate to its obligation to absorb expected losses or receive residual returns.
We evaluate our interests in a VIE to determine whether we are the primary beneficiary. We use primarily qualitative analysis to determine if we are deemed to have a controlling financial interest in the VIE.
We continually monitor our interests in legal entities for changes in the design or activities of an entity and changes in our interests, including our status as the primary beneficiary to determine if the changes require us to revise our previous conclusions. |
|
MarkWest Utica EMG, along with its subsidiary Ohio Gathering, is a VIE and we are considered to be the primary beneficiary. MarkWest Utica EMG Condensate, along with its subsidiary Ohio Condensate, is also a VIE, however, we are not considered to be the primary beneficiary. As a result, MarkWest Utica EMG Condensate, including its subsidiary Ohio Condensate, is accounted for under the equity method. Changes in the design or nature of the activities of any of these entities, or our involvement with an entity, may require us to reconsider our conclusions on the entity's status as a VIE and/or our status as the primary beneficiary. Such reconsideration requires significant judgment and understanding of the organization. This could result in the deconsolidation of the affected subsidiary. The deconsolidation of a subsidiary would have a significant impact on our financial statements.
We account for our ownership interest in Centrahoma and MarkWest Pioneer under the equity method and have determined that these entities are not VIEs. However, changes in the design or nature of the activities of the entity may require us to reconsider our conclusions. Such reconsideration would require the identification of the variable interests in the entity and a determination on which party is the entity's primary beneficiary. If an equity investment were considered a VIE and we were determined to be the primary beneficiary, the change could cause us to consolidate the entity. The consolidation of an entity that is currently accounted for under the equity method could have a significant impact on our financial statements. |
97
Table of Contents
| | | | |
Description | | Judgments and Uncertainties | | Effect if Actual Results Differ from
Estimates and Assumptions |
|---|
| Acquisitions—Purchase Price Allocation | | | | |
We allocate the purchase price of an acquired business to its identifiable assets and liabilities based on estimated fair values. The excess of the purchase price over the amount allocated to the assets and liabilities is recorded as goodwill.
For significant acquisitions, we engage outside appraisal firms to assist in the fair value determination of identifiable intangible assets such as customer relationships, trade names and any other significant assets or liabilities. We adjust the preliminary purchase price allocation, as necessary, after the acquisition closing date through the end of the measurement period of up to one year as we finalize valuations for the assets acquired and liabilities assumed. |
|
Purchase price allocation methodology requires management to make assumptions and apply judgment to estimate the fair value of acquired assets and liabilities. Management estimates the fair value of assets and liabilities primarily using a market approach, income approach or cost approach, as appropriate. Key inputs into the fair value determinations include estimates and assumptions related to future volumes, commodity prices, operating costs, replacement costs and construction costs, as well as an estimate of the expected term and profits of the related customer contract or contracts. |
|
If estimates or assumptions used to complete the purchase price allocation and estimate the fair value of acquired assets and liabilities significantly differed from assumptions made, the allocation of purchase price between goodwill, intangibles and property plant and equipment could significantly differ. Such a difference would impact future earnings through depreciation and amortization expense. In addition, if forecasts supporting the valuation of the intangibles or goodwill are not achieved, impairments could arise. |
Income Taxes |
|
|
|
|
Under the asset and liability method of income tax accounting, deferred tax assets and liabilities are determined based on differences between the financial reporting and the tax basis of assets and liabilities and are measured using the tax rates and laws that are expected to apply to taxable income in the years in which those temporary differences are expected to be recovered or settled.
A deferred tax asset must be reduced by a valuation allowance if it is more likely than not that some portion or all of the deferred tax asset will not be realized prior to expiration. |
|
The Corporation has deferred tax assets related to NOL carryforwards. Management's assessment of our ability to utilize the NOL carryforwards depends upon our estimates of future taxable income. There are many risks and other factors that could cause our actual future taxable income to be significantly different that our estimates. These factors include but are not limited to, changes in production volumes of natural gas by our producer customers, our ability to retain customers, changes in laws or regulations impacting our operations, changes in commodity prices, etc. |
|
As of December 31, 2013, the Corporation had NOL carryforwards for federal and state income tax purposes of approximately $26.5 million and $1.5 million, respectively. We believe that we will be able to fully utilize these NOL carryforwards and therefore have not recorded a valuation allowance. If for any reason our future taxable income is less than we have estimated, we may not realize the full benefit of these NOL carryforwards. |
Recent Accounting Pronouncements
From time to time, new accounting pronouncements are issued by FASB that we adopt as of the specified effective date. If not discussed in Note 2—Recent Accounting Pronouncements of the accompanying Notes to Consolidated Financial Statements included in Item 8 of this Form 10-K,
98
Table of Contents
management believes that the impact of recently issued standards, which are not yet effective, will not have a material impact on our financial statements upon adoption.
ITEM 7A. Quantitative and Qualitative Disclosures About Market Risk
Market risk includes the risk of loss arising from adverse changes in market rates and prices. We face market risk from commodity price changes and, to a lesser extent, interest rate changes and nonperformance by our customers and counterparties.
NGL and natural gas prices are volatile and are impacted by changes in fundamental supply and demand, as well as market uncertainty, availability of NGL transportation and fractionation capacity and a variety of additional factors that are beyond the Partnership's control. Our profitability is directly affected by prevailing commodity prices primarily as a result of processing or conditioning at our own or third-party processing plants, purchasing and selling or gathering and transporting volumes of natural gas at index-related prices and the cost of third-party transportation and fractionation services. To the extent that commodity prices influence the level of natural gas drilling by our producer customers, such prices also affect profitability. To protect us financially against adverse price movements and to maintain more stable and predictable cash flows so that we can meet our cash distribution objectives, debt service and capital plans, we execute a strategy governed by the risk management policy approved by our Board. We have a committee comprised of senior management that oversees risk management activities, continually monitors the risk management program and adjusts our strategy as conditions warrant. We enter into certain derivative contracts to reduce the risks associated with unfavorable changes in the prices of natural gas, NGLs and crude oil. Derivative contracts utilized are swaps and options traded on the OTC market and fixed price forward contracts. The risk management policy does not allow us to take speculative positions with our derivative contracts.
To mitigate our cash flow exposure to fluctuations in the price of NGLs, we have entered into derivative financial instruments relating to the future price of NGLs and crude oil. We currently manage the majority of our NGL price risk using direct product NGL derivative contracts. We enter into NGL derivative contracts when adequate market liquidity exists and future prices are satisfactory. A portion of our NGL price exposure is managed by using crude oil contracts. During 2012 and continuing into 2013, the correlation between the price of crude oil and NGLs deteriorated and as a result, the crude oil contracts became less effective in offsetting the impact of NGL price fluctuations. In periods where NGL prices and crude oil prices are not consistent with the historical relationship, the crude oil contracts create increased risk and additional gains or losses. We may settle our crude oil contracts prior to the contractual settlement date in order to take advantage of favorable terms and reduce the future exposure resulting from the less effective crude oil contracts. Based on our current volume forecasts, over 85% of our derivative positions used to manage our future commodity price exposure are direct product NGL derivative contracts.
To mitigate our cash flow exposure to fluctuations in the price of natural gas, we primarily utilize derivative financial instruments relating to the future price of natural gas and take into account the partial offset of our long and short natural gas positions resulting from normal operating activities.
As a result of our current derivative positions, we believe that we have mitigated a portion of our expected commodity price risk through the fourth quarter of 2015. We would be exposed to additional commodity risk in certain situations such as if producers under-deliver or over-deliver products or if processing facilities are operated in different recovery modes. In the event that we have derivative positions in excess of the product delivered or expected to be delivered, the excess derivative positions may be terminated.
99
Table of Contents
Currently, all of our financial derivative positions are with financial institutions that are participating members of the Credit Facility ("participating bank group members"). Management conducts a standard credit review on counterparties to derivative contracts. There are no collateral requirements for derivative contracts among us and any participating bank group members. Specifically, we are not required to post collateral when we enter into derivative contracts with participating bank group members as the participating bank group members have a collateral position in substantially all our of wholly-owned assets other than MarkWest Liberty Midstream and its subsidiaries. A separate agreement with certain participating bank group members allows MarkWest Liberty Midstream to enter into derivative positions without posting cash collateral. We use standardized agreements that allow for offset of certain positive and negative exposures ("master netting arrangements") in the event of default or other terminating events, including bankruptcy.
The following tables provide information on the volume of our derivative activity for positions related to long liquids and keep-whole price risk at December 31, 2013, including the weighted-average prices ("WAVG"):
| | | | | | | | | | | | | |
WTI Crude Collars | | Volumes
(Bbl/d) | | WAVG Floor
(Per Bbl) | | WAVG Cap
(Per Bbl) | | Fair Value
(in thousands) | |
|---|
2014 | | | 1,418 | | $ | 90.36 | | $ | 108.73 | | $ | 1,096 | |
| | | | | | | | | | |
WTI Crude Swaps | | Volumes
(Bbl/d) | | WAVG Price
(Per Bbl) | | Fair Value
(in thousands) | |
|---|
2014 | | | 697 | | $ | 92.39 | | $ | (748 | ) |
2015 | | | 1,000 | | | 89.49 | | | 505 | |
| | | | | | | | | | |
Propane Swaps | | Volumes
(Gal/d) | | WAVG Price
(Per Gal) | | Fair Value
(in thousands) | |
|---|
2014 | | | 114,942 | | $ | 0.92 | | $ | (7,923 | ) |
| | | | | | | | | | |
IsoButane Swaps | | Volumes
(Gal/d) | | WAVG Price
(Per Gal) | | Fair Value
(in thousands) | |
|---|
2014 | | | 17,001 | | $ | 1.45 | | $ | 642 | |
| | | | | | | | | | |
Normal Butane Swaps | | Volumes
(Gal/d) | | WAVG Price
(Per Gal) | | Fair Value
(in thousands) | |
|---|
2014 | | | 45,484 | | $ | 1.37 | | $ | 1,169 | |
| | | | | | | | | | |
Natural Gasoline Swaps | | Volumes
(Gal/d) | | WAVG Price
(Per Gal) | | Fair Value
(in thousands) | |
|---|
2014 (Jan - Mar) | | | 7,249 | | $ | 1.91 | | $ | (133 | ) |
100
Table of Contents
The following tables provide information on the volume of our taxable subsidiary's commodity derivative activity for positions related to keep-whole price risk at December 31, 2013, including the WAVG:
| | | | | | | | | | |
WTI Crude Swaps | | Volumes
(Bbl/d) | | WAVG Price
(Per Bbl) | | Fair Value
(in thousands) | |
|---|
2014 | | | 154 | | $ | 90.05 | | $ | (310 | ) |
| | | | | | | | | | |
Natural Gas Swaps | | Volumes
(MMBtu/d) | | WAVG Price
(Per MMBtu) | | Fair Value
(in thousands) | |
|---|
2014 | | | 8,733 | | $ | 4.93 | | $ | (3,110 | ) |
| | | | | | | | | | |
Propane Swaps | | Volumes
(Gal/d) | | WAVG Price
(Per Gal) | | Fair Value
(in thousands) | |
|---|
2014 | | | 74,189 | | $ | 1.10 | | $ | (920 | ) |
| | | | | | | | | | |
IsoButane Swaps | | Volumes
(Gal/d) | | WAVG Price
(Per Gal) | | Fair Value
(in thousands) | |
|---|
2014 | | | 7,516 | | $ | 1.45 | | $ | 304 | |
| | | | | | | | | | |
Normal Butane Swaps | | Volumes
(Gal/d) | | WAVG Price
(Per Gal) | | Fair Value
(in thousands) | |
|---|
2014 | | | 20,411 | | $ | 1.39 | | $ | 689 | |
| | | | | | | | | | |
Natural Gasoline Swaps | | Volumes
(Gal/d) | | WAVG Price
(Per Gal) | | Fair Value
(in thousands) | |
|---|
2014 | | | 7,106 | | $ | 2.32 | | $ | 667 | |
| | | | | | | | | | |
Propane Fixed Physical | | Volumes
(Gal/d) | | WAVG Price
(Per Gal) | | Fair Value
(in thousands) | |
|---|
2014 (Jan - Mar) | | | 8,222 | | $ | 1.10 | | $ | (92 | ) |
The following table provides information on the volume of MarkWest Liberty Midstream's commodity derivative activity positions related to long liquids price risk at December 31, 2013, including the WAVG:
| | | | | | | | | | |
WTI Crude Swaps | | Volumes
(Bbl/d) | | WAVG Price
(Per Bbl) | | Fair Value
(in thousands) | |
|---|
2014 | | | 358 | | $ | 91.85 | | $ | (484 | ) |
| | | | | | | | | | |
Propane Swaps | | Volumes
(Gal/d) | | WAVG Price
(Per Gal) | | Fair Value
(in thousands) | |
|---|
2014 | | | 29,946 | | $ | 1.00 | | $ | (1,750 | ) |
| | | | | | | | | | |
IsoButane Swaps | | Volumes
(Gal/d) | | WAVG Price
(Per Gal) | | Fair Value
(in thousands) | |
|---|
2014 | | | 4,447 | | $ | 1.56 | | $ | 357 | |
| | | | | | | | | | |
Normal Butane Swaps | | Volumes
(Gal/d) | | WAVG Price
(Per Gal) | | Fair Value
(in thousands) | |
|---|
2014 | | | 10,498 | | $ | 1.45 | | $ | 609 | |
| | | | | | | | | | |
Natural Gasoline Swaps | | Volumes
(Gal/d) | | WAVG Price
(Per Gal) | | Fair Value
(in thousands) | |
|---|
2014 | | | 8,400 | | $ | 2.00 | | $ | (175 | ) |
101
Table of Contents
The following table provides information on the derivative positions related to long liquids and keep-whole price risk that we have entered into subsequent to December 31, 2013, including the WAVG:
| | | | | | | |
Propane Swaps | | Volumes
(Gal/d) | | WAVG Price
(Per Gal) | |
|---|
2014 (Apr - Dec) | | | 6,169 | | $ | 1.14 | |
The following tables provide information on the derivative positions of MarkWest Liberty Midstream related to long liquids price risk that we have entered into subsequent to December 31, 2013, including the WAVG:
| | | | | | | |
Propane Swaps | | Volumes
(Gal/d) | | WAVG Price
(Per Gal) | |
|---|
2014 (Apr - Dec) | | | 39,316 | | $ | 1.14 | |
| | | | | | | |
IsoButane Swaps | | Volumes
(Gal/d) | | WAVG Price
(Per Gal) | |
|---|
2014 (Apr - Dec) | | | 3,679 | | $ | 1.36 | |
| | | | | | | |
Normal Butane Swaps | | Volumes
(Gal/d) | | WAVG Price
(Per Gal) | |
|---|
2014 (Apr - Dec) | | | 9,148 | | $ | 1.28 | |
We have a commodity contract with a producer in the Appalachia region that creates a floor on the frac spread for gas purchases of 9,000 Dth/d. The commodity contract is a component of a broader regional arrangement that also includes a keep-whole processing agreement. This contract is accounted for as an embedded derivative and is recorded at fair value. The changes in fair value of this commodity contract are based on the difference between the contractual and index pricing and are recorded in earnings throughDerivative loss related to purchased product costs. In February 2011, we executed agreements with the producer to extend the commodity contract and the related processing agreement from March 31, 2015 to December 31, 2022. The recorded liability excludes the inception fair value of the commodity contract related to the extended period from April 1, 2015 to December 31, 2022. In accordance with GAAP for non-option embedded derivatives, the fair value of this extended portion of the commodity contract at its inception of February 1, 2011 is deemed to be allocable to the host processing contract and, therefore, not recorded as a derivative liability. See the following table for a reconciliation of the liability recorded for the embedded derivative as of December 31, 2013 (in thousands):
| | | | |
Fair value of commodity contract | | $ | 91,815 | |
Inception value for period from April 1, 2015 to December 31, 2022 | | | (53,507 | ) |
| | | | |
| | | | | |
Derivative liability as of December 31, 2013 | | $ | 38,308 | |
| | | | |
| | | | | |
| | | | | |
| | | | |
We have a commodity contract that gives us an option to fix a component of the utilities cost to an index price on electricity at one of our plant locations through the fourth quarter of 2014. The changes in the fair value of the derivative component of this contract are recognized asDerivative (gain) loss related to facility expenses. As of December 31, 2013, the estimated fair value of this contract was an asset of $3.3 million.
Our primary interest rate risk exposure results from our Credit Facility which has a borrowing capacity of $1.2 billion. The applicable interest rate for our Credit Facility was 4.75% at December 31,
102
Table of Contents
2013. As of February 19, 2014, we have $198.0 million borrowings outstanding on our Credit Facility. The debt related to this agreement bears interest at variable rates that are tied to either the U.S. prime rate or LIBOR at the time of borrowing.
We may make use of interest rate swap agreements in the future to adjust the ratio of fixed and floating rates in our debt portfolio, however we had no interest rate swaps outstanding as of December 31, 2013. Our debt portfolio as of December 31, 2013 is shown in the following table.
| | | | | | | | | | | |
Long-Term Debt | | Interest Rate | | Lending Limit | | Due Date | | Outstanding at
December 31, 2013 | |
|---|
Credit Facility | | Variable | | $ | 1.2 billion | | September 2017 | | $ | — | |
2020 Senior Notes | | Fixed | | $ | 500.0 million | | November 2020 | | $ | 500.0 million | |
2021 Senior Notes | | Fixed | | $ | 325.0 million | | August 2021 | | $ | 325.0 million | |
2022 Senior Notes | | Fixed | | $ | 455.0 million | | June 2022 | | $ | 455.0 million | |
2023A Senior Notes | | Fixed | | $ | 750.0 million | | February 2023 | | $ | 750.0 million | |
2023B Senior Notes | | Fixed | | $ | 1.0 billion | | July 2023 | | $ | 1.0 billion | |
Based on our overall interest rate exposure at December 31, 2013, a hypothetical increase or decrease of one percentage point in interest rates applied to borrowings under our Credit Facility would not change pre-tax earnings. Based on our overall interest rate exposure at February 19, 2014, a hypothetical increase or decrease of one percentage point in interest rates applied to borrowings under our Credit Facility would change pre-tax earnings by approximately $2.0 million over a twelve-month period.
We are subject to risk of loss resulting from nonpayment by our customers to whom we provide midstream services or sell natural gas or NGLs. Our credit exposure related to these customers is represented by the value of our trade receivables. Where exposed to credit risk, we analyze the customer's financial condition prior to entering into a transaction or agreement, establish credit terms and monitor the appropriateness of these terms on an ongoing basis. In the event of a customer default, we may sustain a loss and our cash receipts could be negatively impacted.
We are subject to risk of loss resulting from nonpayment or nonperformance by the counterparties to our derivative contracts. Our credit exposure related to commodity derivative instruments is represented by the fair value of contracts with a net positive fair value at the reporting date. These outstanding instruments expose us to credit loss in the event of nonperformance by the counterparties to the agreements. Should the creditworthiness of one or more of our counterparties decline, our ability to mitigate nonperformance risk is limited to a counterparty agreeing to either a voluntary termination and subsequent cash settlement or a novation of the derivative contract to a third party. In the event of a counterparty default, we may sustain a loss and our cash receipts could be negatively impacted.
103
Table of Contents
ITEM 8. Financial Statements and Supplementary Data
Index to Consolidated Financial Statements
| | |
Report of Deloitte & Touche LLP, Independent Registered Public Accounting Firm | | 105 |
Consolidated Balance Sheets at December 31, 2013 and 2012 | | 106 |
Consolidated Statements of Operations for the years ended December 31, 2013, 2012 and 2011 | | 107 |
Consolidated Statements of Changes in Equity for the years ended December 31, 2013, 2012 and 2011 | | 108 |
Consolidated Statements of Cash Flows for the years ended December 31, 2013, 2012 and 2011 | | 109 |
Notes to Consolidated Financial Statements for the years ended December 31, 2013, 2012 and 2011 | | 110 |
All schedules have been omitted because they are not required or because the required information is contained in the financial statements or notes thereto.
104
Table of Contents
REPORT OF INDEPENDENT REGISTERED PUBLIC ACCOUNTING FIRM
To the Board of Directors of
MarkWest Energy GP, L.L.C.
Denver, Colorado
We have audited the accompanying consolidated balance sheets of MarkWest Energy Partners, L.P. and subsidiaries (the "Partnership") as of December 31, 2013 and 2012, and the related consolidated statements of operations, changes in equity, and cash flows for each of the three years in the period ended December 31, 2013. These financial statements are the responsibility of the Partnership's management. Our responsibility is to express an opinion on these financial statements based on our audits.
We conducted our audits in accordance with the standards of the Public Company Accounting Oversight Board (United States). Those standards require that we plan and perform the audit to obtain reasonable assurance about whether the financial statements are free of material misstatement. An audit includes examining, on a test basis, evidence supporting the amounts and disclosures in the financial statements. An audit also includes assessing the accounting principles used and significant estimates made by management, as well as evaluating the overall financial statement presentation. We believe that our audits provide a reasonable basis for our opinion.
In our opinion, such consolidated financial statements present fairly, in all material respects, the financial position of MarkWest Energy Partners, L.P. and subsidiaries as of December 31, 2013 and 2012, and the results of their operations and their cash flows for each of the three years in the period ended December 31, 2013, in conformity with accounting principles generally accepted in the United States of America.
We have also audited, in accordance with the standards of the Public Company Accounting Oversight Board (United States), the Partnership's internal control over financial reporting as of December 31, 2013, based on the criteria established inInternal Control—Integrated Framework (1992) issued by the Committee of Sponsoring Organizations of the Treadway Commission and our report dated February 26, 2014 expressed an unqualified opinion on the Partnership's internal control over financial reporting.
/s/ DELOITTE & TOUCHE LLP
Denver, Colorado
February 26, 2014
105
Table of Contents
MARKWEST ENERGY PARTNERS, L.P.
CONSOLIDATED BALANCE SHEETS
(in thousands)
| | | | | | | |
| | December 31,
2013 | | December 31,
2012 | |
|---|
ASSETS | | | | | | | |
Current assets: | | | | | | | |
Cash and cash equivalents ($4,114 and $31,584, respectively) | | $ | 85,305 | | $ | 345,756 | |
Restricted cash ($0 and $500, respectively) | | | 10,000 | | | 25,500 | |
Receivables, net ($5,346 and $403, respectively) | | | 299,107 | | | 197,977 | |
Inventories ($2,553 and $0, respectively) | | | 41,363 | | | 24,633 | |
Fair value of derivative instruments | | | 11,457 | | | 19,504 | |
Deferred income taxes | | | 23,200 | | | 5,281 | |
Other current assets ($5,527 and $82, respectively) | | | 44,068 | | | 34,871 | |
| | | | | | |
| | | | | | | | |
Total current assets | | | 514,500 | | | 653,522 | |
| | | | | | |
| | | | | | | | |
Property, plant and equipment ($1,655,789 and $410,205, respectively) | | | 8,583,767 | | | 5,542,316 | |
Less: accumulated depreciation ($33,583 and $2,787, respectively) | | | (890,598 | ) | | (602,698 | ) |
| | | | | | |
| | | | | | | | |
Total property, plant and equipment, net | | | 7,693,169 | | | 4,939,618 | |
| | | | | | |
| | | | | | | | |
Other long-term assets: | | | | | | | |
Restricted cash | | | 10,000 | | | 10,000 | |
Investment in unconsolidated affiliates | | | 75,627 | | | 63,054 | |
Intangibles, net of accumulated amortization of $285,732 and $221,416, respectively | | | 874,792 | | | 855,155 | |
Goodwill | | | 144,856 | | | 142,174 | |
Deferred financing costs, net of accumulated amortization of $25,083 and $18,567, respectively | | | 52,132 | | | 51,145 | |
Deferred contract cost ($6,591 and $0, respectively), net of accumulated amortization of $2,886 and $2,574, respectively | | | 26,955 | | | 676 | |
Fair value of derivative instruments | | | 505 | | | 10,878 | |
Other long-term assets ($658 and $0, respectively) | | | 3,887 | | | 2,140 | |
| | | | | | |
| | | | | | | | |
Total assets | | $ | 9,396,423 | | $ | 6,728,362 | |
| | | | | | |
| | | | | | | | |
| | | | | | | | |
| | | | | | |
LIABILITIES AND EQUITY | | | | | | | |
Current liabilities: | | | | | | | |
Accounts payable ($82,007 and $73,865, respectively) | |
$ |
401,088 | |
$ |
320,627 | |
Accrued liabilities ($112,029 and $109,572, respectively) | | | 437,847 | | | 390,178 | |
Fair value of derivative instruments | | | 28,838 | | | 27,229 | |
| | | | | | |
| | | | | | | | |
Total current liabilities | | | 867,773 | | | 738,034 | |
| | | | | | |
| | | | | | | | |
Deferred income taxes | | | 287,566 | | | 189,428 | |
Fair value of derivative instruments | | | 27,763 | | | 32,190 | |
Long-term debt, net of discounts of $6,929 and $8,061, respectively | | | 3,023,071 | | | 2,523,051 | |
Other long-term liabilities | | | 156,500 | | | 134,261 | |
Commitments and contingencies (see Note 18) | | |
| | |
| |
Redeemable non-controlling interest (see Note 3) | | | 235,617 | | | — | |
Equity: | | |
| | |
| |
Common units (157,766 and 127,494 common units issued and outstanding, respectively) | | | 3,476,295 | | | 2,097,404 | |
Class B units (15,964 and 19,954 Class B units issued and outstanding, respectively) | | | 602,025 | | | 752,531 | |
Non-controlling interest in consolidated subsidiaries | | | 719,813 | | | 261,463 | |
| | | | | | |
| | | | | | | | |
Total equity | | | 4,798,133 | | | 3,111,398 | |
| | | | | | |
| | | | | | | | |
Total liabilities and equity | | $ | 9,396,423 | | $ | 6,728,362 | |
| | | | | | |
| | | | | | | | |
| | | | | | | | |
| | | | | | |
Asset and liability amounts in parentheses represent the portion of the consolidated balance attributable to the variable interest entity.
The accompanying notes are an integral part of these consolidated financial statements.
106
Table of Contents
MARKWEST ENERGY PARTNERS, L.P.
CONSOLIDATED STATEMENTS OF OPERATIONS
(in thousands, except per unit amounts)
| | | | | | | | | | |
| | Year ended December 31, | |
|---|
| | 2013 | | 2012 | | 2011 | |
|---|
Revenue: | | | | | | | | | | |
Revenue | | $ | 1,687,085 | | $ | 1,383,279 | | $ | 1,522,592 | |
Derivative (loss) gain | | | (24,638 | ) | | 56,535 | | | (29,035 | ) |
| | | | | | | | |
| | | | | | | | | | | |
Total revenue | | | 1,662,447 | | | 1,439,814 | | | 1,493,557 | |
| | | | | | | | |
| | | | | | | | | | | |
Operating expenses: | | | | | | | | | | |
Purchased product costs | | | 691,165 | | | 530,328 | | | 682,370 | |
Derivative (gain) loss related to purchased product costs | | | (1,737 | ) | | (13,962 | ) | | 52,960 | |
Facility expenses | | | 291,069 | | | 206,861 | | | 171,497 | |
Derivative loss (gain) related to facility expenses | | | 2,869 | | | 1,371 | | | (6,480 | ) |
Selling, general and administrative expenses | | | 101,549 | | | 93,444 | | | 80,441 | |
Depreciation | | | 299,884 | | | 183,250 | | | 143,704 | |
Amortization of intangible assets | | | 64,644 | | | 53,320 | | | 43,617 | |
(Gain) loss on disposal of property, plant and equipment | | | (33,763 | ) | | 6,254 | | | 8,797 | |
Accretion of asset retirement obligations | | | 824 | | | 672 | | | 1,185 | |
| | | | | | | | |
| | | | | | | | | | | |
Total operating expenses | | | 1,416,504 | | | 1,061,538 | | | 1,178,091 | |
| | | | | | | | |
| | | | | | | | | | | |
Income from operations | | | 245,943 | | | 378,276 | | | 315,466 | |
Other income (expense): | | | | | | | | | | |
Earnings from unconsolidated affiliates | | | 1,422 | | | 2,328 | | | 158 | |
Interest income | | | 262 | | | 419 | | | 422 | |
Interest expense | | | (151,851 | ) | | (120,191 | ) | | (113,631 | ) |
Amortization of deferred financing costs and discount (a component of interest expense) | | | (6,726 | ) | | (5,601 | ) | | (5,114 | ) |
Loss on redemption of debt | | | (38,455 | ) | | — | | | (78,996 | ) |
Miscellaneous income, net | | | 2,519 | | | 62 | | | 144 | |
| | | | | | | | |
| | | | | | | | | | | |
Income before provision for income tax | | | 53,114 | | | 255,293 | | | 118,449 | |
Provision for income tax (benefit) expense: | | | | | | | | | | |
Current | | | (11,208 | ) | | (2,366 | ) | | 17,578 | |
Deferred | | | 23,877 | | | 40,694 | | | (3,929 | ) |
| | | | | | | | |
| | | | | | | | | | | |
Total provision for income tax | | | 12,669 | | | 38,328 | | | 13,649 | |
| | | | | | | | |
| | | | | | | | | | | |
Net income | | | 40,445 | | | 216,965 | | | 104,800 | |
Net (income) loss attributable to non-controlling interest | | | (2,368 | ) | | 3,437 | | | (44,105 | ) |
| | | | | | | | |
| | | | | | | | | | | |
Net income attributable to the Partnership's unitholders | | $ | 38,077 | | $ | 220,402 | | $ | 60,695 | |
| | | | | | | | |
| | | | | | | | | | | |
| | | | | | | | | | | |
| | | | | | | | |
Net income attributable to the Partnership's common unitholders per common unit (Note 23): | | | | | | | | | | |
Basic | | $ | 0.26 | | $ | 1.98 | | $ | 0.75 | |
| | | | | | | | |
| | | | | | | | | | | |
| | | | | | | | | | | |
| | | | | | | | |
Diluted | | $ | 0.24 | | $ | 1.69 | | $ | 0.75 | |
| | | | | | | | |
| | | | | | | | | | | |
| | | | | | | | | | | |
| | | | | | | | |
Weighted average number of outstanding common units: | | | | | | | | | | |
Basic | | | 138,409 | | | 109,979 | | | 78,466 | |
| | | | | | | | |
| | | | | | | | | | | |
| | | | | | | | | | | |
| | | | | | | | |
Diluted | | | 160,443 | | | 130,648 | | | 78,619 | |
| | | | | | | | |
| | | | | | | | | | | |
| | | | | | | | | | | |
| | | | | | | | |
The accompanying notes are an integral part of these consolidated financial statements.
107
Table of Contents
MARKWEST ENERGY PARTNERS, L.P.
CONSOLIDATED STATEMENTS OF CHANGES IN EQUITY
(in thousands)
| | | | | | | | | | | | | | | | | | | | | | |
| |
| |
| |
| |
| |
| |
| | Redeemable
Non-
Controlling
Interest
(Temporary
Equity) | |
|---|
| | Common Units | | Class B Units | |
| |
| |
|---|
| | Non-
controlling
Interest | |
| |
|---|
| | Units | | Amount | | Units | | Amount | | Total | |
|---|
December 31, 2010 | | | 71,440 | | $ | 957,452 | | | — | | $ | — | | $ | 392,842 | | $ | 1,350,294 | | $ | — | |
Issuance of units in public equity offerings, net of offering costs | | | 23,225 | | | 1,095,488 | | | — | | | — | | | — | | | 1,095,488 | | | — | |
Issuance of Class B units | | | — | | | — | | | 19,954 | | | 752,531 | | | — | | | 752,531 | | | — | |
Distributions paid | | | — | | | (218,398 | ) | | — | | | — | | | (62,805 | ) | | (281,203 | ) | | — | |
Contributions to MarkWest Liberty Midstream joint venture | | | — | | | — | | | — | | | — | | | 126,392 | | | 126,392 | | | — | |
Purchase of non-controlling interest of MarkWest Liberty M&R, net of tax benefit | | | — | | | (1,198,465 | ) | | — | | | — | | | (500,345 | ) | | (1,698,810 | ) | | — | |
Share-based compensation activity | | | 275 | | | 8,083 | | | — | | | — | | | — | | | 8,083 | | | — | |
Excess tax benefits related to share-based compensation | | | — | | | 1,084 | | | — | | | — | | | — | | | 1,084 | | | — | |
Deferred income tax impact from changes in equity | | | — | | | (63,417 | ) | | — | | | — | | | — | | | (63,417 | ) | | — | |
Net income | | | — | | | 60,695 | | | — | | | — | | | 44,105 | | | 104,800 | | | — | |
| | | | | | | | | | | | | | | | |
| | | | | | | | | | | | | | | | | | | | | | | |
December 31, 2011 | | | 94,940 | | | 642,522 | | | 19,954 | | | 752,531 | | | 189 | | | 1,395,242 | | | — | |
Issuance of units in public offering, net of offering costs | | | 32,308 | | | 1,634,081 | | | — | | | — | | | — | | | 1,634,081 | | | — | |
Distributions paid | | | — | | | (339,967 | ) | | — | | | — | | | (71 | ) | | (340,038 | ) | | — | |
Contributions from non-controlling interest | | | — | | | — | | | — | | | — | | | 264,782 | | | 264,782 | | | — | |
Share-based compensation activity | | | 246 | | | 6,548 | | | — | | | — | | | — | | | 6,548 | | | — | |
Excess tax benefits related to share-based compensation | | | — | | | 907 | | | — | | | — | | | — | | | 907 | | | — | |
Deferred income tax impact from changes in equity | | | — | | | (67,089 | ) | | — | | | — | | | — | | | (67,089 | ) | | — | |
Net income (loss) | | | — | | | 220,402 | | | — | | | — | | | (3,437 | ) | | 216,965 | | | — | |
| | | | | | | | | | | | | | | | |
| | | | | | | | | | | | | | | | | | | | | | | |
December 31, 2012 | | | 127,494 | | | 2,097,404 | | | 19,954 | | | 752,531 | | | 261,463 | | | 3,111,398 | | | — | |
Issuance of units in public offering, net of offering costs | | | 26,115 | | | 1,698,066 | | | — | | | — | | | — | | | 1,698,066 | | | — | |
Conversion of Class B units to common units | | | 3,990 | | | 150,506 | | | (3,990 | ) | | (150,506 | ) | | — | | | — | | | — | |
Distributions paid | | | — | | | (462,488 | ) | | — | | | — | | | (211 | ) | | (462,699 | ) | | — | |
Contributions from non-controlling interest | | | — | | | — | | | — | | | — | | | 685,219 | | | 685,219 | | | — | |
Redeemable non-controlling interest classified as temporary equity | | | — | | | — | | | — | | | — | | | (235,617 | ) | | (235,617 | ) | | 235,617 | |
Share-based compensation activity | | | 167 | | | 11,072 | | | — | | | — | | | — | | | 11,072 | | | — | |
Other | | | — | | | — | | | — | | | — | | | 6,591 | | | 6,591 | | | — | |
Deferred income tax impact from changes in equity | | | — | | | (56,342 | ) | | — | | | — | | | — | | | (56,342 | ) | | — | |
Net income | | | — | | | 38,077 | | | — | | | — | | | 2,368 | | | 40,445 | | | — | |
| | | | | | | | | | | | | | | | |
| | | | | | | | | | | | | | | | | | | | | | | |
December 31, 2013 | | | 157,766 | | $ | 3,476,295 | | | 15,964 | | $ | 602,025 | | $ | 719,813 | | $ | 4,798,133 | | $ | 235,617 | |
| | | | | | | | | | | | | | | | |
| | | | | | | | | | | | | | | | | | | | | | | |
| | | | | | | | | | | | | | | | | | | | | | | |
| | | | | | | | | | | | | | | | |
The accompanying notes are an integral part of these consolidated financial statements.
108
Table of Contents
MARKWEST ENERGY PARTNERS, L.P.
CONSOLIDATED STATEMENTS OF CASH FLOWS
(in thousands)
| | | | | | | | | | |
| | Year ended December 31, | |
|---|
| | 2013 | | 2012 | | 2011 | |
|---|
Cash flows from operating activities: | | | | | | | | | | |
Net income | | $ | 40,445 | | $ | 216,965 | | $ | 104,800 | |
Adjustments to reconcile net income to net cash provided by operating activities (net of acquisitions): | | | | | | | | | | |
Depreciation | | | 299,884 | | | 183,250 | | | 143,704 | |
Amortization of intangible assets | | | 64,644 | | | 53,320 | | | 43,617 | |
Loss on redemption of debt | | | 38,455 | | | — | | | 78,996 | |
Amortization of deferred financing costs and discount | | | 6,726 | | | 5,601 | | | 5,114 | |
Accretion of asset retirement obligations | | | 824 | | | 672 | | | 1,185 | |
Amortization of deferred contract cost | | | 312 | | | 312 | | | 312 | |
Phantom unit compensation expense | | | 16,282 | | | 14,615 | | | 13,479 | |
Equity in earnings of unconsolidated affiliates | | | (1,422 | ) | | (2,328 | ) | | (158 | ) |
Contributions to unconsolidated affiliate | | | — | | | — | | | (560 | ) |
Distributions from unconsolidated affiliates | | | 6,370 | | | 8,416 | | | 4,382 | |
Unrealized loss (gain) on derivative instruments | | | 15,602 | | | (102,127 | ) | | 4,147 | |
(Loss) gain on disposal of property, plant and equipment | | | (33,763 | ) | | 6,254 | | | 8,797 | |
Deferred income taxes | | | 23,877 | | | 40,694 | | | (3,929 | ) |
Other | | | — | | | — | | | 1,626 | |
Changes in operating assets and liabilities, net of working capital acquired: | | | | | | | | | | |
Receivables | | | (85,927 | ) | | 31,993 | | | (45,107 | ) |
Inventories | | | (16,730 | ) | | 16,580 | | | (16,025 | ) |
Other current assets | | | (9,197 | ) | | (23,285 | ) | | (3,557 | ) |
Accounts payable and accrued liabilities | | | 68,070 | | | 28,417 | | | 54,795 | |
Other long-term assets | | | (21,747 | ) | | (647 | ) | | (308 | ) |
Other long-term liabilities | | | 22,945 | | | 13,311 | | | 15,093 | |
| | | | | | | | |
| | | | | | | | | | | |
Net cash provided by operating activities | | | 435,650 | | | 492,013 | | | 410,403 | |
| | | | | | | | |
| | | | | | | | | | | |
Cash flows from investing activities: | | | | | | | | | | |
Restricted cash | | | 15,500 | | | (9,497 | ) | | 2,006 | |
Capital expenditures | | | (3,046,956 | ) | | (1,950,324 | ) | | (550,839 | ) |
Acquisition of business, net of cash acquired | | | (222,888 | ) | | (506,797 | ) | | (230,728 | ) |
Investment in unconsolidated affiliates | | | (17,521 | ) | | (6,066 | ) | | — | |
Proceeds from disposal of property, plant and equipment | | | 209,303 | | | 596 | | | 3,450 | |
| | | | | | | | |
| | | | | | | | | | | |
Net cash flows used in investing activities | | | (3,062,562 | ) | | (2,472,088 | ) | | (776,111 | ) |
| | | | | | | | |
| | | | | | | | | | | |
Cash flows from financing activities: | | | | | | | | | | |
Proceeds from public equity offerings, net | | | 1,698,066 | | | 1,634,081 | | | 1,095,488 | |
Proceeds from Credit facility | | | — | | | 511,100 | | | 1,182,200 | |
Payments of Credit facility | | | — | | | (577,100 | ) | | (1,116,200 | ) |
Proceeds from long-term debt | | | 1,000,000 | | | 742,613 | | | 1,199,000 | |
Payments of long-term debt | | | (501,112 | ) | | — | | | (693,888 | ) |
Payments of premiums on redemption of long-term debt | | | (31,516 | ) | | — | | | (71,377 | ) |
Payments for debt issuance costs, deferred financing costs and registration costs | | | (14,046 | ) | | (14,720 | ) | | (20,163 | ) |
Acquisition of non-controlling interest, including transaction costs | | | — | | | — | | | (997,601 | ) |
Contributions from non-controlling interest | | | 685,219 | | | 264,781 | | | 126,392 | |
Payments of SMR Liability | | | (2,241 | ) | | (2,058 | ) | | (1,875 | ) |
Cash paid for taxes related to net settlement of share-based payment awards | | | (5,210 | ) | | (8,067 | ) | | (6,354 | ) |
Excess tax benefits related to share-based compensation | | | — | | | 907 | | | 1,084 | |
Payment of distributions to common unitholders | | | (462,488 | ) | | (339,967 | ) | | (218,398 | ) |
Payment of distributions to non-controlling interest | | | (211 | ) | | (71 | ) | | (62,805 | ) |
| | | | | | | | |
| | | | | | | | | | | |
Net cash flows provided by financing activities | | | 2,366,461 | | | 2,211,499 | | | 415,503 | |
| | | | | | | | |
| | | | | | | | | | | |
Net (decrease) increase in cash and cash equivalents | | | (260,451 | ) | | 231,424 | | | 49,795 | |
Cash and cash equivalents at beginning of year | | | 345,756 | | | 114,332 | | | 64,537 | |
| | | | | | | | |
| | | | | | | | | | | |
Cash and cash equivalents at end of year | | $ | 85,305 | | $ | 345,756 | | $ | 114,332 | |
| | | | | | | | |
| | | | | | | | | | | |
| | | | | | | | | | | |
| | | | | | | | |
The accompanying notes are an integral part of these consolidated financial statements.
109
Table of Contents
MARKWEST ENERGY PARTNERS, L.P.
NOTES TO CONSOLIDATED FINANCIAL STATEMENTS
1. Organization and Basis of Presentation
MarkWest Energy Partners, L.P. ("MarkWest Energy Partners") was formed in January 2002 as a Delaware limited partnership. MarkWest Energy Partners and its subsidiaries (collectively, the "Partnership") are engaged in the gathering, processing and transportation of natural gas; the gathering, transportation, fractionation, storage and marketing of NGLs and the gathering and transportation of crude oil. We have a leading presence in many unconventional gas plays including the Marcellus Shale, Utica Shale, Huron/Berea Shale, Haynesville Shale, Woodford Shale and Granite Wash formations. The Partnership's principal executive office is located in Denver, Colorado.
The Partnership's consolidated financial statements include all majority-owned or majority-controlled subsidiaries. In addition, MarkWest Utica EMG and its subsidiaries, a VIE for which the Partnership has been determined to be the primary beneficiary, is included in the consolidated financial statements (see Note 3). For non-wholly-owned subsidiaries, the interests owned by third parties have been recorded asNon-controlling interest in consolidated subsidiaries in the accompanying Consolidated Balance Sheets. Intercompany investments, accounts and transactions have been eliminated. The Partnership's investment in MarkWest Pioneer and Centrahoma, in which the Partnership exercises significant influence but does not control and is not the primary beneficiary, are accounted for using the equity method. The accompanying consolidated financial statements of the Partnership have been prepared in accordance with GAAP.
2. Summary of Significant Accounting Policies
The preparation of financial statements in conformity with GAAP requires management to make estimates and assumptions that affect the reported amounts of assets and liabilities, disclosure of contingent assets and liabilities at the date of the financial statements and the reported amounts of revenues and expenses during the reporting period. Actual results could differ from those estimates. Estimates affect, among other items, valuing identified intangible assets; determining the fair value of derivative instruments; valuing inventory; evaluating impairments of long-lived assets, goodwill and equity investments; establishing estimated useful lives for long-lived assets; recognition of share-based compensation expense; estimating revenues, expense accruals and capital expenditures; valuing asset retirement obligations; and in determining liabilities, if any, for environmental and legal contingencies.
The Partnership considers investments in highly liquid financial instruments purchased with an original maturity of 90 days or less to be cash equivalents. Such investments include money market accounts.
Restricted cash consists primarily of cash and investments that must be maintained as collateral for letters of credit issued to certain third party producer customers. The balances will be outstanding until certain capital projects are completed and the third party releases the restriction. Restricted cash balances for which the restrictions are not expected to be released within a period of twelve months are classified as long-term assets in the Consolidated Balance Sheets.
110
Table of Contents
MARKWEST ENERGY PARTNERS, L.P.
NOTES TO CONSOLIDATED FINANCIAL STATEMENTS (Continued)
2. Summary of Significant Accounting Policies (Continued)
Inventories, which consist primarily of natural gas, propane, other NGLs and spare parts and supplies, are valued at the lower of weighted-average cost or fair value. Processed natural gas and NGL inventories include material, labor and overhead. Shipping and handling costs related to purchases of natural gas and NGLs are included in inventory.
Property, Plant and Equipment
Property, plant and equipment are recorded at cost. Expenditures that extend the useful lives of assets are capitalized. Repairs, maintenance and renewals that do not extend the useful lives of the assets are expensed as incurred. Interest costs for the construction or development of long-lived assets are capitalized and amortized over the related asset's estimated useful life. Leasehold improvements are depreciated over the shorter of the useful life or lease term. Depreciation is provided, principally on the straight-line method, over a period of 10 to 25 years for all assets, with the exception of miscellaneous equipment and vehicles, which are depreciated over a period of three to ten years.
The Partnership evaluates transactions involving the sale of property, plant and equipment to determine if they are, in-substance, the sale of real estate. Tangible assets may be considered real estate if the costs to relocate them for use in a different location exceeds 10% of the asset's fair value. Financial assets, primarily in the form of ownership interests in an entity, may be in-substance real estate based on the significance of the real estate in the entity. Sales of real estate are not considered consummated if the Partnership maintains an interest in the asset after it is sold or has certain other forms of continuing involvement. Significant judgment is required to determine if a transaction is a sale of real estate and if a transaction has been consummated. If a sale of real estate is not considered consummated, the Partnership cannot record the transaction as a sale and must account for the transaction under an alternative method of accounting such as a financing or leasing arrangement. The Partnership's sale of the SMR in 2009, which was considered in-substance real estate, was not considered a sale due to the Partnership's continuing involvement and was accounted for as a financing arrangement. See Note 6 for a description of the transaction and its impact on the financial statements.
An asset retirement obligation ("ARO") is a legal obligation associated with the retirement of tangible long-lived assets that generally result from the acquisition, construction, development or normal operation of the asset. AROs are recorded at fair value in the period in which they are incurred, if a reasonable estimate of fair value can be made and added to the carrying amount of the associated asset. This additional carrying amount is then depreciated over the life of the asset. The liability is determined using a risk free interest rate and increases due to the passage of time based on the time value of money until the obligation is settled. The Partnership recognizes a liability of a conditional ARO as soon as the fair value of the liability can be reasonably estimated. A conditional ARO is defined as an unconditional legal obligation to perform an asset retirement activity in which the timing and/or method of settlement are conditional on a future event that may or may not be within the control of the entity.
111
Table of Contents
MARKWEST ENERGY PARTNERS, L.P.
NOTES TO CONSOLIDATED FINANCIAL STATEMENTS (Continued)
2. Summary of Significant Accounting Policies (Continued)
Equity investments in which the Partnership exercises significant influence, but does not control and is not the primary beneficiary, are accounted for using the equity method and are reported inInvestment in unconsolidated affiliates in the accompanying Consolidated Balance Sheets.
The Partnership believes the equity method is an appropriate means for it to recognize increases or decreases measured by GAAP in the economic resources underlying the investments. Regular evaluation of these investments is appropriate to evaluate any potential need for impairment. The Partnership uses evidence of a loss in value to identify if an investment has an other than a temporary decline.
Non-controlling interests that are puttable by the non-controlling interest holder to the Partnership are considered to be redeemable non-controlling interests if the redemption feature is not deemed to be a freestanding financial instrument and if the redemption is not solely within the control of the Partnership. Redeemable non-controlling interest is not considered to be a component ofEquity and is reported as temporary equity in the mezzanine section on the Consolidated Balance Sheets. The amount recorded as redeemable non-controlling interest at each balance sheet date is the greater of the redemption value and the carrying value of the redeemable non-controlling interest (the initial carrying value increased or decreased for the non-controlling interest holders' share of net income or loss and distributions).
Our collaborative arrangements principally relate to contractual arrangements to pursue the development of facilities and services to support the rapid growth of NGL production occurring in the liquids-rich areas of the Marcellus and Utica Shales. Each party to the contractual arrangement jointly owns certain property and share in revenue, if any, and operating expenses in accordance with their respective ownership interest.
The Partnership's intangibles are mainly comprised of customer contracts and relationships acquired in business combinations and recorded under the acquisition method of accounting at their estimated fair values at the date of acquisition. Using relevant information and assumptions, management determines the fair value of acquired identifiable intangible assets. Fair value is generally calculated as the present value of estimated future cash flows using a risk-adjusted discount rate. The key assumptions include probability of contract renewals, economic incentives to retain customers, historical volumes, current and future capacity of the gathering system, pricing volatility and the discount rate. Amortization of intangibles with definite lives is calculated using the straight-line method over the estimated useful life of the intangible asset. The estimated economic life is determined by assessing the life of the assets related to the contracts and relationships, likelihood of renewals, the projected reserves, competitive factors, regulatory or legal provisions and maintenance and renewal costs.
112
Table of Contents
MARKWEST ENERGY PARTNERS, L.P.
NOTES TO CONSOLIDATED FINANCIAL STATEMENTS (Continued)
2. Summary of Significant Accounting Policies (Continued)
Goodwill is the cost of an acquisition less the fair value of the net identifiable assets of the acquired business. The Partnership evaluates goodwill for impairment annually as of November 30, and whenever events or changes in circumstances indicate it is more likely than not that the fair value of a reporting unit is less than its carrying amount. The Partnership may first assess qualitative factors to evaluate whether it is more likely than not that the fair value of a reporting unit is less than its carrying amount as the basis for determining whether it is necessary to perform the two-step goodwill impairment test. The Partnership may elect to perform the two-step goodwill impairment test without completing a qualitative assessment. If a two-step process goodwill impairment test is elected or required, the first step involves comparing the fair value of the reporting unit to which goodwill has been allocated, with its carrying amount. If the carrying amount of a reporting unit exceeds its fair value, the second step of the process involves comparing the implied fair value to the carrying value of the goodwill for that reporting unit. If the carrying value of the goodwill of a reporting unit exceeds the implied fair value of that goodwill, the excess of the carrying value over the implied fair value is recognized as an impairment loss.
The Partnership's policy is to evaluate whether there has been an impairment in the value of long-lived assets when certain events indicate that the remaining balance may not be recoverable. The Partnership evaluates the carrying value of its property, plant and equipment on at least a segment level and at lower levels where the cash flows for specific assets can be identified and are largely independent from other asset groups. A long-lived asset group is considered impaired when the estimated undiscounted cash flows from such asset group are less than the asset group's carrying value. In that event, a loss is recognized to the extent that the carrying value exceeds the fair value of the long-lived asset group. Fair value is determined primarily using estimated discounted cash flows. Management considers the volume of reserves behind the asset and future NGL product and natural gas prices to estimate cash flows. The amount of additional reserves developed by future drilling activity depends, in part, on expected natural gas prices. Projections of reserves, drilling activity and future commodity prices are inherently subjective and contingent upon a number of variable factors, many of which are difficult to forecast. Any significant variance in any of these assumptions or factors could materially affect future cash flows, which could result in the impairment of an asset group.
For assets identified to be disposed of in the future, the carrying value of these assets is compared to the estimated fair value, less the cost to sell, to determine if impairment is required. Until the assets are disposed of, an estimate of the fair value is re-determined when related events or circumstances change.
Deferred financing costs are amortized over the contractual term of the related obligations or, in certain circumstances, accelerated if the obligation is refinanced, using the effective interest method.
The Partnership may pay consideration to a producer upon entering a long-term arrangement to provide midstream services to the producer. In such cases, the amount of consideration paid is
113
Table of Contents
MARKWEST ENERGY PARTNERS, L.P.
NOTES TO CONSOLIDATED FINANCIAL STATEMENTS (Continued)
2. Summary of Significant Accounting Policies (Continued)
recorded asDeferred contract cost, net of accumulated amortization on the accompanying Consolidated Balance Sheets and is amortized over the term of the arrangement.
Derivative instruments (including derivative instruments embedded in other contracts) are recorded at fair value and included in the Consolidated Balance Sheets as assets or liabilities. Assets and liabilities related to derivative instruments with the same counterparty are not netted in the Consolidated Balance Sheets. The Partnership discloses the fair value of all of its derivative instruments separate from other assets and liabilities under the captionFair value of derivative instruments in the Consolidated Balance Sheets, inclusive of option premiums (net of amortization), if any. Changes in the fair value of derivative instruments are reported in the Statements of Operations in accounts related to the item whose value or cash flows are being managed. Substantially all derivative instruments were marked to market throughRevenue,Purchased product costs, orFacility expenses. Revenue gains and losses relate to contracts utilized to manage the cash flow for the sale of a product and the amortization of associated option premiums. Option premiums are amortized over the effective term of the corresponding option contract. Purchased product costs gains and losses relate to contracts utilized to manage the cost of natural gas purchases, typically related to keep-whole arrangements. Facility expenses gains and losses relate to a contract utilized to manage electricity costs. Changes in risk management activities are reported as an adjustment to net income in computing cash flow from operating activities on the accompanying Consolidated Statements of Cash Flows.
During the years ended December 31, 2013, 2012 and 2011, the Partnership did not designate any hedges or designate any contracts as normal purchases and normal sales.
Management believes the carrying amount of financial instruments, including cash and cash equivalents, restricted cash, receivables, accounts payable and accrued liabilities approximate fair value because of the short-term maturity of these instruments. The recorded value of the amounts outstanding under the Credit Facility, if any, approximate fair value due to the variable interest rate that approximates current market rates. Derivative instruments are recorded at fair value, based on available market information (see Note 8). The following table shows the carrying value and related fair value of financial instruments that are not recorded in the financial statements at fair value as of December 31, 2013 and 2012 (in thousands):
| | | | | | | | | | | | | |
| | December 31, 2013 | | December 31, 2012 | |
|---|
| | Carrying
Value | | Fair
Value | | Carrying
Value | | Fair
Value | |
|---|
Long-term debt | | $ | 3,023,071 | | $ | 3,079,460 | | $ | 2,523,051 | | $ | 2,763,080 | |
SMR Liability | | | 89,592 | | | 120,922 | | | 91,851 | | | 130,736 | |
The fair value of the long-term debt is estimated based on recent market non-binding indicative quotes. The Partnership has continued to report an asset and the related depreciation, for the total capitalized costs of constructing the SMR and has recorded a liability equal to the proceeds from the transaction plus the estimated costs incurred by the buyer to complete construction ("SMR Liability"). The fair value of the SMR Liability is estimated using a discounted cash flow approach based on the
114
Table of Contents
MARKWEST ENERGY PARTNERS, L.P.
NOTES TO CONSOLIDATED FINANCIAL STATEMENTS (Continued)
2. Summary of Significant Accounting Policies (Continued)
contractual cash flows and the Partnership's unsecured borrowing rate. Both the long-term debt and SMR fair values are considered Level 3 measurements as discussed below.
Financial assets and liabilities recorded at fair value in the Consolidated Balance Sheets are categorized based upon a fair value hierarchy established by GAAP, which classifies the inputs used to measure fair value into the following levels:
- •
- Level 1—inputs to the valuation methodology are quoted prices (unadjusted) for identical assets or liabilities in active markets.
- •
- Level 2—inputs to the valuation methodology include quoted prices for similar assets and liabilities in active markets and inputs that are observable for the asset or liability, either directly or indirectly, for substantially the full term of the financial instrument.
- •
- Level 3—inputs to the valuation methodology are unobservable and significant to the fair value measurement.
A financial instrument's categorization within the valuation hierarchy is based upon the lowest level of input that is significant to the fair value measurement.
The determination to classify a financial instrument within Level 3 of the valuation hierarchy is based upon the significance of the unobservable inputs to the overall fair value measurement. However, Level 3 financial instruments typically include, in addition to the unobservable or Level 3 inputs, observable inputs (that is, inputs that are actively quoted and can be validated to external sources); accordingly, the gains and losses for Level 3 financial instruments include changes in fair value due in part to observable inputs that are part of the valuation methodology. Level 3 financial instruments include crude oil options, all NGL derivatives and the embedded derivatives in commodity contracts discussed in Note 7 as they have significant unobservable inputs.
The methods and assumptions described above may produce a fair value that may not be realized in future periods upon settlement. Furthermore, while the Partnership believes its valuation methods are appropriate and consistent with other market participants, the use of different methodologies or assumptions to determine the fair value of certain financial instruments could result in a different estimate of fair value at the reporting date. For further discussion see Note 8.
The Partnership generates the majority of its revenues from natural gas gathering, transportation and processing; NGL gathering, transportation, fractionation, marketing and storage; and crude oil gathering and transportation. It enters into a variety of contract types. The Partnership provides services under the following different types of arrangements:
- •
- Fee-based arrangements—Under fee-based arrangements, the Partnership receives a fee or fees for one or more of the following services: gathering, processing and transmission of natural gas; gathering, transportation, fractionation exchange and storage of NGLs; and gathering and transportation of crude oil. The revenue the Partnership earns from these arrangements is generally directly related to the volume of natural gas, NGLs or crude oil that flows through the Partnership's systems and facilities and is not directly dependent on commodity prices. In certain
115
Table of Contents
MARKWEST ENERGY PARTNERS, L.P.
NOTES TO CONSOLIDATED FINANCIAL STATEMENTS (Continued)
2. Summary of Significant Accounting Policies (Continued)
Under certain contracts, the Partnership is allowed to retain a fixed percentage of the volume gathered to cover the compression fuel charges and deemed-line losses. To the extent the Partnership's gathering systems are operated more or less efficiently than specified per contract allowance, the Partnership is entitled to retain the benefit or loss for its own account.
In many cases, the Partnership provides services under contracts that contain a combination of more than one of the arrangements described above. The terms of the Partnership's contracts vary based on gas quality conditions, the competitive environment when the contracts are signed and customer requirements. It is upon delivery and title transfer that the Partnership meets all four revenue recognition criteria and it is at such time that the Partnership recognizes revenue.
The Partnership's assessment of each of the revenue recognition criteria as they relate to its revenue producing activities is as follows:
Persuasive evidence of an arrangement exists. The Partnership's customary practice is to enter into a written contract, executed by both the customer and the Partnership.
Delivery. Delivery is deemed to have occurred at the time the product is delivered and title is transferred or, in the case of fee-based arrangements, when the services are rendered.
The fee is fixed or determinable. The Partnership negotiates the fee for its services at the outset of its fee-based arrangements. In these arrangements, the fees are nonrefundable. For other arrangements,
116
Table of Contents
MARKWEST ENERGY PARTNERS, L.P.
NOTES TO CONSOLIDATED FINANCIAL STATEMENTS (Continued)
2. Summary of Significant Accounting Policies (Continued)
the amount of revenue is determinable when the sale of the applicable product has been completed upon delivery and transfer of title.
Collectability is reasonably assured. Collectability is evaluated on a customer-by-customer basis. New and existing customers are subject to a credit review process, which evaluates a customer's financial position (e.g. cash position and credit rating) and its ability to pay. If collectability is not considered reasonably assured at the outset of an arrangement in accordance with the Partnership's credit review process, revenue is recognized when the fee is collected.
The Partnership enters into revenue arrangements where it sells customers' gas and/or NGLs and depending on the nature of the arrangement acts as the principal or agent. Revenue from such sales is recognized gross where the Partnership acts as the principal, as the Partnership takes title to the gas and/or NGLs, has physical inventory risk and does not earn a fixed amount. Revenue is recognized net when the Partnership acts as an agent and earns a fixed amount and does not take ownership of the gas and/or NGLs.
Amounts billed to customers for shipping and handling, including fuel costs, are included inRevenue, except under contracts where we are acting as an agent. Shipping and handling costs associated with product sales are included in operating expenses. Taxes collected from customers and remitted to the appropriate taxing authority are excluded from revenue.
The Partnership routinely makes accruals based on estimates for both revenues and expenses due to the timing of compiling billing information, receiving certain third party information and reconciling the Partnership's records with those of third parties. The delayed information from third parties includes, among other things, actual volumes purchased, transported or sold, adjustments to inventory and invoices for purchases, actual natural gas and NGL deliveries and other operating expenses. The Partnership makes accruals to reflect estimates for these items based on its internal records and information from third parties. Estimated accruals are adjusted when actual information is received from third parties and the Partnership's internal records have been reconciled.
The Partnership issues phantom units under its share-based compensation plans as described further in Note 20. A phantom unit entitles the grantee to receive a common unit upon the vesting of the phantom unit. Phantom units are treated as equity awards and compensation expense is measured for these phantom unit grants based on the fair value of the units on the grant date, as defined by GAAP. The fair value of the units awarded is amortized into earnings, reduced for an estimate of expected forfeitures, over the period of service corresponding with the vesting period. For certain plans, the awards may be accounted for as liability awards and the compensation expense is adjusted monthly for the change in the fair value of the unvested units granted.
To satisfy common unit awards, the Partnership may issue new common units, acquire common units in the open market or use common units already owned by the general partner.
117
Table of Contents
MARKWEST ENERGY PARTNERS, L.P.
NOTES TO CONSOLIDATED FINANCIAL STATEMENTS (Continued)
2. Summary of Significant Accounting Policies (Continued)
The Partnership elected to adopt the simplified method to establish the beginning balance of the additional paid-in capital pool ("APIC Pool") related to the tax effects of employee share-based compensation and to determine the subsequent impact on the APIC Pool and Consolidated Statements of Cash Flows of the tax effects of share-based compensation awards that were outstanding upon adoption. Additional paid-in capital is reported asCommon units in the accompanying Consolidated Balance Sheets. Cash flows resulting from tax deductions in excess of the cumulative compensation cost recognized for share-based compensation awards exercised are classified as financing cash flows and are included asExcess tax benefits related to share-based compensation in the accompanying Consolidated Statements of Cash Flows.
The Partnership is not a taxable entity for federal income tax purposes. As such, the Partnership does not directly pay federal income tax. The Partnership's taxable income or loss, which may vary substantially from the net income or loss reported in the Consolidated Statements of Operations, is includable in the federal income tax returns of each partner. The Partnership is, however, a taxable entity under certain state jurisdictions. The Corporation is a tax paying entity for both federal and state purposes.
In addition to paying tax on its own earnings, the Corporation recognizes a tax expense or a tax benefit on its proportionate share of Partnership income or loss resulting from the Corporation's ownership of Class A units of the Partnership even though for financial reporting purposes such income or loss is eliminated in consolidation. The Class A units represent limited partner interests with the same rights as common units except that the Class A units do not have voting rights, except as required by law. Class A units are not treated as outstanding common units in the Consolidated Balance Sheet as they are eliminated in the consolidation of the Corporation. The deferred income tax component relates to the change in the temporary book to tax basis difference in the carrying amount of the investment in the Partnership which results primarily from its timing differences in the Corporation's proportionate share of the book income or loss as compared with the Corporation's proportionate share of the taxable income or loss of the Partnership.
The Partnership and the Corporation account for income taxes under the asset and liability method. Deferred income taxes are recognized for the future tax consequences attributable to differences between the financial statement carrying amounts of existing assets and liabilities and their respective tax basis, capital loss carryforwards and net operating loss and credit carryforwards. Deferred tax assets and liabilities are measured using enacted tax rates applied to taxable income in the years in which those temporary differences are expected to be recovered or settled. The effect of any tax rate change on deferred taxes is recognized as tax expense (benefit) from continuing operations in the period that includes the enactment date of the tax rate change. Realizability of deferred tax assets is assessed and, if not more likely than not, a valuation allowance is recorded to reflect the deferred tax assets at net realizable value as determined by management. Deferred tax balances that are expected to be settled within twelve months are classified as current and all other deferred tax balances are classified as long-term in the accompanying Consolidated Balance Sheets. All changes in the tax bases of assets and liabilities are allocated among continued operations and items charged or credited directly to equity.
118
Table of Contents
MARKWEST ENERGY PARTNERS, L.P.
NOTES TO CONSOLIDATED FINANCIAL STATEMENTS (Continued)
2. Summary of Significant Accounting Policies (Continued)
The Partnership's outstanding phantom units are considered to be participating securities and the Class B units are considered to be a separate class of common units that do not participate in cash distributions. Therefore, basic and diluted earnings per common unit are calculated pursuant to the two-class method described in GAAP for earnings per share. In accordance with the two-class method, basic earnings per common unit is calculated by dividing net income attributable to the Partnership's unitholders, after deducting amounts that are allocable to participating securities or separate class of common units, the outstanding phantom units and Class B units, by the weighted average number of common units outstanding during the period. The amount allocable to the phantom units and Class B units is generally calculated as if all of the net income attributable to the Partnership's unitholders were distributed and not on the basis of actual cash distributions for the period. Therefore, no earnings are allocable to Class B units as they do not participate in cash distributions. During periods in which a net loss attributable to the Partnership is reported or periods in which the total distributions exceed the reported net income attributable to the Partnership's unitholders, the amount allocable to the phantom units and Class B units is based on actual distributions to the phantom units and Class B unitholders. Diluted earnings per unit is calculated by dividing net income attributable to the Partnership's unitholders, after deducting amounts allocable to the outstanding phantom units and Class B units, by the weighted average number of potential common units outstanding during the period. Potential common units are excluded from the calculation of diluted earnings per unit during periods in which net income attributable to the Partnership's unitholders, after deducting amounts that are allocable to the outstanding phantom units and Class B units, is a loss as the impact would be anti-dilutive.
Transactions in which the Partnership acquires control of a business are accounted for under the acquisition method. The identifiable assets, liabilities and any non-controlling interests are recorded at the estimated fair market values as of the acquisition date. The purchase price in excess of the fair value acquired is recorded as goodwill.
The Partnership's ownership interest in a consolidated subsidiary may change if it sells a portion of its interest or acquires additional interest or if the subsidiary issues or repurchases its own shares. If the transaction does not result in a change in control over the subsidiary, the transaction is accounted for as an equity transaction. If a sale results in a change in control, it would result in the deconsolidation of a subsidiary with a gain or loss recognized in the Consolidated Statements of Operations. If the purchase of additional interest occurs which changes the acquirer's ownership interest from non-controlling to controlling, the acquirer's preexisting interest in the acquiree is remeasured to its fair value, with a resulting gain or loss recorded in earnings upon consummation of the business combination. Once an entity has control of a subsidiary, its acquisitions of some or all of the noncontrolling interests in that subsidiary are accounted for as equity transactions and are not considered to be a business combination. See Note 3 for a description of the transaction that resulted in a change in the Partnership's ownership interest in a subsidiary and the impact of these transactions to the financial statements.
119
Table of Contents
MARKWEST ENERGY PARTNERS, L.P.
NOTES TO CONSOLIDATED FINANCIAL STATEMENTS (Continued)
3. Variable Interest Entities
Effective January 1, 2012, the Partnership and EMG Utica, LLC ("EMG Utica") (together the "Members"), executed agreements to form a joint venture, MarkWest Utica EMG, to develop significant natural gas gathering, processing and NGL fractionation, transportation and marketing infrastructure in eastern Ohio.
In February 2013, the Members entered into the Amended and Restated Limited Liability Company Agreement of MarkWest Utica EMG ("Amended Utica LLC Agreement") which replaced the original agreement. Pursuant to the Amended Utica LLC Agreement, the aggregate funding commitment of EMG Utica increased from $500.0 million to $950.0 million (the "Minimum EMG Investment"). As part of this commitment, EMG Utica was required to fund, as needed, all capital required for MarkWest Utica EMG until such time as EMG Utica had contributed aggregate capital equal to $750.0 million (the "Tier 1 EMG Contributions"). Following the funding of the Tier 1 EMG Contributions, the Partnership had the one time right to elect to fund up to 60% of all capital required for MarkWest Utica EMG until such time as EMG Utica has contributed aggregate capital equal to the Minimum EMG Investment.
The Partnership elected not to fund the 60% and therefore, EMG Utica was required to fund all capital until the Minimum EMG Investment was satisfied which occurred in May 2013. As EMG Utica has funded the Minimum EMG Investment, the Partnership will be required to fund, as needed, 100% of future capital for MarkWest Utica EMG until such time as the aggregate capital that has been contributed by the Partnership and EMG Utica equals $2.0 billion. After such time, and until such time as the investment balances of the Partnership and EMG Utica are in the ratio of 70% and 30%, respectively (such time being referred to as the "Second Equalization Date"), EMG Utica will have the right, but not the obligation, to fund up to 10% of each capital call for MarkWest Utica EMG and the Partnership will be required to fund all remaining capital not elected to be funded by EMG Utica. After the Second Equalization Date, the Partnership and EMG Utica will have the right, but not the obligation, to fund its pro rata portion (based on the respective investment balances) of any additional required capital and may also fund additional capital which the other party elects not to fund. As of December 31, 2013, EMG Utica has contributed $950.0 million and the Partnership has contributed $566.5 million to MarkWest Utica EMG.
Under the Amended Utica LLC Agreement, after EMG Utica has contributed more than $500.0 million to MarkWest Utica EMG and prior to December 31, 2016, EMG Utica's investment balance will also be increased by a quarterly special non-cash allocation of income ("Preference Amount") that is based upon the amount of capital contributed by EMG Utica in excess of $500.0 million. No Preference Amount will accrue to EMG Utica's investment balance after December 31, 2016. EMG Utica received a special non-cash allocation of income of approximately $23.2 million for the year ended December 31, 2013.
If the Partnership's investment balance does not equal at least 51% of the aggregate investment balances of both Members as of December 31, 2016, then EMG Utica may require that the Partnership purchase membership interests from EMG Utica so that, following the purchase, the Partnership's investment balance equals 51% of the aggregate investment balances of the Members. The purchase price payable would equal the investment balance associated with the membership interests acquired from EMG Utica. If EMG Utica makes this election, the Partnership would be required to purchase the membership interests on or before March 1, 2017, but effective as of January 1, 2017. The amount
120
Table of Contents
MARKWEST ENERGY PARTNERS, L.P.
NOTES TO CONSOLIDATED FINANCIAL STATEMENTS (Continued)
3. Variable Interest Entities (Continued)
of non-controlling interest subject to the redemption option as of December 31, 2013 is reported asRedeemable non-controlling interest in the mezzanine equity section of the Partnership's Consolidated Balance Sheets.
Under the Amended Utica LLC Agreement, the Partnership will continue to receive 60% of cash generated by MarkWest Utica EMG that is available for distribution until the earlier of December 31, 2016 and the date on which the Partnership's investment balance equals 60% of the aggregate investment balances of the Partnership and EMG Utica. After the earlier of those dates, cash generated by MarkWest Utica EMG that is available for distribution will be allocated to the Partnership and EMG Utica in proportion to their respective investment balances.
In contemplation of executing the Amended Utica LLC Agreement, the Partnership and EMG Utica executed an amendment to the original agreement in January 2013 that obligated the Partnership to temporarily fund MarkWest Utica EMG while EMG Utica completed efforts to raise additional capital to fund its remaining $150.0 million capital commitment under the original agreement. In February 2013, the Partnership contributed approximately $76.2 million to MarkWest Utica EMG and subsequently received a distribution of $61.2 million as reimbursement for the temporary funding. The remaining $15.0 million was retained by MarkWest Utica EMG and is treated as a capital contribution from the Partnership under the terms of the Amended Utica LLC Agreement.
Ohio Gathering is a consolidated subsidiary of MarkWest Utica EMG engaged in providing natural gas gathering services in the Utica Shale in eastern Ohio. As of December 31, 2013, MarkWest Utica EMG owns more than 99% of Ohio Gathering. As of December 31, 2013, Blackhawk Midstream LLC ("Blackhawk") owns less than a 1% interest in Ohio Gathering, but has an option to acquire up to a 40% voting interest ("Ohio Gathering Option"). In December 2013, Blackhawk agreed to sell its interest and the Ohio Gathering Option to Summit; the transaction closed in January 2014. If Summit elects to exercise the option and contribute capital to Ohio Gathering, its ownership interest will equal the amount of its contribution expressed as a percentage of the total capital contributed to Ohio Gathering since inception (inclusive of the amounts contributed by Summit upon exercise of the Ohio Gathering Option). The Ohio Gathering Option expires on May 11, 2014. As noted in theMarkWest EMG Utica Condensate and Ohio Condensate section below, Summit also has an option to acquire up to a 40% interest in Ohio Condensate. If Summit elects to exercise one of the options it must exercise the other at the same time and for the same percentage ownership.
The Partnership has determined that MarkWest Utica EMG is a VIE primarily due to MarkWest Utica EMG's inability to fund its planned activities without additional subordinated financial support. The Partnership has concluded that it is the primary beneficiary of MarkWest Utica EMG. As the primary beneficiary of MarkWest Utica EMG, the Partnership consolidates the entity and recognizes non-controlling interest and redeemable non-controlling interest. The decision to consolidate MarkWest Utica EMG is re-evaluated every quarterly period and is subject to change.
The assets of MarkWest Utica EMG are the property of MarkWest Utica EMG and are not available to the Partnership for any other purpose, including as collateral for its secured debt (see Notes 16 and 25). MarkWest Utica EMG's asset balances can only be used to settle its own obligations. The liabilities of MarkWest Utica EMG do not represent additional claims against the Partnership's general assets and the creditors or beneficial interest holders of MarkWest Utica EMG do not have recourse to the general credit of the Partnership. The Partnership's maximum exposure to loss as a result of its involvement with MarkWest Utica EMG includes its equity investment, any additional
121
Table of Contents
MARKWEST ENERGY PARTNERS, L.P.
NOTES TO CONSOLIDATED FINANCIAL STATEMENTS (Continued)
3. Variable Interest Entities (Continued)
capital contribution commitments and any operating expenses incurred by the subsidiary operator in excess of its compensation received for the performance of the operating services. Other than temporary funding due to the timing of the administrative process associated with capital calls in the beginning of 2013, the Partnership did not provide any financial support to MarkWest Utica EMG that it was not contractually obligated to provide during the years ended December 31, 2013 and 2012. The Partnership was reimbursed for its temporary funding except for $15.0 million that was retained and treated as a capital contribution from the Partnership as discussed above.
The results of operations of MarkWest Utica EMG and its subsidiary are shown separately as the Utica segment and are shown in parentheses on the Consolidated Balances Sheets (see Note 24).
In December 2013, the Partnership and EMG ("Condensate Members") executed the Limited Liability Company Agreement of MarkWest Utica EMG Condensate, L.L.C, ("Utica Condensate LLC Agreement") to form MarkWest Utica EMG Condensate (or "Utica Condensate") for the purpose of engaging in wellhead condensate gathering, stabilization, terminalling, storage and marketing in the state of Ohio.
Under the terms of the Utica Condensate LLC Agreement, until the Condensate Equalization Date (as defined below) the Partnership has a 55% ownership interest and EMG has a 45% ownership interest in Utica Condensate. After the Condensate Equalization Date, each Condensate Member's ownership interest will be equal to its investment balance expressed as a percentage of the aggregate investment balance of all Condensate Members at the end of each accounting period. However, both before and after the Condensate Equalization Date, allocations of profits and losses and distributions of available cash will be made to the Condensate Members based upon the investment balances of the Condensate Members. The investment balances of the Condensate Members are subject to reduction if, and to the extent, that the Condensate Members receive distributions of available cash prior to the Condensate Equalization Date as a result of the exercise of the Condensate Option by Summit as described below. EMG is required to provide 100% of the capital funding to Utica Condensate until the earlier of 1) such time that EMG has contributed $100.0 million ("Tier 1 Condensate Contributions") or 2) September 1, 2014. If EMG completes the Tier 1 Condensate Contributions prior to September 1, 2014, the Partnership is required to contribute 100% of the required capital until the earlier of 1) September 1, 2014, 2) such time as the total capital contributed equals $125.0 million (the earlier of the two foregoing dates, the "Required Condensate True Up Date"), and 3) the date on which the Partnership has an investment balance equal to 55% of the aggregate investment balances of the Condensate Members (the earlier of the three foregoing dates, the "Condensate Equalization Date"). If the Partnership's investment balance in Utica Condensate does not equal 55% of the total investment balances of the Condensate Members as of the Required Condensate True Up Date, the Partnership is required to purchase ownership interests from EMG such that following the purchase the Partnership's investment balance associated with its ownership interest will equal 55% ("Required True Up Transaction"). The purchase price payable would equal the investment balance associated with the ownership interests so acquired from EMG. If Utica Condensate requires additional capital subsequent to the Condensate Equalization Date, each member has the right, but not the obligation, to contribute capital in proportion to its ownership interest.
122
Table of Contents
MARKWEST ENERGY PARTNERS, L.P.
NOTES TO CONSOLIDATED FINANCIAL STATEMENTS (Continued)
3. Variable Interest Entities (Continued)
Under the Utica Condensate LLC Agreement, oversight of the business and affairs of Utica Condensate will be managed by a board of managers. Prior to the Condensate Equalization Date, the board of managers will consist of three managers designated by the Partnership and three managers designated by EMG. Thereafter, the number of managers that each Condensate Member may designate will be determined based upon ownership interests. In addition, each of the Partnership and EMG have consent rights with respect to certain specified material transactions involving Utica Condensate, therefore, management has concluded that Utica Condensate is under joint control and will be accounted for as an equity method investment.
Initially, Utica Condensate's business will be conducted solely through a subsidiary, Ohio Condensate, which was formed in December 2013 when MarkWest Utica EMG Condensate and Blackhawk executed the Limited Liability Company Agreement of Ohio Condensate Company, L.L.C. ("Ohio Condensate LLC Agreement). As of December 31, 2013, Utica Condensate owns 99% of Ohio Condensate. As of December 31, 2013, Blackhawk owned a 1% interest in Ohio Condensate, and had an option to acquire up to a 40% voting interest ("Ohio Condensate Option"). In December 2013, Blackhawk agreed to sell its interest and the Ohio Condensate Option to Summit; the transaction closed in January 2014. If Summit elects to exercise the Ohio Condensate Option and contribute capital to Ohio Condensate, its ownership interest will equal the amount of its contribution expressed as a percentage of the total capital contributed to Ohio Condensate since inception (inclusive of the amounts contributed by Summit upon exercise of the Ohio Condensate Option). The Ohio Condensate Option expires on May 11, 2014. As noted above, Summit can only exercise the Ohio Gathering Option and Ohio Condensate Option if both are exercised at the same time and for the same percentage ownership.
As of December 31, 2013, MarkWest Utica EMG Condensate and its subsidiary had not commenced operating activities and therefore had no impact on the Partnership's operating results. The Partnership sold approximately $17.4 million of assets under construction to Utica Condensate in December 2013 and has recorded that amount inReceivables, net in the accompanying Consolidated Balance Sheets as of December 31, 2013.
MarkWest Pioneer is the owner and operator of the Arkoma Connector Pipeline. The Partnership and Arkoma Pipeline Partners, L.L.C. share the equity interests in MarkWest Pioneer equally (50% and 50%). The Partnership has historically determined that MarkWest Pioneer was a VIE and the Partnership was the primary beneficiary. Therefore, MarkWest Pioneer has historically been included as a consolidated subsidiary by the Partnership. Based on further consideration of the facts and circumstances, MarkWest Pioneer should not have been consolidated and should have been accounted for under the equity method since the Partnership sold 50% of its interests to Arkoma Pipeline Partners, L.L.C. in 2009. Under the equity method, the Partnership would have recognized an impairment of its investment in MarkWest Pioneer of approximately $39.2 million ($35.4 million, net of provision for income tax) in the year ended December 31, 2009.
123
Table of Contents
MARKWEST ENERGY PARTNERS, L.P.
NOTES TO CONSOLIDATED FINANCIAL STATEMENTS (Continued)
3. Variable Interest Entities (Continued)
The Partnership determined that the consolidation error and impairment were immaterial to the prior periods included in the accompanying consolidated financial statements. Correcting the cumulative effect of the error in the three months ended December 31, 2013 could have had a significant effect on the results of operations for the full year; therefore, the Partnership has restated the accompanying Consolidated Balance Sheets as of December 31, 2012 (including the parenthetical disclosure of VIE balances), the Consolidated Statements of Operations for the years ended December 31, 2012 and 2011 and the Consolidated Statement of Cash Flows and Consolidated Statements of Changes in Equity for the years ended December 31, 2012 and 2011. The impact of the misstatement is shown in the tables below (in thousands). In addition, the footnotes have been updated for the immaterial changes.
| | | | | | | |
| | December 31, 2012 | |
|---|
Balance Sheet | | As previously
reported | | As restated | |
|---|
Cash and cash equivalents | | $ | 347,899 | | $ | 345,756 | |
Receivables, net | | | 198,769 | | | 197,977 | |
Other current assets | | | 35,053 | | | 34,871 | |
Total current assets | | | 656,639 | | | 653,522 | |
Property, plant and equipment | | |
5,700,176 | | |
5,542,316 | |
Less: accumulated depreciation | | | (624,548 | ) | | (602,698 | ) |
Total property, plant and equipment, net | | | 5,075,628 | | | 4,939,618 | |
Investment in unconsolidated affiliates | | |
31,179 | | |
63,054 | |
Other long-term assets | | | 2,242 | | | 2,140 | |
Total assets | | | 6,835,716 | | | 6,728,362 | |
Accounts payable | | |
320,645 | | |
320,627 | |
Accrued liabilities | | | 391,352 | | | 390,178 | |
Total current liabilities | | | 739,226 | | | 738,034 | |
Deferred income taxes | | |
191,318 | | |
189,428 | |
Other long-term liabilities | | | 134,340 | | | 134,261 | |
Common units | | |
2,134,714 | | |
2,097,404 | |
Non-controlling interest in consolidated subsidiaries | | | 328,346 | | | 261,463 | |
Total equity | | |
3,215,591 | | |
3,111,398 | |
Total liabilities and equity | | | 6,835,716 | | | 6,728,362 | |
124
Table of Contents
MARKWEST ENERGY PARTNERS, L.P.
NOTES TO CONSOLIDATED FINANCIAL STATEMENTS (Continued)
3. Variable Interest Entities (Continued)
| | | | | | | | | | | | | |
| | Year ended December 31,
2012 | | Year ended December 31,
2011 | |
|---|
Statement of Operations | | As previously
reported | | As restated | | As previously
reported | | As restated | |
|---|
Revenue | | $ | 1,395,231 | | $ | 1,383,279 | | $ | 1,534,434 | | $ | 1,522,592 | |
Total revenue | | | 1,451,766 | | | 1,439,814 | | | 1,505,399 | | | 1,493,557 | |
Facility expenses | | |
208,385 | | |
206,861 | | |
173,598 | | |
171,497 | |
Selling, general and administrative expenses | | | 94,116 | | | 93,444 | | | 81,229 | | | 80,441 | |
Depreciation | | | 189,549 | | | 183,250 | | | 149,954 | | | 143,704 | |
Accretion of asset retirement obligations | | | 677 | | | 672 | | | 1,190 | | | 1,185 | |
Total operating expenses | | | 1,070,038 | | | 1,061,538 | | | 1,187,235 | | | 1,178,091 | |
Income from operations | | |
381,728 | | |
378,276 | | |
318,164 | | |
315,466 | |
Earnings from unconsolidated affiliates | | | 699 | | | 2,328 | | | (1,095 | ) | | 158 | |
Income before provision for income tax | | | 257,116 | | | 255,293 | | | 119,894 | | | 118,449 | |
Net income | | | 218,788 | | | 216,965 | | | 106,245 | | | 104,800 | |
Net loss (income) attributable to non-controlling interest | | | 1,614 | | | 3,437 | | | (45,550 | ) | | (44,105 | ) |
125
Table of Contents
MARKWEST ENERGY PARTNERS, L.P.
NOTES TO CONSOLIDATED FINANCIAL STATEMENTS (Continued)
3. Variable Interest Entities (Continued)
| | | | | | | | | | | | | |
| | Year ended December 31,
2012 | | Year ended December 31,
2011 | |
|---|
Statement of Cash Flows | | As previously
reported | | As restated | | As previously
reported | | As restated | |
|---|
Cash flows from operating activities: | | | | | | | | | | | | | |
Net income | | $ | 218,788 | | $ | 216,965 | | $ | 106,245 | | $ | 104,800 | |
Adjustments to reconcile net income to net cash provided by operating activities: | | | | | | | | | | | | | |
Depreciation | | | 189,549 | | | 183,250 | | | 149,954 | | | 143,704 | |
Accretion of asset retirement obligations | | | 677 | | | 672 | | | 1,190 | | | 1,185 | |
Equity in (earnings) loss of unconsolidated affiliates | | | (699 | ) | | (2,328 | ) | | 1,095 | | | (158 | ) |
Distributions from unconsolidated affiliates | | | 2,600 | | | 8,416 | | | 300 | | | 4,382 | |
Receivables | | | 32,588 | | | 31,993 | | | (45,463 | ) | | (45,107 | ) |
Other current assets | | | (23,115 | ) | | (23,285 | ) | | (3,728 | ) | | (3,557 | ) |
Accounts payable and accrued liabilities | | | 28,412 | | | 28,417 | | | 54,745 | | | 54,795 | |
Other long-term assets | | | (647 | ) | | (647 | ) | | (307 | ) | | (308 | ) |
Net cash provided by operating activities | | | 496,713 | | | 492,013 | | | 414,698 | | | 410,403 | |
Cash flows from investing activities: | | |
| | |
| | |
| | |
| |
Capital expenditures | | | (1,951,427 | ) | | (1,950,324 | ) | | (551,281 | ) | | (550,839 | ) |
Investment in unconsolidated affiliates | | | (5,227 | ) | | (6,066 | ) | | — | | | — | |
Net cash flows used in investing activities | | | (2,472,352 | ) | | (2,472,088 | ) | | (776,553 | ) | | (776,111 | ) |
Cash flows from financing activities: | | |
| | |
| | |
| | |
| |
Contributions from non-controlling interest | | | 265,620 | | | 264,781 | | | 126,392 | | | 126,392 | |
Payment of distributions to non-controlling interest | | | (5,887 | ) | | (71 | ) | | (66,887 | ) | | (62,805 | ) |
Net cash flows provided by financing activities | | | 2,206,522 | | | 2,211,499 | | | 411,421 | | | 415,503 | |
Net increase in cash and cash equivalents | | |
230,883 | | |
231,424 | | |
49,566 | | |
49,795 | |
Cash and cash equivalents at beginning of year | | | 117,016 | | | 114,332 | | | 67,450 | | | 64,537 | |
Cash and cash equivalents at end of period | | | 347,899 | | | 345,756 | | | 117,016 | | | 114,332 | |
126
Table of Contents
MARKWEST ENERGY PARTNERS, L.P.
NOTES TO CONSOLIDATED FINANCIAL STATEMENTS (Continued)
3. Variable Interest Entities (Continued)
| | | | | | | | | | | | | | | | | | | |
| | Common Units | | Non-controlling Interest | | Total Equity | |
|---|
Statement of Changes in Equity | | As previously
reported | | As restated | | As previously
reported | | As restated | | As previously
reported | | As restated | |
|---|
December 31, 2010 | | $ | 993,049 | | $ | 957,452 | | $ | 465,517 | | $ | 392,842 | | $ | 1,458,566 | | $ | 1,350,294 | |
Distributions paid | | | (218,398 | ) | | (218,398 | ) | | (66,887 | ) | | (62,805 | ) | | (285,285 | ) | | (281,203 | ) |
Deferred income tax impact from changes in equity. | | | (62,227 | ) | | (63,417 | ) | | — | | | — | | | (62,227 | ) | | (63,417 | ) |
Net income | | | 60,695 | | | 60,695 | | | 45,550 | | | 44,105 | | | 106,245 | | | 104,800 | |
December 31, 2011 | | | 679,309 | | | 642,522 | | | 70,227 | | | 189 | | | 1,502,067 | | | 1,395,242 | |
Distributions paid | | | (339,967 | ) | | (339,967 | ) | | (5,887 | ) | | (71 | ) | | (345,854 | ) | | (340,038 | ) |
Contributions from non-controlling interest | | | — | | | — | | | 265,620 | | | 264,782 | | | 265,620 | | | 264,782 | |
Deferred income tax impact from changes in equity. | | | (66,566 | ) | | (67,089 | ) | | — | | | — | | | (66,566 | ) | | (67,089 | ) |
Net income | | | 220,402 | | | 220,402 | | | (1,614 | ) | | (3,437 | ) | | 218,788 | | | 216,965 | |
December 31, 2012 | | | 2,134,714 | | | 2,097,404 | | | 328,346 | | | 261,463 | | | 3,215,591 | | | 3,111,398 | |
In 2009, the Partnership entered into a joint venture with M&R, to form MarkWest Liberty Midstream, which operates in the natural gas midstream business in and around the Marcellus Shale in western Pennsylvania and northern West Virginia. The Partnership determined MarkWest Liberty Midstream was a VIE until December 31, 2011, primarily due to the Partnership's disproportionate economic interests as compared to its voting interests in MarkWest Liberty Midstream. Effective December 31, 2011, the partnership acquired M&R's 49% non-controlling interest of MarkWest Liberty Midstream for $994.0 million in cash and approximately 19,954,000 Class B units. Therefore, MarkWest Liberty Midstream is no longer a VIE.
The following table summarizes the effect of the change of ownership interest of MarkWest Liberty Midstream on the equity attributable to the Partnership's common units for the year ended December 31, 2011 (in thousands):
| | | | |
Net income attributable to the Partnership's unitholders | | $ | 60,695 | |
Transfers to the non-controlling interests: | | | | |
Decrease in common unit equity for 2011 acquisition of equity interest in MarkWest Liberty Midstream, net of $51,321 income tax benefit | | | (1,194,865 | ) |
Decrease in common unit equity for transaction costs related to 2011 acquisition of equity interest in MarkWest Liberty Midstream | | | (3,600 | ) |
| | | | |
| | | | | |
Net (loss) income attributable to the Partnership and transfers to the non-controlling interest | | $ | (1,137,770 | ) |
| | | | |
| | | | | |
| | | | | |
| | | | |
127
Table of Contents
MARKWEST ENERGY PARTNERS, L.P.
NOTES TO CONSOLIDATED FINANCIAL STATEMENTS (Continued)
4. Business Combinations
On May 8, 2013, the Partnership acquired natural gas gathering and processing assets from Chesapeake Energy Corporation ("Chesapeake") for a cash purchase price of approximately $225.2 million. The acquired assets include a 200 MMcf/d cryogenic gas processing plant under construction (which commenced operation in February 2014), known as the Buffalo Creek Plant, 22 miles of gas gathering pipeline in Hemphill County, Texas and approximately 30 miles of rights-of-way associated with the future construction of a trunk line. Additional assets acquired from Chesapeake consist of an amine treating facility and a five-mile gas gathering pipeline in Washita County, Oklahoma. This acquisition is referred to as the "Buffalo Creek Acquisition".
Concurrently with the closing of the Buffalo Creek Acquisition, the Partnership entered into a long-term fee-based agreement to provide treating, processing and certain gathering and compression services for natural gas owned or controlled by Chesapeake at the acquired facilities. Chesapeake has dedicated 130,000 acres throughout the Anadarko Basin to the Partnership as part of this long-term agreement. As a result of the acquisition, the Partnership has expanded its presence in the Granite Wash and Hogshooter formations in Oklahoma.
Contemporaneously with the Buffalo Creek Acquisition, Chesapeake agreed to extend a keep-whole processing agreement for natural gas produced in the Appalachia Basin area of the Partnership's Northeast segment for five additional years, to 2020. The Partnership paid an additional $20.0 million of cash upon closing the Buffalo Creek Acquisition as consideration for the extension and has recorded it asDeferred contract cost in the accompanying Consolidated Balance Sheets. The deferred contract costs will be amortized over the extension term. This $20.0 million is not considered to be part of the purchase price of the Buffalo Creek Acquisition and is not included in the purchase price allocation table below.
The goodwill recognized from the Buffalo Creek Acquisition results primarily from the Partnership's ability to grow its business in the liquids-rich gas areas of the Granite Wash and Hogshooter formations in Oklahoma and access additional markets in a competitive environment as a result of securing the gathering and processing rights for a large area of dedicated acreage. All of the goodwill is deductible for tax purposes.
Pro forma financial results that give effect to the Buffalo Creek Acquisition are not presented as it is impractical to obtain the necessary information. Chesapeake did not operate the acquired assets as a standalone business and, therefore, historical financial information that is consistent with the operations under the current agreements is not available.
On May 29, 2012, the Partnership acquired natural gas gathering and processing assets from Keystone for a cash purchase price of approximately $507.3 million, giving effect to the final working capital adjustment. The Partnership paid cash of $509.6 million in May 2012. During 2013, we received $2.3 million related to a working capital adjustment.
Keystone's existing assets are located in Butler County, Pennsylvania and include two cryogenic gas processing plants totaling approximately 90 MMcf/d of processing capacity, a gas gathering system and associated field compression.
128
Table of Contents
MARKWEST ENERGY PARTNERS, L.P.
NOTES TO CONSOLIDATED FINANCIAL STATEMENTS (Continued)
4. Business Combinations (Continued)
As a result of the Keystone Acquisition, the Partnership became a party to a long-term fee-based agreement to gather and process certain natural gas owned or controlled by a subsidiary of Rex Energy Corporation and a subsidiary of Sumitomo Corporation("Sumitomo"), at the acquired facilities and in 2013 to exchange the resulting NGLs for fractionated products at facilities already owned and operated by the Partnership. Rex and Sumitomo have dedicated an area of approximately 900 square miles to the Partnership as part of this long-term gathering and processing agreement. As a result of the Keystone Acquisition, the Partnership has expanded its position in the liquids-rich Marcellus Shale area into northwest Pennsylvania.
The goodwill recognized from the Keystone Acquisition results primarily from synergies created from integrating the Keystone assets with the Partnership's existing Marcellus Shale operations and the Partnership's strengthened competitive position as it plans to expand its business in the newly developing liquids-rich areas of the Marcellus Shale. All of the goodwill is deductible for tax purposes.
Pro forma financial results that give effect to the Keystone Acquisition are not presented as any pro forma adjustments would not be material to the Partnership's historical results.
On February 1, 2011, the Partnership acquired natural gas processing and NGL pipeline assets from EQT for a cash purchase price of approximately $230.7 million. The assets acquired include natural gas processing facilities located near Langley, Kentucky, consisting of a cryogenic natural gas processing plant with a capacity of approximately 100 MMcf/d and a refrigeration natural gas processing plant with a capacity of approximately 75 MMcf/d, the partially constructed Ranger pipeline that extends through parts of Kentucky and West Virginia, and certain other related assets. The acquired assets do not include certain residue gas compression and transportation facilities at the same location as the Langley Processing Facilities. In connection with the Langley Acquisition, the Partnership completed the construction of the Ranger Pipeline to connect the Langley Processing Facilities to the Partnership's existing pipeline that transports NGLs to its Siloam fractionation facility in South Shore, Kentucky.
Concurrently with the closing of the Langley Acquisition, the Partnership entered into a long-term agreement to process certain natural gas owned or controlled by EQT at the Langley Processing Facilities. In 2012, the Partnership installed an additional cryogenic natural gas processing plant with a capacity of 150 MMcf/d as required by the processing agreement. The Partnership exchanges the NGLs produced at the Langley Processing Facilities for fractionated products from its Siloam facility and markets the fractionated products on behalf of EQT in accordance with a long-term NGL exchange and marketing agreement. As a result of the acquisition, the Partnership has significantly expanded its midstream operations in the liquids-rich gas areas of the Appalachian Basin.
The goodwill recognized from the Langley Acquisition results primarily from the Partnership's ability to continue to grow its business in the liquids-rich gas areas of the Appalachian Basin and access additional markets in a competitive environment as a result of securing the processing rights for a large area of dedicated acreage and acquiring expanded midstream infrastructure in the acquisition. All of the goodwill is deductible for tax purposes.
The three acquisitions were accounted for as business combinations. The total purchase price was allocated to the identifiable assets acquired and liabilities assumed based on the estimated fair values at
129
Table of Contents
MARKWEST ENERGY PARTNERS, L.P.
NOTES TO CONSOLIDATED FINANCIAL STATEMENTS (Continued)
4. Business Combinations (Continued)
the individual acquisition dates. The remaining purchase price in excess of the fair value of the identifiable assets and liabilities was recorded as goodwill.
The acquired assets and the related results of operations are included in the Partnership's following segments:
| | | | | | | | |
Acquisition | | Segment | | Intangible Assets Acquired | | Useful Life | | Amortization
Method |
|---|
Buffalo Creek | | Southwest | | Identifiable customer contract with Chesapeake | | 20 years | | Straight-line |
Keystone | | Marcellus | | Identifiable customer contract with Rex and Sumitomo | | 19 years | | Straight-line |
Langley | | Northeast | | Identifiable customer contract | | 12 years | | Straight-line |
The following table summarizes the purchase price allocation for the three acquisitions (in thousands):
| | | | | | | | | | |
| | Buffalo Creek | | Keystone | | Langley | |
|---|
Assets: | | | | | | | | | | |
Cash | | $ | — | | $ | 2,837 | | $ | — | |
Accounts receivable | | | — | | | 1,756 | | | — | |
Inventory | | | — | | | 86 | | | 1,806 | |
Property, plant and equipment | | | 144,115 | | | 136,593 | | | 136,525 | |
Goodwill | | | 2,682 | | | 74,256 | | | 58,497 | |
Intangible asset | | | 84,500 | | | 304,708 | | | 33,900 | |
Liabilities: | | | | | | | | | | |
Accounts payable | | | (6,087 | ) | | (12,117 | ) | | — | |
Other short-term liabilities | | | — | | | (175 | ) | | — | |
Other long-term liabilities | | | — | | | (632 | ) | | — | |
| | | | | | | | |
| | | | | | | | | | | |
Total | | $ | 225,210 | | $ | 507,312 | | $ | 230,728 | |
| | | | | | | | |
| | | | | | | | | | | |
| | | | | | | | | | | |
| | | | | | | | |
The results of operations of the three acquisitions are included in the consolidated financial statements from their respective acquisition dates. Revenue and net income related to the three acquisitions are immaterial during the year each acquisition occurred.
5. Divestiture
In June 2013, the Partnership sold certain gathering assets in Doddridge County, West Virginia (the "Sherwood Asset Sale") to Summit for approximately $207.9 million cash, net of third party transaction costs. In connection with the Sherwood Asset Sale, Summit assumed liabilities associated with the purchased assets, other than certain identified liabilities that were retained by the Partnership. Liquids-rich gas gathered by these assets is dedicated to the Partnership for processing at the Marcellus segment's Sherwood processing complex, also located in Doddridge County, West Virginia. The assets included in this transaction consist of over 40 miles of newly constructed high-pressure gas gathering pipelines, certain rights-of-way associated with the pipeline and two compressor stations totaling over 21,000 horsepower of combined compression. The assets had a carrying value of approximately
130
Table of Contents
MARKWEST ENERGY PARTNERS, L.P.
NOTES TO CONSOLIDATED FINANCIAL STATEMENTS (Continued)
5. Divestiture (Continued)
$168.2 million and were part of the Partnership's Marcellus segment. The gain of approximately $39.7 million on the Sherwood Asset Sale is included in(Gain) loss on disposal of property, plant and equipment in the accompanying Consolidated Statements of Operations.
6. SMR Transaction
On September 1, 2009, the Partnership completed the SMR Transaction. At that time, the Partnership had begun constructing the SMR at its Javelina gas processing and fractionation facility in Corpus Christi, Texas. Under the terms of the agreement, the Partnership received proceeds of $73.1 million and the purchaser completed the construction of the SMR. The Partnership and the purchaser also executed a related product supply agreement under which the Partnership will receive the entire product produced by the SMR through 2030 in exchange for processing fees and the reimbursement of certain other expenses. The processing fee payments began when the SMR commenced operations in March 2010. The Partnership is deemed to have continuing involvement with the SMR as a result of certain provisions in the related agreements. Therefore, the transaction is treated as a financing arrangement under GAAP. The Partnership imputes interest on the SMR Liability at 9.35% annually, its incremental borrowing rate at transaction consummation. The accrued interest on the SMR Liability was capitalized until the SMR commenced operations and the Partnership began payment of the processing fee under the product supply agreement. Each processing fee payment has multiple elements: reduction of principal of the SMR Liability, interest expense associated with the SMR Liability and facility expense related to the operation of the SMR. As of December 31, 2013 and 2012, the following amounts related to the SMR are included in the accompanying Consolidated Balance Sheets (in thousands):
| | | | | | | |
| | December 31, 2013 | | December 31, 2012 | |
|---|
ASSETS | | | | | | | |
Property, plant and equipment, net of accumulated depreciation of $20,195 and $14,926, respectively | | $ | 85,169 | | $ | 90,437 | |
LIABILITIES | | | | | | | |
Accrued liabilities | | $ | 2,479 | | $ | 2,259 | |
Other long-term liabilities | | | 87,113 | | | 89,592 | |
7. Derivative Financial Instruments
NGL and natural gas prices are volatile and are impacted by changes in fundamental supply and demand, as well as market uncertainty, availability of NGL transportation and fractionation capacity and a variety of additional factors that are beyond the Partnership's control. The Partnership's profitability is directly affected by prevailing commodity prices primarily as a result of processing or conditioning at its own or third-party processing plants, purchasing and selling or gathering and transporting volumes of natural gas at index-related prices and the cost of third-party transportation and fractionation services. To the extent that commodity prices influence the level of natural gas drilling by the Partnership's producer customers, such prices also affect profitability. To protect itself financially against adverse price movements and to maintain more stable and predictable cash flows so that the
131
Table of Contents
MARKWEST ENERGY PARTNERS, L.P.
NOTES TO CONSOLIDATED FINANCIAL STATEMENTS (Continued)
7. Derivative Financial Instruments (Continued)
Partnership can meet its cash distribution objectives, debt service and capital plans, the Partnership executes a strategy governed by the risk management policy approved by the General Partner's board of directors. The Partnership has a committee comprised of senior management that oversees risk management activities, continually monitors the risk management program and adjusts its strategy as conditions warrant. The Partnership enters into certain derivative contracts to reduce the risks associated with unfavorable changes in the prices of natural gas, NGLs and crude oil. Derivative contracts utilized are swaps and options traded on the OTC market and fixed price forward contracts. The risk management policy does not allow the Partnership to take speculative positions with its derivative contracts.
To mitigate its cash flow exposure to fluctuations in the price of NGLs, the Partnership has entered into derivative financial instruments relating to the future price of NGLs and crude oil. The Partnership currently manages the majority of its NGL price risk using direct product NGL derivative contracts. The Partnership enters into NGL derivative contracts when adequate market liquidity exists and future prices are satisfactory. A portion of the Partnership's NGL price exposure is managed by using crude oil contracts. In periods where NGL prices and crude oil prices are not consistent with the historical relationship, the crude oil contracts create increased risk and additional gains or losses. The Partnership may settle its crude oil contracts prior to the contractual settlement date in order to take advantage of favorable terms and reduce the future exposure resulting from the less effective crude oil contracts. Based on our current volume forecasts, the majority of our derivative positions used to manage our future commodity price exposure are direct product NGL derivative contracts.
To mitigate its cash flow exposure to fluctuations in the price of natural gas, the Partnership primarily utilizes derivative financial instruments relating to the future price of natural gas and takes into account the partial offset of its long and short gas positions resulting from normal operating activities.
As a result of its current derivative positions, the Partnership has mitigated a portion of its expected commodity price risk through the fourth quarter of 2015. The Partnership would be exposed to additional commodity risk in certain situations such as if producers under deliver or over deliver product or when processing facilities are operated in different recovery modes. In the event the Partnership has derivative positions in excess of the product delivered or expected to be delivered, the excess derivative positions may be terminated.
Currently, all of the Partnership's financial derivative positions are with financial institutions that are participating members of the Credit Facility ("participating bank group members"). Management conducts a standard credit review on counterparties to derivative contracts. There are no collateral requirements for derivative contracts among the Partnership and any participating bank group members. Specifically, the Partnership is not required to post collateral when it enters into derivative contracts with participating bank group members as the participating bank group members have a collateral position in substantially all the wholly-owned assets of the Partnership other than MarkWest Liberty Midstream and its subsidiaries. A separate agreement with certain participating bank group members allows MarkWest Liberty Midstream to enter into derivative positions without posting cash collateral. The Partnership uses standardized agreements that allow for offset of certain positive and negative exposures ("master netting arrangements") in the event of default or other terminating events, including bankruptcy.
132
Table of Contents
MARKWEST ENERGY PARTNERS, L.P.
NOTES TO CONSOLIDATED FINANCIAL STATEMENTS (Continued)
7. Derivative Financial Instruments (Continued)
The Partnership records derivative contracts at fair value in the Consolidated Balance Sheets and has not elected hedge accounting or the normal purchases and normal sales designation. The Partnership's accounting may cause volatility in the Consolidated Statements of Operations as the Partnership recognizes in current earnings all unrealized gains and losses from the changes in fair value on derivatives.
As of December 31, 2013, the Partnership had the following outstanding commodity contracts that were executed to manage the cash flow risk associated with future sales of NGLs or future purchases of natural gas.
| | | | | | |
Derivative contracts not designated as hedging instruments | | Financial
Position | | Notional
Quantity (net) | |
|---|
Crude Oil (bbl) | | Short | | | 1,323,905 | |
Natural Gas (MMBtu) | | Long | | | 3,187,606 | |
NGLs (gal) | | Short | | | 125,470,405 | |
The Partnership has a commodity contract with a producer in the Appalachia region that creates a floor on the frac spread for gas purchases of 9,000 Dth/d. The commodity contract is a component of a broader regional arrangement that also includes a keep-whole processing agreement. This contract is accounted for as an embedded derivative and is recorded at fair value. The changes in fair value of this commodity contract are based on the difference between the contractual and index pricing and are recorded in earnings throughDerivative (gain) loss related to purchased product costs. In February 2011, the Partnership executed agreements with the producer to extend the commodity contract and the related processing agreement from March 31, 2015 to December 31, 2022, with the producer's option to extend the agreement for successive five year terms through December 31, 2032. As of December 31, 2013, the estimated fair value of this contract was a liability of $91.8 million and the recorded value was a liability of $38.3 million. The recorded liability does not include the inception fair value of the commodity contract related to the extended period from April 1, 2015 to December 31, 2022. In accordance with GAAP for non-option embedded derivatives, the fair value of this extended portion of the commodity contract at its inception of February 1, 2011 is deemed to be allocable to the host processing contract and, therefore, not recorded as a derivative liability. See the following table for a reconciliation of the liability recorded for the embedded derivative as of December 31, 2013 (in thousands):
| | | | |
Fair value of commodity contract | | $ | 91,815 | |
Inception value for period from April 1, 2015 to December 31, 2022. | | | (53,507 | ) |
| | | | |
| | | | | |
Derivative liability as of December 31, 2013 | | $ | 38,308 | |
| | | | |
| | | | | |
| | | | | |
| | | | |
The Partnership has a commodity contract that gives it an option to fix a component of the utilities cost to an index price on electricity at its plant location in the Southwest segment through the fourth quarter of 2014. Changes in the fair value of the derivative component of this contract are
133
Table of Contents
MARKWEST ENERGY PARTNERS, L.P.
NOTES TO CONSOLIDATED FINANCIAL STATEMENTS (Continued)
7. Derivative Financial Instruments (Continued)
recognized asDerivative loss (gain) related to facility expenses. As of December 31, 2013 and 2012, the estimated fair value of this contract was an asset of $3.3 million and $6.1 million, respectively.
The impact of the Partnership's derivative instruments on its Consolidated Balance Sheets is summarized below (in thousands):
| | | | | | | | | | | | | |
| | Assets | | Liabilities | |
|---|
Derivative contracts not designated as
hedging instruments and
their balance sheet location | | Fair Value at
December 31,
2013 | | Fair Value at
December 31,
2012 | | Fair Value at
December 31,
2013 | | Fair Value at
December 31,
2012 | |
|---|
Commodity contracts(1) | | | | | | | | | | | | | |
Fair value of derivative instruments—current | | $ | 11,457 | | $ | 19,504 | | $ | (28,838 | ) | $ | (27,229 | ) |
Fair value of derivative instruments—long-term | | | 505 | | | 10,878 | | | (27,763 | ) | | (32,190 | ) |
| | | | | | | | | | |
| | | | | | | | | | | | | | |
Total | | $ | 11,962 | | $ | 30,382 | | $ | (56,601 | ) | $ | (59,419 | ) |
| | | | | | | | | | |
| | | | | | | | | | | | | | |
| | | | | | | | | | | | | | |
| | | | | | | | | | |
- (1)
- IncludesEmbedded Derivatives in Commodity Contracts as discussed above.
Although certain derivative positions are subject to master netting agreements, the Partnership has elected not to offset any derivative assets and liabilities. The gross amounts in the table below equal the balances presented in the Consolidated Balance Sheets. The table below summarizes the impact if the Partnership had elected to net its derivative positions that are subject to master netting arrangements (in thousands):
| | | | | | | | | | | | | | | | | | | |
| | Assets | | Liabilities | |
|---|
As of December 31, 2013 | | Gross
Amounts of
Assets in the
Consolidated
Balance
Sheet | | Gross
Amounts
Not Offset
in the
Consolidated
Balance
Sheet | | Net Amount | | Gross
Amounts of
Liabilities
in the
Consolidated
Balance
Sheet | | Gross
Amounts
Not Offset
in the
Consolidated
Balance
Sheet | | Net Amount | |
|---|
Current | | | | | | | | | | | | | | | | | | | |
Commodity contracts | | $ | 8,181 | | $ | (7,017 | ) | $ | 1,164 | | $ | (18,293 | ) | $ | 7,017 | | $ | (11,276 | ) |
Embedded derivatives in commodity contracts | | | 3,276 | | | — | | | 3,276 | | | (10,545 | ) | | — | | | (10,545 | ) |
| | | | | | | | | | | | | | |
| | | | | | | | | | | | | | | | | | | | |
Total current derivative instruments | | | 11,457 | | | (7,017 | ) | | 4,440 | | | (28,838 | ) | | 7,017 | | | (21,821 | ) |
| | | | | | | | | | | | | | |
| | | | | | | | | | | | | | | | | | | | |
Non-current | | | | | | | | | | | | | | | | | | | |
Commodity contracts | | | 505 | | | — | | | 505 | | | — | | | — | | | — | |
Embedded derivatives in commodity contracts | | | — | | | — | | | — | | | (27,763 | ) | | — | | | (27,763 | ) |
| | | | | | | | | | | | | | |
| | | | | | | | | | | | | | | | | | | | |
Total non-current derivative instruments | | | 505 | | | — | | | 505 | | | (27,763 | ) | | — | | | (27,763 | ) |
| | | | | | | | | | | | | | |
| | | | | | | | | | | | | | | | | | | | |
Total derivative instruments | | $ | 11,962 | | $ | (7,017 | ) | $ | 4,945 | | $ | (56,601 | ) | $ | 7,017 | | $ | (49,584 | ) |
| | | | | | | | | | | | | | |
| | | | | | | | | | | | | | | | | | | | |
| | | | | | | | | | | | | | | | | | | | |
| | | | | | | | | | | | | | |
134
Table of Contents
MARKWEST ENERGY PARTNERS, L.P.
NOTES TO CONSOLIDATED FINANCIAL STATEMENTS (Continued)
7. Derivative Financial Instruments (Continued)
| | | | | | | | | | | | | | | | | | | |
| | Assets | | Liabilities | |
|---|
As of December 31, 2012 | | Gross
Amounts of
Assets in the
Consolidated
Balance
Sheet | | Gross
Amounts
Not Offset
in the
Consolidated
Balance
Sheet | | Net Amount | | Gross
Amounts of
Liabilities
in the
Consolidated
Balance
Sheet | | Gross
Amounts
Not Offset
in the
Consolidated
Balance
Sheet | | Net Amount | |
|---|
Current | | | | | | | | | | | | | | | | | | | |
Commodity contracts | | $ | 16,438 | | $ | (9,541 | ) | $ | 6,897 | | $ | (16,679 | ) | $ | 9,541 | | $ | (7,138 | ) |
Embedded derivatives in commodity contracts | | | 3,066 | | | — | | | 3,066 | | | (10,550 | ) | | — | | | (10,550 | ) |
| | | | | | | | | | | | | | |
| | | | | | | | | | | | | | | | | | | | |
Total current derivative instruments | | | 19,504 | | | (9,541 | ) | | 9,963 | | | (27,229 | ) | | 9,541 | | | (17,688 | ) |
| | | | | | | | | | | | | | |
| | | | | | | | | | | | | | | | | | | | |
Non-current | | | | | | | | | | | | | | | | | | | |
Commodity contracts | | | 7,798 | | | (2,637 | ) | | 5,161 | | | (2,637 | ) | | 2,637 | | | — | |
Embedded derivatives in commodity contracts | | | 3,080 | | | — | | | 3,080 | | | (29,553 | ) | | — | | | (29,553 | ) |
| | | | | | | | | | | | | | |
| | | | | | | | | | | | | | | | | | | | |
Total non-current derivative instruments | | | 10,878 | | | (2,637 | ) | | 8,241 | | | (32,190 | ) | | 2,637 | | | (29,553 | ) |
| | | | | | | | | | | | | | |
| | | | | | | | | | | | | | | | | | | | |
Total derivative instruments | | $ | 30,382 | | $ | (12,178 | ) | $ | 18,204 | | $ | (59,419 | ) | $ | 12,178 | | $ | (47,241 | ) |
| | | | | | | | | | | | | | |
| | | | | | | | | | | | | | | | | | | | |
| | | | | | | | | | | | | | | | | | | | |
| | | | | | | | | | | | | | |
In the tables above, the Partnership does not offset a counterparty's current derivative contracts with the counterparty's non-current derivative contracts, although the Partnership's master netting arrangements would allow current and non-current positions to be offset in the event of default. Additionally, in the event of a default, the Partnership's master netting arrangements would allow for the offsetting of all transactions executed under the master netting arrangement. These types of transactions may include non-derivative instruments, derivatives qualifying for scope exceptions, receivables and payables arising from settled positions and other forms of non-cash collateral (such as letters of credit). These types of transactions are excluded from the offsetting tables presented above.
135
Table of Contents
MARKWEST ENERGY PARTNERS, L.P.
NOTES TO CONSOLIDATED FINANCIAL STATEMENTS (Continued)
7. Derivative Financial Instruments (Continued)
The impact of the Partnership's derivative instruments on its Consolidated Statements of Operations is summarized below (in thousands):
| | | | | | | | | | |
| | Year ended December 31, | |
|---|
Derivative contracts not designated as hedging instruments and the location of
gain or (loss) recognized in income | | 2013 | | 2012 | | 2011 | |
|---|
Revenue: Derivative (loss) gain | | | | | | | | | | |
Realized loss | | $ | (3,534 | ) | $ | (6,508 | ) | $ | (48,093 | ) |
Unrealized (loss) gain | | | (21,104 | ) | | 63,043 | | | 19,058 | |
| | | | | | | | |
| | | | | | | | | | | |
Total revenue: derivative (loss) gain | | | (24,638 | ) | | 56,535 | | | (29,035 | ) |
| | | | | | | | |
| | | | | | | | | | | |
Derivative gain (loss) related to purchased product costs | | | | | | | | | | |
Realized loss | | | (6,634 | ) | | (26,493 | ) | | (27,711 | ) |
Unrealized gain (loss) | | | 8,371 | | | 40,455 | | | (25,249 | ) |
| | | | | | | | |
| | | | | | | | | | | |
Total derivative gain (loss) related to purchase product costs | | | 1,737 | | | 13,962 | | | (52,960 | ) |
| | | | | | | | |
| | | | | | | | | | | |
Derivative (loss) gain related to facility expenses | | | | | | | | | | |
Unrealized (loss) gain | | | (2,869 | ) | | (1,371 | ) | | 6,480 | |
| | | | | | | | |
| | | | | | | | | | | |
Total (loss) gain | | $ | (25,770 | ) | $ | 69,126 | | $ | (75,515 | ) |
| | | | | | | | |
| | | | | | | | | | | |
| | | | | | | | | | | |
| | | | | | | | |
At December 31, 2013 and 2012, the fair value of the Partnership's commodity derivative contracts does not include any value for premium payments. For the years ended December 31, 2013, 2012 and 2011, theRealized loss—revenue includes amortization of premium payments of zero, zero and $4.4 million, respectively.
8. Fair Value
Fair Value Measurement
Fair value measurements and disclosures relate primarily to the Partnership's derivative positions as discussed in Note 7.
Money market funds are measured at fair value and are included in Level 1 measurements of the valuation hierarchy. The derivative contracts are measured at fair value on a recurring basis and classified within Level 2 and Level 3 of the valuation hierarchy. The Level 2 and Level 3 measurements are obtained using a market approach. LIBOR rates are an observable input for the measurement of all derivative contracts. The measurements for all commodity contracts contain observable inputs in the form of forward prices based on WTI crude oil prices; Columbia Appalachia, Henry Hub, PEPL and Houston Ship Channel natural gas prices. Level 2 instruments include crude oil and natural gas swap contracts. The valuations are based on the appropriate commodity prices and contain no significant unobservable inputs. Level 3 instruments include crude oil options, all NGL transactions and embedded derivatives in commodity contracts. The significant unobservable inputs for crude oil options, NGL transactions and embedded derivatives in commodity contracts include option volatilities and NGL prices interpolated and extrapolated due to inactive markets, electricity price curves, and probability of
136
Table of Contents
MARKWEST ENERGY PARTNERS, L.P.
NOTES TO CONSOLIDATED FINANCIAL STATEMENTS (Continued)
8. Fair Value (Continued)
renewal. The following table presents the financial instruments carried at fair value as of December 31, 2013 and 2012 and by the valuation hierarchy (in thousands):
| | | | | | | |
As of December 31, 2013 | | Assets | | Liabilities | |
|---|
Significant other observable inputs (Level 2) | | | | | | | |
Commodity contracts | | $ | 544 | | $ | (4,691 | ) |
Significant unobservable inputs (Level 3) | | | | | | | |
Commodity contracts | | | 8,142 | | | (13,602 | ) |
Embedded derivatives in commodity contracts | | | 3,276 | | | (38,308 | ) |
| | | | | | |
| | | | | | | | |
Total carrying value in Consolidated Balance Sheet | | $ | 11,962 | | $ | (56,601 | ) |
| | | | | | |
| | | | | | | | |
| | | | | | | | |
| | | | | | |
| | | | | | | |
As of December 31, 2012 | | Assets | | Liabilities | |
|---|
Significant other observable inputs (Level 2) | | | | | | | |
Commodity contracts | | $ | 8,441 | | $ | (15,970 | ) |
Significant unobservable inputs (Level 3) | | | | | | | |
Commodity contracts | | | 15,795 | | | (3,346 | ) |
Embedded derivatives in commodity contracts | | | 6,146 | | | (40,103 | ) |
| | | | | | |
| | | | | | | | |
Total carrying value in Consolidated Balance Sheet | | $ | 30,382 | | $ | (59,419 | ) |
| | | | | | |
| | | | | | | | |
| | | | | | | | |
| | | | | | |
137
Table of Contents
MARKWEST ENERGY PARTNERS, L.P.
NOTES TO CONSOLIDATED FINANCIAL STATEMENTS (Continued)
8. Fair Value (Continued)
The following table provides additional information about the significant unobservable inputs used in the valuation of Level 3 instruments as of December 31, 2013. The market approach is used for valuation of all instruments.
| | | | | | | | |
Level 3 Instrument | | Balance
Sheet
Classification | | Unobservable Inputs | | Value Range | | Time Period |
|---|
Commodity contracts | | Assets | | Forward propane prices (per gallon)(1) | | $1.07 - $1.26 | | Jan. 2014 - Dec. 2014 |
| | | | Forward isobutane prices (per gallon)(1) | | $1.32 - $1.40 | | Jan. 2014 - Dec. 2014 |
| | | | Forward normal butane prices (per gallon)(1) | | $1.26 - $1.36 | | Jan. 2014 - Dec. 2014 |
| | | | Forward natural gasoline prices (per gallon)(1) | | $2.02 - $2.13 | | Jan. 2014 - Dec. 2014 |
| | | | Crude option volatilities (%) | | 10.43% - 19.76% | | Jan. 2014 - Dec. 2014 |
| | Liabilities | | Forward propane prices (per gallon)(1) | | $1.07 - $1.26 | | Jan. 2014 - Dec. 2014 |
| | | | Forward isobutane prices (per gallon)(1) | | $1.32 - $1.40 | | Jan. 2014 - Dec. 2014 |
| | | | Forward normal butane prices (per gallon)(1) | | $1.26 - $1.36 | | Jan. 2014 - Dec. 2014 |
| | | | Forward natural gasoline prices (per gallon)(1) | | $2.02 - $2.13 | | Jan. 2014 - Dec. 2014 |
| | | | Crude option volatilities (%) | | 8.92% - 21.29% | | Jan. 2014 - Jul. 2014 |
Embedded derivatives in commodity contracts | | Asset | | ERCOT Pricing (per Megawatt Hour)(2) | | $33.98 - $62.96 | | Jan. 2014 - Dec. 2014 |
| | Liability | | Forward propane prices (per gallon)(1) | | $0.91 - $1.26 | | Jan. 2014 - Dec. 2022 |
| | | | Forward isobutane prices (per gallon)(1) | | $1.27 - $1.40 | | Jan. 2014 - Dec. 2022 |
| | | | Forward normal butane prices (per gallon)(1) | | $1.19 - $1.36 | | Jan. 2014 - Dec. 2022 |
| | | | Forward natural gasoline prices (per gallon)(1) | | $1.82 - $2.13 | | Jan. 2014 - Dec. 2022 |
| | | | Forward natural gas prices (per MMBtu)(3) | | $3.50 - $4.59 | | Jan. 2014 - Dec. 2022 |
| | | | Probability of renewal(4) | | 0% | | |
- (1)
- NGL prices decrease over the respective periods.
- (2)
- The forward ERCOT prices utilized in the valuations are generally flat at the low end of the range with a seasonal spike in pricing in the summer months.
- (3)
- Natural gas prices used in the valuations are generally at the lower end of the range in the early years and increase over time.
- (4)
- The producer counterparty to the embedded derivative has the option to renew the gas purchase agreement and the related keep-whole processing agreement for two successive five-year terms after 2022. The embedded gas purchase agreement cannot be renewed without the renewal of the related keep-whole processing agreement. Due to the significant number of years until the renewal options are exercisable and
138
Table of Contents
MARKWEST ENERGY PARTNERS, L.P.
NOTES TO CONSOLIDATED FINANCIAL STATEMENTS (Continued)
8. Fair Value (Continued)
the high level of uncertainty regarding the counterparty's future business strategy, the future commodity price environment, and the future competitive environment for midstream services in the Appalachia area, management determined that a 0% probability of renewal is an appropriate assumption.
Fair Value Sensitivity Related to Unobservable Inputs
Commodity contracts (assets and liabilities)—For the Partnership's commodity contracts, increases in forward NGL prices result in a decrease in the fair value of the derivative assets and an increase in the fair value of the derivative liabilities. The forward prices for the individual NGL products generally increase or decrease in a positive correlation with one another. An increase in crude option volatilities will generally result in an increase in the fair value of the Partnership's derivative assets and derivative liabilities in commodity contracts.
Embedded derivative in commodity contracts (liability)—The embedded derivative liability relates to the natural gas purchase agreement embedded in a keep-whole processing agreement as discussed further in Note 7. Increases (decreases) in forward NGL prices result in an increase (decrease) in the fair value of the embedded derivative liability. An increase in the probability of renewal would result in an increase in the fair value of the related embedded derivative liability.
Embedded derivative in commodity contracts (asset)—The embedded derivative asset relates to utilities costs discussed further in Note 7. Increases in the forward ERCOT prices, relative to natural gas prices, result in an increase in the fair value of the embedded derivative asset.
Level 3 Valuation Process
The Partnership's Risk Management Department (the "Risk Department") is responsible for the valuation of the Partnership's commodity derivative contracts and embedded derivatives in commodity contracts. The Risk Department reports to the Chief Financial Officer and is responsible for the oversight of the Partnership's commodity risk management program. The members of the Risk Department have the requisite experience, knowledge and day-to-day involvement in the energy commodity markets to ensure appropriate valuations and understand the changes in the valuations from period to period. The valuations of the Level 3 commodity derivative contracts are performed by a third-party pricing service and reviewed and validated on a quarterly basis by the Risk Department by comparing the pricing and option volatilities to actual market data and/or data provided by at least one other independent third-party pricing service. The valuations for the embedded derivatives in commodity contracts are completed by the Risk Department utilizing the market data and price curves provided by the third-party pricing service. For the embedded derivative in the keep-whole processing arrangement discussed in Note 7, the Risk Department must develop forward price curves for NGLs and natural gas for periods in which price curves are not available from third-party pricing services due to insufficient market data. As of December 31, 2013, the Risk Department utilized internally developed price curves for the period of January 2016 through December 2022 in the valuation of the embedded derivative in the keep-whole processing arrangement. In developing the pricing curves for these periods, the Risk Department maximizes its use of the latest known market data and trends as well as its understanding of the historical relationships between forward NGL and natural gas prices and the forward market data that is available for the required period, such as crude oil pricing and natural gas pricing from other markets. However, there is very limited actual market data available to validate the Risk Department's estimated price curves.
139
Table of Contents
MARKWEST ENERGY PARTNERS, L.P.
NOTES TO CONSOLIDATED FINANCIAL STATEMENTS (Continued)
8. Fair Value (Continued)
Changes in Level 3 Fair Value Measurements
The tables below include a roll forward of the balance sheet amounts for the years ended December 31, 2013 and 2012 (including the change in fair value) for assets and liabilities classified by the Partnership within Level 3 of the valuation hierarchy (in thousands):
| | | | | | | |
| | Year Ended December 31, 2013 | |
|---|
| | Commodity
Derivative
Contracts (net) | | Embedded
Derivatives
in Commodity
Contracts (net) | |
|---|
Fair value at beginning of period | | $ | 12,449 | | $ | (33,957 | ) |
Total loss (realized and unrealized) included in earnings(1) | | | (19,157 | ) | | (10,336 | ) |
Settlements | | | 1,248 | | | 9,261 | |
| | | | | | |
| | | | | | | | |
Fair value at end of period | | $ | (5,460 | ) | $ | (35,032 | ) |
| | | | | | |
| | | | | | | | |
| | | | | | | | |
| | | | | | |
The amount of total losses for the period included in earnings attributable to the change in unrealized gains or losses relating to assets still held at end of period | | $ | (13,040 | ) | $ | (8,559 | ) |
| | | | | | |
| | | | | | | | |
| | | | | | | | |
| | | | | | |
| | | | | | | |
| | Year Ended December 31, 2012 | |
|---|
| | Commodity
Derivative
Contracts (net) | | Embedded
Derivatives
in Commodity
Contracts (net) | |
|---|
Fair value at beginning of period | | $ | (2,965 | ) | $ | (53,904 | ) |
Total gain (realized and unrealized) included in earnings(1) | | | 17,153 | | | 9,199 | |
Settlements | | | (1,739 | ) | | 10,748 | |
| | | | | | |
| | | | | | | | |
Fair value at end of period | | $ | 12,449 | | $ | (33,957 | ) |
| | | | | | |
| | | | | | | | |
| | | | | | | | |
| | | | | | |
The amount of total gains for the period included in earnings attributable to the change in unrealized gains or losses relating to assets still held at end of period | | $ | 8,213 | | $ | 8,175 | |
| | | | | | |
| | | | | | | | |
| | | | | | | | |
| | | | | | |
- (1)
- Gains and losses on Commodity Derivative Contracts classified as Level 3 are recorded inDerivative (loss) gain—revenue in the accompanying Consolidated Statements of Operations. Gains and losses on Embedded Derivatives in Commodity Contracts are recorded inPurchased product costs,Derivative (gain) loss related to purchased product costs andDerivative loss (gain) related to facility expenses.
140
Table of Contents
MARKWEST ENERGY PARTNERS, L.P.
NOTES TO CONSOLIDATED FINANCIAL STATEMENTS (Continued)
9. Significant Customers and Concentration of Credit Risk
For the years ended December 31, 2013, 2012 and 2011, revenues from a single customer totaled $184.0 million, $175.1 million and $203.3 million, representing 10.9%, 12.7% and 13.4% ofRevenue, respectively. Revenues from this customer are for NGL sales made primarily from the Southwest segment. As of December 31, 2013 and 2012, the Partnership had $20.3 million and $12.5 million of accounts receivable from this customer, respectively.
For the years ended December 31, 2013, 2012 and 2011, revenues from a second customer totaled $183.8 million, $138.7 million and $96.1 million, representing 10.9%, 10.0% and 6.3% ofRevenue, respectively. Revenues from this customer are from gathering and processing services in the Marcellus segment. As of December 31, 2013 and 2012, the Partnership had $45.7 million and $45.1 million of accounts receivable from this customer, respectively.
For the years ended December 31, 2012 and 2011, revenues from a third customer totaled $165.3 million and $297.8 million, representing 11.9% and 19.6% ofRevenue, respectively. Revenues from this customer are made primarily in the Southwest segment. As of December 31, 2012, the Partnership had $3.9 million of accounts receivable from this customer.
10. Receivables
Receivables consist of the following (in thousands):
| | | | | | | |
| | December 31,
2013 | | December 31,
2012 | |
|---|
Trade, net | | $ | 266,560 | | $ | 187,445 | |
Receivables from unconsolidated affiliates | | | 17,363 | | | — | |
Other | | | 15,184 | | | 10,532 | |
| | | | | | |
| | | | | | | | |
Total receivables | | $ | 299,107 | | $ | 197,977 | |
| | | | | | |
| | | | | | | | |
| | | | | | | | |
| | | | | | |
11. Inventories
Inventories consist of the following (in thousands):
| | | | | | | |
| | December 31,
2013 | | December 31,
2012 | |
|---|
NGLs | | $ | 21,131 | | $ | 11,502 | |
Line fill | | | 7,960 | | | 3,261 | |
Spare parts, materials and supplies | | | 12,272 | | | 9,870 | |
| | | | | | |
| | | | | | | | |
Total inventories | | $ | 41,363 | | $ | 24,633 | |
| | | | | | |
| | | | | | | | |
| | | | | | | | |
| | | | | | |
141
Table of Contents
MARKWEST ENERGY PARTNERS, L.P.
NOTES TO CONSOLIDATED FINANCIAL STATEMENTS (Continued)
12. Property, Plant and Equipment
Property, plant and equipment consist of the following (in thousands):
| | | | | | | |
| | December 31,
2013 | | December 31,
2012 | |
|---|
Natural gas gathering and NGL transportation pipelines and facilities | | $ | 4,290,918 | | $ | 2,712,572 | |
Processing plants | | | 1,879,184 | | | 894,282 | |
Fractionation and storage facilities | | | 220,344 | | | 207,169 | |
Crude oil pipelines | | | 16,730 | | | 16,730 | |
Land, building, office equipment and other | | | 710,737 | | | 376,014 | |
Construction in progress | | | 1,465,854 | | | 1,335,549 | |
| | | | | | |
| | | | | | | | |
Property, plant and equipment | | | 8,583,767 | | | 5,542,316 | |
Less: accumulated depreciation | | | (890,598 | ) | | (602,698 | ) |
| | | | | | |
| | | | | | | | |
Total property, plant and equipment, net | | $ | 7,693,169 | | $ | 4,939,618 | |
| | | | | | |
| | | | | | | | |
| | | | | | | | |
| | | | | | |
13. Goodwill and Intangible Assets
Goodwill. The table below shows the gross amount of goodwill acquired and the cumulative impairment loss recognized as of December 31, 2013 (in thousands).
| | | | | | | | | | | | | |
| | Marcellus | | Northeast | | Southwest | | Total | |
|---|
Gross goodwill as of December 31, 2011 | | $ | — | | $ | 62,445 | | $ | 34,178 | | $ | 96,623 | |
Acquisition(1) | | | 74,256 | | | — | | | — | | | 74,256 | |
| | | | | | | | | | |
| | | | | | | | | | | | | | |
Gross goodwill as of December 31, 2012 | | | 74,256 | | | 62,445 | | | 34,178 | | | 170,879 | |
Acquisition(2) | | | — | | | — | | | 2,682 | | | 2,682 | |
| | | | | | | | | | |
| | | | | | | | | | | | | | |
Gross goodwill as of December 31, 2013 | | | 74,256 | | | 62,445 | | | 36,860 | | | 173,561 | |
Cumulative impairment(3) | | | — | | | — | | | (28,705 | ) | | (28,705 | ) |
| | | | | | | | | | |
| | | | | | | | | | | | | | |
Balance as of December 31, 2013 | | $ | 74,256 | | $ | 62,445 | | $ | 8,155 | | $ | 144,856 | |
| | | | | | | | | | |
| | | | | | | | | | | | | | |
| | | | | | | | | | | | | | |
| | | | | | | | | | |
- (1)
- Represents goodwill associated with the Keystone Acquisition (see Note 4).
- (2)
- Represents goodwill associated with the Buffalo Creek Acquisition (see Note 4).
- (3)
- All impairments recorded in the fourth quarter of 2008.
142
Table of Contents
MARKWEST ENERGY PARTNERS, L.P.
NOTES TO CONSOLIDATED FINANCIAL STATEMENTS (Continued)
13. Goodwill and Intangible Assets (Continued)
Intangible Assets. The Partnership's intangible assets as of December 31, 2013 and 2012 are comprised of customer contracts and relationships, as follows (in thousands):
| | | | | | | | | | | | | | | | | | | | | | |
| | December 31, 2013 | | December 31, 2012 | |
| |
|---|
Description | | Gross | | Accumulated
Amortization | | Net | | Gross | | Accumulated
Amortization | | Net | | Useful Life | |
|---|
Marcellus | | $ | 304,708 | | $ | (26,382 | ) | $ | 278,326 | | $ | 304,708 | | $ | (9,380 | ) | $ | 295,328 | | | 19 yrs. | |
Northeast | | | 102,473 | | | (48,402 | ) | | 54,071 | | | 102,473 | | | (38,719 | ) | | 63,754 | | | 12 yrs. | |
Southwest | | | 753,343 | | | (210,948 | ) | | 542,395 | | | 669,390 | | | (173,317 | ) | | 496,073 | | | 10 - 25 yrs. | |
| | | | | | | | | | | | | | | | | |
| | | | | | | | | | | | | | | | | | | | | | | |
Total | | $ | 1,160,524 | | $ | (285,732 | ) | $ | 874,792 | | $ | 1,076,571 | | $ | (221,416 | ) | $ | 855,155 | | | | |
| | | | | | | | | | | | | | | | | |
| | | | | | | | | | | | | | | | | | | | | | | |
| | | | | | | | | | | | | | | | | | | | | | | |
| | | | | | | | | | | | | | | | | |
Estimated future amortization expense related to the intangible assets at December 31, 2013 is as follows (in thousands):
| | | | |
Year ending December 31, | |
| |
|---|
2014 | | $ | 63,908 | |
2015 | | | 63,908 | |
2016 | | | 63,908 | |
2017 | | | 63,908 | |
2018 | | | 63,908 | |
Thereafter | | | 555,252 | |
| | | | |
| | | | | |
| | $ | 874,792 | |
| | | | |
| | | | | |
| | | | | |
| | | | |
14. Accrued Liabilities and Other Long-Term Liabilities
Accrued liabilities as of December 31, 2013 and 2012 consist of the following (in thousands):
| | | | | | | |
| | December 31,
2013 | | December 31,
2012 | |
|---|
Accrued property, plant and equipment | | $ | 324,641 | | $ | 276,402 | |
Interest | | | 52,683 | | | 38,647 | |
Product and operations | | | 24,505 | | | 33,501 | |
Taxes (other than income tax) | | �� | 11,528 | | | 10,168 | |
Employee compensation | | | 11,377 | | | 15,356 | |
Other | | | 13,113 | | | 16,104 | |
| | | | | | |
| | | | | | | | |
Total accrued liabilities | | $ | 437,847 | | $ | 390,178 | |
| | | | | | |
| | | | | | | | |
| | | | | | | | |
| | | | | | |
143
Table of Contents
MARKWEST ENERGY PARTNERS, L.P.
NOTES TO CONSOLIDATED FINANCIAL STATEMENTS (Continued)
14. Accrued Liabilities and Other Long-Term Liabilities (Continued)
Other long-term liabilities as of December 31, 2013 and 2012 consist of the following (in thousands):
| | | | | | | |
| | December 31,
2013 | | December 31,
2012 | |
|---|
SMR Liability (see Note 6) | | $ | 87,113 | | $ | 89,592 | |
Deferred revenue | | | 55,621 | | | 33,139 | |
Asset retirement obligation (See Note 15) | | | 9,996 | | | 8,469 | |
Other | | | 3,770 | | | 3,061 | |
| | | | | | |
| | | | | | | | |
Total other long-term liabilities | | $ | 156,500 | | $ | 134,261 | |
| | | | | | |
| | | | | | | | |
| | | | | | | | |
| | | | | | |
15. Asset Retirement Obligations
The Partnership's assets subject to asset retirement obligations are primarily certain gas-gathering pipelines and processing facilities, a crude oil pipeline and other related pipeline assets. The Partnership also has land leases that require the Partnership to return the land to its original condition upon termination of the lease. The Partnership reviews current laws and regulations governing obligations for asset retirements and leases, as well as the Partnership's leases and other agreements.
The following is a reconciliation of the changes in the asset retirement obligation from January 1, 2012 to December 31, 2013 (in thousands):
| | | | | | | |
| | December 31,
2013 | | December 31,
2012 | |
|---|
Beginning asset retirement obligation | | $ | 8,469 | | $ | 6,745 | |
Liabilities incurred | | | 799 | | | 1,052 | |
Disposals | | | (96 | ) | | — | |
Accretion expense | | | 824 | | | 672 | |
| | | | | | |
| | | | | | | | |
Ending asset retirement obligation | | $ | 9,996 | | $ | 8,469 | |
| | | | | | |
| | | | | | | | |
| | | | | | | | |
| | | | | | |
At December 31, 2013, 2012 and 2011, there were no assets legally restricted for purposes of settling asset retirement obligations. The asset retirement obligation has been recorded as part ofOther long-term liabilities in the accompanying Consolidated Balance Sheets.
In addition to recorded asset retirement obligations, the Partnership has other asset retirement obligations related to certain gathering, processing and other assets as a result of environmental and other legal requirements. The Partnership is not required to perform such work until it permanently ceases operations of the respective assets. Because the Partnership considers the operational life of these assets to be indeterminable, an associated asset retirement obligation cannot be calculated and is not recorded.
144
Table of Contents
MARKWEST ENERGY PARTNERS, L.P.
NOTES TO CONSOLIDATED FINANCIAL STATEMENTS (Continued)
16. Long-Term Debt
Debt is summarized below (in thousands):
| | | | | | | |
| | December 31,
2013 | | December 31,
2012 | |
|---|
Credit Facility | | | | | | | |
Revolving credit facility, variable interest, due September 2017(1) | | $ | — | | $ | — | |
Senior Notes | | |
| | |
| |
2018 Senior Notes, 8.75% interest, net of discount of $0 and $109, respectively, issued April and May 2008 and repaid in February 2013 | | | — | | | 81,003 | |
2020 Senior Notes, 6.75% interest, issued November 2010 and due November 2020 | | | 500,000 | | | 500,000 | |
2021 Senior Notes, 6.5% interest, net of discount of $474 and $826, respectively, issued February and March 2011 and due August 2021 | | | 324,526 | | | 499,174 | |
2022 Senior Notes, 6.25% interest, issued October 2011 and due June 2022 | | | 455,000 | | | 700,000 | |
2023A Senior Notes, 5.5% interest, net of discount of $6,455 and $7,126, respectively, issued August 2012 and due February 2023 | | | 743,545 | | | 742,874 | |
2023B Senior Notes, 4.5% interest, issued January 2013 and due July 2023 | | | 1,000,000 | | | — | |
| | | | | | |
| | | | | | | | |
Total long-term debt | | $ | 3,023,071 | | $ | 2,523,051 | |
| | | | | | |
| | | | | | | | |
| | | | | | | | |
| | | | | | |
- (1)
- Applicable interest rate was 4.75% at December 31, 2013.
On June 29, 2012, the Partnership amended its Credit Facility to increase the borrowing capacity to $1.2 billion and retained the existing accordion option, providing for potential future increases of up to an aggregate of $250.0 million upon the satisfaction of certain requirements. The term of the Credit Facility was extended one year and now matures on September 7, 2017. The Partnership incurred approximately $0, $2.5 million and $2.1 million of deferred financing costs associated with modifications of the Credit Facility during the years ended December 31, 2013, 2012 and 2011, respectively.
The borrowings under the Credit Facility bear interest at a variable interest rate, plus basis points. The variable interest rate is based either on the London interbank market rate ("LIBO Rate Loans") or the higher of (a) the prime rate set by the Facility's administrative agent, (b) the Federal Funds Rate plus 0.50% and (c) the rate for LIBO Rate Loans for a one month interest period plus 1% ("Alternate Base Rate Loans"). The basis points correspond to the Partnership's Total Leverage Ratio (which is the ratio of the Partnership's consolidated funded debt to the Partnership's adjusted consolidated EBITDA), ranging from 0.75% to 1.75% for Alternate Base Rate Loans and from 1.75% to 2.75% for LIBO Rate Loans. The Partnership may utilize up to $150.0 million of the Credit Facility for the issuance of letters of credit and $10.0 million for shorter-term swingline loans.
145
Table of Contents
MARKWEST ENERGY PARTNERS, L.P.
NOTES TO CONSOLIDATED FINANCIAL STATEMENTS (Continued)
16. Long-Term Debt (Continued)
Under the provisions of the Credit Facility and indentures, the Partnership is subject to a number of restrictions and covenants. The Credit Facility and indentures place limits on the ability of the Partnership and its restricted subsidiaries to incur additional indebtedness; declare or pay dividends or distributions or redeem, repurchase or retire equity interests or subordinated indebtedness; make investments; incur liens; create any consensual limitation on the ability of the Partnership's restricted subsidiaries to pay dividends or distributions, make loans or transfer property to the Partnership; engage in transactions with the Partnership's affiliates; sell assets, including equity interests of the Partnership's subsidiaries; make any payment on or with respect to or purchase, redeem, defease or otherwise acquire or retire for value any subordinated obligation or guarantor subordination obligation (except principal and interest at maturity); and consolidate, merge or transfer assets. The Credit Facility also limits the Partnership's ability to enter into transactions with parties that require margin calls under certain derivative instruments. Under the Credit Facility, neither the Partnership nor the bank can require margin calls for outstanding derivative positions.
Significant financial covenants under the Credit Facility include the Interest Coverage Ratio (as defined in the Credit Facility), which must be greater than 2.75 to 1.0 and the Total Leverage Ratio (as defined in the Credit Facility), which must be less than 5.5 to 1.0 in accordance with an amendment executed in December 2013. The maximum permissible Total Leverage Ratio will be 5.25 to 1.0 beginning on January 1, 2015. As of December 31, 2013, the Partnership was in compliance with these covenants. These covenants are used to calculate the available borrowing capacity on a quarterly basis. The Credit Facility is guaranteed by and collateralized by substantially all assets of the Partnership's wholly- owned subsidiaries, other than MarkWest Liberty Midstream and its subsidiaries. As of December 31, 2013, the Partnership had no borrowings outstanding and $11.3 million of letters of credit outstanding under the Credit Facility, leaving approximately $1,188.7 million available for borrowing of which approximately $704.8 million was available for borrowing based on financial covenant requirements. Additionally, the full amount of unused capacity is available for borrowing on a short-term basis to provide financial flexibility within a given fiscal quarter.
2018 Senior Notes. In April 2008, the partnership and its wholly-owned subsidiary, MarkWest Energy Finance Corporation (the "Issuers") completed a private placement, subsequently registered, of $400.0 million in aggregate principal amount of 8.75% senior unsecured notes to qualified institutional buyers under Rule 144A. In May 2008, the Partnership completed the placement of an additional $100.0 million pursuant to the indenture to the 2018 Senior Notes. The notes issued in the April 2008 and May 2008 offerings are treated as a single class of debt under this same indenture. Approximately $253.3 million and $165.6 million of the 2018 Senior Notes were redeemed in the fourth quarter and first quarter of 2011, respectfully. The Partnership received combined proceeds of approximately $488.5 million, after including initial purchasers' premium and deducting the underwriting fees and the other expenses of the offering. The 2018 Senior Notes were repaid in February 2013.
2020 Senior Notes. In November 2010, the Issuers completed a public offering of $500.0 million in aggregate principal amount of 6.75% senior unsecured notes. The 2020 Senior Notes mature on November 1, 2020 and interest is payable semi-annually in arrears on May 1 and November 1. The Partnership received proceeds of approximately $490.3 million after deducting the underwriting fees and the other third-party expenses associated with the offering.
146
Table of Contents
MARKWEST ENERGY PARTNERS, L.P.
NOTES TO CONSOLIDATED FINANCIAL STATEMENTS (Continued)
16. Long-Term Debt (Continued)
2021 Senior Notes. On February 24, 2011, the Issuers completed a public offering of $300.0 million in aggregate principal amount of 6.5% senior unsecured notes, which were issued at par. On March 10, 2011, the Issuers completed a follow-on public offering of an additional $200.0 million in aggregate principal amount of 2021 Senior Notes, which were issued at 99.5% of par and are treated as a single class of debt securities under the same indenture as the 2021 Senior Notes issued on February 24, 2011. The 2021 Senior Notes mature in August 2021 and interest is payable semi-annually in arrears on February 15 and August 15. The Partnership received aggregate net proceeds of approximately $492.4 million from the 2021 Senior Notes offerings after deducting the underwriting fees and other third-party expenses associated with the offerings. The Partnership repaid approximately $175.0 million of the 2021 Senior Notes in February 2013.
2022 Senior Notes. On November 3, 2011, the Issuers completed a public offering of $700.0 million in aggregate principal amount of 6.25% senior unsecured notes due June 2022. Interest on the 2022 Notes is payable semi-annually in arrears on June 15 and December 15, commencing June 15, 2012. The Partnership received aggregate net proceeds of approximately $688.5 million from the 2022 Senior Notes offerings, after deducting the underwriting fees and other third-party expenses. The Partnership repaid approximately $245.0 million of the 2021 Senior Notes in February 2013.
2023A Senior Notes. On August 10, 2012, the Issuers completed a public offering of $750.0 million in aggregate principal amount of 5.5% senior unsecured notes due February 2023. Interest on the 2023A Senior Notes is payable semi-annually in arrears on February 15 and August 15, commencing February 15, 2013. The Partnership received aggregate net proceeds of approximately $730.2 million from the 2023A Senior Notes offerings, after deducting the underwriting fees and other third-party expenses.
2023B Senior Notes. In January 2013, the Partnership completed a public offering for $1.0 billion in aggregate principal amount of 4.5% senior unsecured notes due July 2023. Interest on the 2023B Senior Notes is payable semi-annually in arrears on January 15 and July 15, commencing July 15, 2013. The Partnership received aggregate net proceeds of approximately $986.0 million from the 2023B Senior Notes offerings, after deducting underwriters' and third-party expenses.
The proceeds from the issuance of the 2021 and 2022 Senior Notes were used to redeem $275.0 million in aggregate principal amount of 2016 Senior Notes and $419.0 million in aggregate principal amount of 2018 Senior Notes and to provide additional working capital for general partnership purposes. The proceeds from the issuance of the 2020 Senior Notes were used to redeem the 2014 Senior Notes, repay the Credit Facility and to provide additional working capital for general partnership purposes. The proceeds from the issuance of the 2023A Senior Notes were used to repay borrowings under our Credit Facility, fund capital expenditures and provide additional working capital for general partnership purposes. The proceeds from the 2023B Senior Notes were used to repurchase the $81.1 million of the 2018 Senior Notes, approximately $175.0 million of the 2021 Senior Notes and approximately $245.0 million of the 2022 Senior Notes and to fund capital expenditures and provide general working capital.
The Partnership recorded a total pre-tax loss during 2013 of approximately $38.5 million related to repurchases of the $81.1 million of the 2018 Senior Notes, approximately $175.0 million of the 2021 Senior Notes and approximately $245.0 million of the 2022 Senior Notes. The pre-tax loss consisted of approximately $7.0 million in the first quarter of 2013 related to the non-cash write-off of the
147
Table of Contents
MARKWEST ENERGY PARTNERS, L.P.
NOTES TO CONSOLIDATED FINANCIAL STATEMENTS (Continued)
16. Long-Term Debt (Continued)
unamortized discount and deferred finance costs and approximately $31.5 million related to the payment of redemption premiums. The Partnership recorded a total pre-tax loss of approximately $79.0 million during 2011 related to the redemption of the 2016 Senior Notes and 2018 Senior Notes. The pre-tax loss consisted of approximately $7.6 million related to the non-cash write-off of the unamortized discount and deferred finance costs and approximately $71.4 million related to the payment of tender premiums and third party expenses. The losses were recorded inLoss on redemption of debt in the accompanying Consolidated Statements of Operations.
The Issuers have no independent operating assets or operations. All subsidiaries that are owned 100% by the Partnership, other than MarkWest Energy Finance Corporation and MarkWest Liberty Midstream and its subsidiaries, guarantee the Senior Notes, jointly and severally and fully and unconditionally, subject to certain customary release provisions, including:
- (1)
- in connection with any sale or other disposition of all or substantially all of a subsidiary guarantor's assets (including by way of merger or consolidation) to a third party, if the transaction does not violate the asset sale provisions of the indentures;
- (2)
- in connection with any sale or other disposition of the equity interests of a subsidiary guarantor to a third party, if the transaction does not violate the asset sale provisions of the indentures and the subsidiary guarantor is no longer a restricted subsidiary of the Partnership;
- (3)
- if the Partnership designates any subsidiary guarantor as an unrestricted subsidiary under the indentures;
- (4)
- upon legal defeasance, covenant defeasance or satisfaction and discharge of the indentures; and
- (5)
- at such time as a subsidiary guarantor no longer guarantees any other indebtedness of the Issuers or MarkWest Energy Operating Company, L.L.C. ("Operating Company") and, in the case of Operating Company, Operating Company is not an obligor of any indebtedness under the Credit Facility.
Subsidiaries that are not 100% owned by the Partnership do not guarantee the Senior Notes (see Note 25 for required consolidating financial information). The Senior Notes are senior unsecured obligations equal in right of payment with all of the Partnership's existing and future senior debt. The Senior Notes are senior in right of payment to all of the Partnership's future subordinated debt but effectively junior in right of payment to its secured debt to the extent of the assets securing the debt, including the Partnership's obligations in respect of the Credit Facility.
The indentures governing the Senior Notes limit the activity of the Partnership and the restricted subsidiaries identified in the indentures. Subject to compliance with certain covenants, the Partnership may issue additional notes from time to time under the indentures. If at any time the Senior Notes are rated investment grade by both Moody's Investors Service, Inc. and Standard & Poor's Rating Services and no default (as defined in the indentures) has occurred and is continuing, many of such covenants will terminate, in which case the Partnership and its subsidiaries will cease to be subject to such terminated covenants.
As of December 31, 2013, there are no minimum principal payments on the Senior Notes due during the next five years.
148
Table of Contents
MARKWEST ENERGY PARTNERS, L.P.
NOTES TO CONSOLIDATED FINANCIAL STATEMENTS (Continued)
17. Equity
The Partnership Agreement stipulates the circumstances under which the Partnership is authorized to issue new capital, maintain capital accounts and distribute cash and contains specific provisions for the allocation of net income and losses to each of the partners for purposes of maintaining their respective partner capital accounts.
The Partnership distributes all of its Available Cash, including the Available Cash of its subsidiaries, to all common unitholders of record within 45 days after the end of each quarter. Available Cash is generally defined as all cash and cash equivalents of the Partnership on hand at the end of each quarter, less reserves established by the general partner for future requirements, plus all cash for the quarter from working capital borrowings made after the end of the quarter. The general partner has the discretion to establish cash reserves that are necessary or appropriate to (i) provide for the proper conduct of the Partnership's business; (ii) comply with applicable law, any debt instruments or other agreements; or (iii) provide funds for distributions to unitholders and the general partner for up to the next four quarters. Class A unitholders receive distributions of Available Cash (excluding the Available Cash attributable to MarkWest Hydrocarbon). However, because all Class A unitholders are wholly-owned subsidiaries, these intercompany distributions do not impact the amount of Available Cash that can be distributed to common unitholders. Class B units are not entitled to participate in any distributions of Available Cash prior to their conversion into common units.
The quarterly cash distributions applicable to 2013, 2012 and 2011 were as follows:
| | | | | | | | | |
Quarter Ended | | Distribution Per
Common Unit | | Declaration Date | | Record Date | | Payment Date |
|---|
December 31, 2013 | | $ | 0.86 | | January 22, 2014 | | February 6, 2014 | | February 14, 2014 |
September 30, 2013 | | $ | 0.85 | | October 23, 2013 | | November 7, 2013 | | November 14, 2013 |
June 30, 2013 | | $ | 0.84 | | July 24, 2013 | | August 6, 2016 | | August 14, 2013 |
March 31, 2013 | | $ | 0.83 | | April 25, 2013 | | May 7, 2013 | | May 15, 2013 |
December 31, 2012 | | $ | 0.82 | | January 23, 2013 | | February 6, 2013 | | February 14, 2013 |
September 30, 2012 | | $ | 0.81 | | October 25, 2012 | | November 7, 2012 | | November 14, 2012 |
June 30, 2012 | | $ | 0.80 | | July 26, 2012 | | August 6, 2012 | | August 14, 2012 |
March 31, 2012 | | $ | 0.79 | | April 26, 2012 | | May 7, 2012 | | May 15, 2012 |
December 31, 2011 | | $ | 0.76 | | January 26, 2012 | | February 6, 2012 | | February 14, 2012 |
September 30, 2011 | | $ | 0.73 | | October 18, 2011 | | November 7, 2011 | | November 14, 2011 |
June 30, 2011 | | $ | 0.70 | | July 21, 2011 | | August 1, 2011 | | August 12, 2011 |
March 31, 2011 | | $ | 0.67 | | April 21, 2011 | | May 2, 2011 | | May 13, 2011 |
149
Table of Contents
MARKWEST ENERGY PARTNERS, L.P.
NOTES TO CONSOLIDATED FINANCIAL STATEMENTS (Continued)
17. Equity (Continued)
The public equity offerings completed during the years ended December 31, 2013, 2012 and 2011 were as follows (in millions):
| | | | | | | |
Closing date of offering | | Common
units(1) | | Net
proceeds(2) | |
|---|
January 14, 2011 | | | 3.5 | | $ | 138 | |
July 13, 2011 | | | 4.0 | | $ | 185 | |
October 13, 2011 | | | 5.8 | | $ | 251 | |
December 19, 2011 | | | 10.0 | | $ | 521 | |
January 13, 2012 | | | 0.7 | | $ | 38 | |
March 16, 2012 | | | 6.8 | | $ | 388 | |
May 14, 2012(3) | | | 8.0 | | $ | 427 | |
August 17, 2012 | | | 6.9 | | $ | 338 | |
November 19, 2012 | | | 9.8 | | $ | 437 | |
November 2012 ATM(4) | | | 9.4 | | $ | 590 | |
August 2013 ATM(5) | | | 5.9 | | $ | 396 | |
September 2013 ATM(6) | | | 10.9 | | $ | 718 | |
- (1)
- Includes the full exercise of the underwriters' overallotment option unless otherwise noted.
- (2)
- Net proceeds from equity offerings were used to repay borrowings under the Credit Facility, to fund acquisitions and capital expenditures and to provide working capital for general partnership purposes.
- (3)
- The underwriters' did not exercise their over-allotment option for this offering.
- (4)
- Commencing in November 2012, the Partnership implemented the November 2012 ATM with a financial institution (the "Manager") which allows the Partnership from time to time, through the Manager as its sales agent, to offer and sell common units representing limited partner interests in the Partnership having an aggregate offering price of up to $600.0 million. Sales of such common units are made by means of ordinary brokers' transactions on the NYSE at market prices, in block transactions or as otherwise agreed upon by the Manager and the Partnership. The Partnership may also sell common units to the Manager as principal for its own account at a price to be agreed upon at the time of the sale. For any such sales, the Partnership will enter into a separate agreement with the Manager. Common units sold in 2013 totaled 9.3 million raising $584 million. Common units sold in 2012 totaled 0.1 million raising $6 million.
- (5)
- In August 2013, we entered into an Equity Distribution Agreement with the Manager that established the $400.0 million August 2013 ATM.
- (6)
- In September 2013, we entered into the September 2013 ATM with the Manager that established a $1.0 billion ATM program.
150
Table of Contents
MARKWEST ENERGY PARTNERS, L.P.
NOTES TO CONSOLIDATED FINANCIAL STATEMENTS (Continued)
17. Equity (Continued)
On July 1, 2013, approximately 4.0 million Class B units converted to common units. All of the Partnership's Class B units were issued to and are held by M&R MWE Liberty, LLC, an affiliate of EMG, as part of the Partnership's December 31, 2011 acquisition of the non-controlling interest in MarkWest Liberty Midstream. The remaining Class B units will convert to common units on a one-for-one basis in four equal installments beginning on July 1, 2014 and each of the next three anniversaries of such date.
18. Commitments and Contingencies
The Partnership is subject to a variety of risks and disputes, and is a party to various legal proceedings in the normal course of its business. The Partnership maintains insurance policies in amounts and with coverage and deductibles that it believes are reasonable and prudent. However, the Partnership cannot assure that the insurance companies will promptly honor their policy obligations or that the coverage or levels of insurance will be adequate to protect the Partnership from all material expenses related to future claims for property loss or business interruption to the Partnership, or for third-party claims of personal injury and property damage, or that the coverages or levels of insurance it currently has will be available in the future at economical prices. While it is not possible to predict the outcome of the legal actions with certainty, management is of the opinion that appropriate provisions and accruals for potential losses associated with all legal actions have been made in the consolidated financial statements and that none of these actions, either individually or in the aggregate, will have a material adverse effect on the Partnership's financial condition, liquidity or results of operation.
Certain natural gas processing and gathering arrangements require the Partnership to construct new natural gas processing plants, natural gas gathering pipelines and NGL pipelines and contain certain fees and charges if specified construction milestones are not achieved for reasons other than force majeure. In certain cases, certain producers may have the right to cancel the processing arrangements if there are significant delays that are not due to force majeure. As of December 31, 2013, management does not believe there are any indications that the Partnership will not be able to meet the construction milestones or that force majeure does not apply.
151
Table of Contents
MARKWEST ENERGY PARTNERS, L.P.
NOTES TO CONSOLIDATED FINANCIAL STATEMENTS (Continued)
18. Commitments and Contingencies (Continued)
The Partnership has various non-cancellable operating lease agreements and a long-term propane storage agreement expiring at various times through fiscal year 2040. Annual expense under these agreements was $25.8 million, $20.8 million and $15.0 million for the years ended December 31, 2013, 2012 and 2011, respectively. The minimum future payments under these agreements as of December 31, 2013 are as follows (in thousands):
| | | | |
Year ending December 31, | |
| |
|---|
2014 | | $ | 20,557 | |
2015 | | | 17,014 | |
2016 | | | 15,144 | |
2017 | | | 14,534 | |
2018 | | | 11,405 | |
2019 and thereafter | | | 62,552 | |
| | | | |
| | | | | |
| | $ | 141,206 | |
| | | | |
| | | | | |
| | | | | |
| | | | |
On September 1, 2009, the Partnership entered into a product supply agreement creating a long-term contractual obligation for the payment of processing fees in exchange for the entire product processed by the SMR (see Note 6 for further discussion of this agreement and the related SMR Transaction). The product received under this agreement is sold to a refinery customer pursuant to a corresponding long-term agreement. The minimum amounts payable annually under the product supply agreement, excluding the potential impact of inflation adjustments per the agreement, are as follows (in thousands):
| | | | |
Year ending December 31, | |
| |
|---|
2014 | | $ | 17,412 | |
2015 | | | 17,412 | |
2016 | | | 17,412 | |
2017 | | | 17,412 | |
2018 | | | 17,412 | |
2019 and thereafter | | | 195,205 | |
| | | | |
| | | | | |
Total minimum payments | | | 282,265 | |
Less: Services element | | | (107,974 | ) |
Less: Interest | | | (84,699 | ) |
| | | | |
| | | | | |
Total SMR liability | | | 89,592 | |
Less: Current portion of SMR Liability | | | (2,479 | ) |
| | | | |
| | | | | |
Long-term portion of SMR Liability | | $ | 87,113 | |
| | | | |
| | | | | |
| | | | | |
| | | | |
152
Table of Contents
MARKWEST ENERGY PARTNERS, L.P.
NOTES TO CONSOLIDATED FINANCIAL STATEMENTS (Continued)
19. Lease Operations
Based on the terms of certain natural gas gathering, transportation and processing agreements, the Partnership is considered to be the lessor under several implicit operating lease arrangements in accordance with GAAP. The Partnership's primary implicit lease operations relate to a natural gas gathering agreement in the Marcellus segment for which it earns a fixed-fee for providing gathering services to a single producer using a dedicated gathering system. As the gathering system is expanded, the fixed-fee charged to the producer is adjusted to include the additional gathering assets in the lease. The primary term of the natural gas gathering arrangement expires in 2024 and will continue thereafter on a year to year basis until terminated by either party. Other significant implicit leases relate to a natural gas processing agreement in the Marcellus segment and a natural gas processing agreement in the Northeast segment for which the Partnership earns minimum monthly fees for providing processing services to a single producer using a dedicated processing plant. The primary term of these natural gas processing agreements expire between 2023 and 2025.
The Partnership's revenue from its implicit lease arrangements, excluding executory costs, totaled approximately $122.9 million, $84.0 million and $67.4 million for the years ended December 31, 2013, 2012 and 2011, respectively. The Partnership's implicit lease arrangements related to the processing facilities contain contingent rental provisions whereby the Partnership receives additional fees if the producer customer exceeds the monthly minimum processed volumes. During the years ended December 31, 2013 and 2012, the Partnership received approximately $16.9 million and $15.2 million in contingent lease payments, respectively. The following is a schedule of minimum future rentals on the non-cancellable operating leases as of December 31, 2013 (in thousands):
| | | | |
Year ending December 31, | |
| |
|---|
2014 | | $ | 111,739 | |
2015 | | | 110,025 | |
2016 | | | 110,445 | |
2017 | | | 110,445 | |
2018 | | | 110,445 | |
2019 and thereafter | | | 504,779 | |
| | | | |
| | | | | |
Total minimum future rentals | | $ | 1,057,878 | |
| | | | |
| | | | | |
| | | | | |
| | | | |
The following schedule provides an analysis of the Partnership's investment in assets held for operating lease by major classes as of December 31, 2013 and 2012 (in thousands):
| | | | | | | |
| | December 31,
2013 | | December 31,
2012 | |
|---|
Natural gas gathering and NGL transportation pipelines and facilities | | $ | 755,136 | | $ | 737,500 | |
Natural gas processing facilities | | | 374,312 | | | 123,076 | |
Construction in progress | | | 119,006 | | | 203,863 | |
| | | | | | |
| | | | | | | | |
Property, plant and equipment | | | 1,248,454 | | | 1,064,439 | |
Less: accumulated depreciation | | | (130,041 | ) | | (78,343 | ) |
| | | | | | |
| | | | | | | | |
Total property, plant and equipment, net | | $ | 1,118,413 | | $ | 986,096 | |
| | | | | | |
| | | | | | | | |
| | | | | | | | |
| | | | | | |
153
Table of Contents
MARKWEST ENERGY PARTNERS, L.P.
NOTES TO CONSOLIDATED FINANCIAL STATEMENTS (Continued)
20. Incentive Compensation Plans
The following table summarizes the share-based compensation plans administered by the Compensation Committee of the Board ("Compensation Committee") that were active during the periods presented in the accompanying Consolidated Statements of Operations:
| | | | | | | | | | |
Share-based compensation plan | | Award
Classification | | Further awards
authorized for
issuance under
plan as of
December 31,
2013 | | Awards
outstanding
under the
plan as of
December 31,
2013 | | Final Year
of Activity | |
|---|
2008 Long-Term Incentive Plan ("2008 LTIP") | | Equity | | Yes | | Yes | | | N/A | |
Long-Term Incentive Plan ("2002 LTIP") | | Liability | | No | | No | | | 2011 | |
Compensation Expense
Total compensation expense recorded for share-based pay arrangements was as follows (in thousands):
| | | | | | | | | | |
| | Year ended December 31, | |
|---|
| | 2013 | | 2012 | | 2011 | |
|---|
Phantom units | | $ | 16,282 | | $ | 14,615 | | $ | 13,479 | |
Distribution equivalent rights(1) | | | 77 | | | 41 | | | 446 | |
| | | | | | | | |
| | | | | | | | | | | |
Total compensation expense | | $ | 16,359 | | $ | 14,656 | | $ | 13,925 | |
| | | | | | | | |
| | | | | | | | | | | |
| | | | | | | | | | | |
| | | | | | | | |
- (1)
- A distribution equivalent right is a right, granted in tandem with a specific phantom unit, to receive an amount in cash equal to and at the same time as, the cash distributions made by the Partnership with respect to a unit during the period such phantom unit is outstanding. Payment of distribution equivalent rights associated with units that are expected to vest are recorded as capital distributions, however, payments associated with units that are not expected to vest are recorded as compensation expense.
Compensation expense under the share-based compensation plans has been recorded as eitherSelling, general and administrative expenses orFacility expenses in the accompanying Consolidated Statements of Operations.
As of December 31, 2013, total compensation expense not yet recognized related to the unvested awards under the 2008 LTIP was approximately $15.4 million, with a weighted average remaining vesting period of approximately 0.9 years.
2008 LTIP
The 2008 LTIP was approved by unitholders on February 21, 2008. The 2008 LTIP provides 3.7 million common units for issuance to the Corporation's employees and affiliates as share-based payment awards. The 2008 LTIP was created to attract and retain highly qualified officers, directors and other key individuals and to motivate them to serve the General Partner, the Partnership and their affiliates and to expend maximum effort to improve the business results and earnings of the Partnership and its affiliates. Awards authorized under the 2008 LTIP include unrestricted units, restricted units,
154
Table of Contents
MARKWEST ENERGY PARTNERS, L.P.
NOTES TO CONSOLIDATED FINANCIAL STATEMENTS (Continued)
20. Incentive Compensation Plans (Continued)
phantom units, distribution equivalent rights and performance awards to be granted in any combination.
TSR Performance Units. In April 2010, the Board granted 282,000 TSR Performance Units under the 2008 LTIP to senior executives and other key employees. The TSR Performance Units are classified as equity awards and do not contain distribution equivalent rights. The TSR Performance Units vested in equal installments on January 31, 2011 and January 31, 2012, based on the Partnership's relative total unitholder return (unit price appreciation and distribution performance) over the three-year calendar period prior to the scheduled vesting date compared to the total unitholder return of a defined group of peer companies over the same period ("Market Criteria"). In January 2011 and 2012, 141,000 TSR Performance Units vested based on the Market Criteria and the Board exercised its discretion to issue and immediately vest an additional 35,250 units.
Compensation expense related to the TSR Performance Units that vested solely based on the Market Criteria was recognized over the requisite service period based on the fair value of the units as of the grant date. However, a grant date, as defined by GAAP, was not established for the TSR Performance Units that vest based on a combination of the Market Criteria and performance criteria until the Board exercised its discretion because the performance criteria prevents a mutual understanding of the key terms of the award. Therefore, compensation expense related to this portion of the TSR Performance Units was recognized over the requisite service period based on the fair value of the units as of each reporting date. The requisite service period for all TSR Performance Units began in April 2010 when the Board approved the awards. TSR Compensation expense recognized related to TSR Performance Units was approximately zero, $2.2 million and $4.8 million for the years ended December 31, 2013, 2012 and 2011, respectively.
The fair value of the TSR Performance Units was measured at each appropriate measurement date using a Monte Carlo simulation model that estimated the most likely outcome based on the terms of the award. The key inputs in the model include the market price of the Partnership's common units as of the valuation date, the historical volatility of the market price of the Partnership's common units, the historical volatility of the market price of the common units or common stock of the peer companies and the correlation between changes in the market price of the Partnership's common units and those of the peer companies.
Summary of Equity Awards
Awards under the 2008 LTIP qualify as equity awards. Accordingly, the fair value is measured at the grant date using the market price of the Partnership's common units. A phantom unit entitles an employee to receive a common unit upon vesting. The Partnership generally issues new common units upon vesting of phantom units. Phantom unit awards generally vest in equal tranches over a three-year period or cliff vest after three years. For service-based awards, compensation expense related to each tranche is recognized over its requisite service period, reduced for an estimate of expected forfeitures. Compensation expense related to performance-based awards is recognized when probability of vesting is established. As part of a net settlement option, employees may elect to surrender a certain number of phantom units and in exchange, the Partnership assumes the income tax withholding obligations related to the vesting. Phantom units surrendered for the payment of income tax withholdings will again become available for issuance under the plan from which the awards were initially granted, provided that further awards are authorized for issuance under the plan. The Partnership was required
155
Table of Contents
MARKWEST ENERGY PARTNERS, L.P.
NOTES TO CONSOLIDATED FINANCIAL STATEMENTS (Continued)
20. Incentive Compensation Plans (Continued)
to pay approximately $5.2 million, $8.1 million and $6.0 million during the years ended December 31, 2013, 2012 and 2011, respectively, for income tax withholdings related to the vesting of equity awards. The Partnership received no proceeds from the issuance of phantom units and none of the phantom units that vested were redeemed by the Partnership for cash.
The following is a summary of all phantom unit activity under the 2008 LTIP for the year ended December 31, 2013:
| | | | | | | |
| | Number of
Units | | Weighted-
average
Grant-date
Fair Value | |
|---|
Unvested at December 31, 2012 | | | 687,576 | | $ | 45.79 | |
Granted | | | 342,489 | | | 57.48 | |
Vested | | | (260,113 | ) | | 38.78 | |
Forfeited | | | (12,443 | ) | | 53.38 | |
| | | | | | | |
| | | | | | | | |
Unvested at December 31, 2013 | | | 757,509 | | | 53.36 | |
| | | | | | | |
| | | | | | | | |
| | | | | | | | |
| | | | | | | |
The total fair value and intrinsic value of the phantom units vested under the 2008 LTIP was $10.1 million, $10.4 million and $10.7 million during the years ended December 31, 2013, 2012 and 2011, respectively. The total fair value and intrinsic value of the TSR Performance Units vested was zero, $6.5 million and $4.9 million during the years ended December 31, 2013, 2012 and 2011, respectively.
2002 LTIP
The phantom units awarded under the 2002 LTIP are classified as liability awards. Accordingly, the fair value of the outstanding awards is re-measured at the end of each reporting period using the market price of the Partnership's common units. The fair value of the phantom units awarded is amortized into earnings as compensation expense over the vesting period, which is generally three years. A phantom unit entitles an employee to receive a common unit upon vesting or at the discretion of the Compensation Committee, the cash equivalent to the value of a common unit. The Partnership generally issues new common units upon the vesting of phantom units. As part of a net settlement option, employees may elect to surrender a certain number of phantom units and in exchange, the Partnership assumes the income tax withholding obligations related to the vesting. The Partnership received no proceeds for issuing phantom units and none of the phantom units that vested were redeemed by the Partnership for cash. The amounts paid by the Partnership for income tax withholdings related to the vesting of awards under the 2002 LTIP were $0.4 million for the year ended December 31, 2011. The total fair value and intrinsic value of the phantom units vested under the 2002 LTIP was $1.0 million during the year ended December 31, 2011.
21. Employee Benefit Plan
All employees dedicated to, or otherwise principally supporting the Partnership are employees of MarkWest Hydrocarbon, and substantially all of these employees are participants in MarkWest Hydrocarbon's defined contribution benefit plan. The employer matching contribution expense related to this plan was $4.2 million, $3.2 million and $2.7 million for the years ended December 31, 2013, 2012 and 2011, respectively.
156
Table of Contents
MARKWEST ENERGY PARTNERS, L.P.
NOTES TO CONSOLIDATED FINANCIAL STATEMENTS (Continued)
22. Income Tax
The components of the provision for income tax expense (benefit) are as follows (in thousands):
| | | | | | | | | | |
| | Year ended December 31, | |
|---|
| | 2013 | | 2012 | | 2011 | |
|---|
Current income tax (benefit) expense: | | | | | | | | | | |
Federal | | $ | (11,078 | ) | $ | (2,964 | ) | $ | 15,039 | |
State | | | (130 | ) | | 598 | | | 2,539 | |
| | | | | | | | |
| | | | | | | | | | | |
Total current | | | (11,208 | ) | | (2,366 | ) | | 17,578 | |
| | | | | | | | |
| | | | | | | | | | | |
Deferred income tax expense (benefit): | | | | | | | | | | |
Federal | | | 24,382 | | | 38,531 | | | (4,732 | ) |
State | | | (505 | ) | | 2,163 | | | 803 | |
| | | | | | | | |
| | | | | | | | | | | |
Total deferred | | | 23,877 | | | 40,694 | | | (3,929 | ) |
| | | | | | | | |
| | | | | | | | | | | |
Provision for income tax | | $ | 12,669 | | $ | 38,328 | | $ | 13,649 | |
| | | | | | | | |
| | | | | | | | | | | |
| | | | | | | | | | | |
| | | | | | | | |
A reconciliation of the provision for income tax and the amount computed by applying the federal statutory rate of 35% to the income before income taxes for each of the years ended December 31, 2013, 2012 and 2011 is as follows (in thousands):
Year ended December 31, 2013:
| | | | | | | | | | | | | |
| | Corporation | | Partnership | | Eliminations | | Consolidated | |
|---|
Income before provision for income tax | | $ | 31,145 | | $ | 42,131 | | $ | (20,162 | ) | $ | 53,114 | |
| | | | | | | | | | | | | |
| | | | | | | | | | | | | | |
| | | | | | | | | | | | | | |
| | | | | | | | | | | | | |
Federal statutory rate | | | 35 | % | | 0 | % | | 0 | % | | | |
| | | | | | | | | | | |
| | | | | | | | | | | | | | |
Federal income tax at statutory rate | | | 10,901 | | | — | | | — | | $ | 10,901 | |
Permanent items | | | 40 | | | — | | | — | | | 40 | |
State income taxes net of federal benefit | | | (729 | ) | | 39 | | | — | | | (690 | ) |
Prior period adjustments and tax rate changes | | | (147 | ) | | — | | | — | | | (147 | ) |
Provision on income from Class A units(1) | | | 2,617 | | | — | | | — | | | 2,617 | |
Other | | | (52 | ) | | — | | | — | | | (52 | ) |
| | | | | | | | | | |
| | | | | | | | | | | | | | |
Provision for income tax | | $ | 12,630 | | $ | 39 | | $ | — | | $ | 12,669 | |
| | | | | | | | | | |
| | | | | | | | | | | | | | |
| | | | | | | | | | | | | | |
| | | | | | | | | | |
157
Table of Contents
MARKWEST ENERGY PARTNERS, L.P.
NOTES TO CONSOLIDATED FINANCIAL STATEMENTS (Continued)
22. Income Tax (Continued)
Year ended December 31, 2012:
| | | | | | | | | | | | | |
| | Corporation | | Partnership | | Eliminations | | Consolidated | |
|---|
Income before provision for income tax | | $ | 74,192 | | $ | 178,817 | | $ | 2,284 | | $ | 255,293 | |
| | | | | | | | | | | | | |
| | | | | | | | | | | | | | |
| | | | | | | | | | | | | | |
| | | | | | | | | | | | | |
Federal statutory rate | | | 35 | % | | 0 | % | | 0 | % | | | |
| | | | | | | | | | | |
| | | | | | | | | | | | | | |
Federal income tax at statutory rate | | | 25,967 | | | — | | | — | | $ | 25,967 | |
Permanent items | | | 28 | | | — | | | — | | | 28 | |
State income taxes net of federal benefit | | | 688 | | | 1,689 | | | — | | | 2,377 | |
Current year change in valuation allowance | | | (5 | ) | | — | | | — | | | (5 | ) |
Prior period adjustments and tax rate changes | | | (2,517 | ) | | — | | | — | | | (2,517 | ) |
Provision on income from Class A units(1) | | | 12,412 | | | — | | | — | | | 12,412 | |
Other | | | 66 | | | — | | | — | | | 66 | |
| | | | | | | | | | |
| | | | | | | | | | | | | | |
Provision for income tax | | $ | 36,639 | | $ | 1,689 | | $ | — | | $ | 38,328 | |
| | | | | | | | | | |
| | | | | | | | | | | | | | |
| | | | | | | | | | | | | | |
| | | | | | | | | | |
Year ended December 31, 2011:
| | | | | | | | | | | | | |
| | Corporation | | Partnership | | Eliminations | | Consolidated | |
|---|
Income before provision for income tax | | $ | 3,813 | | $ | 122,642 | | $ | (8,006 | ) | $ | 118,449 | |
| | | | | | | | | | | | | |
| | | | | | | | | | | | | | |
| | | | | | | | | | | | | | |
| | | | | | | | | | | | | |
Federal statutory rate | | | 35 | % | | 0 | % | | 0 | % | | | |
| | | | | | | | | | | |
| | | | | | | | | | | | | | |
Federal income tax at statutory rate | | | 1,335 | | | — | | | — | | $ | 1,335 | |
Permanent items | | | 36 | | | — | | | — | | | 36 | |
State income taxes net of federal benefit | | | 102 | | | 2,742 | | | — | | | 2,844 | |
Current year change in valuation allowance | | | (64 | ) | | — | | | — | | | (64 | ) |
Prior period adjustments and tax rate changes | | | 163 | | | — | | | — | | | 163 | |
Provision on income from Class A units(1) | | | 9,323 | | | — | | | — | | | 9,323 | |
Other | | | 12 | | | — | | | — | | | 12 | |
| | | | | | | | | | |
| | | | | | | | | | | | | | |
Provision for income tax | | $ | 10,907 | | $ | 2,742 | | $ | — | | $ | 13,649 | |
| | | | | | | | | | |
| | | | | | | | | | | | | | |
| | | | | | | | | | | | | | |
| | | | | | | | | | |
- (1)
- The Corporation and the General Partner own Class A units of the Partnership that were received in the merger of the Corporation and the Partnership completed in February 2008. The Class A units share, on a pro-rata basis, in income or loss of the Partnership, except for items attributable to the Partnership's ownership or sale of shares of the Corporation's common stock (as discussed in Note 2). The provision for income tax on income from Class A units includes intra period allocations to continued operations and excludes allocations to equity.
158
Table of Contents
MARKWEST ENERGY PARTNERS, L.P.
NOTES TO CONSOLIDATED FINANCIAL STATEMENTS (Continued)
22. Income Tax (Continued)
The deferred tax assets and liabilities resulting from temporary book-tax differences are comprised of the following (in thousands):
| | | | | | | |
| | December 31, | |
|---|
| | 2013 | | 2012 | |
|---|
Current deferred tax assets: | | | | | | | |
Accruals and reserves | | $ | 221 | | $ | 98 | |
Derivative instruments | | | 4,845 | | | 5,183 | |
Net operating loss carryforward | | | 18,134 | | | — | |
Capital loss carryforward | | | 904 | | | — | |
State tax credit | | | 74 | | | — | |
| | | | | | |
| | | | | | | | |
Current deferred tax assets | | | 24,178 | | | 5,281 | |
Valuation allowance | | | (978 | ) | | — | |
| | | | | | |
| | | | | | | | |
Deferred income taxes | | | 23,200 | | | 5,281 | |
| | | | | | |
| | | | | | | | |
Long-term deferred tax assets: | | | | | | | |
Accruals and reserves | | | 329 | | | 113 | |
Derivative instruments | | | 10,102 | | | 9,915 | |
Phantom unit compensation | | | 3,328 | | | 2,624 | |
Capital loss carryforward | | | — | | | 904 | |
Net operating loss carryforward | | | 9,283 | | | 1 | |
| | | | | | |
| | | | | | | | |
Long-term deferred tax assets | | | 23,042 | | | 13,557 | |
Valuation allowance | | | — | | | (904 | ) |
| | | | | | |
| | | | | | | | |
Net long-term deferred tax assets | | | 23,042 | | | 12,653 | |
| | | | | | |
| | | | | | | | |
Long-term deferred tax liabilities: | | | | | | | |
Property, plant and equipment and intangibles | | | (4,755 | ) | | (3,861 | ) |
Investment in affiliated groups | | | (305,853 | ) | | (198,220 | ) |
| | | | | | |
| | | | | | | | |
Long-term deferred tax liabilities | | | (310,608 | ) | | (202,081 | ) |
| | | | | | |
| | | | | | | | |
Long-term subtotal | | | (287,566 | ) | | (189,428 | ) |
| | | | | | |
| | | | | | | | |
Net deferred tax liability | | $ | (264,366 | ) | $ | (184,147 | ) |
| | | | | | |
| | | | | | | | |
| | | | | | | | |
| | | | | | |
Significant judgment is required in evaluating tax positions and determining the Corporation's provision for income taxes. During the ordinary course of business, there may be transactions and calculations for which the ultimate tax determination is uncertain. However, the Corporation did not have any material uncertain tax positions for the years ended December 31, 2013, 2012 or 2011. As of December 31, 2013, the Corporation had NOL carryforwards for federal and state income tax purposes of approximately $26.5 million and $1.5 million, respectively. The federal NOL carryforwards expire in 20 years and the state NOL carryforwards expire from 5 to 20 years. Included in the NOL carryforwards is approximately $0.6 million attributable to tax deductions related to equity compensation in excess of compensation recognized for financial reporting. As of December 31, 2013, the Corporation had a capital loss carryforward of approximately $0.9 million and a state tax credit of $0.1 million, respectively, that expire in 2014. The Corporation does not anticipate utilizing this capital loss carryforward or state tax credit and has provided a 100% valuation allowance against this deferred
159
Table of Contents
MARKWEST ENERGY PARTNERS, L.P.
NOTES TO CONSOLIDATED FINANCIAL STATEMENTS (Continued)
22. Income Tax (Continued)
tax asset. While the Corporation's consolidated federal tax return and any significant state tax returns are not currently under examination, the tax years 2009 through 2012 remain open to examination by the major taxing jurisdictions to which the Corporation is subject.
23. Earnings Per Common Unit
The following table shows the computation of basic and diluted net income per common unit, for the years ended December 31, 2013, 2012 and 2011, respectively, and the weighted average units used to compute diluted net income per common unit (in thousands, except per unit data):
| | | | | | | | | | |
| | Year ended December 31, | |
|---|
| | 2013 | | 2012 | | 2011 | |
|---|
Net income attributable to the Partnership's unitholders | | $ | 38,077 | | $ | 220,402 | | $ | 60,695 | |
Less: Income allocable to phantom units | | | (2,342 | ) | | (2,142 | ) | | (1,749 | ) |
| | | | | | | | |
| | | | | | | | | | | |
Income available for common unitholders—basic | | | 35,735 | | | 218,260 | | | 58,946 | |
Add: Income allocable to phantom units and DER expense(1) | | | 2,419 | | | 2,183 | | | — | |
| | | | | | | | |
| | | | | | | | | | | |
Income available for common unitholders—diluted | | $ | 38,154 | | $ | 220,443 | | $ | 58,946 | |
| | | | | | | | |
| | | | | | | | | | | |
| | | | | | | | | | | |
| | | | | | | | |
Weighted average common units outstanding—basic | | | 138,409 | | | 109,979 | | | 78,466 | |
Potential common units (Class B and phantom units)(1) | | | 22,034 | | | 20,669 | | | 153 | |
| | | | | | | | |
| | | | | | | | | | | |
Weighted average common units outstanding—diluted | | | 160,443 | | | 130,648 | | | 78,619 | |
| | | | | | | | |
| | | | | | | | | | | |
| | | | | | | | | | | |
| | | | | | | | |
Net income attributable to the Partnership's common unitholders per common unit(2)(3) | | | | | | | | | | |
Basic | | $ | 0.26 | | $ | 1.98 | | $ | 0.75 | |
Diluted | | $ | 0.24 | | $ | 1.69 | | $ | 0.75 | |
- (1)
- In 2013 and 2012, the use of the if converted method is more dilutive, therefore, income allocable to phantom units and DER expense included in the calculation of diluted earnings per unit and the phantom units are included in the potential common units.
- (2)
- For the year ended December 31, 2011, dilutive instruments include TSR Performance Units and are based on the number of units, if any, which would be issuable at the end of the respective reporting period, assuming that date was the end of the contingency period. See Note 20 for further discussion of TSR Performance Units.
- (3)
- Earnings per Class B units equals zero as Class B unitholders are not entitled to receive distributions and, therefore, no income is allocable to Class B units under the two class method.
24. Segment Information
The Partnership's chief operating decision maker is the chief executive officer ("CEO"). The CEO reviews the Partnership's discrete financial information on a geographic and operational basis, as the products and services are closely related within each geographic region and business operation. Accordingly, the CEO makes operating decisions, assesses financial performance and allocates resources on a geographical basis. The Partnership has the following segments: Marcellus, Utica, Northeast and Southwest. The Marcellus segment, which was referred to as the Liberty segment in
160
Table of Contents
MARKWEST ENERGY PARTNERS, L.P.
NOTES TO CONSOLIDATED FINANCIAL STATEMENTS (Continued)
24. Segment Information (Continued)
prior years, has operations in Pennsylvania and northern West Virginia. The Utica segment has operations in Ohio. The Northeast segment has operations in Kentucky, southern West Virginia and Michigan. The Southwest segment has operations in Texas, Oklahoma, Louisiana and New Mexico. All segments provide gathering, processing, transportation and storage services. The Marcellus, Northeast and Southwest segments also provide and the Utica segment will provide, fractionation services. The Partnership prepares segment information in accordance with GAAP. Certain items belowIncome from operations in the accompanying Consolidated Statements of Operations, certain compensation expense, certain other non-cash items and any gains (losses) from derivative instruments are not allocated to individual segments. Management does not consider these items allocable to or controllable by any individual segment and, therefore, excludes these items when evaluating segment performance. Segment results are also adjusted to exclude the portion of operating income attributable to the non-controlling interests.
The tables below present information about operating income and capital expenditures for the reported segments for the years ended December 31, 2013, 2012 and 2011 (in thousands):
Year ended December 31, 2013:
| | | | | | | | | | | | | | | | |
| | Marcellus | | Utica | | Northeast | | Southwest | | Total | |
|---|
Segment revenue | | $ | 527,073 | | $ | 26,442 | | $ | 204,326 | | $ | 935,426 | | $ | 1,693,267 | |
Purchased product costs | | | (100,262 | ) | | — | | | (65,192 | ) | | (525,711 | ) | | (691,165 | ) |
| | | | | | | | | | | | |
| | | | | | | | | | | | | | | | | |
Net operating margin | | | 426,811 | | | 26,442 | | | 139,134 | | | 409,715 | | | 1,002,102 | |
Facility expenses | | | (108,781 | ) | | (35,081 | ) | | (28,425 | ) | | (127,112 | ) | | (299,399 | ) |
Portion of operating loss (income) attributable to non-controlling interests | | | — | | | 3,499 | | | — | | | (21 | ) | | 3,478 | |
| | | | | | | | | | | | |
| | | | | | | | | | | | | | | | | |
Operating income (loss) before items not allocated to segments | | $ | 318,030 | | $ | (5,140 | ) | $ | 110,709 | | $ | 282,582 | | $ | 706,181 | |
| | | | | | | | | | | | |
| | | | | | | | | | | | | | | | | |
| | | | | | | | | | | | | | | | | |
| | | | | | | | | | | | |
Capital expenditures | | $ | 1,613,580 | | $ | 1,242,158 | | $ | 4,586 | | $ | 175,565 | | $ | 3,035,889 | |
Capital expenditures not allocated to segments | | | | | | | | | | | | | | | 11,067 | |
| | | | | | | | | | | | | | | | |
| | | | | | | | | | | | | | | | | |
Total capital expenditures | | | | | | | | | | | | | | $ | 3,046,956 | |
| | | | | | | | | | | | | | | | |
| | | | | | | | | | | | | | | | | |
| | | | | | | | | | | | | | | | | |
| | | | | | | | | | | | | | | | |
161
Table of Contents
MARKWEST ENERGY PARTNERS, L.P.
NOTES TO CONSOLIDATED FINANCIAL STATEMENTS (Continued)
24. Segment Information (Continued)
Year ended December 31, 2012:
| | | | | | | | | | | | | | | | |
| | Marcellus | | Utica | | Northeast | | Southwest | | Total | |
|---|
Segment revenue | | $ | 319,867 | | $ | 571 | | $ | 225,818 | | $ | 842,958 | | $ | 1,389,214 | |
Purchased product costs | | | (74,024 | ) | | — | | | (68,402 | ) | | (387,902 | ) | | (530,328 | ) |
| | | | | | | | | | | | |
| | | | | | | | | | | | | | | | | |
Net operating margin | | | 245,843 | | | 571 | | | 157,416 | | | 455,056 | | | 858,886 | |
Facility expenses | | | (65,825 | ) | | (3,968 | ) | | (24,106 | ) | | (122,691 | ) | | (216,590 | ) |
Portion of operating loss (income) attributable to non-controlling interests | | | — | | | 1,359 | | | — | | | (176 | ) | | 1,183 | |
| | | | | | | | | | | | |
| | | | | | | | | | | | | | | | | |
Operating income (loss) before items not allocated to segments | | $ | 180,018 | | $ | (2,038 | ) | $ | 133,310 | | $ | 332,189 | | $ | 643,479 | |
| | | | | | | | | | | | |
| | | | | | | | | | | | | | | | | |
| | | | | | | | | | | | | | | | | |
| | | | | | | | | | | | |
Capital expenditures | | $ | 1,458,323 | | $ | 233,018 | | $ | 84,542 | | $ | 169,440 | | $ | 1,945,323 | |
Capital expenditures not allocated to segments | | | | | | | | | | | | | | | 5,001 | |
| | | | | | | | | | | | | | | | |
| | | | | | | | | | | | | | | | | |
Total capital expenditures | | | | | | | | | | | | | | $ | 1,950,324 | |
| | | | | | | | | | | | | | | | |
| | | | | | | | | | | | | | | | | |
| | | | | | | | | | | | | | | | | |
| | | | | | | | | | | | | | | | |
Year ended December 31, 2011:
| | | | | | | | | | | | | |
| | Marcellus | | Northeast | | Southwest | | Total | |
|---|
Segment revenue | | $ | 248,949 | | $ | 268,884 | | $ | 1,018,706 | | $ | 1,536,539 | |
Purchased product costs | | | (83,847 | ) | | (91,612 | ) | | (506,911 | ) | | (682,370 | ) |
| | | | | | | | | | |
| | | | | | | | | | | | | | |
Net operating margin | | | 165,102 | | | 177,272 | | | 511,795 | | | 854,169 | |
Facility expenses | | | (34,913 | ) | | (27,126 | ) | | (118,428 | ) | | (180,467 | ) |
Portion of operating income attributable to non-controlling interests | | | (63,731 | ) | | — | | | (176 | ) | | (63,907 | ) |
| | | | | | | | | | |
| | | | | | | | | | | | | | |
Operating income before items not allocated to segments | | $ | 66,458 | | $ | 150,146 | | $ | 393,191 | | $ | 609,795 | |
| | | | | | | | | | |
| | | | | | | | | | | | | | |
| | | | | | | | | | | | | | |
| | | | | | | | | | |
Capital expenditures | | $ | 388,850 | | $ | 51,280 | | $ | 105,619 | | $ | 545,749 | |
Capital expenditures not allocated to segment | | | | | | | | | | | | 5,090 | |
| | | | | | | | | | | | | |
| | | | | | | | | | | | | | |
Total capital expenditures | | | | | | | | | | | $ | 550,839 | |
| | | | | | | | | | | | | |
| | | | | | | | | | | | | | |
| | | | | | | | | | | | | | |
| | | | | | | | | | | | | |
162
Table of Contents
MARKWEST ENERGY PARTNERS, L.P.
NOTES TO CONSOLIDATED FINANCIAL STATEMENTS (Continued)
24. Segment Information (Continued)
The following is a reconciliation of segment revenue to total revenue and operating income before items not allocated to segments to income before provision for income tax for the three years ended December 31, 2013, 2012 and 2011 (in thousands):
| | | | | | | | | | |
| | Year ended December 31, | |
|---|
| | 2013 | | 2012 | | 2011 | |
|---|
Total segment revenue | | $ | 1,693,267 | | $ | 1,389,214 | | $ | 1,536,539 | |
Derivative (loss) gain not allocated to segments | | | (24,638 | ) | | 56,535 | | | (29,035 | ) |
Revenue deferral adjustment and other(1) | | | (6,182 | ) | | (5,935 | ) | | (13,947 | ) |
| | | | | | | | |
| | | | | | | | | | | |
Total revenue | | $ | 1,662,447 | | $ | 1,439,814 | | $ | 1,493,557 | |
| | | | | | | | |
| | | | | | | | | | | |
| | | | | | | | | | | |
| | | | | | | | |
Operating income before items not allocated to segments | | $ | 706,181 | | $ | 643,479 | | $ | 609,795 | |
Portion of operating income attributable to non-controlling interests | | | (3,478 | ) | | (1,183 | ) | | 63,907 | |
Derivative (loss) gain not allocated to segments | | | (25,770 | ) | | 69,126 | | | (75,515 | ) |
Revenue deferral adjustment and other(1) | | | (6,182 | ) | | (5,935 | ) | | (13,947 | ) |
Compensation expense included in facility expenses not allocated to segments | | | (2,421 | ) | | (1,022 | ) | | (1,781 | ) |
Facility expenses adjustments(2) | | | 10,751 | | | 10,751 | | | 10,751 | |
Selling, general and administrative expenses | | | (101,549 | ) | | (93,444 | ) | | (80,441 | ) |
Depreciation | | | (299,884 | ) | | (183,250 | ) | | (143,704 | ) |
Amortization of intangible assets | | | (64,644 | ) | | (53,320 | ) | | (43,617 | ) |
Gain (loss) on disposal of property, plant and equipment | | | 33,763 | | | (6,254 | ) | | (8,797 | ) |
Accretion of asset retirement obligations | | | (824 | ) | | (672 | ) | | (1,185 | ) |
| | | | | | | | |
| | | | | | | | | | | |
Income from operations | | | 245,943 | | | 378,276 | | | 315,466 | |
Earnings from unconsolidated affiliates | | | 1,422 | | | 2,328 | | | 158 | |
Interest income | | | 262 | | | 419 | | | 422 | |
Interest expense | | | (151,851 | ) | | (120,191 | ) | | (113,631 | ) |
Amortization of deferred financing costs and discount (a component of interest expense) | | | (6,726 | ) | | (5,601 | ) | | (5,114 | ) |
Loss on redemption of debt | | | (38,455 | ) | | — | | | (78,996 | ) |
Miscellaneous income, net | | | 2,519 | | | 62 | | | 144 | |
| | | | | | | | |
| | | | | | | | | | | |
Income before provision for income tax | | $ | 53,114 | | $ | 255,293 | | $ | 118,449 | |
| | | | | | | | |
| | | | | | | | | | | |
| | | | | | | | | | | |
| | | | | | | | |
- (1)
- Amount relates to certain contracts in which the cash consideration that the Partnership receives for providing service is greater during the initial years of the contract compared to the later years. In accordance with GAAP, the revenue is recognized evenly over the term of the contract as the Partnership expects to perform a similar level of service for the entire term; therefore, the revenue recognized in the current reporting period is less than the cash received. However, the chief operating decision maker and management evaluate the segment performance based on the cash consideration received and, therefore, the impact of the revenue deferrals is excluded for segment reporting purposes. For the year ended December 31, 2013, approximately $6.4 million and $0.8 million of the revenue deferral adjustment is attributable to the Northeast segment and Southwest segment, respectively. For the year ended December 31, 2012, approximately
163
Table of Contents
MARKWEST ENERGY PARTNERS, L.P.
NOTES TO CONSOLIDATED FINANCIAL STATEMENTS (Continued)
24. Segment Information (Continued)
$6.6 million and $0.8 million of the revenue deferral adjustment is attributable to the Northeast segment and Southwest segment, respectively. For the year ended December 31, 2011, approximately $8.2 million and $7.2 million of the revenue deferral adjustment is attributable to the Northeast segment and Southwest segment, respectively. Beginning in 2015, the cash consideration received from these contracts is expected to decline and the reported segment revenue will be less than the revenue recognized for GAAP purposes. Other consists of management revenues from an unconsolidated affiliate of $1.0 million, $1.5 million, and $1.4 million for the years ended December 31, 2013, 2012, and 2011, respectively.
- (2)
- Facility expenses adjustments consist of the reallocation of the MarkWest Pioneer field services fee and the reallocation of the interest expense related to the SMR, which is included in facility expenses for the purposes of evaluating the performance of the Southwest segment.
The tables below present information about segment assets as of December 31, 2013, 2012 and 2011 (in thousands):
| | | | | | | |
| | 2013 | | 2012 | |
|---|
Marcellus | | $ | 4,529,028 | | $ | 3,172,144 | |
Utica | | | 1,646,995 | | | 439,987 | |
Northeast | | | 572,855 | | | 578,122 | |
Southwest | | | 2,389,057 | | | 2,086,215 | |
| | | | | | |
| | | | | | | | |
Total segment assets | | | 9,137,935 | | | 6,276,468 | |
Assets not allocated to segments: | | | | | | | |
Certain cash and cash equivalents | | | 63,086 | | | 261,473 | |
Fair value of derivatives | | | 11,962 | | | 30,382 | |
Investment in unconsolidated affiliates | | �� | 75,627 | | | 63,054 | |
Other(1) | | | 107,813 | | | 96,985 | |
| | | | | | |
| | | | | | | | |
Total assets | | $ | 9,396,423 | | $ | 6,728,362 | |
| | | | | | |
| | | | | | | | |
| | | | | | | | |
| | | | | | |
- (1)
- Includes corporate fixed assets, deferred financing costs, income tax receivable, non-trade receivables and other corporate assets not allocated to segments.
25. Supplemental Condensed Consolidating Financial Information
MarkWest Energy Partners has no significant operations independent of its subsidiaries. As of December 31, 2013, the Partnership's obligations under the outstanding Senior Notes (see Note 16) were fully, jointly and severally guaranteed, by all of the subsidiaries that are owned 100% by the Partnership, other than MarkWest Liberty Midstream and its subsidiaries. The guarantees are unconditional except for certain customary circumstances in which a subsidiary would be released from the guarantee under the indentures (see Note 16 for these circumstances). Subsidiaries that are not 100% owned by the Partnership do not guarantee the Senior Notes. For the purpose of the following financial information, the Partnership's investments in its subsidiaries and the guarantor subsidiaries' investments in their subsidiaries are presented in accordance with the equity method of accounting. The co-issuer, MarkWest Energy Finance Corporation, has no independent assets or operations. Condensed consolidating financial information for MarkWest Energy Partners and its combined guarantor and
164
Table of Contents
MARKWEST ENERGY PARTNERS, L.P.
NOTES TO CONSOLIDATED FINANCIAL STATEMENTS (Continued)
25. Supplemental Condensed Consolidating Financial Information (Continued)
combined non-guarantor subsidiaries as of December 31, 2013 and 2012 and for the years ended December 31, 2013, 2012 and 2011 is as follows (in thousands):
Condensed Consolidating Balance Sheets
| | | | | | | | | | | | | | | | |
| | As of December 31, 2013 | |
|---|
| | Parent | | Guarantor
Subsidiaries | | Non-Guarantor
Subsidiaries | | Consolidating
Adjustments | | Consolidated | |
|---|
ASSETS | | | | | | | | | | | | | | | | |
Current assets: | | | | | | | | | | | | | | | | |
Cash and cash equivalents | | $ | 224 | | $ | 79,363 | | $ | 5,718 | | $ | — | | $ | 85,305 | |
Restricted cash | | | — | | | — | | | 10,000 | | | — | | | 10,000 | |
Receivables and other current assets | | | 6,248 | | | 266,610 | | | 134,880 | | | — | | | 407,738 | |
Intercompany receivables | | | 1,194,955 | | | 78,010 | | | 125,115 | | | (1,398,080 | ) | | — | |
Fair value of derivative instruments | | | — | | | 10,444 | | | 1,013 | | | — | | | 11,457 | |
| | | | | | | | | | | | |
| | | | | | | | | | | | | | | | | |
Total current assets | | | 1,201,427 | | | 434,427 | | | 276,726 | | | (1,398,080 | ) | | 514,500 | |
Total property, plant and equipment, net | | | 5,379 | | | 2,149,845 | | | 5,622,602 | | | (84,657 | ) | | 7,693,169 | |
Other long-term assets: | | | | | | | | | | | | | | | | |
Restricted cash | | | — | | | — | | | 10,000 | | | — | | | 10,000 | |
Investment in unconsolidated affiliates | | | — | | | 75,627 | | | — | | | — | | | 75,627 | |
Investment in consolidated affiliates | | | 5,741,374 | | | 4,541,617 | | | — | | | (10,282,991 | ) | | — | |
Intangibles, net of accumulated amortization | | | — | | | 595,995 | | | 278,797 | | | — | | | 874,792 | |
Fair value of derivative instruments | | | — | | | 505 | | | — | | | — | | | 505 | |
Intercompany notes receivable | | | 151,200 | | | — | | | — | | | (151,200 | ) | | — | |
Other long-term assets | | | 52,338 | | | 92,276 | | | 83,216 | | | — | | | 227,830 | |
| | | | | | | | | | | | |
| | | | | | | | | | | | | | | | | |
Total assets | | $ | 7,151,718 | | $ | 7,890,292 | | $ | 6,271,341 | | $ | (11,916,928 | ) | $ | 9,396,423 | |
| | | | | | | | | | | | |
| | | | | | | | | | | | | | | | | |
| | | | | | | | | | | | | | | | | |
| | | | | | | | | | | | |
LIABILITIES AND EQUITY | | | | | | | | | | | | | | | | |
Current liabilities: | | | | | | | | | | | | | | | | |
Intercompany payables | | $ | — | | $ | 1,315,707 | | $ | 82,373 | | $ | (1,398,080 | ) | $ | — | |
Fair value of derivative instruments | | | — | | | 26,382 | | | 2,456 | | | — | | | 28,838 | |
Other current liabilities | | | 58,110 | | | 199,146 | | | 583,810 | | | (2,131 | ) | | 838,935 | |
| | | | | | | | | | | | |
| | | | | | | | | | | | | | | | | |
Total current liabilities | | | 58,110 | | | 1,541,235 | | | 668,639 | | | (1,400,211 | ) | | 867,773 | |
Deferred income taxes | | | 3,407 | | | 284,159 | | | — | | | — | | | 287,566 | |
Long-term intercompany financing payable | | | — | | | 151,200 | | | 97,461 | | | (248,661 | ) | | — | |
Fair value of derivative instruments | | | — | | | 27,763 | | | — | | | — | | | 27,763 | |
Long-term debt, net of discounts | | | 3,023,071 | | | — | | | — | | | — | | | 3,023,071 | |
Other long-term liabilities | | | 3,745 | | | 144,561 | | | 8,194 | | | — | | | 156,500 | |
Redeemable non-controlling interest | | |
— | | |
— | | |
— | | |
235,617 | | |
235,617 | |
Equity: | | |
| | |
| | |
| | |
| | |
| |
Common Units | | | 3,461,360 | | | 5,741,374 | | | 5,497,047 | | | (11,223,486 | ) | | 3,476,295 | |
Class B Units | | | 602,025 | | | — | | | — | | | — | | | 602,025 | |
Non-controlling interest in consolidated subsidiaries | | | — | | | — | | | — | | | 719,813 | | | 719,813 | |
| | | | | | | | | | | | |
| | | | | | | | | | | | | | | | | |
Total equity | | | 4,063,385 | | | 5,741,374 | | | 5,497,047 | | | (10,503,673 | ) | | 4,798,133 | |
| | | | | | | | | | | | |
| | | | | | | | | | | | | | | | | |
Total liabilities and equity | | $ | 7,151,718 | | $ | 7,890,292 | | $ | 6,271,341 | | $ | (11,916,928 | ) | $ | 9,396,423 | |
| | | | | | | | | | | | |
| | | | | | | | | | | | | | | | | |
| | | | | | | | | | | | | | | | | |
| | | | | | | | | | | | |
165
Table of Contents
MARKWEST ENERGY PARTNERS, L.P.
NOTES TO CONSOLIDATED FINANCIAL STATEMENTS (Continued)
25. Supplemental Condensed Consolidating Financial Information (Continued)
| | | | | | | | | | | | | | | | |
| | As of December 31, 2012 | |
|---|
| | Parent | | Guarantor
Subsidiaries | | Non-Guarantor
Subsidiaries | | Consolidating
Adjustments | | Consolidated | |
|---|
ASSETS | | | | | | | | | | | | | | | | |
Current assets: | | | | | | | | | | | | | | | | |
Cash and cash equivalents | | $ | 210,015 | | $ | 102,979 | | $ | 32,762 | | $ | — | | $ | 345,756 | |
Restricted cash | | | — | | | — | | | 25,500 | | | — | | | 25,500 | |
Receivables and other current assets | | | 9,191 | | | 178,913 | | | 74,658 | | | — | | | 262,762 | |
Intercompany receivables | | | 812,562 | | | 18,472 | | | 32,656 | | | (863,690 | ) | | — | |
Fair value of derivative instruments | | | — | | | 18,389 | | | 1,115 | | | — | | | 19,504 | |
| | | | | | | | | | | | |
| | | | | | | | | | | | | | | | | |
Total current assets | | | 1,031,768 | | | 318,753 | | | 166,691 | | | (863,690 | ) | | 653,522 | |
Total property, plant and equipment, net | | | 3,542 | | | 1,999,474 | | | 3,032,121 | | | (95,519 | ) | | 4,939,618 | |
Other long-term assets: | | | | | | | | | | | | | | | | |
Restricted cash | | | — | | | — | | | 10,000 | | | — | | | 10,000 | |
Investment in unconsolidated affiliates | | | — | | | 63,054 | | | — | | | — | | | 63,054 | |
Investment in consolidated affiliates | | | 4,104,473 | | | 2,719,920 | | | — | | | (6,824,393 | ) | | — | |
Intangibles, net of accumulated amortization | | | — | | | 559,320 | | | 295,835 | | | — | | | 855,155 | |
Fair value of derivative instruments | | | — | | | 10,878 | | | — | | | — | | | 10,878 | |
Intercompany notes receivable | | | 225,000 | | | — | | | — | | | (225,000 | ) | | — | |
Other long-term assets | | | 50,866 | | | 70,009 | | | 75,260 | | | — | | | 196,135 | |
| | | | | | | | | | | | |
| | | | | | | | | | | | | | | | | |
Total assets | | $ | 5,415,649 | | $ | 5,741,408 | | $ | 3,579,907 | | $ | (8,008,602 | ) | $ | 6,728,362 | |
| | | | | | | | | | | | |
| | | | | | | | | | | | | | | | | |
| | | | | | | | | | | | | | | | | |
| | | | | | | | | | | | |
LIABILITIES AND EQUITY | | | | | | | | | | | | | | | | |
Current liabilities: | | | | | | | | | | | | | | | | |
Intercompany payables | | $ | 461 | | $ | 839,543 | | $ | 23,686 | | $ | (863,690 | ) | $ | — | |
Fair value of derivative instruments | | | — | | | 27,062 | | | 167 | | | — | | | 27,229 | |
Other current liabilities | | | 42,301 | | | 197,934 | | | 472,462 | | | (1,892 | ) | | 710,805 | |
| | | | | | | | | | | | |
| | | | | | | | | | | | | | | | | |
Total current liabilities | | | 42,762 | | | 1,064,539 | | | 496,315 | | | (865,582 | ) | | 738,034 | |
Deferred income taxes | | | 2,906 | | | 186,522 | | | — | | | — | | | 189,428 | |
Long-term intercompany financing payable | | | — | | | 225,000 | | | 99,592 | | | (324,592 | ) | | — | |
Fair value of derivative instruments | | | — | | | 32,190 | | | — | | | — | | | 32,190 | |
Long-term debt, net of discounts | | | 2,523,051 | | | — | | | — | | | — | | | 2,523,051 | |
Other long-term liabilities | | | 2,959 | | | 128,684 | | | 2,618 | | | — | | | 134,261 | |
Equity: | | | | | | | | | | | | | | | | |
Common Units | | | 2,091,440 | | | 4,104,473 | | | 2,981,382 | | | (7,079,891 | ) | | 2,097,404 | |
Class B Units | | | 752,531 | | | — | | | — | | | — | | | 752,531 | |
Non-controlling interest in consolidated subsidiaries | | | — | | | — | | | — | | | 261,463 | | | 261,463 | |
| | | | | | | | | | | | |
| | | | | | | | | | | | | | | | | |
Total equity | | | 2,843,971 | | | 4,104,473 | | | 2,981,382 | | | (6,818,428 | ) | | 3,111,398 | |
| | | | | | | | | | | | |
| | | | | | | | | | | | | | | | | |
Total liabilities and equity | | $ | 5,415,649 | | $ | 5,741,408 | | $ | 3,579,907 | | $ | (8,008,602 | ) | $ | 6,728,362 | |
| | | | | | | | | | | | |
| | | | | | | | | | | | | | | | | |
| | | | | | | | | | | | | | | | | |
| | | | | | | | | | | | |
166
Table of Contents
MARKWEST ENERGY PARTNERS, L.P.
NOTES TO CONSOLIDATED FINANCIAL STATEMENTS (Continued)
25. Supplemental Condensed Consolidating Financial Information (Continued)
Condensed Consolidating Statements of Operations
| | | | | | | | | | | | | | | | |
| | Year ended December 31, 2013 | |
|---|
| | Parent | | Guarantor
Subsidiaries | | Non-Guarantor
Subsidiaries | | Consolidating
Adjustments | | Consolidated | |
|---|
Total revenue | | $ | — | | $ | 1,161,145 | | $ | 550,181 | | $ | (48,879 | ) | $ | 1,662,447 | |
Operating expenses: | | | | | | | | | | | | | | | | |
Purchased product costs | | | — | | | 588,670 | | | 100,758 | | | — | | | 689,428 | |
Facility expenses | | | — | | | 148,492 | | | 146,649 | | | (1,203 | ) | | 293,938 | |
Selling, general and administrative expenses | | | 46,732 | | | 29,855 | | | 32,512 | | | (7,550 | ) | | 101,549 | |
Depreciation and amortization | | | 847 | | | 183,610 | | | 185,810 | | | (5,739 | ) | | 364,528 | |
Other operating expenses | | | — | | | 4,907 | | | (39,926 | ) | | 2,080 | | | (32,939 | ) |
| | | | | | | | | | | | |
| | | | | | | | | | | | | | | | | |
Total operating expenses | | | 47,579 | | | 955,534 | | | 425,803 | | | (12,412 | ) | | 1,416,504 | |
| | | | | | | | | | | | |
| | | | | | | | | | | | | | | | | |
(Loss) income from operations | | | (47,579 | ) | | 205,611 | | | 124,378 | | | (36,467 | ) | | 245,943 | |
Earnings from consolidated affiliates | | | 276,995 | | | 110,763 | | | — | | | (387,758 | ) | | — | |
Loss on redemption of debt | | | (38,455 | ) | | — | | | — | | | — | | | (38,455 | ) |
Other expense, net | | | (161,975 | ) | | (26,749 | ) | | (11,247 | ) | | 45,597 | | | (154,374 | ) |
| | | | | | | | | | | | |
| | | | | | | | | | | | | | | | | |
Income before provision for income tax | | | 28,986 | | | 289,625 | | | 113,131 | | | (378,628 | ) | | 53,114 | |
Provision for income tax expense | | | (39 | ) | | (12,630 | ) | | — | | | — | | | (12,669 | ) |
| | | | | | | | | | | | |
| | | | | | | | | | | | | | | | | |
Net income | | | 28,947 | | | 276,995 | | | 113,131 | | | (378,628 | ) | | 40,445 | |
Net income attributable to non-controlling interest | | | — | | | — | | | — | | | (2,368 | ) | | (2,368 | ) |
| | | | | | | | | | | | |
| | | | | | | | | | | | | | | | | |
Net income attributable to the Partnership's unitholders | | $ | 28,947 | | $ | 276,995 | | $ | 113,131 | | $ | (380,996 | ) | $ | 38,077 | |
| | | | | | | | | | | | |
| | | | | | | | | | | | | | | | | |
| | | | | | | | | | | | | | | | | |
| | | | | | | | | | | | |
167
Table of Contents
MARKWEST ENERGY PARTNERS, L.P.
NOTES TO CONSOLIDATED FINANCIAL STATEMENTS (Continued)
25. Supplemental Condensed Consolidating Financial Information (Continued)
| | | | | | | | | | | | | | | | |
| | Year ended December 31, 2012 | |
|---|
| | Parent | | Guarantor
Subsidiaries | | Non-Guarantor
Subsidiaries | | Consolidating
Adjustments | | Consolidated | |
|---|
Total revenue | | $ | — | | $ | 1,125,368 | | $ | 324,738 | | $ | (10,292 | ) | $ | 1,439,814 | |
Operating expenses: | | | | | | | | | | | | | | | | |
Purchased product costs | | | — | | | 441,853 | | | 74,513 | | | — | | | 516,366 | |
Facility expenses | | | — | | | 137,261 | | | 71,138 | | | (167 | ) | | 208,232 | |
Selling, general and administrative expenses | | | 48,949 | | | 19,069 | | | 29,674 | | | (4,248 | ) | | 93,444 | |
Depreciation and amortization | | | 607 | | | 164,858 | | | 75,599 | | | (4,494 | ) | | 236,570 | |
Other operating expenses | | | 2 | | | 4,341 | | | 2,583 | | | — | | | 6,926 | |
| | | | | | | | | | | | |
| | | | | | | | | | | | | | | | | |
Total operating expenses | | | 49,558 | | | 767,382 | | | 253,507 | | | (8,909 | ) | | 1,061,538 | |
| | | | | | | | | | | | |
| | | | | | | | | | | | | | | | | |
(Loss) income from operations | | | (49,558 | ) | | 357,986 | | | 71,231 | | | (1,383 | ) | | 378,276 | |
Earnings from consolidated affiliates | | | 366,460 | | | 66,114 | | | — | | | (432,574 | ) | | — | |
Other expense, net | | | (118,563 | ) | | (21,001 | ) | | (8,554 | ) | | 25,135 | | | (122,983 | ) |
| | | | | | | | | | | | |
| | | | | | | | | | | | | | | | | |
Income before provision for income tax | | | 198,339 | | | 403,099 | | | 62,677 | | | (408,822 | ) | | 255,293 | |
Provision for income tax expense | | | (1,689 | ) | | (36,639 | ) | | — | | | — | | | (38,328 | ) |
| | | | | | | | | | | | |
| | | | | | | | | | | | | | | | | |
Net income | | | 196,650 | | | 366,460 | | | 62,677 | | | (408,822 | ) | | 216,965 | |
Net income attributable to non-controlling interest | | | — | | | — | | | — | | | 3,437 | | | 3,437 | |
| | | | | | | | | | | | |
| | | | | | | | | | | | | | | | | |
Net income attributable to the Partnership's unitholders | | $ | 196,650 | | $ | 366,460 | | $ | 62,677 | | $ | (405,385 | ) | $ | 220,402 | |
| | | | | | | | | | | | |
| | | | | | | | | | | | | | | | | |
| | | | | | | | | | | | | | | | | |
| | | | | | | | | | | | |
168
Table of Contents
MARKWEST ENERGY PARTNERS, L.P.
NOTES TO CONSOLIDATED FINANCIAL STATEMENTS (Continued)
25. Supplemental Condensed Consolidating Financial Information (Continued)
| | | | | | | | | | | | | | | | |
| | Year ended December 31, 2011 | |
|---|
| | Parent | | Guarantor
Subsidiaries | | Non-Guarantor
Subsidiaries | | Consolidating
Adjustments | | Consolidated | |
|---|
Total revenue | | $ | — | | $ | 1,241,442 | | $ | 252,115 | | $ | — | | $ | 1,493,557 | |
Operating expenses: | | | | | | | | | | | | | | | | |
Purchased product costs | | | — | | | 651,132 | | | 84,198 | | | — | | | 735,330 | |
Facility expenses | | | — | | | 128,612 | | | 36,405 | | | — | | | 165,017 | |
Selling, general and administrative expenses | | | 46,903 | | | 31,015 | | | 7,450 | | | (4,927 | ) | | 80,441 | |
Depreciation and amortization | | | 719 | | | 151,362 | | | 35,948 | | | (708 | ) | | 187,321 | |
Other operating expenses | | | 673 | | | 9,030 | | | 279 | | | — | | | 9,982 | |
| | | | | | | | | | | | |
| | | | | | | | | | | | | | | | | |
Total operating expenses | | | 48,295 | | | 971,151 | | | 164,280 | | | (5,635 | ) | | 1,178,091 | |
| | | | | | | | | | | | |
| | | | | | | | | | | | | | | | | |
(Loss) income from operations | | | (48,295 | ) | | 270,291 | | | 87,835 | | | 5,635 | | | 315,466 | |
Earnings from consolidated affiliates | | | 288,870 | | | 43,172 | | | — | | | (332,042 | ) | | — | |
Loss on redemption of debt | | | (78,996 | ) | | — | | | — | | | — | | | (78,996 | ) |
Other expense, net | | | (91,612 | ) | | (13,686 | ) | | (558 | ) | | (12,165 | ) | | (118,021 | ) |
| | | | | | | | | | | | |
| | | | | | | | | | | | | | | | | |
Income before provision for income tax | | | 69,967 | | | 299,777 | | | 87,277 | | | (338,572 | ) | | 118,449 | |
Provision for income tax expense | | | (2,742 | ) | | (10,907 | ) | | — | | | — | | | (13,649 | ) |
| | | | | | | | | | | | |
| | | | | | | | | | | | | | | | | |
Net income | | | 67,225 | | | 288,870 | | | 87,277 | | | (338,572 | ) | | 104,800 | |
Net income attributable to non-controlling interest | | | — | | | — | | | — | | | (44,105 | ) | | (44,105 | ) |
| | | | | | | | | | | | |
| | | | | | | | | | | | | | | | | |
Net income attributable to the Partnership's unitholders | | $ | 67,225 | | $ | 288,870 | | $ | 87,277 | | $ | (382,677 | ) | $ | 60,695 | |
| | | | | | | | | | | | |
| | | | | | | | | | | | | | | | | |
| | | | | | | | | | | | | | | | | |
| | | | | | | | | | | | |
169
Table of Contents
MARKWEST ENERGY PARTNERS, L.P.
NOTES TO CONSOLIDATED FINANCIAL STATEMENTS (Continued)
25. Supplemental Condensed Consolidating Financial Information (Continued)
Condensed Consolidating Statements of Cash Flows
| | | | | | | | | | | | | | | | |
| | Year ended December 31, 2013 | |
|---|
| | Parent | | Guarantor
Subsidiaries | | Non-Guarantor
Subsidiaries | | Consolidating
Adjustments | | Consolidated | |
|---|
Net cash (used in) provided by operating activities | | $ | (178,266 | ) | $ | 368,551 | | $ | 222,107 | | $ | 23,258 | | $ | 435,650 | |
Cash flows from investing activities: | | | | | | | | | | | | | | | | |
Restricted cash | | | — | | | — | | | 15,500 | | | — | | | 15,500 | |
Capital expenditures | | | (789 | ) | | (182,339 | ) | | (2,838,677 | ) | | (25,151 | ) | | (3,046,956 | ) |
Equity investments | | | (59,468 | ) | | (2,200,000 | ) | | — | | | 2,259,468 | | | — | |
Acquisition of business, net of cash acquired | | | — | | | (222,888 | ) | | — | | | — | | | (222,888 | ) |
Investment in unconsolidated affiliates | | | — | | | (17,521 | ) | | — | | | — | | | (17,521 | ) |
Distributions from consolidated affiliates | | | 95,548 | | | 517,635 | | | — | | | (613,183 | ) | | — | |
Investment in intercompany notes, net | | | 73,800 | | | — | | | — | | | (73,800 | ) | | — | |
Proceeds from disposal of property, plant and equipment | | | — | | | 757 | | | 208,546 | | | — | | | 209,303 | |
| | | | | | | | | | | | |
| | | | | | | | | | | | | | | | | |
Net cash flows provided by (used in) investing activities | | | 109,091 | | | (2,104,356 | ) | | (2,614,631 | ) | | 1,547,334 | | | (3,062,562 | ) |
| | | | | | | | | | | | |
| | | | | | | | | | | | | | | | | |
Cash flows from financing activities: | | | | | | | | | | | | | | | | |
Proceeds from public equity offerings, net | | | 1,698,066 | | | — | | | — | | | — | | | 1,698,066 | |
Proceeds from long-term debt | | | 1,000,000 | | | — | | | — | | | — | | | 1,000,000 | |
Payments of long-term debt | | | (501,112 | ) | | — | | | — | | | — | | | (501,112 | ) |
Payments related to intercompany financing, net | | | — | | | (73,800 | ) | | (1,893 | ) | | 75,693 | | | — | |
Payments of premiums on redemption of long-term debt | | | (31,516 | ) | | — | | | — | | | — | | | (31,516 | ) |
Payments for debt issuance costs, deferred financing costs and registration costs | | | (14,046 | ) | | — | | | — | | | — | | | (14,046 | ) |
Contributions from parent and affiliates | | | — | | | 59,468 | | | 2,200,000 | | | (2,259,468 | ) | | — | |
Contribution from non-controlling interest | | | — | | | — | | | 685,219 | | | — | | | 685,219 | |
Payments of SMR liability | | | — | | | (2,241 | ) | | — | | | — | | | (2,241 | ) |
Share-based payment activity | | | (5,210 | ) | | — | | | — | | | — | | | (5,210 | ) |
Payment of distributions | | | (462,488 | ) | | (95,548 | ) | | (517,846 | ) | | 613,183 | | | (462,699 | ) |
Intercompany advances, net | | | (1,824,310 | ) | | 1,824,310 | | | — | | | — | | | — | |
| | | | | | | | | | | | |
| | | | | | | | | | | | | | | | | |
Net cash flows (used in) provided by financing activities | | | (140,616 | ) | | 1,712,189 | | | 2,365,480 | | | (1,570,592 | ) | | 2,366,461 | |
| | | | | | | | | | | | |
| | | | | | | | | | | | | | | | | |
Net decrease in cash and cash equivalents | | | (209,791 | ) | | (23,616 | ) | | (27,044 | ) | | — | | | (260,451 | ) |
Cash and cash equivalents at beginning of year | | | 210,015 | | | 102,979 | | | 32,762 | | | — | | | 345,756 | |
| | | | | | | | | | | | |
| | | | | | | | | | | | | | | | | |
Cash and cash equivalents at end of period | | $ | 224 | | $ | 79,363 | | $ | 5,718 | | $ | — | | $ | 85,305 | |
| | | | | | | | | | | | |
| | | | | | | | | | | | | | | | | |
| | | | | | | | | | | | | | | | | |
| | | | | | | | | | | | |
170
Table of Contents
MARKWEST ENERGY PARTNERS, L.P.
NOTES TO CONSOLIDATED FINANCIAL STATEMENTS (Continued)
25. Supplemental Condensed Consolidating Financial Information (Continued)
| | | | | | | | | | | | | | | | |
| | Year ended December 31, 2012 | |
|---|
| | Parent | | Guarantor
Subsidiaries | | Non-Guarantor
Subsidiaries | | Consolidating
Adjustments | | Consolidated | |
|---|
Net cash (used in) provided by operating activities | | $ | (154,328 | ) | $ | 468,671 | | $ | 158,412 | | $ | 19,258 | | $ | 492,013 | |
Cash flows from investing activities: | | | | | | | | | | | | | | | | |
Restricted cash | | | — | | | — | | | (9,497 | ) | | — | | | (9,497 | ) |
Capital expenditures | | | (138 | ) | | (304,190 | ) | | (1,626,809 | ) | | (19,187 | ) | | (1,950,324 | ) |
Equity investments | | | (55,283 | ) | | (1,880,279 | ) | | — | | | 1,935,562 | | | — | |
Acquisition of business, net of cash acquired | | | — | | | — | | | (506,797 | ) | | — | | | (506,797 | ) |
Investment in unconsolidated affiliates | | | — | | | (5,227 | ) | | — | | | (839 | ) | | (6,066 | ) |
Distributions from consolidated affiliates | | | 75,431 | | | 140,362 | | | — | | | (215,793 | ) | | — | |
Investment in intercompany notes, net | | | (12,300 | ) | | — | | | — | | | 12,300 | | | — | |
Proceeds from disposal of property, plant and equipment | | | — | | | 1,732 | | | 77 | | | (1,213 | ) | | 596 | |
| | | | | | | | | | | | |
| | | | | | | | | | | | | | | | | |
Net cash flows provided by (used in) investing activities | | | 7,710 | | | (2,047,602 | ) | | (2,143,026 | ) | | 1,710,830 | | | (2,472,088 | ) |
| | | | | | | | | | | | |
| | | | | | | | | | | | | | | | | |
Cash flows from financing activities: | | | | | | | | | | | | | | | | |
Proceeds from public equity offerings, net | | | 1,634,081 | | | — | | | — | | | — | | | 1,634,081 | |
Proceeds from Credit Facility | | | 511,100 | | | — | | | — | | | — | | | 511,100 | |
Payments of Credit Facility | | | (577,100 | ) | | — | | | — | | | — | | | (577,100 | ) |
Proceeds from long-term debt | | | 742,613 | | | — | | | — | | | — | | | 742,613 | |
Proceeds (payments) related to intercompany financing, net | | | — | | | 12,300 | | | (1,142 | ) | | (11,158 | ) | | — | |
Payments for debt issue costs and deferred financing costs | | | (14,720 | ) | | — | | | — | | | — | | | (14,720 | ) |
Contributions from parent and affiliates | | | — | | | 55,283 | | | 1,879,440 | | | (1,934,723 | ) | | — | |
Contribution from non-controlling interest | | | — | | | — | | | 264,781 | | | — | | | 264,781 | |
Payments of SMR liability | | | — | | | (2,058 | ) | | — | | | — | | | (2,058 | ) |
Share-based payment activity | | | (8,067 | ) | | 907 | | | — | | | — | | | (7,160 | ) |
Payment of distributions | | | (339,967 | ) | | (75,431 | ) | | (140,433 | ) | | 215,793 | | | (340,038 | ) |
Intercompany advances, net | | | (1,591,329 | ) | | 1,591,329 | | | — | | | — | | | — | |
| | | | | | | | | | | | |
| | | | | | | | | | | | | | | | | |
Net cash flows provided by financing activities | | | 356,611 | | | 1,582,330 | | | 2,002,646 | | | (1,730,088 | ) | | 2,211,499 | |
| | | | | | | | | | | | |
| | | | | | | | | | | | | | | | | |
Net increase in cash and cash equivalents | | | 209,993 | | | 3,399 | | | 18,032 | | | — | | | 231,424 | |
Cash and cash equivalents at beginning of year | | | 22 | | | 99,580 | | | 14,730 | | | — | | | 114,332 | |
| | | | | | | | | | | | |
| | | | | | | | | | | | | | | | | |
Cash and cash equivalents at end of period | | $ | 210,015 | | $ | 102,979 | | $ | 32,762 | | $ | — | | $ | 345,756 | |
| | | | | | | | | | | | |
| | | | | | | | | | | | | | | | | |
| | | | | | | | | | | | | | | | | |
| | | | | | | | | | | | |
171
Table of Contents
MARKWEST ENERGY PARTNERS, L.P.
NOTES TO CONSOLIDATED FINANCIAL STATEMENTS (Continued)
25. Supplemental Condensed Consolidating Financial Information (Continued)
| | | | | | | | | | | | | | | | |
| | Year ended December 31, 2011 | |
|---|
| | Parent | | Guarantor
Subsidiaries | | Non-Guarantor
Subsidiaries | | Consolidating
Adjustments | | Consolidated | |
|---|
Net cash (used in) provided by operating activities | | $ | (126,782 | ) | $ | 414,844 | | $ | 129,584 | | $ | (7,243 | ) | $ | 410,403 | |
Cash flows from investing activities: | | | | | | | | | | | | | | | | |
Restricted cash | | | — | | | — | | | 2,006 | | | — | | | 2,006 | |
Capital expenditures | | | (789 | ) | | (162,517 | ) | | (399,550 | ) | | 12,017 | | | (550,839 | ) |
Acquisition of business | | | — | | | (230,728 | ) | | — | | | — | | | (230,728 | ) |
Equity investments | | | (47,295 | ) | | (252,367 | ) | | — | | | 299,662 | | | — | |
Distributions from consolidated affiliates | | | 50,718 | | | 64,569 | | | — | | | (115,287 | ) | | — | |
Investment in intercompany notes, net | | | (37,990 | ) | | — | | | — | | | 37,990 | | | — | |
Proceeds from disposal of property, plant and equipment | | | — | | | 606 | | | 7,617 | | | (4,773 | ) | | 3,450 | |
| | | | | | | | | | | | |
| | | | | | | | | | | | | | | | | |
Net cash flows used in investing activities | | | (35,356 | ) | | (580,437 | ) | | (389,927 | ) | | 229,609 | | | (776,111 | ) |
| | | | | | | | | | | | |
| | | | | | | | | | | | | | | | | |
Cash flows from financing activities: | | | | | | | | | | | | | | | | |
Proceeds from public equity offerings, net | | | 1,095,488 | | | — | | | — | | | — | | | 1,095,488 | |
Proceeds from Credit Facility | | | 1,182,200 | | | — | | | — | | | — | | | 1,182,200 | |
Payments of Credit Facility | | | (1,116,200 | ) | | — | | | — | | | — | | | (1,116,200 | ) |
Proceeds from long-term debt | | | 1,199,000 | | | — | | | — | | | — | | | 1,199,000 | |
Payments of long-term debt | | | (693,888 | ) | | — | | | — | | | — | | | (693,888 | ) |
Payments of premiums on redemption of long-term debt | | | (71,377 | ) | | — | | | — | | | — | | | (71,377 | ) |
Proceeds related to intercompany financing, net | | | — | | | 14,990 | | | 23,000 | | | (37,990 | ) | | — | |
Payments for debt issuance costs, deferred financing costs and registration costs | | | (20,163 | ) | | — | | | — | | | — | | | (20,163 | ) |
Acquisition of non-controlling interest, including transaction costs | | | (997,601 | ) | | — | | | — | | | — | | | (997,601 | ) |
Contributions from parents and affiliates | | | — | | | 47,295 | | | 252,367 | | | (299,662 | ) | | — | |
Contributions from non-controlling interest | | | — | | | — | | | 126,392 | | | — | | | 126,392 | |
Payments of SMR Liability | | | — | | | (1,875 | ) | | — | | | — | | | (1,875 | ) |
Share-based payment activity | | | (6,354 | ) | | 1,084 | | | — | | | — | | | (5,270 | ) |
Payment of distributions | | | (218,398 | ) | | (50,718 | ) | | (127,373 | ) | | 115,286 | | | (281,203 | ) |
Intercompany advances, net | | | (190,547 | ) | | 190,547 | | | — | | | — | | | — | |
| | | | | | | | | | | | |
| | | | | | | | | | | | | | | | | |
Net cash flows provided by financing activities | | | 162,160 | | | 201,323 | | | 274,386 | | | (222,366 | ) | | 415,503 | |
| | | | | | | | | | | | |
| | | | | | | | | | | | | | | | | |
Net decrease in cash | | | 22 | | | 35,730 | | | 14,043 | | | — | | | 49,795 | |
Cash and cash equivalents at beginning of year | | | — | | | 63,850 | | | 687 | | | — | | | 64,537 | |
| | | | | | | | | | | | |
| | | | | | | | | | | | | | | | | |
Cash and cash equivalents at end of period | | $ | 22 | | $ | 99,580 | | $ | 14,730 | | $ | — | | $ | 114,332 | |
| | | | | | | | | | | | |
| | | | | | | | | | | | | | | | | |
| | | | | | | | | | | | | | | | | |
| | | | | | | | | | | | |
172
Table of Contents
MARKWEST ENERGY PARTNERS, L.P.
NOTES TO CONSOLIDATED FINANCIAL STATEMENTS (Continued)
26. Supplemental Cash Flow Information
The following table provides information regarding supplemental cash flow information (in thousands):
| | | | | | | | | | |
| | Year ended December 31, | |
|---|
| | 2013 | | 2012 | | 2011 | |
|---|
Supplemental disclosures of cash flow information: | | | | | | | | | | |
Cash paid for interest, net of amounts capitalized | | $ | 137,815 | | $ | 109,001 | | $ | 112,780 | |
Cash (received) paid for income taxes, net | | | (25,324 | ) | | 17,940 | | | 10,115 | |
Supplemental schedule of non-cash investing and financing activities: | | | | | | | | | | |
Amounts payable for property, plant and equipment | | $ | 500,171 | | $ | 408,557 | | $ | 87,071 | |
Interest capitalized on construction in progress | | | 35,053 | | | 26,061 | | | 1,121 | |
Issuance of common units for vesting of share-based payment awards | | | 4,861 | | | 2,510 | | | 5,412 | |
Conversion of Class B units to common units | | | 150,506 | | | — | | | — | |
Issuance of Class B units for acquisition of non-controlling interest | | | — | | | — | | | 752,531 | |
27. Valuation and Qualifying Accounts
Activity in the Partnership's allowance for doubtful accounts and deferred tax asset valuation allowance is as follows (in thousands):
| | | | | | | | | | |
| | Year ended
December 31, | |
|---|
| | 2013 | | 2012 | | 2011 | |
|---|
Allowance for Doubtful Accounts | | | | | | | | | | |
Balance at beginning of period | | $ | 159 | | $ | 160 | | $ | 162 | |
Other charges(1) | | | — | | | (1 | ) | | (2 | ) |
| | | | | | | | |
| | | | | | | | | | | |
Balance at end of period | | $ | 159 | | $ | 159 | | $ | 160 | |
| | | | | | | | |
| | | | | | | | | | | |
| | | | | | | | | | | |
| | | | | | | | |
Deferred Tax Asset Valuation Allowance | | | | | | | | | | |
Balance at beginning of period | | $ | 904 | | $ | 977 | | $ | 1,036 | |
Charged to costs and expenses | | | 74 | | | (73 | ) | | (59 | ) |
| | | | | | | | |
| | | | | | | | | | | |
Balance at end of period | | $ | 978 | | $ | 904 | | $ | 977 | |
| | | | | | | | |
| | | | | | | | | | | |
| | | | | | | | | | | |
| | | | | | | | |
- (1)
- Bad debts written-off (net of recoveries).
173
Table of Contents
MARKWEST ENERGY PARTNERS, L.P.
NOTES TO CONSOLIDATED FINANCIAL STATEMENTS (Continued)
28. Quarterly Results of Operations (Unaudited)
The following summarizes the Partnership's quarterly results of operations for 2013 and 2012 (in thousands, except per unit data):
| | | | | | | | | | | | | |
| | Three months ended(1) | |
|---|
| | March 31(2)(3) | | June 30 | | September 30 | | December 31 | |
|---|
2013 | | | | | | | | | | | | | |
Total revenue | | $ | 373,273 | | $ | 415,120 | | $ | 420,516 | | $ | 453,538 | |
Income from operations | | | 63,663 | | | 140,022 | | | 7,763 | | | 34,495 | |
Net (loss) income | | | (21,131 | ) | | 85,498 | | | (20,027 | ) | | (3,895 | ) |
Net (loss) income attributable to the Partnership's unitholders | | | (15,458 | ) | | 83,699 | | | (23,604 | ) | | (6,560 | ) |
Net (loss) income attributable to the Partnership's common unitholders per common unit(4): | | | | | | | | | | | | | |
Basic | | $ | (0.12 | ) | $ | 0.63 | | $ | (0.17 | ) | $ | (0.05 | ) |
Diluted | | $ | (0.12 | ) | $ | 0.55 | | $ | (0.17 | ) | $ | (0.05 | ) |
| | | | | | | | | | | | | |
| | Three months ended(1) | |
|---|
| | March 31 | | June 30 | | September 30 | | December 31 | |
|---|
2012 | | | | | | | | | | | | | |
Total revenue | | $ | 347,263 | | $ | 442,822 | | $ | 280,576 | | $ | 369,153 | |
Income from operations | | | 50,492 | | | 257,741 | | | 8,593 | | | 61,450 | |
Net income (loss) | | | 15,774 | | | 186,533 | | | (15,265 | ) | | 29,923 | |
Net income (loss) attributable to the Partnership's unitholders | | | 16,020 | | | 186,908 | | | (14,340 | ) | | 31,814 | |
Net income (loss) attributable to the Partnership's common unitholders per common unit(4): | | | | | | | | | | | | | |
Basic | | $ | 0.16 | | $ | 1.74 | | $ | (0.13 | ) | $ | 0.26 | |
Diluted | | $ | 0.14 | | $ | 1.47 | | $ | (0.13 | ) | $ | 0.22 | |
- (1)
- Fluctuations from quarter to quarter were mainly due to changes in gains and losses from derivatives.
- (2)
- During the first quarter of 2013, the Partnership recorded a loss on redemption of debt of approximately $38.5 million related to the repurchase of the 2018 Senior Notes and a portion of 2021 Senior Notes and 2022 Senior Notes. See Note 16 for further details.
- (3)
- As discussed in Note 3, the Partnership determined that the consolidation error and impairment were immaterial to the prior periods included in the accompanying consolidated financial
174
Table of Contents
MARKWEST ENERGY PARTNERS, L.P.
NOTES TO CONSOLIDATED FINANCIAL STATEMENTS (Continued)
28. Quarterly Results of Operations (Unaudited) (Continued)
statements. The impact of the misstatement to the three months ended March 31, 2013 is shown in the table below (in thousands):
| | | | | | | |
| | Three months ended
March 31, 2013 | |
|---|
Statement of Operations | | As previously
reported | | As restated | |
|---|
Revenue | | $ | 375,952 | | $ | 373,273 | |
Income from operations | | | 64,350 | | | 63,663 | |
Net (loss) | | | (20,764 | ) | | (21,131 | ) |
- (4)
- Basic and diluted net (loss) income per unit is computed independently for each of the quarters presented; therefore, the sum of the quarterly earnings per unit may not equal the total computed for the year.
175
Table of Contents
ITEM 9. Changes in and Disagreements with Accountants on Accounting and Financial Disclosure
None.
ITEM 9A. Controls and Procedures
The Partnership's management, under the supervision and with the participation of the Chief Executive Officer and Chief Financial Officer, performed an evaluation of the effectiveness of the design and operation of our disclosure controls and procedures, as defined in Rule 13a-15(e) of the 1934 Act, as of December 31, 2013. Based on this evaluation, the Partnership's management, including our Chief Executive Officer and Chief Financial Officer, concluded that as of December 31, 2013, our disclosure controls and procedures were effective to provide reasonable assurance that information required to be disclosed by us in the reports that we file or submit under the 1934 Act is recorded, processed, summarized, and reported within the time periods specified in the SEC's rules and forms and to provide reasonable assurance that such information is accumulated and communicated to our management, including our Chief Executive Officer and Chief Financial Officer, as appropriate to allow timely decisions regarding required disclosures.
Management, under the supervision and with the participation of the Chief Executive Officer and Chief Financial Officer, of the Partnership is responsible for establishing and maintaining adequate internal control over financial reporting, as defined in Rule 13a-15(f) of the 1934 Act. Management has assessed the effectiveness of our internal control over financial reporting as of December 31, 2013 based on criteria established inInternal Control—Integrated Framework (1992) issued by the Committee of Sponsoring Organizations of the Treadway Commission. Based on this assessment, management concluded that, as of December 31, 2013, our internal control over financial reporting was effective in providing reasonable assurance regarding the reliability of financial reporting and the preparation of financial statements for external purposes in accordance with generally accepted accounting principles.
Management has designed our disclosure controls and procedures and internal control over financial reporting to provide reasonable assurance of achieving their objectives as specified above. Management does not expect, however, that our disclosure controls and procedures or our internal control over financial reporting will prevent or detect all error and fraud. Any control system, no matter how well designed and operated, is based upon certain assumptions and can provide only reasonable, not absolute, assurance that its objectives will be met. Further, no evaluation of controls can provide absolute assurance that misstatements due to error or fraud will not occur or that management has detected all control issues and instances of fraud, if any, within the Partnership.
There were no changes in our internal control over financial reporting during the quarter ended December 31, 2013 that materially affected or are reasonably likely to materially affect, our internal control over financial reporting.
Deloitte & Touche has independently assessed the effectiveness of our internal control over financial reporting and its report is included below.
176
Table of Contents
REPORT OF INDEPENDENT REGISTERED PUBLIC ACCOUNTING FIRM
To the Board of Directors of
MarkWest Energy GP, L.L.C.
Denver, Colorado
We have audited the internal control over financial reporting of MarkWest Energy Partners, L.P., and subsidiaries (the "Partnership") as of December 31, 2013, based on criteria established inInternal Control—Integrated Framework (1992) issued by the Committee of Sponsoring Organizations of the Treadway Commission. The Partnership's management is responsible for maintaining effective internal control over financial reporting and for its assessment of the effectiveness of internal control over financial reporting, included in the accompanying Management's Report on Internal Control Over Financial Reporting. Our responsibility is to express an opinion on the Partnership's internal control over financial reporting based on our audit.
We conducted our audit in accordance with the standards of the Public Company Accounting Oversight Board (United States). Those standards require that we plan and perform the audit to obtain reasonable assurance about whether effective internal control over financial reporting was maintained in all material respects. Our audit included obtaining an understanding of internal control over financial reporting, assessing the risk that a material weakness exists, testing and evaluating the design and operating effectiveness of internal control based on the assessed risk, and performing such other procedures as we considered necessary in the circumstances. We believe that our audit provides a reasonable basis for our opinion.
A company's internal control over financial reporting is a process designed by, or under the supervision of, the company's principal executive and principal financial officers, or persons performing similar functions, and effected by the company's board of directors, management, and other personnel to provide reasonable assurance regarding the reliability of financial reporting and the preparation of financial statements for external purposes in accordance with generally accepted accounting principles. A company's internal control over financial reporting includes those policies and procedures that (1) pertain to the maintenance of records that, in reasonable detail, accurately and fairly reflect the transactions and dispositions of the assets of the company; (2) provide reasonable assurance that transactions are recorded as necessary to permit preparation of financial statements in accordance with generally accepted accounting principles, and that receipts and expenditures of the company are being made only in accordance with authorizations of management and directors of the company; and (3) provide reasonable assurance regarding prevention or timely detection of unauthorized acquisition, use, or disposition of the company's assets that could have a material effect on the financial statements.
Because of the inherent limitations of internal control over financial reporting, including the possibility of collusion or improper management override of controls, material misstatements due to error or fraud may not be prevented or detected on a timely basis. Also, projections of any evaluation of the effectiveness of the internal control over financial reporting to future periods are subject to the risk that the controls may become inadequate because of changes in conditions, or that the degree of compliance with the policies or procedures may deteriorate.
In our opinion, the Partnership maintained, in all material respects, effective internal control over financial reporting as of December 31, 2013, based on the criteria established inInternal Control—Integrated Framework (1992) issued by the Committee of Sponsoring Organizations of the Treadway Commission.
We have also audited, in accordance with the standards of the Public Company Accounting Oversight Board (United States), the consolidated financial statements as of and for the year ended December 31, 2013 of the Partnership and our report dated February 26, 2014 expressed an unqualified opinion on those financial statements.
/s/ DELOITTE & TOUCHE LLP
Denver, Colorado
February 26, 2014
177
Table of Contents
ITEM 9B. Other Information
PART III
ITEM 10. Directors, Executive Officers and Corporate Governance
Information required to be set forth in Item 10. Directors, Executive Officers and Corporate Governance, has been omitted and will be incorporated herein by reference, when filed, to our Proxy Statement for our 2014 Annual Meeting of Unitholders expected to be filed no later than April 30, 2014.
ITEM 11. Executive Compensation
Information required to be set forth in Item 11. Executive Compensation, has been omitted and will be incorporated herein by reference, when filed, to our Proxy Statement for our 2014 Annual Meeting of Unitholders expected to be filed no later than April 30, 2014.
ITEM 12. Security Ownership of Certain Beneficial Owners and Management and Related Unitholder Matters
Information required to be set forth in Item 12. Security Ownership of Certain Beneficial Owners and Management and Related Unitholder Matters, has been omitted and will be incorporated herein by reference, when filed, to our Proxy Statement for our 2014 Annual Meeting of Unitholders expected to be filed no later than April 30, 2014.
ITEM 13. Certain Relationships and Related Transactions and Director Independence
Information required to be set forth in Item 13. Certain Relationships and Related Transactions and Director Independence, has been omitted and will be incorporated herein by reference, when filed, to our Proxy Statement for our 2014 Annual Meeting of Unitholders expected to be filed no later than April 30, 2014.
ITEM 14. Principal Accountant Fees and Services
Information required to be set forth in Item 14. Principal Accountant Fees and Services, has been omitted and will be incorporated herein by reference, when filed, to our Proxy Statement for our 2014 Annual Meeting of Unitholders expected to be filed no later than April 30, 2014.
PART IV
ITEM 15. Exhibits and Financial Statement Schedules
- (a)
- The following documents are filed as part of this report:
- (1)
- Financial Statements
178
Table of Contents
| | | |
Exhibit
Number | | Description |
|---|
| | 2.1 | | Agreement and Plan of Redemption and Merger dated September 5, 2007 by and among MarkWest Hydrocarbon, Inc., MarkWest Energy Partners, L.P. and MWEP, L.L.C. (incorporated by reference to the Current Report on Form 8-K filed September 6, 2007). |
|
2.2+ |
|
Agreement and Plan of Merger dated as of May 7, 2012 among Keystone Midstream Services, L.L.C., R.E. Gas Development, L.L.C., Stonehenge Energy Resources, L.P., Summit Discovery Resources II, L.L.C., MarkWest Liberty Midstream & Resources, L.L.C., MarkWest Liberty Bluestone, L.L.C. and KMS Shareholder Representative, L.L.C. (incorporated by reference to Quarterly Report on Form 10-Q filed August 6, 2012). |
|
3.1 |
|
Certificate of Limited Partnership of MarkWest Energy Partners, L.P. (incorporated by reference to the Registration Statement (No. 33-81780) on Form S-1 filed January 31, 2002). |
|
3.2 |
|
Certificate of Formation of MarkWest Energy Operating Company, L.L.C. (incorporated by reference to the Registration Statement (No. 33-81780) on Form S-1 filed January 31, 2002). |
|
3.3 |
|
Amended and Restated Limited Liability Company Agreement of MarkWest Energy Operating Company, L.L.C., dated as of May 24, 2002 (incorporated by reference to the Current Report on Form 8-K filed June 7, 2002). |
|
3.4 |
|
Certificate of Formation of MarkWest Energy GP, L.L.C. (incorporated by reference to the Registration Statement (No. 33-81780) on Form S-1 filed January 31, 2002). |
|
3.5 |
|
Amended and Restated Limited Liability Company Agreement of MarkWest Energy GP, L.L.C., dated as of May 24, 2002 (incorporated by reference to the Current Report on Form 8-K filed June 7, 2002). |
|
3.6 |
|
Third Amended and Restated Agreement of Limited Partnership of MarkWest Energy Partners, L.P., dated as of February 21, 2008 (incorporated by reference to the Current Report on Form 8-K filed February 21, 2008). |
|
3.7 |
|
Amendment No. 1 to Amended and Restated Limited Liability Company Agreement of MarkWest Energy GP, L.L.C., dated as of December 31, 2004 (incorporated by reference to the Form S-4 Registration Statement filed July 2, 2009). |
|
3.8 |
|
Amendment No. 2 to Amended and Restated Limited Liability Company Agreement of MarkWest Energy GP, L.L.C., dated as of January 19, 2005 (incorporated by reference to the Form S-4 Registration Statement filed July 2, 2009). |
|
3.9 |
|
Amendment No. 3 to Amended and Restated Limited Liability Company Agreement of MarkWest Energy GP, L.L.C., dated as of February 21, 2008 (incorporated by reference to the Form S-4 Registration Statement filed July 2, 2009). |
|
3.10 |
|
Amendment No. 4 to Amended and Restated Limited Liability Company Agreement of MarkWest Energy GP, L.L.C., dated as of March 31, 2008 (incorporated by reference to the Form S-4 Registration Statement filed July 2, 2009). |
|
3.11 |
|
Amendment No. 1 to the Third Amended and Restated Agreement of Limited Partnership of MarkWest Energy Partners, L.P., dated December 29, 2011 (incorporated by reference to the Current Report on Form 8-K filed December 30, 2011). |
|
4.1 |
|
Indenture dated as of April 15, 2008 among MarkWest Energy Partners, L.P., MarkWest Energy Finance Corporation, the several guarantors named therein, and Wells Fargo Bank, N.A., as trustee (incorporated by reference to the Current Report on Form 8-K filed April 15, 2008). |
179
Table of Contents
| | | |
Exhibit
Number | | Description |
|---|
| | 4.2 | | Form of 8.75% Series A and Series B Senior Notes due 2018 with attached notation of Guarantees (incorporated by reference to Exhibits A and D of Exhibit 4.1 hereto, which is incorporated by reference to the Current Report on Form 8-K filed April 15, 2008). |
|
4.3 |
|
Registration Rights Agreement dated as of April 15, 2008 among MarkWest Energy Partners, L.P., MarkWest Energy Finance Corporation, and the several guarantors named therein, and J.P. Morgan Securities Inc., RBC Capital Markets Corporation, Wachovia Capital Markets, LLC, Banc of America Securities LLC, Credit Suisse Securities (USA) LLC, Deutsche Bank Securities Inc., Fortis Securities LLC and SunTrust Robinson Humphrey, Inc. (incorporated by reference to the Current Report on Form 8-K filed April 15, 2008). |
|
4.4 |
|
Registration Rights Agreement dated as of May 1, 2008 among MarkWest Energy Partners, L.P., MarkWest Energy Finance Corporation, and the several guarantors named therein, and J.P. Morgan Securities Inc., RBC Capital Markets Corporation, Wachovia Capital Markets, LLC, Banc of America Securities LLC, Credit Suisse Securities (USA) LLC, Deutsche Bank Securities Inc., Fortis Securities LLC and SunTrust Robinson Humphrey, Inc. (incorporated by reference to the Current Report on Form 8-K filed May 1, 2008). |
|
4.5 |
|
First Supplemental Indenture, dated as of April 25, 2008, among MarkWest Energy Partners, L.P., MarkWest Energy Finance Corporation, the Guarantors named therein, and Wells Fargo Bank, National Association, as Trustee (incorporated by reference to the Annual Report on Form 10-K filed March 2, 2009). |
|
4.6 |
|
Second Supplemental Indenture, dated as of August 4, 2008, among MarkWest Energy Partners, L.P., MarkWest Energy Finance Corporation, the Guarantors named therein, and Wells Fargo Bank, National Association, as Trustee (incorporated by reference to the Annual Report on Form 10-K filed March 2, 2009). |
|
4.7 |
|
Third Supplemental Indenture, dated as of September 15, 2008, among MarkWest Energy Partners, L.P., MarkWest Energy Finance Corporation, the Guarantors named therein, and Wells Fargo Bank, National Association, as Trustee (incorporated by reference to the Annual Report on Form 10-K filed March 2, 2009). |
|
4.8 |
|
Indenture Release of Subsidiary Guarantor dated as of May 1, 2009, among MarkWest Energy Partners, L.P., and Wells Fargo Bank, N.A. (incorporated by reference to the Quarterly Report on Form 10-Q filed August 10, 2009). |
|
4.9 |
|
Indenture Release of Subsidiary Guarantor dated as of October 31, 2009, among MarkWest Energy Partners, L.P. and Wells Fargo Bank, N.A. (incorporated by reference to the Registration Statement on Form S-3 filed January 13, 2010). |
|
4.10 |
|
Fourth Supplemental Indenture dated as of March 10, 2011, by and among MarkWest Energy Partners, L.P., MarkWest Energy Finance Corporation, the Subsidiary Guarantors named therein and Wells Fargo Bank, National Association, as trustee (incorporated by reference to the Quarterly Report on Form 10-Q filed May 9, 2011). |
|
4.11 |
|
Fifth Supplemental Indenture dated as of October 21, 2011, by and among MarkWest Energy Partners, L.P., MarkWest Energy Finance Corporation, the Subsidiary Guarantors named therein and Wells Fargo Bank, National Association, as trustee (incorporated by reference to the Quarterly Report on Form 10-Q filed November 7, 2011). |
180
Table of Contents
| | | |
Exhibit
Number | | Description |
|---|
| | 4.12 | | Sixth Supplemental Indenture, dated as of November 10, 2011, by and among MarkWest Energy Partners, L.P., MarkWest Energy Finance Corporation, the Subsidiary Guarantors named therein and Wells Fargo Bank, National Association, as trustee (incorporated by reference to the Current Report on Form 8-K filed November 15, 2011). |
|
4.13 |
|
Indenture, dated as of November 2, 2010, by and among MarkWest Energy Partners, L.P., MarkWest Energy Finance Corporation, the Subsidiary Guarantors named therein and Wells Fargo Bank, National Association, as trustee (incorporated by reference to the Current Report on Form 8-K filed November 3, 2010). |
|
4.14 |
|
First Supplemental Indenture, dated as of November 2, 2010, by and among MarkWest Energy Partners, L.P., MarkWest Energy Finance Corporation, the Subsidiary Guarantors named therein and Wells Fargo Bank, National Association, as trustee (incorporated by reference to the Current Report on Form 8-K filed November 3, 2010). |
|
4.15 |
|
Form of 6.75% Senior Notes due 2020 with attached notation of Guarantees (incorporated by reference to Exhibits A and B of Exhibit 4.14 hereto, which is incorporated by reference to the Current Report on Form 8-K filed November 3, 2010). |
|
4.16 |
|
Second Supplemental Indenture, dated as of February 24, 2011, by and among MarkWest Energy Partners, L.P., MarkWest Energy Finance Corporation, the Subsidiary Guarantors named therein and Wells Fargo Bank, National Association, as trustee (incorporated by reference to the Current Report on Form 8-K filed February 24, 2011). |
|
4.17 |
|
Form of 6.5% Senior Notes due 2021 with attached notation of Guarantees (incorporated by reference to Exhibits A and B of Exhibit 4.16 hereto, which is incorporated by reference to the Current Report on Form 8-K filed February 24, 2011). |
|
4.18 |
|
Third Supplemental Indenture dated as of March 10, 2011, by and among MarkWest Energy Partners, L.P., MarkWest Energy Finance Corporation, the Subsidiary Guarantors named therein and Wells Fargo Bank, National Association, as trustee (incorporated by reference to the Quarterly Report on Form 10-Q filed May 9, 2011). |
|
4.19 |
|
Fourth Supplemental Indenture dated as of October 21, 2011, by and among MarkWest Energy Partners, L.P., MarkWest Energy Finance Corporation, the Subsidiary Guarantors named therein and Wells Fargo Bank, National Association, as trustee (incorporated by reference to the Quarterly Report on Form 10-Q filed November 7, 2011). |
|
4.20 |
|
Fifth Supplemental Indenture, dated as of November 3, 2011, by and among MarkWest Energy Partners, L.P., MarkWest Energy Finance Corporation, the Subsidiary Guarantors named therein and Wells Fargo Bank, National Association, as trustee (incorporated by reference to the Current Report on Form 8-K filed November 7, 2011). |
|
4.21 |
|
Form of 6.25% Senior Notes due 2022 with attached notation of Guarantees (incorporated by reference to Exhibits A and B of Exhibit 4.20 hereto, which is incorporated by reference to the Current Report on Form 8-K filed November 7, 2011). |
|
4.22 |
|
Sixth Supplemental Indenture, dated as of December 27, 2011, by and among MarkWest Energy Partners, L.P., MarkWest Energy Finance Corporation, the Subsidiary Guarantors named therein and Wells Fargo Bank, National Association, as trustee (incorporated by reference to the Annual Report on Form 10-K filed February 28, 2012). |
181
Table of Contents
| | | |
Exhibit
Number | | Description |
|---|
| | 4.23 | | Seventh Supplemental Indenture dated as of January 30, 2012, by and among MarkWest Energy Partners, L.P., MarkWest Energy Finance Corporation, the Subsidiary Guarantors named therein and Wells Fargo Bank, National Association, as trustee (incorporated by reference to the Quarterly Report on Form 10-Q filed May 7, 2012). |
|
4.24 |
|
Eighth Supplemental Indenture, dated as of August 10, 2012, by and among MarkWest Energy Partners, L.P., MarkWest Energy Finance Corporation, the Subsidiary Guarantors named therein and Wells Fargo Bank, National Association, as trustee (incorporated by reference to the Current Report on Form 8-K filed August 10, 2012). |
|
4.25 |
|
Form of 5.5% Senior Notes due 2023 with attached notation of Guarantees (incorporated by reference to Exhibits A and B of Exhibit 4.24 hereto, which is incorporated by reference to the Current Report on Form 8-K filed August 10, 2012). |
|
4.26 |
|
Ninth Supplemental Indenture, dated as of December 21, 2012, by and among MarkWest Energy Partners, L.P., MarkWest Energy Finance Corporation, the Subsidiary Guarantors named therein and Wells Fargo Bank, National Association, as trustee (incorporated by reference to the Post-Effective Amendment No. 1 to Registration Statement on Form S-3 filed January 7, 2013). |
|
4.27 |
|
Tenth Supplemental Indenture, dated as of January 10, 2013, by and among MarkWest Energy Partners, L.P., MarkWest Energy Finance Corporation, the Subsidiary Guarantors named therein and Wells Fargo Bank, National Association, as trustee (incorporated by reference to the Current Report on Form 8-K filed January 10, 2013). |
|
4.28 |
|
Form of 4.5% Senior Notes due 2023 with attached notation of Guarantees (incorporated by reference to Exhibits A and B of Exhibit 4.27 hereto, which is incorporated by reference to the Current Report on Form 8-K filed January 10, 2013). |
|
4.29 |
|
Eleventh Supplemental Indenture, dated as of April 17, 2013, by and among MarkWest Energy Partners, L.P., MarkWest Energy Finance Corporation, the Subsidiary Guarantors named therein and Wells Fargo Bank, National Association, as trustee (incorporated by reference to the Quarterly Report on Form 10-Q filed May 8, 2013). |
|
4.30 |
|
Twelfth Supplemental Indenture, dated as of June 19, 2013, by and among MarkWest Energy Partners, L.P., MarkWest Energy Finance Corporation, the Subsidiary Guarantors named therein and Wells Fargo Bank, National Association, as trustee (incorporated by reference to the Quarterly Report on Form 10-Q filed August 7, 2013). |
|
4.31 |
|
Registration Rights Agreement dated December 29, 2011 between MarkWest Energy Partners, L.P. and M&R MWE Liberty, LLC (incorporated by reference to the Annual Report on Form 10-K filed February 28, 2012). |
|
10.1 |
|
Amended and Restated Revolving Credit Agreement dated as of July 1, 2010 among MarkWest Energy Partners, L.P., Wells Fargo Bank, National Association, as successor Administrative Agent, Issuing Bank and Swingline Linder, Royal Bank of Canada, as prior administrative agent, RBC Capital Markets, as Syndication Agent, BNP Paribas, Morgan Stanley Bank and U.S. Bank National Association, as Documentation Agents, and the lenders party thereto (incorporated by reference to the Current Report on Form 8-K filed July 7, 2010). |
182
Table of Contents
| | | |
Exhibit
Number | | Description |
|---|
| | 10.2 | | Joinder Agreement dated as of July 29, 2010 among MarkWest Energy Partners, L.P., Wells Fargo Bank, National Association, individually and as Administrative Agent, Issuing Bank and Swingline Lender and Goldman Sachs Bank USA (incorporated by reference to the Current Report on Form 8-K filed August 4, 2010). |
|
10.3 |
|
Joinder Agreement dated as of June 15, 2011 among MarkWest Energy Partners, L.P., Wells Fargo Bank, National Association, individually and as Administrative Agent, Issuing Bank and Swingline Lender and Citibank, N.A. (incorporated by reference to the Current Report on Form 8-K filed June 17, 2011). |
|
10.4 |
|
First Amendment to Amended and Restated Credit Agreement dated as of September 7, 2011 among MarkWest Energy Partners, L.P., Wells Fargo Bank, National Association, as Administrative Agent, and the other agents and lenders party thereto (incorporated by reference to the Current Report on Form 8-K filed September 13, 2011). |
|
10.5 |
|
Second Amendment to Amended and Restated Credit Agreement dated as of December 29, 2011, among MarkWest Energy Partners, L.P., Wells Fargo Bank, National Association, as Administrative Agent, and the other agents and lenders party thereto (incorporated by reference to the Current Report on Form 8-K filed December 30, 2011). |
|
10.6 |
|
Third Amendment to Amended and Restated Credit Agreement dated as of June 29, 2012, among MarkWest Energy Partners, L.P., Wells Fargo Bank, National Association, as Administrative Agent, and the other agents and lenders party thereto (incorporated by reference to the Current Report on Form 8-K filed June 29, 2012). |
|
10.7 |
|
Fourth Amendment to Amended and Restated Credit Agreement dated as of December 20, 2012, among MarkWest Energy Partners, L.P., Wells Fargo Bank, National Association, as Administrative Agent, and the other agents and lenders party thereto (incorporated by reference to the Current Report on Form 8-K filed December 26, 2012). |
|
10.8 |
|
Fifth Amendment to Amended and Restated Credit Agreement dated as of December 11, 2013, among MarkWest Energy Partners, L.P., Wells Fargo Bank, National Association, as Administrative Agent, and the other agents and lenders party thereto (incorporated by reference to the Current Report on Form 8-K filed December 13, 2013). |
|
10.9 |
|
Equity Distribution Agreement dated as of November 7, 2012, among MarkWest Energy Partners, L.P., MarkWest Energy Operating Company, L.L.C. and Citigroup Global Markets Inc. (incorporated by reference to the Current Report on Form 8-K filed November 7, 2012). |
|
10.10 |
|
Equity Distribution Agreement dated as of August 7, 2013, among MarkWest Energy Partners, L.P., MarkWest Energy Operating Company, L.L.C., M&R MWE Liberty, LLC and Citigroup Global Markets Inc. (incorporated by reference to the Current Report on Form 8-K filed August 7, 2013). |
|
10.11 |
|
Equity Distribution Agreement dated as of September 5, 2013, among MarkWest Energy Partners, L.P., MarkWest Energy Operating Company, L.L.C., M&R MWE Liberty, LLC and Citigroup Global Markets Inc. (incorporated by reference to the Current Report on Form 8-K filed September 5, 2013). |
|
10.12 |
|
Terms Agreement dated as of December 17, 2013, among MarkWest Energy Partners, L.P., MarkWest Energy Operating Company, L.L.C., MarkWest Energy Partners, L.P. (in its capacity as custodian for M&R MWE Liberty, LLC) and Citigroup Global Markets Inc. (incorporated by reference to the Current Report on Form 8-K filed December 23, 2013). |
183
Table of Contents
| | | |
Exhibit
Number | | Description |
|---|
| | 10.13 | | Services Agreement dated January 1, 2004 between MarkWest Energy GP, L.L.C. and MarkWest Hydrocarbon, Inc. (incorporated by reference to the Annual Report on Form 10-K filed March 15, 2004). |
|
10.14+ |
|
Natural Gas Liquids Purchase Agreement dated August 25, 2006 between ONEOK Hydrocarbon, L.P. and MarkWest Western Oklahoma Gas Company, L.L.C., now known as MarkWest Oklahoma Gas Company, L.L.C. (incorporated by reference to the Annual Report on Form 10-K filed March 2, 2009). |
|
10.15+ |
|
Amendment to the Natural Gas Liquids Purchase Agreement effective as of November 1, 2008 by and between MarkWest Oklahoma Gas Company, L.L.C. and ONEOK Hydrocarbon, L.P. (incorporated by reference to the Annual Report on Form 10-K filed March 2, 2009). |
|
10.16+ |
|
Raw Product Purchase Agreement dated February 11, 2005 between MarkWest Energy East Texas Gas Company, L.P., now known as MarkWest Energy East Texas Gas Company, L.L.C., and Dynegy Liquids Marketing and Trade, now known as Targa Liquids Marketing and Trade (incorporated by reference to the Annual Report on Form 10-K filed March 2, 2009). |
|
10.17+ |
|
Amendment to the Raw Product Purchase Agreement effective as of December 1, 2009 by and between Targa Liquids Marketing and Trade and MarkWest Energy East Texas Gas Company, L.L.C. (incorporated by reference to the Annual Report on Form 10-K filed March 1, 2010). |
|
10.18 |
|
Exchange Agreement dated September 5, 2007 by and among MarkWest Energy Partners, L.P., MarkWest Hydrocarbon, Inc., and MarkWest Energy, GP L.L.C. (incorporated by reference to the Current Report on Form 8-K filed September 6, 2007). |
|
10.19 |
|
Form of Second Amended and Restated Indemnification Agreement dated April 24, 2008 by and among MarkWest Energy Partners, L.P., MarkWest Energy GP, L.L.C., and each director and officer of MarkWest Energy GP, L.L.C., including the following named executive officers: Frank Semple, President and Chief Executive Officer; Nancy Buese, Senior Vice President and Chief Financial Officer; Randy Nickerson, Senior Vice President and Chief Commercial Officer; John Mollenkopf, Senior Vice President and Chief Operations Officer; and C. Corwin Bromley, Senior Vice President, General Counsel and Secretary (incorporated by reference to the Quarterly Report on Form 10-Q filed August 11, 2008). |
|
10.20 |
|
MarkWest Energy Partners, L.P. 2008 Long-Term Incentive Plan (incorporated by reference to the Form S-4/A Registration Statement filed December 21, 2007). |
|
10.21 |
|
Amendment No. 1 to MarkWest Energy Partners, L.P. 2008 Long-Term Incentive Plan (incorporated by reference to Appendix B to the Proxy Statement on Schedule 14A filed April 20, 2012). |
|
10.22D |
|
Executive Employment Agreement effective September 5, 2007 between MarkWest Hydrocarbon, Inc. and Frank Semple (incorporated by reference to the Current Report on Form 8-K filed September 11, 2007). |
|
10.23D |
|
Form of Executive Employment Agreement effective September 5, 2007 between MarkWest Hydrocarbon, Inc. and Nancy K. Buese, C. Corwin Bromley, John C. Mollenkopf and Randy S. Nickerson (incorporated by reference to the Current Report on Form 8-K filed September 11, 2007). |
184
Table of Contents
| | | |
Exhibit
Number | | Description |
|---|
| | 10.24+ | | Contribution Agreement dated December 29, 2011 among M&R MWE Liberty, LLC, MarkWest Energy Partners, L.P. and MarkWest Liberty Gas Gathering L.L.C. (incorporated by reference to the Annual Report on Form 10-K filed February 28, 2012). |
|
10.25+ |
|
Limited Liability Company Agreement of MarkWest Utica EMG, L.L.C., dated December 29, 2011 and effective January 1, 2012, between MarkWest Utica Operating Company, L.L.C. and EMG Utica, LLC (incorporated by reference to the Annual Report on Form 10-K filed February 28, 2012). |
|
10.26+ |
|
Amendment No. 1 to Limited Liability Company Agreement of MarkWest Utica EMG, L.L.C. dated January 30, 2013, between MarkWest Utica Operating Company, L.L.C. and EMG Utica, LLC (incorporated by reference to the Quarterly Report on Form 10-Q filed May 8, 2013). |
|
10.27+ |
|
Amended and Restated Limited Liability Company Agreement of MarkWest Utica EMG, L.L.C. dated February 18, 2013, between MarkWest Utica Operating Company, L.L.C. and EMG Utica, LLC (incorporated by reference to the Quarterly Report on Form 10-Q filed May 8, 2013). |
|
12.1* |
|
Computation of Ratio of Earnings to Fixed Charges |
|
14.1 |
|
MarkWest Energy Partners, L.P. Code of Conduct and Ethics (incorporated by reference to the Current Report on Form 8-K filed October 31, 2012). |
|
21.1* |
|
List of subsidiaries |
|
23.1* |
|
Consent of Deloitte & Touche LLP |
|
31.1* |
|
Chief Executive Officer Certification Pursuant to Section 13a-14 of the Securities Exchange Act |
|
31.2* |
|
Chief Financial Officer Certification Pursuant to Section 13a-14 of the Securities Exchange Act |
|
32.1* |
|
Certification of Chief Executive Officer of the General Partner pursuant to 18 U.S.C. Section 1350, as adopted pursuant to Section 906 of the Sarbanes-Oxley Act of 2002. |
|
32.2* |
|
Certification of Chief Financial Officer of the General Partner pursuant to 18 U.S.C. Section 1350, as adopted pursuant to Section 906 of the Sarbanes-Oxley Act of 2002. |
|
101* |
|
The following financial information from the annual report on Form 10-K of MarkWest Energy Partners, L.P. for the year ended December 31, 2013, formatted in XBRL (eXtensible Business Reporting Language): (i) Consolidated Balance Sheets, (ii) Consolidated Statements of Operations, (iii) Consolidated Statements of Changes in Equity and Comprehensive Income, (iv) Consolidated Statements of Cash Flows and (v) Notes to Consolidated Financial Statements, tagged as blocks of text. |
- +
- Application has been made to the Securities and Exchange Commission for confidential treatment of certain provisions of these exhibits. Omitted material for which confidential treatment has been requested and has been filed separately with the Securities and Exchange Commission.
- *
- Filed herewith.
- D
- Identifies each management contract or compensatory plan or arrangement.
- (b)
- The following exhibits are filed as part of this report: See Item 15(a)(2) above.
- (c)
- The following financial statement schedules are filed as part of this report: None required.
185
Table of Contents
SIGNATURES
Pursuant to the requirements of section 13 or 15(d) of the Securities Exchange Act of 1934, the Registrant has duly caused this Report to be signed on its behalf by the undersigned, thereunto duly authorized.
| | | | |
| | | MarkWest Energy Partners, L.P.
(Registrant) |
|
|
By: |
|
MarkWest Energy GP, L.L.C., |
| | | Its | | General Partner |
Date: February 26, 2014 |
|
By: |
|
/s/ FRANK M. SEMPLE
Frank M. Semple
Chairman, President and Chief Executive Officer
(Principal Executive Officer) |
Pursuant to the requirements of the Securities Exchange Act of 1934, this report has been signed below by the following persons on behalf of the Registrant and in the capacities with MarkWest Energy GP, L.L.C., the General Partner of MarkWest Energy Partners, L.P., the Registrant and on the dates indicated.
| | | | |
| Date: February 26, 2014 | | By: | | /s/ FRANK M. SEMPLE
Frank M. Semple
Chairman, President and Chief Executive Officer
(Principal Executive Officer) |
Date: February 26, 2014 |
|
By: |
|
/s/ NANCY K. BUESE
Nancy K. Buese
Executive Vice President and
Chief Financial Officer
(Principal Financial Officer) |
Date: February 26, 2014 |
|
By: |
|
/s/ PAULA L. ROSSON
Paula L. Rosson
Senior Vice President and
Chief Accounting Officer
(Principal Accounting Officer) |
Date: February 26, 2014 |
|
By: |
|
/s/ DONALD D. WOLF
Donald D. Wolf
Lead Director |
186
Table of Contents
| | | | |
Date: February 26, 2014 |
|
By: |
|
/s/ KEITH E. BAILEY
Keith E. Bailey
Director |
Date: February 26, 2014 |
|
By: |
|
/s/ MICHAEL L. BEATTY
Michael L. Beatty
Director |
Date: February 26, 2014 |
|
By: |
|
/s/ CHARLES K. DEMPSTER
Charles K. Dempster
Director |
Date: February 26, 2014 |
|
By: |
|
/s/ ANNE E. FOX MOUNSEY
Anne E. Fox Mounsey
Director |
Date: February 26, 2014 |
|
By: |
|
/s/ DONALD C. HEPPERMANN
Donald C. Heppermann
Director |
Date: February 26, 2014 |
|
By: |
|
/s/ WILLIAM P. NICOLETTI
William P. Nicoletti
Director |
Date: February 26, 2014 |
|
By: |
|
/s/ RANDALL J. LARSON
Randall J. Larson
Director |
187