Exhibit 99.1
| Wells Fargo Securities 11th Annual Pipeline, MLP and Energy Symposium December 2012 |
| Forward-Looking Statements This presentation contains forward-looking statements and information. These forward-looking statements, which in many instances can be identified by words like “could,” “may,” “will,” “should,” “expects,” “plans,” “project,” “anticipates,” “believes,” “planned,” “proposed,” “potential,” and other comparable words, regarding future or contemplated results, performance, transactions, or events, are based on MarkWest Energy Partners, L.P. (“MarkWest” and the “Partnership”) current information, expectations and beliefs, concerning future developments and their potential effects on MarkWest. Although MarkWest believes that the expectations reflected in the forward-looking statements are reasonable, it can give no assurance that such expectations will prove to be correct, and actual results, performance, distributions, events or transactions could vary significantly from those expressed or implied in such statements and are subject to a number of uncertainties and risks. Among the factors that could cause results to differ materially are those risks discussed in the periodic reports MarkWest files with the SEC, including its Annual Report on Form 10-K for the year ended December 31, 2011 and its Quarterly Report on Form 10-Q for the quarters ended March 31, 2012, June 30, 2012, and September 30, 2012. You are urged to carefully review and consider the cautionary statements and other disclosures, including those under the heading “Risk Factors,” made in those documents. If any of the uncertainties or risks develop into actual events or occurrences, or if underlying assumptions prove incorrect, it could cause actual results to vary significantly from those expressed in the presentation, and MarkWest’s business, financial condition, or results of operations could be materially adversely affected. Key uncertainties and risks that may directly affect MarkWest’s performance, future growth, results of operations, and financial condition, include, but are not limited to: Fluctuations and volatility of natural gas, NGL products, and oil prices; A reduction in natural gas or refinery off-gas production which MarkWest gathers, transports, processes, and/or fractionates; A reduction in the demand for the products MarkWest produces and sells; Financial credit risks / failure of customers to satisfy payment or other obligations under MarkWest’s contracts; Effects of MarkWest’s debt and other financial obligations, access to capital, or its future financial or operational flexibility or liquidity; Construction, procurement, and regulatory risks in our development projects; Hurricanes, fires, and other natural and accidental events impacting MarkWest’s operations, and adequate insurance coverage; Terrorist attacks directed at MarkWest facilities or related facilities; Changes in and impacts of laws and regulations affecting MarkWest operations and risk management strategy; and Failure to integrate recent or future acquisitions. 2 |
| Non-GAAP Measures Distributable Cash Flow, Adjusted EBITDA, and Net Operating Margin are not measures of performance calculated in accordance with GAAP, and should not be considered separately from or as a substitute for net income, income from operations, or cash flow as reflected in our financial statements. The GAAP measure most directly comparable to Distributable Cash Flow and Adjusted EBITDA is net income (loss). The GAAP measure most directly comparable to Net Operating Margin is income (loss) from operations. In general, we define Distributable Cash Flow as net income (loss) adjusted for (i) depreciation, amortization, accretion, and other non-cash expense; (ii) amortization of deferred financing costs; (iii) loss on redemption of debt net of current tax benefit; (iv) non-cash (earnings) loss from unconsolidated affiliates; (v) distributions from (contributions to) unconsolidated affiliates (net of affiliate growth capital expenditures); (vi) non-cash compensation expense; (vii) non-cash derivative activity; (viii) losses (gains) on the disposal of property, plant, and equipment (PP&E) and unconsolidated affiliates; (ix) provision for deferred income taxes; (x) cash adjustments for non-controlling interest in consolidated subsidiaries; (xi) revenue deferral adjustment; (xii) losses (gains) relating to other miscellaneous non-cash amounts affecting net income for the period; and (xiii) maintenance capital expenditures. We define Adjusted EBITDA as net income (loss) adjusted for (i) depreciation, amortization, accretion, and other non-cash expense; (ii) interest expense; (iii) amortization of deferred financing costs; (iv) loss on redemption of debt; (v) losses (gains) on the disposal of PP&E and unconsolidated affiliates; (vi) non-cash derivative activity; (vii) non-cash compensation expense; (viii) provision for income taxes; (ix) adjustments for cash flow from unconsolidated affiliates; (x) adjustment related to non-guarantor, consolidated subsidiaries; and (xi) losses (gains) relating to other miscellaneous non-cash amounts affecting net income for the period. We define Net Operating Margin as revenue, excluding any derivative activity and adjusted for the non-cash impact of revenue deferrals related to certain agreements, less purchased product costs, excluding any derivative activity. Distributable Cash Flow is a financial performance measure used by management as a key component in the determination of cash distributions paid to unitholders. We believe distributable cash flow is an important financial measure for unitholders as an indicator of cash return on investment and to evaluate whether the Partnership is generating sufficient cash flow to support quarterly distributions. In addition, distributable cash flow is commonly used by the investment community because the market value of publicly traded partnerships is based, in part, on distributable cash flow and cash distributions paid to unitholders. Adjusted EBITDA is a financial performance measure used by management, industry analysts, investors, lenders, and rating agencies to assess the financial performance and operating results of the Partnership’s ongoing business operations. Additionally, we believe Adjusted EBITDA provides useful information to investors for trending, analyzing, and benchmarking our operating results from period to period as compared to other companies that may have different financing and capital structures. Net Operating Margin is a financial performance measure used by management and investors to evaluate the underlying baseline operating performance of our contractual arrangements. Management also uses Net Operating Margin to evaluate the Partnership’s financial performance for purposes of planning and forecasting. Please see the Appendix for reconciliations of Distributable Cash Flow, Adjusted EBITDA, and Net Operating Margin to the most directly comparable GAAP measure. 3 |
| Keystone Key Investment Considerations High-Quality, Diversified Assets Proven Track Record of Growth and Customer Satisfaction Substantial Growth Opportunities Strong Financial Profile Leading presence in six core natural gas producing regions of the U.S. Key long-term contracts with high-quality producers to develop the Marcellus Shale, Utica Shale, Huron/Berea Shale, Woodford Shale, Haynesville Shale, and Granite Wash formation No incentive distribution rights, which drives a lower cost of capital Distributions have increased by 224% (12% CAGR) since IPO Over $7 billion of organic growth and acquisitions since IPO, including the December 2011 Liberty and May 2012 Keystone transactions Ranked #1 in EnergyPoint’s 2011 midstream customer satisfaction survey 2012 growth capital forecast of $1.8 billion 2013 growth capital forecast of $1.4 to $1.9 billion Growth projects are well diversified across the asset base and increase the percentage of fee-based net operating margin Long-term organic growth opportunities focused on resource plays Committed to maintaining strong financial profile Debt to book capitalization of 49% Debt to Adjusted EBITDA of 4.3x Adjusted EBITDA to Interest Expense of 5.2x Established relationships with joint venture partners, which provides capital flexibility 4 |
| US Shale Plays are Driving Natural Gas Supply 5 Source: EIA and En*Vantage MarkWest is focused on midstream development in resource plays (Marcellus, Utica, Woodford, Granite Wash, Haynesville) and has benefited tremendously from the advantages of being a first mover. Resource plays will continue to drive midstream investment for decades to come and we will continue to focus our investments in these areas. US Lower 48 Gas Production vs Demand (Trillion Cubic Feet) 0 5 10 15 20 25 30 2000 2002 2004 2006 2008 2010 2012 2014 2016 2018 2020 0 5 10 15 20 25 30 Non-associated onshore Non-associated offshore Associated w/ oil Tight Gas Coal Bed Methane Shale Gas Net Imports Domestic Gas Demand 21% 9% 10% 9% 26% 23% 39% 25% 7% 9% 7% 13% Source EIA AEO 2012 |
| U.S. Shale Play Volume Growth 6 Source: Goldman Sachs In 2012 the Marcellus Shale Play became the largest producing Shale Play in the U.S. Annual Growth Expectations (bcf/d) 2012 2013 Nov 12 Level Total Dry Production 2.5 0.1 65.6 Shale Gas Areas 4.7 2.3 Haynesville 0.5 (1.5) 7.2 Marcellus 3.0 3.2 8.5 Eagle Ford 0.8 0.7 2.3 Barnett 0.1 0.1 5.3 Associated Gas (Conv. Oil and Shale) 1.8 1.7 Convential Gas (4.0) (3.9) |
| Emerging Resource Plays Base Production (Conventional / Tight Sand) Base Production (Conventional / Tight Sand) 7 Commitment to Resource Plays Capital investments and acquisitions in resource plays since 2004 are driving strong, long-term volume growth. |
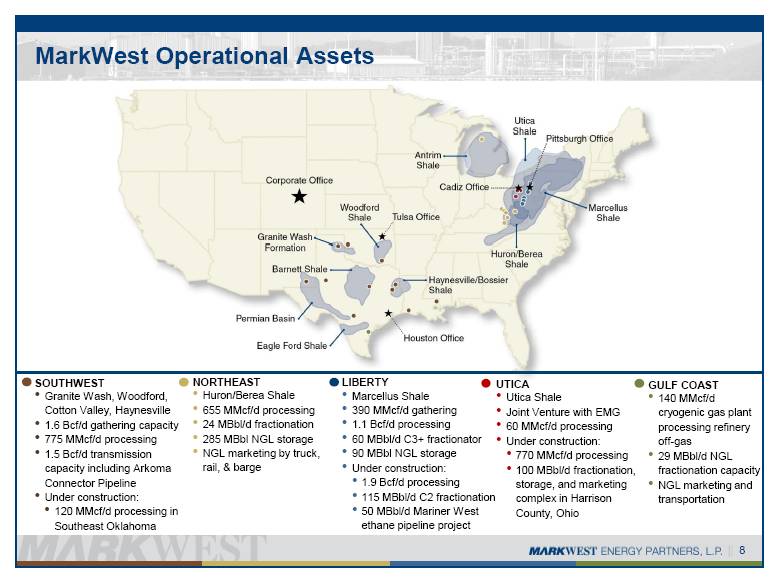
| MarkWest Operational Assets UTICA Utica Shale Joint Venture with EMG 60 MMcf/d processing Under construction: 770 MMcf/d processing 100 MBbl/d fractionation, storage, and marketing complex in Harrison County, Ohio SOUTHWEST Granite Wash, Woodford, Cotton Valley, Haynesville 1.6 Bcf/d gathering capacity 775 MMcf/d processing 1.5 Bcf/d transmission capacity including Arkoma Connector Pipeline Under construction: 120 MMcf/d processing in Southeast Oklahoma NORTHEAST Huron/Berea Shale 655 MMcf/d processing 24 MBbl/d fractionation 285 MBbl NGL storage NGL marketing by truck, rail, & barge LIBERTY Marcellus Shale 390 MMcf/d gathering 1.1 Bcf/d processing 60 MBbl/d C3+ fractionator 90 MBbl NGL storage Under construction: 1.9 Bcf/d processing 115 MBbl/d C2 fractionation 50 MBbl/d Mariner West ethane pipeline project GULF COAST 140 MMcf/d cryogenic gas plant processing refinery off-gas 29 MBbl/d NGL fractionation capacity NGL marketing and transportation 8 |
| 2012 Forecasted Segment Operating Income Contributions to Operating Income by Segment 9 2012 Forecasted Segment Operating Income 2012 Segment Forecasted Operating Income 2012 Forecasted Segment Operating Income 46% 27% 7% 20% Southwest Gulf Coast Northeast Liberty |
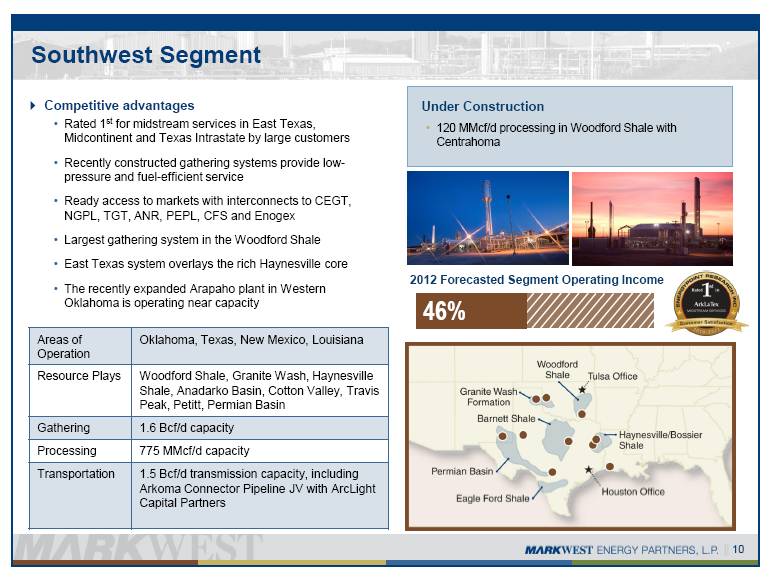
| Southwest Segment Competitive advantages Rated 1st for midstream services in East Texas, Midcontinent and Texas Intrastate by large customers Recently constructed gathering systems provide low-pressure and fuel-efficient service Ready access to markets with interconnects to CEGT, NGPL, TGT, ANR, PEPL, CFS and Enogex Largest gathering system in the Woodford Shale East Texas system overlays the rich Haynesville core The recently expanded Arapaho plant in Western Oklahoma is operating near capacity Under Construction 120 MMcf/d processing in Woodford Shale with Centrahoma Areas of Operation Oklahoma, Texas, New Mexico, Louisiana Resource Plays Woodford Shale, Granite Wash, Haynesville Shale, Anadarko Basin, Cotton Valley, Travis Peak, Petitt, Permian Basin Gathering 1.6 Bcf/d capacity Processing 775 MMcf/d capacity Transportation 1.5 Bcf/d transmission capacity, including Arkoma Connector Pipeline JV with ArcLight Capital Partners 10 2012 Forecasted Segment Operating Income |
| Gulf Coast Segment Competitive advantages Rated 1st in onshore Gulf Coast midstream services by large customers Provide high-quality processing and fractionation services to six major refining complexes Nearly 75% of our inlet volume is under long-term contracts Provide high-purity hydrogen to refiners for production of ultra-low sulfur diesel fuel Our plant reduces overall refinery emissions by converting refinery off-gas to valuable products The recently completed 4th inlet compressor eliminates down time for routine maintenance Area of Operations Corpus Christi, Texas Processing 140 MMcf/d capacity Fractionation 29,000 Bbl/d capacity NGL Marketing & Transportation Ethane, ethylene, propane, propylene, isobutane, normal butane, butylenes, and pentanes Other High-purity hydrogen production 11 2012 Segment Forecasted Operating Income |
| Northeast Segment Competitive advantages Rated 1st for midstream services in the Appalachian Basin by all customers We are the largest gas processor and fractionator in the Appalachian Basin We have operated vertically integrated gas processing, fractionation, storage, and marketing in the Northeast for nearly 25 years In Appalachia, approximately 60% of the volume we process and fractionate is under contract for at least 10 years Areas of Operation Kentucky, West Virginia, Michigan Resource Plays Appalachian Basin, Huron/Berea Shale, the Niagaran Reef Processing 655 MMcf/d capacity Fractionation 24,000 Bbl/d capacity NGL Marketing & Storage NGL marketing by truck, rail and barge 285,000 Bbl NGL capacity with access to 1.2 MBbls of propane storage Transportation 250 mile crude oil transmission pipeline 12 2012 Forecasted Segment Operating Income |
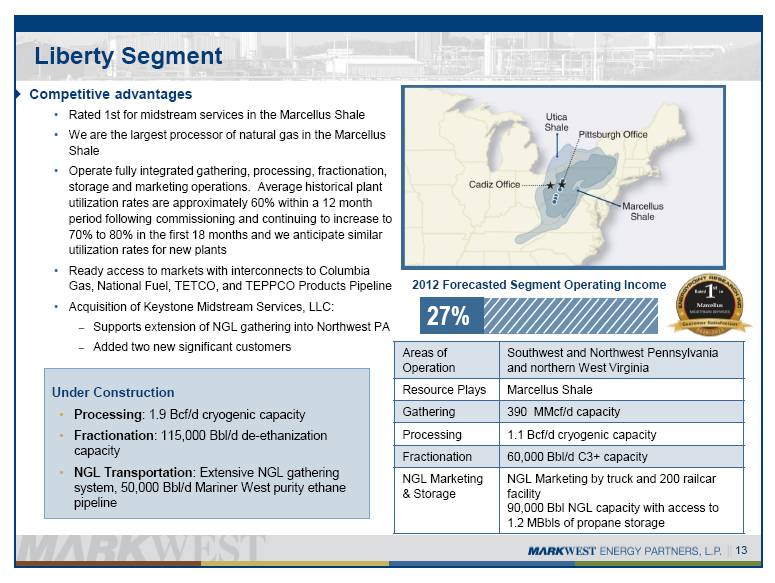
| Liberty Segment Competitive advantages Rated 1st for midstream services in the Marcellus Shale We are the largest processor of natural gas in the Marcellus Shale Operate fully integrated gathering, processing, fractionation, storage and marketing operations. Average historical plant utilization rates are approximately 60% within a 12 month period following commissioning and continuing to increase to 70% to 80% in the first 18 months and we anticipate similar utilization rates for new plants Ready access to markets with interconnects to Columbia Gas, National Fuel, TETCO, and TEPPCO Products Pipeline Acquisition of Keystone Midstream Services, LLC: Supports extension of NGL gathering into Northwest PA Added two new significant customers Areas of Operation Southwest and Northwest Pennsylvania and northern West Virginia Resource Plays Marcellus Shale Gathering 390 MMcf/d capacity Processing 1.1 Bcf/d cryogenic capacity Fractionation 60,000 Bbl/d C3+ capacity NGL Marketing & Storage NGL Marketing by truck and 200 railcar facility 90,000 Bbl NGL capacity with access to 1.2 MBbls of propane storage Under Construction Processing: 1.9 Bcf/d cryogenic capacity Fractionation: 115,000 Bbl/d de-ethanization capacity NGL Transportation: Extensive NGL gathering system, 50,000 Bbl/d Mariner West purity ethane pipeline 13 2012 Forecasted Segment Operating Income |
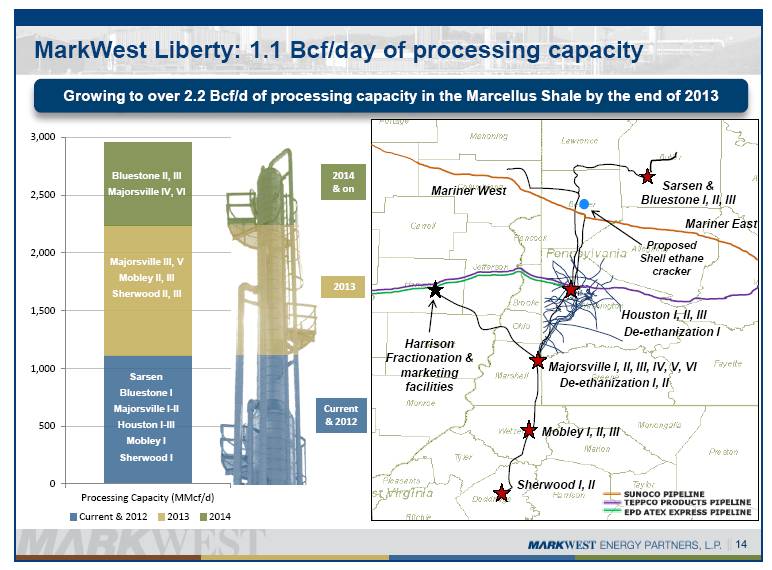
| MarkWest Liberty: 1.1 Bcf/day of processing capacity 14 Growing to over 2.2 Bcf/d of processing capacity in the Marcellus Shale by the end of 2013 TEPPCO PRODUCTS PIPELINE SUNOCO PIPELINE EPD ATEX EXPRESS PIPELINE Mariner West De-ethanization I Houston I, II, III De-ethanization I, II Majorsville I, II, III, IV, V, VI Sarsen & Bluestone I, II, III Sherwood I, II Mobley I, II, III Harrison Fractionation & marketing facilities Proposed Shell ethane cracker Sarsen Bluestone I Majorsville I-II Houston I-III Mobley I Sherwood I Majorsville III, V Mobley II, III Sherwood II, III Bluestone II, III Majorsville IV, VI 2014 & on 2013 Current & 2012 Mariner East 3,000 2,500 2,000 1,500 1,000 500 0 Processing Capacity (MMcf/d) Current&2012 2013 2014 |
| Liberty Project Schedule 15 Current Operations Project Schedule Houston I, II & III 355 MMcf/d De-ethanization 38,000 Bbl/d Mid-2013 C3+ Fractionation 60,000 Bbl/d Mariner West ethane pipeline 50,000 Bbl/d 3Q13 Interconnect to TEPPCO pipeline Rail Loading 200 Rail cars Truck Loading 8 Bays Majorsville I & II 270 MMcf/d Majorsville III 200 MMcf/d 1Q13 NGL Pipeline to Houston 43,400 Bbl/d Majorsville IV 200 MMcf/d 2014 Majorsville V 200 MMcf/d 4Q13 Majorsville VI 200 MMcf/d 2014 De-ethanization I 38,000 Bbl/d Mid-2013 De-ethanization II 38,000 Bbl/d 1Q14 Purity Ethane Pipeline to Houston 3Q13 Mobley I 200 MMcf/d Mobley II 120 MMcf/d 1Q13 NGL Pipeline to Majorsville Mobley III 200 MMcf/d 4Q13 Sherwood I 200 MMcf/d Sherwood II 200 MMcf/d 2Q13 Sherwood III 200 MMcf/d 3Q13 200 NGL Pipeline to Mobley 1Q13 Sarsen 40 MMcf/d Bluestone II 120 MMcf/d 1Q14 Bluestone I 50 MMcf/d Bluestone III 200 MMcf/d TBD NGL Pipeline into Northwest PA 4Q13 Keystone Processing Complex Sherwood Processing Complex Mobley Processing Complex Majorsville Processing and Fractionation Complex Houston Processing and Fractionation Complex Sherwood Processing Complex Keystone Processing Complex Houston Processing and Fractionation Complex Majorsville Processing and Fractionation Complex Mobley Processing Complex |
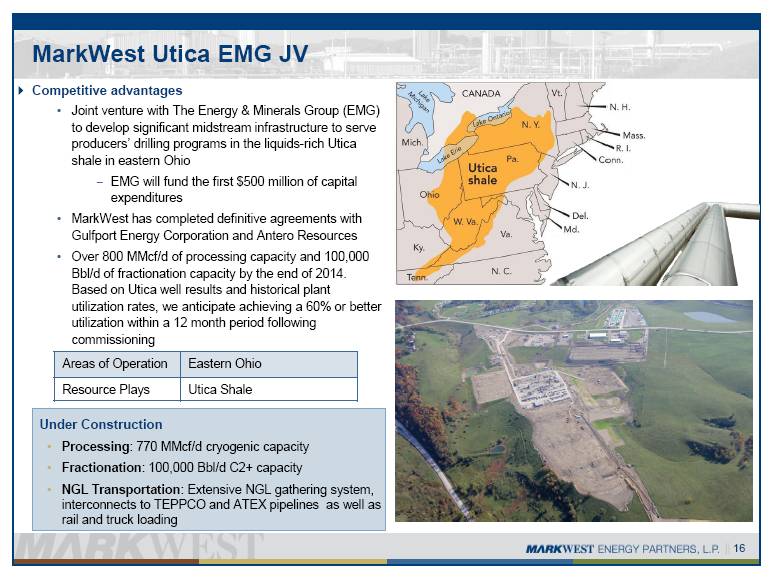
| MarkWest Utica EMG JV Competitive advantages Joint venture with The Energy & Minerals Group (EMG) to develop significant midstream infrastructure to serve producers’ drilling programs in the liquids-rich Utica shale in eastern Ohio EMG will fund the first $500 million of capital expenditures MarkWest has completed definitive agreements with Gulfport Energy Corporation and Antero Resources Over 800 MMcf/d of processing capacity and 100,000 Bbl/d of fractionation capacity by the end of 2014. Based on Utica well results and historical plant utilization rates, we anticipate achieving a 60% or better utilization within a 12 month period following commissioning Areas of Operation Eastern Ohio Resource Plays Utica Shale Under Construction Processing: 770 MMcf/d cryogenic capacity Fractionation: 100,000 Bbl/d C2+ capacity NGL Transportation: Extensive NGL gathering system, interconnects to TEPPCO and ATEX pipelines as well as rail and truck loading 16 |
| 17 The Utica Shale has a recoverable potential of 1.3 billion to 5.5 billion barrels of oil and 3.8 to 15.7 trillion cubic feet of natural gas (1) Horizontal drilling, combined with multistage hydraulic fracturing to create permeable flow paths from wellbores into shale units, has unlocked the resource potential of the play The Point Pleasant formation, a submember of the lower part of the Utica interval, is the primary target of the play The interval Gulfport targeted in the Point Pleasant is an interval greater than 100 feet thick, at a depth shallower than 9,500 feet but deeper than 7,500 feet, with an average TOC content greater than 2% located predominantly within the wet gas and volatile oil phases of the hydrocarbon system Utica Shale Summary Note: Images sourced from Ryder and others, 1998, modified from Wallace and Roen, 1989, industry data from peer company presentations, and internal company data (1) Based on the estimates published by the Ohio Department of Natural Resources Overlapping “Sweet Spot” Thermal Maturity Point Pleasant Thickness (Isopatch Mapping) Point Pleasant TOC (Organic Carbon) Utica Shale – Gulfport Overview Source: Gulfport Energy Corporation |

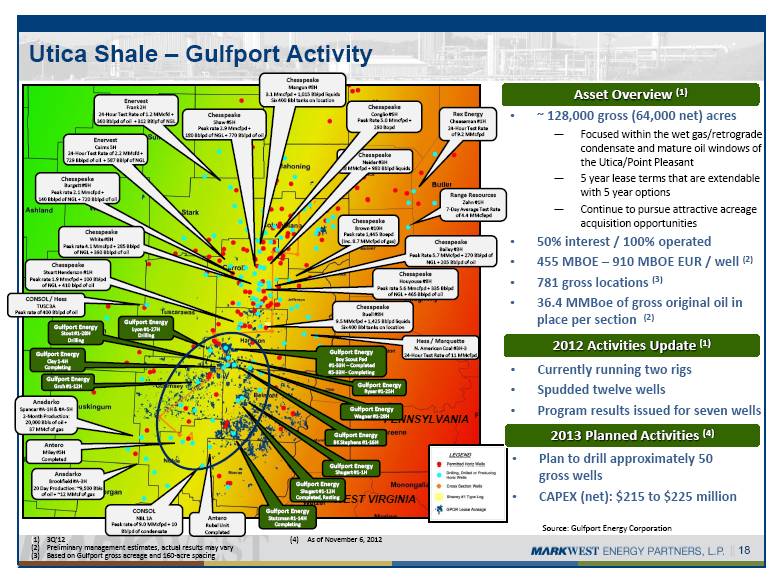
| 18 ~ 128,000 gross (64,000 net) acres Focused within the wet gas/retrograde condensate and mature oil windows of the Utica/Point Pleasant 5 year lease terms that are extendable with 5 year options Continue to pursue attractive acreage acquisition opportunities 50% interest / 100% operated 455 MBOE – 910 MBOE EUR / well (2) 781 gross locations (3) 36.4 MMBoe of gross original oil in place per section (2) Asset Overview (1) 2012 Activities Update (1) Currently running two rigs Spudded twelve wells Program results issued for seven wells OHIO PENNSYLVANIA WEST VIRGINIA Chesapeake Mangun #8H 3.1 Mmcfpd + 1,015 Bblpd liquids Six 400 Bbl tanks on location Chesapeake Buell #8H 9.5 MMcfpd + 1,425 Bblpd liquids Six 400 Bbl tanks on location Anadarko Spencer #A-1H & #A-5H 2-Month Production: 20,000 Bbls of oil + 37 MMcf of gas Range Resources Zahn #1H 7-Day Average Test Rate of 4.4 MMcfepd Chesapeake Neider #3H 3.8 MMcfpd + 980 Bblpd liquids Enervest Frank 2H 24-Hour Test Rate of 1.2 MMcfd + 360 Bblpd of oil + 312 BBlpf of NGL Rex Energy Cheeseman #1H 24-Hour Test Rate of 9.2 MMcfpd Antero Miley #5H Completed Hess / Marquette N. American Coal #3H-3 24-Hour Test Rate of 11 MMcfpd Chesapeake Shaw #5H Peak rate 2.9 Mmcfpd + 180 Bblpd of NGL + 770 Bblpd of oil Chesapeake Brown #10H Peak rate 1,445 Boepd (Inc. 8.7 MMcfpd of gas) Chesapeake Conglio #6H Peak Rate 5.0 Mmcfpd + 290 Bopd Gulfport Energy Wagner #1-28H Gulfport Energy Boy Scout Pad #1-33H – Completed #5-33H - Completing Gulfport Energy Ryser #1-25H Gulfport Energy Shugert #1-12H Completed, Resting Chesapeake Burgett #8H Peak rate 2.1 Mmcfpd + 140 Bblpd of NGL + 720 Bblpd of oil Anadarko Brookfield #A-3H 20 Day Production: ~9,500 Bbls of oil + ~12 MMcf of gas CONSOL / Hess TUSC 3A Peak rate of 400 Bblpd of oil Gulfport Energy Shugert #1-1H Gulfport Energy BK Stephens #1-16H Antero Rubel Unit Completed Gulfport Energy Groh #1-12H Chesapeake Bailey #3H Peak Rate 5.7 MMcfpd + 270 Bblpd of NGL + 205 Bblpd of oil Enervest Cairns 5H 24-Hour Test Rate of 2.2 MMcfd + 729 Bblpd of oil + 587 BBlpf of NGL CONSOL NBL 1A Peak rate of 9.0 MMcfpd + 10 Bblpd of condensate Gulfport Energy Lyon #1-27H Drilling Gulfport Energy Stout #1-28H Drilling Gulfport Energy Clay 1-4H Completing Gulfport Energy Stutzman #1-14H Completing Chesapeake Houyouse #8H Peak rate 5.6 Mmcfpd + 335 Bblpd of NGL + 465 Bblpd of oil Chesapeake White #8H Peak rate 4.1 Mmcfpd + 285 Bblpd of NGL + 390 Bblpd of oil Chesapeake Stuart Henderson #1H Peak rate 1.9 Mmcfpd + 100 Bblpd of NGL + 410 blpd of oil 2013 Planned Activities (4) Plan to drill approximately 50 gross wells CAPEX (net): $215 to $225 million Utica Shale – Gulfport Activity Source: Gulfport Energy Corporation 1) 3Q’12 (2) Preliminary management estimates, actual results may vary (3) Based ib Gulfport gross acreage and 160-acre spacing (4) As of November 6, 2012 |
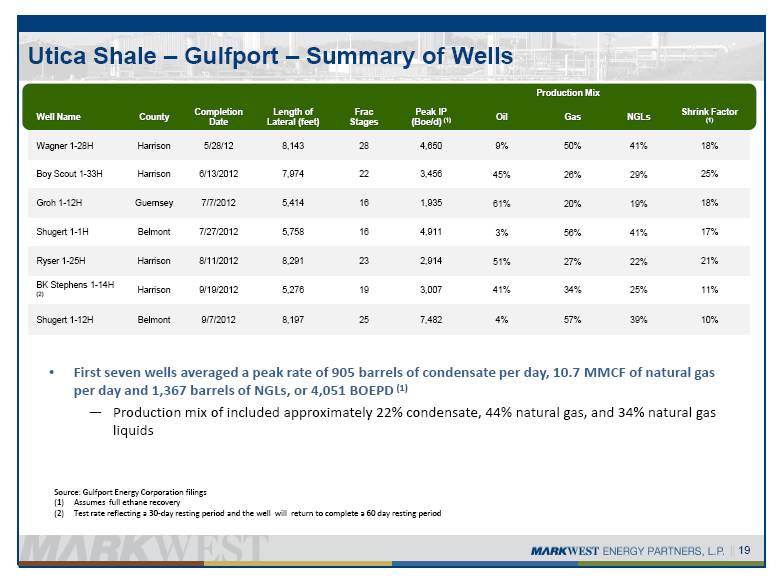
| 19 Utica Shale – Gulfport – Summary of Wells Production Mix Well Name County Completion Date Length of Lateral (feet) Frac Stages Peak IP (Boe/d) (1) Oil Gas NGLs Shrink Factor (1) Wagner 1-28H Harrison 5/28/12 8,143 28 4,650 9% 50% 41% 18% Boy Scout 1-33H Harrison 6/13/2012 7,974 22 3,456 45% 26% 29% 25% Groh 1-12H Guernsey 7/7/2012 5,414 16 1,935 61% 20% 19% 18% Shugert 1-1H Belmont 7/27/2012 5,758 16 4,911 3% 56% 41% 17% Ryser 1-25H Harrison 8/11/2012 8,291 23 2,914 51% 27% 22% 21% BK Stephens 1-14H (2) Harrison 9/19/2012 5,276 19 3,007 41% 34% 25% 11% Shugert 1-12H Belmont 9/7/2012 8,197 25 7,482 4% 57% 39% 10% First seven wells averaged a peak rate of 905 barrels of condensate per day, 10.7 MMCF of natural gas per day and 1,367 barrels of NGLs, or 4,051 BOEPD (1) Production mix of included approximately 22% condensate, 44% natural gas, and 34% natural gas liquids Source: Gulfport Energy Corporation filings (1) Assumes full ethane recovery (2) Test rate reflecting a 30-day resting period and the well will return to complete a 60 day resting period |
| 60,000 net acres of leasehold in core of the play 23% HBP and additional 77% not expiring for 5-plus years Over 90% of acreage has rich gas processing potential 100% operated 3 Tcfe of net resource potential Three wells completed with strong results Fully Integrated 50 MMcf/d of firm refrigeration processing capacity online in 2Q 2013 150 MMcf/d of cryogenic processing capacity online in 3Q 2013 Access to 20,000 Bbl/d of ethane takeaway capacity on Enterprise ATEX pipeline to Mont Belvieu Option to expand to 40,000 Bbl/d Utica Shale – Antero Activity Summary Source: Antero Resources Corporation 20 |
| MarkWest Utica EMG JV Processing Capacity: 185 MMcf/d by 1Q13 21 Growing to 830 MMcf/d of processing capacity in the Utica Shale by the end of 2013 Mobley Sherwood Houston Majorsville Seneca I, II Harrison Fractionator Proposed Shell ethane cracker TEPPCO PRODUCTS PIPELINE EPD ATEX EXPRESS PIPELINE Sarsen & Bluestone INTERCONNECT TO 3RD PARTY PIPELINE and De-ethanization SUNOCO PIPELINE Cadiz Interim Cadiz I, II Seneca Interim Seneca I, II 2013 2012 |
| MarkWest Utica EMG JV Project Schedule 22 Utica Project Schedule Cadiz interim Refrigeration 60 MMcf/d Completed Cadiz I 125 MMcf/d 1Q13 Cadiz II 200 MMcf/d 3Q13 Initial truck and rail loading 3Q13 NGL pipeline to Harrison Fractionator Mid-2013 C3+ Fractionation 60,000 Bbl/d 1Q14 De-ethanization I 40,000 Bbl/d 1Q14 Interconnect with ATEX pipeline 1Q14 Interconnect with TEPPCO pipeline 1Q14 Truck Loading 8 Bays Mid-2013 Rail Loading 200 Rail cars Mid-2013 Interim Seneca Refrigeration 45 MMcf/d 2Q13 Seneca I 200 MMcf/d 3Q13 Seneca II 200 MMcf/d 4Q13 NGL Pipeline to Harrison Fractionator 1Q14 NGL Pipeline from Majorsville to Harrison Fractionator 1Q14 Cadiz Processing Complex in Harrison County, Ohio Harrison County Fractionation Complex Seneca Processing Complex in Noble County, Ohio Other |
| 100% MarkWest Marcellus & Utica Fractionation Capacity 23 Approximately 275,000 Bbl/d of fractionation capacity in the Marcellus and Utica Shales by 2014 2014 2013 Current 2014: Majorsville De-Ethanization 38,000 Bbl/d 2013: Majorsville De-Ethanization 38,000 Bbl/d 2013: Houston De-Ethanization 38,000 Bbl/d 2012: Houston C3+ Fractionation 60,000 Bbl/d 2014 175,000 Bbl/d 100,000 Bbl/d Liberty Utica 2014: Harrison C3+ Fractionation 60,000 Bbl/d 2014: Harrison De-ethanization 40,000 Bbl/d |
| Innovative Midstream Solutions Ethane demand is projected to increase by more than 60% over the next six years We are constructing four large de-ethanizers at the Houston, Majorsville, and Harrison complexes EPD’s ATEX line will be needed to support the conversions and expansions of existing ethylene plants The Mariner projects will provide additional needed ethane takeaway to support the increased demand for ethane. For Mariner East, we have made a 5,000 barrel per day firm commitment 24 Purity product pipeline projects in Marcellus will maximize producer economics Processing Seneca Processing Cadiz Processing & Harrison Fractionation Rich Utica Rich Marcellus Sherwood Processing Marketing Capabilities Truck Rail Pipe Boat Majorsville Processing & De-Ethanization Houston Processing & Fractionation Keystone Processing 70 Mb/d TEPPCO ATEX Mariner Pipelines Mariner West Mariner East |
| FINANCIAL OVERVIEW |

| DCF and Capital Guidance 26 2012 DCF Forecast of $410 million to $430 million 2012 Capital Expenditures Forecast of approximately $1.8 billion 2013 DCF Forecast of $500 million to $575 million 2013 Capital Expenditures Forecast of $1.4 to $1.9 billion 2012 Capital Expenditure Forecast 2013 Capital Expenditure Forecast NEBU 4% Liberty 87% Gulf Coast 1% SWBU 8% Utica 39% NEBU 1% Liberty 57% Gulf Coast < 1% SWBU 3% |
| Lower Cost of Equity Capital Without IDR Load Source: Morgan Stanley as of September 30, 2012 27 0% 2% 4% 6% 8% 10% 12% 14% ETP NKA KMP NS EROC XTEX EEP BPL CMLP BWP GLP RGP WPZ TLP NGLS EPB PNG DPM TCP APL SEP CPNO PAA HEP OKS MWE SXL GEL ACMP EPD WES MMP Cost of Equity Capital Common Unit Yield IDR Load |
| Strong Distribution Growth and Unit Performance 224% Distribution Growth since IPO in May 2002 (12% CAGR) * 2012 assumes an implied distribution of $3.21 per common unit Note: Last unit close price of 11.28.2012 * 28 |
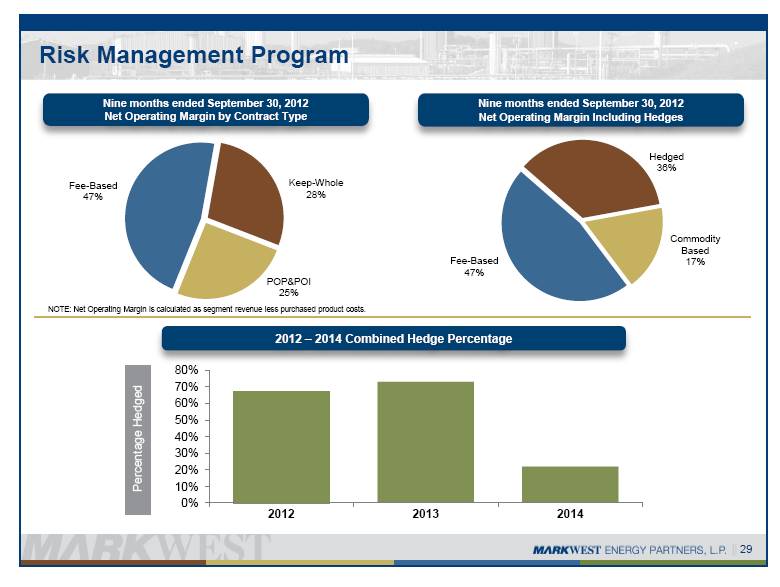
| Nine months ended September 30, 2012 Net Operating Margin by Contract Type 2012 – 2014 Combined Hedge Percentage Risk Management Program NOTE: Net Operating Margin is calculated as segment revenue less purchased product costs. 29 Nine months ended September 30, 2012 Net Operating Margin Including Hedges |
| Increasing Fee-Based Net Operating Margin 30 Note: Forecast Assumes Crude Oil ($/bbl) range of $93.60 to $90.80 and Natural Gas ($/mmbtu) range of $3.29 to $4.55 By 2013, total net operating margin is forecasted to be greater than 60% fee-based |
| Keys to Success Maintain stronghold in key resource plays with high-quality assets Execute growth projects that are well diversified across the asset base 31 EXECUTE, EXECUTE, EXECUTE!!! Provide best-in-class midstream services for our producer customers Preserve strong financial profile Deliver superior & sustainable total returns |
| APPENDIX |

| Reconciliation of DCF and Distribution Coverage ($ in millions) Year ended December 31, 2011 Nine months ended September 30, 2012 Net income $ 106.2 $ 188.7 Depreciation, amortization, impairment, and other non-cash operating expenses 203.9 174.2 Loss on redemption of debt, net of tax benefit 72.1 - Non-cash loss from unconsolidated affiliates 1.1 (0.8) (Contributions to) distributions from unconsolidated affiliates (0.3) 2.2 Non-cash derivative activity (0.3) (101.8) Non-cash compensation expense 3.4 6.3 Provision for income tax – deferred (3.9) 39.4 Cash adjustment for non-controlling interest of consolidated subsidiaries (64.5) (2.5) Revenue deferral adjustment 15.4 5.6 Other 14.3 7.9 Maintenance capital expenditures, net of joint venture partner contributions (14.6) (14.5) Distributable cash flow (DCF) $ 332.8 $ 304.6 Total distributions declared for the period $ 240.7 $ 264.9 Distribution coverage ratio (DCF / Total distributions declared) 1.38x 1.15x 33 |
| Reconciliation of Adjusted EBITDA ($ in millions) Year ended December 31, 2011 LTM ended September 30, 2012 Net income (loss) $ 106.3 $ 126.9 Non-cash compensation expense 3.4 6.0 Non-cash derivative activity (0.3) 0.6 Interest expense (1) 109.9 113.9 Depreciation, amortization, impairments, and other non-cash operating expenses 203.9 229.4 Loss on redemption of debt 79.0 35.5 Provision for income tax 13.7 28.8 Adjustment for cash flow from unconsolidated affiliate 1.3 1.2 Adjustment related to non-guarantor, consolidated subsidiaries (2) (63.9) (40.5) Other (1.9) (2.0) Adjusted EBITDA $ 451.4 $ 499.8 (1) Includes amortization of deferred financing costs and discount, and excludes interest expense related to the Steam Methane Reformer. (2) The non-guarantor subsidiaries, in accordance with Credit Facility covenants, are MarkWest Liberty Midstream & Resources, L.L.C. and its subsidiaries (Liberty), MarkWest Utica EMG L.L.C., MarkWest Pioneer, L.L.C., Wirth Gathering Partnership, and Bright Star Partnership. As of January 1, 2012, Liberty is a wholly owned subsidiary but remains a non-guarantor in accordance with the Credit Facility. 34 |
| ($ in millions) Year ended December 31, 2011 Nine months ended September 30, 2012 Income from operations $ 318.2 $ 319.9 Facility expense 173.6 150.7 Derivative activity 75.5 (71.0) Revenue deferral adjustment 15.4 5.6 Selling, general and administrative expenses 81.2 69.0 Depreciation 150.0 132.2 Amortization of intangible assets 43.6 38.3 Loss on disposal of property, plant, and equipment 8.8 3.0 Accretion of asset retirement obligations 1.1 0.5 Net operating margin $ 867.4 $ 648.3 35 Reconciliation of Net Operating Margin |
| 1515 ARAPAHOE STREET TOWER 1, SUITE 1600 DENVER, COLORADO 80202 PHONE: 303-925-9200 INVESTOR RELATIONS: 866-858-0482 EMAIL: INVESTORRELATIONS@MARKWEST.COM WEBSITE: WWW.MARKWEST.COM |