Table of Contents
UNITED STATES
SECURITIES AND EXCHANGE COMMISSION
Washington, D.C. 20549
FORM6-K
REPORT OF FOREIGN PRIVATE ISSUER PURSUANT TO RULE13a-16 OR
15d-16 UNDER THE SECURITIES EXCHANGE ACT OF 1934
For the month of April, 2017
Commission File Number:001-31221
Total number of pages: 66
NTT DOCOMO, INC.
(Translation of registrant’s name into English)
Sanno Park Tower11-1, Nagata-cho2-chome
Chiyoda-ku, Tokyo100-6150
Japan
(Address of principal executive offices)
Indicate by check mark whether the registrant files or will file annual reports under cover Form20-F or Form40-F.
Form20-F ☒ Form40-F ☐
Indicate by check mark if the registrant is submitting the Form6-K in paper as permitted by RegulationS-T Rule 101(b)(1): ☐
Indicate by check mark if the registrant is submitting the Form6-K in paper as permitted by RegulationS-T Rule 101(b)(7): ☐
SIGNATURES
Pursuant to the requirements of the Securities Exchange Act of 1934, the registrant has duly caused this report to be signed on its behalf by the undersigned, thereunto duly authorized.
| NTT DOCOMO, INC. | ||||||
| Date: April 27, 2017 | By: | /s/ KATSUYUKI TAKAGI | ||||
Katsuyuki Takagi Head of Investor Relations | ||||||
Information furnished in this form:
| 1. | Earnings release for the fiscal year ended March 31, 2017 |
| 2. | Results Presentation for the Fiscal Year Ended March 31, 2017 |
Table of Contents
 |  | |||
Earnings Release | April 27, 2017 | |||
| For the Fiscal Year Ended March 31, 2017 | [U.S. GAAP] |
| Name of registrant: | NTT DOCOMO, INC.(URL https://www.nttdocomo.co.jp/) | |
| Code No.: | 9437 | |
| Stock exchange on which the Company’s shares are listed: | Tokyo Stock Exchange-First Section | |
| Representative: | Kazuhiro Yoshizawa, Representative Director, President and Chief Executive Officer | |
| Contact: | Koji Otsuki, Senior Manager, General Affairs Department / TEL+81-3-5156-1111 | |
| Scheduled date for the general meeting of shareholders: | June 20, 2017 | |
| Scheduled date for dividend payment: | June 21, 2017 | |
| Scheduled date for filing of securities report: | June 21, 2017 | |
| Supplemental material on annual results: | Yes | |
| Presentation on annual results: | Yes (for institutional investors and analysts) |
(Amounts are rounded off to the nearest 1 million yen.)
1. Consolidated Financial Results for the Fiscal Year Ended March 31, 2017 (April 1, 2016 - March 31, 2017)
(1) Consolidated Results of Operations
(Millions of yen, except per share amounts)
| Operating Revenues | Operating Income | Income Before Income Taxes and Equity in Net Income (Losses) of Affiliates | Net Income Attributable to NTT DOCOMO, INC. | |||||||||||||||||||||||||||||
Year ended March 31, 2017 | 4,584,552 | 1.3 | % | 944,738 | 20.7 | % | 949,563 | 22.0 | % | 652,538 | 19.0 | % | ||||||||||||||||||||
Year ended March 31, 2016 | 4,527,084 | 3.3 | % | 783,024 | 22.5 | % | 778,021 | 20.8 | % | 548,378 | 33.7 | % | ||||||||||||||||||||
(Percentages above represent changes compared to the corresponding period of the previous year)
| (Note) | Comprehensive income attributable to | For the fiscal year ended March 31, 2017: | 662,281 million yen | 29.7 | % | |||||
| NTT DOCOMO, INC.: | For the fiscal year ended March 31, 2016: | 510,667 million yen | 12.7 | % |
| Basic Earnings per Share Attributable to NTT DOCOMO, INC. | Diluted Earnings per Share Attributable to NTT DOCOMO, INC. | ROE | ROA | Operating Income Margin | ||||||||||||||||
Year ended March 31, 2017 | 175.12 (yen) | — | 12.0 | % | 12.9 | % | 20.6 | % | ||||||||||||
Year ended March 31, 2016 | 141.30 (yen) | — | 10.3 | % | 10.8 | % | 17.3 | % | ||||||||||||
| (Note) | Equity in net income (losses) of affiliates: | For the fiscal year ended March 31, 2017: | (11,273) million yen | |||
| For the fiscal year ended March 31, 2016: | (5,060) million yen |
(2) Consolidated Financial Position
(Millions of yen, except per share amounts)
| Total Assets | Total Equity (Net Assets) | NTT DOCOMO, INC. Shareholders’ Equity | Shareholders’ Equity Ratio | NTT DOCOMO, INC. Shareholders’ Equity per Share | ||||||||||||
March 31, 2017 | 7,453,074 | 5,561,146 | 5,530,629 | 74.2% | 1,492.91 (yen) | |||||||||||
March 31, 2016 | 7,214,114 | 5,343,105 | 5,302,248 | 73.5% | 1,409.94 (yen) | |||||||||||
(3) Consolidated Cash Flows
(Millions of yen)
| Cash Flows from Operating Activities | Cash Flows from Investing Activities | Cash Flows from Financing Activities | Cash and Cash Equivalents at End of Year | |||||||||||||
Year ended March 31, 2017 | 1,312,418 | (943,094 | ) | (433,097 | ) | 289,610 | ||||||||||
Year ended March 31, 2016 | 1,209,131 | (375,251 | ) | (583,608 | ) | 354,437 | ||||||||||
2. Dividends
| Cash Dividends per Share (yen) | Total Cash Dividends for the Year (Millions of yen) | Payout Ratio | Ratio of Dividends to NTT DOCOMO, INC. Shareholders’ Equity | |||||||||||||||||||||||||||||
Date of Record | End of the First Quarter | End of the Second Quarter | End of the Third Quarter | Year End | Total | |||||||||||||||||||||||||||
Year ended March 31, 2016 | — | 35.00 | — | 35.00 | 70.00 | 267,474 | 49.5 | % | 5.0 | % | ||||||||||||||||||||||
Year ended March 31, 2017 | — | 40.00 | — | 40.00 | 80.00 | 296,994 | 45.7 | % | 5.5 | % | ||||||||||||||||||||||
Year ending March 31, 2018 (Forecasts) | — | 50.00 | — | 50.00 | 100.00 | 56.6 | % | |||||||||||||||||||||||||
3. Forecasts of Consolidated Financial Results for the Fiscal Year Ending March 31, 2018 (April 1, 2017 - March 31, 2018)
(Millions of yen, except per share amounts)
| Operating Revenues | Operating Income | Income Before Income Taxes and Equity in Net Income (Losses) of Affiliates | Net Income Attributable to NTT DOCOMO, INC. | Basic Earnings per Share Attributable to NTT DOCOMO, INC. | ||||||||||||||||||||||||||||||||
Year ending March 31, 2018 | 4,750,000 | 3.6 | % | 960,000 | 1.6 | % | 966,000 | 1.7 | % | 655,000 | 0.4 | % | 176.81 (yen) | |||||||||||||||||||||||
(Percentages above represent changes compared to the corresponding period of the previous year)
Table of Contents
* Notes:
(1) Changes in significant subsidiaries | None | |
(Changes in significant subsidiaries for the fiscal year ended March 31, 2017 which resulted in changes in scope of consolidation) |
(2) Changes in significant accounting policies | ||
i. Changes due to revision of accounting standards and other regulations: | None | |
ii. Others: | Yes | |
(Refer to “5.(5).ii. Change in Accounting Policies” on page 29.) | ||
(3) Number of issued shares (common stock) | ||
i. Number of issued shares (inclusive of treasury stock): | As of March 31, 2017: | 3,899,563,000 shares | ||
| As of March 31, 2016: | 3,958,543,000 shares | |||
ii. Number of treasury stock: | As of March 31, 2017: | 194,977,467 shares | ||
| As of March 31, 2016: | 197,926,250 shares | |||
iii. Number of weighted average common shares outstanding: | For the fiscal year ended March 31, 2017: | 3,726,266,553 shares | ||
| For the fiscal year ended March 31, 2016: | 3,880,823,341 shares | |||
* This earnings release is not subject to an audit.
* Explanation for forecasts of operations and other notes:
| Forecast of results |
Forward-looking statements in this earnings release, such as forecasts of results of operations, are based on the information currently available and the certain asumptions that we regard as reasonable, and therefore actual results may differ materially from those contained in, or suggested by, any forward-looking statements. With regard to the assumptions and other related matters concerning forecasts for the fiscal year ending March 31, 2018, please refer to pages 2 and 18, contained in the attachment.
Table of Contents
| page | ||
| 1 | ||
| 2-18 | ||
| 2-14 | ||
| 15-16 | ||
| 17 | ||
| 18 | ||
| 19-20 | ||
| 21-23 | ||
| 21 | ||
| 21-23 | ||
| 24 | ||
| 25-31 | ||
| 25 | ||
(2) Consolidated Statements of Income and Consolidated Statements of Comprehensive Income | 26 | |
| 27 | ||
| 28 | ||
| 29-31 | ||
| 32 | ||
| 32 | ||
1
Table of Contents

Earnings Release for the Fiscal Year Ended March 31, 2017
1. Information on Consolidated Results
i. Business Overview
The environment surrounding our business has changed significantly. In Japan’s telecommunications market, competition has intensified due to the government’spro-competition policy, the rise oflow-cost smartphones offered by Mobile Virtual Network Operators (MVNOs) and other factors. In addition, we have seen technical advancements in areas such as artificial intelligence (AI), IoT* and drones, as well as an expansion of customer touchpoints by various service providers leveraging loyalty point programs and other means. These changes have brought about both active competition in the telecommunications market and collaboration with new players from other industries, accelerating competition in new markets that transcend the conventional boundaries of the telecommunications business.
Amid these changes in the market environment, we positioned the fiscal year ended March 31, 2017 as the period to make “a vibrant leap toward further growth” beyond income recovery, and promoted the two pillars of “reinforcement of telecommunications business” and “expansion of smart life business and other businesses.” Our strategy is based on valueco-creation, which we call “+d,” through which we pursue the creation of new values by evolving our collaborative activities with a wide range of external partners.
In order to enhance the convenience of “d POINTs,” we made efforts to increase the number of stores participating in the “d POINT” program, including, for example, through our “+d” initiative with McDonald’s Co. Ltd, which enables customers to accumulate and redeem “d POINTs” at all McDonald’s restaurants in Japan. In another effort to create new value, we launched anover-the-counter insurance consultation service, “DOCOMO Insurance Consultation,” at our docomo Shops. Other projects included the commencement of the “DOCOMO Drone Project,” a series of verification trials using drones for shopping and package delivery services, and verification trials for a self-driving bus utilizing mobile network, which we conducted jointly with various external partners to make advances towards solving social issues.
Meanwhile, we continued to enhance customer returns, with emphasis on enriching our “Kake-hodai & Pake-aeru” billing scheme. As a part of such measures, we launched the “docomo Child-Raising Support Program” for families with children, offering additional benefits and convenience and assisting them in making their precious memories.
For the fiscal year ended March 31, 2017, despite a decrease in equipment sales revenues and a negative impact on mobile communications services revenues caused by the further expansion of our “Kake-hodai & Pake-aeru” billing scheme for the purpose of increasing returns to our customers, operating revenues increased by ¥57.5 billion from the previous fiscal year to ¥4,584.6 billion, mainly due to the recovery of telecommunications services revenues as a result of the growth of the packet consumption of our “Kake-hodai & Pake-aeru” billing plan subscribers, the expansion of smartphone use and the demand for tablets and other products purchased as a second mobile device for individual use, and the growth in the number of “docomo Hikari” users, as well as the growth of our smart life business and other businesses such as “dmarket” and other content services.
Operating expenses decreased by ¥104.2 billion from the previous fiscal year to ¥3,639.8 billion, owing primarily to a decline of depreciation expenses as a result of our change in depreciation method used and a decrease in cost of equipment sold and initiatives to pursue further cost efficiency, despite an increase in expenses associated with the expansion of “docomo Hikari” revenues and the growth of revenues from our smart life business and other businesses, as well as an increase in expenses associated with the initiatives for enhancing returns to our customers such as reward points for contract renewal and “docomo Child Raising Support Program.”
As a result, operating income increased by ¥161.7 billion from the previous fiscal year to ¥944.7 billion, which was higher than ¥940.0 billion, the full-year forecast as revised in the second quarter of the fiscal year ended March 31, 2017.
Income before income taxes and equity in net income (losses) of affiliates was ¥949.6 billion, and net income attributable to NTT DOCOMO, INC. increased by ¥104.2 billion from the previous fiscal year to ¥652.5 billion for the fiscal year ended March 31, 2017.
| * | Abbreviation for Internet of Things. A concept that describes a world in which everything is connected to the Internet, enabling remote control and management of devices, etc. |
2
Table of Contents

| DOCOMO Earnings Release | Fiscal Year Ended March 31, 2017 |
Consolidated results of operations for the fiscal years ended March 31, 2016 and 2017 were as follows:
<Results of operations>
| Billions of yen | ||||||||||||||||
| Year ended March 31, 2016 | Year ended March 31, 2017 | Increase (Decrease) | ||||||||||||||
Operating revenues | ¥ | 4,527.1 | ¥ | 4,584.6 | ¥ | 57.5 | 1.3 | % | ||||||||
Operating expenses | 3,744.1 | 3,639.8 | (104.2 | ) | (2.8 | ) | ||||||||||
|
|
|
|
|
|
|
| |||||||||
Operating income | 783.0 | 944.7 | 161.7 | 20.7 | ||||||||||||
Other income (expense) | (5.0 | ) | 4.8 | 9.8 | — | |||||||||||
|
|
|
|
|
|
|
| |||||||||
Income before income taxes and equity in net income (losses) of affiliates | 778.0 | 949.6 | 171.5 | 22.0 | ||||||||||||
Income taxes | 211.7 | 287.7 | 76.0 | 35.9 | ||||||||||||
|
|
|
|
|
|
|
| |||||||||
Income before equity in net income (losses) of affiliates | 566.3 | 661.9 | 95.6 | 16.9 | ||||||||||||
Equity in net income (losses) of affiliates | (5.1 | ) | (11.3 | ) | (6.2 | ) | (122.8 | ) | ||||||||
|
|
|
|
|
|
|
| |||||||||
Net income | 561.2 | 650.6 | 89.4 | 15.9 | ||||||||||||
Less: Net (income) loss attributable to noncontrolling interests | (12.9 | ) | 1.9 | 14.8 | — | |||||||||||
|
|
|
|
|
|
|
| |||||||||
Net income attributable to NTT DOCOMO, INC. | ¥ | 548.4 | ¥ | 652.5 | ¥ | 104.2 | 19.0 | |||||||||
|
|
|
|
|
|
|
| |||||||||
EBITDA margin* | 32.3 | % | 31.9 | % | (0.4) point | — | ||||||||||
|
|
|
|
|
|
|
| |||||||||
ROE* | 10.3 | % | 12.0 | % | 1.7 point | — | ||||||||||
|
|
|
|
|
|
|
| |||||||||
| * | EBITDA and EBITDA margin, as we use them in this earnings release, are different from EBITDA as used in Item 10(e) of RegulationS-K and may not be comparable to similarly titled measures used by other companies. For an explanation of our definitions of EBITDA, EBITDA margin, ROE, see “6. Reconciliations of the DisclosedNon-GAAP Financial Measures to the Most Directly Comparable GAAP Financial Measures” on page 32. |
<Operating revenues>
| Billions of yen | ||||||||||||||||
| Year ended March 31, 2016 | Year ended March 31, 2017 | Increase (Decrease) | ||||||||||||||
Telecommunications services | ¥ | 2,815.5 | ¥ | 2,985.1 | ¥ | 169.6 | 6.0 | % | ||||||||
Mobile communications services revenues | 2,767.6 | 2,844.0 | 76.4 | 2.8 | ||||||||||||
Voice revenues | 849.4 | 875.2 | 25.8 | 3.0 | ||||||||||||
Packet communications revenues | 1,918.2 | 1,968.8 | 50.6 | 2.6 | ||||||||||||
Optical-fiber broadband service and other telecommunications services revenues | 47.9 | 141.1 | 93.2 | 194.5 | ||||||||||||
Equipment sales | 860.5 | 719.2 | (141.3 | ) | (16.4 | ) | ||||||||||
Other operating revenues | 851.1 | 880.3 | 29.2 | 3.4 | ||||||||||||
|
|
|
|
|
|
|
| |||||||||
Total operating revenues | ¥ | 4,527.1 | ¥ | 4,584.6 | ¥ | 57.5 | 1.3 | % | ||||||||
|
|
|
|
|
|
|
| |||||||||
| Note: | Voice revenues include data communications revenues through circuit switching systems. |
<Operating expenses>
| Billions of yen | ||||||||||||||||
| Year ended March 31, 2016 | Year ended March 31, 2017 | Increase (Decrease) | ||||||||||||||
Personnel expenses | ¥ | 286.2 | ¥ | 291.8 | ¥ | 5.6 | 2.0 | % | ||||||||
Non-personnel expenses | 2,427.3 | 2,432.1 | 4.8 | 0.2 | ||||||||||||
Depreciation and amortization | 625.9 | 452.3 | (173.6 | ) | (27.7 | ) | ||||||||||
Impairment loss | 17.7 | 12.2 | (5.5 | ) | (31.0 | ) | ||||||||||
Loss on disposal of property, plant and equipment and intangible assets | 68.8 | 79.6 | 10.9 | 15.8 | ||||||||||||
Communication network charges | 276.9 | 329.4 | 52.5 | 18.9 | ||||||||||||
Taxes and public dues | 41.3 | 42.4 | 1.1 | 2.6 | ||||||||||||
|
|
|
|
|
|
|
| |||||||||
Total operating expenses | ¥ | 3,744.1 | ¥ | 3,639.8 | ¥ | (104.2 | ) | (2.8 | )% | |||||||
|
|
|
|
|
|
|
| |||||||||
| Note: | Impairment losses of goodwill and unamortizable intangible assets, which had previously been included in“Non-personnel expenses,” have been recorded as “Impairment loss” for the fiscal year ended March 31, 2017.“Non-personnel expenses” and “Impairment loss” for the fiscal year ended March 31, 2016 have been reclassified accordingly. |
3
Table of Contents
| DOCOMO Earnings Release | Fiscal Year Ended March 31, 2017 |
ii. Segment Results
Telecommunications Business—
<Results of operations>
| Billions of yen | ||||||||||||||||
| Year ended March 31, 2016 | Year ended March 31, 2017 | Increase (Decrease) | ||||||||||||||
Operating revenues from telecommunications business | ¥ | 3,689.8 | ¥ | 3,711.2 | ¥ | 21.4 | 0.6 | % | ||||||||
Operating income (loss) from telecommunications business | 708.9 | 832.8 | 123.9 | 17.5 | ||||||||||||
Despite a decrease in equipment sales revenues and the negative impact on mobile communications services revenues caused by the further expansion of our “Kake-hodai & Pake-aeru” billing scheme for the purpose of increasing returns to our customers, operating revenues from telecommunications business for the fiscal year ended March 31, 2017 were ¥3,711.2 billion, an increase of ¥21.4 billion, or 0.6% from the previous fiscal year, as a result of the growth of the packet consumption of our “Kake-hodai & Pake-aeru” billing plan subscribers, the expansion of smartphone use and the demand for tablets and other products purchased as a second mobile device for individual use, and the growth in the number of “docomo Hikari” users, of which there were 3.40 million as of March 31, 2017.
Operating expenses from telecommunications business decreased by ¥102.6 billion, or 3.4%, from the previous fiscal year to ¥2,878.4 billion due primarily to a decrease in depreciation expenses as a result of our change in depreciation method used, a decrease in cost of equipment sold and initiatives to pursue further cost efficiency, despite the increase in expenses associated with “docomo Hikari” revenues as well as an increase in expenses associated with initiatives for enhancing returns to our customers, such as reward points for contract renewal and “docomo Child Raising Support Program.”
Consequently, operating income from telecommunications business was ¥832.8 billion, an increase of ¥123.9 billion, or 17.5%, from the same period of the previous fiscal year.
<<Key Topics>>
| • | Enhanced Customer Returns |
We continued to strengthen returns to our customers mainly by leveraging our “Kake-hodai & Pake-aeru” billing scheme in an effort to address to their diverse needs.
In June 2016, to improve the benefits offered to long-term users, we introduced two new subscription courses for customers completing atwo-year contract. These customers can choose between the “Free Course” and “Zutto DOCOMO Discount Course,” subscriptions with or without cancellation fees. At the same time, we raised the amount of monthly discounts offered under the “Zutto DOCOMO Discount” program and started offering “reward points” to customers renewing their subscription contract.
In September 2016, we launched the “Ultra Pack” designed for customers with high data usage. In October 2016, we introduced two new plans forLTE-enabled docomo Feature Phone users: “Kake-hodai Light Plan (for feature phones),” which provides for a monthly flat rate unlimited domestic voice calls of under five minutes, and “Keitai Pack,” atwo-tier rate plan for packet data communications. From November 2016, we started offering the “Kids’ Keitai Plus” rate plan for customers using our “Kids’ Phone.” And starting in January 2017, to cater to users with limited data usage, we enabled users to bundle the “Kake-hodai Light Plan (for smartphones/tablets)” with “Data S Pack.”
As a result of these undertakings, the total number of “Kake-hodai & Pake-aeru” subscriptions as of March 31, 2017 reached 37.07 million, recording an increase of 7.36 million from March 31, 2016.
4
Table of Contents
| DOCOMO Earnings Release | Fiscal Year Ended March 31, 2017 |
| • | Actions for Boosting Smartphone Usage |
From August 2016, we started offering the “Smartphone Debut Discount,” a program that provides first-time smartphone users with discounts on their basic monthly charges for up to 24 months. Furthermore, starting January 2017, we increased the amount of discounts available with the “Kake-hodai Light Plan (for smartphones/tablets)” for first-time smartphone users of age 60 and higher, called the “Senior Special Discount” program which allows seniors to use our services at more affordable rates.
To further accelerate the adoption of smartphones, we continued to expand our product lineup, releasing iPhone 7, iPhone 7 Plus and launching other new models equipped with new features such as “Suguden” (which enables tapless operation of smartphones) as well as our first original smartphone, “MONO MO-01J,” featuring enhanced ease of use.
As a result of these undertakings, the total number of our smartphone/tablet users grew to 35.86 million as of March 31, 2017.
| • | Actions to Enrich Service Offerings and Expand Adoption of “docomo Hikari” |
In April 2016, we added new offerings to our “docomo Hikari” optical-fiber broadband service: “docomo Hikari Denwa” IP telephone service and “docomo Hikari TV Option” IP TV service. By doing so, we have been able to integrate all customer-related operations for our optical-fiber broadband, fixed-line telephone and TV services, from application to after-sales.
We also introduced other new rate plans and services to accommodate the needs of our customers, including the “Hikari Fukusu Wari” package for customers subscribing to two or more “docomo Hikari” lines for a group of people to share, and “docomo Hikari Type C” which allows subscribers to use the optical-fiber broadband and Internet access services offered by our partner cable TV operators as a set.
Further, in February 2017, we released “docomo Hikari Router 01,” a homeWi-Fi router that comes together with a remote assistance service for setting up Internet access andWi-Fi environments. Simultaneously, we commenced “docomo Hikari Router Security,” a new service that allows users to use “docomo Hikari” services easily, conveniently and free from concerns.
Because of our efforts regarding these initiatives and also because our various promotional campaigns were well-received by our customers, the total number of “docomo Hikari” subscriptions grew to 3.40 million as of March 31, 2017, posting a net increase of 1.84 million over the past fiscal year.
| • | Actions for Reinforcement of Communication Network |
In an effort to reinforce our networks, we have expanded the coverage of our “PREMIUM 4G” service to 1,421 cities across Japan as of March 31, 2017. We also improved the speed of network by using carrier aggregation* using a new spectrum band of 3.5GHz from June 2016, and through other new techniques, we commenced a communication service that offers Japan’s fastest maximum downlink speed of 682Mbps in March 2017. Through these measures, we have successfully created a high-speed communication environment that provides customers with comfortable network experience.
We conducted surveys of effective data speeds adhering to the “Guidelines for the Effective Speed Measurement Method of Internet Connection Services Provided by Mobile Telecommunications Carriers and Information Providing Method, etc. for Users” defined by the Ministry of Internal Affairs and Communications. The results indicated that we achieved improvements in both download and upload speeds over the previous year: the median (Android + iOS) of our download speeds was 118Mbps (166% the level of the previous year), and that of our upload speeds was 23Mbps (110% the level of the previous year).
| * | Technology that achieves improvement of data speeds by aggregating multiple carrier frequencies |
5
Table of Contents
| DOCOMO Earnings Release | Fiscal Year Ended March 31, 2017 |
Number of subscriptions by services and other operating data are as follows:
<Number of subscriptions by services>
| Thousand subscriptions | ||||||||||||||||
| March 31, 2016 | March 31, 2017 | Increase (Decrease) | ||||||||||||||
Mobile telecommunication services | 70,964 | 74,880 | 3,916 | 5.5 | % | |||||||||||
Including: “Kake-hodai & Pake-aeru” billing plan | 29,704 | 37,066 | 7,362 | 24.8 | ||||||||||||
Mobile telecommunication services (LTE(Xi)) | 38,679 | 44,544 | 5,865 | 15.2 | ||||||||||||
Mobile telecommunication services (FOMA) | 32,285 | 30,336 | (1,949 | ) | (6.0 | ) | ||||||||||
| Notes: | Number of subscriptions to Mobile telecommunications services, Mobile telecommunications services (LTE(Xi)) and Mobile telecommunications services (FOMA) includes Communication Module services subscriptions. |
<Number of handsets sold>
| Thousand units | ||||||||||||||||
| Year ended March 31, 2016 | Year ended March 31, 2017 | Increase (Decrease) | ||||||||||||||
Number of handsets sold | 26,058 | 27,482 | 1,424 | 5.5 | % | |||||||||||
Mobile telecommunication services (LTE(Xi)) | ||||||||||||||||
New LTE(Xi) subscription | 9,234 | 9,796 | 562 | 6.1 | ||||||||||||
Change of subscription from FOMA | 3,538 | 2,963 | (576 | ) | (16.3 | ) | ||||||||||
LTE(Xi) handset upgrade by LTE(Xi) subscribers | 8,059 | 9,305 | 1,246 | 15.5 | ||||||||||||
Mobile telecommunication services (FOMA) | ||||||||||||||||
New FOMA subscription | 2,374 | 3,162 | 788 | 33.2 | ||||||||||||
Change of subscription from Xi | 101 | 63 | (39 | ) | (38.2 | ) | ||||||||||
FOMA handset upgrade by FOMA subscribers | 2,751 | 2,194 | (557 | ) | (20.3 | ) | ||||||||||
|
|
|
|
|
|
|
| |||||||||
Churn rate* | 0.62 | % | 0.59 | % | (0.03)point | — | ||||||||||
| * | “Churn rate” is calculated excluding the subscriptions and cancellations of subscriptions of Mobile Virtual Network Operators (MVNOs). |
6
Table of Contents
| DOCOMO Earnings Release | Fiscal Year Ended March 31, 2017 |
<Trend of ARPU and MOU*>
| Yen | ||||||||||||||||
| Year ended March 31, 2016 | Year ended March 31, 2017 | Increase (Decrease) | ||||||||||||||
Aggregate ARPU* | ¥ | 4,170 | ¥ | 4,430 | ¥ | 260 | 6.2 | % | ||||||||
Voice ARPU | 1,210 | 1,250 | 40 | 3.3 | ||||||||||||
Data ARPU | 2,960 | 3,180 | 220 | 7.4 | ||||||||||||
Packet ARPU | 2,910 | 2,990 | 80 | 2.7 | ||||||||||||
“docomo Hikari” ARPU | 50 | 190 | 140 | 280.0 | ||||||||||||
|
|
|
|
|
|
|
| |||||||||
MOU* (minutes) | 133 | 137 | 4 | 3.0 | % | |||||||||||
Notes:
| 1. | Definition of ARPU and MOU |
| a. | ARPU (Average monthly Revenue Per Unit): |
Average monthly revenue per unit, or ARPU, is used to measure average monthly operating revenues attributable to designated services on a per user basis. ARPU is calculated by dividing telecommunications services revenues (excluding certain revenues) by the number of active users to our wireless services in the relevant periods, as shown below under “ARPU Calculation Method.” We believe that our ARPU figures provide useful information to analyze the average usage per user and the impacts of changes in our billing arrangements. The revenue items included in the numerators of our ARPU figures are based on our U.S. GAAP results of operations.
| b. | MOU (Minutes of Use): |
Average monthly communication time per user.
| 2. | ARPU Calculation Methods |
Aggregate ARPU= Voice ARPU + Packet ARPU + “docomo Hikari” ARPU
Data ARPU= Packet ARPU + “docomo Hikari” ARPU
| - Voice ARPU | : | Voice ARPU Related Revenues (basic monthly charges, voice communication charges) / Number of active users | ||
| - Packet ARPU | : | Packet ARPU Related Revenues (basic monthly charges, packet communication charges) / Number of active users | ||
| - “docomo Hikari” ARPU | : | “docomo Hikari” ARPU Related Revenues (basic monthly charges, voice communication charges) / Number of active users |
| 3. | Active Users Calculation Method |
Sum of number of active users for each month ((number of users at the end of previous month + number of users at the end of current month) /2) during the relevant period
| 4. | The number of “users” used to calculate ARPU and MOU is the total number of subscriptions, excluding the subscriptions listed below: |
| a. | Subscriptions of communication module services, “Phone Number Storage,” “Mail Address Storage,” “docomo Business Transceiver” and wholesale telecommunication services and interconnecting telecommunications facilities that are provided to Mobile Virtual Network Operators (MVNOs); and |
| b. | Data Plan subscriptions in the case where the customer contracting for such subscription in his/her name also has a subscription for “Xi” or “FOMA” services in his/her name |
| Revenues from communication module services, “Phone Number Storage,” “Mail Address Storage,” “docomo Business Transceiver” and wholesale telecommunications services and interconnecting telecommunications facilities that are provided to Mobile Virtual Network Operators (MVNOs) are not included in the ARPU calculation. |
7
Table of Contents
| DOCOMO Earnings Release | Fiscal Year Ended March 31, 2017 |
Smart life business—
<Results of operations>
| Billions of yen | ||||||||||||||||
| Year ended March 31, 2016 | Year ended March 31, 2017 | Increase (Decrease) | ||||||||||||||
Operating revenues from smart life business | ¥ | 504.1 | ¥ | 501.9 | ¥ | (2.2 | ) | (0.4 | )% | |||||||
Operating income (loss) from smart life business | 46.5 | 57.9 | 11.5 | 24.7 | ||||||||||||
Operating revenues from smart life business for the fiscal year ended March 31, 2017 were ¥501.9 billion, a decrease of ¥2.2 billion, or 0.4%, from the previous fiscal year, due mainly to a decrease in revenues from subsidiaries, despite an increase of content services revenues such as “dmarket” and other content services.
Operating expenses from smart life business were ¥444.0 billion, a decrease of ¥13.7 billion, or 3.0%, from the previous fiscal year, due mainly to a decrease in expenses associated with revenues from our subsidiaries and despite an increase in expenses associated with the growth in content services revenues.
As a consequence, operating income from smart life business was ¥57.9 billion, an increase of ¥11.5 billion, or 24.7%, from the previous fiscal year.
<<Key Topics>>
| • | Initiatives Aimed at Enhancing “dmarket” |
We continued enhancing our “dmarket” lineup by offering new services in our smart life business that are closely related to our customers’ health and livelihoods.
To provide total support for customers’ health, we started offering “dhealthcare pack” in April 2016, an integrated package that combines four health-related services, including the “Aruite-Otoku” application that allows users to earn “d POINTs” from the number of steps recorded on their smartphones. Also, in July 2016, we rebranded our “Home Anshin Partner” service to “dliving,” adding new components such as a childcare support service offered at a discounted rate, and a feature that allows users to check their home electricity consumption, etc. These initiatives, along with the brisk sales of “dmagazine,” resulted in a rise in the combined number of “dmarket” subscriptions* to 16.08 million as of March 31, 2017.
| • | Actions for Proliferation of “d CARD” |
Since October 2016, our “d CARD” credit card service and our “iD” contactless payment service have supported Apple Pay. This enables users of ApplyPay-compatible devices to use “d CARD” on Apple Pay, and users of iPhone 7, iPhone 7 Plus and Apple Watch Series 2 to pay with “iD” for purchases at stores.
In November 2016, we started offering “d CARD PREPAID,” a prepaid card which can be used for payments at all stores accepting “iD” across Japan as well as those accepting Mastercard worldwide. It also carries the features of the “d POINT CARD” for accumulating and using points.
| • | Launch of New Sports Content Service toward the Realization of a Smart Life |
In February 2017, in collaboration with the Perform Group, we launched a new sports content service, “DAZN for docomo.” The service offers both live andon-demand video with unlimited viewing access to Meiji Yasuda J. League soccer games and other popular sports programs from Japan and overseas.
| • | Actions to Support Regional Vitalization |
Starting in December 2016, our “gacco” online video learning service was adopted as thee-learning system for the “Regional Revitalization College” program promoted by the Office for Promotion of Regional Revitalization in the Cabinet Office of the government of Japan. The program offers a total of 37 professional courses, including a course on “how to build attractive tourist destinations.”
| * | The total number of users using “dTV,” “danime store,” “dhits,” “dkids,” “dmagazine,” “dgourmet,” “dhealthcare pack” and “dliving” services under a monthly subscription arrangement. |
8
Table of Contents
| DOCOMO Earnings Release | Fiscal Year Ended March 31, 2017 |
| • | Bicycle Sharing Service by Using IoT |
To address social issues such as the need to reduce greenhouse gas emissions and revitalize regions and tourism, we worked to expand the bicycle sharing business. Specifically, including an experiment carried out over a wide area in Tokyo*, we operated bicycle sharing services with local government business partners, and we enriched usage of services by expanding service areas and improving their qualities.
| * | Conducted with Chiyoda City, Chuou City, Minato City, Shinjuku City, Bunkyo City and Koto City |
9
Table of Contents
| DOCOMO Earnings Release | Fiscal Year Ended March 31, 2017 |
Other businesses—
<Results of operations>
| Billions of yen | ||||||||||||||||
| Year ended March 31, 2016 | Year ended March 31, 2017 | Increase (Decrease) | ||||||||||||||
Operating revenues from other businesses | ¥ | 359.3 | ¥ | 400.4 | ¥ | 41.1 | 11.4 | % | ||||||||
Operating income (loss) from other businesses | 27.7 | 54.0 | 26.3 | 94.9 | ||||||||||||
Operating revenues from other businesses for the fiscal year ended March 31, 2017 amounted to ¥400.4 billion, an increase of ¥41.1 billion, or 11.4%, from the previous fiscal year, driven mainly by an increase in the number of subscriptions for our “Mobile Device Protection Service” and the growth of revenues relating to IoT businesses.
Operating expenses from other businesses were ¥346.4 billion, an increase of ¥14.8 billion, or 4.5%, from the previous fiscal year, as a result of rises in expenses associated with the expansion of revenues from our “Mobile Device Protection Service” and other services.
Consequently, operating income from other businesses was ¥54.0 billion, an increase of ¥26.3 billion, or 94.9%, from the previous fiscal year.
<<Key Topics>>
| • | Expansion of IoT |
To allow customers to utilize LTE connections in IoT solutions that involve high-speed transmission of large-capacity content, we started marketing aLTE-enabled ubiquitous communication module“UM04-KO.” The module enables stress-free execution of remote control/operational support solutions, such as remote monitoring of images that require high-speed and large-capacity transmission.
To encourage the use of modules in a wide variety of applications, we created the “LTE Ubiquitous Plan,” a billing scheme that enables the use of modules at lower transmission speeds and reduced power.
| • | Promotion of Global Platform Business through DOCOMO Digital Limited |
DOCOMO’s subsidiary, DOCOMO Digital Limited (DDL), mainly offers mobile payment platforms such as carrier billing payment and digital marketing-driven mobile content distribution in more than 35 countries through DOCOMO Digital Germany GmbH and Buongiorno S.p.A., subsidiaries of DDL.
DDL has positioned mobile payment platforms as a pillar of future growth in the fiscal year ended March 31, 2017, they promoted its expansion by providing carrier billing payment for service providers and mobile network operators in various countries. Customers of the carrier billing payment are able to make payments of monthly charges and contents for purchases at App stores through their billing statements.
| • | Supporting Program for Business Startups |
We support the growth of startup companies and innovate together with them through both our investment in such startups and the activities of DOCOMO Innovation Village.
With respect to our investment activities, we strategically invest in businesses that provide synergies to our own business, mainly targeting business sectors related to telecommunications and sectors that can provide added value through ICT* such as medicine, education, agriculture and others.
With respect to the activities of DOCOMO Innovation Village, we support startup companies through our three core programs: Village Alliance, Village Community and Village Social Entrepreneurs. Specifically, in each program, we offer opportunities to make connections between us and startups companies or between our employees and entrepreneurs, and supported entrepreneurs who aim to solve social issues.
| * | Abbreviation for Information and Communication Technology. |
10
Table of Contents
| DOCOMO Earnings Release | Fiscal Year Ended March 31, 2017 |
iii. CSR Activities
We aspire to help build a society in which everyone can share in a prosperous life of safety, security and comfort, beyond borders and across generations. We believe it is our corporate social responsibility (“CSR”) to fulfill the two aspects of (i) “Innovative docomo,” to solve various social issues in the fields of IoT, medicine, healthcare, education and agriculture through the“co-creation of social values,” an initiative that we plan to pursue together with various partners to create new services and businesses, and (ii) “Responsible docomo,” to thoroughly ensure fair, transparent and ethical business operations as a foundation for the creation of such values. Accordingly, we will strive to realize a sustainable society while expanding our own businesses.
DOCOMO was selected as a component of the Dow Jones Sustainability Asia Pacific Index (DJSI Asia Pacific), a part of the Down Jones Sustainability Indices, which is one of the world’s leading indices for ESG* investment. Also, DOCOMO was selected as a component of the FTSE4Good Index.
We aspire to build a better future for the earth together with our various stakeholders. In October 2016 we established the “DOCOMO Global Environmental Charter” which sets forth our aspirations for the future, and established specific environmental targets in our “Green Action Plan 2030.”
| * | An investment method that is named after and focuses on the three elements of “Environment,” “Social” and “Governance.” |
<Innovative docomo>
| • | Cooperation with Local Governments for the Solution of Social Issues |
In April 2016 we entered into a “business collaboration agreement for the use of ICT and data” with Kobe City for the purpose of solving various social issues in the regional communities. As a project promoted under this agreement, we commenced the “Kobe City-DOCOMO urban monitoring service (verification trial)” using BLE* tags for monitoring children.
We have promoted various other joint initiatives with local governments across Japan. One example is a collaboration agreement with Sendai City in August 2016. The initiative aims to support the development of a sustainably vibrant town with three main areas of focus: “disaster prevention and mitigation,” “regional revitalization” and “feasibility tests of near-future technology” that uses drones and other technologies.
| * | Abbreviation for Bluetooth Low Energy. One of the extended specifications of Bluetooth that enables communication with reduced power consumption. |
| • | New Service for Customers with Hearing Difficulties |
In October 2016 we started a trial offering of “Mierudenwa” to assist customers with hearing difficulties. The service automatically converts and displays a caller’s spoken words into text in real time.
<Responsible docomo>
| • | Actions for Disaster Response and Preparedness |
In the aftermath of the 2016 Kumamoto Earthquakes, in addition to securing and restoring communication services, we provided assistance to the people and areas affected by the disaster by affording free battery-charging services andWi-Fi spots at evacuation shelters and through the donation of relief funds.
In the aftermath of the torrential rain and other harms caused by Typhoon No.10 in 2016, we promptly secured and restored communication services. We also implemented various measures to help disaster victims affected by the 2016 Middle Tottori Earthquake and the large-scale fire that devastated Itoigawa City, Niigata Prefecture, including the free provision of battery chargers and partial waiver of handset repair fees.
Other measures we have taken to step up our disaster preparedness include the upgrade of our large-zone base stations by addingLTE-compatibility and conversion of existing base stations covering coastal and mountainous areas into medium-zone base stations to secure communications in these areas. These preparations taken in advance will allow customers to use mobile phones free of concerns in the event of a disaster. We have also added foreign language and illustration-based guidance functions to our “Area Mail” emergency alert service in a preparatory effort to provide our diverse customer base with greater peace of mind when a disaster does occur.
11
Table of Contents
| DOCOMO Earnings Release | Fiscal Year Ended March 31, 2017 |
| • | For the Recovery of Disaster-Stricken Areas in Tohoku Japan |
We donated a total of approximately ¥72.6 million to municipalities in the disaster-stricken areas (12 municipalities in Iwate, Miyagi and Fukushima Prefectures, and 3 intermediary organizations). Donations were made by approximately 9,900 employees who participated in the Company’s recovery support program along with contributions from the Company itself.
In addition, at the oyster and seaweed farms of Higashi-Matsushima City, Miyagi Prefecture damaged by the 2011 Great East Japan Earthquake, we promoted fishery “+d” initiatives by installingICT-enabled buoys with the aim of improving the productivity of fishermen and realizing high-quality seafood production. In Fukushima Prefecture, we provided a “tablet-based information distribution and community support system” to help sustain the community of residents living in temporary housing units. Further, to support the continued use of this system by the senior population, we also hosted community gatherings and other regular events using tablet devices.
| • | Continued Efforts in “Smartphone and Mobile Phone Safety Class” and “DOCOMO Hearty Lecture” |
DOCOMO’s “Smartphone and Mobile Phone Safety Classes” enlighten participants on the rules and manners of using smartphones and mobile phones, as well as to how to respond to troubles that may arise with their use. In the year ended March 31, 2017, we held a total of approximately 7,900 sessions with a cumulative participation of approximately 1.26 million people. In April 2016, we launched a new initiative convening the class in conjunction with a crime prevention seminar hosted by the Hiroshima Prefectural Police.
We also held 114 sessions of our “DOCOMO Hearty Lecture” for people with disabilities, introducing convenient features and usage tips for smartphones and other mobile devices. The lectures had a participation of a total of 1,200 people.
| • | Mobile Communication Fund Activities |
The Mobile Communication Fund (MCF) is anon-profit organization established by DOCOMO with the aim to support research activities. In the year ended March 31, 2017, the Fund continued its sponsorship of the “DOCOMO Mobile Science Award,” given to outstanding research and dissertations relating to mobile communications technologies. The MCF presented an Award of Excellence (with ¥6 million in prize money) in each of the following divisions: Advanced Technology, Basic Science and Social Science Divisions. The Fund also provided scholarships totaling ¥56.16 million to 39 privately financed international students from Asia and provided subsidies totaling ¥35.00 million to 68 different civic activities undertaken for the health and development of children and relief for the 2016 Kumamoto Earthquake victims.
12
Table of Contents
| DOCOMO Earnings Release | Fiscal Year Ended March 31, 2017 |
iv. Trend of Capital Expenditures
<Capital expenditures>
| Billions of yen | ||||||||||||||||
| Year ended March 31, 2016 | Year ended March 31, 2017 | Increase (Decrease) | ||||||||||||||
Total capital expenditures | ¥ | 595.2 | ¥ | 597.1 | ¥ | 1.9 | 0.3 | % | ||||||||
Telecommunications business | 573.9 | 576.2 | 2.3 | 0.4 | ||||||||||||
Smart life business | 13.9 | 14.4 | 0.5 | 3.9 | ||||||||||||
Other businesses | 7.5 | 6.5 | (0.9 | ) | (12.5 | ) | ||||||||||
The principal capital expenditures made during the fiscal year ended March 31, 2017 are summarized below.
| • | Expansion of Telecommunications Facilities |
As a result of our aggressiveroll-out of “PREMIUM 4G” service in the high-traffic areas in urban centers to construct a network that can offer “greater comfort of access” to our customers, the total number of “PREMIUM 4G”-compatible base stations increased from previously 22,800 stations as of March 31, 2016 to 69,700 stations as of March 31, 2017.
In addition, in pursuit of further coverage improvement of our LTE service, we increased the total number of LTE base stations from 138,100 as of March 31, 2016 to 161,900 as of March 31, 2017.
| • | Measures for More Efficient Use of Capital Expenditures |
Toward the goal of further strengthening our managerial structure, we continued to pursue more efficient use of capital expenditures through reduction of equipment procurement and other costs, and further improvement of the efficiency of telecommunications facilities construction. We also aggressively promoted the integration and/or capacity expansion of our facilities with the introduction of high-performance equipment for the purpose of reducing our future network operation costs.
As a result of the above measures, the total capital expenditures for the fiscal year ended March 31, 2017 increased by 0.3% from the previous fiscal year to ¥597.1 billion.
13
Table of Contents
| DOCOMO Earnings Release | Fiscal Year Ended March 31, 2017 |
v. Prospects for the Fiscal Year Ending March 31, 2018
The environment surrounding our business has changed significantly.
In Japan’s telecommunications market, competition has intensified due to the government’spro-competition policy, the rise oflow-cost smartphones offered by Mobile Virtual Network Operators (MVNOs) and other factors. In addition, we have seen technical advancements in areas such as artificial intelligence (AI), IoT and drones, as well as an expansion of customer touchpoints by various service providers leveraging loyalty point programs and other means. These changes have brought about both active competition in the telecommunications market and collaboration with new players from other industries, accelerating competition in new markets that transcend the conventional boundaries of the telecommunications business.
We position the fiscal year ending March 31, 2018 as the year to “tackle evolution,” taking the first steps towards the delivery of our Medium-Term Strategy 2020 “Declaration beyond.” We will do so by moving forward with the creation and evolution of services, business evolution with “+d” and reinforcement & evolution of all foundations. Through these endeavors, we expect to post an increase in both operating revenues and operating income for the fiscal year ending March 31, 2018.
Operating revenues for the fiscal year ending March 31, 2018 are estimated to increase by ¥165.4 billion from the previous fiscal year to ¥4,750.0 billion, driven by an increase in optical-fiber broadband service and other telecommunications service revenues due to the projected growth of “docomo Hikari” users, an increase in mobile communications services revenues due to the reduction of negative impact from “Monthly Support” discount program and other factors.
On the expenses side, operating expenses are expected to increase by ¥150.2 billion to ¥3,790.0 billion, due to an increase in expenses associated with the growth of revenues from “docomo Hikari,” an increase in depreciation expenses and other factors.
Accordingly, operating income for the fiscal year ending March 31, 2018 is estimated to be ¥960.0 billion, an increase of ¥15.3 billion from the previous fiscal year.
| Billions of yen | ||||||||||||||||
| Year ended March 31, 2017 (Actual results) | Year ending March 31, 2018 (Forecasts) | Increase (Decrease) | ||||||||||||||
Operating revenues | ¥ | 4,584.6 | ¥ | 4,750.0 | ¥ | 165.4 | 3.6 | % | ||||||||
Operating income | 944.7 | 960.0 | 15.3 | 1.6 | ||||||||||||
Income before income taxes and equity in net income (losses) of affiliates | 949.6 | 966.0 | 16.4 | 1.7 | ||||||||||||
Net income attributable to NTT DOCOMO, INC. | 652.5 | 655.0 | 2.5 | 0.4 | ||||||||||||
Capital expenditures | 597.1 | 570.0 | (27.1 | ) | (4.5 | ) | ||||||||||
Adjusted free cash flows excluding changes in investments for cash management purposes* | 664.5 | 710.0 | 45.5 | 6.8 | ||||||||||||
EBITDA* | 1,463.4 | 1,480.0 | 16.6 | 1.1 | ||||||||||||
EBITDA margin* | 31.9 | % | 31.2 | % | (0.7)point | — | ||||||||||
ROE* | 12.0 | % | 11.5 | % | (0.5)point | — | ||||||||||
| * | EBITDA and EBITDA margin, as we use them, are different from EBITDA as used in Item 10(e) of RegulationS-K and may not be comparable to similarly titled measures used by other companies. For an explanation of our definition of adjusted free cash flows excluding changes in investments for cash management purposes, EBITDA, EBITDA margin, and ROE, see “6. Reconciliations of the DisclosedNon-GAAP Financial Measures to the Most Directly Comparable GAAP Financial Measures” on page 32. | |
| Notes: | Japan’s telecommunications sector is characterized by rapid changes in the market environment due to technical innovations, market entry by new competitors and other factors. To respond to such changes, our corporate group may introduce new billing plans or other measures that could potentially have a significant impact on our revenues and income. The timing of introduction of such measures will be decided after comprehensively taking into consideration our operational circumstances and the actions of our competitors, and therefore, is not necessarily decided beforehand. Such measures, depending on the timing of implementation, may significantly affect our results forecasts to be made at the time of our first-half results announcement. Providing such prospects on a half-year basis, therefore, may not be adequate or useful as information to be disclosed to investors. Accordingly, we will provide prospects for the full year only, and report progressvis-à-vis the projected full-year forecasts by disclosing actual results on a quarterly basis. | |
14
Table of Contents
��
| DOCOMO Earnings Release | Fiscal Year Ended March 31, 2017 |
i. Financial Position
| Billions of yen | ||||||||||||||||
| March 31, 2016 | March 31, 2017 | Increase (Decrease) | ||||||||||||||
Total assets | ¥ | 7,214.1 | ¥ | 7,453.1 | ¥ | 239.0 | 3.3 | % | ||||||||
Total NTT DOCOMO, INC. shareholders’ equity | 5,302.2 | 5,530.6 | 228.4 | 4.3 | ||||||||||||
Total liabilities | 1,854.8 | 1,869.0 | 14.2 | 0.8 | ||||||||||||
Including: Interest bearing liabilities | 222.2 | 221.9 | (0.3 | ) | (0.1 | ) | ||||||||||
ii. Cash Flow Conditions
| ||||||||||||||||
| Billions of yen | ||||||||||||||||
| Year ended March 31, 2016 | Year ended March 31, 2017 | Increase (Decrease) | ||||||||||||||
Net cash provided by operating activities | ¥ | 1,209.1 | ¥ | 1,312.4 | ¥ | 103.3 | 8.5 | % | ||||||||
Net cash used in investing activities | (375.3 | ) | (943.1 | ) | (567.8 | ) | (151.3 | ) | ||||||||
Net cash provided by (used in) financing activities | (583.6 | ) | (433.1 | ) | 150.5 | 25.8 | ||||||||||
Free cash flows (1) | 833.9 | 369.3 | (464.6 | ) | (55.7 | ) | ||||||||||
Free cash flows excluding changes in investments for cash management purposes (2)* | 598.7 | 664.5 | 65.8 | 11.0 | ||||||||||||
| Notes: | (1) | Free cash flows = Net cash provided by operating activities + Net cash used in investing activities | ||
| (2) | Changes in investments for cash management purposes = Changes by purchases, redemption at maturity and disposals of financial instruments held for cash management purposes with original maturities of longer than three months |
| * | See “6. Reconciliations of the DisclosedNon-GAAP Financial Measures to the Most Directly Comparable GAAP Financial Measures” on page 32. |
For the fiscal year ended March 31, 2017, net cash provided by operating activities was ¥1,312.4 billion, an increase of ¥103.3 billion, or 8.5%, from the same period of the previous fiscal year. This was due mainly to a decrease in cash outflows for agent resellers in relation to providing funds for the installment purchase of handset by our customers.
Net cash used in investing activities was ¥943.1 billion, an increase of ¥567.8 billion, or 151.3%, from the same period of the previous fiscal year. This was due mainly to an increase in cash outflows for short-term bailment for consumption to a related party, as well as a decrease in cash inflows for proceeds from redemption of long-term bailment for consumption to a related party.
Net cash used in financing activities was ¥433.1 billion, a decrease of ¥150.5 billion, or 25.8%, from the same period of the previous fiscal year. This was due mainly to a decrease in cash outflows for payments to acquire treasury stock.
As a result of the foregoing, the balance of cash and cash equivalents was ¥289.6 billion as of March 31, 2017, a decrease of ¥64.8 billion, or 18.3%, from the previous fiscal year end.
15
Table of Contents
| DOCOMO Earnings Release | Fiscal Year Ended March 31, 2017 |
iii. Cash Flow and Other Indicators
| Billions of yen | ||||||||||||||||||||
| Year ended March 31, 2013 | Year ended March 31, 2014 | Year ended March 31, 2015 | Year ended March 31, 2016 | Year ended March 31, 2017 | ||||||||||||||||
Shareholders’ equity ratio (1) | 74.9 | % | 75.2 | % | 75.3 | % | 73.5 | % | 74.2 | % | ||||||||||
Market equity ratio (2)* | 82.2 | % | 89.9 | % | 113.3 | % | 133.1 | % | 128.9 | % | ||||||||||
Debt to Equity ratio (3) (multiple) | 0.047 | 0.041 | 0.041 | 0.042 | 0.040 | |||||||||||||||
Liabilities to cash flow ratio (4) | 24.7 | % | 23.0 | % | 23.1 | % | 18.4 | % | 16.9 | % | ||||||||||
Interest coverage ratio (5) | 558.4 | 634.1 | 1,099.3 | 3,022.8 | 28,530.8 | |||||||||||||||
| Notes: | (1) | Shareholders’ equity ratio = NTT DOCOMO, INC. shareholders’ equity / Total assets | ||
| Shareholders’ equity ratio ended March 31, 2013 has been revised due to the reinstatement of equity method for an investee. | ||||
| (2) | Market equity ratio = Market value of total share capital** / Total assets | |||
| Market equity ratio ended March 31, 2013 has been revised due to the reinstatement of equity method for an investee. | ||||
| (3) | Debt to Equity ratio = Interest bearing liabilities / NTT DOCOMO, INC. shareholders’ equity | |||
| (4) | Liabilities to cash flow ratio = Interest bearing liabilities / Net cash provided by operating activities (excluding irregular factors and effect of transfer of receivables*** for the fiscal year ended March 31, 2013) | |||
| (5) | Interest coverage ratio = Net cash provided by operating activities (excluding irregular factors and effect of transfer of receivables) / Interest paid**** |
| * | See “6. Reconciliations of the DisclosedNon-GAAP Financial Measures to the Most Directly Comparable GAAP Financial Measures” on page 32. |
| ** | Market value of total share capital = Closing share price multiplied by the number of outstanding shares (excluding treasury stock) as of the end of the fiscal period. |
| *** | Amounts of Net cash provided by operating activities for the fiscal years ended March 31, 2013 exclude the effects of irregular factors and transfer of receivables. |
| Irregular factors = Effects of uncollected revenues due to bank closures at the end of the fiscal period |
| Effect of transfer of receivables = Effect caused by the uncollected amounts of transferred receivables of telephone charges to NTT FINANCE CORPORATION |
| **** | Interest paid is disclosed on “Supplemental disclosures of cash flow information” in “5. (4) Consolidated Statements of Cash Flows” on page 28. |
16
Table of Contents
| DOCOMO Earnings Release | Fiscal Year Ended March 31, 2017 |
i. Basic Policies for Profit Distribution
We believe that providing adequate returns to shareholders is one of the most important issues in corporate management while raising corporate value through the growth and expansion of our businesses. We plan to pay dividends by taking into account our consolidated results, consolidated financial position and consolidated dividend payout ratio based on the principle of stable and sustainable dividend payments. We will also continue to take a flexible approach regarding share repurchases. We intend to keep the repurchased shares as treasury stock and in principle to limit the amount of such treasury stock to approximately 5% of our total issued shares, and will consider retiring any treasury stock held in excess of this limit in a lump around the end of the fiscal year or at other appropriate times.
In addition, we will allocate internal reserves to research and development efforts, capital expenditures, strategic investments and others for the purpose of generating innovative technologies, offering attractive services and expanding our business domains.
ii. Dividend
We paid ¥40 per share as an interim dividend for the six months ended September 30, 2016 and plan to pay ayear-end dividend of ¥40 per share.
iii. Prospect for the next fiscal year
We expect to pay a total dividend of ¥100 per share for the year ending March 31, 2018, consisting of an interim dividend of ¥50 per share and ayear-end dividend of ¥50 per share.
iv. Share repurchases and share retirements
In the fiscal year ended March 31, 2017, we acquired 56.03 million outstanding shares of our common stock at an amount in total of ¥149.6 billion based on the resolution of the Board of Directors. On March 31, 2017, we retired 58.98 million outstanding shares, approximately 1.5% of the total outstanding shares before the retirement.
17
Table of Contents
| DOCOMO Earnings Release | Fiscal Year Ended March 31, 2017 |
(4) Special Note Regarding Forward-Looking Statements
This earning release contains forward-looking statements such as forecasts of results of operations, management strategies, objectives and plans, forecasts of operational data such as the expected number of subscriptions, and the expected dividend payments. All forward-looking statements that are not historical facts are based on management’s current plans, expectations, assumptions and estimates based on the information currently available. Some of the projected numbers in this report were derived using certain assumptions that were indispensable for making such projections in addition to historical facts. These forward-looking statements are subject to various known and unknown risks, uncertainties and other factors that could cause our actual results to differ materially from those contained in or suggested by any forward-looking statement. Potential risks and uncertainties include, without limitation, the following:
| (1) | Changes in the market environment in the telecommunications industry, such as intensifying competition from other businesses or other technologies caused by Mobile Number Portability, development of appealing new handsets, new market entrants, mergers among other service providers and other factors, or the expansion of the areas of competition and an increase in mobile communications operators entering into and collaborating with other industries could limit the acquisition of new subscriptions and retention of existing subscriptions by our corporate group, or it may lead to ARPU diminishing at a greater than expected rate, an increase in our costs, or an inability to optimize costs as expected. |
| (2) | If current and new services, usage patterns, and sales schemes proposed and introduced by our corporate group cannot be developed as planned, or if unanticipated expenses arise, the financial condition of our corporate group could be affected and our growth could be limited. |
| (3) | The introduction or change of various laws or regulations inside and outside of Japan, or the application of such laws and regulations to our corporate group, could restrict our business operations, which may adversely affect our financial condition and results of operations. |
| (4) | Limitations in the amount of frequency spectrum or facilities made available to us could negatively affect our ability to maintain and improve our service quality and level of customer satisfaction and could increase our costs. |
| (5) | Other mobile service providers in the world may not adopt the technologies and the frequency bands that are compatible with those used by our corporate group’s mobile communications system on a continuing basis, which could affect our ability to sufficiently offer international services. |
| (6) | Our domestic and international investments, alliances and collaborations, as well as investments in new business fields, may not produce the returns or provide the opportunities we expect. |
| (7) | Malfunctions, defects or imperfections in our products and services or those of other parties may give rise to problems. |
| (8) | Social problems that could be caused by misuse or misunderstanding of our products and services may adversely affect our credibility or corporate image. |
| (9) | Inadequate handling of confidential business information including personal information by our corporate group, contractors and others may adversely affect our credibility or corporate image. |
| (10) | Owners of intellectual property rights that are essential for our business execution may not grant us a license or other use of such intellectual property rights, which may result in our inability to offer certain technologies, products and/or services, and our corporate group may also be held liable for damage compensation if we infringe the intellectual property rights of others. In addition, the illicit use by a third party of the intellectual property rights owned by our corporate group could reduce our license revenues actually obtained and may inhibit our competitive superiority. |
| (11) | Events and incidents caused by natural disasters, social infrastructure paralysis such as power shortages, the proliferation of harmful substances, terror or other destructive acts, the malfunctioning of equipment, software bugs, deliberate incidents induced by computer viruses, cyber-attacks, equipment misconfiguration, hacking, unauthorized access and other problems could cause failure in our networks, distribution channels, and/or other factors necessary for the provision of service, disrupting our ability to offer services to our subscribers and such incidents may adversely affect our credibility or corporate image, or lead to a reduction of revenues and/or increase of costs. |
| (12) | Concerns about adverse health effects arising from wireless telecommunications may spread and consequently adversely affect our financial condition and results of operations. |
| (13) | Our parent company, NIPPON TELEGRAPH AND TELEPHONE CORPORATION (NTT), could exercise influence that may not be in the interests of our other shareholders. |
18
Table of Contents
| DOCOMO Earnings Release | Fiscal Year Ended March 31, 2017 |
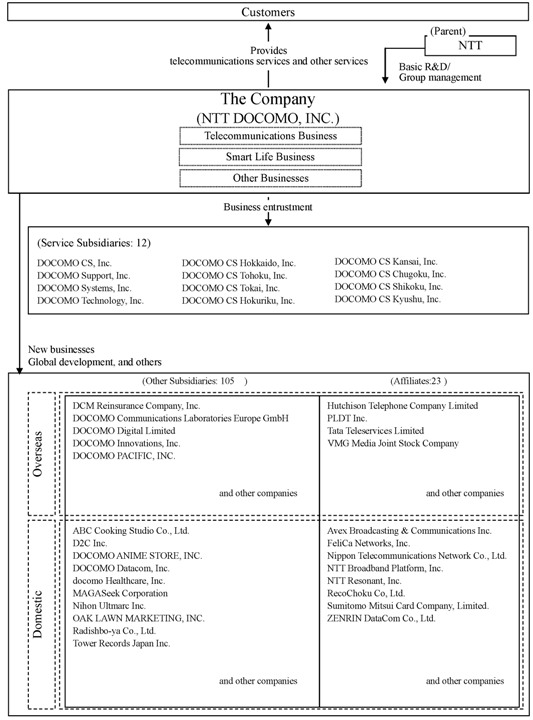
2. Condition of the Corporate Group
We primarily engage in mobile telecommunications services as a member of the NTT group, with NTT as the holding company.
NTT DOCOMO, INC. (the “Company”), its 117 subsidiaries and 23 affiliates constitute the NTT DOCOMO group (“DOCOMO”) and operate its business.
The segments of DOCOMO and the corporate position of each group company are as follows:
[Segment Information]
| Business Segment | Main Business Areas | |
Telecommunications business | Cellular (LTE(Xi) and FOMA) services, optical-fiber broadband services, satellite communications services, international services and sales of handsets and devices for each service, etc. | |
| Smart life business | Services offered through “dmarket” portal such as distribution of video, music and electronic books, etc., finance/payment services, online shopping service and other life-related services, etc. | |
| Other businesses | Mobile device protection service, commissioned business of development, sales and maintenance of systems, etc. | |
[Position of Each Company]
| (1) | The Company engages in telecommunications, smart life and other businesses in Japan. |
| (2) | 12 business-entrusted subsidiaries of the Company, each of which is entrusted with certain services by the Company, operate independently to maximize their expertise and efficiency. These subsidiaries are entrusted with part of the services provided by, or give assistance to, the Company. |
| (3) | There are 105 other subsidiaries and 23 affiliates, including entities engaged in the research of overseas mobile communications markets and technologies and overseas units established for the purpose of global business expansion or new business deployment. |
19
Table of Contents
| DOCOMO Earnings Release | Fiscal Year Ended March 31, 2017 |
The following chart summarizes the description on the previous page:
As of March 31, 2017
20
Table of Contents
| DOCOMO Earnings Release | Fiscal Year Ended March 31, 2017 |
Under the corporate philosophy of “creating a new world of communications culture,” we are striving to improve and strengthen our core business primarily by expanding the uptake of our LTE services, while also providing services that are useful for our customers’ lives and businesses. The basic policies in our corporate management are to contribute to building a rich and vigorous society through these endeavors, to improve our enterprise value, and to heighten the trust and value our shareholders and customers place in us.
(2) Medium- and Long-Term Management Strategies, Issues to be Addressed by the Group and Target Management Indicators
Medium-Term Strategy 2020 “Declaration beyond” |
Looking ahead to the year 2020 and beyond, we will aim to amaze and inspire beyond expectations for our customers and create new valueshand-in-hand with our partners by exceeding customers’ expectations.
The word “beyond” reflects our will to transform ourselves to realize a richer future with 5G. For our customers, we will offer enhanced benefits and convenience as well as value and inspiration, such as enjoyment, surprise, satisfaction and peace of mind, and realize theco-creation of new values through “+d” initiatives such as making contributions to industries, solving social issues and expanding our partners’ businesses.
“Declaration beyond” outlines six declarations we have set for these initiatives. By delivering three declarations intended for our customers and three for our partners, we will aim to steadily reinforce our revenue foundation and cash generation capability, while continuing to improve the returns to our customers and shareholders, thereby bringing about a future of abundance.
| ● | “Declaration beyond” |
<Declaration 1: Market Leader>
We will aspire to become a market leader in delivering benefits and convenience through further convergence and evolution of services, billing plans and point programs.
<Declaration 2: Style Innovation>
Taking advantage of the distinctive properties of 5G, we will devise enjoyable and exciting new services that bring innovation to customer’s usage style.
<Declaration 3:Peace-of-Mind and Comfort Support>
Toward the goal of realizing services that ensure the peace of mind and satisfaction of customers, we will continue to evolve our customer touchpoints through the adoption of AI.
<Declaration 4: Industry Creation>
Leveraging the 5G network that enables high-speed, large-capacity andlow-latency transmission and simultaneous connections with massive number of devices, we will strive to broaden the business opportunities of our partners and drive advancements across all industries in Japan.
21
Table of Contents
| DOCOMO Earnings Release | Fiscal Year Ended March 31, 2017 |
<Declaration 5: SolutionCo-creation>
Aiming to bring about growth and social abundance to Japan, we will further accelerate our “+d” initiatives to solve social issues.
<Declaration 6: Partner Business Expansion>
By further expanding and evolving the business platforms built upon DOCOMO’s assets, we will support our partners’ businesses and promote measures to grow the flow of transactions.
22
Table of Contents
| DOCOMO Earnings Release | Fiscal Year Ended March 31, 2017 |
FY2017 Priority Initiatives |
We position FY2017 as the year to “tackle evolution,” taking the first steps towards the delivery of our Medium-Term Strategy 2020 “Declaration beyond.” We will do so by moving forward with the creation & evolution of services, business evolution with “+d” and reinforcement & evolution of all foundations, the following are the details:
| (1) | Creation & Evolution of Services |
We will work to realize services which offer exciting new viewing experiences, continue with returns to customers that cater to different stages in life and further brush up our customer touchpoints.
| (2) | Business Evolution with “+d” initiatives |
In the smart life business, corporate sales and marketing business and other businesses, we will accelerate and expand our existing “+d” initiatives, and also create new businesses with our partners based on trials utilizing 5G.
| (3) | Reinforcement & Evolution of All Foundations |
We will strengthen our technical assets that are required to drive evolution in the age of 5G/IoT while also solidifying our financial position. Concurrently, we will focus on work style reforms for our employees, who sustain our business operations.
In our Medium-Term Strategy 2020 “Declaration beyond,” we will aim to continue providing customer returns through ongoing cost efficiency improvement, while increasing our operating free cash flow and shareholder returns by the convergence & evolution of a wide variety of added value and advancement of broadband services such as 5G and “docomo Hikari.”
<FY2017 Target>
Item | FY2017 Target | <Reference> Toward 2020 | ||||
Operating free cash flow* | ¥ | 910.0 billion | Cash generation capability exceeding previous fiscal year continuously by realizing efficient investment activities in 5G and EBITDA growth | |||
Shareholder returns | Annual Dividend ¥100 | Continuous increase in dividends and expeditious share repurchase | ||||
| * | Operating free cash flow = EBITDA - Capital Expenditures |
Notes: |
(1) |
Names of companies, products, etc., contained in this release are the trademarks or registered trademarks of their respective organizations. | ||
| (2) | iPhone, Apple Watch Series, Apple Pay are trademarks of Apple Inc. The iPhone trademark is used under a license from AIPHONE CO., LTD. |
23
Table of Contents
| DOCOMO Earnings Release | Fiscal Year Ended March 31, 2017 |
4. Basic Approach to the Selection of Accounting Standards
In order to improve the international comparability of our financial information in the capital markets and increase the efficiency of our financial reporting, we are considering adopting International Financial Reporting Standards (“IFRS”) beginning with the three months ending June 30, 2018.
24
Table of Contents
| DOCOMO Earnings Release | Fiscal Year Ended March 31, 2017 |
5. Consolidated Financial Statements
(1) Consolidated Balance Sheets
| Millions of yen | ||||||||||||
| March 31, 2016 | March 31, 2017 | Increase (Decrease) | ||||||||||
ASSETS | ||||||||||||
Current assets: | ||||||||||||
Cash and cash equivalents | ¥ | 354,437 | ¥ | 289,610 | ¥ | (64,827 | ) | |||||
Short-term investments | 5,872 | 301,070 | 295,198 | |||||||||
Accounts receivable | 237,040 | 239,137 | 2,097 | |||||||||
Receivables held for sale | 972,851 | 936,748 | (36,103 | ) | ||||||||
Credit card receivables | 276,492 | 347,557 | 71,065 | |||||||||
Other receivables | 381,096 | 398,842 | 17,746 | |||||||||
Allowance for doubtful accounts | (17,427 | ) | (19,517 | ) | (2,090 | ) | ||||||
Inventories | 153,876 | 153,388 | (488 | ) | ||||||||
Deferred tax assets | 107,058 | 81,025 | (26,033 | ) | ||||||||
Prepaid expenses and other current assets | 108,898 | 108,412 | (486 | ) | ||||||||
|
|
|
|
|
| |||||||
Total current assets | 2,580,193 | 2,836,272 | 256,079 | |||||||||
|
|
|
|
|
| |||||||
Property, plant and equipment: | ||||||||||||
Wireless telecommunications equipment | 5,084,416 | 5,084,923 | 507 | |||||||||
Buildings and structures | 896,815 | 906,177 | 9,362 | |||||||||
Tools, furniture and fixtures | 468,800 | 441,513 | (27,287 | ) | ||||||||
Land | 199,054 | 198,980 | (74 | ) | ||||||||
Construction in progress | 190,261 | 204,413 | 14,152 | |||||||||
Accumulated depreciation and amortization | (4,398,970 | ) | (4,295,111 | ) | 103,859 | |||||||
|
|
|
|
|
| |||||||
Total property, plant and equipment, net | 2,440,376 | 2,540,895 | 100,519 | |||||||||
|
|
|
|
|
| |||||||
Non-current investments and other assets: | ||||||||||||
Investments in affiliates | 411,395 | 373,758 | (37,637 | ) | ||||||||
Marketable securities and other investments | 182,905 | 198,650 | 15,745 | |||||||||
Intangible assets, net | 615,013 | 608,776 | (6,237 | ) | ||||||||
Goodwill | 243,695 | 230,971 | (12,724 | ) | ||||||||
Other assets | 479,103 | 434,312 | (44,791 | ) | ||||||||
Deferred tax assets | 261,434 | 229,440 | (31,994 | ) | ||||||||
|
|
|
|
|
| |||||||
Totalnon-current investments and other assets | 2,193,545 | 2,075,907 | (117,638 | ) | ||||||||
|
|
|
|
|
| |||||||
Total assets | ¥ | 7,214,114 | ¥ | 7,453,074 | ¥ | 238,960 | ||||||
|
|
|
|
|
| |||||||
LIABILITIES AND EQUITY | ||||||||||||
Current liabilities: | ||||||||||||
Current portion of long-term debt | ¥ | 200 | ¥ | 60,217 | ¥ | 60,017 | ||||||
Short-term borrowings | 1,764 | 1,623 | (141 | ) | ||||||||
Accounts payable, trade | 793,084 | 853,538 | 60,454 | |||||||||
Accrued payroll | 53,837 | 59,187 | 5,350 | |||||||||
Accrued income taxes | 165,332 | 105,997 | (59,335 | ) | ||||||||
Other current liabilities | 205,602 | 194,494 | (11,108 | ) | ||||||||
|
|
|
|
|
| |||||||
Total current liabilities | 1,219,819 | 1,275,056 | 55,237 | |||||||||
|
|
|
|
|
| |||||||
Long-term liabilities: | ||||||||||||
Long-term debt (exclusive of current portion) | 220,200 | 160,040 | (60,160 | ) | ||||||||
Accrued liabilities for point programs | 75,182 | 94,639 | 19,457 | |||||||||
Liability for employees’ retirement benefits | 201,604 | 193,985 | (7,619 | ) | ||||||||
Other long-term liabilities | 137,983 | 145,266 | 7,283 | |||||||||
|
|
|
|
|
| |||||||
Total long-term liabilities | 634,969 | 593,930 | (41,039 | ) | ||||||||
|
|
|
|
|
| |||||||
Total liabilities | 1,854,788 | 1,868,986 | 14,198 | |||||||||
|
|
|
|
|
| |||||||
Redeemable noncontrolling interest | 16,221 | 22,942 | 6,721 | |||||||||
|
|
|
|
|
| |||||||
Equity: | ||||||||||||
NTT DOCOMO, INC. shareholders’ equity | ||||||||||||
Common stock | 949,680 | 949,680 | — | |||||||||
Additionalpaid-in capital | 330,482 | 326,621 | (3,861 | ) | ||||||||
Retained earnings | 4,413,030 | 4,656,139 | 243,109 | |||||||||
Accumulated other comprehensive income (loss) | 14,888 | 24,631 | 9,743 | |||||||||
Treasury stock | (405,832 | ) | (426,442 | ) | (20,610 | ) | ||||||
Total NTT DOCOMO, INC. shareholders’ equity | 5,302,248 | 5,530,629 | 228,381 | |||||||||
Noncontrolling interests | 40,857 | 30,517 | (10,340 | ) | ||||||||
|
|
|
|
|
| |||||||
Total equity | 5,343,105 | 5,561,146 | 218,041 | |||||||||
|
|
|
|
|
| |||||||
Total liabilities and equity | ¥ | 7,214,114 | ¥ | 7,453,074 | ¥ | 238,960 | ||||||
|
|
|
|
|
| |||||||
25
Table of Contents
| DOCOMO Earnings Release | Fiscal Year Ended March 31, 2017 |
(2) Consolidated Statements of Income and Consolidated Statements of Comprehensive Income
Consolidated Statements of Income
| Millions of yen | ||||||||||||
| Year ended March 31, 2016 | Year ended March 31, 2017 | Increase (Decrease) | ||||||||||
Operating revenues: | ||||||||||||
Telecommunications services | ¥ | 2,815,507 | ¥ | 2,985,094 | ¥ | 169,587 | ||||||
Equipment sales | 860,486 | 719,161 | (141,325 | ) | ||||||||
Other operating revenues | 851,091 | 880,297 | 29,206 | |||||||||
|
|
|
|
|
| |||||||
Total operating revenues | 4,527,084 | 4,584,552 | 57,468 | |||||||||
|
|
|
|
|
| |||||||
Operating expenses: | ||||||||||||
Cost of services (exclusive of items shown separately below) | 1,248,553 | 1,335,457 | 86,904 | |||||||||
Cost of equipment sold (exclusive of items shown separately below) | 881,471 | 792,145 | (89,326 | ) | ||||||||
Depreciation and amortization | 625,934 | 452,341 | (173,593 | ) | ||||||||
Impairment loss | 17,683 | 12,205 | (5,478 | ) | ||||||||
Selling, general and administrative | 970,419 | 1,047,666 | 77,247 | |||||||||
|
|
|
|
|
| |||||||
Total operating expenses | 3,744,060 | 3,639,814 | (104,246 | ) | ||||||||
|
|
|
|
|
| |||||||
Operating income | 783,024 | 944,738 | 161,714 | |||||||||
|
|
|
|
|
| |||||||
Other income (expense): | ||||||||||||
Interest expense | (512 | ) | (277 | ) | 235 | |||||||
Interest income | 987 | 608 | (379 | ) | ||||||||
Other, net | (5,478 | ) | 4,494 | 9,972 | ||||||||
|
|
|
|
|
| |||||||
Total other income (expense) | (5,003 | ) | 4,825 | 9,828 | ||||||||
|
|
|
|
|
| |||||||
Income before income taxes and equity in net income (losses) of affiliates | 778,021 | 949,563 | 171,542 | |||||||||
|
|
|
|
|
| |||||||
Income taxes: | ||||||||||||
Current | 267,249 | 238,172 | (29,077 | ) | ||||||||
Deferred | (55,530 | ) | 49,507 | 105,037 | ||||||||
|
|
|
|
|
| |||||||
Total income taxes | 211,719 | 287,679 | 75,960 | |||||||||
|
|
|
|
|
| |||||||
Income before equity in net income (losses) of affiliates | 566,302 | 661,884 | 95,582 | |||||||||
|
|
|
|
|
| |||||||
Equity in net income (losses) of affiliates (including impairment charges of investments in affiliates) | (5,060 | ) | (11,273 | ) | (6,213 | ) | ||||||
|
|
|
|
|
| |||||||
Net income | 561,242 | 650,611 | 89,369 | |||||||||
|
|
|
|
|
| |||||||
Less: Net (income) loss attributable to noncontrolling interests | (12,864 | ) | 1,927 | 14,791 | ||||||||
|
|
|
|
|
| |||||||
Net income attributable to NTT DOCOMO, INC. | ¥ | 548,378 | ¥ | 652,538 | ¥ | 104,160 | ||||||
|
|
|
|
|
| |||||||
Per share data | ||||||||||||
Weighted average common shares outstanding – Basic and Diluted | 3,880,823,341 | 3,726,266,553 | (154,556,788 | ) | ||||||||
|
|
|
|
|
| |||||||
Basic and Diluted earnings per share attributable to NTT DOCOMO, INC. | ¥ | 141.30 | ¥ | 175.12 | ¥ | 33.82 | ||||||
|
|
|
|
|
| |||||||
Consolidated Statements of Comprehensive Income | ||||||||||||
| Millions of yen | ||||||||||||
| Year ended March 31, 2016 | Year ended March 31, 2017 | Increase (Decrease) | ||||||||||
Net income | ¥ | 561,242 | ¥ | 650,611 | ¥ | 89,369 | ||||||
Other comprehensive income (loss): | ||||||||||||
Unrealized holding gains (losses) onavailable-for-sale securities, net of applicable taxes | (5,993 | ) | 11,739 | 17,732 | ||||||||
Unrealized gains (losses) on cash flow hedges, net of applicable taxes | (117 | ) | 85 | 202 | ||||||||
Foreign currency translation adjustment, net of applicable taxes | (10,587 | ) | (12,975 | ) | (2,388 | ) | ||||||
Pension liability adjustment, net of applicable taxes | (21,008 | ) | 10,709 | 31,717 | ||||||||
|
|
|
|
|
| |||||||
Total other comprehensive income (loss) | (37,705 | ) | 9,558 | 47,263 | ||||||||
|
|
|
|
|
| |||||||
Comprehensive income | 523,537 | 660,169 | 136,632 | |||||||||
|
|
|
|
|
| |||||||
Less: Comprehensive (income) loss attributable to noncontrolling interests | (12,870 | ) | 2,112 | 14,982 | ||||||||
|
|
|
|
|
| |||||||
Comprehensive income attributable to NTT DOCOMO, INC. | ¥ | 510,667 | ¥ | 662,281 | ¥ | 151,614 | ||||||
|
|
|
|
|
| |||||||
26
Table of Contents
| DOCOMO Earnings Release | Fiscal Year Ended March 31, 2017 |
(3) Consolidated Statements of Changes in Equity
| Millions of yen | ||||||||||||||||||||||||||||||||
| NTT DOCOMO, INC. shareholders’ equity | Total NTT DOCOMO, INC. shareholders’ equity | Noncontrolling interests | Total equity | |||||||||||||||||||||||||||||
| Common stock | Additional paid-in capital | Retained earnings | Accumulated other comprehensive income (loss) | Treasury stock | ||||||||||||||||||||||||||||
Balance as of March 31, 2015 | ¥ | 949,680 | ¥ | 339,783 | ¥ | 4,397,228 | ¥ | 52,599 | ¥ | (359,218 | ) | ¥ | 5,380,072 | ¥ | 22,544 | ¥ | 5,402,616 | |||||||||||||||
|
|
|
|
|
|
|
|
|
|
|
|
|
|
|
| |||||||||||||||||
Purchase of treasury stock | (307,486 | ) | (307,486 | ) | (307,486 | ) | ||||||||||||||||||||||||||
Retirement of treasury stock | (260,872 | ) | 260,872 | — | — | |||||||||||||||||||||||||||
Cash dividends declared to NTT DOCOMO, INC. shareholders | (271,704 | ) | (271,704 | ) | (271,704 | ) | ||||||||||||||||||||||||||
Cash distributions to noncontrolling interests | — | (2,390 | ) | (2,390 | ) | |||||||||||||||||||||||||||
Acquisition of new subsidiaries | — | 22 | 22 | |||||||||||||||||||||||||||||
Changes in interest in subsidiaries | (9,301 | ) | (9,301 | ) | 8,489 | (812 | ) | |||||||||||||||||||||||||
Others | — | (46 | ) | (46 | ) | |||||||||||||||||||||||||||
Net income | 548,378 | 548,378 | 12,232 | 560,610 | ||||||||||||||||||||||||||||
Other comprehensive income (loss) | (37,711 | ) | (37,711 | ) | 6 | (37,705 | ) | |||||||||||||||||||||||||
|
|
|
|
|
|
|
|
|
|
|
|
|
|
|
| |||||||||||||||||
Balance as of March 31, 2016 | ¥ | 949,680 | ¥ | 330,482 | ¥ | 4,413,030 | ¥ | 14,888 | ¥ | (405,832 | ) | ¥ | 5,302,248 | ¥ | 40,857 | ¥ | 5,343,105 | |||||||||||||||
|
|
|
|
|
|
|
|
|
|
|
|
|
|
|
| |||||||||||||||||
Purchase of treasury stock | (149,607 | ) | (149,607 | ) | (149,607 | ) | ||||||||||||||||||||||||||
Retirement of treasury stock | (128,997 | ) | 128,997 | — | — | |||||||||||||||||||||||||||
Cash dividends declared to NTT DOCOMO, INC. shareholders | (280,432 | ) | (280,432 | ) | (280,432 | ) | ||||||||||||||||||||||||||
Cash distributions to noncontrolling interests | — | (3,500 | ) | (3,500 | ) | |||||||||||||||||||||||||||
Acquisition of new subsidiaries | — | 49 | 49 | |||||||||||||||||||||||||||||
Changes in interest in subsidiaries | (3,861 | ) | (3,861 | ) | (4,095 | ) | (7,956 | ) | ||||||||||||||||||||||||
Net income | 652,538 | 652,538 | (2,610 | ) | 649,928 | |||||||||||||||||||||||||||
Other comprehensive income (loss) | 9,743 | 9,743 | (184 | ) | 9,559 | |||||||||||||||||||||||||||
|
|
|
|
|
|
|
|
|
|
|
|
|
|
|
| |||||||||||||||||
Balance as of March 31, 2017 | ¥ | 949,680 | ¥ | 326,621 | ¥ | 4,656,139 | ¥ | 24,631 | ¥ | (426,442 | ) | ¥ | 5,530,629 | ¥ | 30,517 | ¥ | 5,561,146 | |||||||||||||||
|
|
|
|
|
|
|
|
|
|
|
|
|
|
|
| |||||||||||||||||
| * | Changes in the redeemable noncontrolling interest are not included in the table. |
27
Table of Contents
| DOCOMO Earnings Release | Fiscal Year Ended March 31, 2017 |
(4) Consolidated Statements of Cash Flows
| Millions of yen | ||||||||
| Year ended March 31, 2016 | Year ended March 31, 2017 | |||||||
Cash flows from operating activities: | ||||||||
Net income | ¥ | 561,242 | ¥ | 650,611 | ||||
Adjustments to reconcile net income to net cash provided by operating activities– | ||||||||
Depreciation and amortization | 625,934 | 452,341 | ||||||
Deferred taxes | (55,530 | ) | 49,507 | |||||
Loss on sale or disposal of property, plant and equipment | 36,535 | 54,160 | ||||||
Inventory write-downs | 18,880 | 11,043 | ||||||
Impairment loss | 17,683 | 12,205 | ||||||
Impairment loss on marketable securities and other investments | 636 | 2,305 | ||||||
Loss on sale of a subsidiary | 13,117 | — | ||||||
Equity in net (income) losses of affiliates (including impairment charges of investments in affiliates) | 5,060 | 11,273 | ||||||
Dividends from affiliates | 13,929 | 10,401 | ||||||
Changes in assets and liabilities: | ||||||||
(Increase) / decrease in accounts receivable | 22,406 | (2,690 | ) | |||||
(Increase) / decrease in receivables held for sale | (74,852 | ) | 36,103 | |||||
(Increase) / decrease in credit card receivables | (22,551 | ) | (34,410 | ) | ||||
(Increase) / decrease in other receivables | (46,331 | ) | (17,735 | ) | ||||
Increase / (decrease) in allowance for doubtful accounts | 3,884 | 7,240 | ||||||
(Increase) / decrease in inventories | 13,125 | (10,565 | ) | |||||
(Increase) / decrease in prepaid expenses and other current assets | (4,966 | ) | (767 | ) | ||||
(Increase) / decrease innon-current receivables held for sale | (13,601 | ) | 57,626 | |||||
Increase / (decrease) in accounts payable, trade | (32,544 | ) | 58,680 | |||||
Increase / (decrease) in accrued income taxes | 97,176 | (59,290 | ) | |||||
Increase / (decrease) in other current liabilities | 31,638 | (11,925 | ) | |||||
Increase / (decrease) in accrued liabilities for point programs | (14,747 | ) | 19,457 | |||||
Increase / (decrease) in liability for employees’ retirement benefits | 27,752 | (7,608 | ) | |||||
Increase / (decrease) in other long-term liabilities | 11,488 | 9,804 | ||||||
Other, net | (26,232 | ) | 14,652 | |||||
|
|
|
| |||||
Net cash provided by operating activities | 1,209,131 | 1,312,418 | ||||||
|
|
|
| |||||
Cash flows from investing activities: | ||||||||
Purchases of property, plant and equipment | (434,919 | ) | (450,826 | ) | ||||
Purchases of intangible and other assets | (179,010 | ) | (192,625 | ) | ||||
Purchases ofnon-current investments | (3,465 | ) | (2,155 | ) | ||||
Proceeds from sale ofnon-current investments | 9,345 | 6,452 | ||||||
Purchases of short-term investments | (9,523 | ) | (156,779 | ) | ||||
Redemption of short-term investments | 4,659 | 121,572 | ||||||
Proceeds from redemption of long-term bailment for consumption to a related party | 240,000 | — | ||||||
Short-term bailment for consumption to a related party | — | (380,000 | ) | |||||
Proceeds from redemption of short-term bailment for consumption to a related party | — | 120,000 | ||||||
Other, net | (2,338 | ) | (8,733 | ) | ||||
|
|
|
| |||||
Net cash used in investing activities | (375,251 | ) | (943,094 | ) | ||||
|
|
|
| |||||
Cash flows from financing activities: | ||||||||
Proceeds from short-term borrowings | 146,880 | 25,094 | ||||||
Repayment of short-term borrowings | (147,022 | ) | (25,214 | ) | ||||
Principal payments under capital lease obligations | (1,389 | ) | (1,167 | ) | ||||
Payments to acquire treasury stock | (307,486 | ) | (149,607 | ) | ||||
Dividends paid | (271,643 | ) | (280,527 | ) | ||||
Cash distributions to noncontrolling interests | (2,390 | ) | (3,500 | ) | ||||
Other, net | (558 | ) | 1,824 | |||||
|
|
|
| |||||
Net cash provided by (used in) financing activities | (583,608 | ) | (433,097 | ) | ||||
|
|
|
| |||||
Effect of exchange rate changes on cash and cash equivalents | (1,388 | ) | (1,054 | ) | ||||
|
|
|
| |||||
Net increase (decrease) in cash and cash equivalents | 248,884 | (64,827 | ) | |||||
Cash and cash equivalents at beginning of year | 105,553 | 354,437 | ||||||
|
|
|
| |||||
Cash and cash equivalents at end of year | ¥ | 354,437 | ¥ | 289,610 | ||||
|
|
|
| |||||
Supplemental disclosures of cash flow information: | ||||||||
Cash received during the fiscal year for: | ||||||||
Income tax refunds | ¥ | 8,241 | ¥ | 758 | ||||
Cash paid during the fiscal year for: | ||||||||
Interest, net of amount capitalized | 400 | 46 | ||||||
Income taxes | 176,806 | 297,765 | ||||||
Non-cash investing and financing activities: | ||||||||
Assets acquired through capital lease obligations | 965 | 1,138 | ||||||
Assets of wireless telecommunications equipment acquired through exchanges of similar equipment | 3,844 | 6,581 | ||||||
Retirement of treasury stock | 260,872 | 128,997 | ||||||
|
|
|
| |||||
28
Table of Contents
| DOCOMO Earnings Release | Fiscal Year Ended March 31, 2017 |
(5) Notes to Consolidated Financial Statements
i. Note to Going Concern Assumption
There is no corresponding item.
ii. Change in Accounting Policies
Change in depreciation method
Previously, DOCOMO principally used the declining-balance method for calculating depreciation of property, plant, and equipment with the exception of buildings, which are depreciated on a straight-line basis. Effective April 1, 2016, DOCOMO adopted the straight-line method of depreciation for all property, plant, and equipment. Data traffic has recently grown due to increased use of smartphones. As a way of addressing the rising data traffic, DOCOMO providesLTE-Advanced services, using the carrier aggregation technology which enables higher speeds and capacities for the LTE services. With the introduction of the carrier aggregation technology, DOCOMO is able to use its frequencies more efficiently, bringing stability to DOCOMO’s operation of its wireless telecommunications equipment. As a result, DOCOMO believes that the straight-line depreciation method better reflects the pattern of consumption of the future benefits to be derived from those assets being depreciated. The effect of the change in the depreciation method is recognized prospectively as a change in the accounting estimate pursuant to the Financial Accounting Standards Board Accounting Standards Codification 250, “Accounting Changes and Error Corrections.”
The change in depreciation method caused a decrease in “Depreciation and amortization” by ¥154,050 million for the fiscal year ended March 31, 2017. “Net income attributable to NTT DOCOMO, INC.” and “Basic and Diluted earnings per share attributable to NTT DOCOMO, INC.” for the fiscal year ended March 31, 2017 increased by ¥105,370 million and ¥28.28, respectively.
iii. Equity
Share Repurchases and Share Retirements
On January 29, 2016, the Board of Directors resolved that NTT DOCOMO, INC. may repurchase up to 220,000,000 outstanding shares of its common stock for an amount in total not exceeding ¥500,000 million during the period from February 1, 2016 through December 31, 2016.
On April 28, 2016, the Board of Directors resolved that NTT DOCOMO, INC. may acquire up to 99,132,938 outstanding shares of its common stock by way of the Tokyo Stock Exchange Trading NetworkOff-Auction Own Share Repurchase Trading System(“ToSTNeT-3”) and market purchases in accordance with the discretionary dealing contract, at an amount in total not exceeding ¥192,514 million from May 2, 2016 through December 31, 2016.
Based on this resolution, NTT DOCOMO, INC. repurchased 9,021,000 shares of its common stock at ¥24,433 million using theToSTNeT-3 on May 18, 2016, and also repurchased 47,010,000 shares of its common stock for a total purchase price of ¥125,174 million by way of market purchases in accordance with the discretionary dealing contract as of December 31, 2016. NTT DOCOMO, INC. did not repurchase any shares from NTT for the fiscal year ended March 31, 2017.
NTT DOCOMO, INC. also carried out compulsory acquisition ofless-than-one-unit shares upon request.
Aggregate number and price of shares repurchased for the fiscal year ended March 31, 2017 were as follows:
Year ended March 31, | Shares | Millions of yen | ||||||
2017 | 56,031,217 | 149,607 | ||||||
29
Table of Contents
| DOCOMO Earnings Release | Fiscal Year Ended March 31, 2017 |
NTT DOCOMO, INC. retired its own shares held as treasury stock as shown in the following table for the fiscal year ended March 31 2017. The share retirement resulted in a decrease of “Retained earnings” by ¥128,997 million in the same amount as the aggregate purchase price. There were no changes in the number of authorized shares.
Date of the resolution of the Board of Directors | Shares | Millions of yen | ||||||
March 24, 2017 (written resolution in lieu of a Board of Directors meeting) | 58,980,000 | 128,997 | ||||||
iv. Segment Information
DOCOMO’s chief operating decision maker (“CODM”) is its Board of Directors. The CODM evaluates the performance and makes resource allocations of its segments based on the information provided by DOCOMO’s internal management reports.
DOCOMO has three operating segments, which consist of telecommunications business, smart life business, and other businesses.
The telecommunications business includes mobile phone services (LTE(Xi) services and FOMA services), optical-fiber broadband service, satellite mobile communications services, international services and the equipment sales related to these services. The smart life business includes video and music distribution, electronic books and other services offered through DOCOMO’s “dmarket” portal, as well as finance/payment services, shopping services and various other services to support our customers’ daily lives. The other businesses primarily includes “Mobile Device Protection Service,” as well as development, sales and maintenance of IT systems.
Accounting policies used to determine segment operating revenues and operating income (loss) are consistent with those used to prepare the consolidated financial statements in accordance with U.S. GAAP.
Assets by segment are not included in the management reports which are reported to the CODM. However, they are disclosed herein only to provide additional information. The “Corporate” row in the tables below is included to reflect the recorded amounts of common assets which are not allocated to any segments, and assets in “Corporate” primarily include cash and cash equivalents, securities and investments in affiliates. DOCOMO allocates amounts of assets and related depreciation and amortization expenses to common assets, such as buildings for telecommunications purposes and common facilities, on a systematic and rational basis based on the proportionate amount of network assets to each segment.
Segment operating revenues:
| Millions of yen | ||||||||||||
| Year ended March 31, 2016 | Year ended March 31, 2017 | |||||||||||
Telecommunications business- | ||||||||||||
External customers | ¥ | 3,688,486 | ¥ | 3,709,947 | ||||||||
Intersegment | 1,293 | 1,209 | ||||||||||
|
|
|
| |||||||||
Subtotal | 3,689,779 | 3,711,156 | ||||||||||
Smart life business- | ||||||||||||
External customers | 491,234 | 486,547 | ||||||||||
Intersegment | 12,895 | 15,371 | ||||||||||
|
|
|
| |||||||||
Subtotal | 504,129 | 501,918 | ||||||||||
Other businesses- | ||||||||||||
External customers | 347,364 | 388,058 | ||||||||||
Intersegment | 11,912 | 12,342 | ||||||||||
|
|
|
| |||||||||
Subtotal | 359,276 | 400,400 | ||||||||||
|
|
|
| |||||||||
Segment total | 4,553,184 | 4,613,474 | ||||||||||
Elimination | (26,100 | ) | (28,922 | ) | ||||||||
|
|
|
| |||||||||
Consolidated | ¥ | 4,527,084 | ¥ | 4,584,552 | ||||||||
|
|
|
| |||||||||
30
Table of Contents
| DOCOMO Earnings Release | Fiscal Year Ended March 31, 2017 |
Segment operating income (loss):
| Millions of yen | ||||||||
| Year ended March 31, 2016 | Year ended March 31, 2017 | |||||||
Telecommunications business | ¥ | 708,854 | ¥ | 832,798 | ||||
Smart life business | 46,450 | 57,919 | ||||||
Other businesses | 27,720 | 54,021 | ||||||
|
|
|
| |||||
Consolidated | ¥ | 783,024 | ¥ | 944,738 | ||||
|
|
|
| |||||
Segment assets:
| Millions of yen | ||||||||
| Year ended March 31, 2016 | Year ended March 31, 2017 | |||||||
Telecommunications business | ¥ | 5,309,327 | ¥ | 5,243,470 | ||||
Smart life business | 601,601 | 677,182 | ||||||
Other businesses | 237,862 | 258,531 | ||||||
|
|
|
| |||||
Segment total | 6,148,790 | 6,179,183 | ||||||
Elimination | (1,988 | ) | (1,381 | ) | ||||
Corporate | 1,067,312 | 1,275,272 | ||||||
|
|
|
| |||||
Consolidated | ¥ | 7,214,114 | ¥ | 7,453,074 | ||||
|
|
|
| |||||
Other Significant items:
Depreciation and amortization:
| Millions of yen | ||||||||
| Year ended March 31, 2016 | Year ended March 31, 2017 | |||||||
Telecommunications business | ¥ | 592,073 | ¥ | 418,669 | ||||
Smart life business | 16,892 | 16,190 | ||||||
Other businesses | 16,969 | 17,482 | ||||||
|
|
|
| |||||
Consolidated | ¥ | 625,934 | ¥ | 452,341 | ||||
|
|
|
| |||||
Capital expenditures:
| Millions of yen | ||||||||
| Year ended March 31, 2016 | Year ended March 31, 2017 | |||||||
Telecommunications business | ¥ | 573,893 | ¥ | 576,151 | ||||
Smart life business | 13,855 | 14,391 | ||||||
Other businesses | 7,468 | 6,536 | ||||||
|
|
|
| |||||
Consolidated | ¥ | 595,216 | ¥ | 597,078 | ||||
|
|
|
| |||||
Segment operating income (loss) is segment operating revenues less segment operating expenses.
As indicated in “(5)ii. Change in Accounting Policies,” previously, DOCOMO principally used the declining-balance method for calculating depreciation of property, plant, and equipment with the exception of buildings, which are depreciated on a straight-line basis. Effective April 1, 2016, DOCOMO adopted the straight-line method of depreciation. As a result, compared with the depreciation method used prior to April 1, 2016, operating income for the Telecommunications business segment, Smart life business segment, and Other businesses segment for the fiscal year ended March 31, 2017 increased by ¥153,548 million, ¥340 million and ¥162 million, respectively.
DOCOMO does not disclose geographical information since the amounts of operating revenues generated outside Japan are immaterial.
31
Table of Contents
| DOCOMO Earnings Release | Fiscal Year Ended March 31, 2017 |
Reconciliations of the DisclosedNon-GAAP Financial Measures to the Most Directly Comparable GAAP Financial Measures
The reconciliations for the year ending March 31, 2018 (Forecasts) are provided to the extent available without unreasonable efforts.
i. EBITDA and EBITDA margin
| Billions of yen | ||||||||||||||||
| Year ending March 31, 2018 (Forecasts) | Year ended March 31, 2016 | Year ended March 31, 2017 | ||||||||||||||
a. EBITDA | ¥ | 1,480.0 | ¥ | 1,463.2 | ¥ | 1,463.4 | ||||||||||
|
|
|
|
|
| |||||||||||
Depreciation and amortization | (490.0 | ) | (625.9 | ) | (452.3 | ) | ||||||||||
Loss on sale or disposal of property, plant and equipment | (30.0 | ) | (36.5 | ) | (54.2 | ) | ||||||||||
Impairment loss | — | (17.7 | ) | (12.2 | ) | |||||||||||
|
|
|
|
|
| |||||||||||
Operating income | 960.0 | 783.0 | 944.7 | |||||||||||||
|
|
|
|
|
| |||||||||||
Other income (expense) | 6.0 | (5.0 | ) | 4.8 | ||||||||||||
Income taxes | (306.0 | ) | (211.7 | ) | (287.7 | ) | ||||||||||
Equity in net income (losses) of affiliates | (5.0 | ) | (5.1 | ) | (11.3 | ) | ||||||||||
Less: Net (income) loss attributable to noncontrolling interests | 0.0 | (12.9 | ) | 1.9 | ||||||||||||
|
|
|
|
|
| |||||||||||
b. Net income attributable to NTT DOCOMO, INC. | 655.0 | 548.4 | 652.5 | |||||||||||||
|
|
|
|
|
| |||||||||||
c. Operating revenues | 4,750.0 | 4,527.1 | 4,584.6 | |||||||||||||
|
|
|
|
|
| |||||||||||
EBITDA margin (=a/c) | 31.2 | % | 32.3 | % | 31.9 | % | ||||||||||
Net income margin (=b/c) | 13.8 | % | 12.1 | % | 14.2 | % | ||||||||||
|
|
|
|
|
| |||||||||||
| Note: | EBITDA and EBITDA margin, as we use them, are different from EBITDA as used in Item 10(e) of regulationS-K and may not be comparable to similarly titled measures used by other companies. Impairment losses of goodwill and unamortizable intangible assets, which had previously been included in “Selling, general and administrative” of the consolidated statements of income, have been recorded as “Impairment loss” of the consolidated statements of income for the fiscal year ended March 31, 2017. “Impairment loss” for the fiscal year ended March 31, 2016 in the above table has also been reclassified to conform to the presentation used for the fiscal year ended March 31, 2017. |
ii. ROE
| Billions of yen | ||||||||||||||||
| Year ending March 31, 2018 (Forecasts) | Year ended March 31, 2016 | Year ended March 31, 2017 | ||||||||||||||
a. Net income attributable to NTT DOCOMO, INC. | ¥ | 655.0 | ¥ | 548.4 | ¥ | 652.5 | ||||||||||
b. Shareholders’ equity | 5,691.4 | 5,341.2 | 5,416.4 | |||||||||||||
|
|
|
|
|
| |||||||||||
ROE (=a/b) | 11.5 | % | 10.3 | % | 12.0 | % | ||||||||||
|
|
|
|
|
| |||||||||||
| Note: | Shareholders’ equity = Two period ends average of NTT DOCOMO, INC. shareholders’ equity |
iii. Free cash flows excluding changes in investments for cash management purposes
| Billions of yen | ||||||||||||||||
| Year ending March 31, 2018 (Forecasts) | Year ended March 31, 2016 | Year ended March 31, 2017 | ||||||||||||||
Net cash provided by operating activities | ¥ | 1,280.0 | ¥ | 1,209.1 | ¥ | 1,312.4 | ||||||||||
Net cash used in investing activities | (570.0 | ) | (375.3 | ) | (943.1 | ) | ||||||||||
|
|
|
|
|
| |||||||||||
Free cash flows | 710.0 | 833.9 | 369.3 | |||||||||||||
|
|
|
|
|
| |||||||||||
Changes in investments for cash management purposes | — | 235.1 | (295.2 | ) | ||||||||||||
|
|
|
|
|
| |||||||||||
Free cash flows excluding changes in investments for cash management purposes | 710.0 | 598.7 | 664.5 | |||||||||||||
|
|
|
|
|
| |||||||||||
| Notes: | Changes in investments for cash management purposes were derived from purchases, redemption at maturity and disposals of financial instruments held for cash management purposes with original maturities of longer than three months. | |
| Net cash used in investing activities includes changes in investments for cash management purposes for the year ended March 31, 2016 and 2017 | ||
| The effect of changes in investments for cash management purposes is not taken into account when we forecasted net cash used in investing activities for the year ending March 31, 2018 due to the difficulties in forecasting such effect. | ||
iv. Market equity ratio
| Billions of yen | ||||||||||||||||
| Year ending March 31, 2018 (Forecasts) | Year ended March 31, 2016 | Year ended March 31, 2017 | ||||||||||||||
a. NTT DOCOMO, INC. shareholders’ equity | — | ¥ | 5,302.2 | ¥ | 5,530.6 | |||||||||||
b. Market value of total share capital | — | 9,599.0 | 9,604.1 | |||||||||||||
c. Total assets | — | 7,214.1 | 7,453.1 | |||||||||||||
|
|
|
|
|
| |||||||||||
Shareholders’ equity ratio (=a/c) | — | 73.5 | % | 74.2 | % | |||||||||||
Market equity ratio (=b/c) | — | 133.1 | % | 128.9 | % | |||||||||||
|
|
|
|
|
| |||||||||||
| Notes: | Market value of total share capital = Closing share price multiplied by the number of outstanding shares (excluding treasury stock) as of the end of the fiscal period. Market equity ratio for the year ending March 31, 2018 is not forecasted because it is difficult to estimate the market value of total share capital in the future. |
32
Table of Contents

FY2016 Results Presentation docomo April 27, 2017
Table of Contents

1. FY2016 Results Highlights Key Financial Data, Segment Results Telecommunications Business, Smart Life Business & Other Businesses 2. FY2017Full-Year Guidance, etc.
Table of Contents
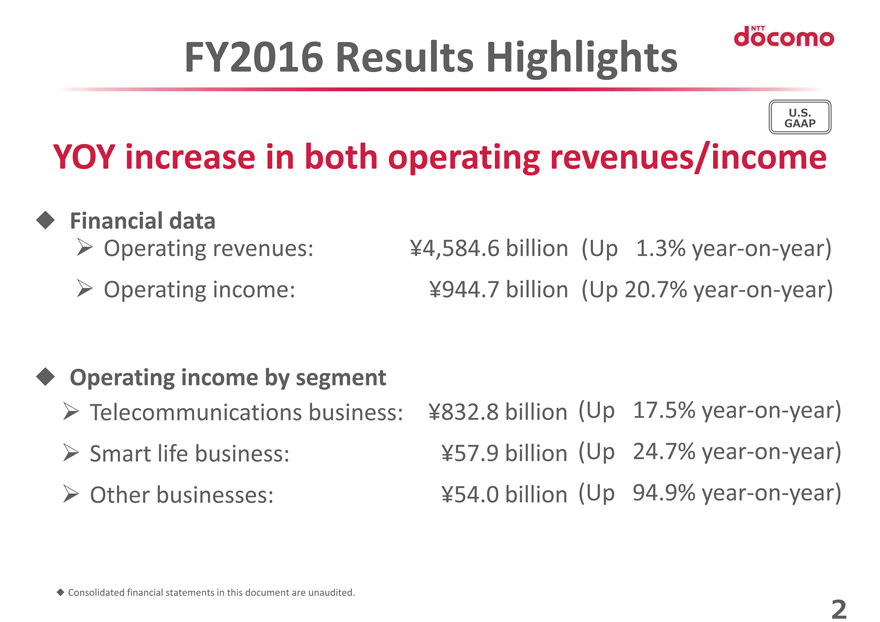
FY2016 Results Highlights U.S. GAAP YOY increase in both operating revenues/income Financial data Operating revenues: ¥4,584.6 billion (Up 1.3%year-on-year) Operating income: ¥944.7 billion (Up 20.7%year-on-year) Operating income by segment Telecommunications business: ¥832.8 billion (Up 17.5%year-on-year) Smart life business: ¥57.9 billion (Up 24.7%year-on-year) Other businesses: ¥54.0 billion (Up 94.9%year-on-year) Consolidated financial statements in this document are unaudited. 2
Table of Contents
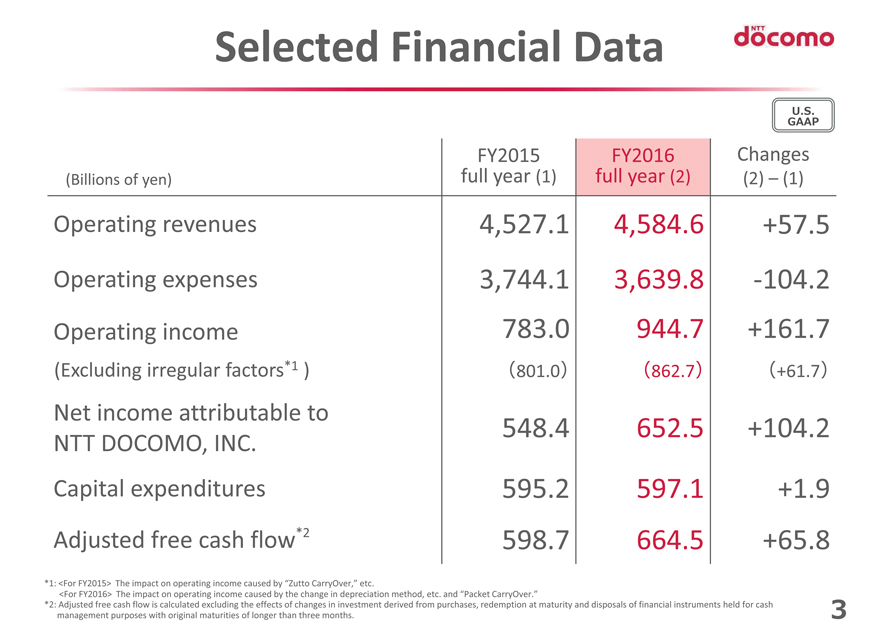
Selected Financial Data U.S. GAAP FY2015 FY2016 Changes (Billions of yen) full year (1) full year (2) (2) (1) Operating revenues 4,527.1 4,584.6 +57.5 Operating expenses 3,744.1 3,639.8-104.2 Operating income 783.0 944.7 +161.7 (Excluding irregular factors*1 ) (801.0) (862.7) (+61.7) Net income attributable to 548.4 652.5 +104.2 NTT DOCOMO, INC. Capital expenditures 595.2 597.1 +1.9 Adjusted free cash flow*2 598.7 664.5 +65.8 *1: <For FY2015> The impact on operating income caused by “Zutto CarryOver,” etc. <For FY2016> The impact on operating income caused by the change in depreciation method, etc. and “Packet CarryOver.” *2: Adjusted free cash flow is calculated excluding the effects of changes in investment derived from purchases, redemption at maturity and disposals of financial instruments held for cash management purposes with original maturities of longer than three months. 3
Table of Contents
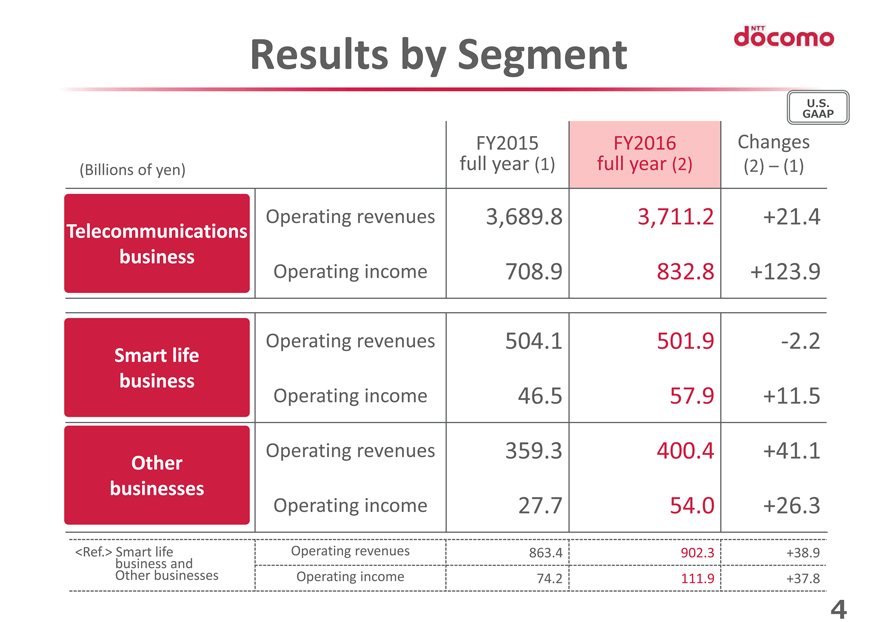
Results by Segment U.S. GAAP FY2015 FY2016 Changes (Billions of yen) full year (1) full year (2) (2) (1) Operating revenues 3,689.8 3,711.2 +21.4 Telecommunications business Operating income 708.9 832.8 +123.9 Operating revenues 504.1 501.9-2.2 Smart life business Operating income 46.5 57.9 +11.5 Operating revenues 359.3 400.4 +41.1 Other businesses Operating income 27.7 54.0 +26.3 <Ref.> Smart life Operating revenues 863.4 902.3 +38.9 business and Other businesses Operating income 74.2 111.9 +37.8 4
Table of Contents

Key Factors behind Changes in Operating Income Decrease in U.S.network-Increase in related GAAP (Billions of yen) other operating expenses*3: revenues: Decrease in Down 110.3 Up 29.2 selling Increase in mobile expenses*2: 944.7 communications Down 81.9 services revenues: Increase in Up 76.4 other 862.7 operating ?1 Increase inoptical-fiber 783.0 expenses: broadband service Decrease in Up 87.9 revenues, etc.: selling revenues: Up 93.2 Down 141.3 Income impact from the change of depreciation method, etc.: Up 60.0 Selling revenues Income impact from and expenses: “Packet CarryOver”: Up 22.0 Down 59.5 Operating revenues Operating expense Up 57.5 Down 104.2 FY15 FY16 *1: Operating income result is inclusive of “Zutto CarryOver,” etc.(-¥18.0 billion) *2: Sum of cost of equipment sold and commissions to agent resellers *3: Sum of depreciation/amortization, loss on disposal of property, plant and equipment and intangible assets, and communication network charges 5
Table of Contents
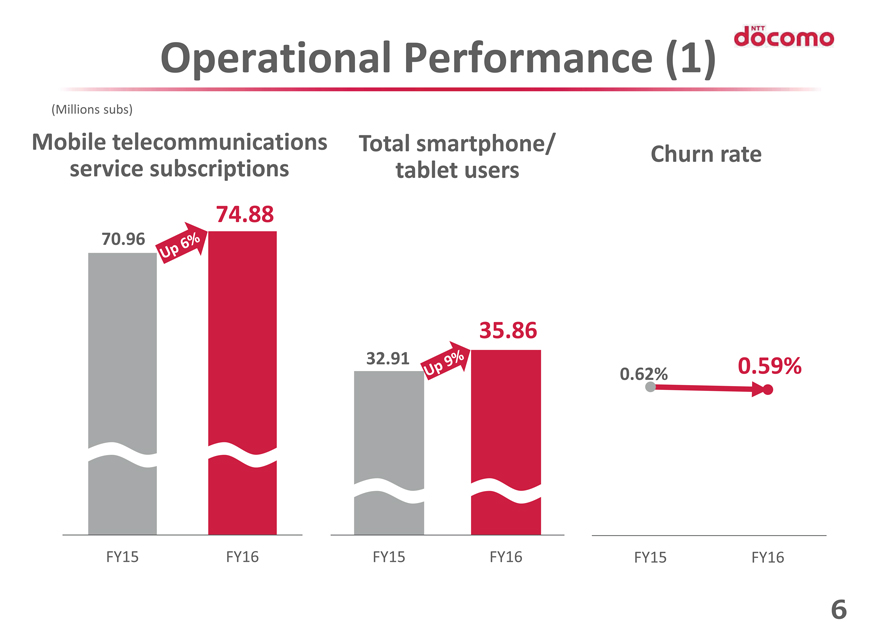
Operational Performance (1) (Millions subs) Mobile telecommunications Total smartphone/ Churn rate service subscriptions tablet users 74.88 70.96 35.86 32.91 0.59% 0.62% FY15 FY16 FY15 FY16 FY15 FY16 6
Table of Contents
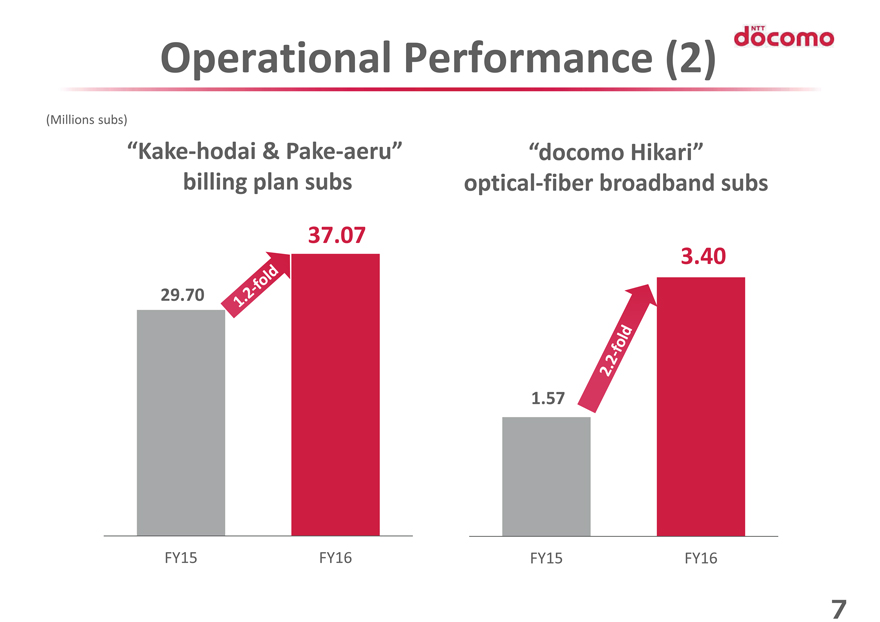
Operational Performance (2) (Millions subs)“Kake-hodai &Pake-aeru” “docomo Hikari” billing plan subsoptical-fiber broadband subs 37.07 3.40 29.70 1.57 FY15 FY16 FY15 FY16 7
Table of Contents
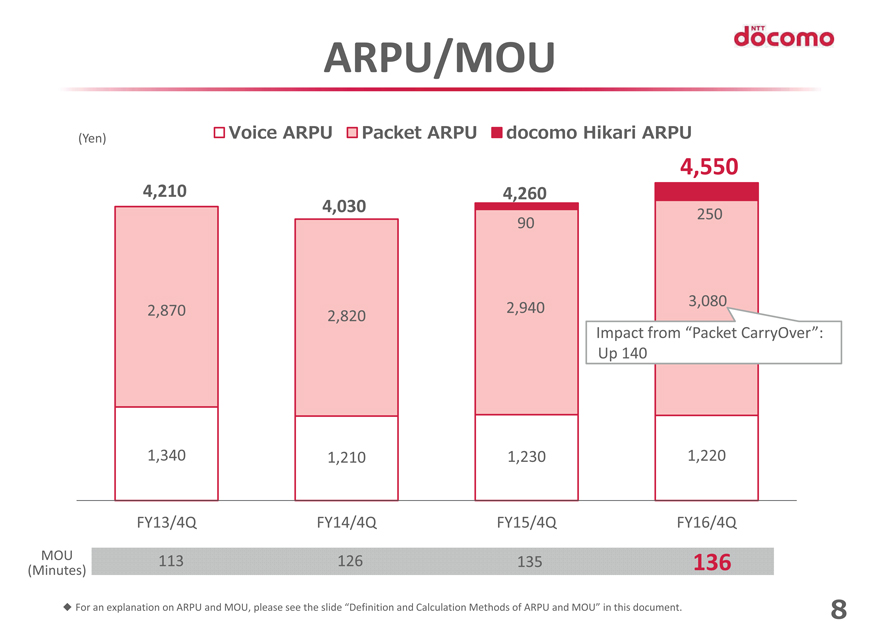
ARPU/MOU (Yen) Voice ARPU Packet ARPU docomo Hikari ARPU 4,550 4,210 4,260 4,030 250 90 3,080 2,870 2,940 2,820 Impact from “Packet CarryOver”: Up 140 1,340 1,210 1,230 1,220 FY13/4Q FY14/4Q FY15/4Q FY16/4Q MOU 113 126 135 136 (Minutes) For an explanation on ARPU and MOU, please see the slide “Definition and Calculation Methods of ARPU and MOU” in this document. 8
Table of Contents
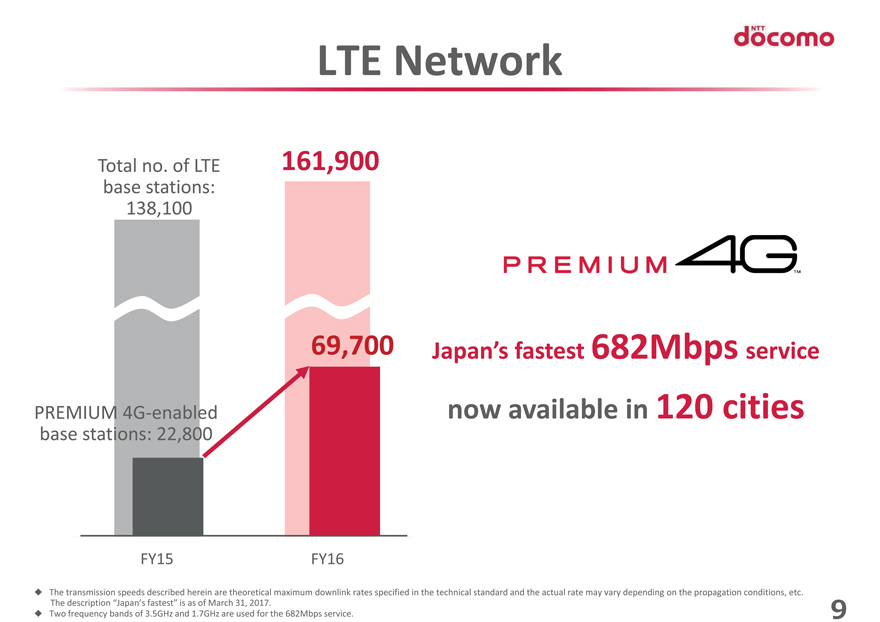
LTE Network Total no. of LTE 161,900 base stations: 138,100 69,700 Japan’s fastest 682Mbps service PREMIUM4G-enabled now available in 120 cities base stations: 22,800 FY15 FY16 The transmission speeds described herein are theoretical maximum downlink rates specified in the technical standard and the actual rate may vary depending on the propagation conditions, etc. The description “Japan’s fastest” is as of March 31, 2017. Two frequency bands of 3.5GHz and 1.7GHz are used for the 682Mbps service. 9
Table of Contents
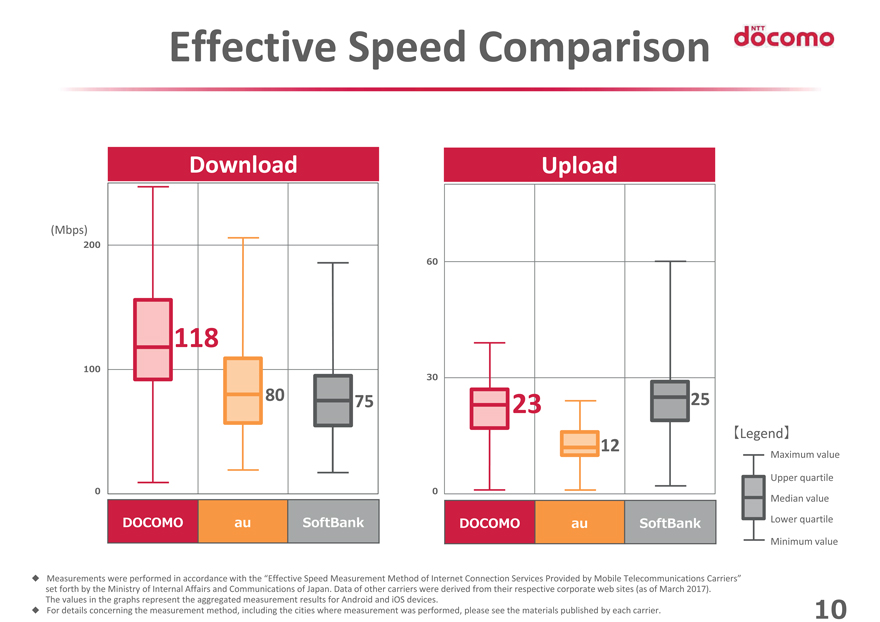
Effective Speed Comparison Download Upload (Mbps) 200200 60 60 118 100100 30 30 80 75 23 25 Legend 12 Maximum value Upper quartile 0 0 0 0 Median value DOCOMO au SoftBank DOCOMO au SoftBank Lower quartile Minimum value Measurements were performed in accordance with the “Effective Speed Measurement Method of Internet Connection Services Provided by Mobile Telecommunications Carriers” set forth by the Ministry of Internal Affairs and Communications of Japan. Data of other carriers were derived from their respective corporate web sites (as of March 2017). The values in the graphs represent the aggregated measurement results for Android and iOS devices. For details concerning the measurement method, including the cities where measurement was performed, please see the materials published by each carrier. 10
Table of Contents
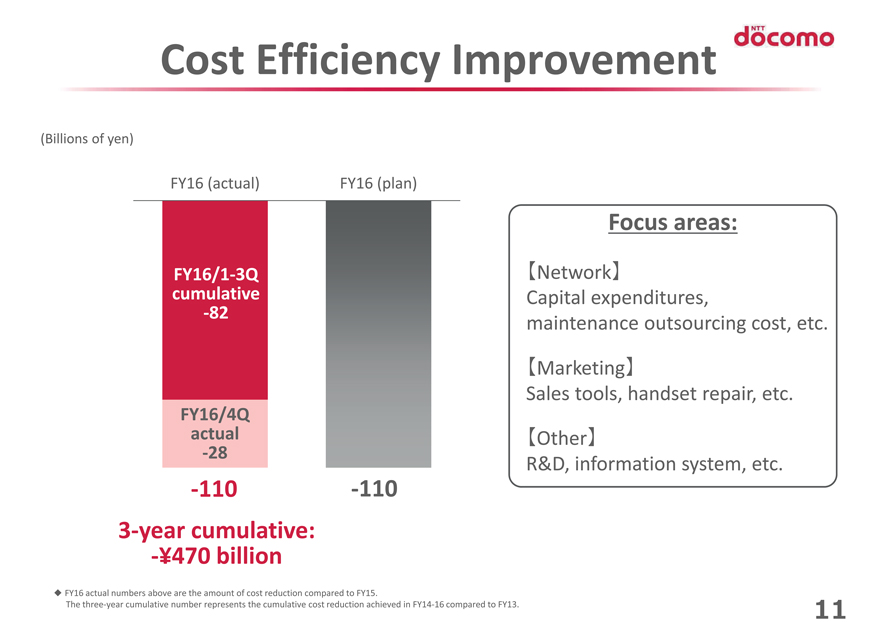
Cost Efficiency Improvement (Billions of yen) FY16 (actual) FY16 (plan) Focus areas:FY16/1-3Q Network cumulative Capital expenditures,-82 maintenance outsourcing cost, etc. Marketing Sales tools, handset repair, etc. FY16/4Q actual Other-28 R&D, information system, etc.-110-1103-year cumulative:-¥470 billion FY16 actual numbers above are the amount of cost reduction compared to FY15. Thethree-year cumulative number represents the cumulative cost reduction achieved inFY14-16 compared to FY13. 11
Table of Contents

Smart Life Business & Other Businesses: Operating Income 120 Principal services, etc: (Billions of yen) * 111.9 Smart Life Business Content services 74.2 Finance/Payment services Group companies Other Businesses Enterprise solutions Support services for customers’ peace of mind, etc. FY15 (actual) FY16 (actual) FY16 (Plan) * Operating income result is inclusive of impairment loss(-¥8.1 billion). 12
Table of Contents
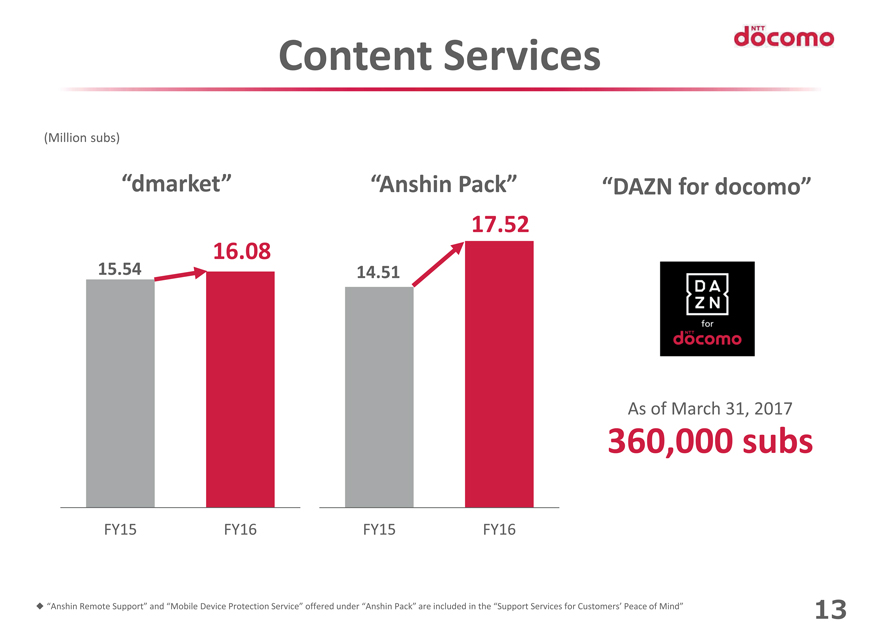
Content Services (Million subs) “dmarket” “Anshin Pack” “DAZN for docomo” 17.52 16.08 15.54 14.51 As of March 31, 2017 360,000 subs FY15 FY16 FY15 FY16 “Anshin Remote Support” and “Mobile Device Protection Service” offered under “Anshin Pack” are included in the “Support Services for Customers’ Peace of Mind” 13
Table of Contents
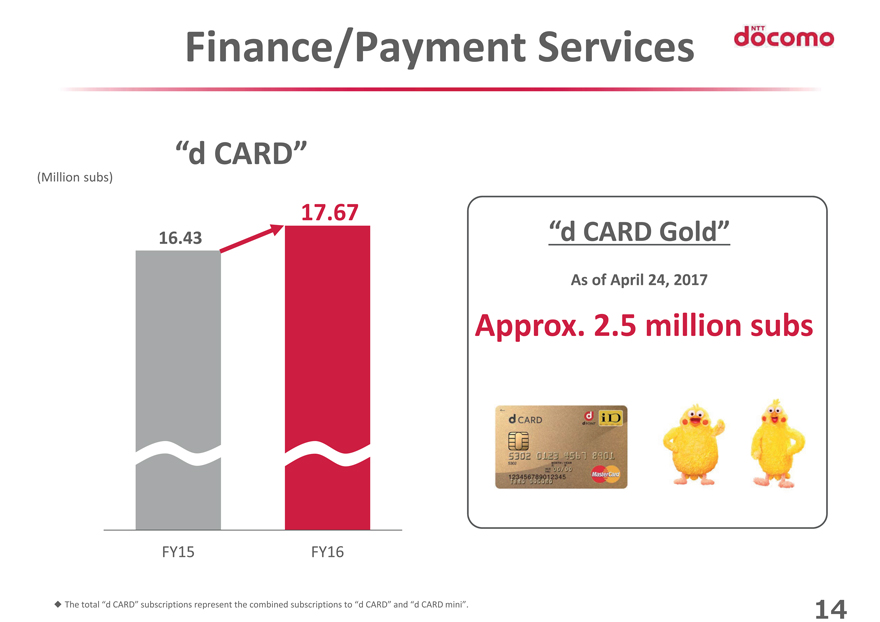
Finance/Payment Services “d CARD” (Million subs) 17.67 16.43 “d CARD Gold” As of April 24, 2017 Approx. 2.5 million subs FY15 FY16 The total “d CARD” subscriptions represent the combined subscriptions to “d CARD” and “d CARD mini”. 14
Table of Contents
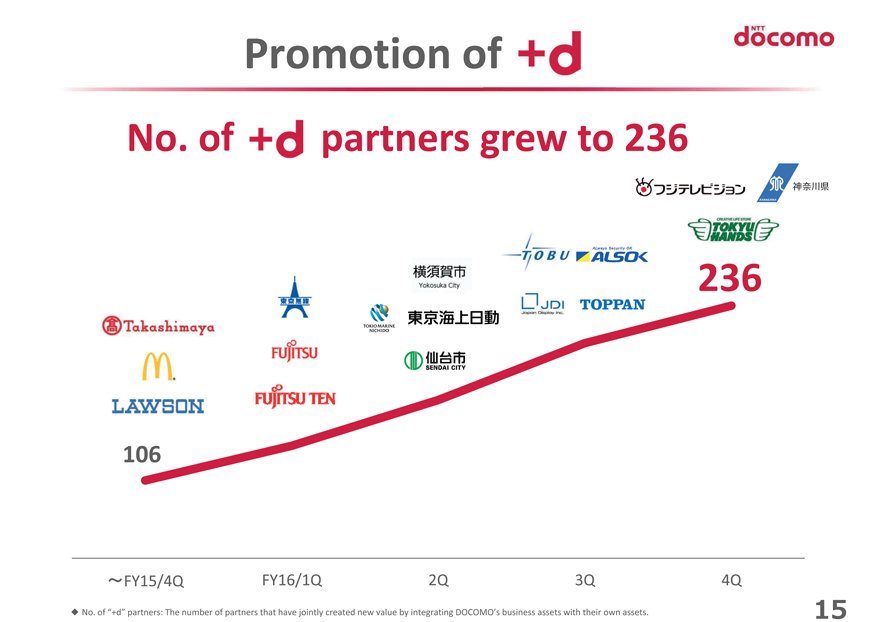
Promotion of No. of partners grew to 236 236 106 ?FY15/4Q FY16/1Q 2Q3Q4Q No. of “+d” partners: The number of partners that have jointly created new value by integrating DOCOMO’s business assets with their own assets. 15
Table of Contents
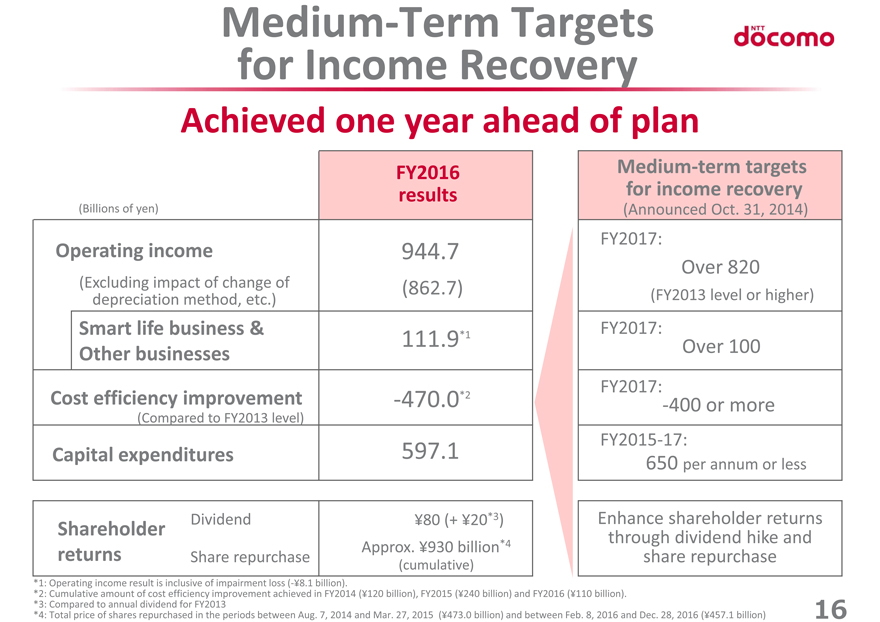
Medium-Term Targets for Income Recovery Achieved one year ahead of plan FY2016Medium-term targets results for income recovery (Billions of yen) (Announced Oct. 31, 2014) FY2017: Operating income 944.7 Over 820 (Excluding impact of change of (862.7) (FY2013 level or higher) depreciation method, etc.) Smart life business & FY2017: 111.9*1 Other businesses Over 100 FY2017: Cost efficiency improvement-470.0*2 (Compared to FY2013 level)-400 or moreFY2015-17: Capital expenditures 597.1 650 per annum or less Dividend ¥80 (+ ¥20*3) Enhance shareholder returns Shareholder *4 through dividend hike and returns Approx. ¥930 billion Share repurchase share repurchase (cumulative) *1: Operating income result is inclusive of impairment loss(-¥8.1 billion). *2: Cumulative amount of cost efficiency improvement achieved in FY2014 (¥120 billion), FY2015 (¥240 billion) and FY2016 (¥110 billion). *3: Compared to annual dividend for FY2013 *4: Total price of shares repurchased in the periods between Aug. 7, 2014 and Mar. 27, 2015 (¥473.0 billion) and between Feb. 8, 2016 and Dec. 28, 2016 (¥457.1 billion) 16
Table of Contents
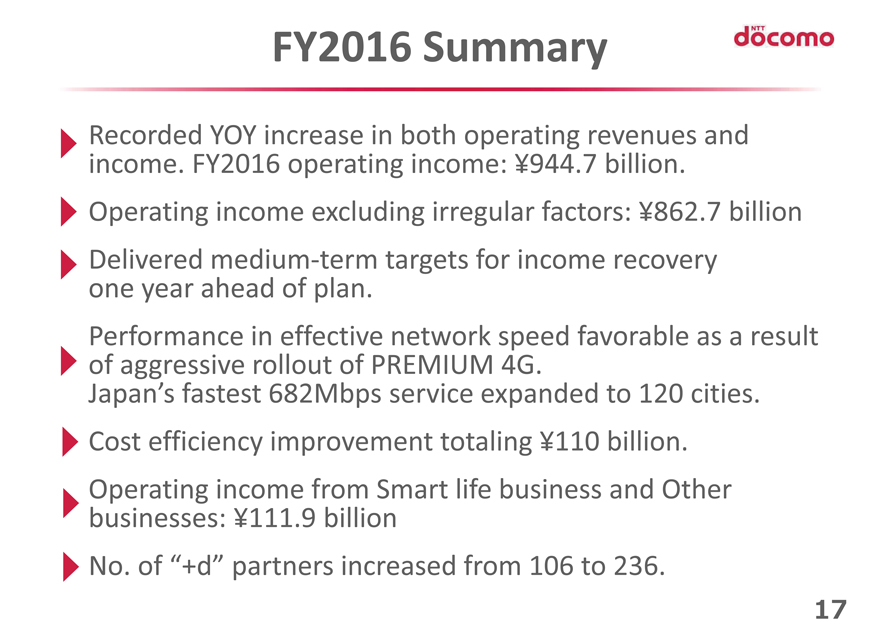
FY2016 Summary Recorded YOY increase in both operating revenues and income. FY2016 operating income: ¥944.7 billion. Operating income excluding irregular factors: ¥862.7 billion Deliveredmedium-term targets for income recovery one year ahead of plan. Performance in effective network speed favorable as a result of aggressive rollout of PREMIUM 4G. Japan’s fastest 682Mbps service expanded to 120 cities. Cost efficiency improvement totaling ¥110 billion. Operating income from Smart life business and Other businesses: ¥111.9 billion No. of “+d” partners increased from 106 to 236. 17
Table of Contents
1. FY2016 Results Highlights
Key Financial Data, Segment Results
Telecommunications Business Smart Life Business & Other
Businesses
2. FY2017Full-Year Guidance, etc.
Table of Contents
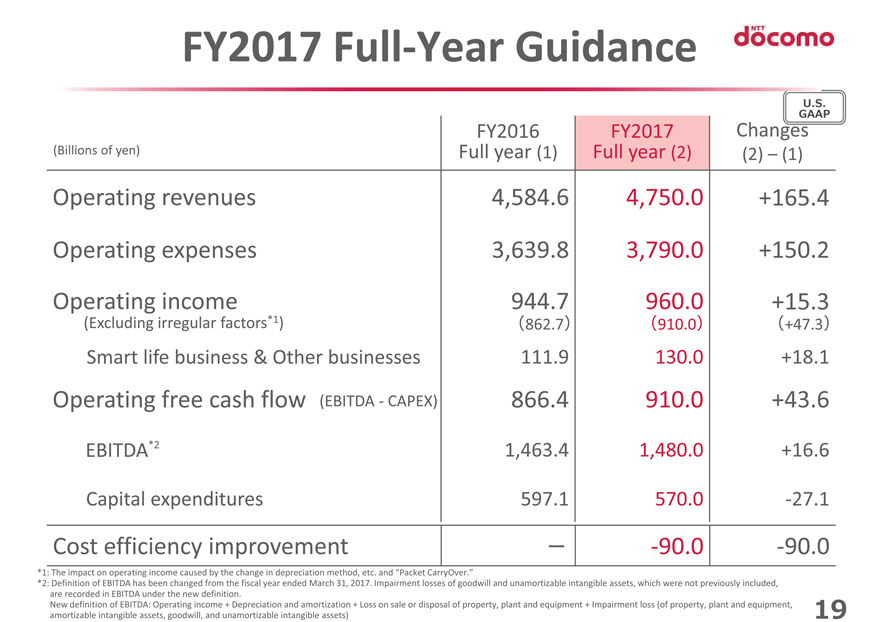
FY2017Full-Year Guidance U.S. GAAP FY2016 FY2017 Changes (Billions of yen) Full year (1) Full year (2) (2) (1) Operating revenues 4,584.6 4,750.0 +165.4 Operating expenses 3,639.8 3,790.0 +150.2 Operating income 944.7 960.0 +15.3 (Excluding irregular factors*1) (862.7) (910.0) (+47.3) Smart life business & Other businesses 111.9 130.0 +18.1 Operating free cash flow (EBITDA-CAPEX) 866.4 910.0 +43.6 EBITDA*2 1,463.4 1,480.0 +16.6 Capital expenditures 597.1 570.0-27.1 Cost efficiency improvement —-90.0-90.0 *1: The impact on operating income caused by the change in depreciation method, etc. and “Packet CarryOver.” *2: Definition of EBITDA has been changed from the fiscal year ended March 31, 2017. Impairment losses of goodwill and unamortizable intangible assets, which were not previously included, are recorded in EBITDA under the new definition. New definition of EBITDA: Operating income + Depreciation and amortization + Loss on sale or disposal of property, plant and equipment + Impairment loss (of property, plant and equipment, amortizable intangible assets, goodwill, and unamortizable intangible assets) 19
Table of Contents
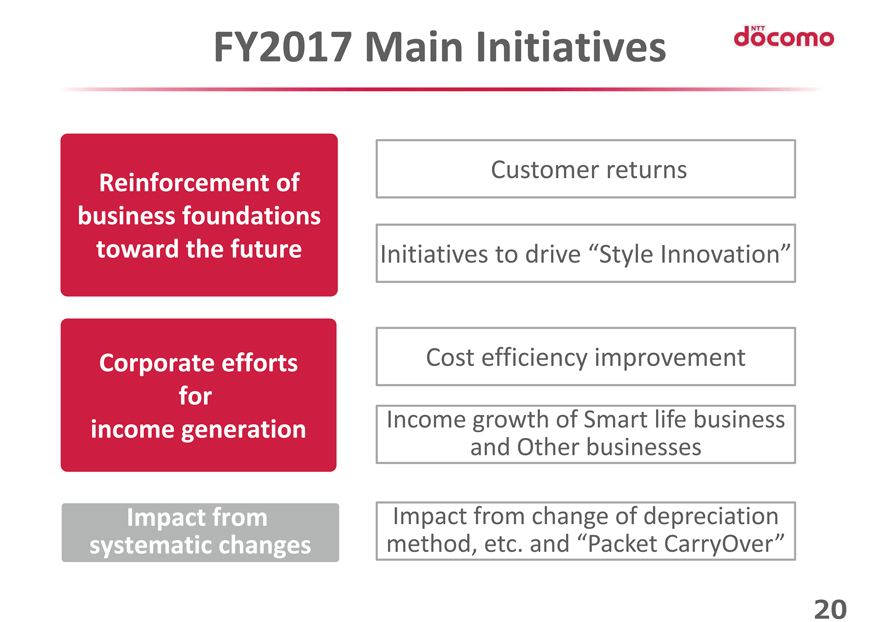
FY2017 Main Initiatives Customer returns Reinforcement of business foundations toward the future Initiatives to drive “Style Innovation” Corporate efforts Cost efficiency improvement for income generation Income growth of Smart life business and Other businesses Impact from Impact from change of depreciation systematic changes method, etc. and “Packet CarryOver” 20
Table of Contents
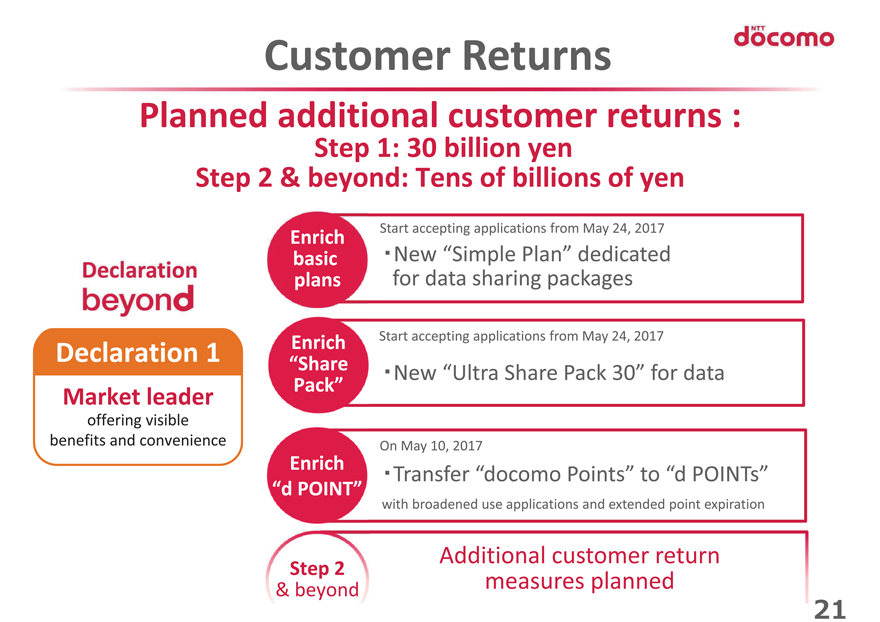
Customer Returns Planned additional customer returns : Step 1: 30 billion yen Step 2 & beyond: Tens of billions of yen Start accepting applications from May 24, 2017 Enrich basic ?New “Simple Plan” dedicated plans for data sharing packages Enrich Start accepting applications from May 24, 2017 Declaration 1 “Share ?New “Ultra Share Pack 30” for data Pack” Market leader offering visible benefits and convenience On May 10, 2017 Enrich ?Transfer “docomo Points” to “d POINTs” “d POINT” with broadened use applications and extended point expiration Additional customer return Step 2 & beyond measures planned 21
Table of Contents
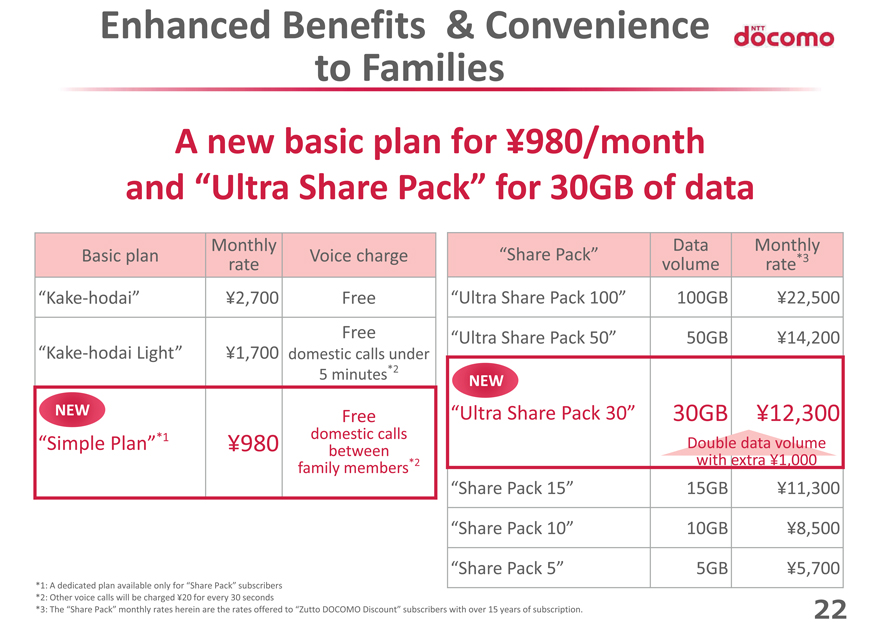
Enhanced Benefits & Convenience to Families A new basic plan for Ą980/month and “Ultra Share Pack” for 30GB of data Monthly Data Monthly Basic plan Voice charge “Share Pack” *3 rate volume rate“Kake-hodai” Ą2,700 Free “Ultra Share Pack 100” 100GB Ą22,500 Free “Ultra Share Pack 50” 50GB Ą14,200“Kake-hodai Light” Ą1,700 domestic calls under 5 minutes*2 NEW NEW Free “Ultra Share Pack 30” 30GB Ą12,300 *1 domestic calls “Simple Plan” Ą980 Double data volume between *2 with extra Ą1,000 family members “Share Pack 15” 15GB Ą11,300 “Share Pack 10” 10GB Ą8,500 “Share Pack 5” 5GB Ą5,700 *1: A dedicated plan available only for “Share Pack” subscribers *2: Other voice calls will be charged Ą20 for every 30 seconds *3: The “Share Pack” monthly rates herein are the rates offered to “Zutto DOCOMO Discount” subscribers with over 15 years of subscription. 22
Table of Contents

Case: Use of “Simple Plan” with Three Family Members Representative line subscriber Aged 25 or younger (using DOCOMO for 15 years ) 2GB data use 2GB data use 2GB data use Simple Plan Simple Plan Simple Plan Basic plan Ą980 Ą980 Ą980sp-mode Ą300 Ą300 Ą300 Share Pack 5 Ą6,500 Ą500 Ą500 Packet Pack Zutto DOCOMO discount U25 Special Discount-Ą800 +1GB Ą6,980 Ą1,780 Ą1,780 Average fee per user: Ą3,513 (2GB) (Total for three users: Ą10,540) 23
Table of Contents

Managerial Targets of “Declaration beyond” Continue proactive customer returns through cost efficiency improvement, while increasing operating free cash flow and stepping up shareholder returns FY16 FY17 2020 Operating Cash generation capability exceeding previous fiscal year continuously by FCF Ą866.4 billion Ą910.0 billion realizing efficient investment (EBITDA-CAPEX) activities in 5G and EBITDA growth Shareholder Annual Dividend Annual Dividend Continuous increase in dividends returns Ą80 Ą100 and expeditious share repurchase 24
Table of Contents
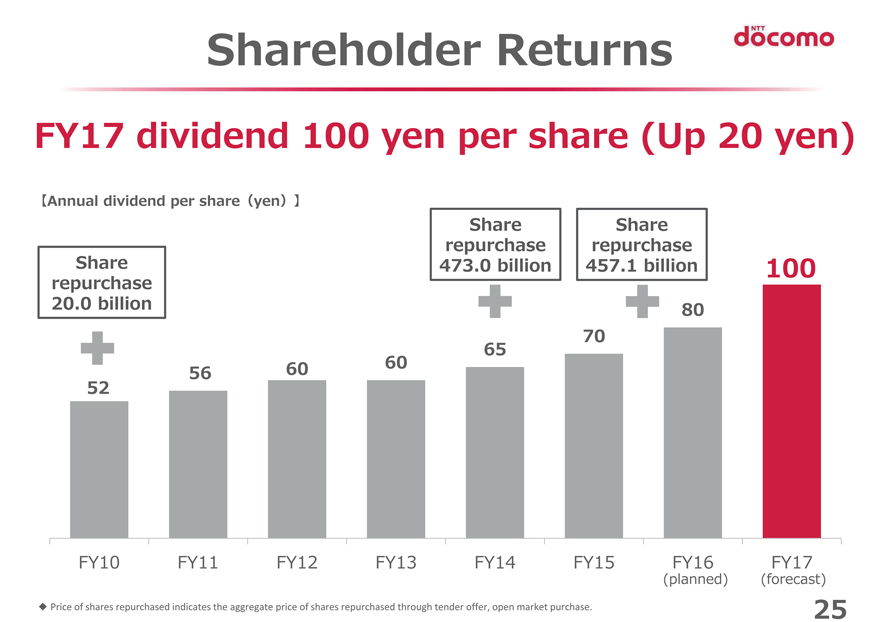
Shareholder Returns FY17 dividend 100 yen per share (Up 20 yen) Annual dividend per share(yen) Share Share Share repurchase repurchase repurchase 473.0 billion 457.1 billion 100 20.0 billion 80 70 65 60 60 56 52 FY10 FY11 FY12 FY13 FY14 FY15 FY16 FY17 (planned) (forecast) Price of shares repurchased indicates the aggregate price of shares repurchased through tender offer, open market purchase. 25
Table of Contents
The new of today, the norm of tomorrow 26
Table of Contents
Appendices 27
Table of Contents
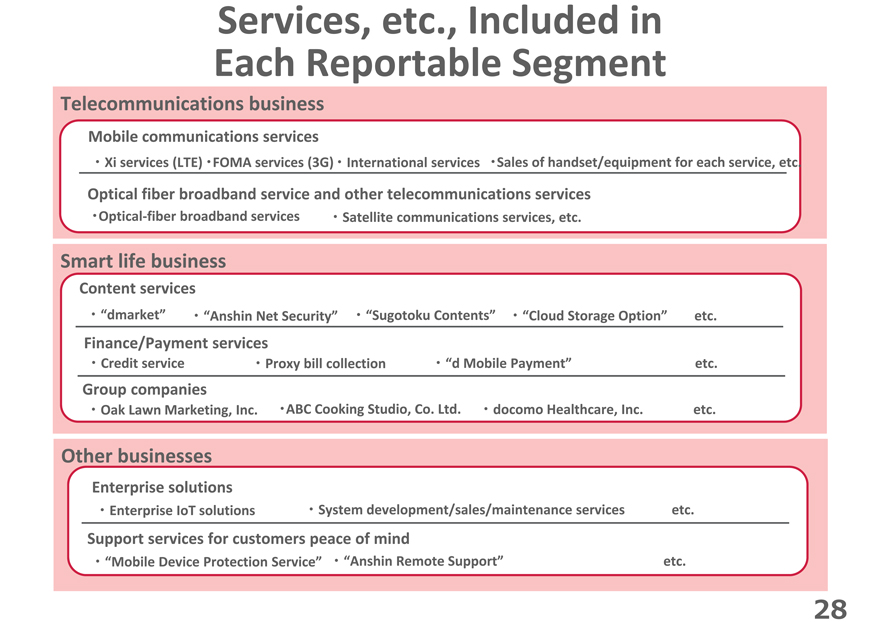
Services, etc., Included in Each Reportable Segment Telecommunications business Mobile communications services ?Xi services (LTE)?FOMA services (3G)?International services?Sales of handset/equipment for each service, etc. Optical fiber broadband service and other telecommunications services?Optical-fiber broadband services?Satellite communications services, etc. Smart life business Content services ?“dmarket”?“Anshin Net Security”?“Sugotoku Contents”?“Cloud Storage Option” etc. Finance/Payment services ?Credit service?Proxy bill collection?“d Mobile Payment” etc. Group companies ?Oak Lawn Marketing, Inc.?ABC Cooking Studio, Co. Ltd.?docomo Healthcare, Inc. etc. Other businesses Enterprise solutions ?Enterprise IoT solutions?System development/sales/maintenance services etc. Support services for customers peace of mind ?“Mobile Device Protection Service”?“Anshin Remote Support” etc. 28
Table of Contents
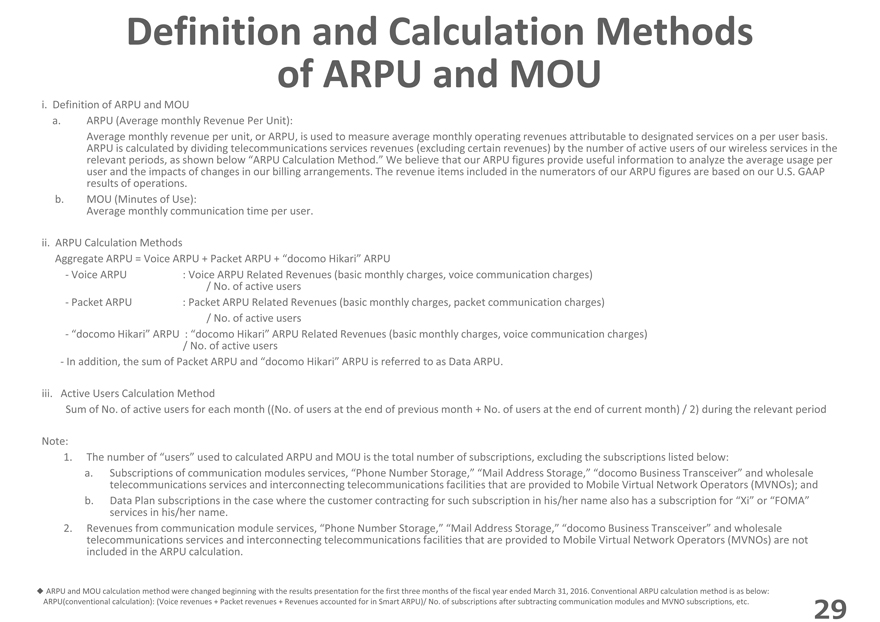
Definition and Calculation Methods of ARPU and MOU i. Definition of ARPU and MOU a. ARPU (Average monthly Revenue Per Unit): Average monthly revenue per unit, or ARPU, is used to measure average monthly operating revenues attributable to designated services on a per user basis. ARPU is calculated by dividing telecommunications services revenues (excluding certain revenues) by the number of active users of our wireless services in the relevant periods, as shown below “ARPU Calculation Method.” We believe that our ARPU figures provide useful information to analyze the average usage per user and the impacts of changes in our billing arrangements. The revenue items included in the numerators of our ARPU figures are based on our U.S. GAAP results of operations. b. MOU (Minutes of Use): Average monthly communication time per user. ii. ARPU Calculation Methods Aggregate ARPU = Voice ARPU + Packet ARPU + “docomo Hikari” ARPU-Voice ARPU : Voice ARPU Related Revenues (basic monthly charges, voice communication charges) / No. of active users-Packet ARPU : Packet ARPU Related Revenues (basic monthly charges, packet communication charges) / No. of active users-“docomo Hikari” ARPU : “docomo Hikari” ARPU Related Revenues (basic monthly charges, voice communication charges) / No. of active users-In addition, the sum of Packet ARPU and “docomo Hikari” ARPU is referred to as Data ARPU. iii. Active Users Calculation Method Sum of No. of active users for each month ((No. of users at the end of previous month + No. of users at the end of current month) / 2) during the relevant period Note: 1. The number of “users” used to calculated ARPU and MOU is the total number of subscriptions, excluding the subscriptions listed below: a. Subscriptions of communication modules services, “Phone Number Storage,” “Mail Address Storage,” “docomo Business Transceiver” and wholesale telecommunications services and interconnecting telecommunications facilities that are provided to Mobile Virtual Network Operators (MVNOs); and b. Data Plan subscriptions in the case where the customer contracting for such subscription in his/her name also has a subscription for “Xi” or “FOMA” services in his/her name. 2. Revenues from communication module services, “Phone Number Storage,” “Mail Address Storage,” “docomo Business Transceiver” and wholesale telecommunications services and interconnecting telecommunications facilities that are provided to Mobile Virtual Network Operators (MVNOs) are not included in the ARPU calculation. ARPU and MOU calculation method were changed beginning with the results presentation for the first three months of the fiscal year ended March 31, 2016. Conventional ARPU calculation method is as below: ARPU(conventional calculation): (Voice revenues + Packet revenues + Revenues accounted for in Smart ARPU)/ No. of subscriptions after subtracting communication modules and MVNO subscriptions, etc. 29
Table of Contents
Special Note RegardingForward-Looking Statements This presentation containsforward-looking statements such as forecasts of results of operations, management strategies, objectives and plans, forecasts of operational data such as the expected number of subscriptions, and the expected dividend payments. Allforward-looking statements that are not historical facts are based on management’s current plans, expectations, assumptions and estimates based on the information currently available. Some of the projected numbers in this presentation were derived using certain assumptions that were indispensable for making such projections in addition to historical facts. Theseforward-looking statements are subject to various known and unknown risks, uncertainties and other factors that could cause our actual results to differ materially from those contained in or suggested by anyforward-looking statement. Potential risks and uncertainties include, without limitation, the following: (1) Changes in the market environment in the telecommunications industry, such as intensifying competition from other businesses or other technologies caused by Mobile Number Portability, development of appealing new handsets, new market entrants, mergers among other service providers and other factors, or the expansion of the areas of competition and an increase in mobile communications operators entering into and collaborating with other industries could limit the acquisition of new subscriptions and retention of existing subscriptions by our corporate group, or it may lead to ARPU diminishing at a greater than expected rate, an increase in our costs, or an inability to optimize costs as expected. (2) If current and new services, usage patterns, and sales schemes proposed and introduced by our corporate group cannot be developed as planned, or if unanticipated expenses arise the financial condition of our corporate group could be affected and our growth could be limited. (3) The introduction or change of various laws or regulations inside and outside of Japan, or the application of such laws and regulations to our corporate group, could restrict our business operations, which may adversely affect our financial condition and results of operations. (4) Limitations in the amount of frequency spectrum or facilities made available to us could negatively affect our ability to maintain and improve our service quality and level of customer satisfaction and could increase our costs. (5) Other mobile service providers in the world may not adopt the technologies and the frequency bands that are compatible with those used by our corporate group’s mobile communications system on a continuing basis, which could affect our ability to sufficiently offer international services. (6) Our domestic and international investments, alliances and collaborations, as well as investments in new business fields, may not produce the returns or provide the opportunities we expect. (7) Malfunctions, defects or imperfections in our products and services or those of other parties may give rise to problems. (8) Social problems that could be caused by misuse or misunderstanding of our products and services may adversely affect our credibility or corporate image. (9) Inadequate handling of confidential business information including personal information by our corporate group, contractors and others may adversely affect our credibility or corporate image. (10) Owners of intellectual property rights that are essential for our business execution may not grant us a license or other use of such intellectual property rights, which may result in our inability to offer certain technologies, products and/or services, and our corporate group may also be held liable for damage compensation if we infringe the intellectual property rights of others. In addition, the illicit use by a third party of the intellectual property rights owned by our corporate group could reduce our license revenues actually obtained and may inhibit our competitive superiority. (11) Events and incidents caused by natural disasters, social infrastructure paralysis such as power shortages, the proliferation of harmful substances, terror or other destructive acts, the malfunctioning of equipment, software bugs, deliberate incidents induced by computer viruses,cyber-attacks, equipment misconfiguration, hacking, unauthorized access and other problems could cause failure in our networks, distribution channels, and/or other factors necessary for the provision of service, disrupting our ability to offer services to our subscribers and such incidents may adversely affect our credibility or corporate image, or lead to a reduction of revenues and/or increase of costs. (12) Concerns about adverse health effects arising from wireless telecommunications may spread and consequently adversely affect our financial condition and results of operations. (13) Our parent company, NIPPON TELEGRAPH AND TELEPHONE CORPORATION (NTT), could exercise influence that may not be in the interests of our other shareholders. Names of companies, products, etc., contained in this presentation are the trademarks or registered trademarks of their respective organizations. All indicated fees, contained in this presentation, exclude tax unless otherwise specified. 30