September 23, 2004 | CONFIDENTIAL |
Sturgis Bancorp, Inc.
Valuation as of September 20, 2004
Donnelly Penman & Partners
I N V E S T M E N T B A N K I N G
CONFIDENTIAL
![]()
| Table of Contents |
| 1. | Valuation Opinion Letter |
|
|
|
| 2. | Valuation Summary |
|
|
|
| 3. | Discounted Cash Flow Analysis |
|
|
|
| 4. | Recent Trading Analysis |
|
|
|
| 5. | Analysis of Comparable Companies |
|
|
|
| 6. | Analysis of Comparable Acquisitions |
Donnelly Penman & Partners |
|
CONFIDENTIAL
![]()
1. Valuation Opinion Letter
Donnelly Penman & Partners |
|
September 23, 2004
Board of Directors
Sturgis Bancorp, Inc.
125 E. Chicago Road
Sturgis, MI 49091
Attn: Eric L. Eishen - President and CEO
Dear Board of Directors: | PRIVATE & CONFIDENTIAL |
Sturgis Bancorp Inc. ("Sturgis" or the "Company") has engaged Donnelly Penman & Partners ("DP&P") to render its opinion (the "Opinion") with respect to the fair market per share value of the Company's common stock as of September 20, 2004 in the event of a recapitalization through a reverse stock split or "squeeze out" merger transaction.
DP&P is a regional investment banking firm of recognized standing. As part of our investment banking services, we are regularly engaged in the valuation of corporate entities on a stand-alone basis or in connection with capital raising and merger and acquisition transactions. No limitations were imposed by the Company upon DP&P with respect to the investigations made or procedures followed by DP&P in rendering its Opinion.
In arriving at our Opinion, we have:
I. | Reviewed the Annual Reports of the Company for the years ended December 31, 2002 through 2003 as well as interim financials through July 31, 2004; |
|
|
II. | Reviewed reports from the Board of Directors meetings for Sturgis Bancorp Inc and Sturgis Bank and Trust held during the month of July, 2004; |
|
|
III. | Reviewed the Company's Strategic Plan and 2004 - 2006 forecast; |
|
|
IV. | Compared certain financial characteristics of the Company to certain publicly held companies we deemed relevant; |
|
|
V. | Reviewed current banking industry conditions and trends concerning the valuation of recent mergers and acquisitions; |
|
|
VI. | Conducted discussions with the senior management of the Company concerning the business and future prospects of the Company; |
Mr. Eric L. Eishen
September 23, 2004
Page 2
VII. | Prepared a discounted cash flow analysis of the Company based on projections derived from discussions with and deemed reasonable by management of the Company; and |
|
|
VIII. | Reviewed such other data, including financial and industry data, performed such other analyses and taken into account such other matters as we deemed necessary or appropriate. |
In connection with rendering its Opinion to Sturgis, DP&P performed a variety of financial analyses, which are summarized below. DP&P believes that its analyses must be considered as a whole and that selecting portions of its analyses and the factors considered by it, without consideration of all factors and analyses, could create a misleading view of the analyses and the processes underlying DP&P's Opinion. DP&P arrived at its Opinion based on the results of all the analyses it undertook, assessed as a whole, and it did not draw conclusions from or with regard to any one method of analysis. The preparation of a valuation is a complex process involving subjective judgments, and is not necessarily susceptible to partial analysis or summary description.
DP&P did not make or obtain any independent evaluation, valuation or appraisal of the assets or liabilities of Sturgis, nor were we furnished with such materials. DP&P has not reviewed any individual credit files of the Company and has assumed, without independent verification, that the reported allowances for credit losses are adequate to cover such losses.
With respect to the comparable company analysis and comparable merger transaction analysis summarized below, no public company utilized as a comparison is identical to Sturgis, and such analyses necessarily involves complex considerations and judgments concerning the differences in financial and operating characteristics of the financial institutions and other factors that could affect the acquisition or public trading values of the financial institutions concerned. The forecasted financial information furnished by the Company's management contained in or underlying DP&P's analyses are not necessarily indicative of future results or values, which may be significantly more or less favorable than such forecasts and estimates. The forecasts and estimates were based on numerous variables and assumptions that are inherently uncertain, including without limitation factors related to general economic and competitive conditions. In that regard, DP&P assumed, with the Company's consent, that the financial forecasts had been reasonably prepared by management on a basis reflecting the best currently available judgments of management, and that such forecasts will be realized in the amounts and at the times contemplated thereby.
Estimates of values of financial institutions or assets do not purport to be appraisals or necessarily reflect the prices at which financial institutions or their securities actually may be sold. Accordingly, actual results could vary significantly from those assumed in the financial forecasts and related analyses. The analyses performed by DP&P were assigned a weighting based on DP&P's opinion of their relative comparability and significance with regard to the specific characteristics of Sturgis.
Mr. Eric L. Eishen
September 23, 2004
Page 3
COMPANY BACKGROUND
Sturgis Bancorp, Inc. is a financial holding company under the Bank Holding Company Act of 1956, as amended. The Company originated on December 11, 2001, when the shareholders of Sturgis Bank & Trust Company (the "Bank") approved the reorganization of the Bank as a wholly owned subsidiary of the Company. This reorganization was effective January 1, 2002. The Bank is a state-chartered savings bank located in Sturgis, Michigan. The Bank began operations in 1905 as a state chartered building and loan association and in 1988 converted to a federally chartered stock savings bank. In 1999, the Bank was approved by the State of Michigan to become a Michigan savings bank. The principal business of the Bank is to accept savings deposits from the general public and make single family mortgage loans and to a lesser extent, consumer and commercial loans. The Bank established a trust department in 1997 and has been expanding its commercial loan department since 1998. The Bank conducts business from its main office in Sturgis, Michigan and 9 full-service branch offices located in Bronson, Centreville, Climax, Coldwater, Colon, South Haven, Sturgis, Three Rivers and White Pigeon, Michigan. The Bank also operates one limited services branch in Sturgis, Michigan.
The Bank's market area covers all of St. Joseph County and parts of Cass, Branch, Calhoun, Van Buren, Allegan, Hillsdale and Kalamazoo Counties. St. Joseph County has a population of approximately 64,422 with the two main areas of population concentrated in Sturgis and Three Rivers with approximate populations of 11,285 and 7,328, respectively. Bronson, Centreville, Climax, Coldwater, Colon, South Haven and White Pigeon have approximate populations ranging from 1,200 to 10,000. Most individuals within the Bank's market area live within 25 miles of their places of employment.
St. Joseph County has a diverse economy. It is a rural county that has a large agricultural base, but also has a diverse industrial base. Some of the larger manufacturers in the area produce truck bodies, infant formula, machine tools, plastic products, paper board, mirrored acrylic, pressure sensitive labels, orthotic devices, automotive transmissions, and other automotive parts and accessories. There are numerous tool and die as well as mold shops, both large and small.
Sturgis is traded through the NASDAQ SmallCap Market under the symbol STBI. Its shares are traded on a limited basis through 12 multiple local regional and national market makers. The most recent trade of the stock was 400 shares at $13.61 on September 20, 2004. The Company had 2,730,385 shares outstanding as of June 30, 2004.
INDUSTRY OVERVIEW
Commercial, retail and mortgage banking are highly competitive businesses in which the Company receives competition from both bank and non-bank institutions. As a result of the Riegle-Neal Interstate Banking and Branching Efficiency Act of 1994 and the Gramm-Leach-Bliley Act of 1999, the number and types of depository institution competitors have substantially increased.
Mr. Eric L. Eishen
September 23, 2004
Page 4
Sturgis faces increased competition from finance companies, credit unions and bank and non-bank mortgage lenders. These companies may offer higher lending limits and other non-traditional services that Sturgis does not currently offer. Some of the Company's competitors also can leverage greater resources in order to gain a larger business presence within Sturgis' target service areas.
While being relatively small can be a disadvantage, there are certain potential benefits as well. Community banks that make customer service a priority may be able to gain an advantage with customers in their local market that feel neglected by the larger banks. Because the larger banks often seek large homogenous markets and products, niche opportunities are created for smaller institutions that seek to fill the needs of the underserved. Also, the relative difference in size can often correspond to a more agile management team that can respond more quickly to the ever changing competitive environment.
ECONOMIC OVERVIEW
Reports from the Federal Reserve Districts, as outlined in the July 28, 2004 Federal Reserve "Beige Book,"1 indicate that economic growth continued to expand, although some Districts reported that the rate of growth moderated.
Consumer lending activity rose moderately with reports that mortgage originations are strong. Five districts reported increases in their banks' residential real estate lending: Philadelphia, Cleveland, Richmond, Chicago, and St. Louis. Several of these districts indicated that although overall residential real estate lending had risen, the volume of refinancings fell further recently. Both the New York and San Francisco Districts saw borrowing by homebuyers decline, but San Francisco noted that the levels of residential real estate lending in its district remained high.
Borrowing by commercial clients rose moderately as reported by most districts, with the New York, Philadelphia, Cleveland, Richmond, Atlanta, St. Louis, Kansas City, Dallas, and San Francisco Districts reporting rising commercial borrowing in recent weeks. New York, Philadelphia, and Atlanta, however, noted that the increases in their districts were modest. In the Chicago District, commercial borrowing was characterized as flat.
Most Districts reported little change in loan delinquencies. The Cleveland District noted that delinquency rates remained largely unchanged in recent weeks, and applicant credit quality was characterized as stable or slightly improving. Likewise, the New York District reported lower delinquency rates across all loan categories. In the Chicago District, lenders note that household credit quality continues to improve and there were no changes in loan standards and terms. Moderate increases in credit card lending were reported in the Philadelphia District, while the San Francisco District reports good credit quality on existing loans.
____________________________
1Summary of Commentary on Current Economic Conditions by Federal Reserve District, July 28, 2004.
Mr. Eric L. Eishen
September 23, 2004
Page 5
The Livingston Study2, based on survey responses of 26 participants from banking, industry, academia and trade associations, forecasts economic growth and falling unemployment through mid-2005 in its June 2004 report. The results of this most recent release project real Gross Domestic Product ("GDP") will rise at an annual rate of 4.5 percent in the first half of 2004, 4.1 percent in the second half of 2004, and continue at an annual rate of 3.8 percent in the first half of 2005. The unemployment rate is expected to fall from 5.6 percent in June 2004 to 5.4 percent in December 2004 and then continue to decline, to 5.2 percent, by the middle of 2005. Interest rates on the three-month Treasuries are expected to rise from 1.3 percent in June 2004 to 1.8 percent at year-end 2004, then rise throughout 2005, ending the year at 3.4 percent. Long-term interest rates are also expected to rise over the next two years with a projection to climb from 4.8 percent in June 2004 to 5.1 percent by year-end. It is expected to increase further in 2005, finishing the year at 5.6 percent. The participants' views of long-term inflation and output growth have been fairly steady over the last year. The panelists think that real GDP will grow 3.5 percent annually over the next 10 years, the same as in the previous survey. Inflation will average 2.5 percent over the next 10 years, unchanged from the last five surveys dating back to December 2001. For 2004, after-tax corporate profits are expected to rise 15.5 percent, an increase from the December survey's prediction of 14.7 percent. On the other hand, forecasters see corporate profits rising 13.4 percent in 2005, a decrease from the 19.4 percent increase forecast in December. Stock prices (as measured by the S&P 500 index) are forecast to rise in 2004 and 2005. The projection for the S&P 500 at the end of 2005 is about 2.8 percent higher than the previous prediction.
VALUATION METHODOLOGY
The following is a brief summary of the analyses performed by DP&P in connection with its Opinion:
(a)Discounted Cash Flow Analysis.DP&P prepared a discounted dividend stream analysis of Sturgis, which estimated the future after tax cash flows that the Company might produce over the period from September 20, 2004 through December 31, 2008. These estimates were derived from discussions with and deemed reasonable by Sturgis' management team. The estimates assumed that Sturgis' pre-tax earnings would grow at a compound annual growth rate of approximately 27.7% throughout the projection period. This assumes that Sturgis continues to grow their business in their home markets with gradual expansion into new areas. DP&P has, with the guidance of management, used the key assumption that the yields on earning assets grow by 100 basis points in 2005 and 2006 and costs of deposits and borrowings grow by 75 basis points in 2005 and 2006. DP&P further assumed, with management's guidance, that the Company would make dividend payouts ranging from 32% to 57% of earnings through the projection peri od. The resulting cash flows were then discounted to a present value using a discount rate of 10.5%, based on Ibbotson Associates3 build up method with an industry discount applicable to commercial banks and thrifts.
____________________________
2www.phil.frb.org/econ/liv/index.html
3Ibbotson Associates, "Stocks, Bonds, Bills, and Inflation," Valuation Edition 2003 Yearbook
Mr. Eric L. Eishen
September 23, 2004
Page 6
Based on the most recent Ibbotson's data the riskless rate is 4.8%, market risk premium is 7.0% and industry specific premium was -1.3%, resulting in a discount rate of 10.5%, which DP&P regards as appropriate given the nature of the company, industry risk and general economic conditions. DP&P also estimated the residual value for Sturgis' common stock using a price to tangible book value multiple of 1.422 times, which is derived from the analysis of tangible book value multiples in comparable transactions(see paragraph d - Analysis of Comparable Acquisition Transactions). This multiple is applied to the Company's estimated tangible book value at December 31, 2008 of $36.1 million. The discounted dividend analysis implied a value of $13.88 per share for Sturgis' common stock on a marketable basis. This analysis does not purport to be indicative of actual values or actual future results and does not purport to reflect the prices at which any security may trade at the present or at any time in the future. DP&P included this analysis because it is a widely used valuation methodology, but noted that the results of such methodology are highly dependent upon the numerous assumptions that must be made, including earnings growth rates, dividend payout rates, terminal values and discount rates.
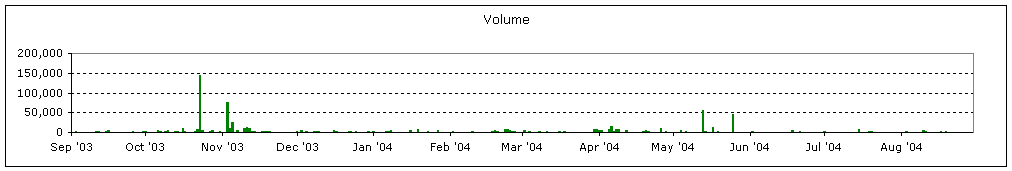
(b)Historical Trading Multiples. DP&P analyzed the quoted trades listed on the NASDAQ SmallCap Market for Sturgis Bancorp, Inc. (STBI) for varying historical periods. DP&P used a simple average of the closing stock price quoted for a period of 30 and 90 trading days and one calendar year. Only days in which the security actually traded were counted in the simple average. For the past 30 trading days, as of September 20, 2004, the historical average price was $13.95 with a period volume of 23,162 compiled over 19 separate trading days. For the past 90 trading days, as of September 20, 2004, the historical average price was $14.03 with a period volume of 194,090 compiled over 61 separate trading days. For the past calendar year, as of September 20, 2004, the historical average price was $13.67 with a period volume of 796,609 compiled over 193 separate trading days. It should be noted that volume may reflect "double counting" due to both the buy and sell side of a transaction being counted. I n addition, the prices and volumes displayed are per the trading information provided on the NASDAQ website and may not reflect all transactions that occurred over the aforementioned time period.
(c)Analysis of Selected Comparable Companies.DP&P compared selected operating results of Sturgis to a select group of publicly traded thrifts headquartered in Michigan. The comparable set had total assets of between $200 and $500 million. Some companies meeting these criteria may have been eliminated based on lack of data as generated by SNL Financial - the source for the comparable transactions data.
Thrifts typically trade at different multiples than commercial banks in the same market because of thrift lending restrictions on commercial loans and a historical specialization in mortgage lending, thus resulting in overall lower net interest margins as compared with commercial banks. Sturgis Bank and Trust operates under a Savings Bank Charter, which is classified as a thrift, and therefore faces similar restrictions to those of other area thrifts. DP&P noted the loan composition and net interest margin of Sturgis was very similar to that of the selected comparable thrift group.
Mr. Eric L. Eishen
September 23, 2004
Page 7
The selected group had approximately the following median values: $278.7 million in total assets, $33.9 million in total equity, a tier one risk-based capital ratio of 14.09%, LTM return on average assets of .74%, LTM return on average equity of 7.05% and a LTM efficiency ratio of 62.94%. This analysis provided valuation benchmarks including the median price multiples of 1.241 times book value, 1.337 times tangible book value and 16.9 times LTM earnings per share. Applying the median price to book value multiple to Sturgis' book value per share as of June 30, 2004 of $10.34 resulted in an implied per share value of $12.83 on a marketable basis. Using the same methodology, the implied values provided by application of the relevant multiples to Sturgis' June 30, 2004 tangible book value and LTM earnings per share of $8.47 and $.74 were found to be $11.32 per share and $12.51 per share, respectively.
No thrift used in the above analyses as a comparison is identical to Sturgis. Accordingly, an analysis of the results of the foregoing necessarily involves complex considerations and judgments concerning differences in financial and operating characteristics of the companies and other factors that could affect the public trading values of the Company and the thrifts to which it is being compared.
(d)Analysis of Comparable Acquisition Transactions. DP&P analyzed thrift acquisition transactions announced and/or completed since January 1, 2001. None of the comparable transactions identified represent "going-private" transactions. DP&P considers the comparable transactions approach a relevant analysis in the valuation of a business. The purpose of this analysis in this Opinion is not to compare any "going-private" transaction proposed by Sturgis to similar transactions undertaken by other financial institutions, but rather to determine an implied value for Sturgis based on the deal pricing metrics of recent acquisitions. DP&P considers the transactions identified as relevant because the characteristics of the target companies are similar to those of Sturgis and thus approximate what the fair value of Sturgis may be in an acquisition scenario. Each selling thrift identified had total assets less than $500 million and was headquartered in the Midwest. DP&P removed any transaction s in which the target was determined to be overcapitalized, defined as having an equity to assets ratio of greater than 12%. DP&P also removed any transactions where the target was sold for less than book value as this may be an indication that the institution was in troubled status prior to the transaction. This analysis provided an approximate median multiple of 1.422 times price to book value, 1.422 times price to tangible book value, 25.0 times LTM earnings per share, and a premium to core deposit metric of 7.1%. Applying the median multiple for price to book value of 1.422 times to Sturgis' June 30, 2004 book value per share of $10.34 results in an implied value per share of $14.70 on a control, marketable basis. Using the same methodology, the values implied by applying the relevant multiples to Sturgis' tangible book value per share at June 30, 2004 of $8.47 and earnings per share for the twelve months ended June 30, 2004 of $.74 were found to be $12.04 per share and $18.50 per share, respectively . Applying the median premium to core deposits of 7.1% to Sturgis' $176.1 million in core deposits as of June 30, 2004 resulted in a calculated value of $12.5 million. When added to Sturgis' book value of $28.2 million as of June 30, 2004 and divided by the 2,730,385 shares outstanding at the same date, the result is an implied value per share of $14.82. Core deposits are defined as all deposits less CDs over $100,000 and brokered deposits.
Mr. Eric L. Eishen
September 23, 2004
Page 8
DP&P notes that no selling thrift reviewed was identical to the Company and that, accordingly, any analysis of comparable transactions necessarily involves complex considerations and judgments concerning differences in financial and operating characteristics of the parties to the transactions being compared.
(e)Net Book Value. The net book value or net equity method implies that a company is worth its accumulated retained earnings, or deficit, plus its original capitalization. Net book value is primarily an amount arrived at over a company's existence which reflects accounting history expressed in unadjusted dollars and not the company's potential.
In most going concerns with a viable future it can be demonstrated that these companies would change hands for more than net book value. Book value is only of importance to the extent it provides an adequate base for the continuance of operations. In most instances where a company earns a significant return on its assets (both tangible and intangible), the net book value approach is not representative of the company's intrinsic business value. We have reviewed the book value of the Company's assets in limited detail and have found net book value to be $28.2 million or $10.34 per share as of June 30, 2004.
CONCLUSION
Our Opinion is directed to the Board of Directors of the Company and does not constitute a recommendation to the Board of Directors of the Company or the Company's existing holders of Common Stock. This Opinion has been prepared for the confidential use of the Board of Directors and senior management of the Company and may not be reproduced, summarized, described or referred to or given to any other person without DP&P's prior written consent. Our Opinion is limited solely to the value of the Company's common stock as of September 20, 2004 given the relevant market at the present time and company specific information available through June 30, 2004.
DP&P will typically utilize either a marketability or minority discount, or combination thereof, to value a minority share of a relatively illiquid company on a comparable basis. No such discounts have been applied to Sturgis' common stock in this valuation. If such a discount were applied, it would result in valuation that would be significantly lower than the value assigned below.
On the basis of, and subject to, the foregoing, we are of the opinion that, as of September 20, 2004, the fair market value of the Company's common stock is $13.75 per share.
Sincerely,
DONNELLY PENMAN & PARTNERS
CONFIDENTIAL
![]()
2. Valuation Summary
Donnelly Penman & Partners |
|
Project Acorn
Valuation Summary
| Value |
| Valuation Technique: | ||||||||||||||||||||
|
|
| Mgt. |
|
|
|
|
|
| ||||||||||||||
|
|
|
|
| 30 Day |
| 90 Day |
| 1 Year |
|
|
|
|
|
|
|
|
|
|
|
|
| Premium |
|
|
|
|
|
|
|
|
|
|
|
|
|
|
|
|
|
|
|
|
|
|
|
|
Value Indication |
|
|
|
|
|
|
|
|
|
|
|
|
|
|
|
|
|
|
|
|
|
|
|
Weight | 100.0% |
| 28.0% |
| 8.0% |
| 8.0% |
| 8.0% |
| 8.0% |
| 8.0% |
| 8.0% |
| 6.0% |
| 6.0% |
| 6.0% |
| 6.0% |
Premium to |
|
|
|
|
|
|
|
|
|
|
|
|
|
|
|
|
| ||||||
Closing as of |
|
|
|
|
|
|
|
|
|
|
|
|
| ||||||||||
|
|
|
|
|
|
|
|
|
|
|
|
|
|
|
|
|
|
|
|
|
|
|
|
Multiple of |
|
|
|
|
|
|
|
|
|
|
|
|
|
|
|
|
|
|
|
|
|
|
|
Percentage of |
|
|
|
|
|
|
|
|
|
|
|
|
|
|
|
|
|
|
|
|
|
|
|
Percentage of |
|
|
|
|
|
|
|
|
|
|
|
|
|
|
|
|
|
|
|
|
|
|
|
Donnelly Penman & Partners |
|
CONFIDENTIAL
![]()
3. Discounted Cash Flow Analysis
Donnelly Penman & Partners |
|
Project Acorn
Discounted Cash Flow Model
Valuation Date: September 20, 2004
($ in thousands - except per share data)
| Projected | ||||||||||
|
| ||||||||||
| For the years ended December 31 | ||||||||||
|
|
|
|
|
|
|
|
|
|
| 2008 |
|
|
|
|
|
|
|
|
|
|
|
|
Net Interest Income After Provision | $7,938,007 |
| $9,649,239 |
| $11,147,863 |
| $12,194,818 |
| $12,907,612 |
|
|
Non-interest Income | 4,031,912 |
| 3,839,280 |
| 4,186,542 |
| 4,424,904 |
| 4,680,677 |
|
|
| 11,969,919 |
| 13,488,519 |
| 15,334,406 |
| 16,619,722 |
| 17,588,289 |
|
|
|
|
|
|
|
|
|
|
|
|
|
|
Amortization of Intangibles | (260,400 | ) | (273,420 | ) | (287,091 | ) | (301,446 | ) | (316,518 | ) |
|
Depreciation | (569,325 | ) | (619,325 | ) | (769,325 | ) | (819,325 | ) | (869,325 | ) |
|
General & Administrative Expenses | (8,614,945 | ) | (8,873,394 | ) | (9,139,596 | ) | (9,413,783 | ) | (9,696,197 | ) |
|
Total Other Expenses | (9,444,670 | ) | (9,766,139 | ) | (10,196,012 | ) | (10,534,554 | ) | (10,882,040 | ) |
|
|
|
|
|
|
|
|
|
|
|
|
|
Income Before Taxes | 2,525,248 |
| 3,722,380 |
| 5,138,394 |
| 6,085,168 |
| 6,706,249 |
|
|
Taxes @ 31% | (782,827 | ) | (1,153,938 | ) | (1,592,902 | ) | (1,886,402 | ) | (2,078,937 | ) |
|
|
|
|
|
|
|
|
|
|
|
|
|
Net Income | 1,742,421 |
| 2,568,442 |
| 3,545,492 |
| 4,198,766 |
| 4,627,312 |
|
|
|
|
|
|
|
|
|
|
|
|
|
|
Dividend Payout | $1,000,000 |
| $1,100,000 |
| $1,210,000 |
| $1,331,000 |
| $1,464,100 |
|
|
(% Divident Payout) | 57% |
| 43% |
| 34% |
| 32% |
| 32% |
|
|
|
|
|
|
|
|
|
|
|
|
|
|
Present Value Factor @ 10.5%(1) | 0.9855 |
| 0.9237 |
| 0.8355 |
| 0.7558 |
| 0.6837 |
|
|
|
|
|
|
|
|
|
|
|
|
|
|
Mid-year Discount | (500,000 | ) |
|
|
|
|
|
|
|
|
|
|
|
|
|
|
|
|
|
|
|
|
|
Present Value of Free Cash Flows | $492,750 |
| $1,016,070 |
| $1,010,955 |
| $1,005,970 |
| $1,001,005 |
|
|
Total Present Value of Cash Flows (Years 1 to 5) | $4,526,750 |
|
|
|
|
Plus: Residual Cash Flow Value | $33,408,212 |
| 2008 Tangible Book Value (TBV) |
| 36,145,930 |
|
|
|
|
|
|
Indicated Equity Value | $37,934,962 |
| 2008 Takeout Price/TBV Multiple(2) |
| 142.2% |
|
|
|
|
|
|
Fully Diluted Shares Outstanding | 2,732,987 |
| Residual Cash Flow Value |
| $51,381,440 |
|
|
|
|
|
|
Equity Value Per Share (Marketable) | $13.88 |
| Present Value Factor |
| 0.6502 |
|
|
|
|
|
|
|
|
| Present Value of Residual Cash Flow |
| $33,408,212 |
Footnotes:
(1) | Based on the Ibbotson Associates weighted average cost of capital build up method (riskless rate + market risk premium) utilizing a 1.3% industry discount for commercial banks (data from Ibbotson Associates 2003 Yearbook - Valuation Edition) |
|
|
(2) | Based on an average of Midwest transactions of comparble size since January 1, 2001. |
Donnelly Penman & Partners |
|
CONFIDENTIAL
![]()
4. Recent Trading Analysis
Donnelly Penman & Partners |
|
Project Acorn |

30 Day Trading Average = $13.95
90 Day Trading Average = $14.03
1 Year Trading Average = $13.67
Average Daily Volume (90 Days) = 2,1571
1 May include double counting (volume from both the bid and ask side of a trade)
Donnelly Penman & Partners |
|
CONFIDENTIAL
![]()
5. Analysis of Comparable Companies
Donnelly Penman & Partners |
|
Comparable Company Analysis
Publicly traded thrifts in Michigan, Indiana and Ohio with total assets between $200 and $500 million
|
|
|
|
|
|
|
|
| ||
|
|
| Fiscal | Closing | Dividend | Closing Price (9/13/2004) to: | Total | Total | ||
|
|
| Period | Price | Yield | Book | Tang. | LTM | Assets | Net Loans |
|
|
|
|
|
|
|
|
|
|
|
Alpena Bancshares, Inc. (MHC) | MI | ALPN | 06/30/2004 | $17.00 | 1.18 | 131.58 | 159.47 | 32.08 | $256,177 | $186,335 |
|
|
|
|
|
|
|
|
|
|
|
Ameriana Bancorp | IN | ASBI | 06/30/2004 | $16.31 | 3.77 | 131.21 | 133.69 | 20.65 | $428,538 | $191,854 |
|
|
|
|
|
|
|
|
|
|
|
Blue River Bancshares, Inc. | IN | BRBI | 06/30/2004 | $5.79 | 0.00 | 122.93 | 158.20 | 48.25 | $204,480 | $149,616 |
|
|
|
|
|
|
|
|
|
|
|
Cheviot Financial Corp. (MHC) | OH | CHEV | 06/30/2004 | $11.49 | 1.67 | 148.83 | 148.83 | n.m. | $278,769 | $200,020 |
|
|
|
|
|
|
|
|
|
|
|
FFW Corporation | IN | FFWC | 06/30/2004 | $21.84 | 3.16 | 124.09 | 129.69 | 11.62 | $239,910 | $136,183 |
|
|
|
|
|
|
|
|
|
|
|
First Capital, Inc. | IN | FCAP | 06/30/2004 | $21.00 | 2.79 | 134.87 | 156.13 | 16.67 | $417,840 | $316,577 |
|
|
|
|
|
|
|
|
|
|
|
First Federal Bancorp, Inc. | OH | FFBZ | 06/30/2004 | $13.13 | 1.83 | 193.09 | 193.09 | 23.04 | $258,197 | $225,857 |
|
|
|
|
|
|
|
|
|
|
|
First Franklin Corporation | OH | FFHS | 06/30/2004 | $20.66 | 1.54 | 144.27 | 144.27 | 29.94 | $272,770 | $201,638 |
|
|
|
|
|
|
|
|
|
|
|
HFS Bank, FSB | IN | HFSK | 06/30/2004 | $12.50 | 3.36 | 118.71 | 118.71 | 14.37 | $234,711 | $179,956 |
|
|
|
|
|
|
|
|
|
|
|
LSB Financial Corp. | IN | LSBI | 06/30/2004 | $24.50 | 2.38 | 113.74 | 113.74 | 10.79 | $342,713 | $304,573 |
|
|
|
|
|
|
|
|
|
|
|
MFB Corp. | IN | MFBC | 06/30/2004 | $28.10 | 1.70 | 104.58 | 104.58 | 13.51 | $427,933 | $341,557 |
|
|
|
|
|
|
|
|
|
|
|
Monarch Community Bancorp, Inc. | MI | MCBF | 06/30/2004 | $14.00 | 1.42 | 90.26 | 120.79 | 66.67 | $291,925 | $221,430 |
|
|
|
|
|
|
|
|
|
|
|
Northeast Indiana Bancorp, Inc. | IN | NEIB | 06/30/2004 | $21.28 | 2.63 | 117.76 | 117.76 | 18.34 | $225,099 | $164,358 |
|
|
|
|
|
|
|
|
|
|
|
Peoples Bancorp | IN | PFDC | 06/30/2004 | $21.50 | 3.28 | 114.24 | 119.58 | 14.83 | $493,496 | $362,246 |
|
|
|
|
|
|
|
|
|
|
|
Perpetual Federal Savings Bank | OH | PFOH | 06/30/2004 | $29.25 | 3.12 | 138.89 | 138.89 | 15.16 | $323,725 | $301,386 |
|
|
|
|
|
|
|
|
|
|
|
River Valley Bancorp | IN | RIVR | 06/30/2004 | $23.25 | 3.15 | 170.70 | 170.96 | 14.72 | $258,460 | $209,545 |
|
|
|
|
|
|
|
|
|
|
|
The Northern Savings & Loan Company | OH | NLVS | 06/30/2004 | $19.90 | 3.02 | 110.01 | 110.01 | 15.67 | $313,944 | $227,277 |
|
|
|
|
|
|
|
|
|
|
|
Union Community Bancorp | IN | UCBC | 06/30/2004 | $17.75 | 3.28 | 104.04 | 113.20 | 17.07 | $261,540 | $222,062 |
|
|
|
|
|
|
|
|
|
|
|
Wayne Savings Bancshares, Inc. | OH | WAYN | 06/30/2004 | $16.79 | 2.95 | 150.58 | 156.04 | 25.83 | $386,444 | $216,141 |
|
|
|
|
|
|
|
|
|
|
|
High |
|
|
| 29.25 | 3.77 | 193.09 | 193.09 | 66.67 | 493,496 | 362,246 |
|
|
|
|
|
|
|
|
|
|
|
Low |
|
|
| 5.79 | 0.00 | 90.26 | 104.58 | 10.79 | 204,480 | 136,183 |
|
|
|
|
|
|
|
|
|
|
|
Mean |
|
|
| 18.74 | 2.43 | 129.71 | 137.24 | 22.73 | 311,404 | 229,401 |
|
|
|
|
|
|
|
|
|
|
|
Median |
|
|
| 19.90 | 2.79 | 124.09 | 133.69 | 16.87 | 278,769 | 216,141 |
|
|
|
|
|
|
|
|
|
|
|
|
|
|
|
|
|
|
|
|
|
|
Sturgis Bancorp, Inc. | MI | STBI | 06/30/2004 | 14.05 | 2.65 | 131.59 | 161.45 | 24.30 | 314,126 | 230,690 |
|
|
|
|
|
|
|
|
|
|
|
Sturgis Bancorp, Inc. (for the LTM ended June 30, 2004) |
|
| $10.34 | $8.47 | $0.74 |
|
| |||
|
|
|
|
|
|
|
|
|
|
|
Median Multiple |
|
|
|
|
| 124.1% | 133.7% | 16.9x |
|
|
|
|
|
|
|
|
|
|
|
|
|
Equity Value per Share |
|
|
|
|
| $12.83 | $11.32 | $12.51 |
|
|
|
|
| Tier 1 |
|
|
|
|
|
| 1-4 |
|
|
|
|
|
|
|
|
|
|
|
Alpena Bancshares, Inc. (MHC) | $169,177 | $21,413 | 9.98 | 0.38 | 4.04 | 3.19 | 90.16 | 40.94 | 13.42 | 65.06 |
|
|
|
|
|
|
|
|
|
|
|
Ameriana Bancorp | $347,273 | $39,145 | 14.61 | 0.58 | 6.38 | 3.12 | 81.63 | 28.23 | 3.17 | 48.86 |
|
|
|
|
|
|
|
|
|
|
|
Blue River Bancshares, Inc. | $159,062 | $16,036 | NA | 0.21 | 2.33 | 3.25 | 91.60 | 12.34 | NA | NA |
|
|
|
|
|
|
|
|
|
|
|
Cheviot Financial Corp. (MHC) | $183,743 | $76,593 | 45.51 | 0.42 | 2.21 | 3.14 | 58.06 | 2.95 | 0.00 | 89.10 |
|
|
|
|
|
|
|
|
|
|
|
FFW Corporation | $159,252 | $22,624 | 12.35 | 1.01 | 10.15 | 2.90 | 60.92 | 24.15 | 5.99 | 62.75 |
|
|
|
|
|
|
|
|
|
|
|
First Capital, Inc. | $307,493 | $43,852 | NA | 0.86 | 8.00 | 3.40 | 60.92 | 15.77 | 7.41 | 65.10 |
|
|
|
|
|
|
|
|
|
|
|
First Federal Bancorp, Inc. | $178,775 | $22,913 | 9.36 | 0.75 | 8.22 | 3.69 | 67.67 | 18.45 | 5.08 | 52.14 |
|
|
|
|
|
|
|
|
|
|
|
First Franklin Corporation | $222,253 | $23,568 | 13.11 | 0.41 | 4.74 | 2.36 | 77.07 | 16.88 | 6.01 | 67.09 |
|
|
|
|
|
|
|
|
|
|
|
HFS Bank, FSB | $140,518 | $19,653 | 14.09 | 0.71 | 8.38 | 2.51 | 62.94 | 22.21 | 2.60 | 71.71 |
|
|
|
|
|
|
|
|
|
|
|
LSB Financial Corp. | $242,208 | $28,904 | 10.83 | 0.93 | 10.90 | 3.46 | 58.37 | 20.53 | 4.98 | 51.27 |
|
|
|
|
|
|
|
|
|
|
|
MFB Corp. | $289,803 | $35,716 | 10.42 | 0.63 | 7.75 | 2.78 | 75.32 | 36.16 | 17.67 | 48.41 |
|
|
|
|
|
|
|
|
|
|
|
Monarch Community Bancorp, Inc. | $178,173 | $42,018 | 14.09 | 0.23 | 1.34 | 3.02 | 83.49 | 30.53 | 2.30 | 74.10 |
|
|
|
|
|
|
|
|
|
|
|
Northeast Indiana Bancorp, Inc. | $130,071 | $26,523 | 17.50 | 0.74 | 6.15 | 2.88 | 70.29 | 17.30 | 7.38 | 60.74 |
|
|
|
|
|
|
|
|
|
|
|
Peoples Bancorp | $372,333 | $63,434 | NA | 0.98 | 7.64 | 3.45 | 59.45 | 12.07 | NA | NA |
|
|
|
|
|
|
|
|
|
|
|
Perpetual Federal Savings Bank | $234,651 | $51,966 | 19.30 | 1.54 | 9.40 | 3.30 | 29.20 | 0.40 | 3.65 | 32.09 |
|
|
|
|
|
|
|
|
|
|
|
River Valley Bancorp | $171,457 | $22,096 | NA | 1.02 | 11.36 | 3.21 | 56.83 | 27.63 | 13.99 | 45.56 |
|
|
|
|
|
|
|
|
|
|
|
The Northern Savings & Loan Company | $268,905 | $42,332 | 27.02 | 0.93 | 7.05 | 3.36 | 58.33 | 5.29 | 0.28 | 85.09 |
|
|
|
|
|
|
|
|
|
|
|
Union Community Bancorp | $192,054 | $33,906 | NA | 0.75 | 5.61 | 3.22 | 61.60 | 7.71 | 5.01 | 67.76 |
|
|
|
|
|
|
|
|
|
|
|
Wayne Savings Bancshares, Inc. | $316,419 | $42,036 | 19.28 | 0.66 | 5.59 | 3.05 | 71.82 | 14.26 | 9.18 | 82.91 |
|
|
|
|
|
|
|
|
|
|
|
High | 372,333 | 76,593 | 45.51 | 1.54 | 11.36 | 3.69 | 91.60 | 40.94 | 17.67 | 89.10 |
|
|
|
|
|
|
|
|
|
|
|
Low | 130,071 | 16,036 | 9.36 | 0.21 | 1.34 | 2.36 | 29.20 | 0.40 | 0.00 | 32.09 |
|
|
|
|
|
|
|
|
|
|
|
Mean | 224,401 | 35,512 | 16.96 | 0.72 | 6.70 | 3.12 | 67.14 | 18.62 | 6.36 | 62.93 |
|
|
|
|
|
|
|
|
|
|
|
Median | 192,054 | 33,906 | 14.09 | 0.74 | 7.05 | 3.19 | 62.94 | 17.30 | 5.08 | 65.06 |
|
|
|
|
|
|
|
|
|
|
|
|
|
|
|
|
|
|
|
|
|
|
Sturgis Bancorp, Inc. | 205,008 | 28,240 | 10.00 | 0.71 | 7.17 | 3.08 | 75.45 | 34.75 | 4.83 | 52.92 |
Source: SNL Financial
Donnelly Penman & Partners |
|
CONFIDENTIAL
![]()
6. Analysis of Comparable Transactions
Donnelly Penman & Partners |
|
Comparable Acquisition Analysis
Thrift acquisitions in the Midwest announced since 1/1/01 - Target Assets less than $500 million, Target Equity/Assets < 12.0%
|
|
|
|
|
|
| Target |
|
|
|
|
|
|
|
|
Park National Corporation | First Federal Bancorp, Inc. | OH | 08/02/2004 | NA | 45.90 | 258,197 | 8.87 |
|
|
|
|
|
|
|
|
Northbrook Investments, LLC | North Bancshares, Inc. | IL | 04/08/2004 | NA | 23.90 | 133,746 | 10.09 |
|
|
|
|
|
|
|
|
WesBanco, Inc. | Western Ohio Financial Corporation | OH | 04/01/2004 | 08/31/2004 | 67.50 | 399,540 | 11.10 |
|
|
|
|
|
|
|
|
Landmark Bancorp, Inc. | First Kansas Financial Corporation | KS | 11/13/2003 | 04/01/2004 | 18.30 | 151,583 | 11.24 |
|
|
|
|
|
|
|
|
Garfield Acquisition Corp. | Lenox Bancorp, Inc. | OH | 09/17/2003 | 12/24/2003 | 7.20 | 55,826 | 9.63 |
|
|
|
|
|
|
|
|
Blue River Bancshares, Inc. | Unified Banking Company | KY | 06/09/2003 | 11/17/2003 | 8.20 | 80,264 | 7.28 |
|
|
|
|
|
|
|
|
NS&L Acquisition Corp. | NS&L Bancorp, Inc. | MO | 05/23/2003 | 10/09/2003 | 10.60 | 68,382 | 10.25 |
|
|
|
|
|
|
|
|
Salin Bancshares, Inc. | Blue River Federal Savings Bank | IN | 07/03/2002 | 11/22/2002 | 3.50 | 25,247 | 10.95 |
|
|
|
|
|
|
|
|
Garfield Acquisition Corp. | Findlay Savings Bank | OH | 05/03/2002 | 09/19/2002 | 1.20 | 10,334 | 7.43 |
|
|
|
|
|
|
|
|
National Bancshares Corporation | Peoples Financial Corporation | OH | 10/02/2001 | 04/03/2002 | 14.90 | 106,142 | 9.87 |
|
|
|
|
|
|
|
|
United Community Financial Corp. | Potters Financial Corporation | OH | 09/06/2001 | 04/01/2002 | 23.40 | 151,466 | 8.55 |
|
|
|
|
|
|
|
|
Peoples Community Bancorp, Inc. | Kenwood Bancorp, Incorporated | OH | 08/23/2001 | 04/26/2002 | 7.50 | 58,250 | 7.57 |
|
|
|
|
|
|
|
|
Union Community Bancorp | Montgomery Financial Corporation | IN | 07/24/2001 | 01/02/2002 | 18.50 | 142,925 | 11.85 |
|
|
|
|
|
|
|
|
Chemical Financial Corporation | Bank West Financial Corporation | MI | 05/01/2001 | 09/14/2001 | 29.80 | 284,272 | 8.18 |
|
|
|
|
|
|
|
|
Robertson Holding Company, L.P. | Cumberland Mountain Bancshares, Inc. | KY | 02/09/2001 | 11/01/2001 | 9.50 | 125,998 | 6.79 |
|
|
|
|
|
|
|
|
High |
|
|
|
| 67.50 | 399,540 | 11.85 |
|
|
|
|
|
|
|
|
Low |
|
|
|
| 1.20 | 10,334 | 6.79 |
|
|
|
|
|
|
|
|
Mean |
|
|
|
| 19.33 | 136,811 | 9.31 |
|
|
|
|
|
|
|
|
Median |
|
|
|
| 14.90 | 125,998 | 9.63 |
|
|
|
|
|
|
|
|
|
|
|
|
|
|
|
|
Sturgis Bancorp, Inc. (for the LTM ended June 30, 2004) |
|
|
|
| 230,690 | 8.99 | |
|
|
|
|
|
|
|
|
Median Multiple |
|
|
|
|
|
|
|
|
|
|
|
|
|
|
|
Equity Value per Share |
|
|
|
|
|
|
|
|
|
| Premium | ||||
|
| Book | TBV | LTM EPS | Assets | Deposits | Deposits |
|
|
|
|
|
|
|
|
Park National Corporation | First Federal Bancorp, Inc. | 194.85 | 194.85 | 24.54 | 17.79 | 25.70 | 17.33 |
|
|
|
|
|
|
|
|
Northbrook Investments, LLC | North Bancshares, Inc. | 192.96 | 192.96 | NM | 19.74 | 29.03 | 20.43 |
|
|
|
|
|
|
|
|
WesBanco, Inc. | Western Ohio Financial Corporation | 142.24 | 142.24 | 24.96 | 16.89 | 27.14 | 14.14 |
|
|
|
|
|
|
|
|
Landmark Bancorp, Inc. | First Kansas Financial Corporation | 101.28 | 101.28 | 31.15 | 12.10 | 22.18 | 1.66 |
|
|
|
|
|
|
|
|
Garfield Acquisition Corp. | Lenox Bancorp, Inc. | 133.93 | 133.93 | NM | 12.90 | 26.05 | 7.81 |
|
|
|
|
|
|
|
|
Blue River Bancshares, Inc. | Unified Banking Company | 140.31 | 140.31 | NM | 10.22 | 11.87 | 7.06 |
|
|
|
|
|
|
|
|
NS&L Acquisition Corp. | NS&L Bancorp, Inc. | 151.43 | 151.43 | 31.20 | 15.51 | 18.27 | 7.64 |
|
|
|
|
|
|
|
|
Salin Bancshares, Inc. | Blue River Federal Savings Bank | 130.41 | 130.41 | 18.68 | 14.28 | 20.84 | 6.56 |
|
|
|
|
|
|
|
|
Garfield Acquisition Corp. | Findlay Savings Bank | 150.00 | 150.00 | NM | 11.15 | 12.16 | 5.16 |
|
|
|
|
|
|
|
|
National Bancshares Corporation | Peoples Financial Corporation | 144.29 | 144.29 | 27.22 | 14.26 | 20.14 | 6.96 |
|
|
|
|
|
|
|
|
United Community Financial Corp. | Potters Financial Corporation | 169.62 | 169.62 | 12.29 | 15.45 | 19.58 | 10.14 |
|
|
|
|
|
|
|
|
Peoples Community Bancorp, Inc. | Kenwood Bancorp, Incorporated | 170.18 | 170.18 | NM | 12.88 | 15.73 | 7.14 |
|
|
|
|
|
|
|
|
Union Community Bancorp | Montgomery Financial Corporation | 107.71 | 107.71 | 34.30 | 12.94 | 17.36 | 2.09 |
|
|
|
|
|
|
|
|
Chemical Financial Corporation | Bank West Financial Corporation | 124.73 | 124.73 | 19.49 | 10.48 | 16.89 | 6.17 |
|
|
|
|
|
|
|
|
Robertson Holding Company, L.P. | Cumberland Mountain Bancshares, Inc. | 111.32 | 111.32 | NM | 7.56 | 9.08 | 1.12 |
|
|
|
|
|
|
|
|
High |
| 194.85 | 194.85 | 34.30 | 19.74 | 29.03 | 20.43 |
|
|
|
|
|
|
|
|
Low |
| 101.28 | 101.28 | 12.29 | 7.56 | 9.08 | 1.12 |
|
|
|
|
|
|
|
|
Mean |
| 144.35 | 144.35 | 24.87 | 13.61 | 19.47 | 8.09 |
|
|
|
|
|
|
|
|
Median |
| 142.24 | 142.24 | 24.96 | 12.94 | 19.58 | 7.06 |
|
|
|
|
|
|
|
|
|
|
|
|
|
|
|
|
Sturgis Bancorp, Inc. (for the LTM ended June 30, 2004) | $10.34 | $8.47 | $0.74 | $112.52 | $73.43 | $63.08 | |
|
|
|
|
|
|
|
|
Median Multiple |
| 142.2% | 142.2% | 25.0x | 12.9% | 19.6% | 7.1% |
|
|
|
|
|
|
|
|
Equity Value per Share |
| $14.70 | $12.04 | $18.50 | $14.51 | $14.39 | $14.82 |
Source: SNL Financial LP
Donnelly Penman & Partners |
|