Exhibit 3
DELIVERING ENERGY AROUND THE GLOBE
TABLE OF CONTENTS
Chairman’s Letter | 1 | |
Board of Directors and Officers | 4 | |
Tsakos Energy Navigation Board Committees | 5 | |
Financial Highlights | 7 | |
TEN Growth Charts | 8 | |
Management Review and Analysis | 11 | |
Newbuilding Program in the Year 2003 | 31 | |
General Market Overview - Supply and Demand | 36 | |
World Tanker Fleet | 39 | |
Vessel Prices | 40 | |
Vessel Earnings | 44 | |
Consolidated Financial Statements | 47 | |
TEN Fleet | 80 | |
Internet: www.tenn.gr
CHAIRMAN’S LETTER TO STOCKHOLDERS
April 27, 2004
Dear Fellow Shareowner:
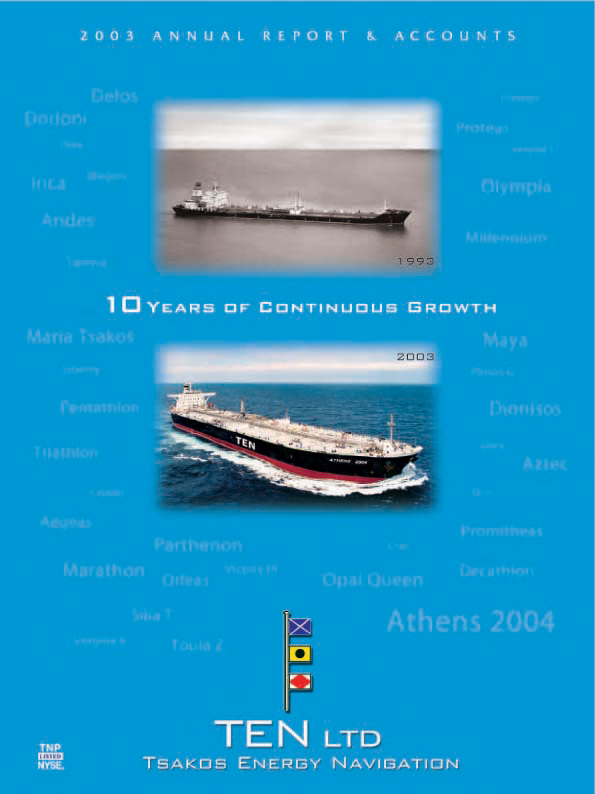
Every year is important, particularly in the life of a young dynamic company. For Tsakos Energy Navigation (TEN), 2003, was very special, as it marked 10 years of continuous growth and sustained profitability.
HIGHLIGHTS OF 2003
| • | Record profits of $59.1 million |
| • | Record earnings per share of $3.45 (basic) |
| • | Record dividends of $1.00 per share |
| • | Six new buildings added to the fleet |
| • | Six new building orders contracted including four ice classed ships |
MILESTONES SINCE INCEPTION
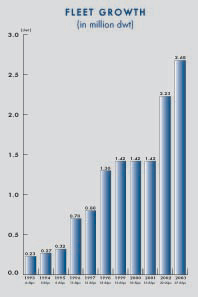
| • | Fleet in operation has grown from four vessels in 1993 to twenty-eight ships currently. |
| • | New building program commenced in 1997 includes sixteen ships currently generating revenues and thirteen vessels to be received in 2004, 2005, 2006, and 2007. |
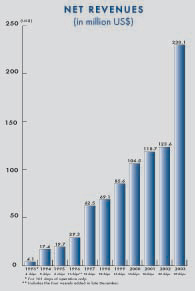
| • | Net revenues have grown to $230.1 million last year from a base of $15.8 million in 1994. |
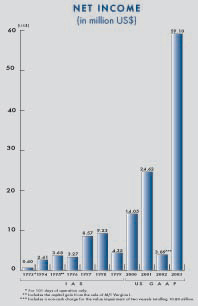
| • | Net income was $2.6 million in 1994 and last year reached $59.1 million. |
| • | Earnings per share grew from $0.67 in 1994 to $3.45 in 2003. |
TEN takes great pride in its ability to produce these outstanding results while at the same time building a company whose human and physical assets are prepared for the challenges and opportunities of the future. Dynamic organic growth has resulted in a young modern fleet comprised of a diversified group of vessels capable of meeting the breadth of our clients’ requirements.
TEN’s FLEET AND TANKER INDUSTRY CHALLENGES
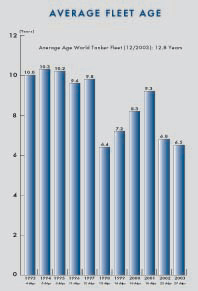
TEN has one of the youngest fleets in the world. Average tonnage age at the end of 2003 was 6.5 years as compared with the world fleet’s age of over 12 years. This key factor has taken on increasing importance.
The impact of shipping tragedies in 1999 and subsequent years has redefined acceptable tanker tonnage. The combination of much tighter regulatory restrictions on vessel ages and survey requirements and charterer vetting standards have resulted in much narrower selectivity among ships and their operators. A strong preference for younger tonnage is increasingly evident in comparative charter rates.
The new regulatory requirements and the overall impact on ownership economics is expected to accelerate vessel retirements. At the same time there is limited availability of new building berths. Thus, the outlook is one of constrained growth in the world’s tanker fleet during early future years.
The tanker industry is highly fragmented. However, the process of consolidation has begun and appears to be accelerating. Among the factors underlying this trend are: tighter vetting standards requiring scale to help moderate rising costs of doing business with first class charterers; limited availability of debt financing for older tonnage; and the significant capital needs to build and maintain a young modern fleet. TEN believes these developments will inure to the benefit of the company, its industry, and the customers it serves.
TEN LIMITED | 1 |
ECONOMIC BACKDROP
The world economy has delivered an erratic but positive performance in the past several months. The locomotion of an expanding U.S. economy has spurred dramatic growth in India, China, and the broader Pacific Rim. Most recently Japan has taken on a much improved tone arising from growing exports to China, Korea, and the U.S. Even domestic consumption appears at long last to be expanding. Unfortunately Europe has failed to keep pace barely avoiding a new recession while Latin America for the most part is burdened with financial and/or political impediments.
Most observers foresee a world economy in an overall growth mode in the foreseeable future. However, the shadow of geopolitical clouds, the pressures of sharply higher commodity prices including oil, and the twin deficits (trade and fiscal) in the U.S. suggest the path will be neither smooth nor riskless.
Growth in energy consumption is heavily dependent on affordability. Demand in the fastest growing economies is the most elastic. The substandard increase in oil demand at the turn of the century mirrored sluggish industrial activity, timid consumer absorption, warmer than normal winters in the northern hemisphere, and aggressive inventory policies. Happily each of these factors reversed last year and demand grew by a full 2%. Recent projections by the International Energy Agency suggest similar demand growth is likely this year although they express caution that a sustained high level of crude oil prices could moderate economic growth prospects with an impact on energy consumption. The principal growth drivers are once again U.S. consumption and the expansion spurts in India, China, and the greater Pacific Rim.
TANKER INDUSTRY
Last year the tanker industry enjoyed one of the strongest chartering markets in modern history. Early months of 2004 have seen a continuation of that environment. The severe temperatures of the winter months in virtually all areas of the northern hemisphere coupled with industrial expansion in India, China, and the Pacific Rim have driven oil demand and consumption to record levels. Much of the growth in consumption developed in markets more distant from the sources of supply with the resulting impact on ton-miles and shipping capacity requirements. This trend is projected to continue even as incremental production derives from Russia and Libya, which are somewhat nearer to consumers. The outlook for tanker capacity in 2004 remains unclear. High charter rates have discouraged scrappage despite the attraction of the sharp increase in steel scrap prices. However, the parallel impact on survey costs and the approaching regulatory deadlines will influence the timing of vessel retirements. The general expectation is that a seasonal dip in charter rates amplified by the likely cutback in OPEC production and a possible adjustment in the U.S.’ strategic reserves could encourage scrappage. On balance, the growth in the supply of tanker capacity could modestly exceed the expanded demand for transport. However, this small gap is likely to be absorbed by longer waiting times for older, less desirable tonnage.
The industry’s earning potential for 2004 is favorable. The solid chartering markets of the first three months are likely to hold up better than usual during the seasonal softness of spring and summer months. Key factors include slim inventories and growing import needs of China, India, and most markets on the Pacific Rim as well as the U.S. However, the revenue side will be offset by higher insurance rates, somewhat higher finance costs, rising maintenance expenses and general operating needs pushed by the soft dollar. On balance, the industry is likely to enjoy a second year of strong profits extending the recovery from the depressed results of 2002.
TEN’s PROSPECTS
TEN’s longer term prospects are very bright. The growth since inception has built a solid platform for future development. In addition to the traditional transport of crude oil and products the company is building the capability to be a key participant in the future growth of ice-bound routes. TEN is also exploring the high growth market of liquefied natural gas (LNG) shipments.
2 | ANNUAL REPORT AND ACCOUNTS 2003 |
The fleet profile was highlighted earlier and is detailed in the MANAGEMENT REVIEW AND ANALYSIS. Key factors include:
| 1) | a young, modern, and growing fleet; |
| 2) | a fleet comprised largely of vessels designed by and built for TEN and its customers identified needs; |
| 3) | a commitment to fleet renewal through sales or retirement of older single-hull vessels; |
| 4) | and embarkation to future growth markets via ice class tankers and LNG carriers. |
Tanker industry tonnage is expected to experience relatively modest growth in early future years as a result of limited shipyard capacity and accelerated scrappage in response to regulatory demands. The latter factor will also speed up the process of consolidation of the tanker industry.
TEN is well positioned to compete in this most demanding environment. TEN’s young and growing fleet is strongly complemented by the human strengths of its commercial and technical managers within the Tsakos group which provide over three decades of experience and strong industry ties. The importance of this heritage has never been more important. Fleet management is supported by a business model which has produced consistent and growing profits through three shipping cycles in the last ten years. The essence of this model is balance. The chartering policy has a bias for term employment but breathing room to participate in rising freight markets. Risk management also tempers financing cost volatility through interest rate hedging positions. The relative stability in profits has built the foundation for the on-going expansion of the fleet, secular earnings growth and higher shareholder value.
ANNUAL GENERAL MEETING
Our shareowners’ annual General Meeting (AGM) will be held in Athens on the 7th of June 2004 at 13:00. The key proposal will be the election of directors including two candidates identified by the nomination committee as valuable additions to your Board of Directors. We will also address directors’ fees as well as our long-term incentive compensation programs. A review of 2003 financial results and the appointment of auditors will be on the agenda. The AGM is where sound corporate governance begins. Your participation by proxy or preferably in person is essential.
As an incentive for your attendance, the AGM is scheduled to coincide with the bi-annual Posidonia Conference which is the premier shipping industry event. It is a great opportunity to meet and visit with leaders in the shipping community.
On behalf of the entire Board of Directors I wish to commend our management for a superb performance. The opportunities of 2003 were fully realized. At the same time the platform for increasing shareholder value is well positioned. The support of our shareowners is greatly appreciated.
Yours sincerely,

D. John Stavropoulos
Chairman of the Board
TEN LIMITED | 3 |
BOARD OF DIRECTORS AND OFFICERS
D. JOHN STAVROPOULOS
CHAIRMAN
Executive Vice President and Chief Credit Officer retired in 1990, having served 33 years with The First National Bank of Chicago and its parent, First Chicago Corporation. He chaired the bank’s Credit Strategy Committee, the Country Risk Management Council, and the Economic Council. Professional societies included the Robert Morris Associates (national director), Association of Reserve City Bankers, Financial Analysts Federation. Mr. Stavropoulos was appointed by President George Bush Senior to serve for life on the Presidential Credit Standards Advisory Committee, he was a director of CIPSCO from 1979 to 1992, an instructor of Economics and Finance at Northwestern University from 1962 to 1968 serves as a life member on the Alumni Advisory Board of the Kellogg School of Management and is a Chartered Financial Analyst. He was elected to the TEN Board and Chairmanship on June 1, 1994. Mr. Stavropoulos is member of the Audit Committee.
MICHAEL G. JOLLIFFE
DEPUTY CHAIRMAN
Deputy Chairman since July 2001 and Director of the Company since September 1993. Mr. Jolliffe is also Vice-Chairman of both Klonatex S.A. and Naoussa Spinning Mills SA., two companies quoted on the Athens Stock Exchange that together form the third largest integrated textiles company in Europe. Mr. Jolliffe is also Chairman of Wigham-Richardson Shipbrokers Ltd, one of the oldest established shipbroking companies in the City of London, and of Shipping Spares Repairs and Supplies Ltd, an Agency Company based in Piraeus, Greece. Additionally Mr. Jolliffe is the President of Eurotrans Hermes Hellas S.A., the Greek agent for various manufacturers of trams, buses and trains. Mr. Jolliffe is a member of the Audit Committee and Chairman of the Capital Markets Committee.
TORBEN JANHOLT
DIRECTOR
Torben Janholt has been a member of our board since October 2002. He is President and CEO of J. Lauritzen A/S, a major Danish shipowning and trading company, since 1998. Between 1995 and 1998 he was Director OTS of the UN World Food Programme, based in Rome. In 1992 he took a position as director and executive consultant with the Armada A/S shipping group. Prior to 1992, Mr. Janholt held various senior positions within the Lauritzen Group; including Managing Director of LauritzenNaval Madrid from 1990 - 1992, Senior Vice President J. Lauritzen USA Inc. New York from 1982 - 1989. Mr. Janholt is Vice Chairman of the Danish Shipowners Association.
WILLIAM O’ NEIL
DIRECTOR
William A. O’Neil is Secretary-General Emeritus of the International Maritime Organization, the United Nations agency concerned with maritime safety and the prevention of pollution from ships. Mr. O’Neil was elected Secretary-General of the IMO for a first term of office beginning in 1990, a second term beginning in 1994, a third term beginning in 1998 and a further two-year term beginning in 2002. He graduated in civil engineering from the University of Toronto in his native Canada in 1949 and served in various positions with the Federal Department of Transport and was particularly closely associated with the St. Lawrence Seaway Authority. He was Commissioner of the Canadian Coast Guard from 1975-80 and then became President and Chief Executive Officer of the St. Lawrence Seaway Authority, a position he held until joining IMO. However, his links with the Organization go back to 1972 when he represented Canada at the IMO Council. He became Chairman of the IMO Council in 1980 and was re-elected four times. In 1991 he became Chancellor of the World Maritime University, Malmö, Sweden and Chairman of the Governing Board of the International Maritime Law Institute in Malta.
PETER NICHOLSON
DIRECTOR
Peter Nicholson trained as a naval architect and spent the main part of his working life with Camper & Nicholsons Limited, the world-famous yacht builders. He became Managing Director of the firm and, later, Chairman. When Camper & Nicholsons merged with Crest Securities to form Crest Nicholson Plc. in 1972, he became an executive director of Crest Nicholson, a role he held until 1988, when he became a non executive in order to pursue a wider range of business interests. Since then he has been a non executive director of Lloyds TSB Group Plc (from 1990-2000), chairman of Carisbrooke Shipping Plc (from 1990-1999). He was a director of various companies in the Marsh Group of insurance brokers and remained a consultant to the company until recently. He has sat on the board of a wide variety of small companies and has been very active in the administration of the UK marine industry and is a trustee of the British Marine Federation. He is a Younger Brother of Trinity House, chairman of the Royal National Lifeboat Institution and a trustee of the International Lifeboat Federation. He joined the board of TEN as a founder director in 1993 and is Chairman of the Audit Committee.
FRANCIS T. NUSSPICKEL
DIRECTOR
Retired partner of Arthur Andersen LLP with 35 years of public accounting experience. Served as a member of the Firm’s Transportation Industry Group and worldwide Industry Head for the Ocean Shipping segment. His responsibilities included projects for mergers and acquisitions, fraud investigations, arbitrations and debt and equity offerings. President of the New York State Society of CPA’s in 1996 & 1997, member of the AICPA Council 1992 to 1998, and present Chairman of Professional Ethics Committee of the New York State Society of CPA’s.
ANGELOS PLAKOPITAS
DIRECTOR
Angelos Plakopitas is the Managing Director of Global Finance SA, since 1991, a financial services company based in Athens, with offices throughout the Balkans, and management of several venture capital funds. Between 1979 and 1990, Mr. Plakopitas was General Manager of Shelman Swiss-Hellenique Wood Products Manufacturers SA, a large industrial and trading company in Greece. From 1970 to 1979 he was Vice President with Citibank N.A. based in Athens and Piraeus, during which time he spent six years as Head of the Shipping Department. Mr. Plakopitas started his career with the Hellenic Industrial Development Bank in 1965.
ANTONIO TARAGONI
DIRECTOR
Has been involved in the shipping industry since 1955, initially with Ballestrero, Tuena and Canepa. He spent a year with Galbraith & Pembroke in London. He founded in 1961 and is President of Nolarma Noleggi & Armamento Srl, presently one of the largest Italian ship agents. This company has a long experience of ship management. Mr. Taragoni is also the Founder and President of Nolarma Tankers Srl, a large Italian tanker shipbroking firm. He has been a Council Member of Intertanko from 1973 to 1995 and a Council Member of Porto Petroli SpA of Genoa from 1975 to 1996. Mr. Taragoni has been a director of the Company since inception.
4 | ANNUAL REPORT AND ACCOUNTS 2003 |
BOARD OF DIRECTORS AND OFFICERS
NIKOLAS P. TSAKOS
PRESIDENT
President, CEO, and director of TEN since inception. Shareholder of Tsakos Energy Management. Mr. Tsakos has been involved in ship management since 1981 and has seafaring experience of 36 months. He is President of the Hellenic Marine Environment Protection Agency (HELMEPA). Mr. Tsakos is a member of the council of the Independent Tanker Owners Association (INTERTANKO), a Board member in the Union of Greek Shipowners (UGS), a council member in the Board of the Greek Shipping Co-operation Committee (GSCC), and a council member of the American Bureau of Shipping (ABS), of Bureau Veritas (BV), and of the Greek Committee of Det Norske Veritas (DNV). He graduated from Columbia University, New York in 1985 with a degree in Economics and Political Science and obtained a Masters’ Degree in Shipping, Trade and Finance from the City of London University Business School in 1987. Mr. Tsakos served as an officer in the Hellenic Navy in 1988.
GEORGE V. SAROGLOU
CHIEF OPERATING OFFICER
Chief Operating Officer since May 1996 and director of TEN since July 2001. Mr. Saroglou is a shareholder and director of Pansystems S.A. a leading Greek IT systems integrator where he also worked from 1987 until 1994. From 1995 to 1996 he was employed in the trading department of the Tsakos Group. He graduated from McGill University (Montreal Canada) in 1987 with a Bachelor Degree in Science (Mathematics).
PAUL DURHAM
FINANCE DIRECTOR
Paul Durham joined the Tsakos Group in 1999 and has served as our Finance Director and Chief Accounting Officer since June 2000. Mr. Durham is a U.K. Chartered Accountant. Prior to joining Tsakos Energy Navigation, from 1989 through 1998 Mr. Durham was employed with the Latsis Group, a shipping, refinery and banking enterprise, becoming Financial Director of shipping in 1995. From 1983 to 1989, Mr. Durham was employed by RJR Nabisco Corporation, serving as audit manager for Europe, Asia and Africa until 1986 and then as financial controller of one of their U.K. food divisions. Mr. Durham worked with Ernst & Young (London and Paris) from 1972 to 1979 and Deloitte & Touche (Chicago and Athens) from 1979 to 1983.
PAUL B. LABRINAKOS
CHIEF MARINE OFFICER
Paul B. Labrinakos was appointed Chief Marine Officer of TEN in June 2002 with the responsibility of overseeing newbuilding vessels and monitoring the fleet under management. He has served with the Tsakos Group since 1992, firstly as Technical Manager based in New York and later in Athens as Technical Director, responsible for the technical supervision of a fleet of 60 vessels. He created the New Projects Department of the Tsakos Group. Earlier in his career he has worked for other major shipping and industrial companies. He has supervised and has been involved in the design and building of over 50 newbuilding vessels. He has seagoing experience on both bulk carriers and tankers. He is a member of several maritime technical committees both in Europe and the USA. He graduated from the Athens National Technical University as a Naval Architect and Marine & Mechanical Engineer. He has completed technical studies also in Germany and in the United States.
TSAKOS ENERGY NAVIGATION BOARD COMMITTEES
Audit Committee Peter Nicholson - Chairman D. John Stavropoulos Michael G. Jolliffe Angelos Plakopitas | Corporate Governance, Nominating / Compensation Committee Peter Nicholson - Chairman D. John Stavropoulos Michael G. Jolliffe Antonio Taragoni Angelos Plakopitas | |
Chartering Committee Antonio Taragoni - Chairman D. John Stavropoulos Nikolas P. Tsakos | Risk Committee D. John Stavropoulos - Chairman Peter Nicholson Nikolas P. Tsakos Paul Durham | |
Capital Market Committee Michael G. Jolliffe - Chairman D. John Stavropoulos Nikolas P. Tsakos | ||
SECRETARY: EMMANUEL G. PANTELIDES
TEN LIMITED | 5 |
FINANCIAL HIGHLIGHTS
(Expressed in thousands of US Dollars – except share data)
(In accordance with United States Generally Accepted Accounting Principles)
| 2003 | 2002 | |||
NET REVENUE | 230,069 | 123,640 | ||
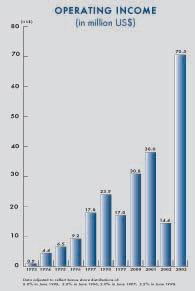
OPERATING INCOME | 70,525 | 14,430 | ||
NET INCOME | 59,052 | 3,894 | ||
EARNINGS PER SHARE (BASIC) | 3.45 | 0.25 | ||
EARNINGS PER SHARE (DILUTED) | 3.44 | 0.25 | ||
TOTAL ASSETS | 825,507 | 694,545 | ||
TOTAL LIABILITIES | 510,938 | 427,101 | ||
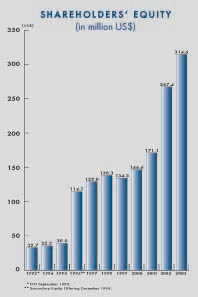
STOCKHOLDERS’ EQUITY | 314,569 | 267,444 | ||
OUTSTANDING SHARES AT YEAR END | 17,151,623 | 17,022,723 | ||
WEIGHTED AVERAGE OUTSTANDING SHARES (BASIC) | 17,134,347 | 15,717,065 | ||
WEIGHTED AVERAGE OUTSTANDING SHARES (DILUTED) | 17,187,859 | 15,854,904 | ||
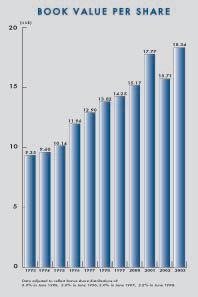
STOCKHOLDERS’ EQUITY PER SHARE OF COMMON STOCK | 18.34 | 15.71 | ||
SHARE PRICE (AS OF DECEMBER 31) (SEE NOTE 1 BELOW) | 18.45 | 15.46 | ||
NUMBER OF VESSELS AT YEAR END (SEE NOTE 2 BELOW) | 27 | 22 | ||
TOTAL DWT | 2,681,552 | 2,225,993 | ||
AVERAGE DEADWEIGHT AGE OF VESSELS | 6.5 | 6.8 | ||
| Note | 1: As quoted on the NYSE. |
| Note | 2: The number of vessels at the year end includes: |
| The M/T Olympia, a double hull Aframax tanker of 107,181 dwt. The vessel was sold through a sale and leaseback arrangement in October of 1999 and is time-chartered back from the buyers until October 2007. |
| The M/T Capella (2002 only), a double hull product carrier of 32,396 dwt chartered-in from December 2002 and redelivered to her Owners in September 2003. |
| The M/T Decathlon and M/T Pentathlon, two double hull Suezmax tankers of 164,274 and 164,235 dwt capacity respectively were sold through a sale and leaseback arrangement in October and November 2003 respectively and are time-chartered back by TEN for a minimum period of five years. The vessels have been re-named by the new owner Cape Baker and Cape Balboa. |
TEN LIMITED | 7 |
TEN GROWTH CHARTS
The 1993-1999 financial data is in accordance with the International Accounting Standards (IAS)
while 2000-2003 is in accordance with the US Generally Accepted Accounting Principles (US GAAP)
 |  | |
 |  | |
8 | ANNUAL REPORT AND ACCOUNTS 2003 |
TEN GROWTH CHARTS
The 1993-1999 financial data is in accordance with the International Accounting Standards (IAS)
while 2000-2003 is in accordance with the US Generally Accepted Accounting Principles (US GAAP)
 |  | |
 |  | |
TEN LIMITED | 9 |
MANAGEMENT REVIEW AND ANALYSIS
The following discussion of our financial condition and results of operations should be read in conjunction with the financial statements and the notes to those statements included later in this Annual Report. This discussion as well as other sections of this Annual Report includes forward-looking statements that involve risks and uncertainties. We have based the forward-looking statements in this Annual Report on our current expectations and projections about future events, including:
| • | general economic and business conditions; |
| • | global and regional political conditions; |
| • | availability of and demand for crude oil and petroleum products; |
| • | demand for crude oil and petroleum product substitutes; |
| • | actions taken by OPEC and major oil producers and refiners; |
| • | competition in the marine transportation industry; |
| • | developments in international trade; |
| • | international trade sanctions; |
| • | changes in seaborne and other transportation industry; |
| • | our ability to find new charters for our vessels at attractive rates; |
| • | capital expenditures; |
| • | meeting our requirements with customers; |
| • | tanker supply and demand; |
| • | interest rate movements; and |
| • | foreign exchange fluctuations. |
The words “anticipate”, “believe”, “estimate”, “expect”, “forecast”, “intend”, “may”, “plan”, “project”, “predict”, “should” and “will” and similar expressions are intended to identify such forward-looking statements. Such statements reflect our current views and assumptions and all forward-looking statements are subject to various risks and uncertainties that could cause actual results to differ materially from expectations. The factors that could affect our future financial results are discussed more fully in our filings with the U.S. Securities and Exchange Commission (“SEC”). Readers are cautioned not to place undue reliance on these forward-looking statements, which speak only as of their dates. We undertake no obligation to publicly update or revise any forward-looking statements.
General
The Company is a holding company formed under the laws of Bermuda in July 1993 under the name Maritime Investment Fund Limited. In June 1996 it changed its name to MIF Limited and in July 2001 changed its name to Tsakos Energy Navigation Limited (“TEN”). The Company is listed on the stock exchanges of Bermuda and Oslo. Since March 5, 2002, following a public offering of its common shares, it is also listed on the New York Stock Exchange under the symbol TNP.
TEN LIMITED | 11 |
TEN is the sole owner of a number of ship owning companies (those owned at December 31, 2003 are listed in Note 1 of the attached financial statements). Apart from certain subsidiaries with discontinued operations, twenty-four of the remaining companies each own one tanker. Three further companies each charter in a vessel for rechartering out to clients.
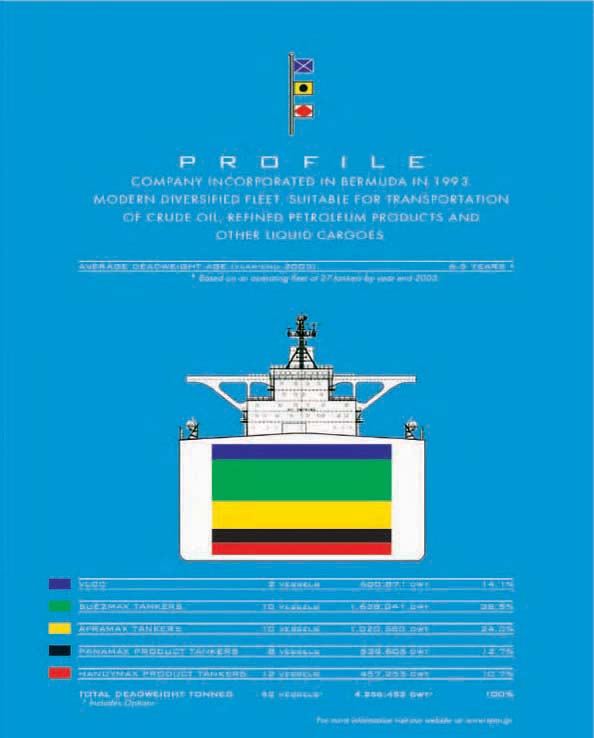
Following the acquisition of a VLCC tanker in January 2004, the Company currently operates a diversified fleet of twenty-eight tankers, consisting of two VLCCs, four Suezmaxes, ten Aframaxes, eight Panamaxes and four Handymax product carriers. A further thirteen tankers (six Suezmaxes and seven product carriers) are on order for delivery from 2004 to 2007.
The primary business of TEN therefore, is to own or charter, through its subsidiaries, carriers of crude oil and petroleum products, which it charters to leading oil companies or refineries or other major chartering enterprises under long, medium and short-term charters. The charter rates obtained are determined in a highly competitive world tanker charter market that has historically exhibited both cyclical and seasonal variations.
The commercial management of these vessels is undertaken through management agreements by a separate company, Tsakos Energy Management S.A. that, in turn, has management agreements with Tsakos Shipping and Trading S.A., a leading ship management company, for the technical management of the Company’s vessels.
Results from Operations
Following a severe depression in freight rates during most of 2002, the market began to see a sharp improvement in the last two months of the year which saw a significant rise in rates brought on by winter demand, low inventories, supply disruptions in Venezuela and Nigeria, prospects of conflict in the Middle East, and the sinking of the Prestige off the Spanish coast. These factors helped to keep the market exceptionally buoyant throughout 2003, modified only by the usual seasonal fluctuations and by new factors that had an impact on the industry, including the high demand for oil imports from China and India, the development of alternative sources for the supply of oil and the passage restrictions in the Bosphorus.
Some of the more significant developments for the Company during 2003 were:
The arrangement of new period charters with leading state-owned oil corporations. While the Company took advantage of the high rates being offered by the spot market, it also sought, in accordance with its overall chartering strategy, to ensure period employment of its vessels, often including in the terms variable rates with minimum floors and profit sharing for the Company to participate in the upside in buoyant markets.
The delivery of six newly constructed vessels:- four Panamax tankers (Maya, Inca, Aztec, Andes) and two Aframax tankers (Marathon, Parthenon). As a result, the dead-weight tonnage of the fleet increased by 20% from 2.23 million tons to 2.68 million tons and the average age (dwt basis) fell from 6.8 years to 6.5 years. Also, an agreement was reached to acquire a VLCC which was delivered in January 2004 and renamedLa Madrina.
The sale of two Suezmaxes acquired in 2002 (Decathlon, Pentathlon), to a German KG organization for $55 million each, thereby achieving a total capital gain of nearly $16 million. The vessels were chartered back for a period of five years over which time the capital gain is amortized. The vessels have been renamedCape Baker andCape Balboa, respectively.
12 | ANNUAL REPORT AND ACCOUNTS 2003 |
The proceeds of new loans with leading European banks relating to the six new vessels amounting to $160 million in total. Repayments amounted to $93 million, including the prepayment on the loans relating to the two sold Suezmaxes. Total debt at the year end amounted to $453 million.
The arrangement of new interest rate swaps, all meeting hedging criteria and providing further coverage of $111 million. Two of the older non-hedging swaps expired during the year. At December 31, 2003, the equivalent of approximately 58% of the outstanding loans were covered by interest rate swap arrangements.
The performance of major surveys on four product carriers (Pella, Dion, Libra, Crux), two Aframaxes (Maria Tsakos, Athens 2004), and three Panamaxes (Hesnes, Victory III, Liberty). In the case of theHesnes, an upgrading was also undertaken with the coating of the ballast tanks.
The ending by mutual accord of the joint venture company, LauriTen Ltd., in accordance with the terms of the original agreement. The original investment made by the Company was returned. Net income earned in 2003 was $0.6 million.
The payment to the Company’s shareholders of two dividends during the year, $0.20 cents per share in April in respect of the fiscal year 2002, and $0.50 cents in November, the first dividend with respect to fiscal year 2003.
The continued adoption and implementation of new corporate governance requirements as required by the Sarbanes-Oxley Act, the SEC, the New York Stock Exchange and the Oslo Stock Exchange. In particular, the Code of Ethics has been revised and is available for viewing on the Company’s website. A firm of public accountants has been appointed to review and document all the internal control procedures relating not only to the Company, but also to the technical managers.
The TEN fleet again achieved record net revenue of $230.1 million, up 86.1% from $123.6 million in 2002. Operating income increased from $14.4 million in 2002 to $70.5 million in 2003, a 388.7% increase. However, in 2002 there was an impairment of $10.8 million on the value of two single-hull vessels. No impairment was considered necessary in 2003.
Net income was $59.1 million in 2003, compared to $3.9 million in the prior year, a 1,416.5% increase. Diluted income per share increased from $0.25 in 2002, based on 15.85 million shares outstanding, to $3.44 in 2003, based on 17.19 million shares outstanding. These results reflect the dramatic improvement in market rates starting in late 2002 and continuing through most of 2003. U.S. interest rates fell in continued efforts to support the U.S. economy, providing reductions in financing costs. Vessel running expenses were held to competitive levels despite increasing costs due to the relative fall in the value of the U.S. Dollar to the Euro and higher insurance premiums.
The Company operated the following types of vessel during 2003:
Vessel Type | VLCC | Suezmax | Aframax | Panamax | Product carriers | ||||||||||||
Average number of vessels | 1 | 4 | 9.4 | 6.6 | 4.7 | ||||||||||||
Number of vessels at end of period | 1 | 4 | 10 | 8 | 4 | ||||||||||||
Dwt at end of period (in thousands) | Dwt | 301.2 | 657.2 | 1,020.7 | 539.6 | 162.9 | |||||||||||
Percentage of total fleet | 11.2 | % | 24.5 | % | 38.1 | % | 20.1 | % | 6.1 | % | |||||||
Average age at end of period | Years | 5.3 | 1.3 | 7.6 | 8.1 | 17.7 |
TEN LIMITED | 13 |
The contribution of the new vessels to the overall results for 2003 was:
| Newbuildings | Acquired | Joint Venture | Other net costs* | Combined | |||||||||||
Average number of vessels | 14.0 | 11.7 | — | — | 25.7 | ||||||||||
Utilization in period | 98 | % | 87 | % | — | — | 93 | % | |||||||
TCE per ship per day | $ | 26,454 | 17,324 | — | — | 22,636 | |||||||||
Operating expenses per ship per day | $ | 5,613 | 6,316 | — | — | 5,949 | |||||||||
Revenue from vessels, net ($ thousand) | $ | 153,856 | 76,213 | — | — | 230,069 | |||||||||
Net income/(loss) - ($ thousand) | $ | 51,853 | 9,398 | 602 | (2,801 | ) | 59,052 | ||||||||
| * | Other net costs include General and Administrative expenses, non-recurring charges, provisions against claims against dormant companies, other costs and interest income. |
(Note - Time Charter Equivalent (TCE): The shipping industry uses time charter equivalent, or TCE, to calculate revenues per vessel in dollars per day for vessels on voyage charters. The industry does this because it does not commonly express charter rates for vessels on voyage charters in dollars per day. TCE allows vessel operators to compare the revenues of vessels that are on voyage charters with those on time charters. For vessels on voyage charters, we calculate TCE by taking revenues earned on the voyage and deducting the voyage costs and dividing by the actual number of net earning days. For vessels on bareboat charters, for which we do not incur either voyage or operating costs, we calculate TCE by taking revenues earned on the charter and adding a representative amount for vessels operating expenses. TCE differs from average daily revenue earned in that TCE is based on revenues before commissions and does not take into account off-hire days.)
Critical Accounting Policies
Our consolidated financial statements are prepared in accordance with accounting principles generally accepted in the United States. The Company’s significant accounting policies are described in Note 2 of the attached financial statements. The application of such policies may require management to make estimates and assumptions. We believe that the following are the more critical accounting estimates used in the preparation of our consolidated financial statements that involve a higher degree of judgment and could have a significant impact on our future consolidated results of operations and financial position:
Revenues from vessels, net. Our vessels are employed under a variety of charter contracts, including time, bare-boat and voyage charters, contracts of affreightment and pool arrangements. Time and bare-boat charter revenues are recorded over the term of the charter as the service is provided. Under a voyage charter (including those under contract of affreightment) the revenues and associated voyage costs are recognized on a pro-rata basis over the duration of the voyage. If a voyage is in progress as at a reporting date, the operating results are estimated and recognized pro-rata on a per day basis. If a loss is forecast for a given voyage, such losses would be provided for in full at the time they can be estimated. Vessel operating expenses are accounted for on an accrual basis. Unearned revenue represents revenue applicable to periods after December 31, of each year. The operating revenues and voyage expenses of all vessels operating under a tanker pool are pooled by the pool manager and net operating revenues are allocated to the pool participants according to an agreed formula. We apply the same revenue and expense principles stated above in determining the pool net operating revenues.
Depreciation. We depreciate our vessels on a straight-line basis over their estimated useful lives, after considering their estimated residual values, based on the assumed value of the scrap steel available for recycling after demolition, calculated at $180 per lightweight ton. In assessing the useful lives of vessels, we have adopted the industry wide accepted practice of assuming a vessel has a useful life of 25 years, given that all classification
14 | ANNUAL REPORT AND ACCOUNTS 2003 |
society rules have been adhered to concerning survey certification and statutory regulations are followed. Useful life is then ultimately dependent on customer demand and if customers were to reject our vessels, either because of new regulations or internal specifications, then the useful life of the vessel will require revision. Actual scrap values are primarily dependent on the demand for steel bars for construction purposes and the availability of vessels for demolition and recycling. Current scrap prices have recently reached a historic high. However, given the volatility in scrap prices in recent years and the average life of the vessels, we have decided not to adjust residual values. If we were to do so in current circumstances, the residual value of vessels would increase and the depreciation charge fall accordingly.
Impairment. The carrying value of the Company’s vessels includes the original cost of the vessels plus capitalized expenses since purchase relating to improvements and upgrading of the vessel, less depreciation. Carrying value also includes the unamortized portion of deferred special survey and dry-docking costs. The carrying value of vessels usually differs from the fair market value applicable to any vessel, as market values fluctuate continuously depending on the market supply and demand conditions for vessels, as determined primarily by prevailing freight rates and newbuilding costs.
In order to identify indicators of impairment, test for recoverability of vessel carrying value and if necessary, measure the required impairment charges, management regularly compares each vessel’s carrying amount with the average of its fair market values as provided by two independent and reputable brokers. In the event that an indicator of impairment exists because a vessel’s carrying value is in excess of its fair market value, management estimates the undiscounted future cash flows to be generated by each of the Company’s vessel’s in order to assess the recoverability of the vessel’s carrying value. These estimates are based on historical industry freight rate averages for each category of vessel taking into account the age, specifications and likely trading pattern of each vessel and the likely condition and operating costs of each vessel. Such estimations are inevitably subjective and actual freight rates, as witnessed during 2002, 2003 and early 2004, may be volatile. As a consequence, estimations may differ considerably from actual results.
The estimations also take into account new regulations regarding the permissible trading of tankers depending on their structure and age. As a consequence of new European Union regulations effective from October 2003, the IMO adopted new regulations in December 2003 regarding early phase out of non-double hull tankers. At December 31, 2003, the Company owned and operated four single-hull tankers, two product carriers with single side and double bottom and two product carriers with double side and single bottom. None of the vessels were deemed Category I vessels, which require phase out by 2005. All eight vessels, providing they complete the newly imposed survey requirements, may continue trading to the end of their assumed economic lives of 25 years.
While management, therefore, is of the opinion that the assumptions it has used in assessing whether there are grounds for impairment are justifiable and reasonable, the possibility remains that conditions in future periods may vary significantly from current assumptions, which may result in a material impairment loss. In the event that the undiscounted future cash flows do not exceed a vessel’s carrying value, an impairment charge is required, and the vessel’s carrying value is written down to the fair market value as determined above. As vessel values are also volatile, the actual market value of a vessel may differ significantly from estimated values within a short period of time.
Allowance for doubtful accounts. Revenue is based on contracted charter parties and although our business is with customers whom we believe to be of the highest standard, there is always the possibility of dispute over terms and payment of freight. In particular, disagreements may arise as to the responsibility for lost time and demurrage revenue due. As such, we periodically assess the recoverability of amounts outstanding and we estimate a provision if there is a possibility of non-recoverability. Although we believe our provisions to be based on fair judgment at the time of their creation, it is possible that an amount under dispute is not ultimately recovered and the estimated provision for doubtful recoverability is inadequate.
TEN LIMITED | 15 |
Amortization of deferred charges. In accordance with Classification Society requirements, a special survey is performed on our vessels every five years. A further intermediate survey takes place in-between special surveys, depending on the age of the vessel. In most cases a dry-docking is necessary with repairs undertaken to bring the vessel up to the condition required for the vessel to be given its classification certificate. The costs include the yard charges for labor, materials and services, plus possible new equipment and parts where required, plus part of the participating crew costs incurred during the survey period. We capitalize these charges and amortize them over the period up to the vessel’s next special survey. These expenses are part of the normal costs we incur in connection with the operation of our fleet.
Financial Analysis
Year ended December 31, 2003 versus year ended December 31, 2002
Net Revenue
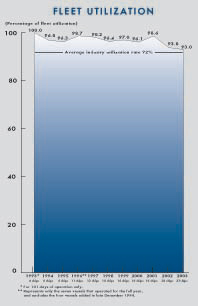
Net revenue from vessels (freight less brokerage commission) was $230.1 million during the year ended December 31, 2003 as compared to $123.6 million during the year ended December 31, 2002, an 86.1% increase partly resulting from an increase in the number of vessels from an average of 18.0 in 2002 to an average of 25.7 in 2003, and partly from the improvement in charter markets. The average time charter equivalent rate per vessel for the year 2003 was $22,636 per day compared to $16,676 for the previous year. In 2002, four newly built Suezmaxes were delivered, mostly in the latter part of the year, representing a whole new category of vessel for the Company to operate. A new Aframax,Opal Queen, was also acquired. These vessels operated throughout 2003. In addition, during 2003, four new Panamax tankers plus a further two Aframaxes were delivered. A Handymax product carrier was chartered-in towards the end of 2002 to provide cover in the absence of owned Handymaxes during their scheduled dry-dockings. This vessel was released in the autumn of 2003. The additional contribution in 2003 over 2002 to net revenue of these twelve vessels was $84.3 million. However, the fleet had 92.9% employment compared to 93.8% in the previous year, both years incurring significant dry-docking activity, which involved nine vessels in 2003 and six vessels in 2002.
Voyage Expenses
Voyage expenses include all our costs, other than operating expenses, that are related to a voyage, including port charges, canal dues and bunker or fuel costs. Voyage expenses were $61.3 million during the year ended December 31, 2003 compared to $32.8 million during the prior year, an 86.7% increase. Total operating days on spot charter and contract of affreightment, under which contracts the owner bears voyage expenses, rose from 2,582 days in 2002 to 4,272 in 2003, a 65% increase. The introduction of the larger Suezmaxes into the fleet with new trading routes (primarily West Africa to the U.S.) also contributed to increased voyage expenses. Bunker costs increased during 2003 as a consequence of higher oil prices.
Vessel Operating Expenses
Vessel operating expenses include crew costs, maintenance repairs and spares, stores, lubricants, insurance and sundry expenses such as tonnage tax, registration fees, and communication costs. Total operating costs were $49.9 million during the year ended December 31, 2003 as compared to $32.3 million during year ended December 31, 2002, an increase of 54.4%. This compares with an increase in operating days of approximately 2,462 or 47%, over the previous year, in those vessels bearing operating expenses.
Operating expenses per ship per day for the fleet increased from $5,498 for the year ended December 31, 2002 to $5,949 for the year ended December 31, 2003, an 8.4% increase. For the most part, this increase was due to the approximately 30% fall in value of the dollar against the Euro over the year. Approximately 25% of the Company’s operating expenses are in Euro, mainly in respect to Greek officers on the vessels. Increased insurance costs and extra repairs and spares also contributed to increased running costs.
16 | ANNUAL REPORT AND ACCOUNTS 2003 |
Depreciation
Depreciation was $32.9 million during the year ended December 31, 2003 compared to $24.4 million during the year ended December 31, 2002, an increase of 34.6%, due primarily to the addition in 2003 of, on an average basis, seven new vessels.
Amortization
We amortize the cost of dry-docking and special surveys over the period to the next special survey and this amortization is included as part of the normal costs we incur in connection with the operation of our vessels. During the year ended December 31, 2003, amortization of deferred dry-docking charges was $7.8 million as compared to $4.3 million during the year ended December 31, 2002, an increase of 81.6%, due to the major dry-docking and special survey work in the two year period since January 1, 2002.
Management Fees
Management fees are the fixed fees per vessel the Company pays to Tsakos Energy Management Ltd. under a management agreement between the companies. Since January 1, 2002 each vessel (excluding temporarily chartered-in vessels) bears a management fee of $15,000 per month, payable by the Company to Tsakos Energy Management Ltd., of which $10,000 per month is forwarded to Tsakos Shipping and Trading S.A. under a management contract for the technical management of the fleet. We believe this to be a very competitive fee to pay for such services. The remaining $5,000 per vessel is retained by Tsakos Energy Management Ltd. to cover the running costs associated with the administration of TEN. Management fees totalled $4.5 million during the year ended December 31, 2003, compared to $3.2 million for the year ended December 31, 2002, an increase of 38.0%, in line with the increase in available days provided by the newly acquired vessels to the fleet.
General and Administrative Expenses
General and administrative expenses consist primarily of professional fees, office supplies, advertising costs, directors’ fees, directors’ liability insurance, and reimbursement of our directors’ and officers’ travel-related expenses. General and administrative expenses were $2.4 million during the year ended December 31, 2003 compared to $1.3 million during the year 2002, an increase of 91.5% primarily due to additional expenditures relating to investor relations, advertising, travel, staff bonuses, SEC filing fees, legal and audit fees.
The sum of general and administrative expenses plus management fees payable to Tsakos Energy Management Ltd. represents the overheads of the Company. On a per vessel basis, daily overhead costs increased from $683 in 2002 to $734 in 2003, due to the factors mentioned above.
Operating Income
Income from vessel operations therefore was $70.5 million during the year ended December 31, 2003 versus $14.4 million during the year ended December 31, 2002, representing a 388.7% increase.
Interest and Finance Costs
Net interest and finance costs increased from $11.4 million during the year ended December 31, 2002 to $12.4 million during the year ended December 31, 2003, an 8.7% increase. Total average bank loans were approximately $473 million for 2003 compared to $271 million for 2002, an increase of 75%. Actual loan interest costs increased from $11.2 million to $13.2 million, only an 18% increase as the average interest rate for 2003 borne on the Company’s loans (taking into account actual interest payable on interest rate swaps) was approximately 3.5% compared to 4.5% for 2002. The actual interest payable on the swaps amounted to $4.5 million in 2003 compared to $2.7 million in 2002, the increase being due to the reduction in long term interest rates.
There was a positive movement of $3.5 million in the fair value (mark-to-market) of the non-hedging interest rate swaps in 2003, which is accounted for through the income statement and is included as part of interest costs,
TEN LIMITED | 17 |
compared to a negative movement of $3.8 million in 2002. This was primarily due to the reduction in the remaining life of the four swaps, including the expiry of two of them. The positive movement would have been greater if not for the unexpected reduction of long term interest rates mentioned above.
Capitalized interest in 2003 was only $0.8 million compared to $3.2 million in the previous year, due to the number of vessels completing construction during the past year and the reduction in average interest rates.
Interest income was $0.4 million during 2003 as compared to $0.7 million during the year ended December 31, 2002, due to lower time deposit interest rates in 2003 compared to 2002, despite much higher average bank deposits. Foreign exchange losses amounted to $0.4 million in 2003 compared to $0.1 million in 2002, due to the devaluation of the U.S. dollar compared to the Euro.
Joint Venture Income
The share of net income due to TEN Ltd. from the joint venture, LauriTen Ltd., for the year ended December 31, 2003 was $0.6 million after the write-off of $0.3 million expenses on cessation of the joint venture, compared to $0.2 million in 2002. The Company acquired a 50% participating interest in LauriTen Ltd. in 2002. The joint venture owned four separate companies each of which owned a small LPG carrier. The joint venture was accounted for using the equity method whereby the investment was carried at the Company’s original cost plus its share of undistributed earnings. A mutual decision was taken in August 2003 by the partners not to extend the joint venture agreement and consequently, in accordance with the original agreement, the joint venture expired on August 31, 2003.
Gain on the Sale of Vessels
The Company sold two Suezmaxes in a sale and leaseback transaction in the fourth quarter of 2003. The total gain of $15.8 million has been deferred and is being amortized over the five year minimum charter period. The initial part of this amortization amounted to $0.5 million in 2003.
Net Income
As a result of the foregoing, net income for the year ended December 31, 2003 was $59.1 million, or $3.45 per share, basic, versus $0.25 per share, basic, during the year ended December 31, 2002, an increase of 1,279%.
Year ended December 31, 2002 versus year ended December 31, 2001
Net Revenue
Net revenue from vessels, net, was $123.6 million during 2002 as compared to $118.7 million during the year ended December 31, 2001, a 4.2% increase primarily resulting from expansion of our fleet from an average of 16 vessels operating in 2001 to an average of 18 vessels operating in 2002. This increase in fleet size offset the weakness in charter markets for all types of tankers during 2002, the average time charter equivalent rate per vessel for 2002 being $16,676 per day compared to $19,002 for 2001. However, the fleet had 93.8% employment in 2002 compared to 98.6% in the previous year, so that total days employed were equivalent to a little over one extra vessel in the year. The primary reason for the reduced productivity was increased dry-docking activity, which involved six vessels during the course of the year. Certain of these vessels had been scheduled for drydock in 2003, but the timing was brought forward to take advantage of the soft freight market.
Voyage Expenses
Voyage expenses were $32.8 million during the year ended December 31, 2002 as compared to $21.4 million during the year ended December 31, 2001, representing a 53.2% increase primarily due to the operation of two extra vessels on spot charter during 2002 compared to 2001. Total operating days on spot charter and contract of affreightment, under which contracts the owner bears voyage expenses, rose from 1,731 days in 2001 to 2,582 in 2002, a 49% increase. Bunker costs, an important component of voyage expenses also increased significantly during 2002.
18 | ANNUAL REPORT AND ACCOUNTS 2003 |
Vessel Operating Expenses
Vessel operating expenses were $32.3 million during the year ended December 31, 2002 as compared to $28.7 million during the year ended December 31, 2001. The increase of 12.7% was due to the addition, on average, of two extra vessels during the year compared to the previous year. This represented an increase in operating days of approximately 14% in vessels bearing operating expenses. Vessel operating expenses per ship per day for the fleet decreased from $5,622 for the year ended December 31, 2001 to $5,498 for the year ended December 31, 2002, despite increased insurance costs, additional required vessel repairs and a rising Euro. The decrease in average daily vessel operating expenses is also partly attributable to reduced running costs during dry-docking activities and the cost efficiencies achieved through the addition of new vessels to the fleet.
Depreciation
Depreciation was $24.4 million during the year ended December 31, 2002 compared to $21.3 million during the year ended December 31, 2001, an increase of 15.0% due to the addition on average for the year of two new vessels to the fleet.
Impairment
The carrying values of two 21-year old single hull vessels, Panos G and Liberty, were written-down to their fair market values, resulting in an impairment loss of $10.8 million. Values of single hull tankers had fallen as a result of the incident involving the Prestige, an aged single hull oil tanker which sank in rough seas and resulted in proposed restrictions on the operation of such vessels. In addition, it was estimated on the basis of industry data that the cash flow expected to be generated by the future use of these vessels would also be less than the carrying values. In such circumstances, accounting principles require the write-down of the difference between the carrying value of the asset and the fair market value.
Amortization
During the year ended December 31, 2002, amortization of deferred dry-docking charges amounted to $4.3 million as compared to $5.1 million during the year ended December 31, 2001, a decrease of 15.7%. The total charges for the previous year included $1.3 million relating to an adjustment of the amortization period for the remaining unamortized deferred dry-docking costs on two vessels undergoing special surveys within 2001 and 2002 to ensure full amortization before the new special surveys. Excluding this adjustment from 2001, the resulting increase in amortization of dry-docking charges of approximately $0.5 million is primarily due to amortization of significant new expenditure relating to dry dock work on four vessels during 2001 and 2002.
Management Fees
Management fees were $3.2 million during the year ended December 31, 2002, a $0.1 million increase from the year ended December 31, 2001. The monthly fee payable to Tsakos Energy Management decreased from $16,500 per month per vessel to $15,000 commencing January 1, 2002. The savings offset the additional management fees resulting from the addition of two vessels on average to the fleet.
Stock Option Compensation Expenses
Stock option compensation expenses represent changes in the fair value of the stock options granted. As all such expenses were fully accounted by December 31, 2001, there were no further charges during the year ended December 31, 2002. The expense during the year ended December 31, 2001 was $0.3 million.
General and Administrative Expenses
General and administrative expenses were $1.3 million during the year ended December 31, 2002 as compared to $0.8 million during the year ended December 31, 2001. This represents a 59.3% increase, which is primarily attributable to increased expenditures with respect to investor relations, advertising, directors’ and officers’ insurance and legal and audit fees relating to our completion in early 2002 of a public offering of our common shares in the United States and our on-going reporting obligations as a publicly traded company.
TEN LIMITED | 19 |
Operating Income
As a result of the foregoing, income from vessel operations was $14.4 million during the year ended December 31, 2002 versus $38.0 million during the year ended December 31, 2001, representing a 62.0% decrease. A significant factor in the decrease in operating income for 2002 versus 2001 was the $10.8 million impairment loss described above.
Interest and Finance Costs
Interest and finance costs decreased from $14.5 million during the year ended December 31, 2001 to $11.4 million during the year ended December 31, 2002, representing a 21.7% decrease. Although total bank loans increased from $244.5 million as at January 1, 2002 to $386.0 million by the year end, average interest rates fell from approximately 5.6% in 2001 to 3.5% in 2002. The decrease in overall interest expense was due also to the increase in capitalization of interest relating to the new building program from $1.6 million in 2001 to $3.2 million during 2002. The reduction in interest and finance costs was offset by a negative $3.8 million fair value adjustment at December 31, 2002 on four open interest rate swap arrangements which we entered into in July 2001. Because these swaps were entered into for non-hedging purposes, the fair value (mark-to-market) of these swap agreements and changes in their fair value are recognized in our financial statements. As at December 31, 2001 these same swaps incurred a $3.4 million negative fair value adjustment, but this had been offset by the termination in June 2001 of two other interest rate swaps entered into in March 2001, which gave rise to a $1 million gain.
Interest income was $0.7 million during the year ended December 31, 2002 as compared to $1.2 million during the year ended December 31, 2001, representing a decrease of 39.4%. This decrease resulted primarily from lower time deposit interest rates in 2002 compared to 2001, notwithstanding that the Company had higher cash balances on deposit during 2002 compared to 2001.
Joint Venture Income
The Company entered into a joint venture, named LauriTen Ltd., with Lauritzen A/S of Denmark in October 2002. The joint venture owns four small LPG carriers which are on bare-boat charter to Lauritzen A/S for one year. The joint venture is accounted for as an investment on an equity basis. The net income of the joint venture is derived after deducting depreciation, bank interest and administrative expenses from the bare-boat charter income and is distributed in equal amounts to the Company and Lauritzen A/S. The share of net income due to TEN Ltd. for the year ended December 31, 2002 is $0.2 million and is included in other income.
Net Income
As a result of the foregoing, net income for the year ended December 31, 2002 was $3.9 million, or $0.25 per share, basic, versus $24.6 million or $2.56 per share, basic, during the year ended December 31, 2001, a decrease of 84.2%.
Liquidity and Capital Resources
Our liquidity requirements relate to servicing our debt, funding the equity portion of investments in vessels, funding working capital and controlling fluctuations in cash flow. Net cash flow generated by continuing operations is our main source of liquidity. Apart from the possibility of securing further equity, additional sources of cash include proceeds from asset sales and borrowings, although all borrowing arrangements to date have specifically related to the acquisition of vessels. There is no off balance sheet financing.
We believe that, unless there is a major and sustained downturn in market conditions, our financial resources are sufficient to meet our liquidity needs through January 1, 2005, taking into account both our existing capital commitments and the minimum debt service requirements as defined by our bank loan covenants.
20 | ANNUAL REPORT AND ACCOUNTS 2003 |
Working capital (non-restricted net current assets) amounted to approximately $33 million at December 31, 2003 compared to approximately $3 million as at December 31, 2002, primarily a reflection of the increase in unrestricted cash holdings from $39.7 million to $86.8 million, most of the increase being due to the sale proceeds arising from the sale of two Suezmaxes in the last quarter. Current assets increased from $75.7 million at December 31, 2002 to $117.0 million at December 31, 2003 due to the increased cash balances and to increased trade and other receivables. Current liabilities increased from $66.2 million to $83.5 million at December 31, 2003 due mainly to increases in the current portion of the long term debt and deferred income and trade accounts payable offset against decreases in accrued liabilities and the fair market valuation of the existing interest rate financial instruments.
Net cash provided by operating activities was $84.2 million in the year ended December 31, 2003 compared to $32.7 million in the previous year, a 157.1% increase. The increase is due mainly to the record income generated by the increase in fleet size and the substantial improvement in the freight market as described in the preceding sections.
Expenditure on dry-dockings is deducted from cash generated by operating activities. Total expenditure during 2003 on dry-dockings amounted to $15.1 million compared to $8.3 million in 2002. Programmed expenditure on dry-dockings has been higher than previous years due to the timing of special and intermediate surveys on the older vessels and the requirement for the newer vessels, delivered since 1997, to undertake their first special survey. A part of the scheduled work was brought forward into 2002, when the freight market was considerably softer. In 2003, special survey work was performed on the Handymax product carriersPella,Libra,Dion andCrux. During much of the period that these vessels were undergoing work, they were substituted in part by the chartered-in Handymax product carrier,Capella which was released by TEN in September 2003. The dry-docking of all the Company’s product carriers has resulted in reduced earnings for this category of vessel during the year. Work was also performed on the PanamaxHesnes relating to its intermediate survey and the coating of its ballast tanks, as performed on its sister vesselBregen in 2002. The vessel returned to pool service in September with the ability to generate more income in its upgraded state. The PanamaxLiberty also completed an extensive intermediate dry-docking and the second of the new Aframaxes, theAthens 2004, delivered in 1998, underwent its first special survey in the second quarter. For the last quarter of the year, the third of the new Aframaxes,Maria Tsakos, undertook its first special survey and the PanamaxVictory III had an intermediate survey.
In contrast, there are four major dry-dockings scheduled for 2004, relating to theOlympia (paid for by the owner),Tamyra,Bregen andLiberty. There is a strong possibility that theLiberty, the oldest vessel in the fleet will be disposed of before its scheduled dry-docking in August.
Net cash used in investing activities was $91.8 million for the year 2003, compared to $257.0 million for the year 2002. Almost all the use of cash in 2003, amounting to $218.9 million, relates to the ongoing new building program. During the year, an amount of $185.8 million was paid for the delivery from Imabari yards in Japan of the PanamaxesMaya (January 24),Inca (March 20),Aztec (May 29),Andes (September 12) and the AframaxesMarathon (January 22) andParthenon (July 23). A further $26.9 million was expended as advances (contract instalments, construction supervisory fees and interest capitalized) on the four Suezmaxes (delivery October 2005, December 2005, February 2006 and May 2006) and the three Handysize product carriers ordered from Hyundai (delivery June 2004, December 2004, June 2005). The cost of upgrading theHesnes was a further $1.1 million. $5.2 million was paid as a deposit for the purchase of the VLCC, delivered in January 2004 at a total purchase price of $51.5 million and renamedLa Madrina.
TEN LIMITED | 21 |
During the period between January 1, 2004 and March 31, 2004, the Company entered into contracts to construct a further six vessels, four ice-class product carriers and two ice-class suezmaxes, bringing the total number of vessels on order to thirteen (see below section on fleet development). The anticipated payment schedule on these vessels, which is subject to change if there are delays or advanced work, is as follows (amounts in $ million):
| Prior to 2004 | 2004 | 2005 | 2006 | 2007 | Total | |||||||
Quarter 1 | 36.3 | 12.2 | 76.1 | 58.4 | ||||||||
Quarter 2 | 23.7 | 25.5 | 35.5 | 55.5 | ||||||||
Quarter 3 | 20.1 | 4.8 | 11.7 | 0 | ||||||||
Quarter 4 | 20.6 | 70.3 | 27.0 | 0 | ||||||||
Total Year | 27.0 | 100.7 | 112.8 | 150.3 | 113.9 | 477.7 |
Net sale proceeds from the sale of the two Suezmaxes,Decathlon andPentathlon, amounted to $108.9 million. The Company received an amount of $11.2 million from Lauritzen Kosan S.A., our Danish partners in the joint venture LauriTen Ltd. for the return of the initial investment in the joint venture LauriTen Ltd. Also, $7.0 million restricted cash in collateral was released.
Net cash from financing activities was $54.8 million in 2003 compared to $230.6 million in 2002. Proceeds from new bank loans in 2003 amounted to $159.9 million with repayments of $93.2 million compared to proceeds of $185.4 million less repayments of $43.9 million in the previous year. 2002 also saw the public offering of our common shares, together with the gross proceeds from the concurrent private placement of one million common shares sold to Sea Consolidation S.A. providing total net proceeds of $100.4 million.
The Company has effectively a continuous program to repurchase a limited number of shares with the primary aim of enhancing share liquidity. The transactions were open market based through the New York Stock Exchange with a maximum price set by the Board of Directors. During 2003, the Company purchased 140,100 shares in the open market in a buy-back program at a cost of approximately $1.8 million. The shares were cancelled in accordance with Bermudan regulations. During the year, the staff of the Tsakos Group exercised 269,000 options at $10 each which provided $2.7 million.
A cash dividend of 20 cents was paid in April 2003 representing the final dividend for the fiscal year 2002 and a 50 cent dividend was paid in November 2003 as the first dividend for the fiscal year 2003. In total, the two dividends amounted to $12.0 million. A further dividend of $ 0.50 cents per share for the fiscal year 2003 has been declared, to be paid on April 29, 2004. The dividend policy of the Company is to pay between 25% and 50% of the net income in any given year, payable in two instalments, the first prior to the end of the year based on expected earnings and cash requirements, and the final portion in the early part of the following year based on final earnings and cash requirements. The payment and the amount is subject to the discretion of our board of directors and depends, among other things, on available cash balances, anticipated cash needs, our results of operations, our financial condition, and any loan agreement restrictions binding us or our subsidiaries, as well as other relevant factors.
We operate in a capital-intensive industry requiring extensive investment in revenue-producing assets. We raise the funds for investments in newbuildings mainly from borrowings and partly out of internally generated funds. Newbuilding contracts generally provide for multiple staged payments of 5% to 10%, with the balance of the vessel purchase price paid upon delivery. For the equity portion of an investment in a newbuilding or a secondhand vessel the Company usually pays from its own cash approximately 30% of the contract price. Repayment of the debt incurred to purchase the vessel is made from vessel operating cash flow, typically over eight to twelve years, compared to the vessel’s asset life of approximately 25 years.
As of December 31, 2003, we were committed to seven newbuilding orders totaling approximately $270 million, of which $27 million had been paid by December 31, 2003 and $49 million had been paid by March 31, 2004. Between January 1, 2004 and March 31, 2004, the Company ordered six further vessels. Of the thirteen vessels that were on order at March 31, 2004, with a total contract value of $505 million, there was still $441 million remaining to be paid.
22 | ANNUAL REPORT AND ACCOUNTS 2003 |
As is customary in our industry, we anticipate financing the majority of our commitments on the new buildings with bank debt. We do not usually finalize financing arrangements for the new buildings until shortly before we take delivery of the vessels. We have not yet completed arrangements for the financing of the construction of the thirteen vessels, although discussions with several banks in each case are in progress. We have established relationships with various major international banks that have previously financed our vessel acquisitions and new buildings. We intend to raise at least 70% of the vessel purchase price with bank debt, although our ability to do so will depend upon the commercial loan market for shipping companies and our perceived prospects at the time.
With regards to the new debt financing, $27.4 million for the part financing of theMarathon was drawn on a $129 million facility arranged with Deutsche Schiffsbank in 2002. (The remaining $101.6 million previously received related to three Suezmaxes delivered in 2002). $55 million was received from HSH Nordbank (previously LandesbankKiel) for the PanamaxesMaya andInca and in the second quarter $26 million was received from the Danish Ship Finance Bank for the PanamaxAztec. A loan of $25.6 million has been received from Credit Suisse for the part financing of the AframaxParthenon delivered in July and a loan of $26 million has been received with the Royal Bank of Scotland for the PanamaxAndes delivered in September. No further financing occurred in the fourth quarter. $93.3 million was repaid during the year including a prepayment of $59.4 million relating to the loan for theDecathlon andPentathlon.
In December 2003, the Company entered into a contract to acquire the double hull VLCCMaersk Estelle (299,700 dwt), built in January 1994, for an amount of $51.5 million. An amount of $5.2 million was paid as an advance. The balance of $46.3 million was paid on delivery in January 2004 and the vessel was renamedLa Madrina.
SUMMARY OF LOAN MOVEMENTS THROUGHOUT 2003 (in $ million):
Loan | Vessel | Balance at January 1, 2003 | New Loans | Repaid | Balance at December 31, 2003 | |||||
Syndicated credit facility | 15 vessels | 174.4 | 0 | 20.4 | 154.0 | |||||
Syndicated credit facility | Millennium | 48.1 | 0 | 3.2 | 44.9 | |||||
12-year term loan | Opal Queen | 29.6 | 0 | 1.7 | 27.9 | |||||
10-year term loan | Silia T. | 32.2 | 0 | 1.9 | 30.4 | |||||
Syndicated credit facility | Triathlon, Marathon | 101.6 | 27.4 | 63.3 | 65.7 | |||||
10-year term loan | Maya | 0 | 27.5 | 1.0 | 26.5 | |||||
10-year term loan | Inca | 0 | 27.5 | 1.0 | 26.5 | |||||
10-year term loan | Aztec | 0 | 26.0 | 0.8 | 25.2 | |||||
10-year term loan | Parthenon | 0 | 25.5 | 0 | 25.6 | |||||
10-year term loan | Andes | 0 | 26.0 | 0 | 26.0 | |||||
Total | 386.0 | 159.9 | 93.3 | 452.6 |
There were no undrawn amounts relating to the above facilities as at December 31, 2003.
As a result of such financing activities, long-term debt increased in 2003 by a net amount of $66.6 million, compared to a net increase of $141.5 million in 2002. The average debt to capital ratio was approximately 59% at December 31, 2003. Interest rate swap instruments currently cover approximately 62% of the outstanding debt, and further coverage is being arranged with major banks. The two remaining swaps which do not meet hedging criteria and cover a notional $100 million will expire in July 2004.
TEN LIMITED | 23 |
In January 2004, the Company obtained a term loan facility for $40.0 million from Citibank to partially finance the acquisition of the VLCCLa Madrinaon delivery. The loan will be repaid in sixteen variable instalments with a balloon payment of $13.5 million to be paid together with the last instalment. The interest rate is based on LIBOR plus a spread. The loan is secured with a first preferred mortgage over the vessel, an assignment of earnings and insurance of the vessel and a corporate guarantee of the ship-owning company.
As at March 31, 2004, after including the new $40.0 million debt and deducting repayments made in the first quarter of 2004 of $8.1 million, total net debt outstanding was $484.5 million. Annual principal payments scheduled from April 1, 2004, are as follow (these will change depending on possible prepayments and new loan arrangements):
Year | Principal Payment (in millions) | ||
2004 | $ | 35.7 | |
2005 | 47.7 | ||
2006 | 166.4 | ||
2007 | 19.7 | ||
2008 | 19.6 | ||
2009 and thereafter | 195.4 | ||
Total | $ | 484.5 | |
During 2002 the Company took delivery of the newly constructed SuezmaxesDecathlonandPentathlon.In October and November 2003, the Company sold and time-chartered the vessels (re-namedCape BakerandCape Balboarespectively) back from the buyer for a minimum period of five years, with options to extend the charters for a further three years. In addition, at the end of the first five years, or until the end of the end of the seventh year if the charter is extended, the Company has the option to buy the vessels at specified amounts. The charter back agreements are accounted for as operating leases and the gains on the sale of $8.3 million and $7.5 million respectively were deferred and are amortized over the five year lease period. During 2003, lease payments relating to the time charters of theCape BakerandCape Balboawere $1.8 million and $1.0 million respectively.
Contractual Obligations as of December 31, 2003 were:
| 2004 | 2005 | 2006 | 2007 | 2008 and thereafter | Total | |||||||
Long-Term Debt Obligations | 41.6 | 43.5 | 162.6 | 16.3 | 188.6 | 452.6 | ||||||
Operating Lease Obligations | 24.3 | 24.4 | 24.5 | 23.0 | 13.9 | 110.1 | ||||||
Purchase Obligations (newbuildings) | 65.7 | 109.8 | 67.4 | — | — | 242.9 | ||||||
Purchase Obligations (vessel acquisition) | 46.4 | — | — | — | — | 46.4 | ||||||
Total | 178.0 | 177.7 | 254.5 | 39.3 | 202.5 | 852.0 |
24 | ANNUAL REPORT AND ACCOUNTS 2003 |
Fleet Development
The current fleet, as described in more detail in the table below, consists of two VLCCs, four Suezmaxes, tenAframaxes, eight Panamaxes and four Handymaxes. All vessels are owned by subsidiaries of TEN with the exception of the AframaxOlympia, acquired in March 1999 and sold in October 1999 and time chartered back from the owners for an initial period of approximately eight years and the two Suezmaxes,Decathlonand Pentathlon(renamedCape BakerandCape Balboa), acquired in 2002 and sold in October and November2003 respectively and time chartered back from the owners for five years.
Name | Built-DWT-Design | Date Acquired | ||
Millennium | 1998–301,171 dwt – VLCC Double Hull | September 22, 1998 | ||
La Madrina | 1994–299,700 dwt – VLCC Double Hull | January 28, 2004 | ||
Silia T. | 2002-164,286 dwt-Suezmax Crude Carrier Double Hull | June 29, 2002 | ||
Cape Baker | 2002-164,274 dwt-Suezmax Crude Carrier Double Hull | August 19, 2002 | ||
Cape Balboa | 2002-164,236 dwt-Suezmax Crude Carrier Double Hull | October 10, 2002 | ||
Triathlon | 2002-164,445 dwt-Suezmax Crude Carrier Double Hull | December 2, 2002 | ||
Parthenon | 2003-107,018 dwt-Aframax Crude Carrier Double Hull | July 23, 2003 | ||
Marathon | 2003-107,181 dwt-Aframax Crude Carrier Double Hull | January 22, 2003 | ||
Opal Queen | 2001-107,181 dwt-Aframax Crude Carrier Double Hull | March 15, 2002 | ||
Olympia | 1999-107,181 dwt-Aframax Crude Carrier Double Hull | March 25, 1999 | ||
Maria Tsakos | 1998-107,181 dwt-Aframax Crude Carrier Double Hull | July 14, 1998 | ||
Athens 2004 | 1998-107,181 dwt-Aframax Crude Carrier Double Hull | March 12, 1998 | ||
Toula Z. | 1997-107,222 dwt-Aframax Crude Carrier Double Hull | June 27, 1997 | ||
Vergina II | 1991-96,709 dwt-Aframax Crude Carrier Single Hull | December 24, 1996 | ||
Tamyra | 1983-86,843 dwt-Aframax Crude Carrier Single Hull | October 1, 1993 | ||
Panos G. | 1981-86,983 dwt-Aframax Crude Carrier Single Hull | December 23, 1996 | ||
TEN LIMITED | 25 |
Andes | 2003-68,439 dwt-Panamax Product Carrier Double Hull | September 12, 2003 | ||
Aztec | 2003-68,439 dwt-Panamax Product Carrier Double Hull | May 29, 2003 | ||
Inca | 2003-68,439 dwt-Panamax Product Carrier Double Hull | March 20, 2003 | ||
Maya | 2003-68,439 dwt-Panamax Product Carrier Double Hull | January 24, 2003 | ||
Victory III | 1990-68,160 dwt-Panamax Product Carrier Double Hull | December 31, 1996 | ||
Hesnes | 1990-68,157 dwt-Panamax Product Carrier Double Hull | April 22, 1996 | ||
Bregen | 1989-68,157 dwt-Panamax Product Carrier Double Hull | December 12, 1995 | ||
Liberty | 1981-68,375 dwt-Panamax Product Carrier Single Hull | December 23, 1996 | ||
Libra | 1988-41,161 dwt-Handymax Product Carrier Double Side/Single Bottom | December 20, 1994 | ||
Crux | 1987-41,161 dwt-Handymax Product Carrier Double Side/Single Bottom | August 4, 1995 | ||
Pella | 1985-40,231 dwt-Handymax Product Carrier Double Bottom/Single Side | November 16, 1993 | ||
Dion | 1984-40,302 dwt-Handymax Product Carrier Double Bottom/Single Side | October 14, 1993 | ||
Of the twenty-eight vessels currently owned or operated by TEN, twenty are double hull, two are double side/single bottom and two are double bottom/single side. This leaves four vessels that are single hull vessels, representing 11% of the Company’s fleet. At the end of 2003, approximately 55% of the world fleet of tankers was single hull.
In November 2003, the IMO issued new phase out guidelines for older vessels, mainly in response to tough European regulations requiring accelerated phase out. Under the new timetable, Category 1 vessels would be phased out by 2005. TEN has no Category 1 vessels. The eight non-double hull vessels are all Category II vessels and, as such, may continue to operate until the end of their assumed useful lives, 25 years, providing that extra condition assessment surveys are passed at predefined dates. We do not currently intend to operate these vessels for any significant period of time beyond their fourth special surveys. If a favorable opportunity arises at any time during the remaining years, the Company may sell one or more of these vessels. However, if overall market conditions at the time of divestment are soft and the price obtained for the vessels is lower than the carrying value we will incur a loss. We intend to replace these aging tankers with new and second-hand vessels consistent with our fleet modernization program. Our decision on whether to acquire additional tankers will be subject to a number of factors, including our expectations on future market rates, supply and demand within the tanker industry generally and our ability to obtain financing upon favorable terms.
As at December 31, 2003, the market value of the fleet (excluding the three chartered-in vessels) was $765 million, according to valuations received from two independent reputable brokers. On the basis of these valuations and given the very positive market conditions prevailing during the first quarter of 2004, it was determined that no impairment of the carrying value of any vessel, including older vessels, was required.
26 | ANNUAL REPORT AND ACCOUNTS 2003 |
TEN’s strategy had already taken full account of the need to operate modern tankers in an efficient and cost effective manner. The newbuilding program, started in 1997 with the acquisition of the double hull AframaxToula Z(107,222 dwt) built by Imabari Yards of Japan, is designed to ensure that aim. Since then the Company has acquired the sister vesselsAthens 2004,Maria Tsakos,Olympia,Opal Queen,MarathonandParthenon.
Similarly, in 2002, the Company added a new class of vessels to its fleet with the delivery of four double hull Korean built Suezmaxes (164,000 dwt), ordered from Hyundai’s Samho yard (Silia T,Decathlon[renamedCape Baker],Pentathlon[renamedCape Balboa] andTriathlon). In 2003, the Company took delivery of four new Panamaxes of 68,467 dwt, again from the Imabari yard. These tankers are designed to the latest technological standards and are the first tankers capable of passing through the Panama Canal with over 500,000 barrels of clean cargo capacity. The first of these vessels,Maya, was delivered in January 2003, the second,Inca, in March 2003, the third,Aztec, in May 2003 and the last one,Andes, in August 2003.
In December 2003, the Company entered into a contract to acquire the vesselMaersk Estelle, a 299,700 dwt double hull VLCC built in January 1994, for an amount of $51.5 million. The vessel was delivered on January 28, 2004 and was renamedLa Madrina. This was the first second-hand vessel that the Company has acquired since 1997 and it fell within the Company’s criteria for purchasing vessels, (double hull, under ten years old and in excellent condition). The price paid was very competitive and the vessel immediately entered into spot charters in January 2004, earning approximately $100,000 per day.
As at the year end, the Company also had on order three 37,000 dwt Product Carriers to be delivered from the MIPO yard of Hyundai, South Korea, in June 2004, December 2004, and June 2005 and to be namedDelos, DodoniandDionisosrespectively. A further four Suezmaxes were contracted for from Hyundai Heavy Industries of South Korea, two to be delivered in the late 2005 and two in early 2006. The new vessels, all Ice Class 1C, will be namedPromitheas,Proteas,OrfeasandAegeas.
In the first quarter of 2004, the Company ordered from South Korea a series of Ice Class 1A vessels in recognition of the growing importance of Russia as a source of supply. These include four product carriers each of 36,600 dwt from the Hyundai MIPO yard and two Suezmax each of 162,400 dwt from the Hyundai Heavy Industries yard.
Our new buildings on order as of March 31, 2004, were as follows:
Expected Delivery | Hull Type (all double-hull) | Deadweight Tons | Ship Yard | Purchase Price (in US $ millions) | |||||||
HANDYSIZE | |||||||||||
Hull H-228 (Delos) | June 2004 | — | 37,000 | Hyundai MIPO | $ | 25.8 | |||||
Hull H-337 (Dodoni) | December 2004 | — | 37,000 | Hyundai MIPO | $ | 25.8 | |||||
Hull H-339 (Dionisos) | June 2005 | — | 37,000 | Hyundai MIPO | $ | 25.8 | |||||
Hull H-345 | September 2006 | Ice 1A | 36,600 | Hyundai MIPO | $ | 30.0 | |||||
Hull H-346 | December 2006 | Ice 1A | 36,600 | Hyundai MIPO | $ | 30.0 | |||||
Hull H-347 | March 2007 | Ice 1A | 36,600 | Hyundai MIPO | $ | 30.0 | |||||
Hull H-348 | June 2007 | Ice 1A | 36,600 | Hyundai MIPO | $ | 30.0 | |||||
TEN LIMITED | 27 |
Expected Delivery | Hull Type (all double-hull) | Deadweight Tons | Ship Yard | Purchase Price (in US $ millions) | |||||||
SUEZMAX | |||||||||||
Hull H-1617 (Promitheas) | October 2005 | Ice 1C | 164,000 | Hyundai Heavy Industries | $ | 48.1 | |||||
Hull H-1618 (Proteas) | December 2005 | Ice 1C | 164,000 | Hyundai Heavy Industries | $ | 48.1 | |||||
Hull H-1619 (Orfeas) | February 2006 | Ice 1C | 164,000 | Hyundai Heavy Industries | $ | 48.1 | |||||
Hull H-1620 (Aegeas) | May 2006 | Ice 1C | 164,000 | Hyundai Heavy Industries | $ | 48.1 | |||||
Hull H-1708 | March 2007 | Ice 1A | 162,400 | Hyundai Heavy Industries | $ | 57.5 | |||||
Hull H-1709 | June 2007 | Ice 1A | 162,400 | Hyundai Heavy Industries | $ | 57.5 | |||||
| 1,238,200 | $ | 504.8 | |||||||||
Each of our newbuilding contracts allows us to rescind the contract upon the failure of the shipbuilder to satisfy certain provisions, most notably in the case of delivery delays exceeding specified time frames. The builder is then obliged to refund the advances we have paid. There are refund guarantees covering such advances. In the event of default by us, such as our failure to pay instalments, the builder may ultimately rescind the contract and may then sell the vessel, in whatever stage of completion it chooses, and refund to us only the instalments advanced after deducting all related expenses.
Under the newbuilding contracts, the purchase prices for the ships are subject to deductions for delayed delivery, excessive fuel consumption and failure to meet specified deadweight tonnage requirements. We make progress payments equal to 30% or 40% of the purchase price of each vessel during the period of its construction. The remainder of the purchase price with respect to each vessel will be paid upon delivery of the given vessel. As of March 31, 2004, we had made progress payments of $63.3 million out of the total purchase price of approximately $504.8 million for these new buildings. Of the remaining amount, a further $64.4 million will be paid within 2004.
While we intend to expand our fleet, attractive opportunities may arise to sell one or more of our vessels, including the thirteen new buildings we have on order, and our board of directors may conclude that the sale of one or more vessels would be in our best interest.
Assuming no other additions or disposals within 2004, the fleet in operation at the end of 2004 will consist of 30 vessels with a total tonnage of 3.1 million dwt and with an average age of 7.7 years.
Apart from the exception noted above of the VLCC,La Madrina, the Company has invested solely in newbuilding tonnage since 1997. In total, twenty-nine vessels have been or are being built tailor-made to the requirements of the oil majors. Eighteen vessels have or are being built in South Korea and eleven in Japan. During these seven years approximately $1.2 billion in shipyard contracts have been signed, building a fleet that meets the highest regulatory and commercial requirements of the Company’s clients. With a diversified modern fleet, management believes the Company is positioned to service the needs of its customers in the transportation both of crude oil and petroleum products. It believes also that the oil majors would prefer to deal with a limited number of shipping companies with quality vessels of different types with global coverage.
It has also recently been announced that the Company is interested in entering into the LNG sector and has signed a Letter of Intent with a yard for the construction of one large LNG carrier with an option for a second. Management believes that the prospects for such carriers are excellent given the extent of construction of onshore facilities due to come on-line from 2007 onwards in the key natural gas producing areas and recipient consumer countries.
28 | ANNUAL REPORT AND ACCOUNTS 2003 |
The chartering strategy of the Company continues to be one of fixing vessels on medium to long-term employment in order to secure a stable income flow, but one which also ensures a satisfactory return. This strategy has enabled the Company to level the effects of the cyclical nature of the tanker industry. The Company has generated positive results every year, achieving almost optimal utilization of the fleet. In order to capitalize on possible upturns in rates, the Company has chartered out several of its vessels on a market basis. Including the VLCC delivered in January 2004, the Company currently has twenty-three of its twenty-eight vessels on time charter or other form of term employment, ensuring that at least 72% of its 2004 availability and 56% of its 2005 availability is already fixed. The vessels that continue on spot are taking advantage of the strong tanker demand that exists in the first quarter of 2004 and is expected to continue for much of the remainder of the year.
The Board of Directors, through its Chartering Committee, formulates the chartering strategy of the Company and the Company’s commercial manager Tsakos Energy Management implements this strategy through the technical managers, Tsakos Shipping and Trading (Tsakos Shipping), part of the Tsakos Group. They evaluate the opportunities for each type of vessel, taking into account the strategic preference for medium and long-term charters and ensure optimal positioning to take account of re-delivery opportunities at advantageous rates.
The cooperation with the Tsakos Group enables the Company to take advantage of the long-established relationships built by Tsakos with many of the world’s major oil companies and refiners. Tsakos Group has built these relationships over thirty-four years of existence and high quality commercial and technical service. Tsakos Shipping, manages the vessels of TEN plus another thirty-three vessels, mostly container vessels and single hull tankers. Apart from the customer relations, TEN is also able to take advantage of the inherent economies of scale associated with a large fleet manager and its commitment to contain running costs without jeopardizing the vessels’ operations. It provides top grade officers and crew for the Company’s vessels and first class superintendent engineers and port captains to ensure that the vessels are in prime condition.
The vessels of the fleet are currently operating as follow:
| • | MILLENNIUMremains bare boat chartered to a leading far eastern corporation having completed five years of a 15-year charter. |
| • | LA MADRINAis currently operating in the spot market for account of various first class charterers. |
| • | SILIA T.is currently on a one-year extension of a time charter with a major charterer. |
| • | CAPE BAKERis currently in the first year of a three year time charter at a fixed rate to a leading South American state oil corporation. |
| • | CAPE BALBOAis currently in the first year of a three year time charter with a minimum base rate and profit sharing agreement to a leading South American state oil corporation. |
| • | TRIATHLONis currently in the first year of a seven-year time charter at a minimum base rate and profit sharing with a major U.S. oil corporation. The charterer has an option for three more years. |
| • | PARTHENONis currently operating in the spot market for account of various first class charterers. |
| • | MARATHONis trading in the Caribbean-U.S. Gulf area under a contract of affreightment for account of a major US refinery. The vessel’s rate is based on market rates prevailing two weeks prior to the beginning of each voyage. |
| • | OLYMPIAis currently in the first year of a two-year time charter for account of a major US refinery. |
TEN LIMITED | 29 |
| • | MARIA TSAKOSis currently operating in the spot market for account of various first class charterers. |
| • | ATHENS 2004continues to trade in the Caribbean-U.S. Gulf area under a contract of affreightment for account of a major U.S. refinery. The vessel’s rate is based on market rates prevailing two weeks prior to the beginning of each voyage. |
| • | TOULA Z.is trading in the Caribbean-U.S. Gulf area under a contract of affreightment for account of a major U.S. refinery. The vessel’s min-max rate is based on a market related formula. |
| • | OPAL QUEENis in the final months of a charter with a major far eastern concern. |
| • | VERGINA IIis in the first year of a two-year time charter with a major charterer. |
| • | TAMYRAhas been operating in the spot market for account of various first class charterers. |
| • | PANOS G.is on a short-term time charter with a far eastern state oil company. |
| • | VICTORY IIIis in the last year of time employment with a South American oil major. |
| • | HESNEShas since July 2001 been participating in a pool of Panamax tankers. The vessel’s earnings are market related. |
| • | BREGENhas since July 2002 been participating in a pool of Panamax tankers. The vessel’s earnings are market related. |
| • | LIBERTYis currently operating in the spot market for account of various first class charterers. |
| • | MAYAis in the first year of a 26-month time charter for a South American state oil corporation. |
| • | INCAis the first year of a 26-month time charter for a South American state oil corporation. |
| • | AZTECis operating under a 12-month time charter for a South American state oil corporation. |
| • | ANDESis employed in a pool of Panamax tankers. The vessel’s earnings are market related. |
| • | LIBRAis in the first year of a 3-year time charter for account of a major North American charterer. |
| • | CRUXis in the first year of a 16-month time charter for account of a major charterer. |
| • | PELLAis completing an 18-month time charter for account of a major South American charterer. |
| • | DIONis on a one-year time charter for account of a major charterer. |
30 | ANNUAL REPORT AND ACCOUNTS 2003 |
NEWBUILDING PROGRAM IN THE YEAR 2003
Deliveries
TEN’s fleet renewal and growth, expanded further in 2003. The Company took delivery of six modern, double hull tankers; two Aframax and four Panamax tankers all built by Imabari Koyo Dockyard in Japan. All vessels are custom made to TEN’s clients’ requirements.
Aframax tankers
| • | Hull Number 8019, namedParthenonon July 23, 2003. |
| • | Hull Number 1388, namedMarathonon January 22, 2003. |
These tankers are sister vessels to five modern Aframax tankers (Toula Z, Maria Tsakos, Athens 2004, OlympiaandOpal Queen) that the Company also built in Imabari and took delivery from 1997 until 2001.
Parthenon is classed under the Det Norske Veritas while Marathon under the American Bureau of Shipping (ABS). Both vessels are under the Greek flag. Principles of design include:
| • | Fully coated ballast tanks |
| • | Full redundancy of auxiliary machinery |
| • | Full compliance with all Oil Majors requirements |
| • | High specification design that ensures excellent manoeuvrability |
| • | Environmentally friendly, superseding all environment protection applicable requirements |
| • | Full compliance with OPA 90 (Oil Pollution Act) regulations. |
Panamax tankers
| • | Hull Number 2160, namedMayaon January 24, 2003. |
| • | Hull Number 2161, namedIncaon March 20, 2003. |
| • | Hull Number 2162, namedAztecon May 29, 2003. |
| • | Hull Number 2163, namedAndeson September 12, 2003. |
All four vessels are sister vessels in design and metrics. They are classed under Lloyds Register and fly the Greek Flag. Principles of design include:
| • | High specification double hull product carrying vessels |
| • | First vessels to transport above 500,000 US barrels of clean products through the Panama Canal |
| • | Highest discharge output in vessel category |
| • | Fully coated ballast tanks |
| • | Full redundancy of auxiliary machinery |
| • | Full compliance with all Oil Majors requirements |
| • | High specification design that ensures excellent manoeuvrability |
| • | Environmentally friendly |
| • | Full compliance with OPA 90 (Oil Pollution Act) regulations. |
TEN LIMITED | 31 |
Vessels under construction
In 2003, TEN placed new orders for six high specification double hull tankers. Two of the vessels ordered are Handysize 37,000 dwt Product/Chemical tankers and four are Suezmax 164,000 dwt (1C Ice-Class) tankers. The two Handysize tankers are built by Hyundai Mipo Dockyard in South Korea, and the four Suezmax tankers by Hyundai Heavy Industries also in South Korea. The Company expects to take delivery of these vessels during 2004-2006.
Handysize tankers ordered in 2003 – 2 vessels
In March and April 2003 TEN singed orders for two Handysize tankers with Hull Numbers 337 (named:Dodoni) and 339 (named:Dionisos) at Hyundai Mipo Dockyard in South Korea. These vessels are sister vessels to Hull Number 228 (named:Delos). The shipbuilding contract for Hull Number 228 was signed on November 2002. A Company associated with the Tsakos Group has an order for Hull Number 229 (to be named:Delphi) at the same yard with expected delivery October 2004. Pursuant to TEN’s right of first refusal on any tanker 10 years or younger that the Tsakos Group could be offered in the market, TEN has an open option on Hull Number 229. As we come closer to the vessel’s expected delivery in October 2004, the Board of Directors of TEN will decide if TEN will exercise the option or not. The option price will be market related based on valuation from two independent renowned shipbrokers. The vessels will be classed with Lloyds Register (LRS) and will fly the Greek flag. Principles of design include:
| • | Oil product and chemical 37,000 dwt carriers |
| • | Six grades of segregation |
| • | Largest volume capacity for vessels of their category/size |
| • | Fully coated ballast tanks |
| • | Fully coated cargo tanks |
| • | Capable of carrying all IMO 3 type products and all products of crude oil |
| • | Full redundancy of auxiliary machinery |
| • | Full compliance with all Oil Majors requirements |
| • | Compliance with all class and industry provisions, notations and requirements, purporting to the protection of the environment. |
| • | Full compliance with OPA 90 (Oil Pollution Act) regulations. |
Suezmax tankers ordered in 2003 – 4 vessels
| • | Hull Number 1617, namedPromitheasto be delivered during October 2005 |
| • | Hull Number 1618, namedProteasto be delivered during December 2005 |
| • | Hull Number 1619, namedOrfeasto be delivered during February 2006 |
| • | Hull Number 1620, namedAegeasto be delivered during May 2006 |
The shipbuilding contract for the first two vessels was signed in July 2003 and for the second two vessels in September 2003. All four tankers are sister vessels with 164,000 dwt capacity and ice class capabilities (1C notation). All vessels will fly the Greek flag and will be classed under Lloyds Register (LRS). Principles of design include:
| • | Sister vessel design with the four 2002 Hyundai Samho built Suezmaxes (Silia T., Cape Baker, Cape BalboaandTriathlon). |
| • | Carrying capacity of over 1.1 million US barrels of crude oil. |
32 | ANNUAL REPORT AND ACCOUNTS 2003 |
| • | Highest intake capability for even very heavy crude oil (maximum in the market) without compromising economic operation. |
| • | Maximum lifting capacity at even shallow drafts due to 50 meter beam. |
| • | Full redundancy of auxiliary machinery |
| • | Full compliance with all Oil Majors requirements |
| • | Environmentally friendly |
| • | Full compliance with OPA 90 (Oil Pollution Act) regulations. |
As of March 31, 2004, the Company has six more newbuilding tankers on order for delivery during 2006-2007. Four are Handysize 37,000 dwt Product/Chemical tankers (Hull Numbers 345, 346, 347, 348) and two are Suezmax 162,400 dwt tankers (Hull Numbers 1708 and 1709). All six vessels are built to the highest ice class standard currently available 1A and adhere to the Finnish Maritime Authority (FMA) standards, which ensure high structure strength for operation in areas with heavy ice presence.
Since 1997 the Company has ordered twenty-nine newbuilding tankers (one VLCC, ten Suezmax, seven Aframax, four Panamax, and seven Handysize tankers) totalling 3,220,808 dwt.
All vessels currently under construction in their respective vessel category/size (for example currently the Suezmax and Handysize under construction) are sister vessels with the vessels of the same category/size if all of them are built after 1997. Each subsequent vessel in the series incorporates customer specific design enhancements to TEN’s shipbuilding specification.
In April 2004 TEN announced the signing of a Letter of Intent (LOI) for the construction of one option one LNG tankers of 145,000 cm3 capacity for delivery during the second half of 2007.
TEN LIMITED | 33 |
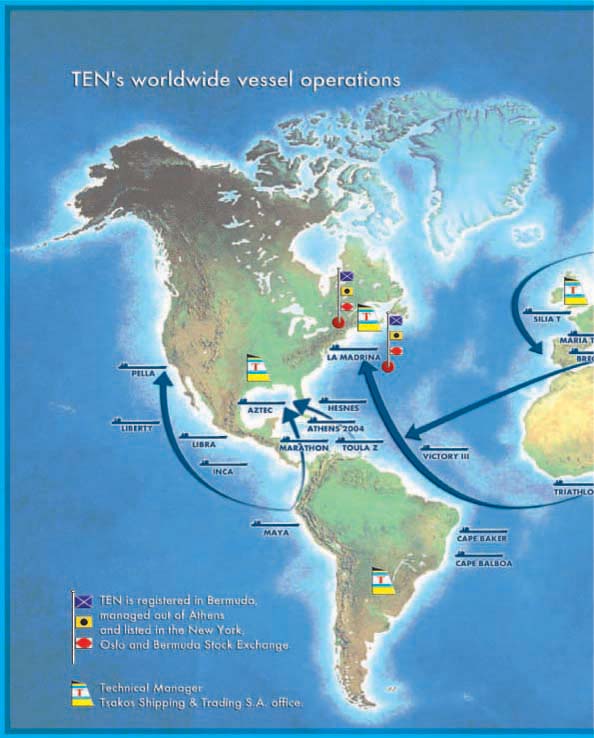
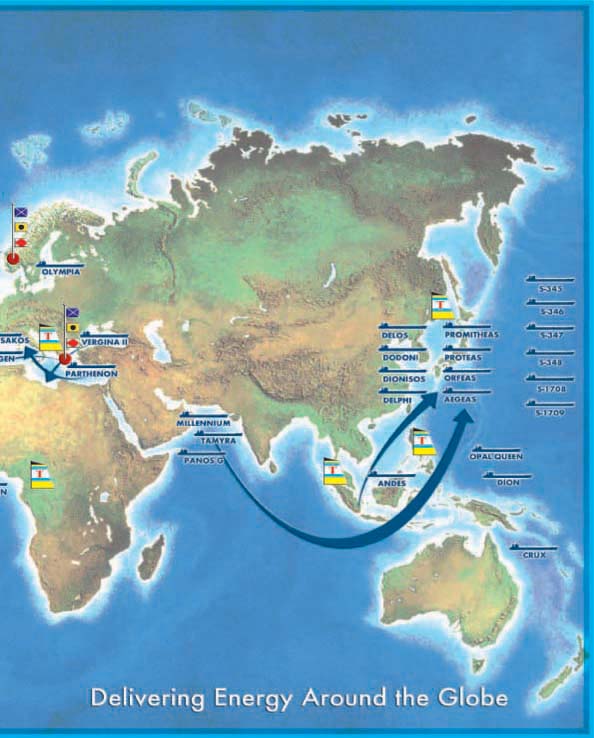
GENERAL MARKET OVERVIEW - SUPPLY and DEMAND
The general malaise that was the hallmark of global oil consumption in 2002 saw significant signs of abatement as that year closed out. As rates continued to climb, 2003 began, and with it, the healthiest rate environment that the industry had seen in many years. Enhanced by a nascent economic recovery in the US and other Western nations, as well as a cold winter in the northern hemisphere, 2003 would prove to be a record year for the tanker industry.
Compared with 2002, average OPEC oil production in 2003 increased by approximately1.5 million barrels per day (“b/d”) to about 27 million b/d. At the current time, OPEC oil production, including Iraq, is estimated at about 27 million b/d. This number continues to be above stated quota levels in spite of consistent assurances from OPEC that production would be curtailed. In February of 2004, OPEC announced that it would curtail production by 1 million b/d. This came on the heels of an oil production cut effective November 1, 2003, which was never fully implemented. OPEC oil producers stated that this latest decision was made in an effort to stem the expected seasonal decrease during the second quarter.
Overall, world oil demand increased at a healthy rate in 2003. The 2.0% increase, which translates to about 1.45 million b/d, significantly outpaced gains in the years 1999-2002. While there were many factors that contributed to this worldwide growth, economic recoveries and activity in the United States, Latin America, China and Southeast Asia were the key drivers of rates in 2003.
Looking forward, based on the IEA’s latest report, price expectations through 2004 average $33 per barrel for crude oil. Compounded by the lack of clarity over production from Iraq, continued political unrest in Venezuela and continued commentary by the Organization of Petroleum Exporting Countries (OPEC) about their production levels, oil price increases could be the norm, rather than the exception in 2004.
Currently, petroleum inventories remain low, particularly in the United States. The IEA also reported that it is expected that these levels will remain at only slightly above minimum levels for at least the next 24 months. Oil inventories are expected to increase in the first half of 2004, but decrease in the later part of the year, leveling out to 2003 year-end levels by the end of 2004.
While it is expected that OPEC-10 (OPEC minus Iraq) will take the necessary steps to curb production to keep oil prices at healthy levels, these cuts are not expected to be as radical as once projected. As such, the current annual OPEC crude oil production should maintain current levels, at approximately 27 million barrels per day. This should allow inventories to build, albeit at a slower pace.
Also factoring into the buildup of inventories is the non-OPEC oil supply, which includes the states of the Former Soviet Union as well as sources in West Africa, among others. It is expected that even if OPEC should significantly cut production, that there will be alternative sources of oil that will keep the supply side amply serviced to meet increasing demand.
The expected increasing demand in China and India will also factor heavily into worldwide consumption and demand. The forecast rate of growth 2.1% would be among the highest in several years. The dynamics at work in India, China, and the Pacific Rim bode well for transportation requirements for petroleum and its products in the coming months and years.
In 2003, annual world oil demand grew 2.0%. Expectations are that worldwide demand in 2004 and 2005 will outpace this rate of growth, indicating that the tanker markets could continue to benefit from a strong rate environment. Another indication of the strength of the market can be seen in continued demand despite price hikes. Historically, as oil prices have risen, some global consumers have been forced to curtail imports. However, in the current environment, it has been observed that price has not dissuaded imports, and in fact in some instances, demand has actually increased.
36 | ANNUAL REPORT AND ACCOUNTS 2003 |
2004 should once again prove to be a strong year for the tanker companies. The aforementioned economic stimuli, coupled with geopolitical events in areas such as Nigeria, Iraq and Venezuela, should fuel the market. Additionally, the new IMO and European Union regulation will have a significant impact on the rate environment. On the horizon, there is the specter of a growing orderbook. The level of scrapping that is observed as well as the increase in oil demand worldwide will be the key factors in the delicate supply and demand balance.
World seaborne trade in crude and refined products was up by 5 to 6%, according to preliminary estimates based on export as well as import data. This growth was driven primarily by an 8.5% growth out of the Middle East, 17% growth from North Africa and 15% growth from the FSU. Imports of seaborne oil were up 33% to China, 6% to Japan and 6% to the USA. These three countries were responsible for 90% of the rise in total volumes, China alone for one third. Imports to Europe and South Korea were unchanged. There was approximately a 6% growth in crude trades and 3% in refined products. During 2003 there was an increase in transport distances, changes in the productivity of the fleet (fleet modernization, the Prestige effect and the congestion in the Black sea). As a result tonnage demand grew by approximately 7.5% in 2003.
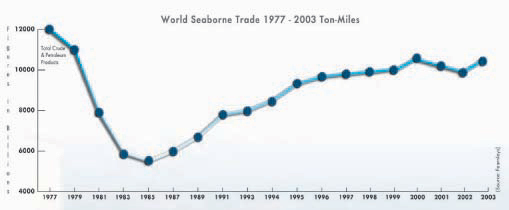
TEN LIMITED | 37 |
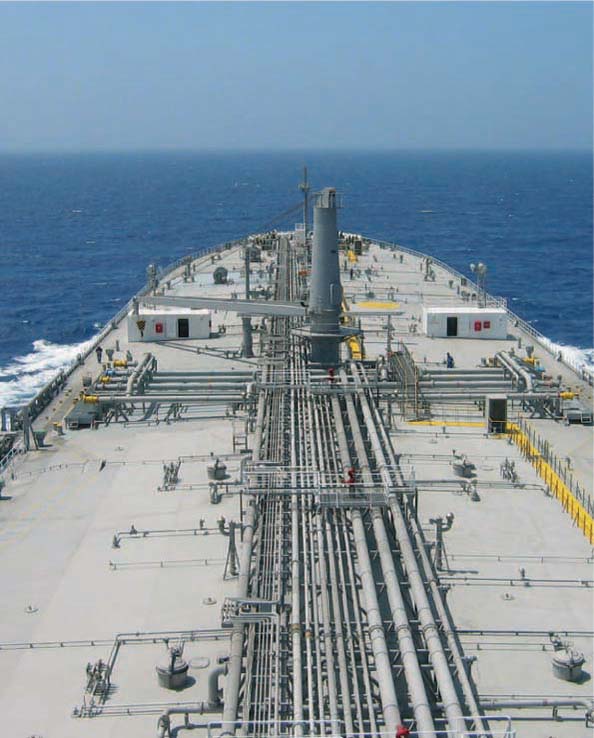
WORLD TANKER FLEET
The supply side should experience modest growth in overall tanker capacity over the next several years. Limits on shipyard capacity and regulatory encouragement for early retirement of tonnage, supported by unusually high scrap values, are reasons for optimism about tanker industry prospects. Growing charterer selectivity that has, and will, promote solid demand for well managed, modern tonnage, further supports these fundamentals. It is reasonable to expect that the usual seasonal decline in the spring, summer, and fall could have less impact than normal in 2004.
Fleet Development
The world tanker fleet exhibited healthy growth in 2003. Overall, the world fleet increased 3.8%, or 10.7 million dwt, over 2002 year-end levels to 290 million dwt. The orderbook continues to build, however, and there are several factors that will determine if these levels are healthy for the industry. Currently, scrapping levels have been low, as the healthy rate environment does not justify the scrapping of older vessels. Even with the new IMO regulations, many of the older vessels in the current world fleet are continuing to earn premium rates, which have boosted the earnings of the tanker companies. At the end of 2003, the tanker orderbook totaled about 79.6 million dwt, or 27.4% of the existing fleet at the end of 2003.
Recycling
It is expected that new IMO and European Union (“EU”) regulations, which will accelerate the phase-out of single hull tankers, will have an effect on the current large tanker orderbook. On October 21, 2003 the EU’s newly adopted tanker regulations became effective. As a result, single hull tankers were immediately banned from carrying heavy fuel oil in EU waters. This will accelerate the phase-out of single hull tankers with phase-out dates depending upon the year of construction and whether the tanker has segregated ballast tanks, and force all single hull tankers to comply with the Condition Assessment Scheme (“CAS”) from the age of 15 years, commencing in 2005.
At the close of 2003, the world tanker fleet still reflected a large number of aging vessels. While the orderbook will certainly offset some of the mandatory scrapping and retirement that will inevitably occur, as of December 31, 2003, approximately 14%, or 40.4 million dwt, of the world tanker fleet was 20 or more years old. This includes 15.6 million dwt or 5.4% of the fleet, which was 25 or more years old.
In spite of the strong rate environment, deletions from the world fleet totaled approximately 20 million dwt in 2003. Overall, between the years of 1999 and 2003, 90.5 million dwt were eliminated. Due to the aforementioned regulations and the aging of the current fleet, it can be expected that tanker scrapping will be at higher levels over the next several years.
TEN LIMITED | 39 |
VESSEL PRICES
Vessel Prices for all classes of vessel experienced significant gains in 2003. The strong rate environment, increase in demand for tonnage as well as the need to modernize fleets to meet new regulation were all contributing factors to the high value of new and second hand tonnage.
New Buildings
New buildings were certainly the top order of business in 2003 as 49 million dwt were contracted. This is a level not seen since the early 1970s. Coupled with the similar demand for new bulk carriers and containerships, the Asian ship building yards saw huge increases in their orderbooks.
By the end of 2003, available berth space had been contracted and accounted for through 2007, with at least a three-year backlog. As a result, average time from contract to delivery is also increasing.
Spurred on by the tremendous increase in orders, prices, of course, followed suit. Prices increase from 20 to 30% across the board, and no vessel class was exempt. This condition was also exacerbated by the rising price of steel. Even though prices came down somewhat in the second quarter of 2003, they gradually rose during the second half, adding additional cost to new contracts. As we moved into 2004, steel availability and quality continues to be a concern, which could add time and money to contracts.
Overall, order activity in the tanker segment was very high. And bigger vessels were took the largest share of the order book with aframaxes and larger accounting for more than half of the 495 orders placed in 2003.
In the VLCC market, 51 vessels accounting for 15.6 million dwt were ordered. Prices were up over 22% for the year, topping out at about $78 million by year-end. In terms of new deliveries, 35 VLCCs were received by their owners in 2003.
For Suezmaxes, 55 tankers equating to 8.7 million dwt were ordered. Again, this class experience significant price appreciation, up as much as 24% to approximately $54 million. 27 new suezmaxes were delivered in 2003.
The Aframax segment saw significant growth with 159 new contracts or 15.2 million dwt being added to the orderbook. Again, price increases were large, about 30%, and ended the year at about $44 million per vessel. New vessel deliveries in 2003 totaled 97 vessels for the Aframax class.
Smaller tankers, including product carriers, accounted for 230 vessels for a total of 10 million dwt. These vessels also saw a price run up of between 22 and 24%, finishing the year at approximately $32 million per vessel. Product carriers totaling 99 vessels or 4.2 million dwt were delivered in 2003.
Korean yards increased their deliveries by 6% in 2003. Korean capacity was used almost exclusively for tanker building, increasing 2.1 million dwt to 16.7 dwt for the year. Korea also doubled its production of Liquefied Natural Gas carriers (LNG), completing 10 vessels in 2003 compared to 5 in 2002. Korean yards also remained very aggressive in this segment, taking on 12 of 14 new orders in 2003. While the Koreans continue to increase their competitiveness in 2003, increases in steel prices could affect their competitive rates going forward.
Japanese shipyards also saw a growth rate of 6% for their deliveries in 2003. Tanker deliveries increased 35% to 9.1 million dwt. However, the Japanese saw a decline in their share of newbuilding orders gaining only 27% as opposed to the 40% share they enjoyed in 2002. Competition from Chinese shipyards certainly had an impact on these numbers. Overall, 64% of Japanese orders came from domestic accounts, which has been a pivotal component of the Japanese shipbuilding industry.
40 | ANNUAL REPORT AND ACCOUNTS 2003 |
China maintained its 11% market share that it enjoyed in 2002 in 2003. However, deliveries were up a total of 97% to 2.6 million dwt. This is a market that is certainly growing, and will have a significant impact on pricing and market share over the coming years. China increased the amount of newbuilding contracts that it secured from 10% in 2002 to 14% in 2003, including 16% of all new buildings in the tanker market representing 8 million dwt.
In Europe, 2003 saw the region account for 18% of world deliveries. Italy was the largest contributor at 19% followed by Germany, Spain and Poland. European shipbuilders capitalized on the growing orderbook, growing their new orders by 87%. However, in spite of this dramatic rise, their new orders accounted for only 9.2% of total demand, down from 9.5% a year earlier. Also of note was the fact that while their Asian counterparts were filled to capacity, European yards had only managed to fill 60 percent of their berths for 2005.
Estimated New Building Tanker Prices
Type | Size (dwt.) | 1998 ($m) | 1999 ($m) | 2000 ($m) | 2001 ($m) | 2002 ($m) | 2003 ($m) | |||||||
Products | 45,000 | 25.00 | 25.00 | 28.50 | 28.80 | 26.00 | 32.00 | |||||||
Aframax | 95 -105,000 | 33.00 | 33.00 | 41.00 | 40.00 | 34.50 | 44.00 | |||||||
Suezmax | 150,000 | 42.00 | 42.00 | 51.00 | 50.00 | 44.50 | 54.00 | |||||||
VLCC | 280,000 | 70.00 | 68.00 | 76.00 | 75.00 | 65.50 | 78.00 |
(Source: Fearnresearch Fearnleys AS)
Secondhand Values
After low activity in the sale and purchase market in 2002, volumes recovered strongly in 2003, which was one of the most active years for decades. In line with the very strong freight market, secondhand tanker values rose substantially in 2003. On average there was a 15% rise in values over the year. Double hull tankers rose by approximately 20%. The firm new building market with rapidly increasing prices and more than three years delivery time also contributed to a sharp upturn in secondhand values.
Estimated Second Hand Tanker Prices
Type - | Year Built | Size (dwt.) | 2000 ($m) | 2001 ($m) | 2002 ($m) | 2003 ($m) | ||||||
Products - | 5 years | 40,000 | 26.5 | 25.5 | 24.0 | 26.5 | ||||||
Aframax - | 5 years | 95,000 | 39.0 | 33.0 | 30.0 | 36.0 | ||||||
Suezmax - | 5 years | 130,000 | 49.5 | 43.0 | 41.5 | 44.5 | ||||||
VLCC - | 5 years | 300,000 | 71.0 | 60.0 | 53.0 | 64.0 |
(Source: Fearnresearch Fearnleys AS)
TEN LIMITED | 41 |

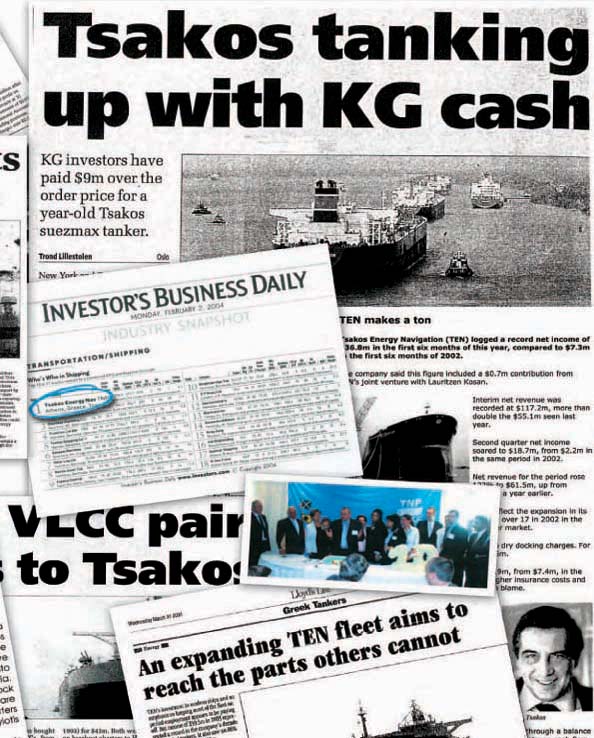
VESSEL EARNINGS
Tanker Demand
The tanker market in 2003 was a watershed year for the industry. A confluence of events including new regulations, a very cold winter in the northern hemisphere and low inventories created a market dynamic that helped to boost the profits of tanker owners across the world. This is diametrically opposed to the market in 2002 where we witnessed an unpredictable market, driven by factors outside the usually supply and demand equation. Even the usual seasonal decline in the third quarter was softened by the incredible demand for crude oil around the world. And, as we move through 2004, while rates have retreated somewhat, it is expected that the tanker industry will continue to see a healthy environment in which to operate.
Demand for all tankers increased at an extremely healthy 7.5% for 2003. With the exception of modest decline in the size of the world Panamax fleet, all other segments, including VLCC, Aframax and Suezmax, showed at least modest gains. The incredible rate environment that began in the fourth quarter of 2002 continued through the entirety of 2003.
The beginning of an economic recovery in the US, and to some degree, in Europe, as well as another cold winter in the Northern Hemisphere helped to keep the demand side of the equation dramatically above the levels of 2002. While the war in Iraq did play a part in the rate environment, overwhelmingly, low inventories were the driving force behind the strength of the market. Coupled with the rising demand in the Pacific Rim, and specifically China, 2003 was a great year for all classes of vessel.
VLCC
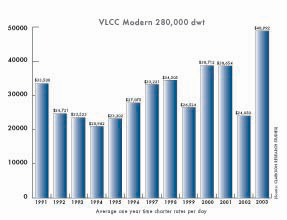
The VLCC fleet currently consists of 436 vessels, of which 58%, or 253 are equipped with double hulls. The bulk of the single hulled vessels are between 10 and 15 years old, but overall, only 55 vessels are older than 15 years. In 2003, the active VLCC fleet did not increase, with new deliveries balancing with the disposal of older vessels.
Spot rates for VLCCs in 2003 were at extremely high levels, with the average coming in at $49,000 per day. After a correction in the spot market that took rates down to as low as $21,000 in October of 2003, the market rebounded decisively driving spot rates up to $97,000 per day in January of this year. While the market has trended downward, there is still great earnings strength in the VLCCs, and this should provide significant upside for owners during 2004.
44 | ANNUAL REPORT AND ACCOUNTS 2003 |
Suezmax
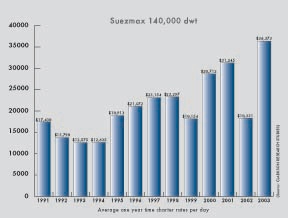
The current suezmax fleet consists of 208 double hulled tanker and 92 with single hulls. This is one of the youngest classes of vessel, with only 35 of 300 over 20 years of age.
The Suezmax market was also incredibly strong in 2003, with average spot earnings of over $36,000 per day. Like VLCCs, the market declined in October of 2003 to $26,000, but then rebounded to fantastic levels in early 2004 at $92,000 per day. The market has relaxed somewhat, but is still above $50,000.
On the timecharter side, rates improved aggressively by 1.8%. This was driven in large part by the delays in the Bosphorous, strong winter demand, and a preference by charterers for Suezmaxes over VLCCs due to freight differentials.
Aframax
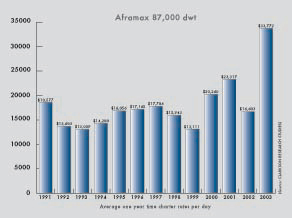
The world aframax fleet currently numbers 611 vessels, and 29% are older than 15 years. The average age for this vessel class is 10.5 years.
The demand for aframax vessels was very strong in 2003, but this class of vessel has enjoyed a very strong run over the last several years. Spot earnings peaked in 2003 at a catastrophic $64,000 per day, as compared to the ten-year average of just above $20,000 per day. Because of this strong rate environment, which has abated somewhat, but is still close to $40,000 per day, scrapping has been low.
TEN LIMITED | 45 |
Products
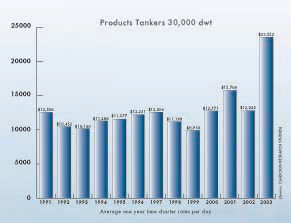
Overall, the product tanker fleet increased worldwide by 8.2% from the end of 2002 to 52.9 million dwt. This market also saw significant growth in 2003, with average TCE rates up more than 50% year over year in some markets. The expanding market for this class of vessel in the Pacific Rim and the US drove demand up. Even though the fleet grew substantially, demand kept adequate pace throughout the year, and freight rates continue at a very high levels so far in 2004. Increasing consumption, and the supply/demand equation of refinery capacity in consumption vs. export regions drove a significant increase in tonne-miles, above 5%.
46 | ANNUAL REPORT AND ACCOUNTS 2003 |
TSAKOS ENERGY NAVIGATION LIMITED
AND SUBSIDIARIES
CONSOLIDATED FINANCIAL STATEMENTS
DECEMBER 31, 2002 AND 2003
TOGETHER WITH REPORT OF INDEPENDENT AUDITORS
TEN LIMITED | 47 |
( - This page is blank intentionally - )
TSAKOS ENERGY NAVIGATION LIMITED AND SUBSIDIARIES
INDEX TO CONSOLIDATED FINANCIAL STATEMENTS
| Page | ||
Report of Ernst & Young, Independent Auditors | F-1 | |
Report of Arthur Andersen, Independent Auditors | F-2 | |
Consolidated Balance Sheets as of December 31, 2002 and 2003 | F-3 | |
Consolidated Statements of Income for the years ended December 31, 2001, 2002 and 2003 | F-5 | |
Consolidated Statements of Stockholders’ Equity for the years ended December 31, 2001, 2002 and 2003 | F-6 | |
Consolidated Statements of Cash Flows for the years ended December 31, 2001, 2002 and 2003 | F-7 | |
Notes to Consolidated Financial Statements | F-8 | |

REPORT OF INDEPENDENT AUDITORS
To the Shareholders and the Board of Directors of
TSAKOS ENERGY NAVIGATION LIMITED
We have audited the accompanying consolidated balance sheets of TSAKOS ENERGY NAVIGATION LIMITED, and subsidiaries (“the Company”), as of December 31, 2003 and 2002 and the related consolidated statements of income, stockholders’ equity and cash flows for the two years then ended. These financial statements are the responsibility of the Company’s management. Our responsibility is to express an opinion on these financial statements based on our audit. The consolidated financial statements of the Company as of December 31, 2001 and for the year then ended were audited by other auditors who have ceased operations as a foreign associated firm of the Securities and Exchange Commission Practice Section of the American Institute of Certified Public Accountants. Those auditors expressed an unqualified opinion on those financial statements in their report dated February 25, 2002.
We conducted our audits in accordance with the auditing standards generally accepted in the United States. Those standards require that we plan and perform the audit to obtain reasonable assurance about whether the financial statements are free of material misstatement. An audit includes examining, on a test basis, evidence supporting the amounts and disclosures in the financial statements. An audit also includes assessing the accounting principles used and significant estimates made by management, as well as evaluating the overall financial statement presentation. We believe that our audits provide a reasonable basis for our opinion.
In our opinion, the consolidated financial statements referred to above present fairly, in all material respects, the consolidated financial position of TSAKOS ENERGY NAVIGATION LIMITED and its subsidiaries at December 31, 2003 and 2002 and the consolidated results of their operations and their cash flows for the two years then ended, in conformity with accounting principles generally accepted in the United States.

Athens, Greece
February 27, 2004
F-1
The audit report of Arthur Andersen, our former independent public accountants, which is set forth below, is included in this Report for purposes of including the opinion of Arthur Andersen on our financial statements for the years ended December 31, 2001. Our financial statements for the fiscal years ended December 31, 2002 and 2003, have been audited by and are reported on by Ernst & Young on page F-1 of this Report.
The audit report set forth below is a copy of the original audit report dated February 25, 2002 rendered by Arthur Andersen which has not been reissued by Arthur Andersen since that date. We are including this copy of the February 25, 2002, Arthur Andersen audit report pursuant to Rule 2-02(e) of Regulation S-X under the Securities Exchange Act of 1934. Your ability to assert claims against Arthur Andersen based on its report may be limited.
REPORT OF INDEPENDENT PUBLIC ACCOUNTANTS
To:
TSAKOS ENERGY NAVIGATION LIMITED
We have audited the accompanying consolidated balance sheets of TSAKOS ENERGY NAVIGATION LIMITED, a Bermuda company, and Subsidiaries (collectively, the “Company”), as of December 31, 1999, 2000 and 2001 and the related consolidated statements of income (loss), stockholders’ equity and cash flows for each of the three years in the period ended December 31, 2001. These financial statements are the responsibility of the Company’s management. Our responsibility is to express an opinion on these financial statements based on our audits.
We conducted our audits in accordance with the United States generally accepted auditing standards. Those standards require that we plan and perform the audit to obtain reasonable assurance about whether the financial statements are free of material misstatement. An audit includes examining, on a test basis, evidence supporting the amounts and disclosures in the financial statements. An audit also includes assessing the accounting principles used and significant estimates made by management, as well as evaluating the overall financial statement presentation. We believe that our audits provide a reasonable basis for our opinion.
In our opinion, the financial statements referred to above present fairly, in all material respects, the financial position of TSAKOS ENERGY NAVIGATION LIMITED and its Subsidiaries as of December 31, 1999, 2000 and 2001 and the results of their operations and their cash flows for each of the three years in the period ended December 31, 2001, in conformity with the United States generally accepted accounting principles.

Athens, Greece
February 25, 2002
F-2
TSAKOS ENERGY NAVIGATION LIMITED AND SUBSIDIARIES
CONSOLIDATED BALANCE SHEETS
December 31, 2002 and 2003
(Expressed in thousands of U.S. Dollars – except per share data)
| 2002 | 2003 | |||||||
ASSETS | ||||||||
CURRENT ASSETS: | ||||||||
Cash and cash equivalents | $ | 39,674 | $ | 86,813 | ||||
Cash, restricted | 7,000 | — | ||||||
Receivables – | ||||||||
Trade accounts receivable, net | 12,244 | 13,401 | ||||||
Insurance claims | 3,277 | 2,749 | ||||||
Due from related companies (Note 3) | 3,824 | 3,836 | ||||||
Advances and other | 5,175 | 5,586 | ||||||
| 24,520 | 25,572 | |||||||
Inventories (Note 4) | 3,275 | 3,381 | ||||||
Prepaid insurance and other | 1,283 | 1,205 | ||||||
Total current assets | 75,752 | 116,971 | ||||||
INVESTMENT (Note 2(l)) | 10,577 | — | ||||||
FIXED ASSETS: | ||||||||
Advances for vessels under construction and acquisitions (Note 5) | 41,963 | 33,420 | ||||||
Vessels (Notes 6 and 8) | 670,452 | 800,870 | ||||||
Accumulated depreciation (Note 6) | (117,309 | ) | (146,208 | ) | ||||
Vessels’ Net Book Value | 553,143 | 654,662 | ||||||
Total fixed assets | 595,106 | 688,082 | ||||||
DEFERRED CHARGES, net (Note 7) | 13,110 | 20,454 | ||||||
Total assets | $ | 694,545 | $ | 825,507 | ||||
The accompanying notes are an integral part of these consolidated financial statements.
F-3
TSAKOS ENERGY NAVIGATION LIMITED AND SUBSIDIARIES
CONSOLIDATED BALANCE SHEETS
December 31, 2002 and 2003
(Expressed in thousands of U.S. Dollars – except per share data)
| 2002 | 2003 | |||||||
LIABILITIES AND STOCKHOLDERS’ EQUITY | ||||||||
CURRENT LIABILITIES: | ||||||||
Current portion of long-term debt (Note 8) | $ | 30,211 | $ | 41,602 | ||||
Accounts payable – | ||||||||
Trade | 14,804 | 15,609 | ||||||
Due to related companies (Note 3) | 2,384 | 3,326 | ||||||
Other | — | 1,825 | ||||||
| 17,188 | 20,760 | |||||||
Accrued liabilities | 6,731 | 6,112 | ||||||
Accrued bank interest | 1,385 | 2,276 | ||||||
Financial Instruments – Fair value (Notes 11 and 16) | 7,838 | 5,097 | ||||||
Unearned revenue | 2,003 | 3,611 | ||||||
Deferred Income, current portion (Note 10) | 838 | 4,005 | ||||||
Total current liabilities | 66,194 | 83,463 | ||||||
LONG-TERM DEBT, net of current portion (Note 8) | 355,741 | 411,018 | ||||||
DEFERRED INCOME, net of current portion (Note 10) | 5,166 | 16,457 | ||||||
STOCKHOLDERS’ EQUITY: | ||||||||
Common stock, $1.00 par value; 40,000,000 shares authorized at December 31, 2002 and 2003; 17,022,723 and 17,151,623 issued and outstanding at December 31, 2002 and 2003, respectively | 17,023 | 17,152 | ||||||
Additional paid-in capital (Notes 9 and 12) | 202,862 | 203,631 | ||||||
Other comprehensive income/(loss) | (629 | ) | (1,431 | ) | ||||
Retained earnings | 48,188 | 95,217 | ||||||
Total stockholders’ equity | 267,444 | 314,569 | ||||||
Total liabilities and stockholders’ equity | $ | 694,545 | $ | 825,507 | ||||
The accompanying notes are an integral part of these consolidated financial statements.
F-4
TSAKOS ENERGY NAVIGATION LIMITED AND SUBSIDIARIES
CONSOLIDATED STATEMENTS OF INCOME
FOR THE YEARS ENDED DECEMBER 31 2001, 2002 AND 2003
(Expressed in thousands of U.S. Dollars – except per share data)
| 2001 | 2002 | 2003 | ||||||||||
REVENUES: | ||||||||||||
Revenue from vessels (Note 1) | $ | 125,029 | $ | 130,004 | $ | 241,365 | ||||||
Commissions (Note 3(b)) | (6,379 | ) | (6,364 | ) | (11,296 | ) | ||||||
Revenue from vessels, net | 118,650 | 123,640 | 230,069 | |||||||||
EXPENSES: | ||||||||||||
Voyage expenses | 21,436 | 32,838 | 61,297 | |||||||||
Vessel operating expenses (Notes 3(b), 3(c) and 14) | 28,695 | 32,347 | 49,949 | |||||||||
Depreciation (Note 6) | 21,250 | 24,429 | 32,877 | |||||||||
Impairment loss (Notes 6 and 7) | — | 10,781 | — | |||||||||
Amortization of deferred charges (Note 7) | 5,119 | 4,315 | 7,835 | |||||||||
Provision for doubtful receivables | — | — | 700 | |||||||||
Management fees (Note 3(a)) | 3,132 | 3,239 | 4,470 | |||||||||
Compensation costs (Note 9) | 258 | — | — | |||||||||
General and administrative expenses (Note 3(e)) | 792 | 1,261 | 2,415 | |||||||||
Operating income | 37,968 | 14,430 | 70,525 | |||||||||
OTHER INCOME (EXPENSES): | ||||||||||||
Interest and finance costs, net (Notes 8 and 11) | (14,542 | ) | (11,385 | ) | (12,372 | ) | ||||||
Interest Income | 1,214 | 736 | 387 | |||||||||
Foreign currency losses | (24 | ) | (84 | ) | (389 | ) | ||||||
Share of profits of joint venture (Note 2(l)) | — | 197 | 602 | |||||||||
Amortization of deferred gain on sale of vessels (Note 10) | — | — | 541 | |||||||||
Other, net | — | — | (242 | ) | ||||||||
Total other income (expenses), net | (13,352 | ) | (10,536 | ) | (11,473 | ) | ||||||
Net Income | $ | 24,616 | $ | 3,894 | $ | 59,052 | ||||||
Earnings per share, basic (Note 13) | $ | 2.56 | $ | 0.25 | $ | 3.45 | ||||||
Earnings per share, diluted (Notes 9 and 13) | $ | 2.54 | $ | 0.25 | $ | 3.44 | ||||||
Weighted average number of shares, basic | 9,634,323 | 15,717,065 | 17,134,347 | |||||||||
Weighted average number of shares, diluted | 9,705,381 | 15,854,904 | 17,187,859 | |||||||||
The accompanying notes are an integral part of these consolidated financial statements.
F-5
TSAKOS ENERGY NAVIGATION LIMITED AND SUBSIDIARIES
CONSOLIDATED STATEMENTS OF STOCKHOLDERS’ EQUITY
FOR THE YEARS ENDED DECEMBER 31, 2001, 2002 AND 2003
(Expressed in thousands of U.S. Dollars – except per share data)
| Comprehensive Income/(Loss) | Common Stock | Additional Paid-in Capital | Retained Earnings | Accumulated Other Comprehensive Income/(Loss) | Total Stock-Holders’ Equity | |||||||||||||||||||
BALANCE, January 1, 2001 | $ | 9,659 | $ | 108,693 | $ | 28,220 | $ | — | $ | 146,572 | ||||||||||||||
Net income | 24,616 | 24,616 | 24,616 | |||||||||||||||||||||
– Issuance of Stock Options | 258 | 258 | ||||||||||||||||||||||
– Repurchase and cancellation of common stock (30,000 shares) | (30 | ) | (348 | ) | (378 | ) | ||||||||||||||||||
Comprehensive income | $ | 24,616 | ||||||||||||||||||||||
BALANCE, December 31, 2001 | $ | 9,629 | $ | 108,603 | $ | 52,836 | $ | — | $ | 171,068 | ||||||||||||||
Net income | 3,894 | 3,894 | 3,894 | |||||||||||||||||||||
– Issuance of common stock | 7,350 | 102,900 | 110,250 | |||||||||||||||||||||
– Expenses related to the issuance of common stock | (9,868 | ) | (9,868 | ) | ||||||||||||||||||||
– Issuance of common stock on acquisition of shares in LauriTen Ltd. (Note 2(l)) | 217 | 3,033 | 3,250 | |||||||||||||||||||||
– Repurchase and cancellation of common stock (172,800 shares) | (173 | ) | (1,806 | ) | (1,979 | ) | ||||||||||||||||||
– Cash dividends declared and paid ($0.50 per share) | (8,542 | ) | (8,542 | ) | ||||||||||||||||||||
– Fair value of financial instruments | (629 | ) | (629 | ) | (629 | ) | ||||||||||||||||||
Comprehensive income | $ | 3,265 | ||||||||||||||||||||||
BALANCE, December 31, 2002 | $ | 17,023 | $ | 202,862 | $ | 48,188 | $ | (629 | ) | $ | 267,444 | |||||||||||||
Net income | 59,052 | 59,052 | 59,052 | |||||||||||||||||||||
– Exercise of stock options (Note 9) | 269 | 2,421 | 2,690 | |||||||||||||||||||||
– Repurchase and cancellation of common stock (140,100 shares) | (140 | ) | (1,652 | ) | (1,792 | ) | ||||||||||||||||||
– Cash dividends declared and paid ($0.70 per share) | (12,023 | ) | (12,023 | ) | ||||||||||||||||||||
– Fair value of financial instruments | (802 | ) | (802 | ) | (802 | ) | ||||||||||||||||||
Comprehensive income | $ | 58,250 | ||||||||||||||||||||||
BALANCE, December 31, 2003 | $ | 17,152 | $ | 203,631 | $ | 95,217 | $ | (1,431 | ) | $ | 314,569 | |||||||||||||
The accompanying notes are an integral part of these consolidated financial statements.
F-6
TSAKOS ENERGY NAVIGATION LIMITED AND SUBSIDIARIES
CONSOLIDATED STATEMENTS OF CASH FLOWS
FOR THE YEARS ENDED DECEMBER 31, 2001, 2002 AND 2003
(Expressed in thousands of U.S. Dollars)
| 2001 | 2002 | 2003 | ||||||||||
Cash Flows from Operating Activities: | ||||||||||||
Net income | $ | 24,616 | $ | 3,894 | $ | 59,052 | ||||||
Adjustments to reconcile net income to net cash provided by operating activities: | ||||||||||||
Depreciation | 21,250 | 24,429 | 32,877 | |||||||||
Impairment loss | — | 10,781 | — | |||||||||
Amortization of deferred costs | 5,119 | 4,315 | 7,835 | |||||||||
Amortization of loan fees | 286 | 286 | 686 | |||||||||
Amortization of deferred income | (838 | ) | (838 | ) | (1,379 | ) | ||||||
Change in fair value of interest rate swaps | 3,387 | 3,822 | (3,543 | ) | ||||||||
Share of profits in joint venture | — | (197 | ) | (602 | ) | |||||||
Stock options granted | 258 | — | — | |||||||||
Payments for dry-docking | (2,763 | ) | (8,265 | ) | (15,114 | ) | ||||||
(Increase) Decrease in: | ||||||||||||
Receivables | (3,173 | ) | (12,589 | ) | (1,052 | ) | ||||||
Inventories | (97 | ) | (1,847 | ) | (106 | ) | ||||||
Prepayments and other | (587 | ) | 153 | 78 | ||||||||
Increase (Decrease) in: | ||||||||||||
Accounts payable | (2,636 | ) | 7,185 | 3,572 | ||||||||
Accrued liabilities | (976 | ) | 1,412 | 272 | ||||||||
Unearned revenue | (392 | ) | 204 | 1,608 | ||||||||
Net Cash from Operating Activities | 43,454 | 32,745 | 84,184 | |||||||||
Cash Flows from Investing Activities: | ||||||||||||
Advances for vessels under construction | (18,653 | ) | (39,771 | ) | (32,096 | ) | ||||||
Vessel acquisitions and/or improvements | (169 | ) | (210,898 | ) | (186,775 | ) | ||||||
Payments for investments in joint venture | — | (7,130 | ) | (36 | ) | |||||||
Return of investment in joint venture | — | — | 11,216 | |||||||||
Proceeds from sale of vessels | — | — | 108,854 | |||||||||
Restricted cash for performance guarantee | (287 | ) | 815 | 7,000 | ||||||||
Net Cash used in Investing Activities | (19,109 | ) | (256,984 | ) | (91,837 | ) | ||||||
Cash Flows from Financing Activities: | ||||||||||||
Proceeds from long-term debt | — | 185,371 | 159,910 | |||||||||
Financing costs | — | (716 | ) | (751 | ) | |||||||
Payments of long-term debt | (20,463 | ) | (43,877 | ) | (93,242 | ) | ||||||
Proceeds from public offering, net of related issuance costs | — | 100,382 | — | |||||||||
Proceeds from exercise of stock options | — | — | 2,690 | |||||||||
Cash dividend | — | (8,542 | ) | (12,023 | ) | |||||||
Repurchase and cancellation of common stock | (378 | ) | (1,979 | ) | (1,792 | ) | ||||||
Net Cash from (used in) Financing Activities | (20,841 | ) | 230,639 | 54,792 | ||||||||
Net increase in cash and cash equivalents | 3,504 | 6,400 | 47,139 | |||||||||
Cash and cash equivalents at beginning of year | 29,770 | 33,274 | 39,674 | |||||||||
Cash and cash equivalents at end of year | $ | 33,274 | $ | 39,674 | $ | 86,813 | ||||||
The accompanying notes are an integral part of these consolidated financial statements.
F-7
TSAKOS ENERGY NAVIGATION LIMITED
NOTES TO CONSOLIDATED FINANCIAL STATEMENTS
DECEMBER 31, 2002 AND 2003
(Expressed in thousands of United States Dollars)
| 1. | Basis of Presentation and General Information |
The accompanying consolidated financial statements include the accounts of TSAKOS ENERGY NAVIGATION LIMITED (the “Holding Company”) and its wholly owned subsidiaries (collectively, the “Company”). The Company owns and operates a fleet of crude and product oil carriers providing worldwide marine transportation services under long, medium or short-term charters. The Holding Company was formed in July 1993, under the laws of Bermuda and under the name of Maritime Investment Fund Limited. In December 1993, following a public offering of common shares conducted outside the United States, the Company raised $35,000, which was used for the acquisition of the Company’s initial fleet.
In 1996, the Holding Company was renamed MIF LIMITED and in December 1996, a second offering of common shares was completed, through which an additional amount of $71,000 was raised for the expansion of the Company’s fleet. The Holding Company was renamed Tsakos Energy Navigation Limited in 2001 and in March 2002, the Company raised a further $110,000 following an initial public offering on the New York Stock Exchange under the United States Securities Act of 1933, as amended. The Holding Company’s shares are listed on the New York Stock Exchange, the Oslo Børs and the Bermuda Stock Exchange.
The Holding Company is the sole owner of all outstanding shares of the companies listed below:
| (a) | Ship-owning companies with vessels in operation: |
Company | Country of | Date of Incorporation | Vessel Name | Dwt | Year Built | |||||
VLCC | ||||||||||
Oak Shipping Co Ltd. | Liberia | October 10, 1997 | Millennium | 301,171 | 1998 | |||||
Suezmax | ||||||||||
Romeo Shipping Company Limited | Liberia | November 4, 1999 | Silia T | 164,286 | 2002 | |||||
Figaro Shipping Company Limited | Liberia | November 4, 1999 | Triathlon | 164,445 | 2002 | |||||
Aframax | ||||||||||
Soumelia Marine Co Ltd. | Cyprus | February 12, 1996 | Panos G. | 86,983 | 1981 | |||||
Dimena Shipping Co Ltd. | Cyprus | August 3, 1993 | Tamyra | 86,843 | 1983 | |||||
Grevia Marine Co Ltd. | Cyprus | October 10, 1996 | Vergina II | 96,709 | 1991 | |||||
Noble Shipping Enterprises Inc. | Liberia | April 15, 1997 | Toula Z. | 107,222 | 1997 | |||||
Seaport Shipping Corp. | Liberia | August 22, 1997 | Athens 2004 | 107,181 | 1998 | |||||
Kingsbridge Shipping Co Ltd. | Liberia | October 10, 1997 | Maria Tsakos | 107,181 | 1998 | |||||
Azimuth Shipping Company Ltd. | Liberia | August 23, 2000 | Opal Queen | 107,181 | 2001 | |||||
Bosphorus Shipping Co Ltd. | Liberia | August 23, 2000 | Marathon | 107,181 | 2003 | |||||
Oceana Shipping Company Ltd. | Liberia | March 1, 2002 | Parthenon | 107,018 | 2003 | |||||
Panamax | ||||||||||
Malgara Marine Co Ltd. | Cyprus | October 10, 1996 | Liberty | 61,375 | 1981 | |||||
Horizana Shipping Co Ltd. | Malta | March 11, 1994 | Bregen | 68,157 | 1989 | |||||
Fortitude Shipping Co Ltd. | Malta | January 21, 1994 | Hesnes | 68,157 | 1990 | |||||
Klera Navigation Co Ltd. | Cyprus | October 10, 1996 | Victory III | 68,160 | 1990 | |||||
Magnum Faith S.A. | Panama | January 7, 1998 | Inca | 68,439 | 2003 | |||||
Status Fame S.A. | Panama | May 24, 2001 | Maya | 68,439 | 2003 | |||||
Sea Mayfair S.A. | Panama | June 13, 2001 | Aztec | 68,439 | 2003 | |||||
Ergo Glory S.A. | Panama | July 16, 2001 | Andes | 68,439 | 2003 | |||||
Handymax product carrier | ||||||||||
Divino Maritime Co Ltd. | Cyprus | December 3, 1997 | Dion | 40,302 | 1984 | |||||
Estoril Maritime Co Ltd. | Cyprus | December 3, 1997 | Pella | 40,231 | 1985 | |||||
Jersey Shipping Co Ltd. | Liberia | April 23, 1999 | Libra | 41,161 | 1988 | |||||
Annapolis Shipping Co Ltd. | Liberia | April 23, 1999 | Crux | 41,161 | 1987 | |||||
| 2,245,861 | ||||||||||
F-8
TSAKOS ENERGY NAVIGATION LIMITED
NOTES TO CONSOLIDATED FINANCIAL STATEMENTS
DECEMBER 31, 2002 AND 2003
(Expressed in thousands of United States Dollars)
1. Basis of Presentation and General Information (continued)
| (b) | Companies with chartered-in vessels: |
Essex Shipping Co. Ltd.was formed under the laws of Liberia on April 23, 1999 and became the charterer of the 1999 builtOlympia, a double-hull aframax (Dwt 107,181) after her sale by West Point Shipping Co. Ltd. (a subsidiary of the Holding Company), as further described in Note 10.
Juliet Shipping Company Limited and Rigoletto Shipping Company Limitedwere formed under the laws of Liberia on November 4, 1999 and were the former owners of the double-hull 2002 built suezmax vesselsDecathlon(Dwt 164,274) andPentathlon(Dwt 164,235) respectively. The vessels were sold during 2003 and chartered-back by the former owners for a minimum period of five years as further described in Note 10. The vessels have been re-named by the new ownersCape BakerandCape Balboarespectively.
| (c) | Ship-owning companies with vessels under construction: |
Company | Country of Incorporation | Date of Incorporation | Vessel Name | Dwt | ||||
| Handysize | ||||||||
Mediterranean Fame S.A. | Panama | July 5, 2002 | Delos (Hull 228) | 37,000 | ||||
World Excellence S.A. | Panama | January 4, 2003 | Dodoni (Hull 337) | 37,000 | ||||
Oceanic Glory S.A. | Panama | January 3, 2003 | Dionisos (Hull 339) | 37,000 | ||||
| Suezmax | ||||||||
Apollo Glory S.A. | Panama | February 26, 2003 | Promitheas (Hull 1617) | 164,000 | ||||
Apollo Excellence S.A. | Panama | February 26, 2003 | Proteas (Hull 1618) | 164,000 | ||||
Activity Excellence S.A. | Panama | May 22, 2003 | Orfeas (Hull 1619) | 164,000 | ||||
Worldwide Overseas S.A. | Panama | July 2, 2003 | Aegeas (Hull 1620) | 164,000 | ||||
| 767,000 | ||||||||
The expected delivery dates of the above newbuildings are within 2004, 2005 and 2006.
| (d) | Ship-owning companies with discontinued operations: |
Company | Country of Incorporation | Date of Incorporation | ||
Koroni Shipping Co Ltd. | Liberia | August 25, 1993 | ||
Kavalla Shipping Co Ltd. | Liberia | August 25, 1993 | ||
Capias Pte Ltd. | Singapore | December 6, 1994 | ||
Meandros Shipping Co Ltd. | Cyprus | July 8, 1993 | ||
West Point Shipping Co. Ltd. | Liberia | January 4, 1996 | ||
Bordeaux Shipping Company Ltd. | Liberia | March 1, 2002 |
| (e) | Maritime Investment Finance Ltd. (“Maritime Investment”): Maritime Investment was formed under the laws of Liberia on August 25, 1993. The company was formed to secure funds to be used to acquire vessels. |
At December 31, 2003, of the vessels in operation (including the three chartered-in vessels), thirteen were flying the Greek flag, seven the Cypriot flag, two the Maltese flag, two the Panamanian flag, two the Marshall Islands flag and one the Venezuelan flag.
F-9
TSAKOS ENERGY NAVIGATION LIMITED
NOTES TO CONSOLIDATED FINANCIAL STATEMENTS
DECEMBER 31, 2002 AND 2003
(Expressed in thousands of United States Dollars)
1. Basis of Presentation and General Information (continued)
Gross revenues for the years ended December 31, 2001, 2002 and 2003, included revenues derived from charter agreements with significant charterers, as follows (in percentages of total gross revenues):
Charterer | 2001 | 2002 | 2003 | ||||||
A | 15 | % | 10 | % | Under 10 | % | |||
B | 28 | % | 24 | % | 17 | % | |||
2. Significant Accounting Policies
| (a) | Principles of Consolidation: The accompanying consolidated financial statements have been prepared in accordance with accounting principles generally accepted in the United States (“US GAAP”) and include the accounts of the Holding Company and its wholly-owned subsidiaries referred to in Note 1 above. All significant intercompany balances and transactions have been eliminated upon consolidation. The consolidation was based on common ownership and identical activities. |
Certain minor reclassifications have been made to the 2002 prior year consolidated financial statements to conform to the presentation in the 2003 consolidated financial statements. Amounts due to related companies, previously reported under Accounts payable – Trade or Accounts payable – Other, are now separately reflected in the accompanying balance sheet.
| (b) | Use of Estimates:The preparation of consolidated financial statements in conformity with US GAAP requires management to make estimates and assumptions that affect the reported amounts of assets and liabilities and disclosure of contingent assets and liabilities at the date of the consolidated financial statements and the reported amounts of revenues and expenses during the reporting period. Actual results could differ from those estimates. |
| (c) | Foreign Currency Translation:The functional currency of the Company is the U.S. Dollar because the Company’s vessels operate in international shipping markets, which utilize the U.S. Dollar as the functional currency. The accounting books of the Holding Company and its wholly owned subsidiaries are maintained in U.S. Dollars. Transactions involving other currencies during the year are converted into U.S. Dollars using the exchange rates in effect at the time of the transactions. At the balance sheet dates, monetary assets and liabilities, which are denominated in other currencies, are translated to reflect the current exchange rates. Resulting gains or losses are separately reflected in the accompanying consolidated statements of income. |
| (d) | Cash and Cash Equivalents:The Company considers highly liquid investments such as time deposits and certificates of deposit with original maturity of three months or less to be cash equivalents. |
| (e) | Receivables – Trade Accounts Receivable:The amount shown as Receivables – Trade accounts receivable, net at each balance sheet date, includes estimated recoveries from charterers for hire, freight and demurrage billings, net of allowance for doubtful accounts ($183 and $700 as of December 31, 2002 and 2003, respectively). |
F-10
TSAKOS ENERGY NAVIGATION LIMITED
NOTES TO CONSOLIDATED FINANCIAL STATEMENTS
DECEMBER 31, 2002 AND 2003
(Expressed in thousands of United States Dollars)
2. Significant Accounting Policies (continued)
| (f) | Accounts Payable – Trade:The amount shown as Accounts Payable – Trade at each balance sheet date includes payables to suppliers of dry-docking services, port services, bunkers, insurance and other goods and services payable directly by the Company. |
| (g) | Insurance Claims:Insurance claims consist of claims submitted and/or claims in the process of compilation or submission (claims pending). They are recorded on the accrual basis and represent the estimated claimable expenses, net of deductibles, incurred through December 31 of each year, which are expected to be recovered from insurance companies. The classification of insurance claims into current and non-current assets is based on management expectations as to their collection dates. |
| (h) | Inventories:Inventories consist of bunkers, lubricants, victualling and stores and are stated at the lower of cost or market value. The cost is determined by the first-in, first-out method, except for stores, the cost of which is determined based on last invoice cost. |
| (i) | Vessels’ Cost:Vessels are stated at cost, which consists of the contract price and any material expenses incurred upon acquisition (initial repairs, improvements and delivery expenses, interest and on-site supervision costs incurred during the construction periods). Subsequent expenditures for conversions and major improvements are also capitalized when they appreciably extend the life, increase the earning capacity or improve the efficiency or safety of the vessels, otherwise are charged to expenses as incurred. |
| (j) | Impairment of Long-lived Assets:The Company adopted SFAS 144 “Accounting for the Impairment or Disposal of Long-lived Assets” in 2002, which addresses financial accounting and reporting for the impairment or disposal of long-lived assets. The standard requires that long-lived assets and certain identifiable intangibles held and used or disposed of by an entity be reviewed for impairment whenever events or changes in circumstances indicate that the carrying amount of the assets may not be recoverable. An impairment loss for an asset held for use should be recognized when the estimate of undiscounted cash flows, excluding interest charges, expected to be generated by the use of the asset is less than its carrying amount. Measurement of the impairment loss is based on the fair value of the asset as provided by third parties. In this respect, management regularly reviews the carrying amount of the vessels in connection with the estimated recoverable amount for each of the Company’s vessels. The review of the carrying amount in connection with the estimated recoverable amount for each of the Company’s vessels, as of December 31, 2003 indicated that no impairment loss is required. |
| (k) | Vessels’ Depreciation:The cost of each of the Company’s vessels is depreciated on a straight-line basis over the vessels’ remaining economic useful life, after considering the estimated residual value (U.S. Dollars 180 per Lwt). Management estimates the useful life of each of the Company’s vessels to be 25 years, consistent with industry practice and taking into account new international maritime regulations concerning the early phase out of non-double hull vessels. |
| (l) | Investment in Joint Venture:In 2002, the Company acquired a 50% participating interest in a joint venture company (LauriTen Ltd.), which owned four separate companies each of which owned a small LPG carrier. The joint venture was accounted for using the equity method whereby the investment was carried at the Company’s original cost plus its share of undistributed earnings. The investment shown in the accompanying consolidated balance sheet as of December 31, 2002 comprised a cash payment of $6,820, issuance of common stock of $3,250 |
F-11
TSAKOS ENERGY NAVIGATION LIMITED
NOTES TO CONSOLIDATED FINANCIAL STATEMENTS
DECEMBER 31, 2002 AND 2003
(Expressed in thousands of United States Dollars)
2. Significant Accounting Policies (continued)
(216,666 shares at $15.00 each – amount in U.S. Dollars), plus acquisition costs and the Company’s share of 2002 profits of the joint venture. A decision was taken in August 2003 not to extend the joint venture agreement and consequently, in accordance with the original agreement, the joint venture expired on August 31, 2003. The partner who acquired the Company’s share of the joint venture returned the Company’s initial cash investment in the joint venture together with the Company’s proportionate share of the joint venture’s cumulative net income. Furthermore, the partner retained 100% of the Company’s shares originally contributed to the joint venture in exchange for cash consideration of $3,250 plus interest and a commitment from the Company to reimburse the former partner any realized loss in the event of a sale of those shares before December 31, 2004 at a price below $15.00 (amount in U.S. Dollars). The share price at December 31, 2003 was $18.45 (amount in U.S. Dollars) and the former partner sold 50% of the shares in March 2004 at a price in excess of the year-end price. Should the Company’s share price fall below $15.00 (amount in U.S. Dollars) prior to December 31, 2004, the Company will recognize a charge and corresponding liability on the remaining shares held by the former partner based on the difference between the actual share price and the $15.00 (amount in U.S. Dollars) guaranteed price. However, it is not reasonably possible to estimate the likelihood of this occurrence. The Company has not provided a share price guarantee to the former partner beyond December 31, 2004.
| (m) | Accounting for Special Survey and Dry-docking Costs:The Company follows the deferral method of accounting for special survey and dry-docking costs whereby actual costs incurred are deferred and are amortized on a straight-line basis over the period through the date the next special survey becomes due. |
| (n) | Loan Fees:Fees incurred for obtaining new loans or refinancing existing loans are capitalized and included in deferred charges and amortized over the term of the respective loan, using the effective interest rate method. Any unamortized balance of costs relating to loans repaid or refinanced is expensed in the period the repayment or refinancing is made. |
| (o) | Accounting for P&I Back Calls:The vessels’ Protection and Indemnity (P&I) Club insurance is subject to additional premiums referred to as back calls or supplemental calls. Provision has been made for such estimated future calls, which is included in Accrued Liabilities in the accompanying consolidated balance sheets. |
| (p) | Pension and Retirement Benefit Obligations – Crew:The crews on board the Company’s vessels serve under short-term contracts (usually up to nine months) and accordingly, the Company is not liable for any pension or post retirement benefits. |
| (q) | Accounting for Revenue and Expenses:Revenues are generated from freight billings and time charters. Time charter revenues are recorded over the term of the charter as service is provided. Under a voyage charter the revenues and associated voyage costs are recognized on a pro-rata basis over the duration of the voyage. The operating results of voyages in progress at a reporting date are estimated and recognized pro-rata on a per day basis. Probable losses on voyages are provided for in full at the time such losses can be estimated. Vessel operating expenses are accounted for on an accrual basis. Unearned revenue represents cash received prior to the year end and is related to revenue applicable to periods after December 31 of each year. The operating revenues and voyage expenses of vessels operating under a tanker pool are pooled and net operating revenues, calculated on a time charter equivalent basis, are allocated to the pool participants according to an agreed formula. |
F-12
TSAKOS ENERGY NAVIGATION LIMITED
NOTES TO CONSOLIDATED FINANCIAL STATEMENTS
DECEMBER 31, 2002 AND 2003
(Expressed in thousands of United States Dollars)
2. Significant Accounting Policies (continued)
| (r) | Repairs and Maintenance:All repair and maintenance expenses including major overhauling and underwater inspection expenses are charged against income in the year incurred. Such costs, which are included in vessel operating expenses in the accompanying consolidated statements of income, amounted to $6,056, $3,862, and $6,046 in the years ended December 31, 2001, 2002 and 2003, respectively. |
| (s) | Earnings per Share:Basic earnings per share are computed by dividing net income by the weighted average number of common shares outstanding during the year. Diluted earnings per share reflects the potential dilution that could occur if securities or other contracts to issue common stock were exercised. |
| (t) | Segment Reporting:The Company reports financial information and evaluates its operations by charter revenues and not by the length of ship employment for its customers, i.e., spot or time charters. The Company does not have discrete financial information to evaluate the operating results for each such type of charter. Although revenue can be identified for these types of charters, management cannot and does not identify expenses, profitability or other financial information for these charters. As a result, management, including the chief operating decision makers, reviews operating results solely by revenue per day and operating results of the fleet and thus the Company has determined that it operates under one reportable segment. |
| (u) | Interest Rate Swap Agreements:The Company regularly enters into interest rate swap contracts to manage its exposure to fluctuations of interest rates associated with its specific borrowings. Interest rate differentials paid or received under these swap agreements are recognized as part of interest expense related to the hedged debt. Amounts receivable or payable arising on the termination of interest rate swap agreements qualifying as hedging instruments are deferred and amortized over the shorter of the life of the hedged debt or the hedging instrument. During 2000 and 2001, the Company entered into interest rate swap agreements that did not qualify for hedge accounting. As such, the fair value of these agreements and changes therein are recognized in the consolidated balance sheets and statements of income respectively. During 2002 and 2003, the Company entered into interest rate swap agreements that did qualify for hedge accounting. Accordingly, the fair value of these swap agreements and changes therein are recognized in the consolidated balance sheets and other comprehensive income/(loss). |
The off-balance sheet risk in outstanding swap agreements involves both the risk of a counterparty not performing under the terms of the contract and the risk associated with changes in fair value. The Company monitors its positions, the credit ratings of counterparties and the level of contracts it enters into with any one party. The counterparties to these contracts are major financial institutions. The Company has a policy of entering into contracts with parties that meet stringent qualifications and, given the high level of credit quality of its derivative counter parties, the Company does not believe it is necessary to obtain collateral arrangements.
Interest rate swap transactions opened and closed during 2001 were not for hedging purposes and, therefore, related gains on termination have been included in the consolidated income statements under Interest and finance costs, net. No interest swap transactions were entered into and terminated within 2002 or 2003. (See also Notes 10, 11 and 16 for other disclosures related to derivative instruments).
| (v) | Accounting for Leases:Leases of assets under which all the risks and rewards of ownership are effectively retained by the lessor are classified as operating leases. Lease payments under an operating lease are recognized as an expense over the lease term. |
F-13
TSAKOS ENERGY NAVIGATION LIMITED
NOTES TO CONSOLIDATED FINANCIAL STATEMENTS
DECEMBER 31, 2002 AND 2003
(Expressed in thousands of United States Dollars)
2. Significant Accounting Policies (continued)
| (w) | Accounting for Stock-Based Compensation:In 1998, the Company’s Board of Directors approved a Stock Option Plan providing for granting of stock options to directors and officers of the Company as well as to employees of the affiliated companies discussed in Note 3. The plan contains performance requirements and the options granted are accounted for in accordance with the provisions of SFAS No. 123 and EITF 96-18 using the fair value method wherein costs equivalent to the value of such options are recognized over the performance (vesting) period. The Company uses the fair value method to account for stock based compensation (See Note 9). |
| (x) | Other Recent Accounting Pronouncements:In 2003, the FASB issued Interpretation No. 46, Consolidation of Variable Interest Entities (“FIN 46”). FIN 46 provides guidance on the identification of entities for which control is achieved through means other than through voting rights (“variable interest entities”) and how to determine when and which business enterprise (the “primary beneficiary”) should consolidate the variable interest entity. This new model for consolidation applies to an entity in which either (i) the equity investors (if any) do not have a controlling financial interest; or (ii) the equity investment at risk is insufficient to finance the entity’s activities without receiving additional subordinated financial support from other parties. In addition, FIN 46 requires that the primary beneficiary, as well as all other enterprises with a significant variable interest in a variable interest entity, makes additional disclosures. The effective dates and impact of FIN 46 and its revision FIN 46-R, are as follows: |
| 1. | Special purpose entities (“SPE’s”) created prior to February 1, 2003 – application of FIN 46 or early adoption of FIN 46-R at the end of the first interim or annual reporting period after December 15, 2003. |
| 2. | Non-SPE’s created prior to February 1, 2003 – adoption of FIN 46-R at the end of the first interim or annual reporting period after December 15, 2003. |
| 3. | All entities, regardless of whether an SPE, that were created subsequent to January 31, 2003. The provisions of FIN 46 were applicable for variable interests in entities obtained after January 31, 2003. Adoption of FIN 46-R is required at the end of the first interim or annual reporting period ending after March 15, 2003. |
The adoptions of the provisions applicable to SPE’s and all other variable interests obtained after January 31, 2003 did not have an impact on the Company’s financial statements. The Company is currently evaluating the impact of adopting FIN 46-R applicable to non-SPE’s created prior to February 1, 2003, but does not expect any impact on the Company’s results of operations or financial position.
In April 2003, the FASB issued SFAS 149, “Amendment of Statement 133 on Derivative Instruments and Hedging Activities”. Statement 149 amends and clarifies accounting for derivative instruments, including certain instruments embedded in other contracts, and for hedging activities under Statement 133. In particular, the Statement provides clarification regarding the meaning of an “underlying” and the characteristics of a derivative that contains financing components. It also clarifies under what circumstances a contract with an initial net investment meets the characteristic of a derivative as discussed in Statement 133 and when a derivative contains a financing component that warrants special reporting in the statement of cash flows. The Company has adopted the provisions of SFAS 149 effective October 1, 2003, which did not have an effect on the Company’s financial statements.
In May 2003, the FASB issued SFAS 150, “Accounting for Certain Financial Instruments with the Characteristics of both Liabilities and Equity”. Statement 150 affects how an issuer should account for certain types of freestanding financial instruments which have the characteristics of both equity and liabilities and what disclosures are required for the classification, measurement and settlement of such financial instruments. The Statement is effective for all financial instruments entered into or modified after May 31, 2003, and otherwise is effective at the beginning of the first interim period beginning after June 15, 2003. The Company has adopted the provisions of SFAS 150 effective October 1, 2003, which did not have an effect on the Company’s financial statements.
F-14
TSAKOS ENERGY NAVIGATION LIMITED
NOTES TO CONSOLIDATED FINANCIAL STATEMENTS
DECEMBER 31, 2002 AND 2003
(Expressed in thousands of United States Dollars)
3. Transactions with Related Parties
| (a) | Tsakos Energy Management S.A. Formerly known as Absolute Navigation Limited (“Absolute”):The Company has a Management Agreement (“Management Agreement”) with Tsakos Energy Management, a Liberian corporation, to provide overall executive and commercial management of its affairs for a monthly fee of $15 per vessel ($15 in 2002 and $16.5 in 2001). The Company and Tsakos Energy Management have certain common officers and directors. The president, chief executive officer and a director of the Company is also the sole stockholder of Tsakos Energy Management. Tsakos Energy Management may terminate its management agreement with the Company at any time upon one year’s notice. In addition, if even one director was elected to the Company’s Board of Directors, without having been recommended by the existing board, Tsakos Energy Management would have the right to terminate the management agreement on ten days’ notice. If Tsakos Energy Management terminates the agreement for this reason, the Company would be obligated to pay Tsakos Energy Management the present discounted value of all payments that would have otherwise become due under the management agreement until December 2006, a payment of approximately $12,500 as of December 31, 2003, ($12,500 as of December 31, 2002). |
Under the terms of the Management Agreement, management fees for operating vessels for the years ended December 31, 2001, 2002 and 2003 amounted to $3,132, $3,239 and $4,470, respectively and are separately reflected in the accompanying consolidated statements of income. Also under the terms of the Management Agreement, Tsakos Energy Management provides supervisory services for the construction of its vessels for a monthly fee of $15 ($15 in 2002 and $16.5 in 2001). These fees amounted to $1,146, $1,337 and $1,129 during the years ended December 31, 2001, 2002 and 2003, respectively. These fees are either accounted for as part of construction costs for delivered vessels or are included in Advances for Vessels under Construction (Note 5). The amount due to Tsakos Energy Management by the Company as of December 31, 2003 amounted to $242 ($(4) in 2002) and is included in Accounts payable – Due to related companies (Receivables – Due from related companies in 2002) in the accompanying consolidated balance sheets.
| (b) | Tsakos Shipping and Trading S.A. (“Tsakos”):Tsakos Energy Management has appointed Tsakos to provide technical management to the Company’s vessels. Certain members and directors of Tsakos and of Tsakos Energy Management are family-related individuals. Certain directors of Tsakos are also shareholders of the Company. According to the technical management contract between Tsakos and Tsakos Energy Management, the Company has an obligation to pay all estimated monthly operating requirements of its fleet in advance. These advances amounted to $3,820 and $3,836 at December 31, 2002 and 2003 and are reported as amounts due from related company in the accompanying consolidated balance sheets. |
Tsakos Energy Management, at its own expense, pays technical management fees to Tsakos, and the Company bears and pays directly to Tsakos most operating expenses, including repairs and maintenance, provisioning and crewing of the Company’s vessels. Such expenses also include reimbursement of travel and subsistence costs of Tsakos personnel sent overseas to supervise repairs and perform inspections on Company vessels. Amounts for operating expenses are paid in advance and amounted to $24,300, $29,850 and $45,920 in the aggregate during the years ended December 31, 2001, 2002 and 2003, respectively. These expenses are included in vessel operating expenses in the accompanying consolidated statements of income.
F-15
TSAKOS ENERGY NAVIGATION LIMITED
NOTES TO CONSOLIDATED FINANCIAL STATEMENTS
DECEMBER 31, 2002 AND 2003
(Expressed in thousands of United States Dollars)
3. Transactions with Related Parties
Furthermore, Tsakos provides chartering services for the Company’s vessels by communicating with third party kers to solicit, research and propose charters for the Company. For this service, the Company pays to Tsakos a chartering commission of approximately 1.25% on all freights, hires and demurrages. Such commissions for the years ended December 31, 2001, 2002 and 2003 totalled, $1,563, $1,608 and $3,627, respectively, and are included in Commissions in the accompanying consolidated statements of income. Commissions due to Tsakos by the Company amounted to $137 and $472 at December 31, 2002 and 2003 and are included in Accounts payable – Due to related companies in the accompanying consolidated balance sheets.
On January 21, 2002, the Company finalized separate option agreements, exercised on January 31, 2002, to acquire five newbuildings and one vessel delivered by the shipyard in 2001, through the acquisition of shares of ship-owning companies that have management agreements with Tsakos and are considered affiliated with the Tsakos Group. The total acquisition price for the six vessels was $234,750, representing the market value of the vessels at the time of the agreement. Of this total, an amount of $39,543 was payable directly to Tsakos, representing the reimbursement of the aggregate construction progress payments already paid by Tsakos, plus the difference between the original contract prices and the agreed market values.
| (c) | Argosy Insurance Company Limited (“Argosy”):The Company places its hull and machinery insurance, increased value insurance and war risk insurance through Argosy, a captive insurance company affiliated with Tsakos. In the years ended December 31, 2001, 2002 and 2003, the Company was charged by Argosy with insurance premiums of $1,691, $1,995 and $2,519, respectively, which are included in Vessels’ operating expenses in the accompanying consolidated statements of income. Insurance premiums payable to Argosy at December 31, 2002 and 2003 amounted to $1,656 and $2,482, respectively and are included in Accounts payable – Due to related companies in the accompanying consolidated balance sheets. |
| (d) | AirMania Travel S.A. (“AirMania”):Since June 2000, the Company uses an affiliated company, AirMania, for travel services. Travelling expenses for the years 2001, 2002 and 2003 amounted to $341, $723 and $975, respectively and are included in Vessel operating expenses in the accompanying consolidated statements of income. Amounts payable to Air Mania at December 31, 2002 and 2003 were $591 and $130, respectively and are included in Accounts payable – Due to related companies in the accompanying consolidated balance sheets. |
| (e) | Board of Directors’ and Officers’ fees:During the years ended December 31, 2001, 2002 and 2003, the Company paid Board of Directors’ and Officers’ fees of $180, $180 and $240 respectively. Such fees are included in General and administrative expenses in the accompanying consolidated statements of income. |
| (f) | Tsakos Holdings Foundation and Tsakos Group:Companies controlled by the Tsakos Holdings Foundation beneficially own approximately 26.2% (unaudited) of the common shares as of February 24, 2004 and, therefore, have the power to influence the election of the members of the Board of Directors and the vote on substantially all other matters, including significant corporate actions. |
F-16
TSAKOS ENERGY NAVIGATION LIMITED
NOTES TO CONSOLIDATED FINANCIAL STATEMENTS
DECEMBER 31, 2002 AND 2003
(Expressed in thousands of United States Dollars)
4. Inventories
| 2002 | 2003 | |||
Bunkers | 2,398 | 2,054 | ||
Lubricants | 535 | 655 | ||
Other | 342 | 672 | ||
| 3,275 | 3,381 | |||
5. Advances for Vessels under Construction and Acquisitions
The amount shown in the accompanying consolidated balance sheets for the years ended December 31, 2002 and 2003, includes payments to sellers of vessels or, in the case of contracted vessels, the shipyards, supervision services and capitalized interest cost, in accordance with the accounting policy discussed in Note 2(i), as analyzed below:
| 2002 | 2003 | |||
Advance payments on signing of contracts | 25,271 | 28,267 | ||
Additional pre-delivery payments | 13,735 | 3,873 | ||
Construction supervision fees | 1,436 | 754 | ||
Capitalized interest | 1,521 | 385 | ||
Other | — | 141 | ||
| 41,963 | 33,420 | |||
Six new vessels, all constructed at Imabari yards in Japan, were delivered to those subsidiaries of the Holding Company disclosed in Note 1(a) during 2003:
Vessel Name | Total Cost | Date of Delivery | ||
Aframax | ||||
Marathon | 40,874 | January 22, 2003 | ||
Parthenon | 38,190 | July 23, 2003 | ||
Panamax | ||||
Maya | 36,713 | January 24, 2003 | ||
Inca | 36,654 | March 20, 2003 | ||
Aztec | 36,962 | May 29, 2003 | ||
Andes | 36,825 | September 12, 2003 | ||
Total Cost | 226,218 | |||
F-17
TSAKOS ENERGY NAVIGATION LIMITED
NOTES TO CONSOLIDATED FINANCIAL STATEMENTS
DECEMBER 31, 2002 AND 2003
(Expressed in thousands of United States Dollars)
5. Advances for Vessel under Construction and Acquisitions (continued)
Total predelivery costs included in the above amounts were $2,192, $38,446 and $8,110, incurred in 2001, 2002 and 2003 respectively.
As at December 31, 2003 subsidiaries of the Holding Company, as disclosed in Note 1(c), had under construction three handysize product carriers at the Hyundai MIPO shipyard of South Korea and four suezmaxes at the Samho (Hyundai) shipyard of South Korea.
The total contracted amount for the seven vessels under construction is $269,905. Remaining scheduled payments are $65,727 in 2004, $109,838 in 2005 and $67,352 in 2006. It is expected that long term bank loans will be obtained for the financing of the major part of these payments.
6. Vessels
| Vessel Cost | Accumulated Depreciation | Net Book Value | |||||||
December 31, 2000 | 453,435 | (86,891 | ) | 366,544 | |||||
Additions | 169 | — | 169 | ||||||
Depreciation for the year | — | (21,250 | ) | (21,250 | ) | ||||
December 31, 2001 | 453,604 | (108,141 | ) | 345,463 | |||||
Additions | 210,898 | — | 210,898 | ||||||
Transfer from vessels under construction | 30,816 | — | 30,816 | ||||||
Depreciation for the year | — | (24,429 | ) | (24,429 | ) | ||||
Elimination of accumulated depreciation due to impairment | (15,261 | ) | 15,261 | — | |||||
Impairment adjustment | (9,605 | ) | — | (9,605 | ) | ||||
December 31, 2002 | 670,452 | (117,309 | ) | 553,143 | |||||
Additions | 186,775 | 186,775 | |||||||
Transfer from vessels under construction | 40,639 | — | 40,639 | ||||||
Disposals | (96,996 | ) | 3,978 | (93,018 | ) | ||||
Depreciation for the year | — | (32,877 | ) | (32,877 | ) | ||||
December 31, 2003 | 800,870 | (146,208 | ) | 654,662 | |||||
F-18
TSAKOS ENERGY NAVIGATION LIMITED
NOTES TO CONSOLIDATED FINANCIAL STATEMENTS
DECEMBER 31, 2002 AND 2003
(Expressed in thousands of United States Dollars)
6. Vessels (continued)
In December 2003, the Company entered into a contract to acquire the vessel M/TMaersk Estelle, a 299,700 dwt double-hull VLCC built in January 1994, for an amount of $51,500. An amount of $5,150 was paid as an advance and is included in advances shown above (Note 5). The balance of $46,350 was paid on delivery on January 28, 2004. The vessel was renamedLa Madrinaon delivery.
In 2002, the Company determined that the carrying values of the older single-hull vessels,Panos GandLibertywere impaired. Consequently, the total carrying values of these vessels (net book value $15,995) were written down to $6,390, which together with the balance of deferred charges relating to dry-docking and special surveys cost of $3,361, was the fair market value of the vessels as determined by independent marine valuers. An additional amount of impairment loss of $1,176 was charged to deferred dry-docking and survey cost so that the vessels’ cost would not be less than scrap value (Note 7).
Cost of vessels at December 31, 2002 and 2003 includes $19,963 and $23,512 respectively, of amounts capitalized in accordance with the accounting policy discussed in Note 2i above.
Additions to cost include capitalized interest of $3,785 and $1,975 for the years ended December 31, 2002 and 2003 respectively.
All the vessels operate under short-term or long-term time-charters, voyage charters, contracts of affreightment or within a pool arrangement, with the exception of theMillenniumwhich, since her acquisition in 1998, has operated under a bareboat charter for a fifteen-year period ending September 2013. The charterparty provides that the charterer shall, at its own expense, operate (i.e. manning, victual, repair and insure) the vessel. At any time during the bareboat period, the Company may sell the vessel, upon charterer’s consent, at specified amounts and will pay the charterer the 50% of any excess of these amounts.
7. Deferred Charges
| Dry-docking and Special Survey | Loan Fees | Total | |||||||
December 31, 2000 | 11,246 | 1,302 | 12,548 | ||||||
Additions | 2,763 | — | 2,763 | ||||||
Amortization | (5,119 | ) | (286 | ) | (5,405 | ) | |||
December 31, 2001 | 8,890 | 1,016 | 9,906 | ||||||
Additions | 8,265 | 716 | 8,981 | ||||||
Amortization | (4,315 | ) | (286 | ) | (4,601 | ) | |||
Impairment adjustment (Note 6) | (1,176 | ) | — | (1,176 | ) | ||||
December 31, 2002 | 11,664 | 1,446 | 13,110 | ||||||
Additions | 15,114 | 751 | 15,865 | ||||||
Amortization | (7,835 | ) | (686 | ) | (8,521 | ) | |||
December 31, 2003 | 18,943 | 1,511 | 20,454 | ||||||
Amortization for dry-docking and survey costs is separately reflected in the accompanying consolidated statements of income, while amortization of loan fees is included in interest and finance costs, net in the accompanying consolidated statements of income.
F-19
TSAKOS ENERGY NAVIGATION LIMITED
NOTES TO CONSOLIDATED FINANCIAL STATEMENTS
DECEMBER 31, 2002 AND 2003
(Expressed in thousands of United States Dollars)
8. Long-term Debt
Borrower | 2002 | 2003 | ||||||
(a) | Tsakos Energy Navigation Limited | 174,394 | 154,016 | |||||
(b) | Tsakos Energy Navigation Limited | 48,093 | 44,881 | |||||
(c) | Tsakos Energy Navigation Limited | 29,625 | 27,875 | |||||
(d) | Tsakos Energy Navigation Limited | 32,200 | 30,410 | |||||
(e) | Tsakos Energy Navigation Limited | 101,640 | 65,700 | |||||
(f) | Tsakos Energy Navigation Limited | — | 53,000 | |||||
(g) | Tsakos Energy Navigation Limited | — | 25,188 | |||||
(h) | Tsakos Energy Navigation Limited | — | 25,550 | |||||
(i) | Tsakos Energy Navigation Limited | — | 26,000 | |||||
Total | 385,952 | 452,620 | ||||||
Less – current portion | (30,211 | ) | (41,602 | ) | ||||
Long-term portion | 355,741 | 411,018 | ||||||
| (a) | Loan: Balance of U.S. Dollar reducing revolving credit facility obtained in June 1998 to refinance previously outstanding loans, to partially finance the construction cost of the Maria Tsakos, and for working capital purposes. The balance at December 31, 2003 is repayable in six variable semi-annual installments through December 2006 and a balloon payment of $83,331 payable together with the last installment. The interest rates, based on LIBOR plus a spread, at December 31, 2001, 2002 and 2003 were 3.46%, 2.39% and 2.31%, respectively. |
| (b) | Loan: Balance of U.S. Dollar reducing revolving credit facility obtained in March 1999 to refinance a previously outstanding loan and to partially finance the construction cost of the Olympia. The balance at December 31, 2003 is repayable in six variable semi-annual installments through July 2006 and a balloon payment of $33,840 payable in December 2006. The interest rates, based on LIBOR plus a spread, at December 31, 2001, 2002 and 2003 were 4.73%, 2.92% and 2.47%, respectively. |
| (c) | Loan: Balance of U.S. Dollar bank loan obtained in May 2002 to partially finance the acquisition cost of the Opal Queen. The balance at December 31, 2003 is repayable in twenty-one equal semi-annual installments through May 2014 and a balloon payment of $9,500 payable together with the last installment. The interest rates, based on LIBOR plus a spread, at December 31, 2002 and 2003 were 3.83% and 2.44% respectively. The agreement provides an option to the borrower to convert the loan into Euro, Yen or Swiss Francs at the applicable spot rates of exchange. |
| (d) | Loan: Balance of U.S. Dollar bank loan obtained in June 2002 to partially finance the acquisition cost of the Silia T. The balance at December 31, 2003 is repayable in eighteen equal semi-annual installments through June 2012 and a balloon payment of $14,300 payable together with the last installment. The interest rates, based on LIBOR plus a spread, at December 31, 2002 and 2003 were 3.16% and 2.32% respectively. |
F-20
TSAKOS ENERGY NAVIGATION LIMITED
NOTES TO CONSOLIDATED FINANCIAL STATEMENTS
DECEMBER 31, 2002 AND 2003
(Expressed in thousands of United States Dollars)
8. Long-term Debt (continued)
| (e) | Loan:Balance of U.S. Dollar reducing revolving credit facility obtained in four tranches between August 2002 and January 2003 to partially finance the acquisition costs of the Decathlon, Pentathlon, Triathlon and Marathon. On October 15, 2003, following the sale of the Decathlon, an amount of $22,590 was prepaid to the lending bank and on November 17, 2003, following the sale of the Pentathlon, an amount of $36,800 was prepaid to the bank. The balance remaining at December 31, 2003 is repayable in nineteen equal semi-annual installments through January 2013 and a balloon payment of $26,681 payable together with the last installment. The interest rates, based on LIBOR plus a spread, at December 31, 2002 and 2003 were 2.82% and 2.56% respectively. |
| (f) | Loan:Balance of U.S. Dollar bank loan obtained partly ($27,500) in January 2003 to partially finance the acquisition cost of the Maya and partly ($27,500) in March 2003 to partially finance the acquisition cost of the Inca. The balance at December 31, 2003 is repayable in nineteen equal semi-annual installments through July 2013 and a balloon payment of $15,000 payable together with the last installment. The interest rate, based on LIBOR plus a spread, at December 31, 2003 was on aggregate 2.72%. |
| (g) | Loan:Balance of U.S. Dollar bank loan (original amount $26,000) obtained in May 2003 to partially finance the acquisition cost of the Aztec. The balance at December 31, 2003 is repayable in nineteen equal semi-annual installments through May 2013 and a balloon payment of $9,750 payable together with the last installment. The interest rate, based upon LIBOR plus a spread, at December 31, 2003 was 2.10%. |
| (h) | Loan:Balance of U.S. Dollar bank loan (original amount $25,550) obtained in July 2003 to partially finance the acquisition cost of the Parthenon. The balance at December 31, 2003 is repayable in twenty equal semi-annual installments through July 2013 and a balloon payment of $10,050 payable together with the last installment. The interest rate, based upon LIBOR plus a spread, at December 31, 2003 was 2.34%. |
| (i) | Loan:Balance of U.S. Dollar bank loan (original amount $26,000) obtained in September 2003 to partially finance the acquisition cost of the Andes. The balance at December 31, 2003 is repayable in twenty equal semiannual installments through September 2013 and a balloon payment of $11,500 payable together with the last installment. The interest rate, based upon LIBOR plus a spread, at December 31, 2003 was 2.45%. |
The range of the average interest rates of the above executed loans was as follows:
Year ended December 31, 2001 | 5.47% – 5.66% | |
Year ended December 31, 2002 | 2.82% – 3.83% | |
Year ended December 31, 2003 | 2.12% – 2.95% |
Bank loan interest expense for the years ended December 31, 2001, 2002, and 2003 amounted to $12,659, $7,955 and $15,778, respectively, and is included in Interest and finance costs, net in the accompanying consolidated statements of income.
F-21
TSAKOS ENERGY NAVIGATION LIMITED
NOTES TO CONSOLIDATED FINANCIAL STATEMENTS
DECEMBER 31, 2002 AND 2003
(Expressed in thousands of United States Dollars)
8. Long-term Debt (continued)
The loans are secured as follows:
| • | First priority mortgages over theTamyra,Dion,Pella,Libra,Crux,Bregen,Hesnes,Panos G.,Liberty,Vergina II,Victory III,Toula Z.,Athens 2004,Maria Tsakos,Millennium, Opal Queen, Silia T, Triathlon, Maya, Marathon, Inca, Aztec, Parthenon and Andes. |
| • | Assignments of earnings and insurance of the mortgaged vessels, and |
| • | Corporate guarantees of the ship-owning companies. |
The loan agreements include, among other covenants, covenants requiring the borrower to obtain the lenders’ prior consent in order to incur or issue any financial indebtedness, additional borrowings, pay dividends in an amount more than 50% of cumulative net income (as defined in the related agreements), pay stockholders’ loans, sell vessels and assets and change the beneficial ownership or management of the vessels. Also, the covenants require the borrower to maintain a minimum liquidity, a minimum hull value in connection with the vessels’ outstanding loans, insurance coverage of the vessels against all customary risks and maintenance of operating bank accounts with minimum balances.
The annual principal payments required to be made after December 31, 2003 are as follows:
Year | Amount | |
2004 | 41,601 | |
2005 | 43,468 | |
2006 | 162,644 | |
2007 | 16,272 | |
2008 and thereafter | 188,635 | |
| 452,620 | ||
| 9. | Stock Option Plan |
The Company has adopted a Stock Option Plan authorizing the issuance of up to 450,000 options to purchase common shares (the “Plan”). Under the terms of the Plan, stock options granted vest 50% on the grant date and 25% on each of the first and second anniversary dates of the grant, in all instances, subject to achievement of certain performance criteria based on earnings per share. The options expire on the fifth anniversary of the date upon which the option was granted. Options may be granted to directors and officers of the Company or to other persons who are capable of influencing the development of the Company’s business. In August 2001, all outstanding stock options were vested and all Company performance conditions to the exercise of such options were removed by the Board of Directors. As a result, the Company recorded a charge to operations of $34, in the third quarter of 2001.
On July 17, 2001, the Company’s Board of Directors approved the issuance of 163,000 stock options with an exercise price of $12.00 per share (amount in U.S. Dollars) to the directors of the Company and persons employed by Tsakos and Tsakos Energy Management. The compensation expense recognized during 2001 relating to these options was $301, which was equal to the grant date fair value of these options, or $1.85 per share (amount in U.S. Dollars). Such options, which were fully vested and exercisable by August 22, 2001, were valued by application of the Black-Scholes Option Pricing Model using the assumptions set forth below.
F-22
TSAKOS ENERGY NAVIGATION LIMITED
NOTES TO CONSOLIDATED FINANCIAL STATEMENTS
DECEMBER 31, 2002 AND 2003
(Expressed in thousands of United States Dollars)
9. Stock Option Plan (continued)
| 2003 | 2002 | 2001 | ||||||||||||
| Number of Shares | Weighted- average | Number of Shares | Weighted- average | Number of Shares | Weighted- average exercise price U.S.$ | |||||||||
Outstanding at beginning of year | 450,000 | 10.72 | 450,000 | 10.72 | 298,000 | 10.00 | ||||||||
Granted | — | — | — | — | 163,000 | 12.00 | ||||||||
Exercised | (269,000 | ) | 10.00 | — | — | — | — | |||||||
Forfeited | — | — | — | — | (11,000 | ) | 10.00 | |||||||
Outstanding at end of year | 181,000 | 11.80 | 450,000 | 10.72 | 450,000 | 10.72 | ||||||||
Options exercisable at year end | 181,000 | 11.80 | 450,000 | 10.72 | 450,000 | 10.72 | ||||||||
As of December 31, 2003, the weighted-average remaining contractual life of outstanding options is 2.5 years. Cost recognized for options issued to the Directors of the Company and to employees of Tsakos and Tsakos Energy Management, using the fair value method, was $258, $0 and $0, for the years ended December 31, 2001, 2002 and 2003, respectively.
The compensation expense recorded by the Company in connection with all stock options granted has been recognized on the basis of fair value under the methodology prescribed by SFAS No. 123, accordingly there is no further pro-forma data that needs to be disclosed on the Company’s income from continued operations and earnings per share for each of the years in the three year period ended December 31, 2003.
The fair value of options granted, which is amortized to the expense over the option vesting period, is estimated on the date of grant and subsequent reporting dates using the Black-Scholes Option-Pricing Model with the following weighted average assumptions as of December 31, 2001:
Expected life of option (years) | 4 | ||
Risk-Free interest rate | 6.74 | % | |
Expected volatility of the Company’s stock | 108.34 | % | |
Expected dividend yield on Company’s stock | N/A |
10. Deferred Income
| 2002 | 2003 | |||||||
(a) | Gain on Olympia sale-leaseback transaction | 2,654 | 2,654 | |||||
(b) | Gain on Decathlon/Pentathlon sale-leaseback transactions | — | 15,296 | |||||
(c) | Gain on interest rate swap agreements | 3,350 | 2,512 | |||||
Total | 6,004 | 20,462 | ||||||
Less – current portion | (838 | ) | (4,005 | ) | ||||
Long-term portion | 5,166 | 16,457 | ||||||
F-23
TSAKOS ENERGY NAVIGATION LIMITED
NOTES TO CONSOLIDATED FINANCIAL STATEMENTS
DECEMBER 31, 2002 AND 2003
(Expressed in thousands of United States Dollars)
10. Deferred Income (continued)
| (a) | Gain on Olympia Sale-leaseback transaction:In October 1999, the Company sold the Olympia and realized a capital gain of $2,654. The Company entered into a time charter agreement to leaseback the Olympia, for an initial period of approximately eight years, following which, the Company has the first option to annually extend the charter for a further year until December 31, 2011. Alternatively, the lessor has the option to extend the charter for two additional years, through July 19, 2009, which is considered as the earliest expiration date of the charter which is treated as an operating lease. |
The Company, as lessee, if it does not extend the charter, may at specified dates after December 31, 2006, buy the vessel at specified amounts. The lessor has the option to require the Company to buy the vessel for an amount of $15,000, anytime prior to June 30, 2009, and this constitutes a guarantee of the vessel’s residual value. Accordingly, the resulting gain of $2,654 is deferred in full to the extent of the residual guarantee, and will not be recognized in income prior to the date of the exercise of the option by the lessor or the date at which the lease ends without the lessor exercising the option.
Lease payment related to the time charter of the Olympia amounted to $7,041, $7,491, and $7,577 during the years ended December 31, 2001, 2002 and 2003, respectively. At December 31, 2003, the Company’s future minimum lease payments related to the time charter of the Olympia, assuming the vessel owner does not exercise the put option, are as follows:
Year | Amount | |
2004 | 7,688 | |
2005 | 7,759 | |
2006 | 7,853 | |
2007 | 6,366 | |
| 29,666 | ||
As of December 31, 2003, the vessel operated under time charter, expiring in November 2005. The amount receivable under this charter during 2004 and 2005 until expiry of the charter is $13,416.
| (b) | Gain on Decathlon/Pentathlon Sale-leaseback transactions:In October and November 2003, the Company sold the Decathlon and the Pentathlon and time-chartered the vessels (re-named Cape Baker and Cape Balboa respectively) back from the buyer for a minimum period of five years, with options to extend the charters for a further three years. In addition, at the end of the first five years, or until the end of the seventh year if the charter is extended, the Company has the option to buy the vessel at specified amounts. The charter back agreements are accounted for as operating leases and the gains on the sale of $8,340 and $7,497 respectively were deferred and are amortized in proportion to the gross rental charge to expense over the five year lease period. During 2003, lease payments relating to the time charters of the Cape Baker and Cape Balboa were $1,775 and $1,024, respectively. The Company’s future minimum lease payments on these vessels are as follows: |
F-24
TSAKOS ENERGY NAVIGATION LIMITED
NOTES TO CONSOLIDATED FINANCIAL STATEMENTS
DECEMBER 31, 2002 AND 2003
(Expressed in thousands of United States Dollars)
10. Deferred Income (continued)
Year | Cape Baker Amount | Cape Balboa Amount | Total Amount | |||
2004 | 8,326 | 8,326 | 16,652 | |||
2005 | 8,303 | 8,303 | 16,606 | |||
2006 | 8,304 | 8,304 | 16,608 | |||
2007 | 8,304 | 8,304 | 16,608 | |||
2008 | 6,552 | 7,303 | 13,855 | |||
| 39,789 | 40,540 | 80,329 | ||||
| (c) | Gain on Interest Rate Swap Agreements:On June 18, 1998 and September 21, 1998, the Company entered into two interest rate swap agreements for a period of eight years (through December 2006) for a notional amount of $150,000 and $58,800, respectively. Under these agreements, the Company paid a fixed interest rate of 5.99% and 5.54% respectively and received interest at LIBOR. In September 1999, the Company terminated both agreements. The termination yielded a gain of $6,072, which is deferred because the interest rate swap agreements were classified as hedges and as such early termination requires that the gain be amortized into income over the original life of the swap agreements. Amortization of the gain for the years ended December 31, 2001, 2002 and 2003, amounted to $839, $838 and $838, respectively and is included in Interest and finance costs, net in the accompanying consolidated statements of income. |
11. Interest and Finance Costs, Net
| Expense (Income) | |||||||||
| 2001 | 2002 | 2003 | |||||||
Interest on long-term debt, net of capitalized interest | 12,659 | 7,955 | 15,778 | ||||||
Change in fair value of non-hedging financial instruments | 2,406 | 3,822 | (3,543 | ) | |||||
Amortization of loan fees | 286 | 286 | 685 | ||||||
Amortization of deferred gain from termination of swap agreement | (839 | ) | (838 | ) | (838 | ) | |||
Bank charges | 29 | 160 | 290 | ||||||
Total | 14,542 | 11,385 | 12,372 | ||||||
On March 21, 2001, the Company entered into two interest rate swap agreements, of a non-hedging nature, for a period of approximately five years for a notional amount of $104,015 and $50,000, respectively. In June 2001, both agreements were terminated, resulting in a gain of $981, which is included in Interest and finance costs, net in the accompanying consolidated statement of income for the year ended December 31, 2001.
F-25
TSAKOS ENERGY NAVIGATION LIMITED
NOTES TO CONSOLIDATED FINANCIAL STATEMENTS
DECEMBER 31, 2002 AND 2003
(Expressed in thousands of United States Dollars)
11. Interest and Finance Costs, Net (continued)
On July 27, 2001, the Company concluded two interest rate swap agreements for a period of two years for a notional amount of $15,000 and $30,000 respectively, paying a fixed interest rate of 4.39% and 4.38% respectively and receiving interest at LIBOR. In July 2003, these agreements expired. The positive change in the fair value of these swaps during 2003 of $1,251 (negative $204 during 2002) is included in Interest and finance costs, net in the accompanying consolidated statement of income for the year ended December 31, 2002, on the basis that these swap agreements did not meet the hedging criteria of SFAS No. 133.
On July 27, 2001, the Company concluded two interest rate swap agreements for a period of three years (through August 2004) for a notional amount of $80,000 and $20,000, respectively. Under these agreements, the Company pays a fixed interest rate of 4.82% and 4.83%, respectively and receives interest at LIBOR. The fair value of these swap agreements at December 31, 2003, in accordance with SFAS No. 133 was $3,666 and was reflected in Financial Instruments – Fair Value in the accompanying consolidated balance sheet. The positive change in the fair value of these swaps during 2003 of $2,293 (negative $3,618 during 2002) is included in Interest and finance costs, net in the accompanying consolidated statements of income, on the basis that these swap agreements did not meet the hedging criteria of SFAS No. 133.
The Company has entered into a further five interest rate swap arrangements, all of which meet hedging criteria:
On December 19, 2002, the company entered into a five-year interest rate collar swap agreement, which is effective for the period commencing January 2003 through 2008. The notional amount of the swap is $50,000 and it is accounted for as a hedge of the Company’s variable interest rate payments on $50,000 of the loan described in Note 8(e). In accordance with the terms of the swap agreement, the Company receives LIBOR and pays LIBOR up to a cap of 4.5%. In addition, if LIBOR is 2.0% or below, or 3.75% or below, on the swap fixing dates during 2004 and 2005, 2006, 2007, respectively, the Company pays interest at a rate of 4.0%.
On March 28 and April 2, 2003 the Company entered into two five-year interest rate collar swap agreements, which are effective for the periods commencing May 9, 2003 and July 30, 2003. The notional amounts of the swaps are $20,000 and $21,460, respectively, and they are accounted for as a hedge of the Company’s variable interest rate payments on syndicated loans described in Note 8(c and d). In accordance with the terms of the first swap agreement, the Company receives LIBOR and pays LIBOR up to a cap of 4.5%. From May 9, 2004 to 2005, if LIBOR is below 4.5%, but above 1.75%, the Company will pay LIBOR. If LIBOR is at 1.75% or below, up to May 9, 2005, then the Company will pay 3.9%. From May 9, 2005 to 2008, if LIBOR is below 4.5% and above 2.5%, the Company will pay LIBOR, unless LIBOR is at or below 2.5% when the Company will pay 4.5%. In accordance with the terms of the second swap agreement, the Company receives LIBOR and pays LIBOR up to a cap of 4.5%. Between July 30, 2004 to 2005, if LIBOR is at or below 1.75%, the Company will pay 4%. From July 30, 2005 to 2008, if LIBOR is below 4.5% and above 2.75%, the Company will pay LIBOR, unless LIBOR is at or below 2.75% when the Company will pay 4.5%.
F-26
TSAKOS ENERGY NAVIGATION LIMITED
NOTES TO CONSOLIDATED FINANCIAL STATEMENTS
DECEMBER 31, 2002 AND 2003
(Expressed in thousands of United States Dollars)
11. Interest and Finance Costs, Net (continued)
On July 11, 2003, the Company entered into a five-year interest rate collar swap agreement, which is effective for the period commencing July 21, 2003. The notional amount of the swap is $33,840 for the first 4 years and $24,000 for another one year. It is accounted for as a hedge of the Company’s variable interest rate payments on the loan described in Note 8(b). In accordance with the terms of the swap agreement a cap at 3.925% plus spread is in place throughout the five-year period. A floor at the same rate is only activated during the four years commencing July 11, 2004 if LIBOR is below 1.55% during the year commencing July 11, 2004, 2.3% in the year commencing July 11, 2005, and 2.6% in the two years commencing July 11, 2006.
On July 8, 2003, the Company entered into a five-year interest rate collar swap agreement, which is effective for the period commencing January 21, 2004. The notional amount of the swap is $35,990. It is accounted for as a hedge of the Company’s variable interest rate payments on the loan described in Note 8(e). In accordance with the terms of the swap agreement a cap at 4% plus spread is in place throughout the five year period. A floor at 3.5% plus spread is only activated during the four years commencing July 8, 2004 if LIBOR is below 1.6% during the year commencing July 8, 2004, 2.75% in the three years commencing July 8, 2005.
The sum of the fair values of the five swap agreements that meet hedging criteria as at December 31, 2002 and 2003 was $(629) and $(1,431), respectively and was reflected as a liability in 2002 and 2003 and as a component of other comprehensive income in the accompanying consolidated balance sheets. No portion of the hedging instruments has been determined ineffective and therefore excluded from the assessment of hedge effectiveness or recognized in the Company’s statements of income.
12. Additional Paid-In Capital
The amounts shown in the accompanying consolidated balance sheets, as additional paid-in capital, represent either payments made by the stockholders in excess of the par value of common stock purchased by them or proceeds from the exercise of stock options in excess of their par value.
For certain periods during the years, 2001, 2002 and 2003, the Board of Directors authorized the re-purchase of a limited number of shares by the Company with the primary aim of enhancing share liquidity. The transactions were open market based through the Oslo Børs or New York Stock Exchange with a maximum price set by the Board of Directors. Such repurchases for the years ended December 31, 2001, 2002 and 2003 amounted to $378, $1,979, and $1,792, respectively.
13. Earnings Per Common Share
The computation of basic earnings per share is based on the weighted average number of common shares outstanding during the year. The computation of diluted earnings per share assumes the foregoing and the exercise of all stock options (see Note 9) using the treasury stock method.
F-27
TSAKOS ENERGY NAVIGATION LIMITED
NOTES TO CONSOLIDATED FINANCIAL STATEMENTS
DECEMBER 31, 2002 AND 2003
(Expressed in thousands of United States Dollars)
13. Earnings Per Common Share (continued)
The components of the calculation of basic earnings per share and diluted earnings per share are as follows
(amounts in U.S. Dollars):
| 2001 | 2002 | 2003 | |||||||
Income: | |||||||||
Income available to common shareholders | $ | 24,616 | $ | 3,894 | $ | 59,052 | |||
Basic earnings per share: | |||||||||
Weighted average common shares outstanding | 9,634,323 | 15,717,065 | 17,134,347 | ||||||
Diluted earnings per share: | |||||||||
Weighted average common shares outstanding | 9,634,323 | 15,717,065 | 17,134,347 | ||||||
Options | 71,058 | 137,839 | 53,512 | ||||||
Weighted average common shares – diluted | 9,705,381 | 15,854,904 | 17,187,859 | ||||||
Basic earnings per common share | $ | 2.56 | $ | 0.25 | $ | 3.45 | |||
Diluted earnings per common share | $ | 2.54 | $ | 0.25 | $ | 3.44 | |||
14. Income Taxes
Under the laws of the countries of the companies’ incorporation and/or vessels’ registration, the companies are not subject to tax on international shipping income, however, they are subject to registration and tonnage taxes, which have been included in Vessel operating expenses in the accompanying consolidated statements of income, $339, $408 and $315 in the years ended December 31, 2001, 2002 and 2003, respectively.
Pursuant to the Internal Revenue Code of the United States (the “Code”), U.S. source income from the international operations of ships is generally exempt from U.S. tax if the company operating the ships meets certain requirements. Among other requirements, in order to qualify for this exemption, the company operating the ships must be incorporated in a country which grants an equivalent exemption from income taxes to U.S. citizens and U.S. corporations and must be more than 50% owned by individuals who are residents, as defined, in such country or another foreign country that grants an equivalent exemption to U.S. citizens and U.S. corporations or if the stock of the vessel owning company or its holding company is considered to be primarily and regularly traded on a U.S. established securities market for a taxable year and one or more non-qualified persons, each owning 5% or more of the shares, do not own in aggregate 50% or more of the shares. The management of the Company believes that by virtue of the above provisions, it was not subject to tax on its U.S. source income, although sections of the Code are not clear in all respects.
F-28
TSAKOS ENERGY NAVIGATION LIMITED
NOTES TO CONSOLIDATED FINANCIAL STATEMENTS
DECEMBER 31, 2002 AND 2003
(Expressed in thousands of United States Dollars)
15. Contingencies
Various claims, suits, and complaints, including those involving government regulations and product liability, arise in the ordinary course of the shipping business. In addition, losses may arise from disputes with charterers, agents, insurance and other claims with suppliers relating to the operations of the Company’s vessels. Management believes that all such matters are either adequately covered by insurance or are not expected to have a material adverse effect on the Company’s results from operations or financial condition.
The Company accrues for the cost of environmental liabilities when management becomes aware that a liability is probable and is able to reasonably estimate the probable exposure. Currently, management is not aware of any such claims or contingent liabilities, which should be disclosed, or for which a provision should be established in the accompanying consolidated financial statements. A minimum of up to $1,000,000 of the liabilities associated with the individual vessels actions, mainly for sea pollution, are covered by the Protection and Indemnity (P&I) Club insurance.
16. Financial Instruments
The principal financial assets of the Company consist of cash on hand and at banks and accounts receivable due from charterers. The principal financial liabilities of the Company consist of long-term bank loans and accounts payable due to suppliers and derivatives.
| (a) | Interest rate risk:The Company’s interest rates and long-term loan repayment terms are described in Note 8. |
| (b) | Concentration of credit risk:Financial Instruments, which potentially subject the Company to significant concentrations of credit risk consist principally of cash, trade accounts receivable and derivatives. The Company places its temporary cash investments, consisting mostly of deposits, with high credit qualified financial institutions. The Company performs periodic evaluations of the relative credit standing of those financial institutions that are considered in the Company’s investment strategy. The Company does not require collateral on these financial instruments. The Company is exposed to credit risk in the event of non-performance by counterparties to derivative instruments, however, the Company limits this exposure by diversifying among counterparties with high credit ratings. Credit risk with respect to trade accounts receivable is generally diversified due to the large number of entities comprising the Company’s charterer base and their dispersion across many geographic areas. |
| (c) | Fair value:The carrying amounts reflected in the accompanying consolidated balance sheets of financial assets and liabilities approximate their respective fair values due to the short maturity of these instruments. The fair values of long-term bank loans approximate the recorded values, generally due to their variable interest rates. The fair value of the swap agreements discussed in Note 11 equates to the amount that would be paid by the Company to cancel the swaps. Accordingly, the fair market value of the non-hedging swap agreements mentioned above, at December 31, 2003 was $3,666 and was reflected in Financial Instruments – Fair Value in the accompanying consolidated balance sheet. The movement in fair value has been included in Interest and finance costs, net in the accompanying consolidated statements of income ($(3,387) in 2001, $(3,822) in 2002 and $3,543 in 2003). The fair market value of the hedging swap agreements at December 31, 2003 of $(1,431) was reflected in Financial Instruments – Fair Value, and the movement in fair value ($(802) in 2003 and $(629) in 2002) has been included in Other comprehensive income/(loss), in the accompanying 2003 consolidated balance sheet. |
F-29
TSAKOS ENERGY NAVIGATION LIMITED
NOTES TO CONSOLIDATED FINANCIAL STATEMENTS
DECEMBER 31, 2002 AND 2003
(Expressed in thousands of United States Dollars)
17. Subsequent Events
In January 2004, the Company acquired the share capital of Apollo Honour S.A. and Fortune Faith S.A. (both Panamanian companies). The companies entered into an agreement with a shipyard in S. Korea for the construction of two 37,000 DWT 1A ice-class product carriers, with hull numbers 345 and 346 respectively at $29,990 each, with expected delivery in 2006. On March 15, 2004, the Company exercised options to construct two further 37,000 DWT 1A ice-class product carriers with hull numbers 347 and 348 respectively at $29,990 each, with expected delivery in 2007.
In January 2004, the Company acquired options to construct two 1B ice-class product carriers, to be exercised by April 30, 2004.
In January 2004, the Company obtained a term loan facility for $40,000 to partially finance the acquisition of the VLCC M/TMaersk Estelle, which was renamedLa Madrinaon delivery (see Note 6). The loan will be repaid in sixteen variable installments with a balloon payment of $13,500 to be paid together with the last installment. The interest rate is based on LIBOR plus a spread. The loan is secured with a first preferred mortgage over the vessel, an assignment of earnings and insurance of the vessel and a corporate guarantee of the ship-owning company.
In February 2004, the Company acquired the share capital of Mercury Emerald S.A. and Powerful Shipping S.A. (both Panamanian companies). The companies entered into an agreement with a shipyard in S. Korea for the construction of two 162,400 DWT 1A ice-class suezmax crude carriers, with hull numbers 1708 and 1709 respectively at $57,444 each, with expected delivery in 2007.
On February 26, 2004, the Board of Directors resolved that a dividend of $0.50 cents per share will be paid on April 29, 2004 to shareholders of record on April 15, 2004.
F-30
TEN’S FLEETIN 2004
M/T Millennium | ||
Description | : Double Hull - VLCC | |
Total Deadweight | : 301,171 mt | |
Length Overall | : 331.00 m | |
Max. Breadth | : 58.00 m | |
Summer Draft | : 22.22 m | |
Built - Year/Place/Classification Society | : 1998 / Hyundai Heavy Industries South Korea / American Bureau of Shipping | |
M/T La Madrina | ||
Description | : Double Hull - VLCC | |
Total Deadweight | : 299,700 mt | |
Length Overall | : 343.71 m | |
Max. Breadth | : 56.40 m | |
Summer Draft | : 21.60 m | |
Built - Year/Place/Classification Society | : 1994 / Odense Lindoe Denmark / Lloyds Register | |
M/T Silia T1 • Cape Baker2 • Cape Balboa3 • Triathlon4 | ||
Description | : Double Hull - Suezmax Tanker | |
Total Deadweight | : 164,2861/164,2742/164,2363/164,4454 mt | |
Length Overall | : 274.00 m | |
Max. Breadth | : 50.00 m | |
Summer Draft | : 17.00 m | |
Built - Year/Place/Classification Society | : 2002 / Samho South Korea / American Bureau of Shipping | |
M/T Parthenon1 • Marathon2 • Opal Queen2 • Olympia2 • Maria Tsakos2 • Athens 20042 • Toula Z3 | ||
Description | : Double Hull- Aframax Tanker | |
Total Deadweight | : 107,0811/107,1812/107,2223 mt | |
Length Overall | : 246.80 m | |
Max. Breadth | : 42.00 m | |
Summer Draft | : 14.78 m | |
Built - Year/Place/Classification Society | ||
M/T Parthenon • Marathon | : 2003 / Imabari Japan / Det Norske Veritas1- American Bureau of Shipping2 | |
M/T Opal Queen | : 2001 / Imabari Japan / Nipon Kaiji Kyokai | |
M/T Olympia | : 1999 / Imabari Japan / Bureau Veritas | |
M/T Maria Tsakos | : 1998 / Imabari Japan / Lloyds Register | |
M/T Athens 2004 | : 1998 / Imabari Japan / Bureau Veritas | |
M/T Toula Z. | : 1997 / Imabari Japan / American Bureau of Shipping | |
M/T Vergina II | ||
Description | : Aframax Tanker | |
Total Deadweight | : 96,709 mt | |
Length Overall | : 247.20 m | |
Max. Breadth | : 41.60 m | |
Summer Draft | : 13.10 m | |
Built - Year/Place/Classification Society | : 1991 / Poland / American Bureau of Shipping | |
M/T Tamyra • M/T Panos G | ||
Description | : Aframax Tanker | |
Total Deadweight | : 86,843 / 86,983 mt | |
Length Overall | : 243.80 m | |
Max. Breadth | : 39.40 m | |
Summer Draft | : 13.11 m | |
Built - Year/Place/Classification Society | ||
M/T Tamyra | : 1983 / Spain / American Bureau of Shipping | |
M/T Panos G | : 1981 / Spain / Det Norske Veritas | |
80 | ANNUAL REPORT AND ACCOUNTS 2003 |
TEN’S FLEETIN 2004
M/T Maya • Inca • Aztec • Andes | ||
Description | : Double Hull - Panamax Tanker | |
Total Deadweight | : 68,439 mt | |
Length Overall | : 228.50 m | |
Max. Breadth | : 32.20 m | |
Summer Draft | : 13.20 m | |
Built - Year/Place/Classification Society | : 2003 / Imabari Japan / Lloyds Register | |
M/T Liberty | ||
Description | : Panamax Product Tanker | |
Total Deadweight | : 61,375 mt | |
Length Overall | : 225.00 m | |
Max. Breadth | : 32.30 m | |
Summer Draft | : 12.52 m | |
Built - Year/Place/Classification Society | : 1981 / Japan / Lloyds Register | |
M/T Victory III1 • Hesnes2 • Bregen3 | ||
Description | : Double Hull - Panamax Product Tanker | |
Total Deadweight | : 68,1571 / 68,1572 / 68,1603mt | |
Length Overall | : 242.80 m | |
Max. Breadth | : 32.20 m | |
Summer Draft | : 13.62 m | |
Built - Year/Place/Classification Society | ||
M/T Victory III | : 1990 / Ukraine / Det Norske Veritas | |
M/T Hesnes | : 1990 / Ukraine / Bureau Veritas | |
M/T Bregen | : 1989 / Ukraine / American Bureau of Shipping | |
M/T Delos • Dodoni | ||
Description | : Double Hull - Handysize Product /Chemical Tanker | |
Total Deadweight | : 37,000 mt | |
Length Overall | : 176.00 m | |
Max. Breadth | : 31.00 m | |
Summer Draft | : 10.50 m | |
Built - Year/Place/Classification Society | : 2004 / Hyundai Mipo Dockyard South Korea / Lloyds Register | |
M/T Libra • Crux | ||
Description | : Double Side/Single Bottom-Handysize Product Tanker | |
Total Deadweight | : 41,161 mt | |
Length Overall | : 172.20 m | |
Max. Breadth | : 32.30 m | |
Summer Draft | : 11.22 m | |
Built - Year/Place/Classification Society | ||
M/T Libra | : 1988 / Japan / Nippon Kaiji Kyokai | |
M/T Crux | : 1987 / Japan / Nippon Kaiji Kyokai | |
M/T Pella1 • Dion2 | ||
Description | : Single Side/Double Bottom-Handysize Product Tanker | |
Total Deadweight | : 40,2311 / 40,3022 mt | |
Length Overall | : 176.00 m | |
Max. Breadth | : 32.10 m | |
Summer Draft | : 11.22 m | |
Built - Year/Place/Classification Society | ||
M/T Pella | : 1985 / Croatia / Lloyds Register | |
M/T Dion | : 1984 / Croatia / Lloyds Register | |
TEN LIMITED | 81 |
FLEET UNDER CONSTRUCTION
(as of April 27, 2004)
Suezmax M/T Promitheas • Proteas • Orfeas • Aegeas | ||
Description | : 1C Ice Class - Double Hull - Suezmax Tanker | |
Total Deadweight | : 164,000 mt | |
Length Overall | : 274.00 m | |
Max. Breadth | : 50.00 m | |
Summer Draft | : 17.00 m | |
Built - Year/Place/Classification Society | : 2005 - 2006 / Hyundai Heavy Industries South Korea / Lloyds Register | |
Suezmax H/N 1708 • 1709 | ||
Description | : 1A Ice Class - Double Hull - Suezmax Tanker | |
Total Deadweight | : 162,400 mt | |
Length Overall | : 274.00 m | |
Max. Breadth | : 50.00 m | |
Summer Draft | : 17.00 m | |
Built - Year/Place/Classification Society | : 2007 / Hyundai Heavy Industries South Korea / American Bureau of Shipping | |
Handysize M/T Delos1 • Dodoni1 • Dionisos2 • Delphi3 | ||
Description | : Double Hull - Handysize Product /Chemical Tanker | |
Total Deadweight | : 37,000 mt | |
Length Overall | : 176.00 m | |
Max. Breadth | : 31.00 m | |
Summer Draft | : 10.50 m | |
Built - Year/Place/Classification Society | : 20041 / Hyundai Mipo Dockyard South Korea / Lloyds Register | |
| : 20052 / Hyundai Mipo Dockyard South Korea / Lloyds Register | ||
3(on option) | : 20043/ Hyundai Mipo Dockyard South Korea / Lloyds Register | |
Handysize H/N 345 • 346 • 347 • 348 | ||
Description | : 1A Ice Class - Double Hull - Handysize Product /Chemical Tanker | |
Total Deadweight | : 36,660 mt | |
Length Overall | : 183.00 m | |
Max. Breadth | : 27.34 m | |
Summer Draft | : 11.20 m | |
Built - Year/Place/Classification Society | : 2006 - 2007 / Hyundai Mipo Dockyard South Korea / Det Norske Veritas | |
82 | ANNUAL REPORT AND ACCOUNTS 2003 |
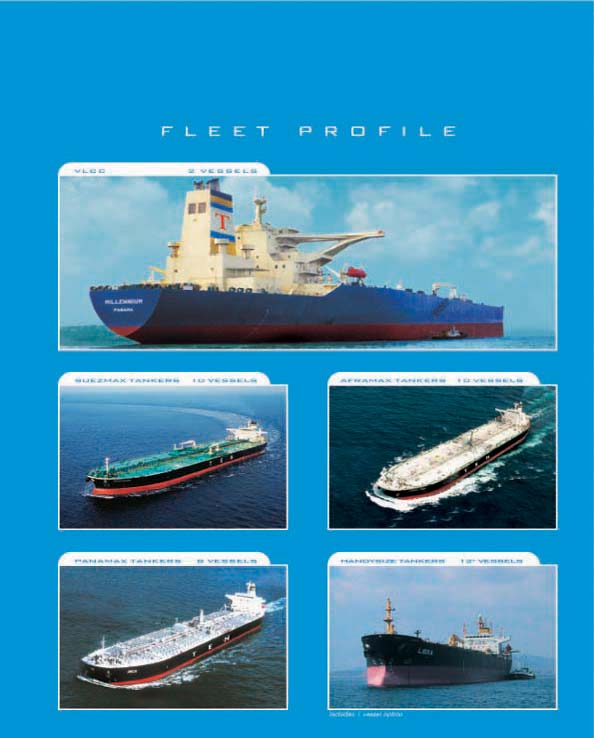
84 | ANNUAL REPORT AND ACCOUNTS 2003 |
TEN Limited shares trade on the New York Stock Exchange, the Oslo Stock Exchange and the Bermuda Stock Exchange under the symbol:
NYSE – TNP
OSLO – TEN
BERMUDA – TEN
There were 17,151,623 million shares outstanding as of December 31, 2003.
Bank of New York serves as transfer agent and registrar for the common shares:
The Bank of New York
111 Eighth Avenue, 11th Floor
New York, NY 10011
Den norske Bank is the Company’s custodian in Norway.
Share price Information
The following table sets forth on a per share basis the high and low sales prices and the average daily trading volume per quarter for consolidated trading in the Company’s common shares on the New York Stock Exchange for each quarter during the 12 months ended December 31, 2003.
Quarter Ended | High | Low | Average Daily Volume during quarter ended | Dividends Declared (Per Share) | ||||||||
March 31, 2003 | $ | 15.15 | $ | 12.00 | 23,067 shares | |||||||
June 30, 2003 | $ | 14.50 | $ | 11.34 | 37,122 shares | $ | 0.20 | * | ||||
September 30, 2003 | $ | 15.08 | $ | 12.95 | 28,855 shares | |||||||
December 31, 2003 | $ | 19.25 | $ | 14.20 | 83,413 shares | $ | 0.50 | ** | ||||
| * | Paid on April 30th 2003 |
| ** | Paid on October 30th 2003 |
Stock information may be accessed through:
Bloomberg under: | “TNP US” | |
| “TEN NO” | ||
| “TEN BH” | ||
Reuters under: | “TEN.OL” | |
Investor Relations
A copy of the Company’s Annual Report on Form 20-F is available by writing or calling to:
Investor Relations
care of George Saroglou/Paul Durham
Tsakos Energy Navigation Limited
367, Syngrou Avenue
175 64 Athens Greece
Tel: + 30 (210) 9407710-13 |  | |
Fax: + 30 (210) 9407716 | ||
Email: ten@tenn.gr | ||
Web Site: www.tenn.gr |