Exhibit 99.4

— President and CEO’s Letter
Dear Shareholder,
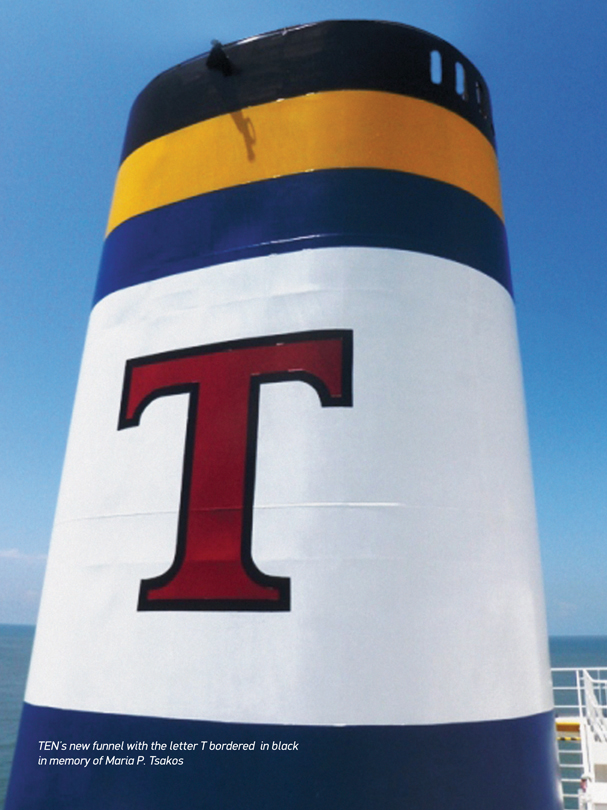
The past year has left a tremendous vacuum in the Tsakos family with the passing away unexpectedly of my beloved sister Maria, a main pillar at the heart of our family. Maria was not just a successful businesswoman; above all she was a charismatic and giving person.
Maria always had time for all of us. She touched and deeply affected many people in her short life and our memory of her will be with us for ever.
The Maria Tsakos Foundation will continue to pursue her efforts, wishes and visions in supporting and educating underprivileged children from all over the world, based in Maria’s home on the Aegean island of Chios.
To all of you who gave, and continue to give, your support in so many ways during this painful period, my family and I would like to say a heartfelt thank you.
The past year was difficult not only on a personal front, but also for the market in which TEN operated. Nevertheless, TEN was able to continue its long run of profitability and fleet modernization in this challenging environment.
At the same time we successfully entered into a new and exciting specialized segment by securing long-term employment for two DP2 shuttle tankers with a major end user. Together with the currently improving market conditions in the LNG sector, these two sectors show great promise in terms of potential returns.
This year has already been marked with a catastrophic natural disaster, the final consequences of which can still not be measured. Our thoughts and support go out to all our Japanese friends. In addition, turmoil has erupted in the Middle East and is likely to continue for some time yet, again with unforeseeable consequences which may affect, one way or another, the environment in which we, and many others, operate in or depend upon.
In these unsettled waters, we maintain our steady course equipped with a modern fleet and a stable strategy and with the support of our colleagues around the world.
Thank you for your support,

Nikolas P. Tsakos
| ANNUAL REPORT AND ACCOUNTS 2010 | >1 |
| Contents | ||||
President and CEO’s Letter | 1 | |||
Chairman’s Letter | 4 | |||
Board of Directors and Officers | 6 | |||
Board Committees | 7 | |||
Shareholder Information | 7 | |||
Financial Highlights | 8 | |||
Forward-Looking Information | 9 | |||
Information on the Company | 9 | |||
Business Overview | 10 | |||
Our Operating Fleet | 12 | |||
Our Newbuildings under Construction | 13 | |||
Fleet Deployment | 13 | |||
Operating and Financial Review and Prospects | 14 | |||
Management’s Report on Internal Control over Financial Reporting | 16 | |||
Financial Statements | F pages | |||
Fleet Details | 48 | |||
| ANNUAL REPORT AND ACCOUNTS 2010 |
— Chairman’s Letter
April 15, 2011
Dear Fellow Shareowners,
Tsakos Energy Navigation (TEN) has completed another year of profitable operations. Indeed, TEN has produced a profit in each year since inception in 1993. This period has marked four significant down-cycles for the tanker industry including the present one. Nevertheless, TEN has grown its fleet from four ships to 51 vessels today, including four new buildings to be delivered through 2013, while it has built a young, growing fleet with an average age of 6.9 years compared with an industry average age of 8.5 years. Through long established relationships with several leading clients it has executed its strategy to serve the diverse and future need of its charterers. This is reflected in its balanced fleet of 24 crude carriers ranging from VLCC’s to Aframaxes, (including two Suezmax DP2 Shuttle tankers and two Suezmax tankers under construction) and 26 product carriers of varying sizes, plus one LNG transporter. Very importantly, 21 of the vessels are ice-class which witnessed several employed at substantial premiums in the recent winter freeze in the Baltic Sea.
This powerful combination of solid client relationships built on quality service, a modern diversified fleet, and a sound financial base supported by a balanced employment policy has enabled TEN to realize its vision as a major factor in the transport of energy.
INDUSTRY CHALLENGES
Protecting the environment is a key priority for all sectors of the transport industry. Regulatory constraints will become tighter. Advanced technology and cleaner burning fuel will impose higher operating costs. Charterers may also become more demanding to protect their interests.
High oil prices and the movement to cleaner fuel have produced significant increases in the costs of bunkers and lubricants. There is also pressure on personnel expenses whenever the value of the dollar depreciates, while the pool of experienced seamen expands much slower than the fleets they serve. Expense management with the emphasis on productivity has become the industry’s watchword. The joint venture between Tsakos interests and Columbia Shipmanagement, called Tsakos Columbia Shipmanagement, assumed the responsibility for technical management of TEN’s fleet in July. The benefits are already evident as we enjoyed a significant reduction in operating expense arising from increased economies of scale. Further benefits will hopefully develop as the partnership matures.
OUTLOOK FOR 2011
The last two years have presented the tanker industry with challenges. Capacity has outstripped demand for tonnage resulting in pressure on charter rates. This relationship will continue in 2011 albeit to a lesser degree. At the same time, cost pressure persists in relation to bunkers, lubricants, repairs and crew wages.
The broad economic outlook remains uncertain. The human toll from Japan’s earthquake and tsunami is heartbreaking. The financial impact is still a matter of speculation. Will it cause a slowdown in the world economic recovery or will the resilience of the Japanese people rapidly overcome the consequences of the disaster? Will it contribute to a spike in energy prices? Will the result be a slackening in demand for oil and its products? Or will it result in a move away from nuclear power back to oil? Inflation fears have already bred the expectation that the developing countries will continue to raise their interest rates and/or capital requirements for lenders. The same holds true for Europe with its fiscal problems. The financial authorities in the USA are under increasing pressure to abate their stimulants despite continuing high unemployment and the real estate woes. We are also faced with the unrest in North Africa and the Middle East.
On a more optimistic note, the developing nations continue to grow at a more sustainable rate and recovery in the developed nations appears to be on a firmer footing.
TEN’s FINANCIAL AND SHARE PERFORMANCE
The record of consistent profitability since 1993 complemented by continuous cash dividends since commencement in October 2002, provide the foundation on which to build future shareholder value.
The strategy of balanced employment with a bias for longer term charters with assured minimum or fixed revenues has maintained high fleet utilization, profitability and sustainable cash flows even in depressed markets keeping TEN’s financial position strong. This has been further enhanced by the highly successful sales and purchases strategy which has produced a young and growing fleet while also generating significant profits of approximately $280 million in the last seven years. Sales and purchases are regarded as a fundamental aspect of our business model and we regard it as a recurring aspect of our profits and cash flow.
We believe the business plan is very sound as evidenced by almost full employment of vessels and a strong balance sheet. Once the tanker industry’s supply/demand returns to normal balance, TEN’s financial results, we believe, will be very rewarding.
TEN’s shares are trading at the levels of early 2004 and 50% of book value. Despite the current depressed valuation TEN has generated exceptional absolute and relative returns for its long-term shareowners. Since listing on the NYSE in March, 2002, the total returns of dividends and appreciation has been 9.73% p.a. as compared with 3.35% for the S&P500 index.
We share your concern with our current share valuation. Management and your board of directors are committed to working towards a higher valuation.
ANNUAL GENERAL MEETING
The shareholders Annual General Meeting (AGM) will be held in Athens on Friday the 3rd of June. We would be most honored and pleased if you join us on this occasion.
Yours sincerely,

D. John Stavropoulos
Chairman of the Board
| ANNUAL REPORT AND ACCOUNTS 2010 | 4< >5 |
— Board of Directors and Officers
D. JOHN STAVROPOULOS
CHAIRMAN
Mr. Stavropoulos served as Executive Vice President and Chief Credit Officer of The First National Bank of Chicago and its parent, First Chicago Corporation, before retiring in 1990 after 33 years with the bank. He chaired the bank’s Credit Strategy Committee, Country Risk Management Council and Economic Council. His memberships in professional societies have included Robert Morris Associates (national director), the Association of Reserve City Bankers and the Financial Analysts Federation. Mr. Stavropoulos was appointed by President George H.W. Bush to serve for life on the Presidential Credit Standards Advisory Committee. Mr. Stavropoulos was elected to the board of directors of Aspis Bank in Greece and served as its Chairman from July 2008 to April 2010. Mr. Stavropoulos was a director of CIPSCO from 1979 to 1992, an instructor of Economics and Finance at Northwestern University from 1962 to 1968, serves as a life member on the EMEA Alumni Advisory Board of the Kellogg School of Management and is a Chartered Financial Analyst.
MICHAEL G. JOLLIFFE
DEPUTY CHAIRMAN
Mr. Jolliffe has been Chairman of Wigham-Richardson Shipbrokers Ltd., one of the oldest established shipbroking companies in the City of London, since 1987 and Chairman of Shipping Spares Repairs and Supplies Ltd., an agency company based in Piraeus, Greece since 1976. Mr. Jolliffe is also the Joint President of Hanjin Eurobulk Ltd., a joint venture between Hanjin Shipping Co., Ltd., of Seoul, Korea and Wigham-Richardson Shipbrokers Ltd. He is also Chairman of StealthGas Inc., a shipping company whose common stock is listed on the Nasdaq Global Select Market. Mr. Jolliffe is also director of INTERNETQ, a tele-marketing company quoted on the London AIM Stock Market and he is chief executive officer of Titan Maritime Ltd., a private shipping company.
PETER NICHOLSON, CBE
DIRECTOR
Mr. Nicholson is trained as a naval architect and spent the majority of his professional career with Camper & Nicholson Limited, the world-famous yacht builder. He became Managing Director of the firm and later, Chairman. When Camper & Nicholson merged with Crest Securities to form Crest Nicholson Plc in 1972, Mr. Nicholson became an executive director, a role he held until 1988 when he became a non-executive in order to pursue a wider range of business interests. Since that time, he has been a non-executive director of Lloyds TSB Group Plc (from 1990 to 2000) and Chairman of Carisbrooke Shipping Plc (from 1990 to 1999). He was a director of various companies in the Marsh Group of insurance brokers. He has served on the boards of a variety of small companies, has been active in the administration of the United Kingdom marine industry and is a trustee of the British Marine Federation. He is a Younger Brother of Trinity House. He was Chairman of the Royal National Lifeboat Institution from 2000 to 2004. In 2010, Mr. Nichols on became partner and Chairman of a limited liability partnership, R.M.G. Wealth Management L.L.P.
ARISTIDES A.N. PATRINOS, Ph.D
DIRECTOR
Dr. Patrinos is President of Synthetic Genomics, Inc. (“SG”), a privately-held company dedicated to developing and commercializing clean and sustainable biofuels that alleviate our dependence on petroleum, enable carbon sequestration and reduce greenhouse gases. He joined SG in February 2006 from the U.S. Department of Energy’s Office of Science. There he served from December 1988 to February 2006 as associate director of the Office of Biological and Environmental Research, overseeing the department’s research activities in human and microbial genome research, structural biology, nuclear medicine, and global environmental change. Dr. Patrinos played a historic role in the Human Genome Project, the founding of the DOE Joint Genome Institute and the design and launch of the DOE’s Genomes to Life Program, a research program dedicated to developing technologies to use microbes for innovative solutions to energy and environmental challenges. He is a Fellow of the American Association for the Advancement of Science and of the American Meteorological Society, and a Member of the American Geophysical Union, the American Society of Mechanical Engineers, and the Greek Technical Society. Recipient of numerous awards and honorary degrees, including three Presidential Rank Awards, two Secretary of Energy Gold Medals, as well as an honorary doctorate from the National Technical University (“NTU”) of Athens. A native of Greece, Dr. Patrinos received his undergraduate degree from the NTU of Athens, and a Ph.D. in mechanical engineering and astronautical sciences from Northwestern University.
FRANCIS T. NUSSPICKEL
DIRECTOR
Mr. Nusspickel is a retired partner of Arthur Andersen LLP with 35 years of public accounting experience. He is a Certified Public Accountant in several U.S. states. During his years with Arthur Andersen, he served as a member of their Transportation Industry Group
and was worldwide Industry Head for the Ocean Shipping segment. His responsibilities included projects for mergers and acquisitions, fraud investigations, arbitrations and debt and equity offerings. He was President of the New York State Society of Certified Public Accountants from 1996 to 1997, a member of the American Institute of Certified Public Accountants (AICPA) Council from 1992 to 1998, and from 2004 to 2007 was Chairman of the Professional Ethics Committee of the New York State Society of Certified Public Accountants. He presently serves as a member of the Joint Trial Board of the AICPA Profession Ethics Executive Committee. Mr. Nusspickel is also a Director of Symmetry Medical Inc., a New York Stock Exchange listed medical device manufacturer.
WILLIAM A. O’NEIL, CMG, CM
DIRECTOR
Mr. O’Neil is Secretary-General Emeritus of the International Maritime Organization, or IMO, the United Nations agency concerned with maritime safety and security and the prevention of pollution from ships. He was first elected Secretary-General of the IMO in 1990 and was re-elected four times, remaining Secretary-General until the end of 2003. Mr. O’Neil has served in various positions with the Canadian Federal Department of Transport and subsequently held senior positions during the construction and operation of the St. Lawrence Seaway Authority. He was appointed the first Commissioner of the Canadian Coast Guard where he served from 1975 until 1980 and then became President and Chief Executive Officer of the St. Lawrence Seaway Authority for ten years. During this period Mr. O’ Neil was a Director of CanArctic Shipping, a Canadian entity engaged in shipping activities in the Canadian Arctic. Mr. O’Neil originally represented Canada in 1972 at the IMO Council, later becoming Chairman of the IMO Council in 1980. In 1991, he became Chancellor of the World Maritime University, Malmo, Sweden and Chairman of the Governing Board of the International Maritime Law Institute in Malta. Mr. O’Neil is a past President of the Institute of Chartered Shipbrokers and is President of Videotel Marine International, both of which are engaged in the training of seafarers. He is a civil engineer graduate of the University of Toronto, a fellow of the Royal Academy of Engineering and the Chairman of the Advisory Board of the Panama Canal Authority.
RICHARD L. PANIGUIAN, CBE
DIRECTOR
Mr. Paniguian was appointed Head of UK Defence and Security Organisation, or DSO, in August 2008, which supports UK defence and security businesses seeking to export and develop joint ventures and partnerships overseas, as well as overseas defence and security businesses seeking to invest in the UK. Previously, Mr. Paniguian pursued a career with BP p.l.c. where he worked for 37 years. He held a wide range of posts with BP in the 1980s – as Commercial Director in the Middle East, Head of International Oil Trading in New York and Head of Capital Markets in London. In the 1990s he completed assignments as a Director of BP Europe, Chief Executive of BP Shipping and subsequently Head of Gas Development in the Middle East and Africa. In 2001 he was appointed Group Vice President for Russia, the Caspian, Middle East and Africa, where he was responsible for developing and delivering BP’s growth strategy in these regions. He played a leading role in support of the TNK-BP joint venture; in delivering the Baku Tbilisi Ceyhan pipeline project; in driving for new gas exploration in Libya, Egypt and Oman; and in completing BP’s first oil project in Angola. In 2007 he was appointed CBE for services to business. Between 2002 and 2007 he was Chairman of the Egyptian British Business Council, and between 2000 and 2002 President of the UK Chamber of Shipping. Mr. Paniguian has a degree in Arabic and Middle East politics and an MBA.
TAKIS ARAPOGLOU
DIRECTOR
From 1978 to 1991, Takis Arapoglou was based in London and worked for Paine Webber, Citicorp Investment Bank and Chase Investment Bank, where he held executive positions in the areas of Corporate Finance, Debt and Equity Capital Markets, Derivatives and Customer Coverage working with North American and European Sovereign, Corporate and Financial Institution customers. In 1991, he was appointed by the Greek Government, Chairman and Chief Executive Offices of the Ionian Bank Group, in Athens. During the same period, he was appointed by the Hellenic Banks Association, Chairman of DIAS S.A., the Greek Interbank Payments System. In 1994, he joined American Express Bank Ltd. in Greece as Senior Country Executive. In 1997, he joined Citibank N.A. in Greece, as Managing Director, Market Manager and Citigroup Country Officer (CCO).In 2000, he returned to London, with Citibank, as Managing Director, Global Industry Head for the Banks & Securities Industry, covering Banks, Broker/Dealers, Consumer Finance companies and Financial Infrastructures, within the Citigroup Global Corporate and Investment Bank. From May 2003 to March 2004, he was Senior Advisor for Financial Institution customers, in Citigroup based in London. From March 2004 until December 2009 he was Chairman and CEO of National Bank of Greece. Mr. Arapoglou holds a B.A. in Mathematics and Physics from the University of Athens, Greece; a B.Sc. in Naval Architecture and Ocean Engineering from the University of Glasgow, Scotland and a M.Sc. in Finance and Management from Brunel University, London.
NIKOLAS P. TSAKOS, Dr.
PRESIDENT & CEO
Mr. Tsakos is the founder, Chief Executive Officer and a director of the Company since inception. He has been involved in ship management since 1981 and has 36 months of seafaring experience. Mr. Tsakos served as an officer in the Hellenic Navy in 1988. He is the former President of the Hellenic Marine Environment Protection Agency (HELMEPA). Mr. Tsakos is a member of the council of the Independent Tanker Owners Association (INTERTANKO), a board member of the UK P&I Club, a board member of the Union of Greek Shipowners (UGS), a council member of the board of the Greek Shipping Co-operation Committee (GSCC) and a council member of the American Bureau of Shipping (ABS), Bureau Veritas (BV) and of the Greek Committee of Det Norske Veritas (DNV) and a board member of Bank of Cyprus. He graduated from Columbia University in New York in 1985 with a degree in Economics and Political Science and obtained a Masters Degree in Shipping, Trade and Finance from City University Business School, London in 1987. In 2011, Mr. Tsakos was awarded an honorary doctorate from the City of London University Business School, for his pioneering work in the equity financial markets relating to shipping companies. Mr. Tsakos is married with three children.
PAUL DURHAM
CHIEF FINANCIAL OFFICER
Mr. Durham joined the Tsakos Group in 1999 and has served as our Chief Financial Officer and Chief Accounting Officer since 2000. Mr. Durham is a United Kingdom Chartered Accountant. From 1989 through 1998, Mr. Durham was employed in Athens with the Latsis Group, a shipping, refinery and banking enterprise, becoming Financial Director of Shipping in 1995. From 1983 to 1989, Mr. Durham was employed by RJR Nabisco Corporation, serving as audit manager for Europe, Asia and Africa until 1986 and then as financial controller of one of their United Kingdom food divisions. Mr. Durham worked with Ernst & Young (London and Paris) from 1972 to 1979 and Deloitte & Touche (Chicago and Athens) from 1979 to 1983.
GEORGE V. SAROGLOU
CHIEF OPERATING OFFICER
Mr. Saroglou has been Chief Operating Officer of the Company since 1996. Mr. Saroglou is a shareholder and director of Pansystems S.A., a leading Greek information technology systems integrator, where he also worked from 1987 until 1994. From 1995 to 1996 he was employed in the Trading Department of the Tsakos Group. He graduated from McGill University in Canada in 1987 with a Bachelors Degree in Science (Mathematics).
VLADIMIR JADRO
CHIEF MARINE OFFICER
Mr. Jadro joined Tsakos Energy Navigation Limited in February 2006. He was appointed Chief Marine Officer of the Company in June 2006. Mr. Jadro was employed by Exxon/ExxonMobil Corp. from 1980 until 2004 in various technical and operational positions including: operations, repairs, new building constructions, off shore conversions and projects of the marine department of ExxonMobil Corp. He was in charge of various tankers and gas carriers form 28,000 dwt to 409,000 dwt, and responsible for the company vetting system. He was also involved in the development of oil companies’ international “SIRE” vessel inspection system. From 1978 until 1980 he was employed by the Bethlehem Steel shipyard. From 1967 until 1977, Mr. Jadro was employed on various tankers starting as third engineer and advancing to Chief Engineer. He is a member of the Society of Naval Architects and Marine Engineers (S.N.A.M.E) and Port Engineers of New York.
— Board Committees
| AUDIT COMMITTEE | CHARTERING COMMITTEE | |
| Francis T.Nusspickel - Chairman | Nikolas P. Tsakos - Chairman | |
| Peter Nicholson | D.John Stavropoulos | |
| D.John Stavropoulos | George V.Saroglou | |
| CAPITAL MARKETS COMMITTEE | RISK COMMITTEE | |
| Michael G.Jolliffe - Chairman | D.John Stavropoulos - Chairman | |
| Takis Arapoglou | Takis Arapoglou | |
| D.John Stavropoulos | Peter Nicholson | |
| Nikolas P. Tsakos | Paul Durham* | |
| Nikolas P.Tsakos | ||
| CORPORATE GOVERNANCE | George V.Saroglou | |
| NOMINATING/COMPENSATION | ||
| COMMITTEE | OPERATIONAL AND | |
| Peter Nicholson - Chairman | ENVIRONMENTAL R&D | |
| Takis Arapoglou | COMMITTEE | |
| Francis T.Nusspickel | William A. O’Neil - Chairman | |
| William A. O’Neil | Francis T.Nusspickel | |
| Richard L.Paniguian | Aristides A.N.Patrinos | |
| Aristides A.N.Patrinos | Vasilis Papageorgiou ** | |
| D.John Stavropoulos | ||
* (Non-Director)
** (Non-Director - Mr. Papageorgiou is the Deputy Chairman of TST)
— Shareholder Information
| • | TEN Ltd shares trade on the New York Stock Exchange and the Bermuda Stock Exchange under the symbol: |
NYSE - TNP
BERMUDA - TEN
| • | As of December 31, 2010 the Company had 46,081,487 shares outstanding. |
| Transfer Agent & Registar | Legal Counsel (New York) | |
| for the shares | Morgan, Lewis & Bockius, LLP | |
| BNY Mellon Shareowner Services | 101 Park Avenue | |
| 480 Washington Boulevard | New York, NY 10178 | |
| Jersey City, NJ 07310-1900 | U.S.A | |
| U.S.A | ||
| Legal Counsel (London) | ||
| Independent Auditors | Holman Fenwick & Willan | |
| Ernst & Young (Hellas) | Friary Court, | |
| Certified Auditors-Accountants S.A. | 65 Crutched Friars | |
| 11th Km National Rd Athens-Lamia | London, EC3N 2AE | |
| 11451 Metamorphosi | United Kingdom | |
| Greece |
| • | Stock information may be accessed through: |
| Bloomberg under: “ TNP US ” | Reuters under: “ TNP.N ” | |
“ TEN BH ” |
| • | A copy of the Company’s Annual Report, on Form 20-F, which is filed with the SEC and contains additional information can be obtained by contacting: |
George V. Saroglou,
Chief Operating Officer: gsaroglou@tenn.gr
Paul Durham,
Chief Financial Officer: pdurham@tenn.gr
Harrys Kosmatos,
Corporate Development Officer: hkosmatos@tenn.gr
| ANNUAL REPORT AND ACCOUNTS 2010 | 6< >7 |
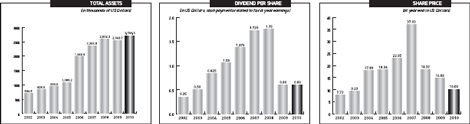
— Financial Highlights
(Expressed in thousands of US Dollars – except for share, per share and vessel data)
| 2010 | 2009 | 2008 | ||||||||||
VOYAGE REVENUES | 408,006 | 444,926 | 623,040 | |||||||||
OPERATING INCOME | 80,695 | 72,405 | 278,838 | |||||||||
NET INCOME | 19,768 | 28,685 | 202,931 | |||||||||
EARNINGS PER SHARE (BASIC) | 0.50 | * | 0.78 | 5.40 | ||||||||
EARNINGS PER SHARE (DILUTED) | 0.50 | * | 0.77 | 5.33 | ||||||||
WEIGHTED AVERAGE OUTSTANDING SHARES (BASIC) | 39,235,601 | 36,940,198 | 37,552,848 | |||||||||
WEIGHTED AVERAGE OUTSTANDING SHARES (DILUTED) | 39,601,678 | 37,200,187 | 38,047,134 | |||||||||
At Year-End: | ||||||||||||
TOTAL ASSETS | 2,702,260 | 2,549,720 | 2,602,317 | |||||||||
TOTAL LIABILITIES | 1,682,330 | 1,635,393 | 1,687,202 | |||||||||
STOCKHOLDERS’ EQUITY | 1,019,930 | 914,327 | 915,115 | |||||||||
OUTSTANDING SHARES | 46,081,487 | 36,916,686 | 37,144,692 | |||||||||
STOCKHOLDERS’ EQUITY PER SHARE OF COMMON STOCK | 22.13 | 24.77 | 24.64 | |||||||||
SHARE PRICE | 10.00 | 14.66 | 18.32 | |||||||||
NUMBER OF VESSELS | 48 | 47 | 46 | |||||||||
TOTAL DWT | 4,961,346 | 4,968,359 | 4,921,862 | |||||||||
AVERAGE DEADWEIGHT AGE OF VESSELS | 6.8 | 6.8 | 6.1 | |||||||||
All share and per share amounts have been restated to give effect to the 2007 two-for-one stock split.
* Includes $3,1 million and $19,1 million impairment charge for 2010 and 2009 respectively.
— Forward-Looking Information
This Annual Report contains forward-looking statements based on beliefs of our management. Any statements contained in this Annual Report that are not historical facts are forward-looking statements as defined in the U.S. Private Securities Litigation Reform Act of 1995. We have based these forward-looking statements on our current expectations and projections about future events, including:
| • | future operating or financial results; |
| • | general economic, market, industry and business conditions; |
| • | global and regional political conditions; |
| • | risks of terrorism, piracy, and other hostilities; |
| • | supply and demand for crude oil and petroleum products; |
| • | our financial condition and liquidity; |
| • | developments in international trade; |
| • | changes in seaborne and other transportation patterns; |
| • | our continued ability to secure profitable employment for our vessels rates; |
| • | vessel acquisitions, capital expenditures and business strategy; |
| • | value of our vessels; |
| • | leveraging the relationships and reputation of our technical managers; |
| • | tanker and product carrier supply and demand; |
| • | environmental and maritime regulations; |
| • | dividend payments and our ability to make such payments; |
| • | interest rate movements; and |
| • | foreign exchange and the strength of the U.S. dollar. |
The words “anticipate,” “believe,” “estimate,” “expect,” “forecast,” “intend,” “may,” “plan,” “project,” “predict,” “should” and “will” and similar expressions as they relate to us are intended to identify such forward-looking statements. Such statements reflect our current views and assumptions and all forward-looking statements are subject to various risks and uncertainties that could cause actual results to differ materially from expectations. The factors that could affect our future financial results are discussed more fully under “Item 3. Key In formation – Risk Factors” as well as elsewhere in the Annual Report on Form 20-F and in our other filings with the U.S. Securities and Exchange Commission (“SEC”). We caution readers of this Annual Report not to place undue reliance on these forward-looking statements, which speak only as of their dates. We undertake no obligation to publicly update or revise any forward-looking statements.
— Information on the Company
Tsakos Energy Navigation Limited is a leading provider of international seaborne crude oil and petroleum product transportation services. In 2007, it also started to transport liquefied natural gas. It was incorporated in 1993 as an exempted company under the laws of Bermuda under the name Maritime Investment Fund Limited. In 1996, Maritime Investment Fund Limited was renamed MIF Limited. Our common shares were listed in 1993 on the Oslo Stock Exchange (OSE) and the Bermuda Stock Exchange, although we de-listed from the OSE in March 2005 due to limited trading. The Company’s shares are no longer actively traded on the Bermuda exchange. In July 2001, the Company’s name was changed to Tsakos Energy Navigation Limited to enhance our brand recognition in the tanker industry, particularly among charterers. In March 2002, we completed an initial public offering of our common shares in the United States and our common shares began trading on the New York Stock Exchange under the ticker symbol “TNP.” Since incorporation, the Company has owned and operated 73 vessels and has sold 27 vessels.
| ANNUAL REPORT AND ACCOUNTS 2010 | 8< >9 |
— Business Overview
Tsakos Energy Navigation Limited is a leading provider of international seaborne crude oil and petroleum product transportation services and, as of March 31, 2011, operated a fleet of 47 modern crude oil carriers and petroleum product tankers that provide world-wide marine transportation services for national, major and other independent oil companies and refiners under long, medium and short-term charters. Our fleet also includes one 2007-built Liquefied Natural Gas (“LNG”) carrier. In addition to the vessels currently operating in our fleet as of March 31, 2011, we are building two additional suezmax tankers, which we expect to take delivery of in the second and third quarters of 2011. In addition, we expect to take delivery the first in a series of two DP2 shuttle tankers in the fourth quarter of 2012 and the second in the first quarter of 2013. The resulting fleet (assuming no further sales) would comprise 51 vessels representing approximately 5.5 million dwt.
We believe that we have established a reputation as a safe, high quality, cost efficient operator of modern and well-maintained tankers. We also believe that these attributes, together with our strategy of proactively working towards meeting our customers’ chartering needs, has contributed to our ability to attract leading charterers as customers and to our success in obtaining charter renewals generating strong fleet utilization.
Our fleet is managed by Tsakos Energy Management Limited, an affiliate company owned by our chief executive officer. Tsakos Energy Management, which performs its services exclusively for our benefit, provides us with strategic advisory, financial, accounting and back-office services. Since July 1, 2010, Tsakos Energy Management subcontracts the technical and operational management of our fleet to Tsakos Columbia Shipmanagement S.A., or TCM. TCM was formed in February 2010 by a Tsakos affiliated company and the German company, Schoeller Holdings Ltd., the owner of the ship management company Columbia Shipmanagement Ltd., or CSM, as a joint-venture ship management company.
TCM, which formally commenced operations on July 1, 2010, now manages the technical and operational activities of all of our vessels apart from three vessels technically managed by other non-affiliated ship managers. TCM is based in Athens, Greece and is staffed primarily with former Tsakos Shipping personnel, in addition to certain CSM executives. TCM and CSM cooperate in the purchase of certain supplies and services on a combined basis. By leveraging the purchasing power of CSM, which currently provides full technical management services for over 130 vessels and crewing services for an additional 200 vessels, we believe TCM is able to procure services and supplies at lower prices than Tsakos Shipping could alone, thereby reducing overall operating expenses for us. We also expect to benefit from CSM’s significant crewing capabilities. In its capacity as technical manager, TCM manages our day-today vessel operations, including maintenance and repair, crewing and supervising newbuilding construction.
Tsakos Shipping will continue to provide commercial management services for our vessels, which include chartering, charterer relations, vessel sale and purchase, and vessel financing.
As of March 31, 2011, our fleet consisted of the following 47 vessels:
Vessel Type | Number of Vessels | |
VLCC | 3 | |
Suezmax | 8 | |
Aframax | 9 | |
Aframax LR2 | 3 | |
Panamax LR1 | 9 | |
Handymax MR2 | 6 | |
Handysize MR1 | 8 | |
LNG carrier | 1 | |
Total | 47 |
Twenty-one of the operating vessels are of ice-class specification. This fleet diversity, which includes a number of sister ships, provides us with the opportunity to be one of the more versatile operators in the market. The current fleet totals approximately 4.9 million dwt, all of which is double-hulled. This compares favorably to the worldwide average of 6% single-hulled dwt as of March 31, 2011. As of March 31, 2011, the average age of the tankers in our current operating fleet was 6.9 years, compared with the industry average of 8.5 years.
In addition to the vessels operating in our fleet as of March 31, 2011, we are building an additional four vessels. We expect delivery of two suezmax tankers in the second and third quarters of 2011. On March 23, 2011 we delivered the aframax tankerOpal Queento its buyers.
We believe the following factors distinguish us from other public tanker companies:
| • | Modern, high-quality, fleet. |
We own a fleet of modern, high-quality tankers that are designed for enhanced safety and low operating costs. Since inception, we have committed to investments of over $3.8 billion, including investments of over $3.2 billion in newbuilding constructions, in order to maintain and improve the quality of our fleet. We believe that increasingly stringent environmental regulations and heightened concerns about liability for oil pollution have contributed to a significant demand for our vessels by leading oil companies, oil traders and major government oil entities. Tsakos Columbia ShipManagement ( TCM ), the technical manager of our fleet, has received ISO 14001 certification, based in part upon audits conducted on our vessels.
| • | Diversified fleet. |
Our diversified fleet, which includes VLCC, suezmax, aframax, panamax, handysize and handymax tankers, as well as one LNG carrier, allows us to better serve our customers’ international crude oil and petroleum product transportation needs. We have also committed a sizeable part of our newbuilding and acquisition program to ice-class vessels. We have 21 ice-class vessels. Additionally, we entered the LNG market with the delivery of our LNG carrier in 2007.
| • | Stability throughout industry cycles. |
Historically, we have employed a high percentage of our fleet on long and medium-term employment with fixed rates or minimum rates plus profit sharing agreements. We believe this approach has resulted in high utilization rates for our vessels. At the same time, we maintain flexibility in our chartering policy to allow us to take advantage of favorable rate trends through spot market employment and contract of affreightment charters with periodic adjustments. Over the last five years, our overall average fleet utilization rate was 97.3%.
| • | Industry recognition. |
For over 38 years, Tsakos entities have maintained relationships with and has achieved acceptance by national, major and other independent oil companies and refiners. Several of the world’s major oil companies and traders, including Houston Refining, PDVSA, ExxonMobil, FLOPEC, Vitol, Shell, BP, Sunoco, Tesoro, Petrobras, Trafigura, Glencore and Neste Oil are among the regular customers of Tsakos Energy Navigation, in particular.
| • | Significant leverage from our relationship with Tsakos Shipping and TCM. |
We believe the expertise, scale and scope of Tsakos Shipping and TCM are key components in maintaining low operating costs, efficiency, quality and safety. We leverage Tsakos Shipping’s reputation and longstanding relationships with leading charterers to foster charter renewals. In addition, due to its anticipated size, we believe that TCM has the ability to spread costs over a larger vessel base than that previously of Tsakos Shipping, thereby capturing even greater economies of scale that may lead to additional cost savings for us.
| ANNUAL REPORT AND ACCOUNTS 2010 | 10< >11 |
— Our Operating Fleet(by Year Acquired)
(as of April 15, 2011)
Vessel Type | Year Built | Year Acquired | Charter Type | |||||||||
VLCC | ||||||||||||
1. Millennium | 1998 | 1998 | bareboat charter | |||||||||
2. La Madrina | 1994 | 2004 | Spot | |||||||||
3. La Prudencia | 1993 | 2006 | Spot | |||||||||
SUEZMAX | ||||||||||||
1. Antarctic | 2007 | 2007 | Time charter | |||||||||
2. Arctic | 2007 | 2007 | Time charter | |||||||||
3. Alaska | 2006 | 2006 | Time charter | |||||||||
4. Archangel | 2006 | 2006 | Time charter | |||||||||
5. Euronike | 2005 | 2005 | Time charter | |||||||||
6. Eurochampion 2004 | 2005 | 2005 | Time charter | |||||||||
7. Triathlon | 2002 | 2002 | Time charter | |||||||||
8. Silia T. | 2002 | 2002 | Time charter | |||||||||
AFRAMAX | ||||||||||||
1. Uraga Princess | 2010 | 2010 | Spot | |||||||||
2. Sapporo Princess | 2010 | 2010 | Spot | |||||||||
3. Asahi Princess | 2009 | 2009 | Spot | |||||||||
4. Ise Princess | 2009 | 2009 | COA | |||||||||
5. Nippon Princess | 2008 | 2008 | Time charter | |||||||||
6. Maria Princess | 2008 | 2008 | Spot | |||||||||
7. Sakura Princess | 2007 | 2007 | COA | |||||||||
8. Izumo Princess | 2007 | 2007 | Spot | |||||||||
9. Propontis | 2006 | 2006 | Time charter | |||||||||
10. Promitheas | 2006 | 2006 | Time charter | |||||||||
11. Proteas | 2006 | 2006 | Time charter | |||||||||
12. Vergina II | 1991 | 1996 | Spot | |||||||||
PANAMAX | ||||||||||||
1. Chantal | 2009 | 2010 | Time charter | |||||||||
2. World Harmony | 2009 | 2010 | Time charter | |||||||||
3. Salamina | 2009 | 2010 | Pool | |||||||||
4. Selini | 2009 | 2010 | Pool | |||||||||
5. Socrates | 2008 | 2008 | Time charter | |||||||||
6. Selecao | 2008 | 2008 | Time charter | |||||||||
7. Andes | 2003 | 2003 | Time charter | |||||||||
8. Inca | 2003 | 2003 | Time charter | |||||||||
9. Maya | 2003 | 2003 | Time charter | |||||||||
HANDYMAX | ||||||||||||
1. Ariadne | 2005 | 2006 | Time charter | |||||||||
2. Afrodite | 2005 | 2006 | Time charter | |||||||||
3. Artemis | 2005 | 2006 | Time charter | |||||||||
4. Apollon | 2005 | 2006 | Time charter | |||||||||
5. Aris | 2005 | 2006 | Pool | |||||||||
6. Ajax | 2005 | 2006 | Pool | |||||||||
HANDYSIZE | ||||||||||||
1. Bosporos | 2007 | 2007 | Spot | |||||||||
2. Byzantion | 2007 | 2007 | Spot | |||||||||
3. Aegeas | 2007 | 2007 | Time charter | |||||||||
4. Andromeda | 2007 | 2007 | Spot | |||||||||
5. Arion | 2006 | 2006 | Pool | |||||||||
6. Amphitrite | 2006 | 2006 | Pool | |||||||||
7. Didimon | 2005 | 2005 | Time charter | |||||||||
8. Delphi | 2004 | 2006 | Time charter | |||||||||
LNG | ||||||||||||
1. Neo Energy | 2007 | 2007 | Time charter | |||||||||
Total Vessels 47 | COA: Contract of Affreightment | |||||||||||
— Our Newbuildings under Construction
As of March 31, 2011, we have on order and expect to take delivery in the second and third quarters of 2011 two suezmaxes under construction by Sungdong Shipbuilding. The newbuildings have a double hull design compliant with all classification requirements and prevailing environmental laws and regulations. On March 21, 2011, the Company ordered two suezmax DP2 shuttle tankers with expected delivery dates the fourth quarter of 2012 and the first quarter of 2013 respectively. Tsakos Shipping has worked closely with the Sungdong yard in South Korea in the design of all the newbuildings and continues to work with the yard during the construction period. TCM provides supervisory personnel present during the construction.
Vessel Type | Expected | Deadweight Tons | Purchase Price(1) (in millions of U.S. dollars) | |||||||
SUEZMAX •Conventional | ||||||||||
1. Spyros K. | 2nd Quarter 2011 | 158,000 | $ | 70.2 | ||||||
2. Dimitris P. | 3rd Quarter 2011 | 158,000 | $ | 70.2 | ||||||
SUEZMAX •DP2 Shuttle Tanker | ||||||||||
3. Hull S7001 | 4th Quarter 2012 | 157,000 | $ | 92.0 | ||||||
4. Hull S7002 | 1st Quarter 2013 | 157,000 | $ | 92.0 | ||||||
Total | 630,000 | $ | 324.4 | |||||||
| (1) | Including extra cost agreed as of March 31, 2011 |
— Fleet Deployment
We strive to optimize the financial performance of our fleet by deploying at least two-thirds of our vessels on either time charters or period employment with variable rates. In the past two years, this proportion has been over 85% as we took proactive steps to meet any potential impact of the expanding world fleet on freight rates. The remainder of the fleet is in the spot market. We believe that our fleet deployment strategy provides us with the ability to benefit from increases in tanker rates while at the same time maintaining a measure of stability through cycles in the industry. The following table details the respective employment basis of our fleet during 2010, 2009 and 2008 as a percentage of operating days.
| Year Ended December 31, | ||||||||||||
Employment Basis | 2010 | 2009 | 2008 | |||||||||
Time Charter - fixed rate | 19 | % | 25 | % | 29 | % | ||||||
Time Charter - variable rate | 45 | % | 44 | % | 54 | % | ||||||
Period Employment at variable rates | 19 | % | 15 | % | 9 | % | ||||||
Spot Voyage | 17 | % | 16 | % | 8 | % | ||||||
Total Net Earnings Days | 16,436 | 16,631 | 15,712 | |||||||||
Tankers operating on time charters may be chartered for several months or years whereas tankers operating in the spot market typically are chartered for a single voyage that may last up to several weeks. Vessels on period employment at variable rates related to the market are either in a pool or operating under contract of affreightment for a specific charterer. Tankers operating in the spot market may generate increased profit margins during improvements in tanker rates, while tankers operating on time charters generally provide more predictable cash flows. Accordingly, we actively monitor macroeconomic trends and governmental rules and regulations that may affect tanker rates in an attempt to optimize the deployment of our fleet. Our fleet has eleven tankers currently operating on spot voyages.
| ANNUAL REPORT AND ACCOUNTS 2010 | 12< >13 |
— Operating and Financial Review and Prospects
The following discussion of our financial condition and results of operations should be read in conjunction with the financial statements and the notes to those statements included elsewhere in this Annual Report. This discussion includes forward-looking statements that involve risks and uncertainties. As a result of many factors our actual results may differ materially from those anticipated in these forward-looking statements.
Overview
The year 2010 saw increasing signs of recovery to the global economy with GDP up 5%, the growth engine being the continued development in Asia, but also the U.S. clearly on the road to recovery albeit without the hoped for reduction in unemployment. Even Europe, beset with national debt problems and taking the long route to recovery through austerity measures, saw some slow growth, primarily in Germany. The recovery and growing global demand for oil, up 3.4% from 2009, gave rise to optimism in the earlier part of the year that 2010 could see a strong recovery in the tanker market by the fourth quarter. Such hope was fueled by increasing use of tankers for storage as the oil price contango moved upwards, from a more relaxed policy by OPEC regarding oil production and from the increased scrapping of older vessels. These hopes dissipated by mid-year as the contango evaporated and more vessels came onto the market, both newbuildings and those released from storage, and inventories of crude and product remained high. The fact that fleet growth was far exceeding vessel demand became more evident towards the fourth quarter as overcapacity pushed industry spot rates to levels near or below vessels’ operating expenses, forcing global fleet utilization to approximately 85%. It was not until December that the crude carrying market saw healthier rates more in line with seasonal expectations, but this was not to last long into 2011. Product carrier rates saw a modest improvement over the previous year, but the market still remained relatively soft.
Some of the more significant developments for the Company during 2010 were:
| • | the delivery of the two aframax tankersSapporo Princess andUraga Princess; |
| • | the sale of the suezmax tankerDecathlon,the aframax tankers,PentathlonandMarathon,and the panamax tankersHesnesandVictory III; |
| • | the acquisition of four new panamax tankers with employment,World Harmony,Chantal,Selini andSalamina; |
| • | the dry-docking ofDidimon, Ariadne, Propontis, Euronike, Eurochampion 2004, La PrudenciaandLa Madrinafor their mandatory special or intermediate survey; |
| • | the continuation of an at-the-market offering, initiated in December 2009, resulting in the sale of approximately 1.2 million common shares for net proceeds of approximately $19.9 million in 2010; |
| • | a follow-on offering of approximately 7.6 million common shares that resulted in net proceeds of $85.1 million; |
| • | the payment to our shareholders of dividends totaling $0.60 per common share with total cash paid out amounting to $22.8 million; |
| • | the charter for 15-year periods of two DP2 suezmax shuttle tankers to be built with delivery expected in the fourth quarter of 2012 and first quarter of 2013, respectively; and |
| • | the agreement to sell the aframax tankerOpal Queen, which was delivered to buyers on March 23, 2011. |
We believe that the key factors which determined our financial performance in 2010, within the given freight rate environment in which we operated, were:
| • | the diversified aspect of the fleet, including our acquisition in recent years of purpose-built vessels to access ice-bound ports and carry LNG (liquefied natural gas), which allowed us to take advantage of all tanker sectors; |
| • | the benefits of the new vessels acquired in recent years in terms of operating efficiencies and desirability on the part of charterers; |
| • | our balanced chartering strategy which ensured a stable cash flow while allowing us to take advantage of any upside in the freight market; |
| • | the long-established relationships with our chartering clients and the development of new relationships with renowned oil- majors; |
| • | the continued control over costs by our technical managers despite pressures caused by rising operating and fuel costs; |
| • | our ability to mitigate financial costs by negotiating competitive terms with reputable banks; |
| • | our ability to manage leverage levels through cash generation and repayment/prepayment of debt; |
| • | our ability to reward our shareholders through a dividend policy; |
| • | our ability to raise new financing through bank debt at competitive terms despite the current tight credit environment; and |
| • | the sale of vessels when attractive opportunities arise. |
We believe that the above factors will also be those that will be behind our future financial performance and will play an especially significant role in the current world economic climate as we proceed through 2011. To these may be added:
| • | a possible recovery in the crude charter market in the latter part of the year; |
| • | the securing of a high level of utilization for our vessels (as at March 31, 2011, 62% of the operational days available for 2011, and 35% for 2012, excluding expected new deliveries, have secured employment); |
| • | the continued appetite by oil majors to fix vessels on medium to long term charters at economic rates; |
| • | the delivery of the two newbuilding suezmaxes that will join the fleet in 2011 and the newbuilding suezmax DP2 shuttle tankers to be delivered in 2012 and 2013; and |
| • | the build up of our cash reserves through operations, vessel sales and possible equity issuance. |
| ANNUAL REPORT AND ACCOUNTS 2010 | 14< >15 |
— Management’s Report on Internal
Control over Financial Reporting
The management of Tsakos Energy Navigation Limited and its subsidiaries (the “Company”), according to Rule 13a-15(f) of the Securities Exchange Act of 1934, is responsible for the establishment and maintenance of adequate internal controls over financial reporting for the Company. Internal control over financial reporting is a process designed to provide reasonable assurance regarding the reliability of financial reporting and the preparation of the Company’s financial statements for external reporting purposes in accordance with U.S. generally accepted accounting principles. However, in any system of internal control there are inherent limitations and consequently internal control over financial reporting may not absolutely prevent or detect misstatements.
The Company’s system of internal control over financial reporting includes policies and procedures that:
| (i) | pertain to the maintenance of records that, in reasonable detail, accurately and fairly reflect the transactions and dispositions of the assets of the Company; |
| (ii) | provide reasonable assurance that transactions are recorded as necessary to permit preparation of financial statements in accordance with U.S. generally accepted accounting principles, and that receipts and expenditures of the Company are being made only in accordance with authorizations of management and directors of the Company, and |
| (iii) | provide reasonable assurance regarding prevention or timely detection of unauthorized acquisition, use, or disposition of the Company’s assets that could have a material effect on the financial statements. |
Management has performed an assessment of the effectiveness of the Company’s internal control over financial reporting as of December 31, 2010, based on the criteria established within Internal Control-Integrated Framework issued by the Committee of Sponsoring Organizations of the Treadway Commission.
Based on our assessment, management has determined that the Company’s internal control over financial reporting as of December 31, 2010, is effective.
| Nikolas P. Tsakos | Paul Durham | |
| President and Chief Executive Officer | Chief Financial Officer | |
 |  |
Date: April 8, 2011

TSAKOS ENERGY NAVIGATION LIMITED AND SUBSIDIARIES
CONSOLIDATED FINANCIAL STATEMENTS
2010
TSAKOS ENERGY NAVIGATION LIMITED AND SUBSIDIARIES
INDEX TO CONSOLIDATED FINANCIAL STATEMENTS
| Page | ||||
Reports of Independent Registered Public Accounting Firm | F-1 | |||
Consolidated Balance Sheets as of December 31, 2010 and 2009 | F-3 | |||
Consolidated Statements of Income for the years ended December 31, 2010, 2009 and 2008 | F-4 | |||
Consolidated Statements of Stockholders’ Equity for the years ended December 31, 2010, 2009 and 2008 | F-5 | |||
Consolidated Statements of Cash Flows for the years ended December 31, 2010, 2009 and 2008 | F-6 | |||
Notes to Consolidated Financial Statements | F-7 | |||
REPORT OF INDEPENDENT REGISTERED PUBLIC ACCOUNTING FIRM
To the Board of Directors and Shareholders of
TSAKOS ENERGY NAVIGATION LIMITED
We have audited the accompanying consolidated balance sheets of TSAKOS ENERGY NAVIGATION LIMITED and subsidiaries as of December 31, 2010 and 2009, and the related consolidated statements of income, stockholders’ equity, and cash flows for each of the three years in the period ended December 31, 2010. These financial statements are the responsibility of the Company’s management. Our responsibility is to express an opinion on these financial statements based on our audits.
We conducted our audits in accordance with the standards of the Public Company Accounting Oversight Board (United States). Those standards require that we plan and perform the audit to obtain reasonable assurance about whether the financial statements are free of material misstatement. An audit includes examining, on a test basis, evidence supporting the amounts and disclosures in the financial statements. An audit also includes assessing the accounting principles used and significant estimates made by management, as well as evaluating the overall financial statement presentation. We believe that our audits provide a reasonable basis for our opinion.
In our opinion, the financial statements referred to above present fairly, in all material respects, the consolidated financial position of TSAKOS ENERGY NAVIGATION LIMITED and subsidiaries at December 31, 2010 and 2009, and the consolidated results of its operations and its cash flows for each of the three years in the period ended December 31, 2010, in conformity with U.S. generally accepted accounting principles.
We also have audited, in accordance with the standards of the Public Company Accounting Oversight Board (United States), TSAKOS ENERGY NAVIGATION LIMITED and subsidiaries’ internal control over financial reporting as of December 31, 2010, based on criteria established in Internal Control-Integrated Framework issued by the Committee of Sponsoring Organizations of the Treadway Commission and our report dated April 8, 2011 expressed an unqualified opinion thereon.
Athens, Greece
April 8, 2011
REPORT OF INDEPENDENT REGISTERED PUBLIC ACCOUNTING FIRM
To the Board of Directors and Shareholders of
TSAKOS ENERGY NAVIGATION LIMITED
We have audited TSAKOS ENERGY NAVIGATION LIMITED and subsidiaries’ internal control over financial reporting as of December 31, 2010, based on criteria established in Internal Control- Integrated Framework issued by the Committee of Sponsoring Organizations of the Treadway Commission (the COSO criteria). TSAKOS ENERGY NAVIGATION LIMITED and subsidiaries’ management is responsible for maintaining effective internal control over financial reporting, and for its assessment of the effectiveness of internal control over financial reporting included in the accompanying Management’s Report on Internal Control over Financial Reporting. Our responsibility is to express an opinion on the company’s internal control over financial reporting based on our audit.
We conducted our audit in accordance with the standards of the Public Company Accounting Oversight Board (United States). Those standards require that we plan and perform the audit to obtain reasonable assurance about whether effective internal control over financial reporting was maintained in all material respects. Our audit included obtaining an understanding of internal control over financial reporting, assessing the risk that a material weakness exists, testing and evaluating the design and operating effectiveness of internal control based on the assessed risk, and performing such other procedures as we considered necessary in the circumstances. We believe that our audit provides a reasonable basis for our opinion.
A company’s internal control over financial reporting is a process designed to provide reasonable assurance regarding the reliability of financial reporting and the preparation of financial statements for external purposes in accordance with generally accepted accounting principles. A company’s internal control over financial reporting includes those policies and procedures that (1) pertain to the maintenance of records that, in reasonable detail, accurately and fairly reflect the transactions and dispositions of the assets of the company; (2) provide reasonable assurance that transactions are recorded as necessary to permit preparation of financial statements in accordance with generally accepted accounting principles, and that receipts and expenditures of the company are being made only in accordance with authorizations of management and directors of the company; and (3) provide reasonable assurance regarding prevention or timely detection of unauthorized acquisition, use, or disposition of the company’s assets that could have a material effect on the financial statements.
Because of its inherent limitations, internal control over financial reporting may not prevent or detect misstatements. Also, projections of any evaluation of effectiveness to future periods are subject to the risk that controls may become inadequate because of changes in conditions, or that the degree of compliance with the policies or procedures may deteriorate.
In our opinion, TSAKOS ENERGY NAVIGATION LIMITED and subsidiaries maintained, in all material respects, effective internal control over financial reporting as of December 31, 2010, based on the COSO criteria.
We also have audited, in accordance with the standards of the Public Company Accounting Oversight Board (United States), the consolidated balance sheets of TSAKOS ENERGY NAVIGATION LIMITED and subsidiaries as of December 31, 2010 and 2009, and the related consolidated statements of income, stockholders’ equity, and cash flows for each of the three years in the period ended December 31, 2010 and our report dated April 8, 2011 expressed an unqualified opinion thereon.
Athens, Greece
April 8, 2011
TSAKOS ENERGY NAVIGATION LIMITED AND SUBSIDIARIES
CONSOLIDATED BALANCE SHEETS
DECEMBER 31, 2010 AND DECEMBER 31, 2009
(Expressed in thousands of U.S. Dollars - except share data)
| 2010 | 2009 | |||||||
| ASSETS | ||||||||
CURRENT ASSETS: | ||||||||
Cash and cash equivalents | $ | 276,637 | $ | 296,181 | ||||
Restricted cash | 6,291 | 6,818 | ||||||
Accounts receivable, net (Note 1(e)) | 24,417 | 12,661 | ||||||
Insurance claims | 5,018 | 3,814 | ||||||
Due from related companies (Note 2) | 2,977 | 5,359 | ||||||
Advances and other | 4,789 | 6,158 | ||||||
Vessels held for sale (Note 1(i)) | 26,986 | 120,877 | ||||||
Inventories | 14,011 | 13,014 | ||||||
Prepaid insurance and other | 2,949 | 3,431 | ||||||
Current portion of financial instruments-Fair value (Note 7) | 3,378 | 3,334 | ||||||
Total current assets | 367,453 | 471,647 | ||||||
INVESTMENTS (Note 3) | 1,000 | 1,000 | ||||||
FINANCIAL INSTRUMENTS - FAIR VALUE, net of current portion (Note 7) | 498 | 3,112 | ||||||
FIXED ASSETS (Notes 1(g), 1(h), 4) | ||||||||
Advances for vessels under construction | 81,882 | 49,213 | ||||||
Vessels | 2,638,550 | 2,335,031 | ||||||
Accumulated depreciation | (403,485 | ) | (325,066 | ) | ||||
Vessels’ Net Book Value | 2,235,065 | 2,009,965 | ||||||
Total fixed assets | 2,316,947 | 2,059,178 | ||||||
DEFERRED CHARGES, net (Note 5) | 16,362 | 14,783 | ||||||
Total assets | $ | 2,702,260 | $ | 2,549,720 | ||||
| LIABILITIES AND STOCKHOLDERS’ EQUITY | ||||||||
CURRENT LIABILITIES: | ||||||||
Current portion of long-term debt (Note 6) | $ | 133,819 | $ | 172,668 | ||||
Payables | 23,914 | 29,223 | ||||||
Due to related companies (Note 2) | 779 | 40 | ||||||
Accrued liabilities | 10,576 | 15,273 | ||||||
Accrued bank interest | 6,481 | 6,079 | ||||||
Unearned revenue | 9,189 | 11,265 | ||||||
Current portion of financial instruments - Fair value (Note 7) | 32,486 | 29,683 | ||||||
Total current liabilities | 217,244 | 264,231 | ||||||
LONG-TERM DEBT, net of current portion (Note 6) | 1,428,648 | 1,329,906 | ||||||
FINANCIAL INSTRUMENTS - FAIR VALUE, net of current portion (Note 7) | 36,438 | 41,256 | ||||||
STOCKHOLDERS’ EQUITY: | ||||||||
Common stock, $ 1.00 par value; 100,000,000 shares authorized; 46,081,487 issued and outstanding at December 31, 2010 and 37,671,392 issued at December 31, 2009. | 46,081 | 37,671 | ||||||
Additional paid-in capital | 350,946 | 266,706 | ||||||
Retained earnings | 671,480 | 679,597 | ||||||
| 1,068,507 | 983,974 | |||||||
Cost of treasury stock (nil and 754,706 shares) | — | 17,863 | ||||||
| 1,068,507 | 966,111 | |||||||
Accumulated other comprehensive loss | (52,329 | ) | (57,731 | ) | ||||
Noncontrolling Interest | 3,752 | 5,947 | ||||||
Total stockholders’ equity | 1,019,930 | 914,327 | ||||||
Total liabilities and stockholders’ equity | $ | 2,702,260 | $ | 2,549,720 | ||||
The accompanying notes are an integral part of these consolidated financial statements.
F-3
TSAKOS ENERGY NAVIGATION LIMITED AND SUBSIDIARIES
CONSOLIDATED STATEMENTS OF INCOME
FOR THE YEARS ENDED DECEMBER 31, 2010, 2009 AND 2008
(Expressed in thousands of U.S. Dollars - except share and per share data)
| 2010 | 2009 | 2008 | ||||||||||
VOYAGE REVENUES: | $ | 408,006 | $ | 444,926 | $ | 623,040 | ||||||
EXPENSES: | ||||||||||||
Commissions | 13,837 | 16,086 | 22,997 | |||||||||
Voyage expenses | 85,813 | 77,224 | 83,065 | |||||||||
Charter hire expense (Note 4) | 1,905 | — | 13,487 | |||||||||
Vessel operating expenses | 126,022 | 144,586 | 143,757 | |||||||||
Depreciation | 92,889 | 94,279 | 85,462 | |||||||||
Amortization of deferred dry-docking costs | 4,553 | 7,243 | 5,281 | |||||||||
Management fees (Note 2(a)) | 14,143 | 13,273 | 12,015 | |||||||||
General and administrative expenses | 3,627 | 4,069 | 4,626 | |||||||||
Management incentive award (Note 2(a)) | 425 | — | 4,750 | |||||||||
Stock compensation expense (Note 8) | 1,068 | 1,087 | 3,046 | |||||||||
Foreign currency (gains) / losses | (378 | ) | 730 | 915 | ||||||||
Amortization of deferred gain on sale of vessels | — | — | (634 | ) | ||||||||
Net gain on sale of vessels | (19,670 | ) | (5,122 | ) | (34,565 | ) | ||||||
Vessel impairment charge (Notes 1(h), 4, 13) | 3,077 | 19,066 | — | |||||||||
Total expenses | 327,311 | 372,521 | 344,202 | |||||||||
Operating income | 80,695 | 72,405 | 278,838 | |||||||||
OTHER INCOME (EXPENSES): | ||||||||||||
Interest and finance costs, net (Note 7) | (62,283 | ) | (45,877 | ) | (82,897 | ) | ||||||
Interest income | 2,626 | 3,572 | 8,406 | |||||||||
Other, net | (3 | ) | 75 | (350 | ) | |||||||
Total other expenses, net | (59,660 | ) | (42,230 | ) | (74,841 | ) | ||||||
Net income | 21,035 | 30,175 | 203,997 | |||||||||
Less: Net income attributable to the noncontrolling interest | (1,267 | ) | (1,490 | ) | (1,066 | ) | ||||||
Net income attributable to Tsakos Energy Navigation Limited | $ | 19,768 | $ | 28,685 | $ | 202,931 | ||||||
Earnings per share, basic attributable to Tsakos Energy Navigation Limited common shareholders | $ | 0.50 | $ | 0.78 | $ | 5.40 | ||||||
Earnings per share, diluted attributable to Tsakos Energy Navigation Limited common shareholders | $ | 0.50 | $ | 0.77 | $ | 5.33 | ||||||
Weighted average number of shares, basic | 39,235,601 | 36,940,198 | 37,552,848 | |||||||||
Weighted average number of shares, diluted | 39,601,678 | 37,200,187 | 38,047,134 | |||||||||
The accompanying notes are an integral part of these consolidated financial statements.
F-4
TSAKOS ENERGY NAVIGATION LIMITED AND SUBSIDIARIES
CONSOLIDATED STATEMENTS OF STOCKHOLDERS’ EQUITY
FOR THE YEARS ENDED DECEMBER 31, 2010, 2009 AND 2008
(Expressed in thousands of U.S. Dollars - except share and per share data)
| Additional | Treasury Stock | Accumulated Other | Tsakos Energy | |||||||||||||||||||||||||||||||||||||
| Comprehensive Income (Loss) | Common Stock | Paid-in Capital | Retained Earnings | Shares | Amount | Comprehensive Income (Loss) | Navigation Limited | Noncontrolling Interest | Total | |||||||||||||||||||||||||||||||
BALANCE, December 31, 2007 | $ | 38,059 | $ | 273,036 | $ | 567,220 | — | — | $ | (23,775 | ) | $ | 854,540 | $ | 3,391 | $ | 857,931 | |||||||||||||||||||||||
Net income | $ | 203,997 | 202,931 | 202,931 | 1,066 | 203,997 | ||||||||||||||||||||||||||||||||||
- Repurchase and cancellation of common stock (392,400 shares) | (393 | ) | (2,425 | ) | (9,414 | ) | (12,232 | ) | (12,232 | ) | ||||||||||||||||||||||||||||||
- Purchase of Treasury stock | 812,700 | (21,937 | ) | (21,937 | ) | (21,937 | ) | |||||||||||||||||||||||||||||||||
- Issuance of 4,650 shares of restricted share units | 5 | (5 | ) | — | — | |||||||||||||||||||||||||||||||||||
- Treasury stock granted to employees as part of stock compensation plan | (7,720 | ) | (286,000 | ) | 7,720 | — | — | |||||||||||||||||||||||||||||||||
- Cash dividends declared and paid ($1.80 per share) | (67,226 | ) | (67,226 | ) | (67,226 | ) | ||||||||||||||||||||||||||||||||||
- Fair value of financial instruments | (48,464 | ) | (48,464 | ) | (48,464 | ) | (48,464 | ) | ||||||||||||||||||||||||||||||||
- Amortization of restricted share units | 3,046 | 3,046 | 3,046 | |||||||||||||||||||||||||||||||||||||
Comprehensive income | $ | 155,533 | ||||||||||||||||||||||||||||||||||||||
| �� | ||||||||||||||||||||||||||||||||||||||||
BALANCE, December 31, 2008 | $ | 37,671 | $ | 265,932 | $ | 693,511 | 526,700 | $ | (14,217 | ) | $ | (72,239 | ) | $ | 910,658 | $ | 4,457 | $ | 915,115 | |||||||||||||||||||||
Net income | $ | 30,175 | $ | 28,685 | $ | 28,685 | $ | 1,490 | $ | 30,175 | ||||||||||||||||||||||||||||||
- Purchase of Treasury stock (245,400 shares) | 245,400 | (4,058 | ) | (4,058 | ) | (4,058 | ) | |||||||||||||||||||||||||||||||||
- Proceeds from Stock Issuance Program | (313 | ) | (154 | ) | (17,394 | ) | 412 | (55 | ) | (55 | ) | |||||||||||||||||||||||||||||
- Cash dividends declared and paid ($1.15 per share) | (42,445 | ) | (42,445 | ) | (42,445 | ) | ||||||||||||||||||||||||||||||||||
- Fair value of financial instruments | 14,508 | 14,508 | 14,508 | 14,508 | ||||||||||||||||||||||||||||||||||||
- Amortization of restricted share units | 1,087 | 1,087 | 1,087 | |||||||||||||||||||||||||||||||||||||
Comprehensive income | $ | 44,683 | ||||||||||||||||||||||||||||||||||||||
BALANCE, December 31, 2009 | $ | 37,671 | $ | 266,706 | $ | 679,597 | 754,706 | $ | (17,863 | ) | $ | (57,731 | ) | $ | 908,380 | $ | 5,947 | $ | 914,327 | |||||||||||||||||||||
Net income | $ | 21,035 | $ | 19,768 | $ | 19,768 | $ | 1,267 | $ | 21,035 | ||||||||||||||||||||||||||||||
- Proceeds from Stock Issuance Program | (156 | ) | (5,036 | ) | (754,706 | ) | 17,863 | 12,671 | 12,671 | |||||||||||||||||||||||||||||||
- Issuance of common stock under Stock Issuance Program | 446 | 6,596 | 7,042 | 7,042 | ||||||||||||||||||||||||||||||||||||
- Issuance of common stock-offering | 7,622 | 77,074 | 84,696 | 84,696 | ||||||||||||||||||||||||||||||||||||
- Issuance of 341,650 shares of restricted share units | 342 | (342 | ) | — | — | |||||||||||||||||||||||||||||||||||
- Cash dividends paid ($0.60 per share) | (22,849 | ) | (22,849 | ) | (22,849 | ) | ||||||||||||||||||||||||||||||||||
- Distribution from Subsidiary to non controlling interest | — | (3,462 | ) | (3,462 | ) | |||||||||||||||||||||||||||||||||||
- Fair value of financial instruments | 5,402 | 5,402 | 5,402 | 5,402 | ||||||||||||||||||||||||||||||||||||
- Amortization of restricted share units | 1,068 | 1,068 | 1,068 | |||||||||||||||||||||||||||||||||||||
Comprehensive income | $ | 26,437 | ||||||||||||||||||||||||||||||||||||||
BALANCE December 31, 2010 | $ | 46,081 | $ | 350,946 | $ | 671,480 | — | $ | — | $ | (52,329 | ) | $ | 1,016,178 | $ | 3,752 | $ | 1,019,930 | ||||||||||||||||||||||
The accompanying notes are an integral part of these consolidated financial statements.
F-5
TSAKOS ENERGY NAVIGATION LIMITED AND SUBSIDIARIES
CONSOLIDATED STATEMENTS OF CASH FLOWS
FOR THE YEARS ENDED DECEMBER 31, 2010, 2009 AND 2008
(Expressed in thousands of U.S. Dollars)
| 2010 | 2009 | 2008 | ||||||||||
Cash Flows from Operating Activities: | ||||||||||||
Net income | $ | 21,035 | $ | 30,175 | $ | 203,997 | ||||||
Adjustments to reconcile net income to net cash provided by operating activities: | ||||||||||||
Depreciation | 92,889 | 94,279 | 85,462 | |||||||||
Amortization of deferred dry-docking costs | 4,553 | 7,243 | 5,281 | |||||||||
Amortization of loan fees | 1,138 | 877 | 944 | |||||||||
Amortization of deferred income | — | — | (634 | ) | ||||||||
Stock compensation expense | 1,068 | 1,087 | 3,046 | |||||||||
Change in fair value of derivative instruments | 5,957 | (12,552 | ) | 15,470 | ||||||||
Gain on sale of vessels | (19,670 | ) | (5,122 | ) | (34,565 | ) | ||||||
Vessel impairment charge | 3,077 | 19,066 | — | |||||||||
Payments for dry-docking | (6,055 | ) | (4,347 | ) | (11,374 | ) | ||||||
(Increase) Decrease in: | ||||||||||||
Receivables | (9,209 | ) | 9,142 | 5,728 | ||||||||
Inventories | (997 | ) | (2,095 | ) | 1,180 | |||||||
Prepaid insurance and other | 482 | (453 | ) | 1,052 | ||||||||
Increase (Decrease) in: | ||||||||||||
Payables | (4,570 | ) | 1,106 | (9,142 | ) | |||||||
Accrued liabilities | (4,295 | ) | (17,801 | ) | 4,926 | |||||||
Unearned revenue | (2,076 | ) | (3,444 | ) | 2,770 | |||||||
Net Cash provided by Operating Activities | 83,327 | 117,161 | 274,141 | |||||||||
Cash Flows from Investing Activities: | ||||||||||||
Advances for vessels under construction and acquisitions | (67,024 | ) | (22,762 | ) | (3,471 | ) | ||||||
Vessel acquisitions and/or improvements | (313,639 | ) | (103,269 | ) | (223,266 | ) | ||||||
Proceeds from the sale of vessels | 140,548 | 50,463 | 62,100 | |||||||||
Net Cash used in Investing Activities | (240,115 | ) | (75,568 | ) | (164,637 | ) | ||||||
Cash Flows from Financing Activities: | ||||||||||||
Proceeds from long-term debt | 235,024 | 80,750 | 168,050 | |||||||||
Financing costs | (1,870 | ) | (1,044 | ) | (382 | ) | ||||||
Payments of long-term debt | (175,131 | ) | (91,805 | ) | (44,363 | ) | ||||||
Decrease/(increase) in restricted cash | 527 | 763 | (692 | ) | ||||||||
Repurchase and cancellation of common stock | — | — | (12,232 | ) | ||||||||
Purchase of treasury stock | — | (4,058 | ) | (21,937 | ) | |||||||
Proceeds from stock issuance program, net | 105,005 | 258 | — | |||||||||
Cash dividend | (22,849 | ) | (42,445 | ) | (67,226 | ) | ||||||
Distribution from subsidiary to noncontrolling interest owners | (3,462 | ) | — | — | ||||||||
Net Cash provided by/(used in) Financing Activities | 137,244 | (57,581 | ) | 21,218 | ||||||||
Net (decrease)/increase in cash and cash equivalents | (19,544 | ) | (15,988 | ) | 130,722 | |||||||
Cash and cash equivalents at beginning of year | 296,181 | 312,169 | 181,447 | |||||||||
Cash and cash equivalents at end of year | $ | 276,637 | $ | 296,181 | $ | 312,169 | ||||||
Interest paid | 57,353 | 67,490 | 68,213 | |||||||||
Cash paid for interest, net of amounts capitalized | ||||||||||||
The accompanying notes are an integral part of these consolidated financial statements.
F-6
TSAKOS ENERGY NAVIGATION LIMITED AND SUBSIDIARIES
NOTES TO CONSOLIDATED FINANCIAL STATEMENTS
DECEMBER 31, 2010, 2009 AND 2008
(Expressed in thousands of U.S. Dollars, except for share and per share data, unless otherwise stated)
| 1. | Significant Accounting Policies |
| (a) | Basis of presentation and description of business: The accompanying consolidated financial statements have been prepared in accordance with U.S. generally accepted accounting principles (“U.S. GAAP”) and include the accounts of Tsakos Energy Navigation Limited (the “Holding Company”), and its wholly-owned and majority-owned subsidiaries (collectively, the “Company”). All intercompany balances and transactions have been eliminated upon consolidation. |
Effective January 1, 2009, the Company adopted new guidance issued by the FASB for the noncontrolling interest in a subsidiary and for the deconsolidation of a subsidiary. This guidance defines a noncontrolling interest, previously called a minority interest, as the portion of equity in a subsidiary not attributable, directly or indirectly, to the Company. This guidance requires, among other items, that a noncontrolling interest be included in the consolidated statement of financial position within equity separate from the Company’s equity; consolidated net income to be reported at amounts inclusive of both the Company’s and noncontrolling interest’s shares and, separately, the amounts of consolidated net income attributable to the Company and noncontrolling interest all on the consolidated statement of income; and if a subsidiary is deconsolidated, any retained noncontrolling equity investment in the former subsidiary be measured at fair value and a gain or loss be recognized in net income based on such fair value. The 2008 financial information has been adjusted so the basis of presentation is consistent with that of the 2009 and 2010 financial information. The adoption of this guidance did not have a material effect on our consolidated statement of financial position, results of operations or cash flows.
The Holding Company consolidates voting interest entities in which it owns all, or at least a majority of the voting interest. A voting interest entity is an entity in which the total equity investment at risk is sufficient to enable the entity to finance itself independently and provides the equity holders with the obligation to absorb losses, the right to receive residual returns and the right to make financial and operating decisions.
As at December 31, 2010, 2009 and 2008, the Holding Company consolidated two variable interest entities (“VIE”) for which it is deemed to be the primary beneficiary, i.e. it has a controlling financial interest in those entities. A VIE is an entity that in general does not have equity investors with voting rights or that has equity investors that do not provide sufficient financial resources for the entity to support its activities. A controlling financial interest in a VIE is present when a company absorbs a majority of an entity’s expected losses, receives a majority of an entity’s expected residual returns, or both.
The Company owns and operates a fleet of crude and product oil carriers and one LNG carrier providing worldwide marine transportation services under long, medium or short-term charters.
| (b) | Use of Estimates:The preparation of financial statements in conformity with U.S. GAAP requires management to make estimates and assumptions that affect the amounts of assets and liabilities reported in the consolidated financial statements and the accompanying notes. Actual results could differ from those estimates. |
F-7
TSAKOS ENERGY NAVIGATION LIMITED AND SUBSIDIARIES
NOTES TO CONSOLIDATED FINANCIAL STATEMENTS
DECEMBER 31, 2010, 2009 AND 2008
(Expressed in thousands of U.S. Dollars, except for share and per share data, unless otherwise stated)
| 1. | Significant Accounting Policies (continued) |
| (c) | Foreign Currency Translation:The functional currency of the Company is the U.S. Dollar because the Company’s vessels operate in international shipping markets in which the U.S. Dollar is utilized to transact most business. The accounting books of the Company are also maintained in U.S. Dollars. Transactions involving other currencies during the year are converted into U.S. Dollars using the exchange rates in effect at the time of the transactions. At the balance sheet dates, monetary assets and liabilities, which are denominated in other currencies, are translated into U.S. Dollars at the year-end exchange rates. Resulting gains or losses are separately reflected in the accompanying Consolidated Statements of Income. |
| (d) | Cash and Cash Equivalents:The Company classifies highly liquid investments such as time deposits and certificates of deposit with original maturities of three months or less as cash and cash equivalents. Minimum cash deposits required to be maintained with banks for loan and interest rate swap compliance purposes and deposits with certain banks that may only be used for the purpose of loan repayments are classified as Restricted cash. |
| (e) | Trade Accounts Receivable, Net:Trade accounts receivable, net at each balance sheet date includes estimated recoveries from charterers for hire, freight and demurrage billings and revenue earned but not yet billed, net of an allowance for doubtful accounts (nil as of December 31, 2010 and nil as of December 31, 2009). Revenue earned but not yet billed amounted to $9,774 and $4,851 as of December 31, 2010 and 2009, respectively. The Company’s management regularly reviews all outstanding invoices and provides allowances for receivables deemed uncollectible. |
| (f) | Inventories: Inventories consist of bunkers, lubricants, victualling and stores and are stated at the lower of cost or market value. The cost is determined primarily by the first-in, first-out method. |
| (g) | Fixed Assets: Fixed assets consist primarily of vessels. Vessels are stated at cost, less accumulated depreciation. The cost of vessels includes the contract price and pre-delivery costs incurred during the construction of new buildings, including capitalized interest, and expenses incurred upon acquisition of second-hand vessels. Subsequent expenditures for conversions and major improvements are capitalized when they appreciably extend the life, increase the earning capacity or improve the efficiency or safety of the vessels; otherwise they are charged to expense as incurred. Expenditures for routine repairs and maintenance are expensed as incurred. |
Depreciation is provided on the straight-line method based on the estimated remaining economic useful lives of the vessels, less an estimated residual value based on a scrap price. Economic useful lives are estimated at 25 years for crude and product oil carriers and 40 years for the LNG carrier from the date of original delivery from the shipyard. Scrap prices have increased over the past seven years. Accordingly, effective January 1, 2008, the Company made a change in estimate related to the scrap price for all of its vessels from $180 per lightweight ton to $300 per lightweight ton.
F-8
TSAKOS ENERGY NAVIGATION LIMITED AND SUBSIDIARIES
NOTES TO CONSOLIDATED FINANCIAL STATEMENTS
DECEMBER 31, 2010, 2009 AND 2008
(Expressed in thousands of U.S. Dollars, except for share and per share data, unless otherwise stated)
| 1. | Significant Accounting Policies (continued) |
| (h) | Impairment of Vessels: The Company reviews vessels for impairment whenever events or changes in circumstances indicate that the carrying amount of a vessel may not be recoverable, such as during severe disruptions in global economic and market conditions. When such indicators are present, a vessel to be held and used is tested for recoverability by comparing the estimate of future undiscounted net operating cash flows expected to be generated by the use of the vessel over its remaining useful life and its eventual disposition to its carrying amount. Net operating cash flows are determined by applying various assumptions regarding future revenues net of commissions, operating expenses, scheduled dry-dockings, expected off-hire and scrap values, and taking into account historical revenue data and published forecasts on future world economic growth and inflation. Should the carrying value of the vessel exceed its estimated future undiscounted net operating cash flows, impairment is measured based on the excess of the carrying amount over the fair market value of the asset. The Company determines the fair value of its vessels based on management estimates and assumptions and by making use of available market data and taking into consideration third party valuations. The review of the carrying amounts in connection with the estimated recoverable amount for certain of the Company’s vessels as of December 31, 2010 and 2009 indicated an impairment charge (Note 4). There was no impairment charge recorded in 2008. |
| (i) | Reporting Assets held for sale:It is the Company’s policy to dispose of vessels and other fixed assets when suitable opportunities occur and not necessarily to keep them until the end of their useful life. Long-lived assets classified as held for sale are measured at the lower of their carrying amount or fair value less cost to sell. These assets are not depreciated once they meet the criteria to be held for sale. At December 31, 2010, the aframax vesselOpal Queenwas classified as held for sale. At December 31, 2009, the suezmax vesselDecathlon,the aframaxesMarathonandParthenonand the panamaxesHesnes andVictory III were classified as held for sale. |
| (j) | Accounting for Special Survey and Dry-docking Costs: The Company follows the deferral method of accounting for dry-docking and special survey costs whereby actual costs incurred are reported in Deferred Charges and are amortized on a straight-line basis over the period through the date the next dry-docking is scheduled to become due. Costs relating to routine repairs and maintenance are expensed as incurred. The unamortized portion of special survey and dry-docking costs for a vessel that is sold is included as part of the carrying amount of the vessel in determining the gain on sale of the vessel. |
| (k) | Loan Costs:Costs incurred for obtaining new loans or refinancing existing loans are capitalized and included in deferred charges and amortized over the term of the respective loan, using the effective interest rate method. Any unamortized balance of costs relating to loans repaid or refinanced as debt extinguishments is expensed in the period the repayment or extinguishment is made. |
F-9
TSAKOS ENERGY NAVIGATION LIMITED AND SUBSIDIARIES
NOTES TO CONSOLIDATED FINANCIAL STATEMENTS
DECEMBER 31, 2010, 2009 AND 2008
(Expressed in thousands of U.S. Dollars, except for share and per share data, unless otherwise stated)
| 1. | Significant Accounting Policies (continued) |
| (l) | Accounting for Revenue and Expenses:Voyage revenues are generated from freight billings and time charter hire. Time charter revenue, including bare-boat hire, is recorded over the term of the charter as the service is provided. Revenues from voyage charters on the spot market or under contract of affreightment are recognized ratably from when a vessel becomes available for loading (discharge ofthe previous charterer’s cargo) to when the next charterer’s cargo is discharged, provided an agreed non-cancelable charter between the Company and the charterer is in existence, the charter rate is fixed or determinable and collectability is reasonably assured. Revenue under voyage charters will not be recognized until a charter has been agreed even if the vessel has discharged its previous cargo and is proceeding to an anticipated port of loading. Vessel voyage and operating expenses and charter hire expense are expensed when incurred. Unearned revenue represents cash received prior to the year end for which related service has not been provided, primarily relating to charter hire paid in advance to be earned over the applicable charter period. The operating revenues and voyage expenses of vessels operating under a tanker pool are pooled and are allocated to the pool participants on a time charter equivalent basis, according to an agreed formula. Revenues from variable hire arrangements are recognized to the extent the variable amounts earned beyond an agreed fixed minimum hire are determinable at the reporting date and all other revenue recognition criteria are met. |
Voyage revenues for 2010, 2009 and 2008, included revenues derived from significant charterers as follows (in percentages of total voyage revenues):
Charterer | 2010 | 2009 | 2008 | |||||||||
A | 16 | % | 14 | % | 15 | % | ||||||
B | 10 | % | 10 | % | 11 | % | ||||||
C | 9 | % | 9 | % | 10 | % | ||||||
| (m) | Segment Reporting:The Company does not evaluate the operating results by type of vessel or by type of charter or by type of cargo. Although operating results may be identified by type of vessel, management, including the chief operating decision maker, reviews operating results primarily by revenue per day and operating results of the fleet. Thus the Company has determined that it operates in one reportable segment, the worldwide maritime transportation of crude and refined oil. In 2007, the Company acquired a liquefied natural gas (LNG) carrier. This is the only vessel of its kind that the Company currently operates and, as it does not meet the quantitative thresholds used to determine reportable segments, the LNG carrier segment is not a reportable segment. The Company’s vessels operate on many trade routes throughout the world and, therefore, the provision of geographic information is considered impracticable by management. |
F-10
TSAKOS ENERGY NAVIGATION LIMITED AND SUBSIDIARIES
NOTES TO CONSOLIDATED FINANCIAL STATEMENTS
DECEMBER 31, 2010, 2009 AND 2008
(Expressed in thousands of U.S. Dollars, except for share and per share data, unless otherwise stated)
| 1. | Significant Accounting Policies (continued) |
| (n) | Derivative Financial Instruments: The Company regularly enters into interest rate swap contracts to manage its exposure to fluctuations of interest rates associated with its specific borrowings. Also the Company enters bunker swap contracts to manage its exposure to fluctuations of bunker prices associated with the consumption of bunkers by its vessels. Interest rate and bunker price differentials paid or received under these swap agreements are recognized as part of interest expense related to the hedged debt. All derivatives are recognized in the consolidated financial statements at their fair value. On the inception date of the derivative contract, the Company designates the derivative as a hedge of a forecasted transaction or the variability of cash flow to be paid (“cash flow” hedge). Changes in the fair value of a derivative that is qualified, designated and highly effective as a cash flow hedge are recorded in other comprehensive income until earnings are affected by the forecasted transaction or the variability of cash flow and are then reported in earnings. Changes in the fair value of undesignated derivative instruments and the ineffective portion of designated derivative instruments are reported in earnings in the period in which those fair value changes have occurred. Realized gains or losses on early termination of undesignated derivative instruments are also classified in earnings in the period of termination of the respective derivative instrument. Realized gains or losses on early termination of the derivative instruments are also classified in earnings in the period of termination of the respective derivative instrument. |
The Company formally documents all relationships between hedging instruments and hedged items, as well as the risk-management objective and strategy for undertaking various hedge transactions. This process includes linking all derivatives that are designated as cash flow hedges to specific forecasted transactions or variability of cash flow. The Company also formally assesses, both at the hedge’s inception and on an ongoing basis, whether the derivatives that are used in hedging transactions are highly effective in offsetting changes in cash flow of hedged items. When it is determined that a derivative is not highly effective as a hedge or that it has ceased to be a highly effective hedge, the Company discontinues hedge accounting prospectively.
| (o) | Fair Value Measurements: When assets or liabilities in the financial statements are to be measured at fair value, the Company defines fair value as the price that would be received to sell an asset or paid to transfer a liability in an orderly transaction between market participants (Note 13). The Company has elected not to report any existing financial assets or liabilities at fair value that are not already reported as such. |
| (p) | Accounting for Leases:Leases of assets under which substantially all the risks and rewards of ownership are effectively retained by the lessor are classified as operating leases. Lease payments under an operating lease are recognized as an expense on a straight-line method over the lease term. The Company held no operating leases at December 31, 2010. |
| (q) | Stock Based Compensation:The Company has a share based incentive plan that covers directors and officers of the Company and employees of the related companies discussed in Note 2. Awards granted are valued at fair value and compensation cost is recognized on a straight line basis, net of estimated forfeitures, over the requisite service period of each award. The fair value of restricted stock issued to crew members, directors and officers of the Company at the grant date is equal to the closing stock price on that date and is amortized over the applicable vesting period using the straight-line method. The fair value of restricted stock issued to non-employees is equal to the closing stock price at the grant date adjusted by the closing stock price at each reporting date and is amortized over the applicable performance period (Note 8). |
F-11
TSAKOS ENERGY NAVIGATION LIMITED AND SUBSIDIARIES
NOTES TO CONSOLIDATED FINANCIAL STATEMENTS
DECEMBER 31, 2010, 2009 AND 2008
(Expressed in thousands of U.S. Dollars, except for share and per share data, unless otherwise stated)
| 1. | Significant Accounting Policies (continued) |
| (r) | Recent Accounting Pronouncements:In January 2010, the FASB issued an Accounting Standards Update (ASU) No. 2010-06, “Fair Value Measurements and Disclosures (Topic 820): Improving Disclosures about Fair Value Measurements.” The updated guidance requires new disclosures to separately disclose the amounts of significant transfers in and out of Levels 1 and 2 fair value measurements and describe the reasons for the transfers; and in the reconciliation for fair value measurements using significant unobservable inputs (Level 3), a reporting entity should present separately information about purchases, sales, issuances, settlements. The updated guidance also clarifies existing disclosures related to the level of disaggregation, and disclosures about inputs and valuation techniques. The new disclosures and clarifications of existing disclosures are effective for interim and annual reporting periods beginning after December 15, 2009, except for the disclosures about purchases, sales, issuances, and settlements in the roll forward of activity in Level 3 fair value measurements. Those disclosures are effective for fiscal years beginning after December 15, 2010, and for interim periods within those fiscal years. We do not expect the adoption of this guidance to have an effect on our consolidated statement of financial position, results of operations or cash flows. |
| 2. | Transactions with Related Parties |
The following amounts were charged by related parties for services rendered:
| 2010 | 2009 | 2008 | ||||||||||
Tsakos Shipping and Trading S.A. (commissions) | 6,276 | 6,086 | 7,707 | |||||||||
Tsakos Energy Management Limited (management fees) | 13,843 | 12,973 | 11,715 | |||||||||
Tsakos Columbia Shipmanagement S.A. | 634 | — | — | |||||||||
Argosy Insurance Company Limited | 9,361 | 10,316 | 8,277 | |||||||||
AirMania Travel S.A. | 437 | 727 | 1,309 | |||||||||
Total expenses with related parties | 30,551 | 30,102 | 29,008 | |||||||||
Balances due from and to related parties are as follows:
| December 31, | ||||||||
| 2010 | 2009 | |||||||
Due from related parties | ||||||||
Tsakos Shipping and Trading S.A. | 2,977 | 2,681 | ||||||
Argosy Insurance Company Limited | — | 2,678 | ||||||
Total due from related parties | 2,977 | 5,359 | ||||||
Due to related parties | ||||||||
Tsakos Energy Management Limited | 75 | 22 | ||||||
Tsakos Columbia Shipmanagement Ltd | 56 | — | ||||||
Argosy Insurance Company Limited | 612 | — | ||||||
AirMania Travel S.A. | 36 | 18 | ||||||
Total due to related parties | 779 | 40 | ||||||
F-12
TSAKOS ENERGY NAVIGATION LIMITED AND SUBSIDIARIES
NOTES TO CONSOLIDATED FINANCIAL STATEMENTS
DECEMBER 31, 2010, 2009 AND 2008
(Expressed in thousands of U.S. Dollars, except for share and per share data, unless otherwise stated)
| 2. | Transactions with Related Parties (continued) |
| (a) | Tsakos Energy Management Limited (the “Management Company”):The Holding Company has a Management Agreement (“Management Agreement”) with the Management Company, a Liberian corporation, to provide overall executive and commercial management of its affairs for a monthly fee. Per the Management Agreement of March 8, 2007, effective from January 1, 2008, there is a prorated adjustment if at beginning of each year the Euro has appreciated by 10% or more against the U.S. Dollar since January 1, 2007. In addition, there is an increase each year by a percentage figure reflecting 12 month Euribor, if both parties agree. As a consequence, from January 1, 2010, monthly management fees for operating vessels were $24.0 per owned vessel and $17.7 for chartered in vessels or for owned vessels chartered out on a bare-boat basis ($23.7 and $17.5 respectively in 2009, and $23.0 and $17.0, respectively, in 2008). From July 1, 2010, the monthly management fees for operating vessels were increased to $27.0 per owned vessel except for the LNG carrier which bears a monthly fee of $32.0 of which $7.0 is paid to the Management Company and $25.0 to a third party manager. The monthly management fees for chartered-in vessels or for owned vessels chartered out on a bare-boat basis were increased to $20.0. It was agreed that no further increase would be implemented at the beginning of 2011. |
In addition to the management fee, the Management Agreement provides for an incentive award to the Management Company, which is at the absolute discretion of the Holding Company’s Board of Directors. The incentive award program is based on the Company’s annual return on equity (“ROE”). In 2009, there was no such award. For 2008 the amount of $4,750 was awarded. For 2010, the Board of Directors resolved to award a special award of $425. The awards are expensed and recognized in accrued liabilities in the accompanying Consolidated Financial Statements where applicable.
The Holding Company and the Management Company have certain officers and directors in common. The President, who is also the Chief Executive Officer and a Director of the Holding Company, is also the sole stockholder of the Management Company. The Management Company may unilaterally terminate its Management Agreement with the Holding Company at any time upon one year’s notice. In addition, if even one director was elected to the Holding Company’s Board of Directors without having been recommended by the existing board, the Management Company would have the right to terminate the Management Agreement on ten days notice, and the Holding Company would be obligated as at December 31, 2010 to pay the Management Company an amount of approximately $134,044 calculated in accordance with the terms of the Management Agreement. Under the terms of the Management Agreement between the Holding Company and the Management Company, the Holding Company may terminate the Management Agreement only under specific circumstances, without the prior approval of the Holding Company’s Board of Directors.
F-13
TSAKOS ENERGY NAVIGATION LIMITED AND SUBSIDIARIES
NOTES TO CONSOLIDATED FINANCIAL STATEMENTS
DECEMBER 31, 2010, 2009 AND 2008
(Expressed in thousands of U.S. Dollars, except for share and per share data, unless otherwise stated)
| 2. | Transactions with Related Parties (continued) |
| (a) | Tsakos Energy Management Limited (continued):Estimated future management fees payable over the next ten years under the Management Agreement, exclusive of any incentive awards and based on existing vessels and known vessels as at December 31, 2010, scheduled for future delivery, are: |
Year | Amount | |||
2011 | 15,529 | |||
2012 | 15,552 | |||
2013 | 15,573 | |||
2014 | 15,636 | |||
2015 to 2020 | 83,352 | |||
| 145,642 | ||||
Management fees for vessels are included in the accompanying Consolidated Statements of Income. Also, under the terms of the Management Agreement, the Management Company provides supervisory services for the construction of new vessels for a monthly fee of $17.7 per vessel in the first half of 2010 and $20.0 from July 1, 2010, $17.5 per vessel in 2009 and $17.0 in 2008. These fees in total amounted to $620, $858 and $1,222 during the years ended December 31, 2010, 2009 and 2008, respectively, and are either accounted for as part of construction costs for delivered vessels or are included in Advances for vessels under construction.
| (b) | Tsakos Columbia Shipmanagement S.A. (“TCM”):The Management Company appointed TCM to provide technical management to the Company’s vessels from July 1, 2010. TCM is owned jointly and in equal part by Tsakos family private interests and by a private German Group. TCM, at the consent of the Holding Company, may subcontract all or part of the technical management of any vessel to an alternative unrelated technical manager. |
Effective July 1, 2010, the Management Company, at its own expense, pays technical management fees to TCM, and the Company bears and pays directly to TCM most of its operating expenses, including repairs and maintenance, provisioning and crewing of the Company’s vessels, as well as certain charges which are capitalized or deferred, including reimbursement of the costs of TCM personnel sent overseas to supervise repairs and perform inspections on Company vessels.
| (c) | Tsakos Shipping and Trading S.A. (“Tsakos Shipping”):Until June 30, 2010 the Management Company had appointed Tsakos Shipping to provide technical management to the Company’s vessels. From July 1, 2010 such technical management is performed by TCM, while Tsakos Shipping continues to provide services to the Company’s vessels as described below. Certain members of the Tsakos family are involved in the decision-making processes of Tsakos Shipping and of the Management Company, and are also shareholders of the Holding Company. |
F-14
TSAKOS ENERGY NAVIGATION LIMITED AND SUBSIDIARIES
NOTES TO CONSOLIDATED FINANCIAL STATEMENTS
DECEMBER 31, 2010, 2009 AND 2008
(Expressed in thousands of U.S. Dollars, except for share and per share data, unless otherwise stated)
| 2. | Transactions with Related Parties (continued) |
| (c) | Tsakos Shipping and Trading S.A. (continued):Tsakos Shipping provides chartering services for the Company’s vessels by communicating with third party brokers to solicit research and propose charters. For this service, the Company pays to Tsakos Shipping a chartering commission of approximately 1.25% on all freights, hires and demurrages. Such commissions are included in Commissions in the accompanying Consolidated Statements of Income. Tsakos Shipping also provides sale and purchase of vessels brokerage service. For this service, Tsakos Shipping may charge brokerage commission. In 2010 and 2009 this commission was approximately 1% of the sale price of a vessel. |
Up to June 30, 2010, the Management Company, at its own expenses, paid technical management fees to Tsakos Shipping, and the Company paid directly to Tsakos Shipping most of its operating expenses, including repairs and maintenance, provisioning and crewing of the Company’s vessels, as well as certain charges which are capitalized or deferred, including reimbursement of the costs of Tsakos Shipping personnel sent overseas to supervise repairs and perform inspections on Company vessels. Commissions due to Tsakos Shipping by the Company have been netted-off against amounts due from Tsakos Shipping for advances made, and the net amount is included in Due from related Companies.
| (d) | Other affiliated companies:On July 19, 2010, the Company signed agreements to purchase two panamax tankers,Chantaland World Harmony,with attached time charters, from affiliated companies for $54,500 each. The vessels were delivered to the Company on August 10, 2010 and July 23, 2010, respectively (Note 4). The attached time charters were determined to be at fair market value (Note 13(c)); therefore, no gains or losses were recognized upon assumption of the time charters. |
On July 22, 2010, the Company exercised an option to purchase two panamax tankers,Salamina andSelini,from affiliated companies for $54,500 million each. On October 20, 2010, the Company signed agreements to purchase theSalamina andSelini with attached pool employment arrangements. The vessels were delivered to the Company on November 12, 2010 and October 26, 2010, respectively (Note 4). The attached pool employment arrangements were at market rates (Note 13(c)); therefore, no gains or losses were recognized upon assumption of the pool employment arrangements.
The remaining unpaid loan balances of $43,924 and $42,100 related to the vesselsSeliniandSalamina were agreed to be assumed by the Company from an affiliated company on October 18, 2010 and November 6, 2010, respectively (Note 6). The assumed loans were determined to be at fair market value (Note 13(c)); therefore, no gain or loss was recognized upon assumption of the loans.
| (e) | Argosy Insurance Company Limited (“Argosy”): The Company places its hull and machinery insurance, increased value insurance and war risk and certain other insurance through Argosy, a captive insurance company affiliated with Tsakos Shipping. |
| (f) | AirMania Travel S.A. (“AirMania”): Apart from third-party agents, the Company also uses an affiliated company, AirMania, for travel services. |
F-15
TSAKOS ENERGY NAVIGATION LIMITED AND SUBSIDIARIES
NOTES TO CONSOLIDATED FINANCIAL STATEMENTS
DECEMBER 31, 2010, 2009 AND 2008
(Expressed in thousands of U.S. Dollars, except for share and per share data, unless otherwise stated)
| 3. | Long-term Investments |
At December 31, 2010, 2009 and 2008, the Company held 125,000 common shares at a total cost of $1,000 in a private U.S. company which undertakes research into synthetic genomic processes which may have a beneficial environmental impact within the energy and maritime industries. Management has determined that there has been no impairment to the cost of this investment since its acquisition in 2007. A Director of the Company is an officer and shareholder of this company.
No income was received from this investment during 2010, 2009 and 2008, and there were no new investments during 2010, 2009 and 2008.
| 4. | Vessels |
Acquisitions
There were two scheduled deliveries of newly constructed vessels in 2010 at a total cost of $128,539 of which $94,184 was paid in 2010. Also the Company acquired four panamax tankers built in 2009 for a total cost of $218,013 (Note 2(d)).
In 2009 there were two scheduled deliveries of newly constructed vessels at a total cost of $127,718 of which $100,457 was paid in 2009. In 2008, there were four scheduled deliveries of newly constructed vessels at a total cost of $245,129 of which $126,943 was paid in 2008. Also in October 2008, the Company repurchased two suezmax tankers for $47,500 each.
Sales
In 2010, the Company sold all five vessels classified as held for sale at December 31, 2009, the suezmaxDecathlon,the aframax tankersMarathonandParthenonand the panamax tankersHesnesandVictory IIIfor net proceeds $140,548 in total realizing a net capital gain of $19,670, which is separately reflected in the accompanying Consolidated Statements of Income. On December 30, 2010, the Company agreed to sell the aframax tankerOpal Queenfor $34,000 for delivery in March, 2011 resulting in an estimated gain of $5,334 to be recorded in the first quarter of 2011. At December 31, 2010, the vessel is accounted for as held for sale (Note 1(i)). During 2009, the Company sold the suezmaxPentathlonfor net proceeds of $50,463 realizing a capital gain of $5,122. In February 2008, the Company sold the aframax tankerOlympia for net proceeds of $62,100 and a capital gain of $34,565.
Charters-out
The future minimum revenues, before reduction for brokerage commissions, expected to be recognized on non-cancelable time charters are as follows:
Year | Amount | |||
2011 | 163,184 | |||
2012 | 64,520 | |||
2013 | 23,160 | |||
2014 | 438 | |||
Net minimum charter payments | 251,302 | |||
F-16
TSAKOS ENERGY NAVIGATION LIMITED AND SUBSIDIARIES
NOTES TO CONSOLIDATED FINANCIAL STATEMENTS
DECEMBER 31, 2010, 2009 AND 2008
(Expressed in thousands of U.S. Dollars, except for share and per share data, unless otherwise stated)
| 4. | Vessels |
Charters-out (continued)
These amounts do not assume any off-hire.
On December 9, 2010, the Company signed two charter-party agreements with the same charterer, each for the charter of a DP 2 suezmax shuttle tanker for a period of fifteen years to commence on delivery of the vessels, expected in the fourth quarter of 2012 and in the first quarter of 2013 respectively (Note 14(c)). The revenue to be generated by these vessels has not been included in the above table.
Charter hire expense
The suezmaxNordic Passat was chartered by the Company from March 2 to June 13, 2010. The total amount of hire charged during this period was $1,755. Another vessel was chartered from January 30, 2010 to February 9, 2010 at a total hire of $150.
Impairment
In the latter part of 2010, events occurred and circumstances changed, which in the ensuing period indicated that the carrying amount of the aframax tankerVergina II,built in 1991was not fully recoverable. More specifically, market conditions led to a significant drop of tanker hire rates and the preference for younger vessels. The Company evaluated this vessel by comparing the weighted estimated undiscounted cash flows to be generated by this vessel under various scenarios against its carrying value. Based on this evaluation the Company determined that the carrying value of theVergina II was impaired. Consequently, the total carrying value of the vessel at December 31, 2010 of $13,623 was written down to $10,546, which is a level 3 measurement of fair market value of the vessel as determined by management taking into consideration valuations from independent marine valuers and making use of current available market data relating to the vessel and similar vessels (Note 13(c)). For the remaining vessels in the fleet, there is no indication of impairment in 2010. During 2009, the carrying value of three vessels the panamax tankersHesnesandVictory IIIand the aframax tankerVergina IIwere written down resulting in a total impairment charge of $19,066.
| 5. | Deferred Charges |
Deferred charges, consisted of dry-docking and special survey costs, net of accumulated amortization, amounted to $12,221 and $10,778 at December 31, 2010 and 2009, respectively, and loan fees, net of accumulated amortization, amounted to $4,141 and $4,005 at December 31, 2010 and 2009, respectively. Amortization of deferred dry-docking costs is separately reflected in the accompanying Consolidated Statements of Income, while amortization of loan fees is included in Interest and finance costs, net.
F-17
TSAKOS ENERGY NAVIGATION LIMITED AND SUBSIDIARIES
NOTES TO CONSOLIDATED FINANCIAL STATEMENTS
DECEMBER 31, 2010, 2009 AND 2008
(Expressed in thousands of U.S. Dollars, except for share and per share data, unless otherwise stated)
| 6. | Long –Term Debt |
Facility | 2010 | 2009 | ||||||
(a) Credit Facilities | 1,127,925 | 1,285,213 | ||||||
(b) Term Bank Loans | 434,542 | 217,361 | ||||||
Total | 1,562,467 | 1,502,574 | ||||||
Less – current portion | (133,819 | ) | (172,668 | ) | ||||
Long-term portion | 1,428,648 | 1,329,906 | ||||||
| (a) | Credit facilities |
As at December 31, 2010, the Company had seven open reducing revolving credit facilities, all of which are reduced in semi-annual installments, and two open facilities which have both a reducing revolving credit component and a term bank loan component. The aggregate available unused amount under these facilities at December 31, 2010 is $32,522. Interest is payable at a rate based on LIBOR plus a spread. At December 31, 2010, interest on these facilities ranged from 1.11% to 5.19%.
| (b) | Term bank loans |
Term loan balances outstanding at December 31, 2010 amounted to $434,542. In April 2010, the Company drew down $40,000 on a 12-year term loan agreed in November 2009, relating to the financing of the vesselSapporo Princess.In June 2010, the Company drew down $39,000 on a 10-year term loan agreed in May 2010, relating to the financing of the vesselUraga Princess.In July and August 2010, the Company drew down $35,000 each on a 7-year term loan agreed in July 2010, relating to the financing ofWorld HarmonyandChantalrespectively. In October 2010, the Company drew down $43,924 on a 10-year loan term agreed in October 2010 relating to the financing of the vesselSelini.In November 2010, the Company drew down $42,100 on an 8-year term loan agreed in October 2010 relating to the financing of the vesselSalamina.These bank loans are payable in U.S. Dollars in semi-annual installments with balloon payments due at maturity between October 2016 and April 2022. Interest rates on the outstanding loans as at December 31, 2010, are based on LIBOR plus a spread.
At December 31, 2010, interest on these term bank loans ranged from 0.94% to 3.03%.
The weighted-average interest rates on the above executed loans for the applicable periods were:
Year ended December 31, 2010 | 1.62 | % | ||
Year ended December 31, 2009 | 2.70 | % | ||
Year ended December 31, 2008 | 4.38 | % |
F-18
TSAKOS ENERGY NAVIGATION LIMITED AND SUBSIDIARIES
NOTES TO CONSOLIDATED FINANCIAL STATEMENTS
DECEMBER 31, 2010, 2009 AND 2008
(Expressed in thousands of U.S. Dollars, except for share and per share data, unless otherwise stated)
| 6. | Long-Term Debt (continued) |
Loan movements for credit facilities and term loans throughout 2010:
Loan | Origination Date | Original Amount | Balance at January 1, 2010 | New Loans | Repaid | Balance at December 31, 2010 | ||||||||||||||||||
12-year term loan1 | 2002 | 30,500 | 17,375 | — | 1,750 | 15,625 | ||||||||||||||||||
Credit facility2 | 2005 | 250,000 | 111,550 | — | 23,826 | 87,724 | ||||||||||||||||||
Credit facility | 2005 | 220,000 | 173,630 | — | 13,135 | 160,495 | ||||||||||||||||||
Credit facility3 | 2006 | 275,000 | 218,650 | — | 69,912 | 148,738 | ||||||||||||||||||
Credit facility4 | 2004 | 179,384 | 115,664 | — | 10,556 | 105,108 | ||||||||||||||||||
Credit facility | 2005 | 220,000 | 117,750 | — | 8,400 | 109,350 | ||||||||||||||||||
Credit facility | 2006 | 371,010 | 311,010 | — | 20,000 | 291,010 | ||||||||||||||||||
10-year term loan | 2004 | 71,250 | 41,406 | — | 3,125 | 38,281 | ||||||||||||||||||
Credit facility | 2006 | 70,000 | 56,875 | — | 4,375 | 52,500 | ||||||||||||||||||
Credit facility | 2007 | 120,000 | 104,984 | — | 2,484 | 102,500 | ||||||||||||||||||
10-year term loan | 2007 | 88,350 | 82,830 | — | 5,520 | 77,310 | ||||||||||||||||||
Credit facility | 2007 | 82,000 | 75,100 | — | 4,600 | 70,500 | ||||||||||||||||||
10-year term loan | 2009 | 38,600 | 35,750 | — | 2,234 | 33,516 | ||||||||||||||||||
8-year term loan | 2009 | 40,000 | 40,000 | — | 2,664 | 37,336 | ||||||||||||||||||
12-year term loan | 2009 | 40,000 | — | 40,000 | 1,250 | 38,750 | ||||||||||||||||||
10-year term loan | 2010 | 39,000 | — | 39,000 | 1,300 | 37,700 | ||||||||||||||||||
7-year term loan | 2010 | 70,000 | — | 70,000 | — | 70,000 | ||||||||||||||||||
10-year term loan | 2010 | 43,924 | — | 43,924 | — | 43,924 | ||||||||||||||||||
8-year term loan | 2010 | 42,100 | — | 42,100 | �� | — | 42,100 | |||||||||||||||||
Total | 1,502,574 | 235,024 | 175,131 | 1,562,467 | ||||||||||||||||||||
| 1 | This bank loan includes an option for the Company to convert the loan during any interest period into Euro, Yen or Swiss Francs at the applicable spot rates of exchange. Conversion of the option would be at current market rates and, therefore, there would be no impact on the fair value of the respective long-term bank loan. The Company sold the vessel (Opal Queen), secured under this loan which was delivered on March 23, 2011 (Note 14(d)). Accordingly, an amount of approximately $13,875 has been reclassified from long-term to current. The total outstanding balance of $15,625 was repaid on March 23, 2011. |
F-19
TSAKOS ENERGY NAVIGATION LIMITED AND SUBSIDIARIES
NOTES TO CONSOLIDATED FINANCIAL STATEMENTS
DECEMBER 31, 2010, 2009 AND 2008
(Expressed in thousands of U.S. Dollars, except for share and per share data, unless otherwise stated)
| 6. | Long-Term Debt (continued) |
| 2 | The Company sold two of its vessels(Hesnesand Victory III) secured under this credit facility within 2010 and accordingly, has prepaid an amount of $11,906 included in the repayments in the above table. |
| 3 | The Company sold two of its vessels(Marathonand Parthenon)secured under this credit facility in 2010, and accordingly, has prepaid an amount of $57,000 included in the repayments in the above table. |
| 4 | This credit facility includes a fixed interest rate portion amounting to $84,909 as at December 31, 2010. |
The above revolving credit facilities and term bank loans are secured by first priority mortgages on substantially all vessels, and to assignments of earnings and insurances of the respectively mortgaged vessels, and by corporate guarantees of the relevant shipowning subsidiaries.
The loan agreements include, among other covenants, covenants requiring the Company to obtain the lenders’ prior consent in order to incur or issue any financial indebtedness, additional borrowings, pay dividends in an amount more than 50% of cumulative net income (as defined in the related agreements), sell vessels and assets, and change the beneficial ownership or management of the vessels. Also, the covenants require the Company to maintain a minimum liquidity, a minimum hull value in connection with the vessels’ outstanding loans, insurance coverage of the vessels against all customary risks and maintenance of operating bank accounts with minimum balances.
The annual principal payments required to be made after December 31, 2010, including balloon payments totaling $747,554 due through April 2022, are as follows:
Year | Amount | |||
2011 | 133,819 | |||
2012 | 118,194 | |||
2013 | 154,537 | |||
2014 | 108,305 | |||
2015 | 239,038 | |||
2016 and thereafter | 808,574 | |||
| 1,562,467 | ||||
F-20
TSAKOS ENERGY NAVIGATION LIMITED AND SUBSIDIARIES
NOTES TO CONSOLIDATED FINANCIAL STATEMENTS
DECEMBER 31, 2010, 2009 AND 2008
(Expressed in thousands of U.S. Dollars, except for share and per share data, unless otherwise stated)
| 7. | Interest and Finance Costs, net |
| 2010 | 2009 | 2008 | ||||||||||
Interest expense | 60,275 | 60,963 | 70,236 | |||||||||
Less: Interest capitalized | (2,520 | ) | (2,050 | ) | (4,319 | ) | ||||||
Interest expense, net | 57,755 | 58,913 | 65,917 | |||||||||
Bunkers swap cash settlements | (2,926 | ) | (1,662 | ) | — | |||||||
Amortization of loan fees | 1,138 | 877 | 944 | |||||||||
Bank charges | 359 | 302 | 566 | |||||||||
Sub-total | 56,326 | 58,430 | 67,427 | |||||||||
Amortization of deferred loss on termination of financial instruments | 2,113 | — | 1,132 | |||||||||
Change in fair value of non-hedging financial instruments | 3,844 | (12,553 | ) | 14,338 | ||||||||
Sub-total | 5,957 | (12,553 | ) | 15,470 | ||||||||
Net total | 62,283 | 45,877 | 82,897 | |||||||||
At December 31, 2010, the Company was committed to thirteen floating-to-fixed interest rate swaps with major financial institutions covering notional amounts aggregating to $859,168 on which it pays fixed rates averaging 4.63% and receives floating rates based on the six-month London interbank offered rate (“LIBOR”) (Note 13).
At December 31, 2010, the Company held ten of the thirteen interest rate swap agreements in order to hedge its exposure to interest rate fluctuations associated with its debt covering notional amounts aggregating to $610,831. The fair value of such financial instruments as of December 31, 2010 and 2009 in aggregate amounted to $47,105 (negative) and $59,063 (negative), respectively.
On March 24, 2010, the Company discontinued as a cash flow hedge one hedging interest rate swap. This interest rate swap is associated with a secured term loan facility for certain held-for-sale vessels at December 31, 2009. Under the terms of the facility, a vessel sale will permanently reduce the debt balance by an amount equivalent to the relevant fraction of the facility computed by taking the fair market value of the vessel sold divided by the fair market value of all the vessels secured under the facility. When an agreement to sell one of those vessels was reached on March 24, 2010, the hedge no longer met the criteria for special hedge accounting as it was no longer highly effective and it was determined by management that the future cash flows associated with the repayment of the related financing of such sold vessel would be probable of not occurring. As such, the changes in fair value during the first quarter of 2010 of the ineffective part of $143 (negative) have been included directly in earnings for the period with the remaining change in fair value (for those vessels under the facility which were not sold) reflected directly in Accumulated other comprehensive loss in Stockholder’s Equity. In addition, the loss within Accumulated other comprehensive loss that was considered to be directly related to the portion of the loan to be prepaid on the sale of the vessel was immediately reclassified to income and amounted to $428. A second vessel financed by the same loan was sold in July 2010, and a further amount of $380 of the loss within Accumulated other comprehensive loss, that was considered to be directly related to the portion of the loan to be prepaid, was immediately reclassified to income.
F-21
TSAKOS ENERGY NAVIGATION LIMITED AND SUBSIDIARIES
NOTES TO CONSOLIDATED FINANCIAL STATEMENTS
DECEMBER 31, 2010, 2009 AND 2008
(Expressed in thousands of U.S. Dollars, except for share and per share data, unless otherwise stated)
| 7. | Interest and Finance Costs, net (continued) |
The remaining loss included in Accumulated other comprehensive loss related to the portion of the loan that will not be prepaid, and for which the associated future cash flows are deemed probable of occurring ($5,224 at December 31, 2010) is being amortized to income over the term of the original hedge provided that the variable-rate interest obligations continue. The amount of such loss amortized during the year ended December 31, 2010 was $1,305, and for the next year up to December 31, 2011 is expected to be $1,644.
At December 31, 2010, the Company held two other interest rate swaps that did not meet hedge accounting criteria. As such, the changes in their fair values during 2010 have been included in change in fair value of non-hedging financial instruments, in the table above and amounted to $89 (positive).
During 2010 and 2009, the Company had seven and six bunker swap agreements, respectively, in order to hedge its exposure to bunker price fluctuations associated with the consumption of bunkers by its vessels. The fair value of these financial instruments as of December 31, 2010 and 2009 was $3,876 (positive) and $6,446 (positive), respectively and the changes in their fair values during 2010 and 2009 amounting to $2,570 (positive) and $6,446 (positive) respectively have been included in Change in fair value of non-hedging financial instruments in the table above, as such agreements do not meet the hedging criteria.
| 8. | Stockholders’ Equity |
The Company has a shareholder rights plan that authorizes to existing shareholders substantial preferred share rights and additional common shares if any third party acquires 15% or more of the outstanding common shares or announces its intent to commence a tender offer for at least 15% of the common shares, in each case, in a transaction that the Board of Directors has not approved.
During 2009, the Company repurchased 245,400 shares as treasury stock at a cost of $4,058. In 2008, 812,700 common shares were repurchased as treasury stock at a cost of $21,937. In addition, repurchases of stock for cancellation for the years ended December 31, 2008 amounted to $12,232. The transactions were open market based through the New York Stock Exchange. There were no repurchases of common shares during 2010.
On December 4, 2009, the Company entered into a distribution agency agreement with a Bank for the offer and sale of up to three million of common shares. In accordance with the terms of the distribution agency agreement, the shares may be offered and sold at any time and from time to time through the sales agent by means of ordinary brokers’ transactions on the New York Stock Exchange at market prices prevailing at the time of sale or as otherwise agreed with the Bank. Under this program, during 2010, the Company sold all of its 754,706 treasury shares remaining at December 31, 2009 for net proceeds of $12,671 before the issuance and sale of 445,127 new shares for net proceeds of $7,042. No further sales of shares under this program were made after May 3, 2010 and the program was formally closed by the Company on October 5, 2010.
F-22
TSAKOS ENERGY NAVIGATION LIMITED AND SUBSIDIARIES
NOTES TO CONSOLIDATED FINANCIAL STATEMENTS
DECEMBER 31, 2010, 2009 AND 2008
(Expressed in thousands of U.S. Dollars, except for share and per share data, unless otherwise stated)
| 8. | Stockholders’ Equity (continued) |
On October 26, 2010, the Company commenced a public offering of its common shares through an appointed underwriter and sold 6,726,457 shares at $11.15 per share. A further 896,861 shares were sold to Tsakos private interests at $11.30 per share. The offering formally closed on November 1, 2010. The total amount raised was $85,135 for the purpose of fleet expansion and general corporate purposes. Expenses amounted to $437.
In 2004, the shareholders approved a share-based incentive plan providing for the granting of up to 1,000,000 of stock options or other share-based awards to directors and officers of the Company, crew members and to employees of the related companies (the “2004 Plan”). As at December 31, 2010, 872,450 restricted share units (RSUs) had been issued to directors, officers and seafarers employed by the Company and to staff of the commercial and technical managers (who are considered as non-employees for accounting purposes), of which 653,300 had vested and 19,400 were forfeited.
Movements under this plan are as follows:
| No of RSUs Granted | No of RSUs Forfeited | No of RSUs Vested | Balance of Non- Vested RSUs | Weighted- Average Grant – Date Fair Value per share | ||||||||||||||||
December 31, 2009 | 727,450 | (16,300 | ) | (311,650 | ) | 399,500 | $ | 14.56 | ||||||||||||
Granted July 1, 2010 | 145,000 | — | — | 145,000 | $ | 13.06 | ||||||||||||||
Vested during 2010 | — | — | (341,650 | ) | (341,650 | ) | $ | 15.20 | ||||||||||||
Forfeited during 2010 | — | (3,100 | ) | — | (3,100 | ) | $ | 15.50 | ||||||||||||
December 31, 2010 | 872,450 | (19,400 | ) | (653,300 | ) | 199,750 | $ | 12.37 | ||||||||||||
During 2010, 341,650 RSUs vested. On July 1, 2010 a further 145,000 RSUs were issued, vesting 50% on June 30, 2011 and 50% on June 30, 2012. The number of RSUs granted and outstanding as at December 31, 2010 and 2009 was 199,750 and 399,500, respectively. At the date of the awards the weighted average fair market value of the Company’s stock granted was $13.06 (2010) and $15.20 (2009). There were no RSUs granted in 2008. The total fair value of shares vested during the years ended December 31, 2010 and 2008 were $3,687 and $5,240, respectively. There were no RSUs vested in 2009.
The outstanding RSUs as of December 31, 2010 will vest as follows:
| Date | RSUs | |||
June 30, 2011 | 72,500 | |||
December 31, 2011 | 54,750 | |||
June 30, 2012 | 72,500 | |||
Total | 199,750 | |||
F-23
TSAKOS ENERGY NAVIGATION LIMITED AND SUBSIDIARIES
NOTES TO CONSOLIDATED FINANCIAL STATEMENTS
DECEMBER 31, 2010, 2009 AND 2008
(Expressed in thousands of U.S. Dollars, except for share and per share data, unless otherwise stated)
| 8. | Stockholders’ Equity (continued) |
Total compensation expense recognized in 2010 amounted to $1,068 consisting of $1,024 for employees and $44 for non-employees. In 2009, total compensation expense amounted to $1,087 consisting of $676 for employees and $411 for non-employees. In 2008, total compensation expense was $3,046 consisting of $1,237 for employees and $1,809 for non-employees. As at December 31, 2010, the total compensation cost related to the non-vested RSUs for both employees and non-employees not yet recognized is $1,148 ($1,484 at December 31, 2009) and the weighted average remaining contractual life of outstanding grants is 1.0 years.
In 2010, Accumulated other comprehensive income increased with unrealized gains of $5,402 of which $3,289 resulted from changes in fair value of financial instruments, $808 were reclassified to income on sale of vessels and $1,305 were amortized to income. In 2009 and 2008, Accumulated other comprehensive income increased with unrealized gains of $14,508 and decreased with unrealized losses of $48,464, respectively, that resulted from the changes in the fair value of financial instruments.
| 9. | Earnings per Common Share |
The computation of basic earnings per share is based on the weighted average number of common shares outstanding during the year. The computation of diluted earnings per share assumes the foregoing and the exercise of all RSUs (Note 8) using the treasury stock method.
| 2010 | 2009 | 2008 | ||||||||||
Net income available to common stockholders | $ | 19,768 | $ | 28,685 | $ | 202,931 | ||||||
Weighted average common shares outstanding | 39,235,601 | 36,940,198 | 37,552,848 | |||||||||
Dilutive effect of RSUs | 366,077 | 259,989 | 494,286 | |||||||||
Weighted average common shares – diluted | 39,601,678 | 37,200,187 | 38,047,134 | |||||||||
Basic earnings per common share | $ | 0.50 | $ | 0.78 | $ | 5.40 | ||||||
Diluted earnings per common share | $ | 0.50 | $ | 0.77 | $ | 5.33 | ||||||
For 2010, 2009 and 2008, there were no RSUs considered anti-dilutive which would have resulted in their exclusion from the computation of diluted earnings per common share.
| 10. | Noncontrolling Interest in Subsidiary |
In August 2006, the Company signed an agreement with Polaris Oil Shipping Inc. (Polaris), an affiliate of Flota Petrolera Ecuatoriana (Flopec), by which Polaris acquired 49% of Mare Success S.A., a previously wholly-owned subsidiary of the Holding Company. Mare Success S.A. is the holding-company of two Panamanian registered companies which own respectively the vesselsMaya andInca.The agreement became effective on November 30, 2006. Mare Success S.A. is fully consolidated in the accompanying financial statements.
F-24
TSAKOS ENERGY NAVIGATION LIMITED AND SUBSIDIARIES
NOTES TO CONSOLIDATED FINANCIAL STATEMENTS
DECEMBER 31, 2010, 2009 AND 2008
(Expressed in thousands of U.S. Dollars, except for share and per share data, unless otherwise stated)
| 11. | Income Taxes |
Under the laws of the countries of the companies’ incorporation and/or vessels’ registration, the companies are not subject to tax on international shipping income. However, they are subject to registration and tonnage taxes, which have been included in Vessel operating expenses. The Company believes that it and its subsidiaries are exempt from U.S. federal income tax which is normally levied at a rate of 4% on 50% of the U.S. source shipping revenue, as each vessel-operating subsidiary is organized in a foreign country that grants an equivalent exemption to corporations organized in the United States and the Company’s stock is primarily and regularly traded on an established securities market in the United States, as defined by the Internal Revenue Code of the United States. Under the regulations, a Company’s stock will be considered to be regularly traded on an established securities market if (i) one or more classes of its stock representing 50% or more of its outstanding shares, by voting power and value, is listed on the market and is traded on the market, other than in minimal quantities, on at least 60 days during the taxable year; and (ii) the aggregate number of shares of stock traded during the taxable year is at least 10% of the average number of shares of the stock outstanding during the taxable year.
| 12. | Commitments and Contingencies |
As at December 31, 2010, the Company had under construction two suezmax tankers. The total contracted amount remaining to be paid for the two vessels under construction, plus the extra costs agreed as at December 31, 2010 was $61,580 which is scheduled to be paid in 2011.
In the ordinary course of the shipping business, various claims and losses may arise from disputes with charterers, agents and other suppliers relating to the operations of the Company’s vessels. Management believes that all such matters are either adequately covered by insurance or are not expected to have a material adverse effect on the Company’s results from operations or financial condition.
| 13. | Financial Instruments |
| (a) | Interest rate risk: The Company’s interest rates and loan repayment terms are described in Notes 6 and 7. |
| (b) | Concentration of credit risk: Financial Instruments consist principally of cash, trade accounts receivable, investments and derivatives. The Company places its temporary cash investments, consisting mostly of deposits, primarily with high credit qualified financial institutions. The Company performs periodic evaluations of the relative credit standing of those financial institutions that are considered in the Company’s investment strategy. The Company limits its credit risk with accounts receivable by performing ongoing credit evaluations of its customers’ financial condition and generally does not require collateral for its accounts receivable and does not have any agreements to mitigate credit risk. |
F-25
TSAKOS ENERGY NAVIGATION LIMITED AND SUBSIDIARIES
NOTES TO CONSOLIDATED FINANCIAL STATEMENTS
DECEMBER 31, 2010, 2009 AND 2008
(Expressed in thousands of U.S. Dollars, except for share and per share data, unless otherwise stated)
| 13. | Financial Instruments (continued) |
| (b) | Concentration of credit risk:(continued) |
The Company limits the exposure of non-performance by counterparties to derivative instruments by diversifying among counterparties with high credit ratings, and performing periodic evaluations of the relative credit standing of the counterparties.
| (c) | Fair value:The carrying amounts reflected in the accompanying Consolidated Balance Sheet of financial assets and accounts payable approximate their respective fair values due to the short maturity of these instruments. The fair value of time charters and pool arrangements attached to newly acquired vessels (Note 2(d) and 4) equals their market value; therefore, no intangible assets or liabilities were recognized upon acquisition of the time charters and pool arrangements. The fair value of long-term bank loans with variable interest rates approximate the recorded values, generally due to their variable interest rates. The present value of the future cash flows of the portion of one long-term bank loan with a fixed interest rate is estimated to be approximately $77,816 as compared to its carrying amount of $84,909 (Note 6). The fair value of the investment discussed in Note 3 equates to the amount that would be received by the Company in the event of sale of that investment. The fair values of the one long-term bank loan with a fixed interest rate and the interest rate swap agreements and bunker swap agreements discussed in Note 7 above are determined through Level 2 of the fair value hierarchy as defined in FASB guidance for Fair Value Measurements and are derived principally from or corroborated by observable market data, interest rates, yield curves and other items that allow value to be determined. The fair value of the investment discussed in Note 3 is determined through Level 3 of the fair value hierarchy as defined in FASB guidance for Fair Value Measurements and is determined by the Company’s own data. The fair values of the impaired vessels discussed in Note 4 are determined through Level 3 of the fair value hierarchy as defined in FASB guidance for Fair Value Measurements and are based on management estimates and assumptions and by making use of available market data and taking into consideration third party valuations. |
The estimated fair values of the Company’s financial instruments, other than derivatives at December 31, 2010 and 2009 are as follows:
| Carrying Amount 2010 | Fair Value 2010 | Carrying Amount 2009 | Fair Value 2009 | |||||||||||||
Financial assets/(liabilities) | ||||||||||||||||
Cash and cash equivalents | 276,637 | 276,637 | 296,181 | 296,181 | ||||||||||||
Restricted cash | 6,291 | 6,291 | 6,818 | 6,818 | ||||||||||||
Short-term investments | 1,000 | 1,000 | 1,000 | 1,000 | ||||||||||||
Debt | 1,562,467 | 1,555,374 | 1,502,574 | 1,493,910 | ||||||||||||
F-26
TSAKOS ENERGY NAVIGATION LIMITED AND SUBSIDIARIES
NOTES TO CONSOLIDATED FINANCIAL STATEMENTS
DECEMBER 31, 2010, 2009 AND 2008
(Expressed in thousands of U.S. Dollars, except for share and per share data, unless otherwise stated)
| 13. | Financial Instruments (continued) |
| (c) | Fair value:(continued) |
Tabular Disclosure of Derivatives Location
Derivatives are recorded in the balance sheet on a net basis by counterparty when a legal right of setoff exists. The following tables present information with respect to the fair values of derivatives reflected in the balance sheet on a gross basis by transaction. The tables also present information with respect to gains and losses on derivative positions reflected in the statement of operations or in the balance sheet, as a component of Accumulated other comprehensive loss.
Fair Value of Derivative Instruments
| Asset Derivatives | Liability Derivatives | |||||||||||||||||
| December 31, 2010 | December 31, 2009 | December 31, 2010 | December 31, 2009 | |||||||||||||||
Derivative | Balance Sheet Location | Fair Value | Fair Value | Fair Value | Fair Value | |||||||||||||
Derivatives designated as hedging instruments | ||||||||||||||||||
Interest rate swaps | Current portion of financial instruments - Fair value | — | — | 23,053 | 25,370 | |||||||||||||
| FINANCIAL INSTRUMENTS - FAIR VALUE, net of current portion | — | — | 24,052 | 33,693 | ||||||||||||||
| Subtotal | — | — | 47,105 | 59,063 | ||||||||||||||
Derivatives not designated as hedging instruments | ||||||||||||||||||
Interest rate swaps | Current portion of financial instruments - Fair value | — | — | 9,433 | 4,313 | |||||||||||||
| FINANCIAL INSTRUMENTS - FAIR VALUE, net of current portion | — | — | 12,386 | 7,563 | ||||||||||||||
Bunker swaps | Current portion of financial instruments - Fair value | 3,378 | 3,334 | — | — | |||||||||||||
| FINANCIAL INSTRUMENTS - FAIR VALUE, net of current portion | 498 | 3,112 | — | — | ||||||||||||||
Subtotal | 3,876 | 6,446 | 21,819 | 11,876 | ||||||||||||||
| Total derivatives | 3,876 | 6,446 | 68,924 | 70,939 | ||||||||||||||
F-27
TSAKOS ENERGY NAVIGATION LIMITED AND SUBSIDIARIES
NOTES TO CONSOLIDATED FINANCIAL STATEMENTS
DECEMBER 31, 2010, 2009 AND 2008
(Expressed in thousands of U.S. Dollars, except for share and per share data, unless otherwise stated)
| 13. | Financial Instruments (continued) |
| (c) | Fair value:(continued) |
The Effect of Derivative Instruments on the Statement of Financial Performance for the Years Ended December 31, 2010, 2009 and 2008
Derivatives in Cash Flow Hedging Relationships
| Gain (Loss) Recognized in Accumulated OCI on Derivative (Effective Portion) | ||||||||||||||
| Derivative | Amount | |||||||||||||
| 2010 | 2009 | 2008 | ||||||||||||
Interest rate swaps | 3,289 | 14,508 | (48,464 | ) | ||||||||||
Total | 3,289 | 14,508 | (48,464 | ) | ||||||||||
| Gain (Loss) Reclassified from Accumulated OCI into Income (Effective Portion) | ||||||||||||||
| Derivative | Location | Amount | ||||||||||||
| 2010 | 2009 | 2008 | ||||||||||||
Interest rate swaps | Interest and finance costs, net | (2,113 | ) | — | — | |||||||||
Total | (2,113 | ) | — | — | ||||||||||
| Gain (Loss) Recognized in Income on Derivative (Ineffective Portion) | ||||||||||||||
| Derivative | Location | Amount | ||||||||||||
| 2010 | 2009 | 2008 | ||||||||||||
Interest rate swaps | Interest and finance costs, net | (143 | ) | 278 | (1,610 | ) | ||||||||
Total | (143 | ) | 278 | (1,610 | ) | |||||||||
Derivatives Not Designated as Hedging Instruments
| Gain (Loss) Recognized on Derivative | ||||||||||||||
| Derivative | Location | Amount | ||||||||||||
| 2010 | 2009 | 2008 | ||||||||||||
Interest rate swaps | Interest and finance costs, net | (8,356 | ) | 3,866 | (14,119 | ) | ||||||||
Bunker swaps | Interest and finance costs, net | 356 | 8,108 | — | ||||||||||
Total | (8,000 | ) | 11,974 | (14,119 | ) | |||||||||
F-28
TSAKOS ENERGY NAVIGATION LIMITED AND SUBSIDIARIES
NOTES TO CONSOLIDATED FINANCIAL STATEMENTS
DECEMBER 31, 2010, 2009 AND 2008
(Expressed in thousands of U.S. Dollars, except for share and per share data, unless otherwise stated)
| 13. | Financial Instruments (continued) |
| (c) | Fair value:(continued) |
The following table summarizes the fair values for assets and liabilities measured on a recurring basis as of December 31, 2010:
Recurring measurements: | December 31, 2010 | Quoted Prices in Active Markets for Identical Assets/(Liabilities) (Level 1) | Significant Other Observable Inputs Assets/(Liabilities) | Unobservable Inputs Assets/(Liabilities) (Level 3) | ||||||||||||
Interest rate swaps | (68,924 | ) | — | (68,924 | ) | — | ||||||||||
Bunker swaps | 3,876 | — | 3,876 | — | ||||||||||||
| (65,048 | ) | — | (65,048 | ) | — | |||||||||||
The following table presents the fair values of items measured at fair value on a nonrecurring basis for the year ended December 31, 2010:
| Nonrecuring basis | December 31, 2010 | Unobservable Inputs (Level 3) | ||||||
Impairment-Vessels held for use (Note 4) | $ | 10,546 | $ | 10,546 | ||||
| $ | 10,546 | $ | 10,546 | |||||
In accordance with the provisions of the impairment of Long-Lived Assets guidance, a vessel held and used with a carrying amount of $13,623 was written down to its fair value of $ 10,546, resulting in an impairment charge of $3,077, which was included in earnings for the period.
| 14. | Subsequent Events |
| (a) | On January 11, 2011, the Company announced a quarterly dividend of $0.15 cents per share which was paid on February 1, 2011 to shareholders of record on January 25, 2011. |
| (b) | On March 14, 2011, the Company announced that a quarterly dividend of $0.15 cents per share will be paid on April 28, 2011 to shareholders of record on April 21, 2011. |
| (c) | On March 21, 2011 the Company signed contracts for the construction of two DP2 suezmax shuttle tankers, with a major Korean shipyard at a total cost of $184,000 with expected delivery in the fourth quarter of 2012 and in the first quarter of 2013 respectively. |
| (d) | On March 23, 2011 the aframax tankerOpal Queen,recorded in the consolidated Balance Sheet as Held-for-Sale, was delivered to its new owners. |
| (e) | On April 4, the Company agreed to the terms of a bank loan for an amount of $48,000 relating to the financing of the suezmax tankerSpyros K,expected to be delivered at the end of April 2011. |
F-29
— Fleet Details
As of April 15, 2011
| DWT | BUILT | HULL | DESIGN | LOA | MAX BREADTH | YARD | CLASSIFICATION SOCIETY | |||||||||||||||||||||||
| CRUDE OIL | ||||||||||||||||||||||||||||||
| VLCC | ||||||||||||||||||||||||||||||
1. MILLENNIUM | 301,171 | Sep-98 | DH | 331.00 m | 58.00 m | Hyundai Heavy Industries | | American Bureau of Shipping /Korean Register | | |||||||||||||||||||||
2. LA MADRINA | 299,700 | Jan-94 | DH | 343.71 m | 56.40 m | Odense Lindoe | | Lloyd’s Register | | |||||||||||||||||||||
3. LA PRUDENCIA | 298,900 | Jan-93 | DH | 343.71 m | 56.40 m | Odense Lindoe | | Lloyd’s Register | | |||||||||||||||||||||
| SUEZMAX | ||||||||||||||||||||||||||||||
1. ANTARCTIC | 163,216 | Apr-07 | DH | 1A | 274.12 m | 50.00 m | Hyundai Heavy Industries | | American Bureau of Shipping | | ||||||||||||||||||||
2. ARCTIC | 163,216 | Jan-07 | DH | 1A | 274.12 m | 50.00 m | Hyundai Heavy Industries | | American Bureau of Shipping | | ||||||||||||||||||||
3. ALASKA | 163,250 | Feb-06 | DH | 1A | 274.12 m | 50.00 m | Hyundai Heavy Industries | | Lloyd’s Register | | ||||||||||||||||||||
4. ARCHANGEL | 163,216 | Jan-06 | DH | 1A | 274.12 m | 50.00 m | Hyundai Heavy Industries | | Lloyd’s Register | | ||||||||||||||||||||
5. EURONIKE | 164,565 | Sep-05 | DH | 1C | 274.12 m | 50.00 m | Hyundai Heavy Industries | | Lloyd’s Register | | ||||||||||||||||||||
6. EUROCHAMPION 2004 | 164,608 | Apr-05 | DH | 1C | 274.12 m | 50.00 m | Hyundai Heavy Industries | | Lloyd’s Register | | ||||||||||||||||||||
7. TRIATHLON | 164,445 | Dec-02 | DH | 274.19 m | 50.00 m | Hyundai Samho | | American Bureau of Shipping | | |||||||||||||||||||||
8. SILIA T | 164,286 | Jun-02 | DH | 274.19 m | 50.00 m | Hyundai Samho | | American Bureau of Shipping | | |||||||||||||||||||||
| AFRAMAX | ||||||||||||||||||||||||||||||
1. URAGA PRINCESS | 105,344 | Jul-10 | DH | DNA | 228.60 m | 42.00 m | Sumitomo Heavy Industries | | Lloyd’s Register | | ||||||||||||||||||||
2. SAPPORO PRINCESS | 105,354 | Apr-10 | DH | DNA | 228.60 m | 42.04 m | Sumitomo Heavy Industries | | Lloyd’s Register | | ||||||||||||||||||||
3. ASAHI PRINCESS | 105,372 | Sep-09 | DH | DNA | 228.60 m | 42.00 m | Sumitomo Heavy Industries | | Lloyd’s Register | | ||||||||||||||||||||
4. ISE PRINCESS | 105,361 | Jul-09 | DH | DNA | 228.60 m | 42.00 m | Sumitomo Heavy Industries | | Lloyd’s Register | | ||||||||||||||||||||
5. NIPPON PRINCESS | 105,392 | Nov-08 | DH | DNA | 228.60 m | 42.00 m | Sumimoto Heavy Industries | | Lloyd’s Register | | ||||||||||||||||||||
6. MARIA PRINCESS | 105,346 | Oct-08 | DH | DNA | 228.60 m | 42.00 m | Sumimoto Heavy Industries | | Lloyd’s Register | | ||||||||||||||||||||
7. SAKURA PRINCESS | 105,365 | Jun-07 | DH | DNA | 228.60 m | 42.04 m | Sumimoto Heavy Industries | | Lloyd’s Register | | ||||||||||||||||||||
8. IZUMO PRINCESS | 105,374 | Mar-07 | DH | DNA | 228.60 m | 42.04 m | Sumimoto Heavy Industries | | Lloyd’s Register | | ||||||||||||||||||||
9. VERGINA II | 96,709 | Apr-91 | DH | 247.20 m | 41.63 m | Gdynia | | American Bureau of Shipping | | |||||||||||||||||||||
— Vessels under Construction
As of April 15, 2011
| DWT | EXPECTED DELIVERY | HULL DESIGN | LOA BREADTH | MAX | YARD | CLASSIFICATION SOCIETY | ||||||||
1. M/T SPYROS K (Hull S-2034) | 158,000 | Apr-11 | DH | 274.20 m | 48.00 m | Sungdong Shipbuilding | American Bureau of Shipping | |||||||
2. M/T DIMITRIS P (Hull S-2035) | 158,000 | Aug-11 | DH | 274.00 m | 48.00 m | Sungdong Shipbuilding | Bureau of Shipping | |||||||
3. M/T TBN (Hull S-7001) | 157,000 | Dec-12 | DH DP2 SHUTTLE TANKER (ST) | 278.50 m | 48.00 m | Sungdong Shipbuilding | Det Norske Veritas | |||||||
4. M/T TBN (Hull S-7002) | 157,000 | Jan-13 | DH DP2 SHUTTLE TANKER (ST) | 278.50 m | 48.00 m | Sungdong Shipbuilding | Det Norske Veritas |
| DWT | BUILT | HULL | DESIGN | LOA | MAX BREADTH | YARD | CLASSIFICATION | |||||||||||||||||||
PRODUCT / CLEAN | ||||||||||||||||||||||||||
AFRAMAX LR | ||||||||||||||||||||||||||
1. PROPONTIS | 117,055 | Oct-06 | DH | 1A | 250.00 m | 44.06 m | Hyundai Heavy Industries | Bureau Veritas | ||||||||||||||||||
2. PROMITHEAS | 117,055 | Aug-06 | DH | 1A | 249.90 m | 44.06 m | Hyundai Heavy Industries | Bureau Veritas | ||||||||||||||||||
3. PROTEAS | 117,055 | May-06 | DH | 1A | 249.90 m | 44.06 m | Hyundai Heavy Industries | Bureau Veritas | ||||||||||||||||||
PANAMAX | ||||||||||||||||||||||||||
1. CHANTAL | 74,329 | May-09 | DH | 228.00 m | 32.20 m | Sungdong Shipbuilding | American Bureau of Shipping | |||||||||||||||||||
2. WORLD HARMONY | 74,200 | Apr-09 | DH | 228.00 m | 32.20 m | Sungdong Shipbuilding | American Bureau of Shipping | |||||||||||||||||||
3. SALAMINA | 74,251 | Feb-09 | DH | 228.00 m | 32.20 m | Sungdong Shipbuilding | American Bureau of Shipping | |||||||||||||||||||
4. SELINI | 74,296 | Jan -09 | DH | 228.00 m | 32.20 m | Sungdong Shipbuilding | American Bureau of Shipping | |||||||||||||||||||
5. SOCRATES | 74,327 | Mar-08 | DH | 228.00 m | 32.20 m | Sungdong Shipbuilding | American Bureau of Shipping | |||||||||||||||||||
6. SELECAO | 74,296 | Feb-08 | DH | 228.00 m | 32.20 m | Sungdong Shipbuilding | American Bureau of Shipping | |||||||||||||||||||
7. ANDES | 68,439 | Sep-03 | DH | 228.54 m | 32.20 m | Koyo Dockyard | Lloyd’s Register | |||||||||||||||||||
8. INCA | 68,439 | Apr-03 | DH | 228.54 m | 32.20 m | Koyo Dockyard | Lloyd’s Register | |||||||||||||||||||
9. MAYA | 68,439 | Jan -03 | DH | 228.54 m | 32.20 m | Koyo Dockyard | Lloyd’s Register | |||||||||||||||||||
HANDYMAX MR | ||||||||||||||||||||||||||
1. ARIADNE | 53,021 | Nov-05 | DH | 1A | 186.41 m | 32.25 m | Hyundai Mipo Dockyard | Lloyd’s Register | ||||||||||||||||||
2. AFRODITE | 53,082 | Aug-05 | DH | 1A | 186.41 m | 32.25 m | Hyundai Mipo Dockyard | Lloyd’s Register | ||||||||||||||||||
3. ARTEMIS | 53,039 | Aug-05 | DH | 1A | 186.41 m | 32.25 m | Hyundai Mipo Dockyard | Lloyd’s Register | ||||||||||||||||||
4. APOLLON | 53,149 | May-05 | DH | 1A | 186.41 m | 32.25 m | Hyundai Mipo Dockyard | Lloyd’s Register | ||||||||||||||||||
5. ARIS | 53,107 | Apr-05 | DH | 1A | 186.41 m | 32.25 m | Hyundai Mipo Dockyard | Lloyd’s Register | ||||||||||||||||||
6. AJAX | 53,095 | Mar-05 | DH | 1A | 186.41 m | 32.25 m | Hyundai Mipo Dockyard | Lloyd’s Register | ||||||||||||||||||
HANDYSIZE MR | ||||||||||||||||||||||||||
1. BOSPOROS | 37,275 | Aug-07 | DH | 1B | 182.55 m | 27.34 m | Hyundai Mipo Dockyard | Det Norske Veritas | ||||||||||||||||||
2. BYZANTION | 37,275 | May-07 | DH | 1B | 182.55 m | 27.34 m | Hyundai Mipo Dockyard | Det Norske Veritas | ||||||||||||||||||
3. AEGEAS | 37,061 | Apr-07 | DH | 1A | 182.55 m | 27.34 m | Hyundai Mipo Dockyard | Det Norske Veritas | ||||||||||||||||||
4. ANDROMEDA | 37,061 | Mar-07 | DH | 1A | 182.55 m | 27.34 m | Hyundai Mipo Dockyard | Det Norske Veritas | ||||||||||||||||||
5. ARION | 37,061 | Oct-06 | DH | 1A | 182.55 m | 27.34 m | Hyundai Mipo Dockyard | Det Norske Veritas | ||||||||||||||||||
6. AMPHITRITE | 37,061 | May-06 | DH | 1A | 182.55 m | 27.34 m | Hyundai Mipo Dockyard | Det Norske Veritas | ||||||||||||||||||
7. DIDIMON | 37,432 | Jan-05 | DH | 175.97 m | 31.00 m | Hyundai Mipo Dockyard | Lloyd’s Register | |||||||||||||||||||
8. DELPHI | 37,432 | Sep-04 | DH | 175.97 m | 31.00 m | Hyundai Mipo Dockyard | Lloyd’s Register | |||||||||||||||||||
LNG | ||||||||||||||||||||||||||
1. NEO ENERGY | 85,602 | Feb-07 | DH | 288.00 m | 44.20 m | Hyundai Heavy Industries | Lloyd’s Register | |||||||||||||||||||
DH: Double Hull • DNA: Design New Aframax • 1A,1B,1C denotes vessel’s ice class distinction
| ANNUAL REPORT AND ACCOUNTS 2010 | 48< >49 |