UNITED STATES
SECURITIES AND EXCHANGE COMMISSION
Washington, D.C. 20549
FORM 10-K | | | | | |
| (Mark One) |
| ☒ | ANNUAL REPORT PURSUANT TO SECTION 13 OR 15(d) OF THE SECURITIES EXCHANGE ACT OF 1934 |
FOR THE FISCAL YEAR ENDED December 31, 2024
OR
| | | | | |
| ☐ | TRANSITION REPORT PURSUANT TO SECTION 13 OR 15(d) OF THE SECURITIES EXCHANGE ACT OF 1934 |
FOR THE TRANSITION PERIOD FROM to
| | | | | | | | | | | | | | |
| | | | |
| Commission File Number | | Registrant; State of Incorporation; Address and Telephone Number | | I.R.S. Employer Identification No. |
| 001-32871 | | COMCAST CORPORATION | | 27-0000798 |
Pennsylvania
One Comcast Center
Philadelphia, PA 19103-2838
(215) 286-1700
| | | | | | | | | | | | | | |
| SECURITIES REGISTERED PURSUANT TO SECTION 12(b) OF THE ACT: |
| Title of Each Class | | Trading symbol(s) | | Name of Each Exchange on Which Registered |
| Class A Common Stock, $0.01 par value | | CMCSA | | The Nasdaq Stock Market LLC |
| 0.000% Notes due 2026 | | CMCS26 | | The Nasdaq Stock Market LLC |
| 0.250% Notes due 2027 | | CMCS27 | | The Nasdaq Stock Market LLC |
| 1.500% Notes due 2029 | | CMCS29 | | The Nasdaq Stock Market LLC |
| 0.250% Notes due 2029 | | CMCS29A | | The Nasdaq Stock Market LLC |
| 0.750% Notes due 2032 | | CMCS32 | | The Nasdaq Stock Market LLC |
| 3.250% Notes due 2032 | | CMCS32A | | The Nasdaq Stock Market LLC |
| 1.875% Notes due 2036 | | CMCS36 | | The Nasdaq Stock Market LLC |
| 3.550% Notes due 2036 | | CMCS36A | | The Nasdaq Stock Market LLC |
| 1.250% Notes due 2040 | | CMCS40 | | The Nasdaq Stock Market LLC |
| 5.250% Notes due 2040 | | CMCS40A | | The Nasdaq Stock Market LLC |
| 5.50% Notes due 2029 | | CCGBP29 | | New York Stock Exchange |
| 2.0% Exchangeable Subordinated Debentures due 2029 | | CCZ | | New York Stock Exchange |
| | | | |
SECURITIES REGISTERED PURSUANT TO SECTION 12(g) OF THE ACT: NONE |
Indicate by check mark if the registrant is a well-known seasoned issuer, as defined in Rule 405 of the Securities Act. Yes ☒ No ☐
Indicate by check mark if the registrant is not required to file reports pursuant to Section 13 or Section 15(d) of the Act. Yes ☐ No ☒
Indicate by check mark whether the registrant (1) has filed all reports required to be filed by Section 13 or 15(d) of the Securities Exchange Act of 1934 during the preceding 12 months (or for such shorter period that the registrant was required to file such reports) and (2) has been subject to such filing requirements for the past 90 days. Yes ☒ No ☐
Indicate by check mark whether the registrant has submitted electronically every Interactive Data File required to be submitted pursuant to Rule 405 of Regulation S-T (§232.405 of this chapter) during the preceding 12 months (or for such shorter period that the registrant was required to submit such files). Yes ☒ No ☐
Indicate by check mark whether the registrant is a large accelerated filer, an accelerated filer, a non-accelerated filer, a smaller reporting company, or an emerging growth company. See the definitions of “large accelerated filer,” “accelerated filer,” “smaller reporting company” and “emerging growth company” in Rule 12b-2 of the Exchange Act.
| | | | | | | | | | | | | | | | | | | | | | | | | | | | | |
| Large accelerated filer | ☒ | Accelerated filer | ☐ | Non-accelerated filer | ☐ | Smaller reporting company | ☐ | Emerging growth company | ☐ |
If an emerging growth company, indicate by check mark if the registrant has elected not to use the extended transition period for complying with any new or revised financial accounting standards provided pursuant to Section 13(a) of the Exchange Act. ☐
Indicate by check mark whether the registrant has filed a report on and attestation to its management’s assessment of the effectiveness of its internal control over financial reporting under Section 404(b) of the Sarbanes-Oxley Act (15 U.S.C. 7262(b)) by the registered public accounting firm that prepared or issued its audit report. Yes ☒ No ☐
If securities are registered pursuant to Section 12(b) of the Act, indicate by check mark whether the financial statements of the registrant included in the filing reflect the correction of an error to previously issued financial statements. ☐
Indicate by check mark whether any of those error corrections are restatements that required a recovery analysis of incentive-based compensation received by any of the registrant’s executive officers during the relevant recovery period pursuant to §240.10D-1 (b). ☐
Indicate by check mark whether the registrant is a shell company (as defined in Rule 12b-2 of the Exchange Act). Yes ☐ No ☒
As of June 30, 2024, the aggregate market value of the Comcast Corporation common stock held by non-affiliates of the registrant was $150.621 billion.
Indicate the number of shares outstanding of each of the registrant’s classes of common stock, as of the latest practicable date:
As of January 15, 2025, there were 3,771,578,226 shares of Comcast Corporation Class A common stock and 9,444,375 shares of Class B common stock outstanding.
DOCUMENTS INCORPORATED BY REFERENCE
Comcast Corporation – Part III – The registrant’s definitive Proxy Statement for its annual meeting of shareholders.
Comcast Corporation
2024 Annual Report on Form 10-K
Table of Contents
| | | | | | | | |
| PART I |
| Item 1 | | |
| Item 1A | | |
| Item 1B | | |
| Item 1C | | |
| Item 2 | | |
| Item 3 | | |
| Item 4 | | |
|
| PART II |
| Item 5 | | |
| Item 6 | | |
| Item 7 | | |
| Item 7A | | |
| Item 8 | | |
| Item 9 | | |
| Item 9A | | |
| Item 9B | | |
| Item 9C | | |
| | |
|
| PART III |
| Item 10 | | |
| Item 11 | | |
| Item 12 | | |
| Item 13 | | |
| Item 14 | | |
|
| PART IV |
| Item 15 | | |
| Item 16 | | |
| |
| |
Explanatory Note
This Annual Report on Form 10-K is for the year ended December 31, 2024. This Annual Report on Form 10-K modifies and supersedes documents filed before it. The U.S Securities and Exchange Commission (“SEC”) allows us to “incorporate by reference” information that we file with it, which means that we can disclose important information to you by referring you directly to those documents. Information incorporated by reference is considered to be part of this Annual Report on Form 10-K. In addition, information that we file with the SEC in the future will automatically update and supersede information contained in this Annual Report on Form 10-K. Unless indicated otherwise, throughout this Annual Report on Form 10-K, we refer to Comcast and its consolidated subsidiaries, as “Comcast,” “we,” “us” and “our.”
This Annual Report on Form 10-K contains trademarks, service marks and trade names owned by us, as well as those owned by others.
Numerical information in this report is presented on a rounded basis using actual amounts. Minor differences in totals and percentage calculations may exist due to rounding.
Part I
Item 1: Business
We are a global media and technology company that reaches customers, viewers and guests worldwide through the connectivity and platforms services we provide and the content and experiences we create. We deliver broadband, wireless, video and voice services primarily under the Xfinity, Comcast Business, Sky and NOW brands; produce, distribute and stream leading entertainment, sports and news through brands including NBC, Telemundo, Universal, Peacock and Sky; and own and operate Universal theme parks.
We operate two primary businesses:
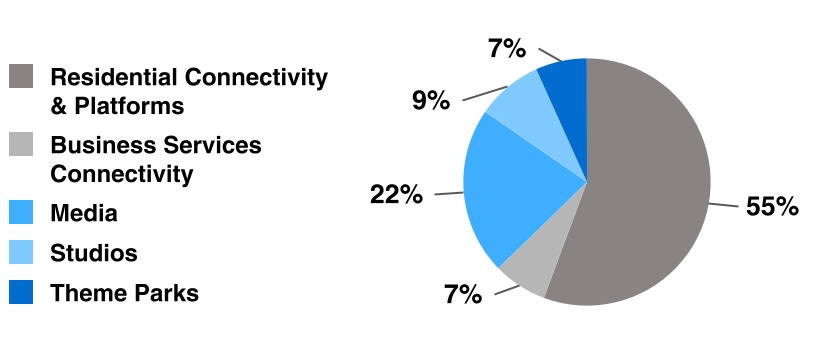
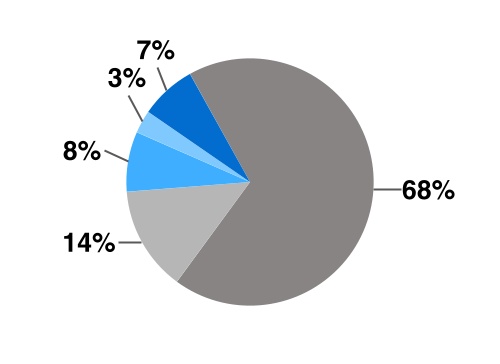
•Connectivity & Platforms: Contains our broadband, wireless, video and wireline voice businesses in the United States, United Kingdom and Italy (collectively, the “Connectivity & Platforms markets”). Also includes the operations of our Sky-branded entertainment television networks in the United Kingdom and Italy. Our Connectivity & Platforms business is reported in two segments, Residential Connectivity & Platforms and Business Services Connectivity.
•Content & Experiences: Contains our media and entertainment businesses that produce and distribute entertainment, sports, news and other content for global audiences and that own and operate theme parks and attractions in the United States and Asia. Our Content & Experiences business is reported in three segments, Media, Studios and Theme Parks.
In November 2024, we announced our intention to create a new independent publicly traded company (“SpinCo”) comprised primarily of a strong portfolio of domestic cable television networks currently within our Media segment, including USA Network, E!, Syfy, MSNBC, CNBC, Oxygen and the Golf Channel along with complementary digital assets including Fandango, Rotten Tomatoes, GolfNow and SportsEngine, through a tax-free spin-off (the “Spin-off”). We are targeting to complete the Spin-off by the end of 2025, subject to the satisfaction of customary conditions, including obtaining final approval from our Board of Directors, satisfactory completion of SpinCo financings, receipt of tax opinions and receipt of any regulatory approvals. There can be no assurance that a separation transaction will occur, or, if one does occur, of its terms or timing.
For additional information on our businesses and segments, refer to Item 7: Management’s Discussion and Analysis of Financial Condition and Results of Operations and Note 2 to the consolidated financial statements included in this Annual Report on Form 10-K.
Description of Our Businesses
| | |
| Connectivity & Platforms Business |
Residential Connectivity & Platforms Segment
Our Residential Connectivity & Platforms segment primarily includes:
•Residential broadband and wireless services (collectively, “Residential Connectivity”)
•Residential and business video services, Sky-branded entertainment television networks and advertising
We offer services to customers individually and as bundled services at a discounted rate.
Residential Connectivity
Broadband
We offer broadband services in the United States over our hybrid fiber-optic and coaxial (“HFC”) network, as well as through direct fiber-to-the-premises connections for certain customers, and internationally in the United Kingdom and Italy by leveraging networks owned by third-party telecommunications providers.
Our domestic broadband offerings have a range of service levels, including up to gigabit-plus downstream speeds that we offer across nearly our entire footprint. As part of our low-income broadband adoption program, we offer qualifying domestic customers broadband services at discounted rates through our Internet Essentials and Internet Essentials Plus services, with downstream speeds of up to 75 and 100 megabits per second, respectively. In 2024, we began offering prepaid domestic broadband services with downstream speeds of up to 200 megabits per second marketed under the NOW brand. We also offer monthly access to our network of Wi-Fi hotspots.
| | | | | | | | |
| 1 | Comcast 2024 Annual Report on Form 10-K |
We continue to evolve and enhance our domestic network capabilities, including deploying technology in select markets that will enable us to deliver multigigabit symmetrical broadband speeds (i.e., comparable upstream and downstream speeds), as described in the Network and Technology discussion below.
We offer Xumo Stream Box (formerly Flex) devices to our domestic customers. The Xumo Stream Box provides access to and integration of streaming content and music from certain internet-based apps, including direct-to-consumer streaming services (“DTC streaming services”) such as Peacock, Disney+ and Netflix, and certain pay-per-view and video on demand programming that is available over the internet. We also offer certain bundled DTC streaming services to our broadband customers. We earn commission revenue from the sale of DTC streaming services when sold with our broadband services or through our video platforms, including X1 and Sky Q.
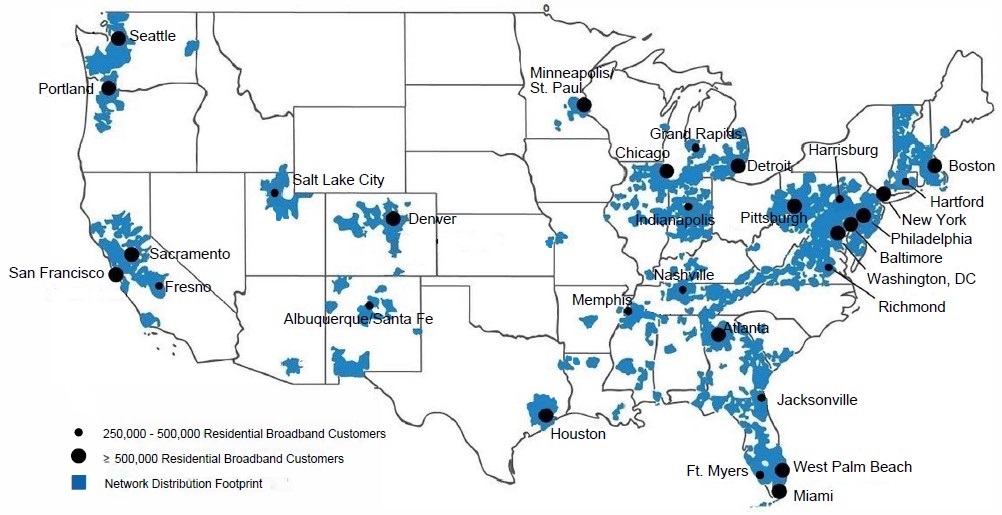
The map below highlights our domestic network footprint and the markets where we had 250,000 or more domestic residential broadband customers as of December 31, 2024.
Our international broadband services primarily include fiber-to-the-cabinet offerings, and increasingly fiber-to-the-premises offerings.
As part of our domestic and international broadband services, we offer to customers our advanced, proprietary wireless gateways that combine an internet modem with a Wi-Fi router to deliver reliable internet speeds and enhanced coverage through an in-and-out-of-home Wi-Fi network. In addition, customers may personalize and manage their Wi-Fi network and connected devices with our mobile apps and online portal. Broadband customers have access to our expanding network of secure Wi-Fi hotspots.
Wireless
We offer wireless services for wireless handsets, tablets and smart watches (“wireless devices”) to residential customers in the United States and the United Kingdom using mobile virtual network operator (“MVNO”) rights. Our domestic wireless services are offered over Verizon’s wireless network and our existing network of secure residential, outdoor and business Wi-Fi hotspots, and are offered initially only as part of our bundled service offerings to customers that subscribe to our qualifying broadband services.
Wireless customers may activate multiple lines per account. We offer domestic customers services on an unlimited data plan, on shared data plans or per gigabyte of data used. In 2024, we began offering prepaid unlimited data plans marketed under the NOW brand. We offer international customers services on various gigabyte plans or an unlimited data plan. Customers may either bring their own device or purchase devices from us with the option to pay upfront or finance the purchase interest-free over 24 months for domestic customers and over 24 to 48 months for international customers.
| | | | | | | | |
| Comcast 2024 Annual Report on Form 10-K | 2 | |
Video
We offer video services to residential and business customers primarily through our X1 platform in the United States over our network, and through our Sky Q platform internationally in the United Kingdom and Italy using a combination of satellite transmission and broadband connections. X1 and Sky Q are cloud-based platforms that provide integrated search functionality leveraging set-top boxes and voice-activated remote controls. The integrated features operate across content in customers’ video service packages and content from internet-based streaming services that customers may access in a manner similar to our Xumo Stream Box. We offer a range of video packages from basic linear service to full linear service, which typically include free-to-air networks and a range of other linear television networks including premium, sports and news networks. Our international video packages also include Sky-branded entertainment television networks that offer entertainment, premium movie and free-to-air programming, as well as Sky Sports networks that are part of our Media segment. Customers may also subscribe to digital video recorder (“DVR”) services or access our video on demand services with programming that is available for no additional cost or to rent or buy digitally. These viewing options are also available through our mobile apps and online portals.
We also offer DTC streaming services marketed under the NOW brand, with an offering in the United States that launched in 2023. NOW services provide video content over the internet and do not require a set-top box. Our international NOW service offerings include packages for monthly access to entertainment, sports and movie programming, as well as daily pass options for sports programming. Our domestic NOW TV service is only offered to qualifying residential broadband customers and includes monthly access to a variety of linear television networks; entertainment and movie programming; integrated access to free streaming channels from Xumo Play, NBC and Sky; and access to the ad-supported tier of Peacock.
We also offer video services in the United Kingdom and Italy over a broadband connection without the need for a satellite dish. These services have an operating system similar to Sky Q and are offered to customers through Sky Stream, which leverages a streaming device and Wi-Fi, or to customers that purchase our Sky Glass smart televisions.
Advertising
As part of our distribution agreements with domestic cable networks, we generally receive an allocation of scheduled advertising time that our advertising business sells, and we also sell advertising on our Sky-branded entertainment television networks and on our digital platforms. We also enter into representation agreements under which we sell advertising on behalf of third parties both domestically and internationally. Additionally, we offer technology, tools, data-driven services and marketplace solutions to customers in the media industry to facilitate effective engagement of advertisers with their target audiences.
Other
We offer residential wireline voice services primarily using interconnected Voice over Internet Protocol (“VoIP”) technology, and we offer residential security and automation services. We also license our technology platforms to other multichannel video providers and distribute certain of our Sky-branded entertainment television networks to third-party video service providers.
Business Services Connectivity Segment
Our Business Services Connectivity segment consists of our domestic service offerings for small businesses, which include broadband, wireline voice and wireless services, as well as our enterprise solutions offerings for medium-sized customers and larger enterprises. Certain business customers subscribe to our video services, and the associated revenue is included in our Residential Connectivity & Platforms segment. We also have certain business connectivity service offerings in the United Kingdom.
Our domestic broadband offerings have a range of service levels, including fiber-based services that deliver symmetrical speeds ranging up to 100 gigabits per second.
Our small business broadband, wireline voice and wireless service offerings are similar to those provided to our residential customers and also include cloud-based cybersecurity services, wireless backup connectivity, advanced Wi-Fi solutions, video monitoring services and other cloud-based services.
Our enterprise solutions offerings also include ethernet network services, which connect multiple locations and provide higher downstream and upstream speed options, advanced voice services, and a software-defined networking product. Larger enterprises may also receive support services related to Wi-Fi networks, router management, network security, business continuity risks and other services. These services are primarily provided to Fortune 1000 companies and other large enterprises with multiple locations both within and outside of our distribution footprint, where we provide coverage outside of our service areas through agreements with other companies to use their networks.
| | | | | | | | |
| 3 | Comcast 2024 Annual Report on Form 10-K |
Network and Technology
The segments within our Connectivity & Platforms business use our HFC network in the United States, which we believe is sufficiently flexible and scalable to support our future technology requirements and enables us to continue to grow capacity and capabilities over time. This network provides the two-way transmissions required to provide connectivity services and interactive video and entertainment services through our platforms, and consists primarily of headends, fiber-optic and coaxial cables owned or leased by us, and equipment such as lasers, routers, switches and content distribution servers. Across nearly our entire domestic footprint, we leverage DOCSIS 3.1 to offer up to gigabit-plus downstream broadband speeds to residential and business customers. We also deploy fiber-to-the-premises with symmetrical speed offerings ranging up to 10 gigabits per second to residential customers who request that service, subject to local construction constraints, and up to 100 gigabits per second to business customers. We offer domestic wireless services using an MVNO agreement that allows us to offer services using Verizon’s wireless network along with our existing network of Wi-Fi hotspots across our network.
We continue to evolve and enhance our domestic network capabilities. In connection with a multiyear network transformation plan, in 2022 we began rolling out downstream speeds of up to 2 gigabits per second to our residential customers, which are now available to approximately 50% of our HFC network footprint. In 2023, we began deploying in select markets DOCSIS 4.0, which enables us to deliver multigigabit symmetrical broadband speeds over our existing HFC network. Additionally, as part of our network evolution, our engineering teams have been virtualizing and automating many core network functions using various technologies to expand capacity, increase operating efficiency, and identify and fix network issues proactively before they affect our customers. Our investment in virtualizing the network helps maintain network reliability and operational efficiency regardless of whether we connect a residence using either fiber or our HFC network. We continue to extend our network’s reach to new homes and businesses within our existing service areas, as well as edging-out to new service areas to expand the number of homes and businesses passed, and a significant portion of new homes and businesses passed are connected with fiber. We also partner with local, state and federal agencies when possible to provide services to unserved and underserved communities leveraging governmental subsidies where available.
The components of our domestic network require periodic maintenance and replacement and are primarily located on owned and leased properties, and in locations under agreements with local public utilities and municipalities. We operate national and regional data centers with equipment that is used to provide our services, and we maintain network operations centers with equipment necessary to monitor and manage the status of our services and network.
Our international services are offered leveraging third-party networks, as well as our own core fiber network for broadband and wireline voice services in the United Kingdom. The related operating plant and equipment used to provide our video and connectivity services include leased satellite system signal receiving, encoding and decoding devices, and owned and leased headends and distribution networks, including coaxial, fiber-optic cables and other related equipment. For a majority of international customers, our video platform is delivered via one-way digital satellite transmission that uses satellites leased from third parties for the distribution of television networks, augmented by a set-top box and two-way broadband connectivity. We offer broadband and wireline voice services in the United Kingdom and Italy using third-party networks. In many cases, the fee for us to access these networks is on regulated terms. The ranges of service levels and speeds we offer are dependent upon the capabilities and reach of these third-party networks. We offer wireless services in the United Kingdom using a combination of a third-party’s network and our own mobile core network.
Our Connectivity & Platforms business engineering teams continue to focus on technology initiatives to develop and deploy next-generation media, content delivery, content aggregation and streaming platforms that support X1, Sky Q, NOW, Sky Stream, Sky Glass, Xumo and our cloud DVR technology. These platforms are based on our global technology platform and integrate linear television networks, owned and third-party DTC streaming services and other internet-based apps, and on demand programming into a unified experience with voice-activated remote control search and interactive features. We also continue to focus on leveraging our own cloud network services to deliver video and advanced search capabilities. Our Connectivity & Platforms business also pursues technology initiatives related to broadband and wireless services that leverage our global technology platform. We provide our customers with in-and-out-of-home Wi-Fi, the ability to manage their Wi-Fi network and connected home with our mobile apps and online portal, advanced security technology, and other features.
Programming
To offer video services, Residential Connectivity & Platforms licenses substantial amounts of linear television programming from third parties and from our Media segment. The fees associated with these distribution agreements are generally based on the number of subscribers receiving the television network programming and a per subscriber fee, although programming expenses for certain television networks are based on a fixed fee. Additionally, certain of our agreements include the rights to offer such programming through multiple delivery platforms, such as through our on demand services, online portal, mobile apps, the Xumo Stream Box, and our NOW and NOW TV streaming services.
| | | | | | | | |
| Comcast 2024 Annual Report on Form 10-K | 4 | |
The programming on our Sky-branded entertainment television networks includes content licensed from third parties and from our Studios segment, including certain original content. Our most significant agreements for the licensing of film and television entertainment content include exclusive rights with Paramount, Warner Bros. and our Studios segment.
Other Sources of Supply and Operations
We purchase from a limited number of suppliers a significant amount of customer premise equipment, including wireless gateways and set-top boxes, network equipment, and services to provide our broadband and video services to residential and business customers. We also purchase from a limited number of suppliers a significant number of wireless devices. We use a limited number of vendors to provide customer billing for our residential and business customers.
Our technical services groups perform various tasks, including installations, plant maintenance and upgrades to our domestic network, and servicing and upgrades of customer premise equipment. The service vehicles used by our technical services groups are primarily owned. Our customer service teams provide primarily 24/7 call-answering capability and other services, and also offer our services to residential and business customers.
Competition
Residential Connectivity & Platforms
Broadband
We compete with a number of companies, many with significant financial resources, that offer internet services, including:
•wireline telecommunications companies
•wireless telecommunications companies
•municipal broadband networks and power companies
•satellite broadband providers
Certain wireline telecommunications companies, such as AT&T, Frontier, Lumen and Verizon in the United States and BT and Virgin Media O2 in the United Kingdom, have built and are continuing to build fiber-based wireline network infrastructure further into their networks, which enables them to provide data transmission speeds that exceed those that can be provided with traditional copper digital subscriber line (“DSL”) technology, and are offering services with these higher speeds in many of our service areas. Certain companies that offer DSL service have increased data transmission speeds, lowered prices or created bundled services to compete with our broadband services.
Various wireless companies are offering internet services using a variety of technologies, including 5G fixed wireless networks and 4G and 5G wireless broadband services. These networks work with devices such as smartphones, laptops, tablets, and mobile and fixed wireless routers, as well as wireless data cards.
Other companies and municipalities have launched fiber-based or newer satellite-based broadband technologies that provide services in certain areas in which we operate.
Domestic broadband-deployment funding initiatives at the federal and state levels may result in other service providers deploying subsidized internet access within our footprint. The availability of these and other offerings could negatively impact the demand for our domestic broadband services.
Wireless
We compete with national and regional wireless service providers in the United States, including AT&T, T-Mobile and Verizon, and wireless service providers in the United Kingdom that offer wireless service on both a stand-alone basis and with other services as bundled offerings.
Video
We compete with a number of companies offering video services in the Connectivity & Platforms markets, including:
•DTC streaming service providers and aggregators, including:
◦subscription-based services, such as Disney+ and Netflix, that offer online services that enable internet streaming and downloading of movies, television shows and other video programming
◦virtual multichannel video providers, such as Hulu + Live TV and YouTube TV, that offer streamed linear television networks
◦free ad-supported television services
| | | | | | | | |
| 5 | Comcast 2024 Annual Report on Form 10-K |
◦companies that offer streaming devices that access and integrate streaming content
•direct broadcast satellite (“DBS”) providers that transmit satellite signals to substantially all households in the Connectivity & Platforms markets to provide video programming and other information similar to our video services
•companies that have built and continue to build fiber-based networks that provide video services similar to ours and provide bundled offerings that include wireless and/or broadband services
•other providers that build and operate communications systems and services in the same areas that we serve, including traditional providers of linear television programming
•a broad array of other online content providers, such as social networking platforms and user-generated content providers
•other companies, such as broadcast television stations, that provide multiple free-to-air networks
Similar to the competitive environment in our Media segment, our Sky-branded entertainment television networks compete for the distribution of our television network programming to third-party video service providers and for viewers’ attention and audience share.
Advertising
We compete for the sale of advertising with digital properties, including an increasing number of ad-supported DTC streaming service providers and other online content providers, such as social networking platforms and user-generated content providers, as well as with television networks and stations, and all other advertising platforms. Similar to the competitive environment in our Media segment, the willingness of advertisers to purchase advertising from us may be adversely affected by declines in audience ratings and television viewership, difficulty in measuring fragmented audiences and the increasing number of entertainment choices available. Our advertising is sold to local, regional and national advertisers, and competition is affected by the market conditions in the specific geographic locations in which we operate. We also compete with companies offering technology, tools and other services to customers in the media industry.
Business Services Connectivity
Business Services Connectivity primarily competes with wireline telecommunications companies and wide area network managed service providers. Competition for our connectivity services for small business customers is generally similar to the Residential Connectivity & Platforms segment. We compete for the sale of enterprise solutions offerings primarily with wide area network managed service providers, cloud-based application service providers and other telecommunication carriers.
Seasonality and Cyclicality
Results in our Residential Connectivity & Platforms segment are impacted by the seasonal nature of residential customers receiving our services, including in college and vacation markets in the United States, and by the timing of the European football seasons in our international markets, which generally result in negative impacts to net customer relationship additions/(losses) in the second quarter of each year.
Similar to seasonal and cyclical variations in our Media segment, advertising revenue is subject to cyclical patterns and changes in viewership levels, driven by timing of the winter holiday season, political campaigns, sports seasons and when programming is aired.
| | |
| Content & Experiences Business |
Media Segment
We operate our Media segment as a combined television and streaming business, which primarily includes:
•NBCUniversal’s national and regional cable networks
•NBC and Telemundo broadcast networks and owned local broadcast television stations
•Peacock DTC streaming service
•International television networks, including Sky Sports networks in the United Kingdom and Italy
We distribute a wide variety of programming on our linear television networks and streaming services to appeal to consumers with varying preferences across demographics and geographic areas.
| | | | | | | | |
| Comcast 2024 Annual Report on Form 10-K | 6 | |
Revenue is primarily generated from the sale of advertising and from the distribution of our television and streaming programming.
We sell advertising on our linear television networks, Peacock and other digital properties. Our advertising sales are affected by the prices we charge for each advertising unit, which are generally based on the size and demographics of our viewing audiences, audience ratings on our television networks, the number of advertising units we can place in our programming and on our digital properties, and our ability to sell advertising across our television and streaming business.
We receive fees from the distribution of our television networks to traditional multichannel video providers, such as our Residential Connectivity & Platforms segment, and virtual multichannel video providers that offer streamed linear television networks. Our distribution agreements are generally multiyear, with revenue based on the number of subscribers receiving the programming on our television networks and a per subscriber fee, although revenue for certain of our television networks is based on a fixed fee. These fees include amounts for our owned television networks, including under NBC and Telemundo retransmission consent agreements, as well as associated fees from NBC-affiliated and Telemundo-affiliated local broadcast television stations. We also receive monthly retail or wholesale subscription fees for Peacock.
We also generate revenue from the licensing of our owned content and technology and from various digital properties.
Domestic Cable Networks
We operate a diversified portfolio of cable networks operating predominantly in the United States. The table below presents a summary of NBCUniversal’s national cable networks and their advertising reach to U.S. households.
| | | | | | | | | | |
| | |
| Cable Network | Approximate U.S. Households as of December 31, 2024 (in millions)(a) | Description of Programming |
| USA Network | 66 | | | | General entertainment and sports |
| E! | 65 | | | | Entertainment and pop culture |
| Syfy | 65 | | | | Genre-based entertainment |
| MSNBC | 65 | | | | News, political commentary and information |
| Bravo | 65 | | | | Lifestyle entertainment |
| CNBC | 64 | | | | Business and financial news |
| Oxygen | 62 | | | | True crime |
| Golf Channel | 54 | | | | Golf competition and golf entertainment |
| Universal Kids | 43 | | | | Children’s entertainment |
| Universo | 16 | | | | Spanish-language entertainment |
| CNBC World | 16 | | | | Global financial news |
| | | | |
(a)Household data is based on information from The Nielsen Company as of December 31, 2024 using its Cable Coverage Universe Estimates report and dynamic ad insertion estimates. The Nielsen estimates include subscribers to both traditional and certain virtual multichannel video providers. The Nielsen estimates are not based on information provided by us and are included solely to enable comparisons between our cable networks and those operated by our peers.
Our regional sports networks serve approximately 11 million households across the United States, including in markets such as Boston, Philadelphia, Sacramento and San Francisco.
Domestic Broadcast Networks
NBC
The NBC network features original entertainment, news and sports programming that reaches viewers in virtually all U.S. television households through more than 200 affiliated stations across the United States, including our 11 owned NBC local broadcast television stations. The NBC owned local broadcast television stations include stations in 8 of the top 10 general markets and collectively reached approximately 35 million U.S. television households as of December 31, 2024, representing approximately 28% of U.S. television households. In addition to broadcasting the NBC network’s national programming, local broadcast television stations deliver local news, weather, and investigative and consumer reporting.
| | | | | | | | |
| 7 | Comcast 2024 Annual Report on Form 10-K |
Telemundo
The Telemundo network, a Spanish-language broadcast network, features original entertainment, news, live specials and sports programming that reaches viewers in over 96% of all U.S. Hispanic television households through 122 affiliated stations, including our 30 owned Telemundo local broadcast television stations, and our national feed. The Telemundo owned local broadcast television stations include stations in all of the top 20 U.S. Hispanic markets and collectively reached approximately 71% of U.S. Hispanic television households as of December 31, 2024. In addition to broadcasting the Telemundo network’s national programming, local broadcast television stations deliver local news, weather, and investigative and consumer reporting. We also own an independent Telemundo station serving the Puerto Rico television market.
Peacock
Peacock is our DTC streaming service, featuring NBCUniversal and third-party content. Programming choices include exclusive Peacock originals, current NBC, Bravo and Telemundo shows, news, late-night comedy, live sports and a library of television shows and movies, as well as several live channels. The service is available on internet-connected devices and offered through two subscription-based tiers: an ad-supported tier and a tier featuring the same content ad-free, with certain limited exceptions. The ad-free tier also allows customers to download and watch select programming offline and provides customers with a live stream of their local NBC affiliate stations. We offer Peacock in the United States directly to customers or through arrangements with third parties and our Residential Connectivity & Platforms segment, which offer Peacock to customers on our behalf.
International Networks
We operate a diversified portfolio of international television networks, including premium sports networks under the Sky Sports brand in the United Kingdom and Italy, with a majority of networks dedicated to a specific sport, such as European football. We also operate several NBCUniversal international television networks globally, including CNBC International, Studio Universal, Telemundo International and Universal TV.
Programming
Our television networks and Peacock include content licensed from our Studios segment and from third parties, as well as content produced by Media segment businesses, such as live news and sports programming and certain original content, including late-night comedy for NBC and original telenovelas for Telemundo.
We have various multiyear agreements for the licensing of content, including contracts related to television and/or streaming rights for sporting events. We generally seek to include in our sports rights agreements the rights to distribute content on one or more of our television networks and on digital properties, including Peacock.
Our most significant sports rights agreements relate to the NBA, NFL, Olympics and English Premier League. The table below presents a summary of these and certain other sports rights:
| | | | | | | | |
| Television and/or Streaming Rights | Market | Rights Expiration |
NBA and WNBA(a) | United States, United Kingdom and Italy | 2035-36 NBA season and 2036 WNBA season |
NFL(b) | United States | 2033-34 season |
| Summer and Winter Olympic Games | United States | 2032 |
| English Premier League | United Kingdom, Italy and United States | 2028-29, 2027-28 and 2027-28 seasons, respectively |
| PGA Tour and other golf events | United States | Between 2026 and 2031 |
NASCAR(c) | United States | 2031 |
| Big Ten football and basketball | United States | 2029-30 season |
| World Wrestling Entertainment (“WWE”) | United States | 2029 on television and 2026 on Peacock |
| Formula One | United Kingdom and Italy | 2029 and 2027, respectively |
| England and Wales Cricket Board | United Kingdom | 2028 |
| English Football League | United Kingdom | 2028-29 season |
| Serie A | Italy | 2028-29 season |
| FIFA World Cup (Spanish-language) | United States | 2026 |
| Certain professional sports teams through our Regional Sports Networks | Certain regions in the United States | Between 2027 and 2040 |
| | | | | | | | |
| Comcast 2024 Annual Report on Form 10-K | 8 | |
(a) Beginning with the 2025-26 NBA season and 2026 WNBA season, includes the rights to produce and distribute across our networks and on Peacock a specified number of NBA and WNBA regular season and playoff games, the NBA All-Star game and NBA All-Star Saturday Night each season, as well as six NBA Conference Finals series and three WNBA Finals series over the term of the agreements. A certain number of NBA games will also be distributed in the Spanish language on Telemundo.
(b) Includes the rights to produce and distribute on NBC and on Peacock a specified number of regular season games that includes Sunday Night Football games, Thursday Kickoff games and Thanksgiving night games, playoff games, and three remaining Super Bowl games, the next of which is in February 2026. The agreement expires after the 2033-34 season, with a termination right available to the NFL after the 2029-30 season. The agreement also includes rights to additional exclusive games on Peacock. All of the NFL games are also distributed in the Spanish language on Universo or Telemundo.
(c) Includes the unilateral right by the other party (i.e., the licensor) to the agreement, under certain circumstances, to shorten the term of the agreement by one year.
Our television and streaming business competes for the acquisition of content, including sports rights, and for on-air and creative talent primarily with other television networks, DTC streaming providers, and local broadcast television stations. In Europe, major sports rights, which are significant to our international networks, are usually tendered through a competitive auction process, with the winning bidder or bidders acquiring rights over a 3 to 5 year period.
Studios Segment
Our Studios segment primarily includes our NBCUniversal and Sky film and television studio production and distribution operations. Our studio production facilities primarily include our owned Universal City location in Los Angeles, California and our leased studios in Atlanta, Georgia and in Elstree, United Kingdom. Revenue is generated primarily from the worldwide licensing of our owned film and television content and from the worldwide distribution of our produced and acquired films for exhibition in movie theaters. We also generate revenue from the sale of physical and digital home entertainment products, as well as the production and licensing of live stage plays and the distribution of content produced by third parties.
Film Studios
Our film studios develop, produce, acquire, market and distribute filmed entertainment worldwide. Our films are produced primarily under the following names:
•Universal Pictures
•Illumination
•DreamWorks Animation
•Focus Features
•Working Title
We distribute the majority of our films initially for exhibition in movie theaters, while other films are initially distributed through licensing agreements. After their initial release, we distribute films globally to different customers over multiple licensing windows. We license films, including recent films and selections from our film library, which is comprised of more than 6,500 movies in a variety of genres, to linear television networks and DTC streaming service providers, and to video on demand services provided by multichannel video providers. This includes licenses to our Media and Residential Connectivity & Platforms segments. Certain films are also licensed to our Media segment and made available for viewing on Peacock on the same date as the theatrical release. We also distribute films globally through the sale of physical and digital home entertainment products. Additionally, we acquire distribution rights to films produced by third parties, which may be limited to particular geographic regions, specific forms of media or certain periods of time. Theatrical revenue is significantly affected by the timing of each release and the number of films we distribute, their acceptance by audiences, the number of exhibition screens, ticket prices, the percentage of ticket sales retention by the exhibitors and the popularity of competing films at the time our films are released. The success of a film in movie theaters is generally a significant factor in determining the revenue a film is likely to generate in succeeding licensing windows and through physical and digital home entertainment product sales.
We develop and produce films both alone and jointly with other studios or production companies. In certain cases, we have also entered into film co-financing arrangements with third party studios and non-studio entities to jointly finance or distribute certain of our film productions. These arrangements can take various forms, but in most cases involve the grant of an economic interest in a film to an investor. Investors generally assume the full risks and rewards of ownership proportionate to their ownership in the film.
In connection with film studio productions, we typically owe “residuals” payments to individuals hired under collective bargaining agreements, which are generally calculated based on post-theatrical or content licensing revenue. We also typically owe “participations” payments to creative talent, to third parties under co-financing agreements and to other parties involved in content production, which are generally based on the financial performance of the content.
| | | | | | | | |
| 9 | Comcast 2024 Annual Report on Form 10-K |
Television Studios
Our television studios develop, produce and distribute original content, including scripted and unscripted television series. We also produce television content jointly as co-producers with third-party studios and production companies. Our television studios produce content primarily under the following names:
•Universal Television
•Universal Content Productions
•Universal Television Alternative Studio
•Universal International Studios
•Sky Studios
Our original content is primarily initially licensed to linear television networks and DTC streaming service providers, including those in our Media and Residential Connectivity & Platforms segments. We also license content after its initial airing, license older television content from our television library, and distribute owned and acquired content globally through the sale of physical and digital home entertainment products. The production and distribution costs related to original broadcast television content generally exceed the revenue generated from the initial license, which means that obtaining additional licenses following the initial network license is critical to the content’s financial success. Similar to our film studios, we typically owe residuals and participations payments in connection with television studio productions.
Theme Parks Segment
Our Theme Parks segment primarily includes the operations of the following Universal theme parks:
•Universal Orlando Resort: Includes two theme parks, Universal Studios Florida and Islands of Adventure, and our water park, Volcano Bay, all of which are located in Orlando, Florida. Universal Orlando Resort also includes Universal CityWalk Orlando, a dining, retail and entertainment complex, and features on-site themed hotels in which we own a noncontrolling interest, and will include an additional theme park, Epic Universe, that is expected to open in May 2025.
•Universal Studios Hollywood: Includes the Universal Studios Hollywood theme park located in Hollywood, California and Universal CityWalk Hollywood, a dining, retail and entertainment complex.
•Universal Studios Japan: Includes the Universal Studios Japan theme park located in Osaka, Japan.
•Universal Beijing Resort: Includes the Universal Studios Beijing theme park, as well as Universal CityWalk Beijing, a dining, retail and entertainment complex, and on-site themed hotels, all of which are located in Beijing, China. Universal Beijing Resort is owned by us and a consortium of Chinese state-owned companies (see Note 7 to the consolidated financial statements included in this Annual Report on Form 10-K).
Our Theme Parks segment properties are primarily owned by us, although certain properties are leased, including land in Beijing, China and Osaka, Japan. We have invested and will continue to invest significantly in existing and new theme park attractions, hotels and infrastructure, as well as in new destinations and experiences, such as Epic Universe; Universal Kids Resort, a smaller-scale theme park in Frisco, Texas expected to open in 2026; and Universal Horror Unleashed, a year-round horror entertainment experience in Las Vegas, Nevada expected to open in 2025.
Revenue is generated primarily from guest spending at our theme parks, including ticket sales and in-park spending on food, beverages and merchandise, and from our consumer products business. Revenue for our theme parks generally depends on the overall environment for travel and tourism, including consumer spending on leisure and other recreational activities.
We also license the right to use the Universal Studios brand name and other intellectual property and provide other services to third parties, including the party that owns and operates the Universal Studios Singapore theme park on Sentosa Island, Singapore. The themed elements in our rides, attractions, and merchandising are based on intellectual property in our Studios and Media segments and intellectual property licensed from third parties under long-term agreements.
Competition
Media
Our Media segment competes for viewers’ attention and audience share with all forms of programming provided to viewers, including DTC streaming service providers; television networks; local broadcast television stations; physical and digital home entertainment products; video on demand and pay-per-view services; online activities, such as social networking and viewing user-generated content; gaming products; and other forms of entertainment, news and information.
| | | | | | | | |
| Comcast 2024 Annual Report on Form 10-K | 10 | |
Media competes for the sale of advertising with digital properties, including an increasing number of ad-supported DTC streaming service providers and other online content, such as social networking platforms and user-generated content, as well as with other television networks and stations, and all other advertising platforms. The willingness of advertisers to purchase advertising from us may be adversely affected by lower audience ratings and viewership at the related networks, stations or digital properties. Declines in audience ratings can be caused by increased competition for the leisure time of viewers and by audience fragmentation resulting from the increasing number and forms of entertainment choices available. Additionally, it is increasingly challenging to accurately measure fragmented audiences.
Our domestic cable networks and international networks compete primarily with other cable networks and programming providers for carriage by multichannel video providers and DTC streaming service providers. Our domestic broadcast networks compete with the other broadcast networks in markets across the United States to secure affiliations with independently owned local broadcast television stations, which are necessary to ensure the effective distribution of broadcast network programming to a nationwide audience. Peacock competes for subscribers primarily with other DTC streaming service providers, as well as with traditional providers of linear television programming.
Studios
Our film and television studios compete for audiences with other major film and television studios, independent film producers and creators of content, as well as with alternative forms of entertainment. The competitive position of our studios primarily depends on the number of films and television series and episodes produced, their distribution and marketing success, and consumer response. Our studios also compete to obtain creative, performing and technical talent, including writers, actors, directors, and producers, as well as scripts for films and television shows, and for the distribution of, and consumer interest in, their content. We also compete with other major film and television studios and other producers of entertainment content for the exhibition of content in theaters, on demand, on television networks, and on DTC streaming services.
Theme Parks
Our theme parks compete with other multi-park entertainment companies as well as other providers of entertainment, tourism, recreational activities and lodging. The competitive position of our theme parks primarily depends on the quality and popularity of rides and attractions, including effective use of intellectual property in themed attractions. There is increased competition in areas with high concentrations of theme parks and other attractions operated by several companies. Macroeconomic conditions and other factors may also result in shifting consumer preferences toward other types of destinations, experiences and products.
Seasonality and Cyclicality
Revenue and costs and expenses in our Media segment are cyclical as a result of our periodic broadcasts of major sporting events, such as the Olympic Games and the Super Bowl. In particular, advertising revenue increases due to increased demand for advertising time for these events and distribution revenue increases in the period of broadcasts of the Olympic Games. Costs and expenses also increase as a result of our production costs for these broadcasts and the recognition of the related rights fees.
Revenue in Media is also subject to cyclical advertising patterns and changes in viewership levels. Domestic advertising revenue is generally higher in the second and fourth quarters of each year and in even-numbered years due to increases in advertising in the spring and in the period leading up to and including the winter holiday season, and advertising related to candidates running for political office and issue-oriented advertising, respectively. International advertising revenue typically has seasonally higher audience levels in winter months, with lower levels in summer months due to the timing of European football seasons, winter holidays and summer vacations. Revenue also fluctuates depending on the timing of when our programming is aired, which typically results in additional advertising revenue in the second and fourth quarters of each year.
Revenue in Studios fluctuates due to the timing, nature and number of films released in movie theaters, through DTC streaming services and viewing on demand, and on physical and digital home entertainment products. Release dates are determined by several factors, including competition and the timing of vacation and holiday periods. As a result, revenue tends to be seasonal, with increases experienced each year during the summer months and around the winter holiday season. We incur significant marketing expenses before and throughout the release of a film in movie theaters and as a result, we typically incur losses on a film prior to and during the film’s exhibition in movie theaters. Content licensing revenue also fluctuates due to the timing of when our film and television content is made available to licensees. Revenue from our television studios fluctuates in part due to a correlation with the broadcast network season beginning annually in September.
Revenue in Theme Parks fluctuates with changes in theme park attendance that typically result from the seasonal nature of vacation travel and weather variations, local entertainment offerings and the opening of new attractions, as well as with changes in currency exchange rates. Our theme parks generally experience peak attendance during the spring holiday period, the summer months when schools are closed and the winter holiday season.
| | | | | | | | |
| 11 | Comcast 2024 Annual Report on Form 10-K |
Our other business interests reported in Corporate and Other consist primarily of our Sky-branded video services and television networks in Germany, Comcast Spectacor, which owns the Philadelphia Flyers and the Wells Fargo Center arena in Philadelphia, Pennsylvania, and Xumo, our consolidated streaming platform joint venture with Charter Communications formed in June 2022. Xumo is focused on developing and offering a streaming platform on a variety of devices, including Xumo TV smart televisions, which have an operating system that leverages our global technology platform, and also operates the Xumo Play streaming service.
Legislation and Regulation
Our businesses are subject to various federal, state, local, and international laws and regulations. In the United States in particular, the Communications Act of 1934, as amended (the “Communications Act”), and Federal Communications Commission (“FCC”) rules and regulations affect significant aspects of our communications businesses.
Beyond the more significant regulations summarized below, legislators and regulators at all levels of government frequently consider changing, and sometimes do change, existing statutes, rules or regulations, or interpretations of existing statutes, rules or regulations, or prescribe new ones, any of which may significantly affect our businesses and ability to effectively compete. Applying existing laws in novel ways to new technologies, including streaming services and artificial intelligence (“AI”), may also affect our business. These legislators and regulators, along with some state attorneys general and foreign governmental authorities, have been active in conducting inquiries and reviews regarding our services. State legislative and regulatory initiatives can create a patchwork of different and/or conflicting state requirements, such as with respect to privacy and Open Internet/net neutrality regulations, that can affect our businesses and ability to effectively compete.
Legislative and regulatory activity has increased in recent years, particularly with respect to broadband networks. For example, Congress has approved tens of billions of dollars in new funding for broadband deployment and adoption initiatives, and may consider other proposals that address communications issues, including whether it should rewrite the Communications Act to account for changes in the communications marketplace. Federal agencies have considered adopting new regulations for communications services, including broadband, although it is uncertain whether those initiatives will continue under the new Administration. States and localities are increasingly proposing new regulations impacting communications services, including broader regulation of broadband networks. Regulators in various international jurisdictions are similarly considering changes to telecommunications and media requirements. Any of these regulations could significantly affect our business and our legal and compliance costs. In addition, United States and foreign regulators and courts could adopt new interpretations of existing competition or antitrust laws or enact new competition or antitrust laws or regulatory tools that could negatively impact our businesses. Any future legislative, judicial, regulatory or administrative actions may increase our costs or impose additional restrictions on our businesses, some of which may be significant. We are unable to predict the outcome or effects of any of these potential actions or any other legislative or regulatory proposals on our businesses.
The following paragraphs summarize the more significant legal and regulatory requirements and risks affecting our businesses.
| | |
| Communications-Related Regulations in the United States |
Broadband
Our broadband services are subject to a number of regulations and commitments.
In 2023, the FCC adopted broad rules that prohibit digital discrimination of access to broadband service based on income level, race, ethnicity, color, religion and national origin; this order currently is subject to legal challenge in federal court. In 2024, the FCC reclassified broadband internet access services as a “telecommunications service” subject to traditional common carriage regulation under Title II of the Communications Act. However, a federal appellate court in January 2025 overturned that reclassification, ruling that broadband internet access service is an “information service” under Title I of the Communications Act and that the FCC does not have authority to subject broadband services to utility-style regulations such as rate regulation and market entry and exit requirements under Title II. As a Title I “information service,” broadband is only subject to light-touch regulation such as broadband disclosure requirements, and deployment, subscription, and pricing reporting requirements. States and localities have in the past enacted and may in the future periodically consider new broadband-related regulations, including those regarding government-owned broadband networks, net neutrality and broadband affordability, which could create a patchwork of, and potentially inconsistent, federal, state and local regulatory regimes. New broadband regulations, if adopted, may have adverse effects on our businesses, and we cannot predict the outcome of any pending or future litigation or how any rules will ultimately be interpreted and enforced and how they might affect our business.
| | | | | | | | |
| Comcast 2024 Annual Report on Form 10-K | 12 | |
We, from time to time, participate in broadband-deployment funding initiatives at the federal and state levels and may also become subject to additional broadband-related commitments as a condition of receiving federal or state broadband funding. We cannot predict how and to whom any such funds will be awarded, when the initiatives will be terminated or the impact of these initiatives on our businesses.
A number of municipalities operate municipally owned broadband networks, and there may be further efforts by local governments to expand or create government-owned networks, particularly in light of federal funding for broadband deployment. Certain states have enacted laws that restrict or prohibit local municipalities from operating municipally owned broadband networks, and there may be efforts in other state legislatures to restrict the development of government-owned networks. Other states, however, have amended or may amend such laws to facilitate such networks. Much of the federal funding authorized for broadband deployment is conditioned on states agreeing to make it available for potential use by government-owned networks, although the funding prioritizes deployment to unserved and underserved areas and locations. We cannot predict how successful any of those efforts will be and how they might affect our businesses.
Video and Media
We are subject to laws and regulations that apply to the cable services we provide through our Residential Connectivity & Platforms business and to our cable networks and local broadcast television stations in our Media business. These laws and regulations can constrain our ability to compete, particularly against DTC streaming service providers, which are not subject to these same requirements.
Federal, state and local franchising rules and regulations may require us to provide adequate channel capacity, facilities and financial support for public, educational and governmental access programming; comply with certain renewal procedures for our franchise agreements; pay franchise fees; and comply with customer service, accessibility, and certain other requirements. In addition, the FCC and other federal agencies can impact the programming networks that we carry, as well as how we price, package, bill and market our video services. FCC regulations also require cable operators to carry programming transmitted by certain local broadcast television stations (“must-carry” requirement) or to negotiate a “retransmission consent” agreement with certain other stations that will frequently involve payments from cable operators to the station; govern program access by preventing cable networks affiliated with cable operators from favoring affiliated cable operators over competing multichannel video providers; grant licenses to broadcast television stations for 8-year cycles, which may not be renewed on favorable terms, or at all; limit local and national television ownership, as well as foreign ownership in a broadcast television station; and regulate children’s programming.
The FCC enforces these rules on a case-by-case basis based on complaints filed by consumers, state and local governments, and other entities. We have been involved in disputes at the FCC in some of these areas and may be involved in new disputes in the future, including potential disputes related to content moderation and free speech. We cannot predict the outcome of any such disputes or associated litigation. The FCC and Congress have previously considered proposals that would require companies that own multiple cable networks to make each of their networks available individually when negotiating distribution agreements with MVPDs and potentially with DTC streaming and other OTT service providers. We currently offer our cable networks on a packaged basis (in “tiers”) and, in various cases, individually. We have been involved in program access disputes at the FCC and may be subject to new complaints in the future.
Furthermore, certain states and localities have adopted laws to impose franchise or other fees on DTC streaming services. To date, courts have invalidated those laws, but we cannot predict the outcome of any future litigation.
Wireless
We offer a wireless voice and data service primarily using our MVNO rights to provide the service over Verizon’s wireless network. MVNOs are subject to many of the same FCC regulations as facilities-based wireless carriers, such as E911 services and local number portability, as well as certain state or local regulations. The FCC or other regulatory authorities may adopt new or different regulations for MVNOs and/or mobile broadband providers in the future, which could adversely affect our wireless phone service offering or our business generally.
Voice
We provide voice services using VoIP technology. The FCC has adopted a number of regulations for providers of nontraditional voice services such as ours, including regulations relating to privacy of customer proprietary network information, local number portability duties and benefits, disability access, E911, law enforcement assistance, outage reporting, Universal Service Fund contribution obligations, rural call completion, customer equipment back-up power, robocall mitigation, service discontinuance and certain regulatory filing requirements. State regulatory commissions and legislatures in other jurisdictions may continue to consider imposing regulatory requirements on our voice services as long as the regulatory classification of VoIP remains unsettled at the federal level.
| | | | | | | | |
| 13 | Comcast 2024 Annual Report on Form 10-K |
Spectrum Allocations
The FCC, the Department of Commerce’s National Telecommunications and Information Administration, and other federal agencies have taken, and in some cases are preparing to take, steps to evaluate and potentially modify certain spectrum allocations and rules to make available additional spectrum that likely will be used for licensed and/or unlicensed commercial services, including 5G and Wi-Fi services, which could impact our businesses. We cannot predict the timing or outcome of these spectrum allocation actions. Additional commercial spectrum could impact current marketplace dynamics, including the ability of wireless providers to compete with our services. Further, if the FCC reallocates spectrum that our businesses currently use to provide services, we could be required to transition our operations to different frequencies in order to accommodate the reallocation of spectrum for 5G, which could disrupt our services and impose additional costs.
| | |
| International Communications-Related and Other Regulations |
Certain of our international businesses are subject to telecommunications and media-specific regulation, including those related to broadband and voice services and television networks, in Europe, Latin America, and other international jurisdictions, and all of our international businesses are subject to regulation under generally applicable laws, such as competition, consumer protection, data protection, and taxation in the jurisdictions where they operate. Our international businesses are currently, and may be in the future, subject to proceedings or investigations from regulatory and antitrust authorities in the jurisdictions in which those businesses operate.
| | |
| Other Areas of Regulation |
Intellectual Property
Copyright, trademark, unfair competition, patent, trade secret and other proprietary-rights laws of the United States and other countries help protect our intellectual property rights. In particular, unauthorized copying, distribution and piracy of programming and films over the internet, through devices, software and websites, counterfeit DVDs/Blu-rays and through other platforms interfere with the market for copyrighted works and present challenges for our content businesses. We have actively engaged in the enforcement of our intellectual property rights and likely will continue to expend substantial resources to protect our content. Although many legal protections exist to combat such practices, the extent of copyright protection is sometimes ambiguous and the use of technological protections can be controversial. Modifications to existing laws, a weakening of these protections or their enforcement or a failure of existing laws, in the United States or internationally, to adapt to new technologies could have an adverse effect on our ability to license and sell our programming.
U.S. copyright laws establish a cable compulsory copyright license that requires our video distribution business to contribute a specified percentage of revenue to a federal copyright royalty pool in exchange for retransmitting copyrighted material included in broadcast signals. We also pay standard industry licensing fees for the public performance of music in the programs we create or distribute. The cable compulsory copyright license and the royalties we pay are subject to audits and possible regulatory and legislative changes that could impact the royalty fees we pay and our ability to retransmit broadcast signals over cable systems. In addition, the landscape for music licensing is constantly changing, and music fees we pay are subject to new fee demands and negotiations. We cannot predict how changes to the compulsory copyright license and music licensing will impact the fees that we pay.
Privacy and Data Protection Regulation
Our businesses are subject to laws and regulations that impose various restrictions and obligations related to privacy and the processing of individuals’ personal information. In the United States, federal privacy laws and regulations, such as those found within the Communications Act or the Video Privacy Protection Act, restrict companies’ collection, use, disclosure and retention of personal information. The proliferation of laws at the state level has expanded consumers’ rights to include individual rights of access, deletion, portability, correction, the right to appeal, and the individual’s right to “opt in” to collection and use of certain types of “sensitive” personal information. Internationally, many of the laws that apply to our businesses are similar to the European Union’s General Data Protection Regulation and the United Kingdom’s Data Protection Act of 2018, which broadly regulate the processing of personal data collected from individuals in the European Union and United Kingdom, respectively.
| | | | | | | | |
| Comcast 2024 Annual Report on Form 10-K | 14 | |
Some of our businesses are also subject to the FTC’s general oversight of consumer privacy protections through its enforcement authority over unfair and deceptive acts or practices, as well as through its enforcement authority over the Children’s Online Privacy Protection Act. The FTC has sought to expand its authority in this area through various rulemakings related to general privacy, targeted advertising and children’s privacy. There has been an increased focus on children’s privacy at both the state and federal levels within the United States, as well as internationally. These new laws may require changes to our products and services and could adversely affect our advertising businesses.
In addition, many international data protection laws, some federal laws, and all 50 U.S. states have security breach notification requirements that obligate businesses to provide notice to consumers and government agencies if certain information has been accessed or exfiltrated by an unauthorized party; some of these laws also require documented information security programs.
State and Local Taxes
Some U.S. states and localities have imposed or are considering imposing, through both legislative and administrative channels, new or additional taxes or fees on, or limiting or eliminating incentives or credits earned or monetized by, our businesses, or imposing adverse methodologies by which taxes, fees, incentives or credits are computed, earned or monetized. These include combined reporting or other changes to general business taxes, central assessments for property tax, and taxes and fees on the businesses operated or services provided by our businesses, most notably new taxes or fees on digital advertising or other digital commerce. In some situations, DBS providers and other competitors (such as DTC streaming service providers) that deliver their services over a broadband connection do not face the same state and local tax and fee burdens. Congress has also considered, and may consider again, proposals to bar or limit states from imposing taxes on these DBS providers or other competitors (such as DTC streaming service providers) that are equivalent to the taxes or fees that we pay. The Internet Tax Freedom Act (“ITFA”) prohibits most states and localities from imposing sales and other taxes on our internet access charges and discriminating against electronic commerce; however, some jurisdictions may challenge the ITFA or the application of the ITFA to our business, or may assert that certain taxes akin to right-of-way fees are not preempted by the ITFA or other federal laws.
Other Regulations
U.S. states and localities, and various regulatory authorities, actively regulate other aspects of our businesses, including our Studios and Theme Parks businesses, accessibility to our video and voice services and broadcast television programming for people with disabilities, customer service standards, inside wiring, cable equipment, pole attachments, universal service fees, regulatory fees, public safety, telemarketing, leased access, indecency, loudness of commercial advertisements, advertising, political broadcasting, sponsorship identification, Emergency Alert System, equal employment opportunity and other employment-related practices, environmental-related matters, our equipment supply chain, and technical standards relating to the operation of cable systems and television stations. In addition, our international businesses are subject to various similar regulations, including those that cover television broadcasting, programming, and advertising. We are occasionally subject to enforcement actions and investigations at the FCC and other federal, state, and local agencies, as well as foreign governments and regulatory authorities, which can result in fines, sanctions and/or ongoing compliance plans and government oversight.
Human Capital Resources
As of December 31, 2024, we had approximately 182,000 full-time and part-time employees calculated on a full-time equivalent basis. Approximately 30% of our employees were located in over 30 countries outside the United States, with larger workforce concentrations in the United Kingdom, Western Europe, East Asia and South Asia. We also use freelance and temporary employees in the normal course of our business. A small overall portion of our full-time U.S. employees are unionized, although many of Content & Experiences’ freelance and temporary writers, directors, actors, technical and production personnel, as well as some on-air and creative talent employees, are covered by industry-wide collective bargaining agreements or work councils. Outside the United States, employees in certain countries, particularly in Europe, are represented by an employee representative organization, such as a union, works council or employee association.
Our company has been built on a foundation of respect, integrity and trust, and we are committed to creating and fostering a work environment that promotes those values. As a global media and technology company, we have a wide range of employees, including management professionals, technicians, engineers, call center employees, theme park employees, and media talent and production employees. Some of our key workforce-related programs and initiatives include the following.
Employee Engagement
•We seek to create an engaged workforce through proactive listening and constructive dialogue, including through employee engagement surveys, as well as through employee resource groups.
| | | | | | | | |
| 15 | Comcast 2024 Annual Report on Form 10-K |
•We are committed to creating an environment that encourages employees to ask questions, raise concerns and speak up about a workplace issue or suspected illegal or unethical conduct. We provide several channels for speaking up without fear of retaliation, including a helpline and a web portal that are administered by an independent third-party company and allow for anonymous reporting when permitted by applicable laws.
Talent Development
•We provide a wide variety of opportunities for professional growth for all employees with in-classroom and online trainings and on-the-job experience.
•We offer education tuition assistance to full-time employees in the United States.
•Our Board of Directors discusses succession planning for our CEO and the remainder of our senior executive management team at least once a year. Throughout the year, our senior executive management team, as well as a broader array of executives throughout our businesses, make presentations to the Board and its committees and interact with our directors informally outside of regularly scheduled Board meetings, which provides directors with meaningful insight into our current pool of talent, what attracts and retains our executives, and our company culture.
•We promote a culture that embraces equal opportunity for all.
•Comcast has nine voluntary employee resource groups with more than 36,000 members in 240 chapters across the U.S. These employee-led organizations are open to all and contribute to business priorities, career development, and foster an inclusive and collaborative workplace.
Health and Welfare Benefits
•We offer a robust portfolio of health and welfare programs and solutions designed to meet the unique needs of our employees and their families, delivered through a consistent and seamless member experience.
•Our offerings include comprehensive and affordable health care coverage options along with a variety of additional tools and resources, including access to dedicated health care navigators, expert medical opinion services, virtual primary care services and a diabetes management program. In addition, we offer comprehensive family planning options, including for adoption and surrogacy, and provide specialized support teams to help employees manage all stages in the family planning journey including parenthood.
•We continue to invest in the emotional wellbeing of our employees and offer a broad array of tools and resources such as our Employee Assistance Program, which provides personal counseling sessions to support employees and their families and provide problem-solving support for a broad range of issues, including stress, anxiety, depression, substance use and more. We also offer various digital emotional wellbeing tools, including child learning and behavior support, meditation, stress management, sleep issues, depression, chronic pain and substance use.
Financial Benefits
•We focus on attracting and retaining employees by providing compensation and benefits packages that are competitive within the applicable market, taking into account the job position’s location and responsibilities.
•We provide competitive financial benefits such as a 401(k) retirement plan in the United States with a company match and other retirement arrangements internationally.
•We have employee stock purchase plans in the United States, United Kingdom, India and several other European countries where most of our full-time and part-time employees can purchase our stock at a discount.
•We generally grant stock-based awards on an annual basis to a meaningful portion of our employees, with over 24,000 employees receiving such awards in 2024.
•We offer financial literacy training and counseling to support employees in making their own financial decisions.
Available Information and Websites
Our phone number is (215) 286-1700, and our principal executive offices are located at One Comcast Center, Philadelphia, PA 19103-2838. Our Annual Reports on Form 10-K, Quarterly Reports on Form 10-Q, Current Reports on Form 8-K and any amendments to such reports filed with or furnished to the SEC under Sections 13(a) or 15(d) of the Securities Exchange Act of 1934, as amended (the “Exchange Act”), are available free of charge on the SEC’s website at www.sec.gov and on our website at www.comcastcorporation.com as soon as reasonably practicable after such reports are electronically filed with the SEC. The information posted on our websites is not incorporated into our SEC filings.
| | | | | | | | |
| Comcast 2024 Annual Report on Form 10-K | 16 | |
Caution Concerning Forward-Looking Statements
This Annual Report on Form 10-K includes statements that may constitute “forward-looking statements” within the meaning of the Private Securities Litigation Reform Act of 1995, Section 27A of the Securities Act of 1933, and Section 21E of the Securities Exchange Act of 1934. Forward-looking statements are not historical facts or statements of current conditions, but instead represent only our beliefs regarding future events, many of which, by their nature, are inherently uncertain and outside of our control. These may include estimates, projections and statements relating to our business plans, objectives and expected operating results, which are based on current expectations and assumptions that are subject to risks and uncertainties that may cause actual results to differ materially. These forward-looking statements are generally identified by words such as “believe,” “project,” “expect,” “anticipate,” “estimate,” “intend,” “potential,” “strategy,” “future,” “opportunity,” “commit,” “plan,” “goal,” “may,” “should,” “could,” “will,” “would,” “will be,” “will continue,” “will likely result” and similar expressions. In evaluating these statements, you should consider various factors, including the risks and uncertainties we describe in “Risk Factors” and in other reports we file with the SEC.
Any of these factors could cause our actual results to differ materially from those expressed or implied by our forward-looking statements, which could adversely affect our businesses, results of operations or financial condition. Readers are cautioned not to place undue reliance on forward-looking statements, which speak only as of the date they are made. We undertake no obligation to update or revise publicly any forward-looking statements, whether because of new information, future events or otherwise.
| | | | | | | | |
| 17 | Comcast 2024 Annual Report on Form 10-K |
Item 1A: Risk Factors
Risks Related to Our Business, Industry and Operations
Our businesses operate in highly competitive and dynamic industries, and our businesses and results of operations could be adversely affected if we do not compete effectively.
Our businesses operate in intensely competitive, consumer-driven, rapidly changing environments. We compete with a growing number of companies that provide a broad range of communications products and services and entertainment, sports, news and information content to consumers. There can be no assurance that we will be able to compete effectively against our competitors or that competition will not have an adverse effect on our businesses.
Below is a summary of our most significant sources of competition. Many of these competitors offer competitive pricing, packaging and/or bundling of services to customers, which further increases competition. For a more detailed description of the competition facing our businesses, see Item 1: Business and refer to the “Competition” discussion within that section.
•Connectivity & Platforms’ broadband services compete primarily against wireline telecommunications companies, including many that are increasing deployment of fiber-based networks; wireless telecommunications companies offering internet services (using a variety of technologies, including 5G fixed wireless networks and 4G and 5G wireless broadband services); electric cooperatives and municipalities in the United States that own and operate their own broadband networks; and DBS and newer satellite broadband providers. Broadband-deployment funding initiatives at the federal and state level may result in other service providers deploying new subsidized internet access networks within our footprint, and in cases where we receive subsidies, may impose constraints on how we conduct our businesses. For a more extensive discussion of the significant risks associated with the regulation of our businesses, see “—We are subject to regulation by federal, state, local and foreign authorities, which impose additional costs and restrictions on our businesses” below and Item 1: Business and refer to the “Legislation and Regulation” discussion within that section.
•Our wireless and voice services compete with both telecommunications and wireless telecommunication providers.
•Competition for video services consists primarily of DTC streaming service providers and aggregators, DBS providers and telecommunications companies.
•Business Services Connectivity primarily competes with wireline telecommunications companies and wide area network managed service providers.
•Our businesses in Content & Experiences, as well as our video business, face substantial and increasing competition from providers of similar types of entertainment, sports, news and information content, as well as from other forms of entertainment, including from social networking and user-generated content, as well as tourism, recreational activities and lodging. They must compete to obtain talent, popular content (including sports programming), advertising and other resources required to successfully operate their businesses. This competition has further intensified as certain DTC streaming service providers have commissioned, and may continue to commission, high-cost programming and acquire live sports programming rights to attract viewers at significant costs.
Competitors with significant resources, greater efficiencies of scale, fewer regulatory burdens and more competitive pricing and packaging continue to increasingly compete with our businesses in all forms. Some of these competitors could also have preferential access to customer data or other competitive information. Further, consolidation of, or cooperation between, our competitors may increase competition in all of these areas. For example, cooperation between competitors may allow them to offer a range of products and services, including aggregating certain content into a stand-alone offering, offering free or lower cost DTC streaming services, potentially on an exclusive basis, through unlimited data-usage plans for broadband and wireless services or bundling DTC streaming services on their platforms.
Our competitive position may be negatively affected if we do not provide our customers with a satisfactory customer experience. In addition, our ability to compete effectively depends on our perceived image and reputation among our various constituencies, including our customers, consumers, advertisers, business partners, employees, investors and government authorities. For example, some of these constituencies may have their own, and some have conflicting, environmental, social and governance priorities, which may present risks to our reputation and brands if these constituencies perceive misalignment.
Changes in consumer behavior continue to adversely affect our businesses and challenge existing business models.
Distribution platforms for viewing and purchasing content continue to challenge existing business models, increase the number of competitors that our businesses face, and have driven, and will continue to drive, changes in consumer behavior as consumers seek control over when, where and how they consume content and access communications services, and how much or for how long they pay for such content.
| | | | | | | | |
| Comcast 2024 Annual Report on Form 10-K | 18 | |
The number of entertainment choices available to consumers, including DTC streaming service providers and aggregators, social networking and user-generated content platforms, and gaming and virtual reality products and services, continue to increase, intensify audience fragmentation and disaggregate how content traditionally has been distributed to and viewed by consumers. The continuing trend of content owners, including us with Peacock, delivering their content directly to consumers, rather than through, or in addition to, traditional video distribution channels also disrupts traditional media distribution business models. As consumers increasingly turn to DTC streaming services in lieu of linear video services, which continue to experience accelerated net customer losses, our video customers and video revenues, and linear television network subscriber fees received from video service providers, each decrease. In addition to reducing traditional television viewership, these trends when coupled with time-shifting technologies, such as DVR and on demand services, have caused, and likely will continue to cause, audience ratings declines for our television networks. Shifting content consumption patterns also may result in lower demand for home entertainment products or theatrical attendance. While we have adapted some of our video and content offerings to compete in the evolving media distribution landscape, such as by offering Peacock and NOW, there also can be no assurance that we will be able to successfully compete or that Peacock will grow or sustain its revenue or user base, successfully compete as a stand-alone DTC streaming service or fully offset decreases to our linear television networks’ results of operations.
Our failure to effectively anticipate or adapt to emerging competitors or changes in consumer behavior, including among younger consumers, and shifting business models could have an adverse effect on our competitive position, businesses and results of operations.
A decline in advertisers’ expenditures or changes in advertising markets could negatively impact our businesses.
We compete for the sale of advertising time with digital properties, including an increasing number of ad-supported DTC streaming service providers as advertisers have shifted, and may continue to shift, a larger portion of their total expenditures to digital media. We also compete with other online content providers, such as social networking platforms and user-generated content providers, television networks and stations, and all other advertising platforms. Because we derive substantial revenue from the sale of advertising, a decline in expenditures by advertisers, including through traditional linear television distribution models or on Peacock, could negatively impact our results of operations. We have experienced, and may continue to experience, declines caused by the economic prospects of specific advertisers or industries and economic conditions generally; increased competition for the leisure time of viewers, audience fragmentation and viewing content on DTC streaming services; use of time-shifting or advertising-blocking technologies; and regulatory intervention on advertising placement. Lower audience ratings and reduced viewership, which many of our linear television networks have experienced, and likely will continue to experience, as well as the level of popularity of Peacock, affect advertisers’ willingness to purchase advertising from us and the rates paid. Advertising sales and rates also are dependent on the methodology used for audience measurement and could be negatively affected if methodologies do not accurately reflect actual viewership levels.
Our success depends on consumer acceptance of our content, and our businesses may be adversely affected if our content fails to achieve sufficient consumer acceptance.
We create and acquire media, sports and entertainment content, the success of which depends substantially on consumer tastes and preferences that often change in unpredictable ways. To meet the changing preferences of our consumer markets, we must consistently create, acquire, market and distribute a broad array of content and theme park attractions. We have invested, and will continue to invest, substantial amounts in content, such as the production of films and original content for television networks and streaming services, and in the creation of new theme parks and theme park attractions, before learning the extent to which they will earn consumer acceptance.
We obtain a significant portion of our content from third parties, such as movie studios, television production companies, sports organizations and other suppliers, sometimes on an exclusive basis. Competition for popular content, particularly for sports programming, is intense. Entering into or renewing contracts for such content rights or acquiring additional rights has in the past resulted, and may result in the future, in significantly increased costs, potentially over an extended contractual term. Particularly with respect to contracts for sports rights, our results of operations and cash flows over the term of a contract depend on a number of factors, including the strength of the advertising market, audience size, the timing and amount of rights payments, and the ability to secure distribution from, impose surcharges on, or obtain carriage on multichannel video providers or to grow and retain subscribers to our own DTC services. There can be no assurance that revenue generated from these contracts will exceed our costs for the rights and of producing and distributing the programming. In addition, media companies may determine not to license popular content to us, and as more content owners offer their content directly to consumers through their own platforms, they may reduce the quantity and quality of the content they license to our linear television networks or Peacock. The inability to enter into or renew some or all of these contracts on acceptable terms could reduce the reach of our programming, which could adversely affect our results of operations and businesses.
| | | | | | | | |
| 19 | Comcast 2024 Annual Report on Form 10-K |
We also create content for licensing to third parties and to our linear television networks or Peacock. The inability to license such content on acceptable terms or at all could negatively impact our business. Moreover, we may generate lower revenue when we opt to retain our content for our own use, including for Peacock, rather than licensing it to third parties who pay licensing fees for such content.
If our content does not achieve sufficient consumer acceptance, or if we cannot obtain or retain rights to popular content on acceptable terms, or at all, our businesses may be adversely affected.
Programming expenses for our video services are increasing on a per subscriber basis, which could adversely affect our video businesses.
We expect programming expenses for our video services to continue to be the largest single expense item for our Residential Connectivity & Platforms business and to continue to increase on a per subscriber basis. Part of these programming expenses include payments to certain local broadcast television stations in exchange for their required consent for the retransmission of broadcast network programming to video services customers; we expect to continue to be subject to demands for payment and other concessions from local broadcast television stations. These market factors may be exacerbated by consolidation in the media industry, which may further increase our programming expenses. If we are unable to offset programming cost increases through rate increases, the sale of additional services, cost management or other initiatives, the increasing cost of programming could have an adverse effect on our results of operations.
Moreover, as our contracts with programming providers expire, there can be no assurance that they will be renewed on acceptable terms, or at all, in which case we may be unable to provide such programming as part of our video services, and our businesses and results of operations could be adversely affected.
The loss of programming distribution agreements, or the renewal of these agreements on less favorable terms, could adversely affect our businesses.
Our linear television networks depend on their ability to secure and maintain distribution agreements with traditional and virtual multichannel video providers. The number of subscribers to our television networks has been, and likely will continue to be, reduced as a result of fewer subscribers to multichannel video providers as the media distribution business model changes. Similarly, multichannel video providers may elect not to enter into agreements to distribute some or all of our linear television networks as a result of these changing market dynamics. In addition, our broadcast television networks depend on their ability to secure and maintain network affiliation agreements with third-party local broadcast television stations in the markets where we do not own the affiliated local broadcast television station. Our owned local broadcast television stations must elect, with respect to retransmission by certain multichannel video providers, either “must-carry” status, in which we require the provider to carry the station without paying any compensation to us, or “retransmission consent,” in which we give up our right to mandatory carriage and instead seek to negotiate the terms and conditions of carriage, including the amount of compensation, if any, paid to us by such provider.
For all of these types of arrangements, our ability to renew agreements on acceptable terms may be affected by evolving market dynamics and industry consolidation. There can be no assurance that any of these agreements will be entered into or renewed in the future on similar terms. The inability to enter into or renew some or all of these agreements could reduce our revenues and the reach of our programming, which could adversely affect our businesses.
Our businesses depend on using and protecting certain intellectual property rights and on not infringing, misappropriating or otherwise violating the intellectual property rights of others.
We rely on our intellectual property, such as patents, copyrights, trademarks and trade secrets, as well as licenses and other agreements with our vendors and other third parties, to use various technologies, conduct our business operations and sell our products and services. Legal challenges to our intellectual property rights and claims of intellectual property infringement, misappropriation or other violation by third parties could require that we enter into royalty or licensing agreements on unfavorable terms, incur substantial monetary liability, or be enjoined preliminarily or permanently from further use of the intellectual property in question, from importing into the United States or other jurisdictions in which we operate hardware or software that uses such intellectual property or from the continuation of our businesses as currently conducted. We may need to change our business practices if any of these events occur, which may limit our ability to compete effectively and could have an adverse effect on our results of operations. Even if we believe any such challenges or claims are without merit, they can be time-consuming, costly to defend and may divert management’s attention and resources away from our businesses. Moreover, if we are unable to obtain, or continue to obtain, licenses from our vendors and other third parties on reasonable terms, or at all, our businesses could be adversely affected.
| | | | | | | | |
| Comcast 2024 Annual Report on Form 10-K | 20 | |
In addition, intellectual property constitutes a significant part of the value of our businesses, and our success is highly dependent on protecting the intellectual property rights of the content we create or acquire against third-party misappropriation, reproduction or infringement. The unauthorized reproduction, distribution or display of copyrighted material negatively affects our ability to generate revenue from the legitimate sale of our content, as well as from the sale of advertising in connection with our content, and increases our costs due to our active enforcement of our intellectual property rights. The legal landscape for new technologies, including AI, remains uncertain, and legal developments could impact our ability to protect against unauthorized third-party use, misappropriation, reproduction or infringement or impact our ability to deploy new technologies. Our use or adoption of new and emerging technologies may also increase our exposure to intellectual property claims.
Piracy and other unauthorized uses of content are made easier, and the enforcement of intellectual property rights more challenging, by technological advances that allow the conversion of programming, films and other content into digital formats, which facilitates the creation, transmission and sharing of high-quality unauthorized copies. In particular, piracy of programming and films through unauthorized distribution platforms continues to present challenges for our businesses. For example, certain entities may stream our broadcast television content illegally online without our consent and without paying us any compensation, and sporting events on our international networks may be illegally transmitted. While piracy is a challenge in the United States, it is particularly prevalent in many parts of the world that lack developed copyright laws, effective enforcement of copyright laws and technical protective measures like those in effect in the United States. If any U.S. or international laws intended to combat piracy and protect intellectual property rights are repealed or weakened or are not adequately enforced, or if the legal system fails to adapt to new technologies that facilitate piracy, we may be unable to effectively protect our rights, the value of our intellectual property may be negatively impacted and our costs of enforcing our rights may increase.
We may be unable to obtain necessary hardware, software and operational support.
We depend on third-party vendors to supply us with a significant amount of the hardware, software and operational support necessary to provide certain of our products and services. We also rely on third-party satellite transponder capacity to provide video services in Europe, as well as on third-party wireless networks to offer certain wireless services in the United States and internationally. Some of these vendors represent our primary source of supply or grant us the right to incorporate their intellectual property into some of our hardware and software products. While we monitor the operations and financial condition of key vendors in an attempt to detect any potential difficulties, there can be no assurance that we would timely identify any operating or financial difficulties associated with these vendors or that we could effectively mitigate our risks with respect to any such difficulties. If any of these vendors experience operating or financial difficulties, including as a result of cybersecurity vulnerabilities or incidents, faulty software updates, or any other supply chain compliance-related issues, if our demand exceeds their capacity or if they breach or terminate their agreements with us or are otherwise unable to meet our specifications or provide the equipment, products or services we need in a timely manner (or at all), or at reasonable prices, our ability to provide some products or services may be adversely affected and we may incur additional costs.
Our businesses depend on keeping pace with technological developments.
Our success is, to a large extent, dependent on our ability to acquire, develop, adopt and leverage new and existing technologies, and our competitors’ use of certain types of technology, including AI, and equipment may provide them with a competitive advantage. New technologies can materially impact our businesses in a number of ways, including affecting the demand for our products, the distribution methods of our products and content to our customers, how we create our entertainment products, the ways in which our customers can purchase and view our content and the growth of distribution platforms available to advertisers. For example, current and new wireless internet technologies (including 5G fixed wireless networks and 4G and 5G wireless broadband services) continue to evolve rapidly and may allow for greater speed and reliability for those services as compared with prior technologies and create further competition for our businesses. In addition, some companies and U.S. municipalities are building advanced fiber-based networks that provide very fast internet access speeds, and some providers offer newer satellite broadband services. We expect advances in communications technology to continue to occur in the future.
If we choose technology or equipment that is not as effective or attractive to consumers as that employed by our competitors, if we fail to employ technologies desired by consumers or that enhance our business operations, such as through the use of AI, or if we fail to execute effectively on our technology initiatives, our businesses and results of operations could be adversely affected. We also will continue to incur additional costs as we execute our technology initiatives, such as the deployment of multigigabit symmetrical speeds by leveraging our DOCSIS 4.0 technology and the development and enhancement of various streaming platforms. There can be no assurance that we can execute on these and other initiatives in a manner sufficient to grow or maintain our revenue or to successfully compete in the future. We also may generate less revenue or incur increased costs if changes in our competitors’ product offerings require that we offer certain services or enhancements at a lower or no cost to our customers or that we increase our research and development expenditures.
| | | | | | | | |
| 21 | Comcast 2024 Annual Report on Form 10-K |
A cyber attack, information or security breach, or technology disruption or failure may negatively impact our ability to conduct our business or result in the misuse of confidential information, all of which could adversely affect our business, reputation and results of operations.
Network and information systems and other technologies, including those that are related to our network management, customer service operations and programming delivery and are embedded in our products and services, are critical to our business activities. In the ordinary course of our business, there are constant attempts by unauthorized parties to cause systems-related events and security incidents and to identify and exploit vulnerabilities in security architecture and system design. These incidents include computer hacking, cyber attacks, computer viruses, worms or other destructive or disruptive software, denial of service attacks, phishing attacks, malware, ransomware, malicious social engineering, theft, misconduct, fraud and other malicious activities. Incidents can be caused inadvertently by us or our third-party vendors, such as process breakdowns, human error, software or hardware failures or vulnerabilities in security architecture or system design.
Cyber threats and attacks are constantly evolving and are growing in sophistication and frequency, which increases the difficulty of detecting and successfully defending against them. For example, we expect threat actors will continue to gain sophistication by using tools and techniques, such as AI, that are specifically designed to circumvent security controls. Some cyber attacks have had, and in the future can have, cascading impacts that unfold with increasing speed across networks, information systems and other technologies across the world and create latent vulnerabilities in our and third-party vendors’ systems and other technologies. We also obtain certain confidential, proprietary and personal information about our customers, personnel and vendors, that in many cases is provided or made available to third-party vendors who agree to protect it, which has in the past, and may in the future, become compromised through a cyber attack or data breach, misappropriation, misuse, leakage, falsification or accidental release or loss of information by us or a third party. Due to the nature of our businesses, we may be at a disproportionately heightened risk of these types of incidents occurring because we maintain certain information necessary to conduct our business in digital form. We also incorporate third-party software (including extensive open-source software), applications, and data hosting and cloud-based services into many aspects of our products, services and operations, as well as rely on service providers to help us perform our business operations, all of which expose us to cyber attacks with respect to such third-party suppliers and service providers and their products and services. Due to applicable laws, regulations and contractual obligations, we may be held responsible for cybersecurity breaches or incidents experienced by such third parties in relation to the information we share with them. Due to the complexity and interconnectedness of our systems and those of our third-party vendors, the process of enhancing our protective measures can itself create a risk of systems disruptions and security issues.
While we develop and maintain systems, and operate programs that seek to prevent security incidents from occurring, these efforts are costly and must be constantly monitored and updated in the face of sophisticated and rapidly evolving attempts to overcome our security measures and protections. The occurrence of both intentional and unintentional incidents has caused, and may from time to time in the future cause, a variety of business impacts. These include degradation or disruption of our network, products and services, excessive call volume to call centers, theft or misuse of our intellectual property or other assets, disruption of the security of our internal systems, products, services or satellite transmission signals, power outages, and the compromise or exfiltration of sensitive, personal, proprietary, confidential or technical business information and customer or vendor data, and reputational impacts. In addition, despite efforts to detect unlawful intrusions, attacks can persist for an extended period of time before being detected, and following detection, it may take considerable time to understand the nature, scope, impact and timing of the incident. Moreover, the amount and scope of insurance we maintain against losses resulting from any of the foregoing events likely would not be sufficient to fully cover our losses or otherwise adequately compensate us for disruptions to our business that may result. Repercussions of these incidents, some of which we have experienced in the past, could include litigation or cause regulators to impose significant fines or other remedial measures, including with respect to relevant customer privacy rules, or otherwise have an adverse effect on our company. Despite our efforts, we expect that we will continue to experience such incidents in the future, and there can be no assurance that any such incident will not have an adverse effect on our business, reputation or results of operations. Refer to Item 1C: Cybersecurity for additional information.
| | | | | | | | |
| Comcast 2024 Annual Report on Form 10-K | 22 | |
Weak economic conditions may have a negative impact on our businesses.
A substantial portion of our revenue comes from customers whose spending patterns may be affected by prevailing economic conditions. Weak economic conditions in the United States, in Europe or globally could adversely affect demand for any of our products and services and have a negative impact on our results of operations. For example, weak economic conditions will likely impact our customers’ discretionary spending and as a result, they may reduce the level of services to which they subscribe or may discontinue subscribing to one or more of our services altogether. This risk may be increased by the expanded availability of free or lower cost competitive services, such as certain DTC streaming services, or substitute services for broadband and voice services, such as wireless and public Wi-Fi networks. Weak economic conditions also negatively impact our advertising revenue, the performance of our films and home entertainment releases, and attendance and spending in our theme parks. In particular, the success of our theme parks and theatrical releases largely depends on consumer demand for out-of-home entertainment experiences, which may be limited by weakened economic conditions. Weak economic conditions may also cause governments and regulators to impose additional tax or product affordability regulations, which could have a negative impact on our results of operations.
Weak economic conditions and disruptions in the global financial markets, such as high interest rates, may impact our ability to obtain financing or to refinance existing debt on acceptable terms, if at all, which could increase the cost of our borrowings over time and may increase our exposure to currency fluctuations in countries where we operate. Further, inflationary pressures in the United States, in Europe and globally may also have negative impacts on our cost structure and pricing models and may impact the ability of third parties (including advertisers, customers, suppliers, wholesale distributors, retailers and content creators, among others) to satisfy their obligations to us.
Acquisitions and other strategic initiatives present many risks, and we may not realize the financial and strategic goals that we had contemplated.
From time to time, we make acquisitions and investments and may pursue other strategic initiatives, such as the proposed Spin-off. In connection with such acquisitions and strategic initiatives, we may incur significant or unanticipated expenses, fail to realize anticipated benefits and synergies, have difficulty incorporating an acquired or new line of business, disrupt relationships with current and new employees, customers and vendors, incur significant debt, divert the attention of management from our current operations, or have to delay or not proceed with announced transactions or initiatives. These and other circumstances could also result in the impairment of goodwill and long-lived assets. Additionally, federal regulatory or antitrust agencies such as the FCC or DOJ or international regulators may impose restrictions on the operation of our businesses as a result of our seeking regulatory approvals for any significant acquisitions and strategic initiatives or may dissuade us from pursuing certain transactions. The occurrence of any of these events could have an adverse effect on our business and results of operations.
We face risks relating to doing business internationally that could adversely affect our businesses.
We operate our businesses worldwide. There are risks inherent in doing business internationally, including global financial market turmoil; economic volatility and global economic slowdown; currency exchange rate fluctuations and inflationary pressures; geopolitical risks, including acts of terror and war; requirements of local laws and customs relating to the publication and distribution of content and the display and sale of advertising; import or export restrictions, tariffs, sanctions and trade regulations; difficulties in developing, staffing and managing foreign operations; issues related to occupational safety and adherence to diverse local labor laws and regulations; and potentially adverse tax developments. Additionally, although we employ foreign currency derivative instruments to hedge certain exposure to foreign currency exchange rate risks, including the British pound, euro and Japanese yen, the use of such derivative instruments may not be sufficient to mitigate exchange rate fluctuations. In addition, doing business internationally subjects us to risks relating to political or social unrest, as well as corruption and government regulations, including U.S. laws such as the Foreign Corrupt Practices Act and the U.K. Bribery Act, that impose stringent requirements on how we conduct our foreign operations. Moreover, foreign enforcement of laws and contractual rights in certain countries where we do business can be inconsistent and unpredictable, which may affect our ability to enforce our rights or make investments that we believe otherwise make strategic sense. If any of these events occur or our conduct does not comply with such laws and regulations, our businesses may be adversely affected.
| | | | | | | | |
| 23 | Comcast 2024 Annual Report on Form 10-K |
Natural disasters, severe weather and other uncontrollable events could adversely affect our business, reputation and results of operations.
Our services, products and properties are vulnerable to damage from the occurrence of certain events, including natural disasters, severe weather events such as hurricanes and wildfires, and a range of other unforeseeable events such as infectious disease outbreaks, terrorist attacks or other similar events. Such events have in the past caused, and could in the future cause, a variety of adverse business impacts including degradation or disruption of our network, products and services, excessive call volume to call centers, a reduction in demand for our products, services and theme parks, disruption of our internal systems, products, services or satellite transmission signals, power outages, and damage to our or our customers’ or vendors’ equipment and properties. These events also may result in lost revenue and large expenditures to repair or replace damaged properties, products and services and could lead to litigation and regulatory fines or remedial measures, including if we inadvertently contributed to damages suffered by others.
The amount and scope of insurance we maintain against losses resulting from these types of events likely would not be sufficient to fully cover our losses or otherwise adequately compensate us for disruptions to our business that may result. We expect that we will continue to experience some or all of these events in the future, and there can be no assurance that any such event will not have an adverse effect on our business, reputation or results of operations.
The loss of key management personnel or popular on-air and creative talent could have an adverse effect on our businesses.
We rely on certain key management personnel in the operation of our businesses. While we maintain long-term and emergency transition plans for key management personnel and believe we could either identify internal candidates or attract outside candidates to fill any vacancy created by the loss of any key management personnel, the loss of one or more of our key management personnel could have a negative impact on our businesses.
In addition, our Content & Experiences business depends on the abilities and expertise of on-air and creative talent. If we fail to attract or retain on-air or creative talent, if the costs to attract or retain such talent increase materially, or if these individuals cause negative publicity or lose their current appeal, our businesses could be adversely affected.
Labor disputes, whether involving employees or sports organizations, may disrupt our operations and adversely affect our businesses.
Many of the writers, directors, actors, technical and production personnel, as well as some on-air and creative talent employees in our Content & Experiences business, are covered by collective bargaining agreements or works councils. Many of these collective bargaining agreements are industry-wide agreements, and we may lack practical control over the negotiations and terms of the agreements. If we are unable to reach agreement with a labor union before the expiration of a collective bargaining agreement, our employees who were covered by that agreement may have a right to strike or take other actions that could adversely affect us, which could disrupt our operations and reduce our revenue, and the resolution of any disputes may increase our costs. For example, the Writers Guild of America (“Writers Guild”) and the Screen Actors Guild-American Federation of Television and Radio Artists (“SAG”) work stoppages in 2023 paused productions, which reduced content licensing revenue at our Studios segment. There can be no assurance that we will renew our collective bargaining agreements as they expire or that we can renew them on favorable terms or without any work stoppages in the future.
In addition, labor disputes in sports organizations with which we have programming rights agreements of varying scope and duration could have an adverse effect on our businesses.
Risks Related to Legal, Regulatory and Governance Matters
We are subject to regulation by federal, state, local and foreign authorities, which impose additional costs and restrictions on our businesses.
Our businesses are subject to various federal, state, local and federal laws and regulations. In the United States in particular, the Communications Act and FCC rules and regulations affect significant aspects of our communications businesses.
Legislators and regulators at all levels of government frequently consider changing, and sometimes do change, existing statutes, rules or regulations, or interpretations of existing statutes, rules or regulations, or prescribe new ones, any of which may significantly affect our businesses and ability to effectively compete. Applying existing laws in novel ways to new technologies, including streaming services and AI, may also affect our business. These legislators and regulators, along with some state attorneys general and foreign governmental authorities, have been active in conducting inquiries and reviews regarding our services. State legislative and regulatory initiatives can create a patchwork of different and/or conflicting state requirements, such as with respect to privacy and Open Internet/net neutrality regulations, that can affect our businesses and ability to effectively compete.
| | | | | | | | |
| Comcast 2024 Annual Report on Form 10-K | 24 | |
Legislative and regulatory activity has increased in recent years, particularly with respect to broadband networks. For example, Congress has approved tens of billions of dollars in new funding for broadband deployment and adoption initiatives, and may from time to time consider other proposals that address communications issues, including whether it should rewrite the Communications Act to account for changes in the communications marketplace. Federal agencies have considered adopting new regulations for communications services, including broadband, although it is uncertain whether those initiatives will continue under the new Administration. States and localities are increasingly proposing new regulations impacting communications services, including broader regulation of broadband networks. Regulators in various international jurisdictions are similarly considering changes to telecommunications and media requirements. Any of these regulations could significantly affect our business and our legal and compliance costs.
In addition, United States and foreign regulators and courts could adopt new interpretations of existing competition or antitrust laws or enact new competition or antitrust laws or regulatory tools that could negatively impact our businesses. Any future legislative, judicial, regulatory or administrative actions may increase our costs or impose additional restrictions on our businesses, some of which may be significant. We are unable to predict the outcome or effects of any of these potential actions or any other legislative or regulatory proposals on our businesses.
Failure to comply with the laws and regulations applicable to our businesses could result in administrative enforcement actions, fines, and civil and criminal liability. Any changes to the legal and regulatory framework applicable to any of our services or businesses could have an adverse impact on our businesses and results of operations. For a more extensive discussion of the significant risks associated with the regulation of our businesses, see Item 1: Business and refer to the “Legislation and Regulation” discussion within that section.
Unfavorable litigation or governmental investigation results could require us to pay significant amounts or lead to onerous operating procedures.
We are subject from time to time to a number of lawsuits both in the United States and in foreign countries, including claims relating to competition, intellectual property rights (including patents), employment and labor matters, personal injury and property damage, free speech, customer privacy, regulatory requirements, advertising, marketing and selling practices, and credit and collection issues. Greater constraints on the use of arbitration to resolve certain of these disputes could adversely affect our business. We also spend substantial resources complying with various regulatory and government standards, including any related investigations and litigation. We may incur significant expenses defending any such suit or government charge and may be required to pay amounts or otherwise change our operations in ways that could adversely impact our businesses, results of operations or financial condition.
Our Class B common stock has substantial voting rights and separate approval rights over several potentially material transactions, and our Chairman and CEO has considerable influence over our company through his beneficial ownership of our Class B common stock.
Our Class B common stock has a non-dilutable 33 1/3% of the combined voting power of our Class A and Class B common stock. This non-dilutable voting power is subject to proportional decrease to the extent the number of shares of Class B common stock is reduced below 9,444,375, which was the number of shares of Class B common stock outstanding on the date of our 2002 acquisition of AT&T Corp.’s cable business, subject to adjustment in specified situations. Stock dividends payable on the Class B common stock in the form of Class B or Class A common stock do not decrease the non-dilutable voting power of the Class B common stock. The Class B common stock also has separate approval rights over several potentially material transactions, even if they are approved by our Board of Directors or by our other shareholders and even if they might be in the best interests of our other shareholders. These potentially material transactions include mergers or consolidations involving us, transactions (such as a sale of all or substantially all of our assets) or issuances of securities that require shareholder approval, transactions that result in any person or group owning shares representing more than 10% of the combined voting power of the resulting or surviving corporation, issuances of Class B common stock or securities exercisable or convertible into Class B common stock, and amendments to our articles of incorporation or by-laws that would limit the rights of holders of our Class B common stock. Brian L. Roberts, our chairman and CEO, beneficially owns all of the outstanding shares of our Class B common stock and, accordingly, has considerable influence over our company and the potential ability to transfer effective control by selling the Class B common stock, which could be at a premium.
Item 1B: Unresolved Staff Comments
None.
| | | | | | | | |
| 25 | Comcast 2024 Annual Report on Form 10-K |
Item 1C: Cybersecurity
Our management, with involvement and input from our Board of Directors, performs an annual enterprise-wide risk management (“ERM”) assessment to identify and manage key existing and emerging risks for our company. Our ERM process assesses the characteristics and circumstances of the evolving business environment at the time and seeks to identify both the potential impacts to our company of a particular risk and the velocity with which the risk may manifest (e.g., rapidly in less than three months or more slowly in more than twelve months). Our executive management team has the overall responsibility for, and oversight of, our ERM process, and an ERM steering committee manages the process, with one or more senior business executives then monitoring and managing each of the identified risks.
Cybersecurity is among the risks identified for Board-level oversight as a result of our most recent ERM assessment, with our Audit Committee of the Board overseeing our policies, practices and assessments with respect to cybersecurity.
The Board and/or our Audit Committee receive regular updates throughout the year on cybersecurity. Each of our Board and Audit Committee separately receives an annual report on cybersecurity matters and related risk exposures from our primary businesses’ Chief Information Security Officers (“CISOs”) and Chief Technology Officers or other similar officers (“CTOs”). Our Audit Committee also receives regular updates on our cybersecurity posture throughout the year, as appropriate. When covered during an Audit Committee meeting, the chair of the Audit Committee reports on its discussion to the full Board.
In addition to this Board-level oversight, our Cybersecurity Leadership Council (“CLC”) oversees our cybersecurity strategy and is responsible for overseeing and managing our cybersecurity risks. The CLC includes our Chief Financial Officer (“CFO”), Chief Legal Officer, head of Internal Audit, Chief Privacy and Data Strategy Officer, and lead internal securities counsel, as well as the CISOs, CTOs, CFOs and General Counsels of our primary businesses. Given the complex and varied nature of our businesses, the Connectivity & Platforms and Content & Experiences businesses each have a dedicated CISO who we believe is appropriately qualified to assess and manage cybersecurity risks. The Connectivity & Platforms CISO has served in various roles in product security and privacy at our company since 2016 and held various leadership and technical positions in Fortune 500 companies before joining our company. The Content & Experiences CISO has served in various roles in information security at our company since 2018 and held various roles in managing security operation center service portfolios and information security before joining our company.
The CLC conducts regular meetings throughout the year during which CISOs provide updates and report on meaningful cybersecurity risks, threats, incidents and vulnerabilities in accordance with the CLC’s reporting framework, as well as related priorities, mitigation and remediation activities, financial and employee resource levels, regulatory compliance, technology trends and third-party provider risks. To help inform this reporting framework, our primary businesses maintain incident response plans and other policies and procedures designed to respond to, mitigate and remediate cybersecurity incidents according to a defined set of severity ratings based on the potential impact to our business, information technology systems, network or data, including data held or information technology services provided by third-party vendors or other service providers.
Network and information systems and other technologies, including those that are related to our network management, customer service operations and programming delivery and are embedded in our products and services, are critical to our business activities. We frequently obtain certain confidential, proprietary and/or personal information about our customers, personnel and vendors, which in many cases is provided or made available to third-party vendors who agree to protect it. As a result, we have multiple layers of security designed to detect and block cybersecurity events, as well as a dedicated team of cybersecurity personnel, who assist our CISOs in helping to assess, identify, monitor, detect and manage cybersecurity risks, threats, vulnerabilities and incidents. In the normal course, we engage assessors, consultants and other third parties to assist in various cyber-related matters. For example, an outside consulting firm conducts a National Institute of Standards and Technology and International Organization for Standardization-based cybersecurity capability maturity assessment every three years, which is reviewed with the Audit Committee, and our security teams leverage third-party advisors, as appropriate. We also perform penetration tests, data recovery testing, security audits and risk assessments throughout the year. Our cybersecurity program also incorporates intelligence sharing capabilities about emerging threats within the telecommunications industry and other industries through collaboration with peer companies and specialized consultants and through public-private partnerships with government intelligence agencies. We hold cybersecurity trainings for our employees and request that key vendors do the same.
| | | | | | | | |
| Comcast 2024 Annual Report on Form 10-K | 26 | |
However, while we develop and maintain systems, and operate programs that seek to prevent security incidents from occurring, these systems and programs must be constantly monitored and updated in the face of sophisticated and rapidly evolving attempts to overcome our security measures and protections. The occurrence of both intentional and unintentional incidents has caused, and could cause in the future, a variety of adverse business impacts. See “Item 1A: Risk Factors” above for additional information on risks related our business, including for example risks related to cyber attacks, information and system breaches, and technology disruptions and failures; our reliance on using and protecting certain intellectual property rights; keeping pace with technological developments; legal and regulatory developments; and obtaining hardware, software and operational support from third-party vendors.
Item 2: Properties
We believe our physical assets are generally in good operating condition and are suitable and adequate for our business operations. We own our corporate headquarters, which is located in Philadelphia, Pennsylvania at One Comcast Center.
| | |
| Connectivity & Platforms Business |
Our principal physical assets for the operations of the Residential Connectivity & Platforms and the Business Services Connectivity segments consist of operating plant and equipment, including our network in the United States. Refer to Item 1: Business: Network and Technology for additional information.
Our Connectivity & Platforms business headquarters is located in One Comcast Center, Philadelphia, Pennsylvania. We also own the Comcast Technology Center, which is a center for our technology and engineering workforce located adjacent to the Comcast Center, and our Sky headquarters, located in Middlesex, United Kingdom.
We also own or lease buildings throughout the Connectivity & Platforms markets that contain administrative space, retail stores and customer service centers, and warehouses.
| | |
| Content & Experiences Business |
Our Content & Experiences business and NBCUniversal headquarters are located in New York, New York at 30 Rockefeller Plaza and its surrounding campus, which include offices and studios used by the Media segment. We own substantially all of the space we occupy at 30 Rockefeller Plaza, and we lease the spaces in the surrounding campus.
Other principal locations supporting our Media segment operations include our leased Telemundo headquarters and production facilities in Miami, Florida, as well as our Universal City location in Los Angeles, California, our owned CNBC headquarters and production facilities located in Englewood Cliffs, New Jersey and our leased NBC Sports headquarters and production facilities in Stamford, Connecticut.
Refer to Item 1: Business: Studios Segment and Theme Parks Segment for information on properties used in those respective segment operations.
We also own or lease additional offices, studios, production facilities, screening rooms, retail operations, warehouse space, satellite transmission receiving facilities and data centers in numerous locations in the United States and around the world.
Item 3: Legal Proceedings
See Note 14 to the consolidated financial statements included in this Annual Report on Form 10-K for a discussion of legal proceedings.
Item 4: Mine Safety Disclosures
Not applicable.
| | | | | | | | |
| 27 | Comcast 2024 Annual Report on Form 10-K |
Part II
Item 5: Market for Registrant’s Common Equity, Related Stockholder Matters and Issuer Purchases of Equity Securities
Market Information
Comcast’s Class A common stock is listed on The Nasdaq Stock Market LLC under the symbol CMCSA. There is no established public trading market for Comcast’s Class B common stock. The Class B common stock can be converted, on a share for share basis, into Class A common stock.
Holders
Record holders as of January 15, 2025 are presented in the table below.
| | | | | |
| Stock Class | Record Holders |
| Class A Common Stock | 303,127 | |
| Class B Common Stock | 1 | |
Holders of Class A common stock in the aggregate hold 662/3% of the combined voting power of our common stock. The number of votes that each share of Class A common stock has at any given time depends on the number of shares of Class A common stock and Class B common stock then outstanding, with each share of Class B common stock having 15 votes per share. The Class B common stock represents 331/3% of the combined voting power of our common stock, which percentage is generally non-dilutable under the terms of our articles of incorporation. Mr. Brian L. Roberts beneficially owns all outstanding shares of Class B common stock. Generally, including as to the election of directors, holders of Class A common stock and Class B common stock vote as one class except where class voting is required by law.
Dividends
We expect to continue to pay quarterly dividends, although each dividend is subject to approval by our Board of Directors. Refer to Liquidity and Capital Resources in Item 7: Management’s Discussion and Analysis of Financial Condition and Results of Operations for additional information.
Share Repurchases
The table below summarizes Comcast’s common stock repurchases during 2024.
| | | | | | | | | | | | | | | | | | |
| Period | Total Number of
Shares
Purchased | Average
Price Per
Share | Total Number of
Shares
Purchased as
Part of Publicly
Announced
Authorization | Total Dollar
Amount
Purchased Under the Publicly Announced
Authorization | Maximum Dollar Value
of Shares That
May Yet Be Purchased
Under the Publicly
Announced
Authorization(a) | |
| First Quarter 2024 | 55,961,536 | | $ | 43.03 | | 55,961,536 | | $ | 2,408,046,377 | | $ | 13,186,952,831 | | |
| Second Quarter 2024 | 56,381,926 | | $ | 39.29 | | 56,381,926 | | $ | 2,214,999,556 | | $ | 10,971,953,275 | | |
| Third Quarter 2024 | 49,913,271 | | $ | 39.44 | | 49,913,271 | | $ | 1,968,792,051 | | $ | 9,003,161,225 | | |
| October 1-31, 2024 | 16,562,668 | | $ | 41.66 | | 16,562,668 | | $ | 689,999,638 | | $ | 8,313,161,586 | | |
| November 1-30, 2024 | 12,943,713 | | $ | 43.26 | | 12,943,713 | | $ | 559,999,640 | | $ | 7,753,161,946 | | |
| December 1-31, 2024 | 20,002,768 | | $ | 39.89 | | 20,002,768 | | $ | 797,999,685 | | $ | 6,955,162,262 | | |
| Total | 211,765,882 | | $ | 40.80 | | 211,765,882 | | $ | 8,639,836,946 | | $ | 6,955,162,262 | | |
(a)In September 2022, our Board of Directors approved a share repurchase program authorization of $20 billion and in January 2024, our Board of Directors terminated the existing program and approved a new program authorization of $15 billion effective as of January 26, 2024, which had no expiration date. In January 2025, our Board of Directors terminated this existing program and approved a new program authorization of $15 billion, which has no expiration date. We expect to repurchase additional shares of our Class A common stock under this authorization in the open market or in private transactions, subject to market and other conditions.
| | | | | | | | |
| Comcast 2024 Annual Report on Form 10-K | 28 | |
The following graph compares the annual percentage change in the cumulative total shareholder return on Comcast’s Class A common stock during the five years ended December 31, 2024 with the cumulative total returns on the Standard & Poor’s 500 Stock Index and a select peer group consisting of us and other companies engaged in the transmission and distribution and media industries. This peer group consists of our Class A common stock and the common stock of AT&T Inc., Charter Communications, Inc., Fox Corp. (Class A), Lumen Technologies, Inc., Paramount Global (Class B), T-Mobile US, Inc., Verizon Communications Inc., Warner Bros. Discovery Inc. and The Walt Disney Company.
The comparison assumes $100 was invested on December 31, 2019 in our Class A common stock and in each of the following indices and assumes the reinvestment of dividends.
| | | | | | | | | | | | | | |
| Comparison of 5 Year Cumulative Total Return |
| | | | | | | | | | | | | | | | | |
| 2020 | 2021 | 2022 | 2023 | 2024 |
| Comcast Class A | $ | 119 | | $ | 117 | | $ | 83 | | $ | 107 | | $ | 95 | |
| S&P 500 Stock Index | $ | 118 | | $ | 152 | | $ | 125 | | $ | 157 | | $ | 197 | |
| Peer Group | $ | 112 | | $ | 103 | | $ | 79 | | $ | 87 | | $ | 103 | |
| | | | | |
Item 6: [Reserved]
[Reserved]
| | | | | | | | |
| 29 | Comcast 2024 Annual Report on Form 10-K |
Item 7: Management’s Discussion and Analysis of Financial Condition and Results of Operations
Management’s discussion and analysis of financial condition and results of operations is provided as a supplement to, and should be read in conjunction with, the consolidated financial statements and related notes (“Notes”) to enhance the understanding of our operations and our present business environment. For more information about our company’s operations and the risks facing our businesses, see Item 1: Business and Item 1A: Risk Factors, respectively. Refer to Item 7: Management’s Discussion and Analysis of Financial Condition and Results of Operations in our 2023 Annual Report on Form 10-K for management’s discussion and analysis of our financial condition and results of operations for fiscal year 2022, including comparison to fiscal year 2023. We are a global media and technology company with two primary businesses: Connectivity & Platforms and Content & Experiences. We present the operations of (1) our Connectivity & Platforms business in two segments: Residential Connectivity & Platforms and Business Services Connectivity; and (2) our Content & Experiences business in three segments: Media, Studios and Theme Parks. The discussion and analysis that follows includes the results of the cable television networks and complementary digital assets proposed to be included in the Spin-off and does not reflect or give effect to what our results of operations and financial condition may be following the Spin-off, if consummated.
| | |
Consolidated Revenue, Net Income Attributable to Comcast Corporation and Adjusted EBITDA(a) |
| (in billions) |
| | | | | | | | | | | | | | | | | | | | |
| Revenue | | Net Income Attributable to Comcast Corporation | | Adjusted EBITDA | |
(a)Adjusted EBITDA is a financial measure that is not defined by generally accepted accounting principles in the United States (“GAAP”). Refer to the “Non-GAAP Financial Measures” section on page 44 for additional information, including our definition and our use of Adjusted EBITDA, and for a reconciliation from net income attributable to Comcast Corporation to Adjusted EBITDA. Revenue, Net Income Attributable to Comcast Corporation and Adjusted EBITDA charts are not presented on the same scale.
| | |
2024 Revenue and Adjusted EBITDA Segment Contribution(a) |
(a)Charts exclude the results of Content & Experiences Headquarters and Other, Corporate and Other, and eliminations. Refer to our Management’s Discussion and Analysis of Financial Condition and Results of Operations for additional information.
| | | | | | | | |
| Comcast 2024 Annual Report on Form 10-K | 30 | |
2024 Developments
| | | | | |
Connectivity & Platforms(a) | Content & Experiences(a)(b) |
| |
| |
(a) Revenue and Adjusted EBITDA charts are not presented on the same scale.
(b) Segment details in the charts exclude the results of Content & Experiences Headquarters and Other and Eliminations and therefore the amounts do not equal the total.
| | | | | | | | |
| Residential Connectivity & Platforms | | Media |
•Revenue remained consistent due to decreases in video and other revenue, offset by increases in domestic broadband, domestic wireless, international connectivity and advertising revenue. •Adjusted EBITDA increased primarily due to a decrease in programming expenses, while revenue remained consistent. •Adjusted EBITDA margin increased from 37.5% to 38.2%.
Business Services Connectivity •Revenue increased due to an increase in revenue from enterprise solutions offerings and small business customers. •Adjusted EBITDA increased due to an increase in revenue, partially offset by increased costs and expenses. •Adjusted EBITDA margin decreased from 57.2% to 56.7%.
Customer Metrics •Total customer relationships decreased by 527,000 to 51.6 million. •Domestic broadband customers decreased by 411,000 to 31.8 million. •Domestic wireless lines increased by 1.2 million to 7.8 million. •Domestic video customers decreased by 1.6 million to 12.5 million. •Domestic homes and businesses passed increased by 1.2 million to 63.7 million.
Capital Expenditures •Total Connectivity & Platforms capital expenditures remained consistent at $8.3 billion, reflecting increased spending on line extensions and support capital, offset by decreased spending on customer premise equipment and scalable infrastructure.
| | •Revenue increased primarily due to the impact of the Paris Olympics in 2024. Excluding $1.9 billion of incremental revenue associated with this event, revenue increased due to increases in domestic distribution and international networks revenue. •Adjusted EBITDA increased primarily due to an increase in revenue, partially offset by an increase in programming and production costs driven by the Paris Olympics. •Peacock generated revenue and costs and expenses of $4.9 billion and $6.7 billion in 2024, respectively, including the Paris Olympics, compared to $3.4 billion and $6.1 billion in 2023, respectively. Paid subscribers increased by 5 million to 36 million in 2024.
Studios •Revenue decreased primarily due to decreases in theatrical and content licensing revenue. 2023 included the impact of the Writers Guild and SAG work stoppages. •Adjusted EBITDA increased due to a decrease in costs and expenses driven by programming and production, partially offset by a decrease in revenue.
Theme Parks •Revenue decreased due to decreases in revenue at our domestic theme parks, as well as the negative impact of foreign currency at our international theme parks. •Adjusted EBITDA decreased due to a decrease in revenue and an increase in costs and expenses. •Capital expenditures continues to reflect significant spending for the development of Epic Universe in Orlando. |
| | | | | | | | |
| 31 | Comcast 2024 Annual Report on Form 10-K |
Other
•Repurchased a total of 212 million shares of our Class A common stock for $8.6 billion in 2024 compared to a total of 262 million shares of our Class A common stock for $11.0 billion in 2023. Raised our dividend by $0.08 to $1.24 per share on an annualized basis in January 2024 and paid $4.8 billion of dividends in 2024.
•In the fourth quarter of 2023, we exercised our put right requiring Disney to purchase our interest in Hulu and received $8.6 billion, representing $9.2 billion for our share of Hulu’s minimum equity value presented as an advance on the sale of our investment in our consolidated balance sheet, less $557 million for our share of prior capital calls. We expect to receive additional proceeds for the sale of our interest in Hulu following the final determination of Hulu’s fair value pursuant to a third-party appraisal process, at which time we will recognize the sale of our interest. See Note 7.
•In November 2024, we announced our intention to create SpinCo, a new independent publicly traded company through a tax-free spin-off. We are targeting to complete the Spin-off by the end of 2025, subject to the satisfaction of customary conditions. There can be no assurance that a separation transaction will occur, or, if one does occur, of its terms or timing.
| | |
| Consolidated Operating Results |
| | | | | | | | | | | | | |
| Year ended December 31 (in millions, except per share data) | 2024 | 2023 | | Change
2023 to 2024 | |
| Revenue | $ | 123,731 | | $ | 121,572 | | | 1.8 | % | |
| Costs and Expenses: | | | | | |
| Programming and production | 37,026 | | 36,762 | | | 0.7 | | |
| Marketing and promotion | 8,073 | | 7,971 | | | 1.3 | | |
| Other operating and administrative | 40,533 | | 39,190 | | | 3.4 | | |
| Depreciation | 8,729 | | 8,854 | | | (1.4) | | |
| Amortization | 6,072 | | 5,482 | | | 10.8 | | |
| | | | | |
| | | | | |
| Total costs and expenses | 100,434 | | 98,258 | | | 2.2 | | |
| Operating income | 23,297 | | 23,314 | | | (0.1) | | |
| Interest expense | (4,134) | | (4,087) | | | 1.2 | | |
| Investment and other income (loss), net | (490) | | 1,252 | | | NM | |
| Income before income taxes | 18,673 | | 20,478 | | | (8.8) | | |
| Income tax expense | (2,796) | | (5,371) | | | (48.0) | | |
| Net income | 15,877 | | 15,107 | | | 5.1 | | |
| Less: Net income (loss) attributable to noncontrolling interests | (315) | | (282) | | | 12.0 | | |
| Net income attributable to Comcast Corporation | $ | 16,192 | | $ | 15,388 | | | 5.2 | % | |
| Basic earnings per common share attributable to Comcast Corporation shareholders | $ | 4.17 | | $ | 3.73 | | | 11.7 | % | |
| Diluted earnings per common share attributable to Comcast Corporation shareholders | $ | 4.14 | | $ | 3.71 | | | 11.7 | % | |
| Weighted-average number of common shares outstanding - basic | 3,885 | | 4,122 | | (5.8) | % | |
| Weighted average number of common shares outstanding - diluted | 3,908 | | 4,148 | | (5.8) | % | |
| | | | | |
Adjusted EBITDA(a) | $ | 38,069 | | $ | 37,633 | | | 1.2 | % | |
Percentage changes that are considered not meaningful are denoted with NM.
(a)Adjusted EBITDA is a non-GAAP financial measure. Refer to the “Non-GAAP Financial Measures” section on page 44 for additional information, including our definition and our use of Adjusted EBITDA, and for a reconciliation from net income attributable to Comcast Corporation to Adjusted EBITDA.
| | | | | | | | |
| Comcast 2024 Annual Report on Form 10-K | 32 | |
Consolidated Revenue
The following graph illustrates the contributions to the change in consolidated revenue made by our Connectivity & Platforms and Content & Experiences businesses, as well as by Corporate and Other activities, including eliminations.
(a) Graph is presented using a truncated scale.
Revenue for our segments and other businesses is discussed separately below under the heading “Segment Operating Results.”
Consolidated Costs and Expenses
The following graph illustrates the contributions to the change in consolidated costs and expenses, excluding depreciation expense and amortization expense, made by our Connectivity & Platforms and Content & Experiences businesses, as well as by Corporate and Other activities, including adjustments and eliminations.
(a) Graph is presented using a truncated scale.
Costs and expenses for our segments and our corporate operations and other businesses are discussed separately below under the heading “Segment Operating Results.”
Consolidated depreciation and amortization expense increased in 2024 compared to 2023 primarily due to increased amortization of certain acquisition-related intangible assets related to the linear media business, partially offset by a decrease in depreciation of our international property and equipment and a decrease in the amortization of software.
Amortization expense from acquisition-related intangible assets totaled $2.7 billion and $2.3 billion in 2024 and 2023, respectively. Amounts primarily relate to customer relationship intangible assets recorded in connection with the Sky transaction in 2018 and the NBCUniversal transaction in 2011.
| | | | | | | | |
| 33 | Comcast 2024 Annual Report on Form 10-K |
Consolidated interest expense increased in 2024 compared to 2023 primarily due to an increase in average debt outstanding and higher weighted-average interest rates in the current year, partially offset by interest expense in the prior year associated with a collateralized obligation that was repaid in the fourth quarter of 2023.
Consolidated investment and other income (loss), net increased in 2024 compared to 2023.
| | | | | | | | | |
| Year ended December 31 (in millions) | 2024 | 2023 | |
| Equity in net income (losses) of investees, net | $ | (680) | | $ | 789 | | |
| Realized and unrealized gains (losses) on equity securities, net | (313) | | (130) | | |
| Other income (loss), net | 502 | | 592 | | |
| Total investment and other income (loss), net | $ | (490) | | $ | 1,252 | | |
The change in equity in net income (losses) of investees, net in 2024 compared to 2023 was primarily due to our investment in Atairos. The income (losses) at Atairos were driven by fair value adjustments on its underlying investments with income (loss) of $(474) million and $1.1 billion in 2024 and 2023, respectively.
The change in realized and unrealized gains (losses) on equity securities, net in 2024 compared to 2023 was primarily due to higher losses on nonmarketable securities in the current year.
The change in other income (loss), net in 2024 compared to 2023 primarily resulted from foreign exchange remeasurement.
| | |
| Consolidated Income Tax Expense |
Our effective income tax rate in 2024 and 2023 was 15.0% and 26.2%, respectively.
The decrease in income tax expense in 2024 was primarily driven by a tax benefit from an internal corporate reorganization completed in 2024, as well as lower domestic income before income taxes.
See Note 5 for additional information on our income taxes.
| | |
| Consolidated Net Income (Loss) Attributable to Noncontrolling Interests |
The changes in net income (loss) attributable to noncontrolling interests in 2024 compared to 2023 was primarily due to our regional sports networks.
| | | | | | | | |
| Comcast 2024 Annual Report on Form 10-K | 34 | |
| | |
| Segment Operating Results |
Our segment operating results are presented based on how we assess operating performance and internally report financial information. See Note 2 for additional information on our segments.
| | |
| Connectivity & Platforms Overview |
| | | | | | | | | | | | | | | | | |
| | | | 2023 to 2024 | |
| Year ended December 31 (in millions) | 2024 | 2023 | | Change | Constant Currency Change(b) | | |
| Revenue | | | | | | | |
| Residential Connectivity & Platforms | $ | 71,574 | | $ | 71,946 | | | (0.5) | % | (1.0) | % | | |
| Business Services Connectivity | 9,701 | | 9,255 | | | 4.8 | | 4.8 | | | |
| Total Connectivity & Platforms revenue | $ | 81,275 | | $ | 81,201 | | | 0.1 | % | (0.3) | % | | |
| Adjusted EBITDA | | | | | | | |
| Residential Connectivity & Platforms | $ | 27,338 | | $ | 26,948 | | | 1.4 | % | 1.2 | % | | |
| Business Services Connectivity | 5,500 | | 5,291 | | | 3.9 | | 4.0 | | | |
| Total Connectivity & Platforms Adjusted EBITDA | $ | 32,838 | | $ | 32,239 | | | 1.9 | % | 1.7 | % | | |
Adjusted EBITDA Margin(a) | | | | | | | |
| Residential Connectivity & Platforms | 38.2 | % | 37.5 | % | | 70 bps | 80 bps | | |
| Business Services Connectivity | 56.7 | | 57.2 | | | (50) bps | (50) bps | | |
| Total Connectivity & Platforms Adjusted EBITDA margin | 40.4 | % | 39.7 | % | | 70 bps | 80 bps | | |
| | | | | | | |
| | | | | | | |
| | | | | | | |
| | | | | | | |
| | | | | | | |
| | | | | | | |
| | | | | | | |
| | | | | | | |
| | | | | | | |
| | | | | | | |
| | | | | | | |
| | | | | | | |
| | | | | | | |
| | | | | | | |
| | | | | | | |
| | | | | | | |
| | | | | | | |
| | | | | | | |
(a)Our Adjusted EBITDA margin is Adjusted EBITDA as a percentage of revenue. We believe this metric is useful particularly as we continue to focus on growing our higher-margin businesses and improving overall operating cost management. The changes reflect the year-over-year basis point changes in the rounded Adjusted EBITDA margins.
(b)Constant currency is a non-GAAP financial measure. Refer to the “Non-GAAP Financial Measures” section on page 44 for additional information, including our definition and our use of constant currency, and for a reconciliation of constant currency amounts.
We continue to focus on growing our higher-margin connectivity businesses while managing overall operating costs. We also continue to invest in our network to support higher-speed broadband offerings and to expand the number of homes and businesses passed. A competitive environment, which has increased in recent years, has had negative impacts on our customer relationships additions/(losses). In addition, government funding for the Affordable Connectivity Program, which provided a monthly discount towards broadband service for eligible low-income households, expired during the second quarter of 2024, which had a negative impact on our residential domestic broadband customer relationships. We believe our residential connectivity revenue will increase as a result of growth in average domestic broadband revenue per customer, as well as increases in domestic wireless and international connectivity revenue. At the same time, we expect continued declines in video revenue as a result of domestic customer net losses due to shifting video consumption patterns and the competitive environment, although customer net losses typically mitigate the impact of continued rate increases on programming expenses. We also expect continued declines in other revenue related to declines in wireline voice revenue. We believe our Business Services Connectivity segment will continue to grow by offering competitive services, including enterprise solutions.
| | | | | | | | |
| 35 | Comcast 2024 Annual Report on Form 10-K |
Connectivity & Platforms Customer Metrics
| | | | | | | | | | | | | | | | |
| | | | | | |
| | Net Additions / (Losses) |
| (in thousands) | 2024 | 2023 | | 2024 | 2023 | |
| Customer Relationships | | | | | | |
Domestic Residential Connectivity & Platforms customer relationships(a) | 31,172 | | 31,648 | | | (476) | | (212) | | |
International Residential Connectivity & Platforms customer relationships(a) | 17,811 | 17,847 | | (36) | | (93) | | |
Business Services Connectivity customer relationships(b) | 2,626 | 2,641 | | (16) | | 17 | | |
| Total Connectivity & Platforms customer relationships | 51,609 | 52,136 | | (527) | | (288) | | |
| Domestic Broadband | | | | | | |
| Residential customers | 29,373 | 29,748 | | (375) | | (64) | | |
| Business customers | 2,469 | 2,505 | | (36) | | (2) | | |
| Total domestic broadband customers | 31,842 | 32,253 | | (411) | | (66) | | |
| Domestic Wireless | | | | | | |
Total domestic wireless lines(c) | 7,826 | 6,588 | | 1,237 | | 1,275 | | |
| Domestic Video | | | | | | |
| Total domestic video customers | 12,523 | 14,106 | | (1,583) | | (2,037) | | |
Domestic homes and businesses passed(d) | 63,692 | 62,457 | | | | |
Domestic broadband penetration of homes and businesses passed(e) | 49.8 | % | 51.5 | % | | | | |
(a)Residential Connectivity & Platforms customer relationships generally represent the number of residential customer locations that subscribe to at least one of our services. International Residential Connectivity & Platforms customer relationships represent customers receiving Sky services in the United Kingdom and Italy. Because each of our services includes a variety of product tiers, which may change from time to time, net additions or losses in any one period will reflect a mix of customers at various tiers.
(b)Business Services Connectivity customer metrics are generally counted based on the number of locations receiving services, including locations within our network in the United States, as well as locations outside of our network both in the United States and internationally. Certain arrangements whereby third parties provide connectivity services leveraging our network are also generally counted based on the number of locations served.
(c)Domestic wireless lines represent the number of residential and business customers’ wireless devices. An individual customer relationship may have multiple wireless lines.
(d)Connectivity & Platforms domestic homes and businesses are considered passed if we can connect them to our network in the United States without further extending the transmission lines. Homes and businesses passed is an estimate based on the best available information.
(e)Penetration is calculated by dividing the number of domestic customers located within our network by the number of domestic homes and businesses passed.
| | | | | | | | | | | | | | | | | |
| | | | 2023 to 2024 | |
| 2024 | 2023 | | Change | Constant Currency Change(a) | | |
| Average monthly total Connectivity & Platforms revenue per customer relationship | $ | 130.57 | | $ | 129.43 | | | 0.9 | % | 0.4 | % | | |
| Average monthly total Connectivity & Platforms Adjusted EBITDA per customer relationship | $ | 52.75 | | $ | 51.39 | | | 2.7 | % | 2.5 | % | | |
(a)Constant currency is a non-GAAP financial measure. Refer to the “Non-GAAP Financial Measure” section on page 44 for additional information, including our definition and our use of constant currency, and for a reconciliation of constant currency amounts.
Average monthly total revenue per customer relationship is impacted by rate adjustments and changes in the types and levels of services received by our residential and business customers, as well as changes in advertising and other revenue and in foreign currency exchange rates. While revenue from our individual service offerings is also impacted by changes in the allocation of revenue among services sold in a bundle, the allocation does not impact average monthly total revenue per customer relationship. Each of our services has a different contribution to Adjusted EBITDA margin. We use average monthly Adjusted EBITDA per customer relationship to evaluate the profitability of our customer base across our service offerings. We believe both metrics are useful to understand the trends in our business, and average monthly Adjusted EBITDA per customer relationship is useful particularly as we continue to focus on growing our higher-margin businesses.
| | | | | | | | |
| Comcast 2024 Annual Report on Form 10-K | 36 | |
Connectivity & Platforms — Supplemental Costs and Expenses Information
Connectivity & Platforms supplemental costs and expenses information in the table below is presented on an aggregate basis across the Connectivity & Platforms segments as the segments use certain shared infrastructure, including our network in the United States. Costs and expenses information reported separately for the Residential Connectivity & Platforms and Business Services Connectivity segments includes each segment’s direct costs and an allocation of shared costs.
| | | | | | | | | | | | | | | | | | | | | | | | | |
| | | | | | | | | | 2023 to 2024 | |
| (in millions) | | | | | | | | 2024 | 2023 | | | Change | Constant Currency Change(g) | | |
| Costs and Expenses | | | | | | | | | | | | | | | |
Programming(a) | | | | | | | | $ | 16,881 | | $ | 18,067 | | | | (6.6) | % | (7.1) | % | | |
Technical and support(b) | | | | | | | | 7,617 | | 7,416 | | | | 2.7 | | 2.3 | | | |
Direct product costs(c) | | | | | | | | 6,607 | | 6,146 | | | | 7.5 | | 6.0 | | | |
Marketing and promotion(d) | | | | | | | | 4,772 | | 4,720 | | | | 1.1 | | 0.6 | | | |
Customer service(e) | | | | | | | | 2,732 | | 2,783 | | | | (1.9) | | (2.3) | | | |
Other(f) | | | | | | | | 9,828 | | 9,830 | | | | — | | (0.6) | | | |
| Total Connectivity & Platforms costs and expenses | | | | | | | | $ | 48,438 | | $ | 48,962 | | | | (1.1) | % | (1.7) | % | | |
(a)Programming expenses, which represent our most significant operating expense, are the fees we incur to provide video services to our customers, and primarily include fees related to the distribution of television network programming and fees charged for retransmission of the signals from local broadcast television stations. These expenses also include the costs of content on the Sky-branded entertainment television networks, including amortization of licensed content.
(b)Technical and support expenses primarily consists of costs for labor to complete service call and installation activities; and costs for network operations and satellite transmission, product development, fulfillment and provisioning.
(c)Direct product costs primarily consists of access fees related to using wireless and broadband networks owned by third parties to deliver our services and costs of products sold, including wireless devices and Sky Glass smart televisions.
(d)Marketing and promotion expenses primarily consists of the costs associated with attracting new customers and promoting our service offerings.
(e)Customer service expenses primarily consists of the personnel and other costs associated with customer service and certain selling activities.
(f)Other expenses primarily consists of administrative personnel costs; franchise and other regulatory fees; fees paid to third parties where we sell advertising on their behalf; bad debt; building and office expenses, taxes and billing costs; and other business, headquarters and support costs necessary to operate the Connectivity & Platforms business.
(g)Constant currency is a non-GAAP financial measure. Refer to the “Non-GAAP Financial Measures” section on page 44 for additional information, including our definition and our use of constant currency, and for a reconciliation of constant currency amounts.
| | |
| Residential Connectivity & Platforms Segment Results of Operations |
| | | | | | | | | | | | | | | | | | | | | | | | | | | |
| | | | | | | | | | | 2023 to 2024 | |
| (in millions) | | | | | | | | 2024 | 2023 | | | Change | Constant Currency Change(a) | | |
| Revenue | | | | | | | | | | | | | | | |
| Domestic broadband | | | | | | | | $ | 26,228 | | $ | 25,489 | | | | 2.9 | % | 2.9 | % | | |
| Domestic wireless | | | | | | | | 4,273 | | 3,664 | | | | 16.6 | | 16.6 | | | |
| International connectivity | | | | | | | | 4,854 | | 4,207 | | | | 15.4 | | 12.4 | | | |
| Total residential connectivity | | | | | | | | 35,355 | | 33,359 | | | | 6.0 | | 5.6 | | | |
| Video | | | | | | | | 26,872 | | 28,797 | | | | (6.7) | | (7.2) | | | |
| Advertising | | | | | | | | 4,089 | | 3,969 | | | | 3.0 | | 2.1 | | | |
| Other | | | | | | | | 5,259 | | 5,820 | | | | (9.6) | | (10.2) | | | |
| Total revenue | | | | | | | | 71,574 | | 71,946 | | | | (0.5) | | (1.0) | | | |
| Costs and Expenses | | | | | | | | | | | | | | | |
| Programming | | | | | | | | 16,881 | | 18,067 | | | | (6.6) | | (7.1) | | | |
| Other | | | | | | | | 27,355 | | 26,932 | | | | 1.6 | | 0.8 | | | |
| Total costs and expenses | | | | | | | | 44,237 | | 44,998 | | | | (1.7) | | (2.3) | | | |
| Adjusted EBITDA | | | | | | | | $ | 27,338 | | $ | 26,948 | | | | 1.4 | % | 1.2 | % | | |
(a)Constant currency is a non-GAAP financial measure. Refer to the “Non-GAAP Financial Measures” section on page 44 for additional information, including our definition and our use of constant currency, and for a reconciliation of constant currency amounts.
| | | | | | | | |
| 37 | Comcast 2024 Annual Report on Form 10-K |
Residential Connectivity & Platforms Segment – Revenue
Domestic broadband revenue primarily consists of revenue from sales of broadband services to residential customers in the United States, including equipment and installation services. Domestic broadband revenue also includes revenue related to Xumo Stream Boxes and commission revenue from the sale of certain DTC streaming services.
Domestic broadband revenue increased in 2024 primarily due to an increase in average rates.
Domestic wireless revenue primarily consists of revenue from sales of wireless services and devices, including handsets, tablets and smart watches, to residential customers in the United States.
Domestic wireless revenue increased in 2024 primarily due to an increase in the number of customer lines and device sales.
International connectivity revenue primarily consists of revenue from sales of broadband services, including equipment and installation services, wireless services and wireless devices to residential customers in the United Kingdom and Italy, as well as commission revenue from the sale of certain third-party DTC streaming services.
International connectivity revenue increased in 2024 primarily due to an increase in broadband revenue resulting from an increase in average rates and an increase in wireless revenue primarily resulting from an increase in the sale of wireless services. This increase includes the positive impact of foreign currency.
Video revenue primarily consists of revenue from sales of video services to residential and business customers across the Connectivity & Platforms markets, including equipment and installation services. Video revenue includes pay-per-view and other transactional revenue and franchise fees, as well as revenue from sales of certain hardware, including Sky Glass smart televisions.
Video revenue decreased in 2024 due to declines in the overall number of video customers, partially offset by an overall increase in average rates.
Advertising revenue primarily consists of revenue from the sale of advertising across our platforms in the Connectivity & Platforms markets, including advertising as part of our distribution agreements with cable networks in the United States, and advertising on Sky-branded entertainment television networks and on our digital properties. Advertising also includes revenue where we enter into representation agreements under which we sell advertising on behalf of third parties and from our advanced advertising businesses.
Advertising revenue increased in 2024 primarily driven by an increase in domestic political advertising, partially offset by lower domestic nonpolitical advertising.
Other revenue primarily consists of revenue in the Connectivity & Platforms markets from sales of wireline voice services to residential customers; our residential security and automation services businesses; the licensing of our technology platforms to other multichannel video providers; the distribution of certain of our Sky-branded entertainment television networks to third-party video service providers; commissions from electronic retailing networks; and certain billing and collection fees.
Other revenue decreased in 2024 primarily due to a decrease in residential wireline voice revenue driven by a decline in the number of customers.
Residential Connectivity & Platforms Segment – Costs and Expenses
Programming expenses decreased in 2024 primarily due to a decline in the number of domestic video subscribers, partially offset by domestic contractual rate increases.
Other expenses increased in 2024 primarily due to an increase in direct product costs, the impact of foreign currency and higher technical and support costs, partially offset by lower severance charges in 2024 compared to severance and other charges in 2023.
| | | | | | | | |
| Comcast 2024 Annual Report on Form 10-K | 38 | |
| | |
| Business Services Connectivity Segment Results of Operations |
| | | | | | | | | | | | | | | | | | | | | | | | |
| (in millions) | | | | | | | | 2024 | | 2023 | | | Change
2023 to 2024 | |
| Revenue | | | | | | | | $ | 9,701 | | | $ | 9,255 | | | | 4.8 | % | |
| Costs and expenses | | | | | | | | 4,201 | | | 3,964 | | | | 6.0 | | |
| Adjusted EBITDA | | | | | | | | $ | 5,500 | | | $ | 5,291 | | | | 3.9 | % | |
Business services connectivity revenue primarily consists of revenue from our service offerings for small business locations in the United States, which include broadband, wireline voice and wireless services, as well as our enterprise solutions offerings, and our business connectivity service offerings in the United Kingdom.
Business services connectivity revenue increased in 2024 primarily due to an increase in revenue from enterprise solutions offerings and from higher rates from small business customers.
Business services connectivity costs and expenses increased in 2024 primarily due to increases in direct product costs, marketing and promotion expenses, and technical and support expenses. Severance charges in 2024 were consistent compared to severance and other charges in 2023.
| | |
| Content & Experiences Overview |
| | | | | | | | | | | | | | | |
| Year ended December 31 (in millions) | 2024 | 2023 | | Change
2023 to 2024 | | | |
| Revenue | | | | | | | |
| Media | $ | 28,148 | | $ | 25,355 | | | 11.0 | % | | | |
| | | | | | | |
| Studios | 11,092 | | 11,625 | | | (4.6) | | | | |
| Theme Parks | 8,617 | | 8,947 | | | (3.7) | | | | |
| Headquarters and Other | 50 | | 64 | | | (21.7) | | | | |
| Eliminations | (2,798) | | (2,800) | | | 0.1 | | | | |
| Total Content & Experiences revenue | $ | 45,108 | | $ | 43,191 | | | 4.4 | % | | | |
| Adjusted EBITDA | | | | | | | |
| Media | $ | 3,130 | | $ | 2,955 | | | 5.9 | % | | | |
| | | | | | | |
| Studios | 1,404 | | 1,269 | | | 10.7 | | | | |
| Theme Parks | 2,949 | | 3,345 | | | (11.8) | | | | |
| Headquarters and Other | (831) | | (946) | | | 12.2 | | | | |
| Eliminations | 82 | | 77 | | | 5.9 | | | | |
| Total Content & Experiences Adjusted EBITDA | $ | 6,735 | | $ | 6,700 | | | 0.5 | % | | | |
We operate our Media segment as a combined television and streaming business. We expect that the number of subscribers and audience ratings at our linear television networks will continue to decline as a result of the competitive environment and shifting video consumption patterns, which we aim to mitigate over time by continued growth in paid subscribers and advertising revenue at Peacock. We expect to continue to incur significant costs related to content and marketing at Peacock. Revenue and programming expenses are also impacted by the timing of certain sporting events, including the Olympics in the third quarter of 2024 and our acquisition of NBA rights, which begin in 2025.
Our Studios segment generates revenue primarily from third parties and from licensing content to our Media segment. While results of operations for our Studios segment are not impacted, results for our total Content & Experiences business may be impacted as the Studios segment licenses content to the Media segment, including for Peacock, rather than licensing the content to third parties. The Writers Guild and the SAG work stoppages from May to September 2023 and July to November 2023, respectively, resulted in reduced content licensing revenue at our Studios segment and reduced programming and production costs at both our Studios and Media segments in 2023.
We continue to invest significantly in existing and new theme park attractions, hotels and infrastructure, including Epic Universe in Orlando, which we expect will open in May 2025, as well as in new destinations and experiences, which we believe will have a positive impact on attendance and guest spending at our theme parks.
| | | | | | | | |
| 39 | Comcast 2024 Annual Report on Form 10-K |
| | |
| Media Segment Results of Operations |
| | | | | | | | | | | | | |
| Year ended December 31 (in millions) | 2024 | 2023 | | Change
2023 to 2024 | |
| Revenue | | | | | |
| Domestic advertising | $ | 10,008 | | $ | 8,600 | | | 16.4 | % | |
| Domestic distribution | 11,826 | | 10,663 | | | 10.9 | | |
| International networks | 4,282 | | 4,109 | | | 4.2 | |
| Other | 2,031 | | 1,983 | | | 2.4 | | |
| Total revenue | 28,148 | | 25,355 | | | 11.0 | | |
| Costs and Expenses | | | | | |
| Programming and production | 18,968 | | 16,921 | | | 12.1 | | |
| Marketing and promotion | 1,473 | | 1,389 | | | 6.1 | | |
| Other | 4,577 | | 4,091 | | | 11.9 | | |
| Total costs and expenses | 25,017 | | 22,400 | | | 11.7 | | |
| Adjusted EBITDA | $ | 3,130 | | $ | 2,955 | | | 5.9 | % | |
Media Segment – Revenue
Revenue increased in 2024 primarily due to the Paris Olympics in 2024. Excluding incremental revenue associated with this event, revenue increased in 2024 driven by increases in domestic distribution and international networks revenue.
| | | | | | | | | | | | | |
| Year ended December 31 (in millions) | 2024 | 2023 | | Change
2023 to 2024 | |
| Total revenue | $ | 28,148 | | $ | 25,355 | | | 11.0 | % | |
| Olympics | 1,906 | | — | | | NM | |
| Total revenue, excluding Olympics | $ | 26,242 | | $ | 25,355 | | | 3.5 | % | |
| Total domestic advertising revenue | $ | 10,008 | | $ | 8,600 | | | 16.4 | % | |
| Olympics | 1,432 | | — | | | NM | |
| Domestic advertising revenue, excluding Olympics | $ | 8,576 | | $ | 8,600 | | | (0.3) | % | |
| Total domestic distribution revenue | $ | 11,826 | | $ | 10,663 | | | 10.9 | % | |
| Olympics | 473 | | — | | | NM | |
| Domestic distribution revenue, excluding Olympics | $ | 11,353 | | $ | 10,663 | | | 6.5 | % | |
Percentage changes that are considered not meaningful are denoted with NM.Domestic advertising revenue primarily consists of revenue generated from sales of advertising on our linear television networks, Peacock and other digital properties operating predominantly in the United States.
Domestic advertising revenue increased in 2024 primarily due to the Paris Olympics in 2024. Excluding incremental revenue associated with this event, domestic advertising revenue remained consistent in 2024 primarily due to a decrease in revenue at our linear television networks, offset by an increase in revenue at Peacock.
Domestic distribution revenue primarily consists of revenue generated from the distribution of our television networks operating predominantly in the United States to traditional and virtual multichannel video providers, and from NBC-affiliated and Telemundo-affiliated local broadcast television stations. Our revenue from distribution agreements is generally based on the number of subscribers receiving the programming on our television networks and a per subscriber fee. Distribution revenue also includes Peacock subscription fees.
Domestic distribution revenue increased in 2024, including the impact of the Paris Olympics in 2024. Excluding incremental revenue associated with this event, domestic distribution revenue increased in 2024 primarily due to an increase in Peacock paid subscribers, partially offset by a decrease in revenue at our linear television networks. The decrease at our networks was primarily due to a decline in the number of subscribers, partially offset by contractual rate increases.
| | | | | | | | |
| Comcast 2024 Annual Report on Form 10-K | 40 | |
International networks revenue primarily consists of revenue generated by our networks operating predominantly outside the United States, including the Sky Sports networks in the United Kingdom and Italy. This revenue primarily results from the distribution of our television networks to traditional and virtual multichannel video providers and other platforms, as well as sales of advertising. A significant portion of this revenue comes from the Residential Connectivity & Platforms segment.
International networks revenue increased in 2024 primarily due to an increase in revenue associated with the distribution of sports networks and the positive impact of foreign currency.
Other revenue primarily consists of revenue generated from various digital properties and the licensing of our owned content and technology.
* * *
Media segment total revenue included $4.9 billion and $3.4 billion related to Peacock in 2024 and 2023, respectively, including amounts related to the Paris Olympics in 2024. We had 36 million and 31 million paid subscribers of Peacock as of 2024 and 2023, respectively. Peacock paid subscribers represent customers from which we recognize distribution revenue, including both customers that pay us directly and customers receiving the service through arrangements with companies who sell Peacock on our behalf. In these arrangements, paid subscribers are counted based on the terms of the arrangement when the related revenue is recognized. As a result, certain customers are counted when they activate their account, while other customers are counted when the Peacock service is made available to them as part of their bundled service offering regardless of whether it is activated.
Media Segment – Costs and Expenses
Programming and production costs primarily consists of the amortization of owned and licensed content, including sports rights, direct production costs, production overhead, on-air talent costs and costs associated with the distribution of our television networks to multichannel video providers.
Programming and production costs increased in 2024 primarily due to costs associated with the Paris Olympics, an increase in other sports programming costs for our domestic television networks, the impact of foreign currency, an increase in entertainment content costs for our television networks, including the impact of the Writers Guild and SAG work stoppages in the prior year, and higher programming costs at Peacock.
Marketing and promotion expenses primarily consists of the costs associated with promoting our television networks, Peacock and other digital properties.
Marketing and promotion expenses increased in 2024 primarily due to increased costs associated with the Paris Olympics, partially offset by lower costs related to marketing for entertainment programming.
Other expenses primarily consists of salaries, employee benefits, rent and other overhead expenses.
Other expenses increased in 2024 primarily due to an increase in costs related to Peacock and higher severance charges in 2024.
* * *
Media segment total costs and expenses included $6.7 billion and $6.1 billion related to Peacock in 2024 and 2023, respectively, including amounts related to the Paris Olympics in 2024.
| | | | | | | | |
| 41 | Comcast 2024 Annual Report on Form 10-K |
| | |
| Studios Segment Results of Operations |
| | | | | | | | | | | | | |
| Year ended December 31 (in millions) | 2024 | 2023 | | Change
2023 to 2024 | |
| Revenue | | | | | |
| Content licensing | $ | 8,063 | | $ | 8,231 | | | (2.0) | % | |
| Theatrical | 1,693 | | 2,079 | | | (18.6) | | |
| Other | 1,335 | | 1,315 | | | 1.5 | | |
| | | | | |
| Total revenue | 11,092 | | 11,625 | | | (4.6) | | |
| Costs and Expenses | | | | | |
| Programming and production | 7,257 | | 7,958 | | | (8.8) | | |
| Marketing and promotion | 1,483 | | 1,579 | | | (6.1) | | |
| Other | 947 | | 818 | | | 15.7 | | |
| Total costs and expenses | 9,687 | | 10,356 | | | (6.5) | | |
| Adjusted EBITDA | $ | 1,404 | | $ | 1,269 | | | 10.7 | % | |
Studios Segment – Revenue
Content licensing revenue primarily relates to the licensing of our owned film and television content in the United States and internationally to television networks and DTC streaming service providers, as well as through video on demand services provided by multichannel video providers and other service providers.
Content licensing revenue decreased in 2024 primarily due to the timing of when content was made available by our film studios, partially offset by the timing of when content was made available by our television studios under licensing agreements, including the impact of the Writers Guild and SAG work stoppages in the prior year.
Theatrical revenue primarily relates to the worldwide distribution of our produced and acquired films for exhibition in movie theaters.
Theatrical revenue decreased in 2024 primarily due to higher revenue from releases in our 2023 slate, including The Super Mario Bros. Movie, Oppenheimer and Fast X, compared to revenue from releases in our 2024 slate, including Despicable Me 4, Wicked, and Kung Fu Panda 4.
Other revenue primarily consists of the sale of physical and digital home entertainment products, as well as the production and licensing of live stage plays and the distribution of content produced by third parties.
Studios Segment – Costs and Expenses
Programming and production costs primarily consists of the amortization of capitalized film and television production and acquisition costs; residuals and participations expenses; and distribution expenses.
Programming and production costs decreased in 2024 primarily due to lower costs associated with theatrical releases, partially offset by higher costs associated with content licensing sales, including the impact of the Writers Guild and SAG work stoppages in the prior year.
Marketing and promotion expenses primarily consists of expenses associated with advertising for our theatrical releases.
Marketing and promotion expenses decreased in 2024 primarily due to decreased spending on current year and upcoming theatrical film releases.
Other expenses include salaries, employee benefits, rent and other overhead expenses.
| | |
| Theme Parks Segment Results of Operations |
| | | | | | | | | | | | | |
| Year ended December 31 (in millions) | 2024 | 2023 | | Change
2023 to 2024 | |
| Revenue | $ | 8,617 | | $ | 8,947 | | | (3.7) | % | |
| Costs and expenses | 5,668 | | 5,602 | | | 1.2 | | |
| Adjusted EBITDA | $ | 2,949 | | $ | 3,345 | | | (11.8) | % | |
| | | | | | | | |
| Comcast 2024 Annual Report on Form 10-K | 42 | |
Theme parks segment revenue primarily relates to guest spending at our theme parks, including ticket sales and in-park spending, and to our consumer products business.
Theme park segment revenue decreased in 2024 primarily due to decreases at our domestic theme parks primarily driven by decreased park attendance, as well as the negative impact of foreign currency at our international theme parks.
Theme parks segment costs and expenses primarily consists of theme park operations, including repairs and maintenance and related administrative expenses; food, beverage and merchandise costs; labor costs; and sales and marketing costs.
Theme parks segment costs and expenses increased in 2024 primarily due to higher costs associated with park operations and preopening costs for Epic Universe, partially offset by the impact of foreign currency. We expect to incur additional preopening costs for Epic Universe ahead of the expected opening in May 2025.
| | |
| Content & Experiences Headquarters, Other and Eliminations |
Headquarters and Other Results of Operations
| | | | | | | | | | | | | |
| Year ended December 31 (in millions) | 2024 | 2023 | | Change
2023 to 2024 | |
| Revenue | $ | 50 | | $ | 64 | | | (21.7) | % | |
| Costs and expenses | 881 | | 1,010 | | | (12.8) | | |
| Adjusted EBITDA | $ | (831) | | $ | (946) | | | 12.2 | % | |
Headquarters and Other expenses primarily consists of overhead, personnel and other costs necessary to operate the Content & Experiences business. Expenses decreased in 2024 primarily due to higher severance charges in 2023.
Eliminations
| | | | | | | | | | | | | |
| Year ended December 31 (in millions) | 2024 | 2023 | | Change
2023 to 2024 | |
| Revenue | $ | (2,798) | | $ | (2,800) | | | (0.1) | % | |
| Costs and expenses | (2,880) | | (2,877) | | | 0.1 | | |
| Adjusted EBITDA | $ | 82 | | $ | 77 | | | 5.9 | % | |
Amounts represent eliminations of transactions between segments in our Content & Experiences business, the most significant being content licensing between the Studios and Media segments, which are affected by the timing of recognition of content licenses.
Eliminations increase or decrease to the extent that additional content is made available to our other segments within the Content & Experiences business. Refer to Note 2 for additional information on transactions between our segments.
| | |
| Corporate, Other and Eliminations |
| | |
| Corporate and Other Results of Operations |
| | | | | | | | | | | | | |
| Year ended December 31 (in millions) | 2024 | 2023 | | Change
2023 to 2024 | |
| Revenue | $ | 2,933 | | $ | 2,763 | | | 6.1 | % | |
| Costs and expenses | 4,308 | | 4,098 | | | 5.1 | | |
| | | | | |
| | | | | |
| Adjusted EBITDA | $ | (1,376) | | $ | (1,335) | | | (3.1) | % | |
Corporate and Other primarily consists of overhead and personnel costs; Sky-branded video services and television networks in Germany; Comcast Spectacor, which owns the Philadelphia Flyers and the Wells Fargo Center arena in Philadelphia, Pennsylvania; and Xumo, our consolidated streaming platform joint venture.
Corporate and Other revenue increased in 2024 reflecting higher revenue across each of our other businesses.
Corporate and Other costs and expenses increased in 2024 primarily due to increases related to corporate functions and increased marketing associated with the Paris Olympics, partially offset by lower costs related to Sky operations in Germany, including charges related to entertainment content and the impact of the timing of recognition of costs in the prior year as a result of the 2022 FIFA World Cup. We will have expanded German broadcast rights to Bundesliga beginning with the 2025/2026 season, which will result in an increase in programming and production costs.
| | | | | | | | |
| 43 | Comcast 2024 Annual Report on Form 10-K |
| | | | | | | | | | | | | |
| Year ended December 31 (in millions) | 2024 | 2023 | | Change
2023 to 2024 | |
| Revenue | $ | (5,585) | | $ | (5,583) | | | — | % | |
| Costs and expenses | (5,456) | | (5,611) | | | (2.8) | | |
| Adjusted EBITDA | $ | (128) | | $ | 28 | | | NM | |
Percentage changes that are considered not meaningful are denoted with NM.
Amounts represent eliminations of transactions between our Connectivity & Platforms, Content & Experiences and other businesses, the most significant being distribution of television network programming between the Media and Residential Connectivity & Platforms segments. Eliminations of transactions between segments within Content & Experiences are presented separately. Amounts are affected by the periodic broadcast of the Olympic Games, including the Paris Olympics in 2024. Refer to Note 2 for additional information on transactions between our segments.
| | |
| Non-GAAP Financial Measures |
Consolidated Adjusted EBITDA
Adjusted EBITDA is a non-GAAP financial measure and is the primary basis used to measure the operational strength and performance of our businesses as well as to assist in the evaluation of underlying trends in our businesses. This measure eliminates the significant level of noncash depreciation and amortization expense that results from the capital-intensive nature of certain of our businesses and from intangible assets recognized in business combinations. It is also unaffected by our capital and tax structures, and by our investment activities, including the results of entities that we do not consolidate, as our management excludes these results when evaluating our operating performance. Our management and Board of Directors use this financial measure to evaluate our consolidated operating performance and the operating performance of our operating segments and to allocate resources and capital to our operating segments. It is also a significant performance measure in our annual incentive compensation programs. Additionally, we believe that Adjusted EBITDA is useful to investors because it is one of the bases for comparing our operating performance with that of other companies in our industries, although our measure of Adjusted EBITDA may not be directly comparable to similar measures used by other companies.
We define Adjusted EBITDA as net income attributable to Comcast Corporation before net income (loss) attributable to noncontrolling interests, income tax expense, investment and other income (loss), net, interest expense, depreciation and amortization expense, and other operating gains and losses (such as impairment charges related to fixed and intangible assets and gains or losses on the sale of long-lived assets), if any. From time to time, we may exclude from Adjusted EBITDA the impact of certain events, gains, losses or other charges (such as significant legal settlements) that affect the period-to-period comparability of our operating performance.
We reconcile consolidated Adjusted EBITDA to net income attributable to Comcast Corporation. This measure should not be considered a substitute for operating income (loss), net income (loss), net income (loss) attributable to Comcast Corporation, or net cash provided by operating activities that we have reported in accordance with GAAP.
| | | | | | | | | |
| Reconciliation from Net Income Attributable to Comcast Corporation to Adjusted EBITDA |
| Year ended December 31 (in millions) | 2024 | 2023 | |
| Net income attributable to Comcast Corporation | $ | 16,192 | | $ | 15,388 | | |
| Net income (loss) attributable to noncontrolling interests | (315) | | (282) | | |
| Income tax expense | 2,796 | | 5,371 | | |
| Interest expense | 4,134 | | 4,087 | | |
| Investment and other (income) loss, net | 490 | | (1,252) | | |
| Depreciation | 8,729 | | 8,854 | | |
| Amortization | 6,072 | | 5,482 | | |
| | | |
| | | |
Adjustments(a) | (30) | | (16) | | |
| | | |
| Adjusted EBITDA | $ | 38,069 | | $ | 37,633 | | |
(a)Amounts represent the impact of certain events, gains, losses or other charges that are excluded from Adjusted EBITDA, including costs associated with the Spin-off and costs related to our investment portfolio.
| | | | | | | | |
| Comcast 2024 Annual Report on Form 10-K | 44 | |
Constant Currency
Constant currency and constant currency growth rates are non-GAAP financial measures that present our results of operations excluding the estimated effects of foreign currency exchange rate fluctuations. Certain of our businesses, including Connectivity & Platforms, have operations outside the United States that are conducted in local currencies. As a result, the comparability of the financial results reported in U.S. dollars is affected by changes in foreign currency exchange rates. In our Connectivity & Platforms business, we use constant currency and constant currency growth rates to evaluate the underlying performance of the businesses, and we believe they are helpful for investors because such measures present operating results on a comparable basis year over year to allow the evaluation of their underlying performance.
Constant currency and constant currency growth rates are calculated by comparing the results for each comparable prior year period adjusted to reflect the average exchange rates from each current year period presented rather than the actual exchange rates that were in effect during the respective periods.
Reconciliation of Connectivity & Platforms Constant Currency
| | | | | | | | | | | | | | |
| 2023 | |
| Year ended December 31 (in millions) | As Reported | Effects of Foreign Currency | Constant Currency Amounts | | | |
| Revenue | | | | | | |
| Residential Connectivity & Platforms | $ | 71,946 | $ | 355 | $ | 72,301 | | | |
| Business Services Connectivity | 9,255 | 1 | 9,256 | | | |
| Total Connectivity & Platforms revenue | $ | 81,201 | $ | 356 | $ | 81,557 | | | |
| Adjusted EBITDA | | | | | | |
| Residential Connectivity & Platforms | $ | 26,948 | $ | 60 | $ | 27,008 | | | |
| Business Services Connectivity | 5,291 | (1) | 5,291 | | | |
| Total Connectivity & Platforms Adjusted EBITDA | $ | 32,239 | $ | 60 | $ | 32,299 | | | |
| Adjusted EBITDA Margin | | | | | | |
| Residential Connectivity & Platforms | 37.5 | % | (10) bps | 37.4 | % | | | |
| Business Services Connectivity | 57.2 | | — bps | 57.2 | | | | |
| Total Connectivity & Platforms Adjusted EBITDA margin | 39.7 | % | (10) bps | 39.6 | % | | | |
| | | | | | |
| | | | | | |
| | | | | | |
| | | | | | |
| | | | | | |
| | | | | | |
| | | | | | |
| | | | | | |
| | | | | | |
| | | | | | |
| | | | | | |
| | | | | | |
| | | | | | |
| | | | | | |
| | | | | | |
| | | | | | |
| | | | | | |
| | | | | | |
| | | | | | | | | | | | | | |
| 2023 | |
| As Reported | Effects of Foreign Currency | Constant Currency Amounts | | | |
| Average monthly total Connectivity & Platforms revenue per customer relationship | $ | 129.43 | | $ | 0.57 | | $ | 130.00 | | | | |
| Average monthly total Connectivity & Platforms Adjusted EBITDA per customer relationship | $ | 51.39 | | $ | 0.09 | | $ | 51.48 | | | | |
| | | | | | | | | | | | | | |
| | 2023 | |
| (in millions) | As Reported | Effects of Foreign Currency | Constant Currency Amounts | | | |
| Costs and Expenses | | | | | | |
| Programming | $ | 18,067 | | $ | 100 | | $ | 18,167 | | | | |
| Technical and support | 7,416 | | 27 | | 7,443 | | | | |
| Direct product costs | 6,146 | | 84 | | 6,230 | | | | |
| Marketing and promotion | 4,720 | | 22 | | 4,741 | | | | |
| Customer service | 2,783 | | 11 | | 2,795 | | | | |
| Other | 9,830 | | 53 | | 9,883 | | | | |
| Total Connectivity & Platforms costs and expenses | $ | 48,962 | | $ | 297 | | $ | 49,259 | | | | |
| | | | | | | | |
| 45 | Comcast 2024 Annual Report on Form 10-K |
Reconciliation of Residential Connectivity & Platforms Constant Currency
| | | | | | | | | | | | | | | | | | | | | | | | | | | | | |
| | | 2023 | | |
| (in millions) | | | | | | | As Reported | | Effects of Foreign Currency | | Constant Currency Amounts | | | | | | |
| Revenue | | | | | | | | | | | | | | | | | |
| Domestic broadband | | | | | | | $ | 25,489 | | | $ | — | | | $ | 25,489 | | | | | | | |
| Domestic wireless | | | | | | | 3,664 | | | — | | | 3,664 | | | | | | | |
| International connectivity | | | | | | | 4,207 | | | 112 | | | 4,319 | | | | | | | |
| Total residential connectivity | | | | | | | 33,359 | | | 112 | | | 33,472 | | | | | | | |
| Video | | | | | | | 28,797 | | | 169 | | | 28,966 | | | | | | | |
| Advertising | | | | | | | 3,969 | | | 35 | | | 4,004 | | | | | | | |
| Other | | | | | | | 5,820 | | | 39 | | | 5,859 | | | | | | | |
| Total revenue | | | | | | | 71,946 | | | 355 | | | 72,301 | | | | | | | |
| Costs and Expenses | | | | | | | | | | | | | | | | | |
| Programming | | | | | | | 18,067 | | | 100 | | | 18,167 | | | | | | | |
| Other | | | | | | | 26,932 | | | 195 | | | 27,126 | | | | | | | |
| Total costs and expenses | | | | | | | 44,998 | | | 295 | | | 45,293 | | | | | | | |
| Adjusted EBITDA | | | | | | | $ | 26,948 | | | $ | 60 | | | $ | 27,008 | | | | | | | |
Other Adjustments
From time to time, we present adjusted information, such as revenue, to exclude the impact of certain events, gains, losses or other charges. This adjusted information is a non-GAAP financial measure. We believe, among other things, that the adjusted information may help investors evaluate our ongoing operations and can assist in making meaningful period-over-period comparisons.
| | |
| Liquidity and Capital Resources |
| | | | | | | | | | | |
| Year ended December 31 (in billions) | 2024 | 2023 | | | |
| Cash provided by operating activities | $ | 27.7 | | $ | 28.5 | | | | |
| Cash used in investing activities | $ | (15.7) | | $ | (7.2) | | | | |
| Cash used in financing activities | $ | (10.9) | | $ | (19.9) | | | | |
| | | | | | | | |
| December 31 (in billions) | 2024 | 2023 |
| Cash and cash equivalents | $ | 7.3 | | $ | 6.2 | |
| Debt | $ | 99.1 | | $ | 97.1 | |
Our businesses generate significant cash flows from operating activities. We believe that we will be able to continue to meet our current and long-term liquidity and capital requirements, including fixed charges, through our cash flows from operating activities; existing cash, cash equivalents and investments; available borrowings under our existing credit facility; and our ability to obtain future external financing. Refer to the “Contractual Obligations” discussion below for additional information regarding our cash requirements. We anticipate that we will continue to use a substantial portion of our cash flows from operating activities in repaying our debt obligations, funding our capital expenditures and cash paid for intangible assets, investing in business opportunities, and returning capital to shareholders.
We entered into a new revolving credit facility in May 2024 (see Note 6). We maintain significant availability under our revolving credit facility and our commercial paper program to meet our short-term liquidity requirements. Our commercial paper program generally provides a lower-cost source of borrowing to fund our short-term working capital requirements. As of December 31, 2024, amounts available under our revolving credit facility, net of amounts outstanding under our commercial paper program and outstanding letters of credit and bank guarantees, totaled $11.8 billion.
| | | | | | | | |
| Comcast 2024 Annual Report on Form 10-K | 46 | |
We are subject to customary covenants and restrictions set forth in agreements related to debt issued at Comcast and certain of our subsidiaries, including the indentures governing our public debt securities and the credit agreement governing the Comcast revolving credit facility. Our revolving credit facility contains a financial covenant pertaining to leverage, which is the ratio of debt to EBITDA, as defined in the agreement. Compliance with this financial covenant is tested on a quarterly basis. As of December 31, 2024, we met this financial covenant, and we expect to remain in compliance with this financial covenant and other covenants related to our debt.
Operating Activities
| | | | | | | | | |
| Components of Net Cash Provided by Operating Activities |
| Year ended December 31 (in millions) | 2024 | 2023 | |
| Operating income | $ | 23,297 | | $ | 23,314 | | |
| Depreciation and amortization | 14,802 | | 14,336 | | |
| | | |
| Noncash share-based compensation | 1,288 | | 1,241 | | |
| Changes in operating assets and liabilities | (1,559) | | (2,055) | | |
| Payments of interest | (3,657) | | (3,711) | | |
| Payments of income taxes | (7,096) | | (5,107) | | |
| Proceeds from investments and other | 597 | | 483 | | |
| Net cash provided by operating activities | $ | 27,673 | | $ | 28,501 | | |
The variance in changes in operating assets and liabilities in 2024 was primarily related to the timing of amortization and related payments for our film and television costs, including the timing of sports, which was partially offset by reduced spending in the prior year due to the work stoppages.
The decrease in payments of interest in 2024 was primarily due to the payments of interest in the prior year associated with our collateralized obligation which was repaid in the fourth quarter of 2023, partially offset by increased debt balances following debt issuances in the current year and higher weighted-average interest rates.
Payments of income taxes increased in 2024 and included higher payments in the current year related to the 2023 tax year, primarily driven by the taxable gain recognized on our investment in Hulu. Payments of income taxes in 2024 were favorably impacted by the timing of transferable tax credit purchases, as payments for certain tax credits used in 2024 will be made in 2025. Additionally, we expect to receive a federal income tax refund in 2025 as a result of carrying back a capital loss created primarily as part of a 2024 internal corporate reorganization to offset capital gains recognized in our federal income tax returns for 2021 through 2023 (see Note 5).
Investing Activities
Net cash used in investing activities increased in 2024 primarily due to net proceeds received as an advance on the sale of our interest in Hulu in the prior year (see Note 7), partially offset by decreased cash paid for intangible assets related to software development in the current year and decreased purchases of investments.
We expect to receive additional proceeds for the sale of our interest in Hulu following the finalization of the third-party appraisal process, at which time we will recognize the sale of our interest. See Note 7.
In September 2023, we entered into an agreement with T-Mobile to sell certain of our spectrum licenses. The agreement provides us with a right to remove certain licenses from the transaction, which will result in total cash consideration between $1.2 billion and $3.3 billion. The sale is expected to close in 2028 subject to various conditions and approvals.
Capital Expenditures
Capital expenditures remained consistent in 2024 compared to 2023. Spending on theme park attractions increased in 2024, and included costs associated with the construction of Epic Universe. 2023 expenditures included the acquisition of land for potential theme park expansion opportunities. The costs associated with the construction of Universal Beijing Resort are presented separately in our consolidated statements of cash flows. See Note 7.
Our most significant capital expenditures are within the Connectivity & Platforms business, and we expect that this will continue in the future. Connectivity & Platforms’ capital expenditures remained consistent in 2024 compared to 2023 primarily due to increased spending on line extensions and support capital, offset by decreased spending on customer premise equipment and scalable infrastructure. The table below summarizes the capital expenditures we incurred in our segments in the Connectivity & Platforms business in 2024 and 2023.
| | | | | | | | |
| 47 | Comcast 2024 Annual Report on Form 10-K |
| | | | | | | | | |
| Year ended December 31 (in millions) | 2024 | 2023 | |
| Customer premise equipment | $ | 2,013 | | $ | 2,234 | | |
| Scalable infrastructure | 3,024 | | 3,161 | | |
| Line extensions | 2,691 | | 2,333 | | |
| Support capital | 557 | | 514 | | |
| Total | $ | 8,286 | | $ | 8,241 | | |
We expect our capital expenditures in 2025 will continue to be focused on investments in the Connectivity & Platforms business in scalable infrastructure as we increase capacity and continue to execute our plans to upgrade our network to deliver multigigabit symmetrical speeds, in line extensions for the expansion of homes and businesses passed, and in the continued deployment of wireless gateways. In addition, we expect to continue investment in existing and new attractions at our Universal theme parks, including Epic Universe. Capital expenditures for subsequent years will depend on numerous factors, including competition, changes in technology, regulatory changes, the timing and rate of deployment of new services, the capacity required for existing services, the timing of new attractions at our theme parks and potential acquisitions.
Financing Activities
Net cash used in financing activities decreased in 2024 primarily due to repayment of a collateralized obligation in the prior year (see Note 7), a decrease in repurchases of common stock under our share repurchase program and employee plans, lower repurchases and repayments of debt in the current year, repayments of short-term borrowings, net in the prior year and higher proceeds from borrowings in the current year.
In September 2024, we issued €1.8 billion aggregate principal amount of fixed-rate euro senior notes maturing in 2032 and 2036 and entered into a corresponding cross-currency swap, effectively converting the debt to an aggregate U.S. dollar principal amount of $2.0 billion with a weighted-average interest rate of 4.72%. We also issued £750 million ($1.0 billion using exchange rates on the date of issuance) principal amount of fixed rate sterling senior notes maturing in 2040 with an interest rate of 5.25%. The net proceeds from this issuance were intended for working capital and general corporate purposes, including the early redemption of $725 million of our outstanding 5.25% Notes due 2025, which was completed in October 2024, and the repayment of certain of our other outstanding debt with near-term maturities. In May 2024, we issued $3.3 billion aggregate principal amount of fixed-rate senior notes, which have maturities ranging between 2029 and 2054 and a weighted-average interest rate of 5.38%. The net proceeds from this issuance were used for the repayment of our outstanding commercial paper, and for working capital and general corporate purposes.
In 2024, we made debt repayments of $3.6 billion, including $1.9 billion principal amount of notes due at maturity and $750 million of 5.250% Notes due 2025, $391 million of 3.950% Notes due 2025, $256 million of 3.375% Notes due 2025, and $104 million of 3.150% Notes due 2026.
We have made, and may from time to time in the future make, optional repayments on our debt obligations, which may include repurchases or exchanges of our outstanding public notes and debentures, depending on various factors, such as market conditions. Any such repurchases may be effected through privately negotiated transactions, market transactions, tender offers, redemptions or otherwise. In particular, we may repurchase varying amounts of our outstanding public notes and debentures with short to medium term maturities through privately negotiated or market transactions. See Notes 6 and 7 for additional information on our financing activities.
Share Repurchases and Dividends
In the second quarter of 2021, we restarted our share repurchase program, which had been paused since the beginning of 2019. In January 2024, our Board of Directors terminated our existing program and approved a new share repurchase program authorization of $15 billion effective as of January 26, 2024, which had no expiration date. In 2024, we repurchased a total of 212 million shares of our Class A common stock for $8.6 billion under our authorization programs. We did not purchase any shares outside of these programs. As of December 31, 2024, we had $7.0 billion remaining under the authorization, and in January 2025, our Board of Directors terminated the existing program and approved a new share repurchase program authorization of $15 billion, which has no expiration date. We expect to repurchase additional shares of our Class A common stock under this new authorization in the open market or in private transactions, subject to market and other conditions.
In 2024, our Board of Directors declared quarterly dividends of $0.31 per share, including our fourth quarter dividend payable in January 2025 and we made dividend payments of $4.8 billion. In January 2025, our Board of Directors approved a 6.5% increase in our dividend to $1.32 per share on an annualized basis and approved our first quarter dividend of $0.33 per share, to be paid in April 2025. We expect to continue to pay quarterly dividends, although each dividend is subject to approval by our Board of Directors.
| | | | | | | | |
| Comcast 2024 Annual Report on Form 10-K | 48 | |
The chart below summarizes share repurchases and dividend payments. In addition, we paid $463 million and $291 million in 2024 and 2023, respectively, related to employee taxes associated with the administration of our share-based compensation plans and excise taxes related to share repurchases. Our share repurchases have more than offset dilution that resulted from issuing our Class A common stock in connection with our share-based compensation plans in those years, thereby having the effect of reducing the total number of our Class A common stock outstanding.
| | |
| Share Repurchases Under Share Repurchase Program Authorization and Dividends Paid and Weighted-Average Number of Common Shares Outstanding - Diluted |
| ($ in billions and shares in millions) |
Contractual Obligations
The following table summarizes our most significant contractual obligations as of December 31, 2024:
| | | | | | | | | | | |
| As of December 31, 2024 (in billions) | Total | Within the next 12 months | Beyond the next 12 months |
Debt obligations(a) | $ | 105.1 | | $ | 4.9 | | $ | 100.2 | |
| Programming and production obligations | 96.2 | | 17.2 | | 79.0 | |
(a) Amounts represent the face value of debt and exclude interest payments.Our largest contractual obligations relate to our outstanding debt. As of December 31, 2024, our debt had a weighted-average time to maturity of approximately 16 years. Including the effects of our derivative financial instruments, as of December 31, 2024, our debt had a weighted-average interest rate based on the stated coupons of 3.7% and the percentage of our debt obligations that were fixed-rate debt was 98%. We typically fund and expect to continue to be able to fund debt maturities and interest payments with cash flows generated in our operations; existing cash, cash equivalents and investments; or proceeds from additional external financing. See Note 6 and Item 7A for additional information on our debt.
We also have significant contractual obligations associated with our programming and production expenses. We have multiyear agreements for television and/or streaming rights of sporting events, such as for the NBA, the NFL, the Olympics and the English Premier League, which represent the substantial majority of our programming and production obligations. Connectivity & Platforms’ programming expenses related to the distribution of third-party television networks are generally acquired under multiyear distribution agreements with fees based on the number of subscribers receiving the television network programming and a per subscriber fee. The amounts included in the table above relate to minimum guaranteed commitments for these distribution agreements or fixed fees, and as a result, we expect the total fees to be paid under these arrangements to be significantly higher than the amounts included above. We have funded and expect to continue to be able to fund our programming and production obligations with the cash generated from our operations. As of December 31, 2024, approximately 37% of cash payments related to our programming and production obligations are due after five years, of which the vast majority related to multiyear sports rights agreements. See Note 4 for additional information on programming and production costs.
Our other contractual obligations relate primarily to operating leases (see Note 14) and other arrangements recorded in our consolidated balance sheets and/or disclosed in the notes to our financial statements, including benefit plan obligations (see Note 10), liabilities for uncertain tax positions (see Note 5), our remaining unfunded capital commitment to Atairos (see Note 7) and a contractual obligation related to an interest held by a third party in the revenue of certain theme parks (see Note 14).
| | | | | | | | |
| 49 | Comcast 2024 Annual Report on Form 10-K |
Guarantee Structure
Our debt is primarily issued at Comcast, although we also have debt at certain of our subsidiaries as a result of acquisitions and other issuances. A substantial amount of this debt is subject to guarantees by Comcast and by certain subsidiaries that we have put in place to simplify our capital structure. We believe this guarantee structure provides liquidity benefits to debt investors and helps to simplify credit analysis with respect to relative value considerations of guaranteed subsidiary debt.
| | | | | | | | |
| Debt and Guarantee Structure | | |
| December 31 (in billions) | 2024 | 2023 |
| Debt Subject to Cross-Guarantees | | |
| Comcast | $ | 94.6 | | $ | 91.9 | |
NBCUniversal(a) | 1.6 | | 1.6 | |
Comcast Cable(a) | 0.9 | | 0.9 | |
| 97.1 | | 94.4 | |
| Debt Subject to One-Way Guarantees | | |
| Sky | 3.0 | | 3.6 | |
Other(a) | 0.1 | | 0.1 | |
| 3.1 | | 3.8 | |
| Debt Not Guaranteed | | |
Universal Beijing Resort(b) | 3.4 | | 3.5 | |
| Other | 1.4 | | 1.5 | |
| 4.8 | | 5.0 | |
| Debt issuance costs, premiums, discounts, fair value adjustments for acquisition accounting and hedged positions, net | (6.0) | | (6.1) | |
| Total debt | $ | 99.1 | | $ | 97.1 | |
| | |
|
(a)NBCUniversal Media, LLC (“NBCUniversal”), Comcast Cable Communications, LLC (“Comcast Cable”) and Comcast Holdings Corporation (“Comcast Holdings”), which is included within other debt subject to one-way guarantees, are each consolidated subsidiaries subject to the periodic reporting requirements of the SEC. The guarantee structures and related disclosures in this section, together with Exhibit 22, satisfy these reporting obligations.
(b)Universal Beijing Resort debt financing is secured by the assets of Universal Beijing Resort and the equity interests of the investors. See Note 7 for additional information.
Cross-Guarantees
Comcast, NBCUniversal and Comcast Cable (the “Guarantors”) fully and unconditionally, jointly and severally, guarantee each other’s debt securities. NBCUniversal and Comcast Cable also guarantee other borrowings of Comcast, including its revolving credit facility. These guarantees rank equally with all other general unsecured and unsubordinated obligations of the respective Guarantors. However, the obligations of the Guarantors under the guarantees are structurally subordinated to the indebtedness and other liabilities of their respective non-guarantor subsidiaries. The obligations of each Guarantor are limited to the maximum amount that would not render such Guarantor’s obligations subject to avoidance under applicable fraudulent conveyance provisions of U.S. and non-U.S. law. Each Guarantor’s obligations will remain in effect until all amounts payable with respect to the guaranteed securities have been paid in full. However, a guarantee by NBCUniversal or Comcast Cable of Comcast’s debt securities, or by NBCUniversal of Comcast Cable’s debt securities, will terminate upon a disposition of such Guarantor entity or all or substantially all of its assets.
The Guarantors are each holding companies that principally hold investments in, borrow from and lend to non-guarantor subsidiary operating companies; issue and service third-party debt obligations; repurchase shares and pay dividends; and engage in certain corporate and headquarters activities. The Guarantors are generally dependent on non-guarantor subsidiary operating companies to fund these activities.
As of December 31, 2024 and 2023, the combined Guarantors have noncurrent notes payable to non-guarantor subsidiaries of $88 billion and $136 billion, respectively, and noncurrent notes receivable from non-guarantor subsidiaries of $14 billion and $18 billion, respectively. This financial information is that of the Guarantors presented on a combined basis with intercompany balances between the Guarantors eliminated. The combined financial information excludes financial information of non-guarantor subsidiaries. The underlying net assets of the non-guarantor subsidiaries are significantly in excess of the Guarantor obligations. Excluding investments in non-guarantor subsidiaries, external debt and the noncurrent notes payable and receivable with non-guarantor subsidiaries, the Guarantors do not have material assets, liabilities or results of operations.
| | | | | | | | |
| Comcast 2024 Annual Report on Form 10-K | 50 | |
One-Way Guarantees
Comcast provides full and unconditional guarantees of certain debt issued by Sky Limited (“Sky”), including all of its senior notes, and other consolidated subsidiaries not subject to the periodic reporting requirements of the SEC.
Comcast also provides a full and unconditional guarantee of $138 million principal amount of subordinated debt issued by Comcast Holdings. Comcast’s obligations under this guarantee are subordinated and subject, in right of payment, to the prior payment in full of all of Comcast’s senior indebtedness, including debt guaranteed by Comcast on a senior basis, and are structurally subordinated to the indebtedness and other liabilities of its non-guarantor subsidiaries (for purposes of this Comcast Holdings discussion, Comcast Cable and NBCUniversal are included within the non-guarantor subsidiary group). Comcast’s obligations as guarantor will remain in effect until all amounts payable with respect to the guaranteed debt have been paid in full. However, the guarantee will terminate upon a disposition of Comcast Holdings or all or substantially all of its assets. Comcast Holdings is a consolidated subsidiary holding company that directly or indirectly holds 100% and approximately 37% of our equity interests in Comcast Cable and NBCUniversal, respectively.
As of December 31, 2024 and 2023, Comcast and Comcast Holdings, the combined issuer and guarantor of the guaranteed subordinated debt, have noncurrent senior notes payable to non-guarantor subsidiaries of $53 billion and $104 billion, respectively, and noncurrent notes receivable from non-guarantor subsidiaries of $10 billion and $14 billion, respectively. This financial information is that of Comcast and Comcast Holdings presented on a combined basis with intercompany balances between Comcast and Comcast Holdings eliminated. The combined financial information excludes financial information of non-guarantor subsidiaries of Comcast and Comcast Holdings. The underlying net assets of the non-guarantor subsidiaries of Comcast and Comcast Holdings are significantly in excess of the obligations of Comcast and Comcast Holdings. Excluding investments in non-guarantor subsidiaries, external debt, and the noncurrent notes payable and receivable with non-guarantor subsidiaries, Comcast and Comcast Holdings do not have material assets, liabilities or results of operations.
| | |
| Critical Accounting Estimates |
The preparation of our consolidated financial statements requires us to make estimates that affect the reported amounts of assets, liabilities, revenue and expenses, and the related disclosure of contingent assets and contingent liabilities. We base our judgments on our historical experience and on various other assumptions that we believe are reasonable under the circumstances, the results of which form the basis for making estimates about the carrying value of assets and liabilities that are not readily apparent from other sources. Actual results may differ from these estimates under different assumptions or conditions.
We believe our estimates associated with the valuation and impairment testing of goodwill and cable franchise rights and the accounting for film and television costs are critical in the preparation of our consolidated financial statements. Management has discussed the development and selection of these critical accounting estimates with the Audit Committee of our Board of Directors, and the Audit Committee has reviewed the related disclosures below. See also Notes 4 and 9.
Valuation and Impairment Testing of Goodwill and Cable Franchise Rights
We assess the recoverability of our goodwill and indefinite-lived intangible assets, including cable franchise rights, annually as of July 1, or more frequently whenever events or substantive changes in circumstances indicate that the assets might be impaired. The assessment of recoverability may first consider qualitative factors to determine whether the existence of events or circumstances leads to a determination that it is more likely than not that the fair value of a reporting unit or an indefinite-lived intangible asset is less than its carrying amount. A quantitative assessment is performed if the qualitative assessment results in a more-likely-than-not determination or if a qualitative assessment is not performed. In connection with our impairment assessment process, from time to time, we perform quantitative assessments of our reporting units and cable franchise rights in order to support our qualitative assessments.
Goodwill
Goodwill results from business combinations and represents the excess amount of the consideration paid over the identifiable assets and liabilities recorded in the acquisition. We test goodwill for impairment at the reporting unit level.
When performing a quantitative assessment, we estimate the fair values of our reporting units primarily based on a discounted cash flow analysis that involves significant judgment, including market participant estimates of future cash flows expected to be generated by the business and the selection of discount rates. When performing this analysis, we also consider multiples of earnings from comparable public companies and recent market transactions.
| | | | | | | | |
| 51 | Comcast 2024 Annual Report on Form 10-K |
We performed qualitative assessments in 2024 for goodwill in our Residential Connectivity & Platforms, Business Services Connectivity, Studios and Theme Parks segments in connection with our annual impairment testing. These analyses considered the results of previous quantitative assessments, and also considered various factors that would affect the estimated fair value of these reporting units in our qualitative assessments, including changes in projected future cash flows, recent market transactions and overall macroeconomic conditions, discount rates, and changes in our market capitalization. Based on these assessments, we concluded that it was more likely than not that the estimated fair values of our reporting units were substantially higher than their carrying values and that the performance of a quantitative impairment test was not required. We performed a quantitative assessment in 2024 for goodwill in our Media segment. Based on this assessment, the estimated fair value of the Media reporting unit substantially exceeded its carrying value and no impairment was required.
Changes in market conditions, laws and regulations, and key assumptions made in future quantitative assessments, such as expected cash flows, competitive factors, discount rates, and value indications from market transactions, including the proposed Spin-off of businesses within our Media segment, could negatively impact the results of future impairment testing and could result in the recognition of an impairment charge.
Cable Franchise Rights
Our cable franchise rights assets result from agreements we have with state and local governments that allow us to construct and operate a cable business within a specified geographic area. The value of a franchise is derived from the economic benefits we receive from the right to solicit new customers and to market additional services in a particular service area. The amounts we record for cable franchise rights are primarily a result of cable system acquisitions. Typically when we acquire a cable system, the most significant asset we record is the value of the cable franchise rights.
When performing a quantitative assessment, we estimate the fair values of our cable franchise rights primarily based on a discounted cash flow analysis that involves significant judgment, including the estimate of future cash flows and the selection of discount rates.
In 2024, we performed a qualitative assessment of our cable franchise rights. At the time of our previous quantitative assessment in 2022, which was pursuant to our practice of performing quantitative assessments of cable franchise rights approximately once every four years, the estimated fair values of our franchise rights substantially exceeded their carrying values. We also considered various factors that would affect the estimated fair values of our cable franchise rights in our qualitative assessment, including changes in our projected future cash flows, recent market transactions and overall macroeconomic conditions, discount rates, and changes in our market capitalization. Based on this assessment, we concluded that it was more likely than not that the estimated fair values of our cable franchise rights were substantially higher than the carrying values and that the performance of a quantitative impairment test was not required.
Changes in market conditions, laws and regulations, and key assumptions made in future quantitative assessments, such as expected cash flows, competitive factors, discount rates, and value indications from market transactions, could negatively impact the results of future impairment testing and could result in the recognition of an impairment charge.
Film and Television Content
We capitalize costs for owned film and television content, including direct costs, production overhead, print costs, development costs and interest, as well as acquired libraries. We have determined that the predominant monetization strategy for the substantial majority of our content is on an individual basis. Amortization for owned content predominantly monetized on an individual basis and accrued costs associated with participations and residuals payments are recorded using the individual film forecast computation method, which recognizes the costs in the same ratio as the associated ultimate revenue.
Our estimates of ultimate revenue for films generally include revenue from all sources that are expected to be earned within 10 years from the date of a film’s initial release. These estimates are based on the distribution strategy and historical performance of similar content, as well as factors unique to the content itself. The most sensitive factor affecting our estimate of ultimate revenue for a film intended for theatrical release is the film’s theatrical performance, as subsequent revenue from the licensing and sale of a film has historically exhibited a high correlation to its theatrical performance. Upon a film’s release, our estimates of revenue from succeeding markets, including from content licensing across multiple platforms and home entertainment sales, are revised based on historical relationships and an analysis of current market trends.
| | | | | | | | |
| Comcast 2024 Annual Report on Form 10-K | 52 | |
With respect to television series or other owned television programming, the most sensitive factor affecting our estimate of ultimate revenue is whether the series can be successfully licensed beyond its initial license window. Initial estimates of ultimate revenue are limited to the amount of revenue attributed to the initial license window. Once it is determined that a television series or other owned television programming can be licensed beyond the initial license window, revenue estimates for these additional windows or platforms, such as U.S. and international syndication, home entertainment, and other distribution platforms, are included in ultimate revenue. Revenue estimates for produced episodes include revenue expected to be earned within 10 years of delivery of the initial episode or, if still in production, 5 years from the delivery of the most recent episode, if later.
We capitalize the costs of licensed content when the license period begins, the content is made available for use and the costs of the licenses are known. Licensed content is amortized as the associated programs are used, incorporating estimated viewing patterns.
Capitalized film and television costs are subject to impairment testing when certain triggering events are identified. The substantial majority of our owned content is evaluated for impairment on an individual title basis. Licensed content that is not part of a film group is tested for impairment primarily on a channel, network or platform basis, with the exception of our broadcast networks and owned local broadcast television stations, which are tested on a daypart basis. Sports rights are accounted for as executory contracts and are not subject to impairment. When performing an impairment assessment, we estimate fair value primarily based on a discounted cash flow analysis that involves significant judgment, including market participant estimates of future cash flows, which are supported by internal forecasts. Impairments of capitalized film and television costs were not material in any of the periods presented.
We recognize the costs of multiyear, live-event sports rights as the rights are utilized over the contract term based on estimated relative value. Estimated relative value is generally based on terms of the contract and the nature of and potential revenue generation of the deliverables within the contract.
| | | | | | | | |
| 53 | Comcast 2024 Annual Report on Form 10-K |
Item 7A: Quantitative and Qualitative Disclosures About Market Risk
| | |
| Interest Rate Risk Management |
We maintain a mix of fixed-rate and variable-rate debt and we are exposed to the market risk of adverse changes in interest rates. In order to manage the cost and volatility relating to the interest cost of our outstanding debt, we enter into various interest rate risk management derivative transactions in accordance with our policy.
We monitor our exposure to the risk of adverse changes in interest rates through the use of techniques that include market valuation and sensitivity analyses. We do not engage in any speculative or leveraged derivative transactions.
Our interest rate derivative financial instruments, which primarily include cross-currency swaps and interest rate swaps, represent an integral part of our interest rate risk management program.
The effect of our interest rate derivative financial instruments to our consolidated interest expense was an increase of $49 million in 2024, a decrease of $56 million in 2023 and a decrease of $66 million in 2022. Interest rate derivative financial instruments may have a significant effect on consolidated interest expense in the future.
The table below summarizes by contractual year of maturity the principal amount of our debt, notional amount of our interest rate instruments, effective rates, and fair values subject to interest rate risk maintained by us as of December 31, 2024. We had no variable rate debt outstanding as of December 31, 2024. We estimate interest rates on variable rate swaps using the relevant average implied forward rates through the year of maturity based on the yield curve in effect on December 31, 2024, plus the applicable borrowing margin.
| | | | | | | | | | | | | | | | | | | | | | | | | | |
| (in billions) | 2025 | 2026 | 2027 | 2028 | 2029 | Thereafter | Total | Estimated Fair Value as of December 31, 2024 |
| Debt | | | | | | | | |
| Fixed-rate debt | $ | 4.9 | | $ | 4.9 | | $ | 5.7 | | $ | 7.0 | | $ | 4.8 | | $ | 77.7 | | $ | 105.1 | | $ | 89.8 | |
Average interest rate(a) | 2.9 | % | 1.7 | % | 3.3 | % | 4.0 | % | 3.7 | % | 3.8 | % | 3.6 | % | |
| | | | | | | | |
| | | | | | | | |
| Fixed-to-Variable Interest Rate Swaps |
Notional amount(b) | $ | — | | $ | 1.3 | | $ | 0.3 | | $ | 1.0 | | $ | — | | $ | — | | $ | 2.5 | | $ | (0.2) | |
| Average pay rate | — | % | 6.5 | % | 6.3 | % | 6.8 | % | — | % | — | % | 6.6 | % | |
| Average receive rate | — | % | 3.3 | % | 3.6 | % | 4.2 | % | — | % | — | % | 3.7 | % | |
| | | | | | | | |
| | | | | | | |
| | | | | | | | |
| | | | | | | | |
| | | | | | | | |
(a)Includes the effects of our fixed-to-fixed cross-currency swaps, which are discussed further below under the heading “Foreign Exchange Risk Management.”
(b)Notional amounts are used to calculate the interest to be paid or received and do not represent our exposure to credit loss. The estimated fair value approximates the amount of payments to be made or proceeds to be received to settle the outstanding contracts, excluding accrued interest.
See Notes 1 and 6 for additional information.
| | | | | | | | |
| Comcast 2024 Annual Report on Form 10-K | 54 | |
| | |
| Foreign Exchange Risk Management |
We have significant operations in a number of countries outside the United States, and certain of our operations are conducted in foreign currencies. The value of these currencies, primarily including the British pound, euro, Japanese yen and Chinese yuan, fluctuates relative to the U.S. dollar. These changes could adversely affect the U.S. dollar equivalent value of our non-U.S. dollar operations, which could negatively affect our business, financial condition or results of operations in a given period or in specific territories.
As part of our overall strategy to manage the level of exposure to the risk of foreign exchange rate fluctuations, we enter into derivative financial instruments related to a significant portion of our foreign currency exposure for transactions denominated in currencies other than the functional currency of the transacting entity. We use cross-currency swaps as fair value and cash flow hedges for certain debt obligations denominated in a currency other than the functional currency of the issuer. Cross-currency swaps effectively convert foreign currency denominated debt to debt denominated in the functional currency, which hedge currency exchange risks associated with foreign currency denominated debt. We also enter into foreign currency forward contracts that change in value as currency exchange rates fluctuate to protect the functional currency equivalent value of non-functional currency denominated assets, liabilities, commitments, and forecasted non-functional currency revenue and expenses. In accordance with our policy, we hedge forecasted foreign currency transactions for periods generally not to exceed 30 months. Certain of these derivatives are designated as fair value hedges, including foreign currency forwards designated as fair value hedges on our foreign currency intercompany loans receivable.
We are also exposed to foreign exchange risk on the consolidation of our foreign operations. We have foreign currency denominated debt and cross-currency swaps designated as hedges of our net investments in certain of these subsidiaries.
See Note 6 for additional information.
We have analyzed our foreign currency exposure related to our foreign operations as of December 31, 2024, including our hedging contracts, to identify assets and liabilities denominated in a currency other than their functional currency. For those assets and liabilities, we then evaluated the effect of a hypothetical 10% shift in currency exchange rates, inclusive of the effects of derivatives. The results of our analysis indicate that such a shift in exchange rates would not have a material impact on our 2024 net income attributable to Comcast Corporation.
| | |
| Counterparty Credit Risk Management |
We manage the credit risks associated with our derivative financial instruments through diversification and the evaluation and monitoring of the creditworthiness of counterparties. Although we may be exposed to losses in the event of nonperformance by counterparties, we do not expect such losses, if any, to be significant. We have agreements with certain counterparties that include collateral provisions. These provisions require a party with an aggregate unrealized loss position in excess of certain thresholds to post cash collateral for the amount in excess of the threshold. The threshold levels in our collateral agreements are based on our and the counterparty’s credit ratings. As of December 31, 2024 and 2023, we were not required to post collateral under the terms of these agreements, nor did we hold any collateral under the terms of these agreements.
| | | | | | | | |
| 55 | Comcast 2024 Annual Report on Form 10-K |
Item 8: Comcast Corporation Financial Statements and Supplementary Data
| | | | | | | | |
| Comcast 2024 Annual Report on Form 10-K | 56 | |
Management’s Report on Financial Statements
Our management is responsible for the preparation, integrity and fair presentation of information in the consolidated financial statements, including estimates and judgments. The consolidated financial statements presented in this report have been prepared in accordance with accounting principles generally accepted in the United States. Our management believes the consolidated financial statements and other financial information included in this report fairly present, in all material respects, the financial condition, results of operations and cash flows as of and for the periods presented in this report. The consolidated financial statements have been audited by Deloitte & Touche LLP, an independent registered public accounting firm, as stated in their report, which is included herein.
Management’s Report on Internal Control Over Financial Reporting
Our management is responsible for establishing and maintaining an adequate system of internal control over financial reporting. Our system of internal control over financial reporting is designed to provide reasonable assurance regarding the reliability of financial reporting and the preparation of financial statements for external purposes in accordance with accounting principles generally accepted in the United States.
Our internal control over financial reporting includes those policies and procedures that:
•Pertain to the maintenance of records that, in reasonable detail, accurately and fairly reflect our transactions and dispositions of our assets.
•Provide reasonable assurance that our transactions are recorded as necessary to permit preparation of our financial statements in accordance with accounting principles generally accepted in the United States, and that our receipts and expenditures are being made only in accordance with authorizations of our management and our directors.
•Provide reasonable assurance regarding prevention or timely detection of unauthorized acquisition, use or disposition of our assets that could have a material effect on the financial statements.
Because of its inherent limitations, a system of internal control over financial reporting can provide only reasonable assurance and may not prevent or detect misstatements. Further, because of changes in conditions, effectiveness of internal control over financial reporting may vary over time. Our system contains self-monitoring mechanisms, and actions are taken to correct deficiencies as they are identified.
Our management conducted an evaluation of the effectiveness of the system of internal control over financial reporting based on the framework in Internal Control — Integrated Framework (2013) issued by the Committee of Sponsoring Organizations of the Treadway Commission. Based on this evaluation, our management concluded that the system of internal control over financial reporting was effective as of December 31, 2024. The effectiveness of internal control over financial reporting has been audited by Deloitte & Touche LLP, an independent registered public accounting firm, as stated in their report, which is included herein.
Audit Committee Oversight
The Audit Committee of the Board of Directors, which is comprised solely of independent directors, has oversight responsibility for our financial reporting process and the audits of the consolidated financial statements and internal control over financial reporting. The Audit Committee meets regularly with management and with our internal auditors and independent registered public accounting firm (collectively, the “auditors”) to review matters related to the quality and integrity of our financial reporting, internal control over financial reporting (including compliance matters related to our Code of Conduct), and the nature, extent, and results of internal and external audits. Our auditors have full and free access and report directly to the Audit Committee. The Audit Committee recommended, and the Board of Directors approved, that the audited consolidated financial statements be included in this Form 10-K.
| | | | | | | | | | | | | | |
| /s/ BRIAN L. ROBERTS | | /s/ JASON S. ARMSTRONG | | /s/ DANIEL C. MURDOCK |
| Brian L. Roberts | | Jason S. Armstrong | | Daniel C. Murdock |
Chairman and Chief Executive Officer | | Chief Financial Officer | | Executive Vice President, Chief
Accounting Officer and Controller |
| | | | | | | | |
| 57 | Comcast 2024 Annual Report on Form 10-K |
Report of Independent Registered Public Accounting Firm
To the Shareholders and Board of Directors of
Comcast Corporation
Opinions on the Financial Statements and Internal Control over Financial Reporting
We have audited the accompanying consolidated balance sheets of Comcast Corporation and subsidiaries (the “Company”) as of December 31, 2024 and 2023, the related consolidated statements of income, comprehensive income, cash flows, and changes in equity for each of the three years in the period ended December 31, 2024, and the related notes (collectively referred to as the “financial statements”). We also have audited the Company’s internal control over financial reporting as of December 31, 2024, based on criteria established in Internal Control — Integrated Framework (2013) issued by the Committee of Sponsoring Organizations of the Treadway Commission (COSO).
In our opinion, the financial statements referred to above present fairly, in all material respects, the financial position of the Company as of December 31, 2024 and 2023, and the results of its operations and its cash flows for each of the three years in the period ended December 31, 2024, in conformity with accounting principles generally accepted in the United States of America. Also, in our opinion, the Company maintained, in all material respects, effective internal control over financial reporting as of December 31, 2024, based on criteria established in Internal Control — Integrated Framework (2013) issued by COSO.
Basis for Opinions
The Company’s management is responsible for these financial statements, for maintaining effective internal control over financial reporting, and for its assessment of the effectiveness of internal control over financial reporting, included in the accompanying Management’s Report on Internal Control Over Financial Reporting. Our responsibility is to express an opinion on these financial statements and an opinion on the Company’s internal control over financial reporting based on our audits. We are a public accounting firm registered with the Public Company Accounting Oversight Board (United States) (PCAOB) and are required to be independent with respect to the Company in accordance with the U.S. federal securities laws and the applicable rules and regulations of the Securities and Exchange Commission and the PCAOB.
We conducted our audits in accordance with the standards of the PCAOB. Those standards require that we plan and perform the audits to obtain reasonable assurance about whether the financial statements are free of material misstatement, whether due to error or fraud, and whether effective internal control over financial reporting was maintained in all material respects.
Our audits of the financial statements included performing procedures to assess the risks of material misstatement of the financial statements, whether due to error or fraud, and performing procedures to respond to those risks. Such procedures included examining, on a test basis, evidence regarding the amounts and disclosures in the financial statements. Our audits also included evaluating the accounting principles used and significant estimates made by management, as well as evaluating the overall presentation of the financial statements. Our audit of internal control over financial reporting included obtaining an understanding of internal control over financial reporting, assessing the risk that a material weakness exists, and testing and evaluating the design and operating effectiveness of internal control based on the assessed risk. Our audits also included performing such other procedures as we considered necessary in the circumstances. We believe that our audits provide a reasonable basis for our opinions.
Definition and Limitations of Internal Control over Financial Reporting
A company’s internal control over financial reporting is a process designed to provide reasonable assurance regarding the reliability of financial reporting and the preparation of financial statements for external purposes in accordance with generally accepted accounting principles. A company’s internal control over financial reporting includes those policies and procedures that (1) pertain to the maintenance of records that, in reasonable detail, accurately and fairly reflect the transactions and dispositions of the assets of the company; (2) provide reasonable assurance that transactions are recorded as necessary to permit preparation of financial statements in accordance with generally accepted accounting principles, and that receipts and expenditures of the company are being made only in accordance with authorizations of management and directors of the company; and (3) provide reasonable assurance regarding prevention or timely detection of unauthorized acquisition, use, or disposition of the company’s assets that could have a material effect on the financial statements.
Because of its inherent limitations, internal control over financial reporting may not prevent or detect misstatements. Also, projections of any evaluation of effectiveness to future periods are subject to the risk that controls may become inadequate because of changes in conditions, or that the degree of compliance with the policies or procedures may deteriorate.
Critical Audit Matters
The critical audit matters communicated below are matters arising from the current-period audit of the financial statements that were communicated or required to be communicated to the audit committee and that (1) relate to accounts or disclosures that are material to the financial statements and (2) involved our especially challenging, subjective, or complex judgments. The communication of critical audit matters does not alter in any way our opinion on the financial statements, taken as a whole, and we are not, by communicating the critical audit matters below, providing separate opinions on the critical audit matters or on the accounts or disclosures to which they relate.
Revenue - Refer to Note 3 to the financial statements.
Critical Audit Matter Description
The Company’s Residential Connectivity & Platforms segment generates revenue from customers that subscribe to broadband and wireless connectivity services, video services and wireline voice services. These services are offered to customers individually and as bundled services at a discounted rate.
| | | | | | | | |
| Comcast 2024 Annual Report on Form 10-K | 58 | |
Report of Independent Registered Public Accounting Firm
The processing and recording of revenue are reliant upon multiple information technology (IT) systems.
Given the volume of data and the number of IT systems, subjective auditor judgment was involved in evaluating the sufficiency of audit evidence over revenue recognition for bundled services within the Residential Connectivity & Platforms segment, including the involvement of professionals with expertise in IT to identify, test, and evaluate the Company’s systems and automated controls used in processing revenue transactions.
How the Critical Audit Matter Was Addressed in the Audit
Our audit procedures related to the judgments necessary to determine the appropriate recognition and processing of revenue included the following, among others:
•We tested the effectiveness of controls in the revenue recognition processes, including those in place to (a) establish revenue recognition accounting policies for bundled services, (b) record revenue, including any related discounts, in accordance with the established accounting policies, and (c) reconcile the various systems to the Company’s general ledger.
•With the assistance of our IT specialists, we:
◦Identified the relevant systems and databases used to process revenue transactions and tested the relevant IT controls over each of those systems and databases.
◦Performed testing of automated business controls over revenue from domestic residential and business customers.
•We tested the allocation of revenue for bundled services by selecting a sample of subscriber invoices, evaluating management’s determination of the transaction price and the distinct performance obligations, and recalculating the allocation of transaction price to each performance obligation based on the respective stand-alone selling prices.
•We tested the accuracy and completeness of the subscriber information used in our audit procedures by selecting a sample of the subscribers, and for those selections agreeing the selected subscriber information to supporting documentation.
•We developed expectations of revenue at a disaggregated level based on historical transaction prices, changes in stand-alone selling prices and current year volumes. We also developed an expectation of aggregate domestic residential revenue from subscribers based on cash received during the year. We compared those estimates to revenue recognized by the Company.
Goodwill - Refer to Note 9 to the financial statements.
Critical Audit Matter Description
The Company’s evaluation of goodwill for impairment is performed at the reporting unit level. To determine its reporting units, the Company evaluates the components one level below the segment level and aggregates the components if they have similar economic characteristics. The Company performed a quantitative assessment of goodwill for the Media reporting unit, which involved a comparison of the fair value of the Media reporting unit to its carrying value.
The Company used the discounted cash flow model to estimate fair value, which requires management to make significant judgments related to discount rates and forecasts of expected cash flows. Changes in these assumptions could have a significant impact on either the fair value, the amount of any goodwill impairment charge, or both.
The goodwill balance was $58 billion as of December 31, 2024, of which $20 billion was allocated to the Media reporting unit. Based on the quantitative assessment, the estimated fair value of the Media reporting unit exceeded its carrying value and no impairment was recognized.
We identified the goodwill impairment assessment of the Media reporting unit as a critical audit matter because of the significant judgments made by management to estimate the fair value of the Media reporting unit. This required a high degree of auditor judgment and an increased extent of effort, when performing audit procedures to evaluate management’s conclusion related to the aggregation of components into a single reporting unit and the reasonableness of management’s estimates and assumptions related to the selection of the discount rate, revenue growth rate and Adjusted EBITDA margin included in future expected cash flows for the Media reporting unit.
How the Critical Audit Matter Was Addressed in the Audit
Our audit procedures to evaluate the determination of the reporting unit as well as the discount rate, revenue growth rate and Adjusted EBITDA margin included in future expected cash flows used by management to estimate the fair value of the Media reporting unit included the following, among others:
•We tested the effectiveness of controls over management’s goodwill impairment evaluation, including those over (a) the accounting policies regarding identification of the unit of account for goodwill and (b) the determination of the fair value of Media, such as controls related to management’s selection of the discount rate and forecasts of future expected cash flows.
•With the assistance of our fair value specialists, we evaluated the reasonableness of the (1) valuation methodology and (2) discount rate, including testing the source information underlying the determination of the discount rate, testing the mathematical accuracy of the calculation, and developing a range of independent estimates and comparing those to the discount rate selected by management.
•We evaluated management’s ability to accurately forecast future revenue and Adjusted EBITDA margin by comparing prior year forecasts to actual results in the respective years.
| | | | | | | | |
| 59 | Comcast 2024 Annual Report on Form 10-K |
Report of Independent Registered Public Accounting Firm
•We evaluated the reasonableness of management’s current forecasts of future revenue and Adjusted EBITDA margin by comparing such forecasts to historical results and to forecasted information included in Company press releases as well as in analyst and industry reports of the Company and companies in its peer group.
Income Taxes - Refer to Note 5 to the financial statements.
Critical Audit Matter Description
The Company completed an internal corporate reorganization which resulted in a federal net capital loss of $9.1 billion, which can be carried back three years. Given capital gains recognized in prior federal income tax returns, the Company recognized an income tax benefit and a corresponding refund receivable of $1.9 billion.
We identified the accounting for the tax benefit as a critical audit matter due to the significant judgment required to (1) determine whether the tax position’s technical merits are more-likely-than-not to be sustained and (2) measure the amount of the tax benefit that qualifies for recognition. Auditing the Company’s accounting for this position required a high degree of auditor judgment, specialized knowledge, and involvement of our tax specialists.
How the Critical Audit Matter Was Addressed in the Audit
Our audit procedures related to the tax benefit associated with the internal corporate reorganization included the following, among others:
•We tested the effectiveness of controls over management’s determination of the tax position and the measurement of the tax benefit.
•With the assistance of our tax specialists, we:
◦Evaluated management’s memoranda and third-party opinions used by management to support its position and the related accounting impacts. We assessed the consistency of management’s position with our interpretation of the relevant laws and regulations.
◦Assessed management’s methods and assumptions used in calculating the capital loss and measuring the tax benefit.
◦Recalculated the tax basis of the entities included in the calculation of the capital loss by comparing the amounts to supporting evidence and evaluating the appropriateness of management’s assumptions used to determine the tax basis.
/s/ Deloitte & Touche LLP
Philadelphia, Pennsylvania
January 31, 2025
We have served as the Company’s auditor since 1963.
| | | | | | | | |
| Comcast 2024 Annual Report on Form 10-K | 60 | |
Comcast Corporation
Consolidated Statements of Income
| | | | | | | | | | | | | | | | | |
| Year ended December 31 (in millions, except per share data) | 2024 | | 2023 | | 2022 |
| Revenue | $ | 123,731 | | | $ | 121,572 | | | $ | 121,427 | |
| Costs and Expenses: | | | | | |
| Programming and production | 37,026 | | | 36,762 | | | 38,213 | |
| Marketing and promotion | 8,073 | | | 7,971 | | | 8,506 | |
| Other operating and administrative | 40,533 | | | 39,190 | | | 38,263 | |
| Depreciation | 8,729 | | | 8,854 | | | 8,724 | |
| Amortization | 6,072 | | | 5,482 | | | 5,097 | |
| | | | | |
| Goodwill and long-lived asset impairments | — | | | — | | | 8,583 | |
| Total costs and expenses | 100,434 | | | 98,258 | | | 107,385 | |
| Operating income | 23,297 | | | 23,314 | | | 14,041 | |
| Interest expense | (4,134) | | | (4,087) | | | (3,896) | |
| Investment and other income (loss), net | (490) | | | 1,252 | | | (861) | |
| Income before income taxes | 18,673 | | | 20,478 | | | 9,284 | |
| Income tax expense | (2,796) | | | (5,371) | | | (4,359) | |
| Net income | 15,877 | | | 15,107 | | | 4,925 | |
| Less: Net income (loss) attributable to noncontrolling interests | (315) | | | (282) | | | (445) | |
| Net income attributable to Comcast Corporation | $ | 16,192 | | | $ | 15,388 | | | $ | 5,370 | |
| Basic earnings per common share attributable to Comcast Corporation shareholders | $ | 4.17 | | | $ | 3.73 | | | $ | 1.22 | |
| Diluted earnings per common share attributable to Comcast Corporation shareholders | $ | 4.14 | | | $ | 3.71 | | | $ | 1.21 | |
| | | | | |
| | | | | |
See accompanying notes to consolidated financial statements.
| | | | | | | | |
| 61 | Comcast 2024 Annual Report on Form 10-K |
Comcast Corporation
Consolidated Statements of Comprehensive Income
| | | | | | | | | | | | | | | | | |
| Year ended December 31 (in millions) | 2024 | | 2023 | | 2022 |
| Net income | $ | 15,877 | | | $ | 15,107 | | | $ | 4,925 | |
| Other comprehensive income (loss), net of tax (expense) benefit: | | | | | |
| Currency translation adjustments, net of deferred taxes of $(137), $(29) and $310 | (895) | | | 1,478 | | | (4,242) | |
| Cash flow hedges: | | | | | |
| Deferred gains (losses), net of deferred taxes of $(4), $8 and $(18) | 57 | | | 16 | | | 281 | |
| Realized (gains) losses reclassified to net income, net of deferred taxes of $(1), $38 and $(3) | (1) | | | (158) | | | (192) | |
| Employee benefit obligations and other, net of deferred taxes of $(9), $(2) and $(11) | 31 | | | 3 | | | 33 | |
| Other comprehensive income (loss) | (807) | | | 1,338 | | | (4,120) | |
| Comprehensive income (loss) | 15,070 | | | 16,445 | | | 805 | |
| Less: Net income (loss) attributable to noncontrolling interests | (315) | | | (282) | | | (445) | |
| Less: Other comprehensive income (loss) attributable to noncontrolling interests | (17) | | | (19) | | | (29) | |
| Comprehensive income attributable to Comcast Corporation | $ | 15,402 | | | $ | 16,746 | | | $ | 1,280 | |
See accompanying notes to consolidated financial statements.
| | | | | | | | |
| Comcast 2024 Annual Report on Form 10-K | 62 | |
Comcast Corporation
Consolidated Statements of Cash Flows
| | | | | | | | | | | | | | | | | |
| Year ended December 31 (in millions) | 2024 | | 2023 | | 2022 |
| Operating Activities | | | | | |
| Net income | $ | 15,877 | | | $ | 15,107 | | | $ | 4,925 | |
| Adjustments to reconcile net income to net cash provided by operating activities: | | | | | |
| Depreciation and amortization | 14,802 | | | 14,336 | | | 13,821 | |
| Goodwill and long-lived asset impairments | — | | | — | | | 8,583 | |
| Share-based compensation | 1,288 | | | 1,241 | | | 1,336 | |
| Noncash interest expense (income), net | 464 | | | 316 | | | 309 | |
| Net (gain) loss on investment activity and other | 1,088 | | | (768) | | | 1,177 | |
| Deferred income taxes | (902) | | | (2,739) | | | (834) | |
| Changes in operating assets and liabilities, net of effects of acquisitions and divestitures: | | | | | |
| Current and noncurrent receivables, net | 136 | | | (996) | | | (1,327) | |
| Film and television costs, net | 290 | | | (260) | | | (451) | |
| Accounts payable and accrued expenses related to trade creditors | (758) | | | (520) | | | 497 | |
| Other operating assets and liabilities | (4,611) | | | 2,784 | | | (1,623) | |
| Net cash provided by operating activities | 27,673 | | | 28,501 | | | 26,413 | |
| Investing Activities | | | | | |
| Capital expenditures | (12,181) | | | (12,242) | | | (10,626) | |
| Cash paid for intangible assets | (2,949) | | | (3,298) | | | (3,141) | |
| | | | | |
| Construction of Universal Beijing Resort | (116) | | | (137) | | | (330) | |
| | | | | |
| | | | | |
| Proceeds from sales of businesses and investments | 771 | | | 661 | | | 1,985 | |
| Advance on sale of investment | — | | | 8,610 | | | — | |
| Purchases of investments | (1,082) | | | (1,313) | | | (2,274) | |
| | | | | |
| Other | (113) | | | 558 | | | 246 | |
| Net cash provided by (used in) investing activities | (15,670) | | | (7,161) | | | (14,140) | |
| Financing Activities | | | | | |
| Proceeds from (repayments of) short-term borrowings, net | — | | | (660) | | | 660 | |
| Proceeds from borrowings | 6,268 | | | 6,052 | | | 2,745 | |
| | | | | |
| Repurchases and repayments of debt | (3,573) | | | (4,015) | | | (2,307) | |
| Repayment of collateralized obligation | — | | | (5,175) | | | — | |
| Repurchases of common stock under repurchase program and employee plans | (9,103) | | | (11,291) | | | (13,328) | |
| Dividends paid | (4,814) | | | (4,766) | | | (4,741) | |
| | | | | |
| | | | | |
| | | | | |
| Other | 339 | | | 5 | | | 786 | |
| Net cash provided by (used in) financing activities | (10,883) | | | (19,850) | | | (16,184) | |
| Impact of foreign currency on cash, cash equivalents and restricted cash | (26) | | | 9 | | | (86) | |
| Increase (decrease) in cash, cash equivalents and restricted cash | 1,095 | | | 1,500 | | | (3,997) | |
| Cash, cash equivalents and restricted cash, beginning of year | 6,282 | | | 4,782 | | | 8,778 | |
| Cash, cash equivalents and restricted cash, end of year | $ | 7,377 | | | $ | 6,282 | | | $ | 4,782 | |
See accompanying notes to consolidated financial statements.
| | | | | | | | |
| 63 | Comcast 2024 Annual Report on Form 10-K |
Comcast Corporation
Consolidated Balance Sheets
| | | | | | | | | | | |
| December 31 (in millions, except share data) | 2024 | | 2023 |
| Assets | | | |
| Current Assets: | | | |
| Cash and cash equivalents | $ | 7,322 | | | $ | 6,215 | |
| Receivables, net | 13,661 | | | 13,813 | |
| | | |
| | | |
| Other current assets | 5,817 | | | 3,959 | |
| Total current assets | 26,801 | | | 23,987 | |
| Film and television costs | 12,541 | | | 12,920 | |
| Investments | 8,647 | | | 9,385 | |
| Property and equipment, net | 62,548 | | | 59,686 | |
| Goodwill | 58,209 | | | 59,268 | |
| Franchise rights | 59,365 | | | 59,365 | |
| Other intangible assets, net | 25,599 | | | 27,867 | |
| Other noncurrent assets, net | 12,501 | | | 12,333 | |
| Total assets | $ | 266,211 | | | $ | 264,811 | |
| Liabilities and Equity | | | |
| Current Liabilities: | | | |
| Accounts payable and accrued expenses related to trade creditors | $ | 11,321 | | | $ | 12,437 | |
| Deferred revenue | 3,507 | | | 3,242 | |
| Accrued expenses and other current liabilities | 10,679 | | | 13,284 | |
| Current portion of debt | 4,907 | | | 2,069 | |
| Advance on sale of investment | 9,167 | | | 9,167 | |
| | | |
| Total current liabilities | 39,581 | | | 40,198 | |
| Noncurrent portion of debt | 94,186 | | | 95,021 | |
| Deferred income taxes | 25,227 | | | 26,003 | |
| Other noncurrent liabilities | 20,942 | | | 20,122 | |
| Commitments and contingencies | | | |
| Redeemable noncontrolling interests | 237 | | | 241 | |
| Equity: | | | |
| Preferred stock—authorized, 20,000,000 shares; issued, zero | — | | | — | |
| Class A common stock, $0.01 par value—authorized, 7,500,000,000 shares; issued, 4,651,093,045 and 4,842,108,959; outstanding, 3,778,302,017 and 3,969,317,931 | 47 | | | 48 | |
| Class B common stock, $0.01 par value—authorized, 75,000,000 shares; issued and outstanding, 9,444,375 | — | | | — | |
| Additional paid-in capital | 38,102 | | | 38,533 | |
| Retained earnings | 56,972 | | | 52,892 | |
| Treasury stock, 872,791,028 Class A common shares | (7,517) | | | (7,517) | |
| Accumulated other comprehensive income (loss) | (2,043) | | | (1,253) | |
| Total Comcast Corporation shareholders’ equity | 85,560 | | | 82,703 | |
| Noncontrolling interests | 477 | | | 523 | |
| Total equity | 86,038 | | | 83,226 | |
| Total liabilities and equity | $ | 266,211 | | | $ | 264,811 | |
See accompanying notes to consolidated financial statements.
| | | | | | | | |
| Comcast 2024 Annual Report on Form 10-K | 64 | |
Comcast Corporation
Consolidated Statements of Changes in Equity
| | | | | | | | | | | | | | | | | | | | | | | | |
| (in millions, except per share data) | 2024 | | 2023 | | 2022 | | | | | | | |
| Redeemable Noncontrolling Interests | | | | | | | | | | | | |
| Balance, beginning of year | $ | 241 | | | $ | 411 | | | $ | 519 | | | | | | | | |
| Contributions from (distributions to) noncontrolling interests, net | (13) | | | (24) | | | (77) | | | | | | | | |
| Other | — | | | (171) | | | (80) | | | | | | | | |
| Net income (loss) | 9 | | | 25 | | | 49 | | | | | | | | |
| Balance, end of year | $ | 237 | | | $ | 241 | | | $ | 411 | | | | | | | | |
| | | | | | | | | | | | |
| Class A Common Stock | | | | | | | | | | | | |
| Balance, beginning of year | $ | 48 | | | $ | 51 | | | $ | 54 | | | | | | | | |
| | | | | | | | | | | | |
| Repurchases of common stock under repurchase program and employee plans | (2) | | | (2) | | | (3) | | | | | | | | |
| Balance, end of year | $ | 47 | | | $ | 48 | | | $ | 51 | | | | | | | | |
| | | | | | | | | | | | |
| Class B Common Stock | | | | | | | | | | | | |
| | | | | | | | | | | | |
| Balance, beginning and end of year | $ | — | | | $ | — | | | $ | — | | | | | | | | |
| | | | | | | | | | | | |
| Additional Paid-In Capital | | | | | | | | | | | | |
| Balance, beginning of year | $ | 38,533 | | | $ | 39,412 | | | $ | 40,173 | | | | | | | | |
| Share-based compensation | 1,169 | | | 1,063 | | | 1,055 | | | | | | | | |
| Repurchases of common stock under repurchase program and employee plans | (1,841) | | | (2,086) | | | (2,431) | | | | | | | | |
| Issuances of common stock under employee plans | 240 | | | 272 | | | 278 | | | | | | | | |
| | | | | | | | | | | | |
| Other | 2 | | | (127) | | | 337 | | | | | | | | |
| Balance, end of year | $ | 38,102 | | | $ | 38,533 | | | $ | 39,412 | | | | | | | | |
| | | | | | | | | | | | |
| Retained Earnings | | | | | | | | | | | | |
| Balance, beginning of year | $ | 52,892 | | | $ | 51,609 | | | $ | 61,902 | | | | | | | | |
| | | | | | | | | | | | |
| Repurchases of common stock under repurchase program and employee plans | (7,251) | | | (9,309) | | | (10,897) | | | | | | | | |
| Dividends declared | (4,862) | | | (4,795) | | | (4,757) | | | | | | | | |
| Other | — | | | (1) | | | (10) | | | | | | | | |
| Net income | 16,192 | | | 15,388 | | | 5,370 | | | | | | | | |
| Balance, end of year | $ | 56,972 | | | $ | 52,892 | | | $ | 51,609 | | | | | | | | |
| | | | | | | | | | | | |
| Treasury Stock at Cost | | | | | | | | | | | | |
| | | | | | | | | | | | |
| Balance, beginning and end of year | $ | (7,517) | | | $ | (7,517) | | | $ | (7,517) | | | | | | | | |
| | | | | | | | | | | | |
| Accumulated Other Comprehensive Income (Loss) | | | | | | | | | | | | |
| Balance, beginning of year | $ | (1,253) | | | $ | (2,611) | | | $ | 1,480 | | | | | | | | |
| | | | | | | | | | | | |
| Other comprehensive income (loss) | (790) | | | 1,358 | | | (4,091) | | | | | | | | |
| | | | | | | | | | | | |
| Balance, end of year | $ | (2,043) | | | $ | (1,253) | | | $ | (2,611) | | | | | | | | |
| | | | | | | | | | | | |
| Noncontrolling Interests | | | | | | | | | | | | |
| Balance, beginning of year | $ | 523 | | | $ | 684 | | | $ | 1,398 | | | | | | | | |
| Other comprehensive income (loss) | (17) | | | (19) | | | (29) | | | | | | | | |
| Contributions from (distributions to) noncontrolling interests, net | 295 | | | 166 | | | 89 | | | | | | | | |
| Other | — | | | — | | | (280) | | | | | | | | |
| Net income (loss) | (324) | | | (307) | | | (495) | | | | | | | | |
| Balance, end of year | $ | 477 | | | $ | 523 | | | $ | 684 | | | | | | | | |
| Total equity | $ | 86,038 | | | $ | 83,226 | | | $ | 81,627 | | | | | | | | |
| Cash dividends declared per common share | $ | 1.24 | | | $ | 1.16 | | | $ | 1.08 | | | | | | | | |
See accompanying notes to consolidated financial statements.
| | | | | | | | |
| 65 | Comcast 2024 Annual Report on Form 10-K |
Comcast Corporation
Notes to Consolidated Financial Statements
| | |
| Note 1: Summary of Significant Accounting Policies |
Basis of Presentation
The accompanying consolidated financial statements include all entities in which we have a controlling voting interest and variable interest entities (“VIEs”) required to be consolidated, including Universal Beijing Resort (see Note 7).
We translate assets and liabilities of our foreign operations where the functional currency is the local currency into U.S. dollars at the exchange rate as of the balance sheet date and translate revenue and expenses using average periodic exchange rates. The related translation adjustments are recorded as a component of accumulated other comprehensive income (loss) in our consolidated balance sheets. Any foreign currency transaction gains or losses are included in our consolidated statements of income in investment and other income (loss), net. For disclosures containing future amounts where the functional currency is the local currency, we translate the amounts into U.S. dollars at the exchange rates as of the balance sheet date.
In November 2024, we announced our intention to create SpinCo, a new independent publicly traded company comprised of select domestic cable television networks along with complementary digital assets through a tax-free spin-off. We are targeting to complete the Spin-off by the end of 2025, subject to the satisfaction of customary conditions, including obtaining final approval from our Board of Directors, satisfactory completion of SpinCo financings, receipt of tax opinions and receipt of any regulatory approvals. There can be no assurance that a separation transaction will occur, or, if one does, of its terms or timing. The consolidated financial statements and related notes do not reflect the proposed Spin-off.
Reclassifications
Our current liability for accrued participations and residuals is separately disclosed in Note 4 in the current year and is included within the “accrued expenses and other current liabilities” caption in our consolidated balance sheet for all periods presented. Previously these amounts were presented in a separate caption in our consolidated balance sheet.
Accounting Policies
Our consolidated financial statements are prepared in accordance with GAAP, which require us to select accounting policies, including in certain cases industry-specific policies, and make estimates that affect the reported amount of assets, liabilities, revenue and expenses, and the related disclosure of contingent assets and contingent liabilities. Actual results could differ from these estimates. The following accounting policies are specific to the industries in which we operate:
•capitalization and amortization of film and television costs (see Note 4)
•costs for connecting customers to our HFC network (see Note 8)
Information on other accounting policies and methods that we use in the preparation of our consolidated financial statements are included, where applicable, in their respective footnotes that follow. Below is a discussion of accounting policies and methods used in our consolidated financial statements that are not presented within other footnotes.
Advertising Expenses
Advertising costs are expensed as incurred.
Fair Value Measurements
The accounting guidance related to fair value measurements establishes a hierarchy based on the types of inputs used for the various valuation techniques. The levels of the hierarchy are described below.
•Level 1: Values are determined using quoted market prices for identical financial instruments in an active market.
•Level 2: Values are determined using quoted prices for similar instruments in active markets; quoted prices for identical or similar instruments in markets that are not active; and model-derived valuations in which all significant inputs and significant value drivers are observable in active markets.
•Level 3: Values are determined using models that use significant inputs that are primarily unobservable, discounted cash flow methodologies or similar techniques, as well as instruments for which the determination of fair value requires significant management judgment or estimation.
We use this three-tier fair value hierarchy to measure the fair value of certain financial instruments on a recurring basis, such as for investments (see Note 7); on a non-recurring basis, such as for acquisitions and impairment testing (see Note 9); and for disclosure purposes, such as for debt (see Note 6). Our assessment of the significance of a particular input to the fair value measurement requires judgment and may affect the valuation and classification within the fair value hierarchy.
| | | | | | | | |
| Comcast 2024 Annual Report on Form 10-K | 66 | |
Recent Accounting Pronouncements
Income Tax Disclosures
In December 2023, the Financial Accounting Standards Board (“FASB”) issued updated accounting guidance related to income tax disclosures. The updated accounting guidance, among other things, requires additional disclosure primarily related to the income tax rate reconciliation and income taxes paid. We will adopt the updated accounting guidance in our Annual Report on Form 10-K for the year ending December 31, 2025.
Disaggregation of Income Statement Expenses
In November 2024, the FASB issued updated accounting guidance related to disclosures about certain costs and expenses. The updated accounting guidance, among other things, requires quantitative disclosures for employee compensation, selling expenses and purchases of inventory. The updated guidance is effective beginning in our Annual Report on Form 10-K for the year ending December 31, 2027.
| | |
| Note 2: Segment Information |
We are a global media and technology company with five segments: Residential Connectivity & Platforms, Business Services Connectivity, Media, Studios and Theme Parks. Our segments align to our primary business operations and how our Chairman and Chief Executive Officer, the chief operating decision maker, reviews our operating results. See Note 3 for a description of the various products and services within each segment.
Our segments generally report transactions with one another as if they were stand-alone businesses in accordance with GAAP, and these transactions are eliminated in consolidation. When multiple segments enter into transactions to provide products and services to third parties, revenue is generally allocated to our segments based on relative value. Transactions between our segments generally include intercompany profit consistent with third-party transactions. The Residential Connectivity & Platforms and the Business Services Connectivity segments use certain shared infrastructure, including our network in the United States, and each segment is presented with its direct costs and an allocation of shared costs, as well as revenue from its customers.
Our financial data by segment is presented in the tables below. We do not present asset information for our segments as this information is not used to allocate resources.
| | | | | | | | |
| 67 | Comcast 2024 Annual Report on Form 10-K |
| | | | | | | | | | | | | | | | | | | | | | | | | | |
| Year Ended December 31, 2024 | | | | | | |
| (in millions) | Residential Connectivity & Platforms | Business Services Connectivity | Media | Studios | Theme Parks | Total | | | | | | |
| Revenue from external customers | $ | 71,401 | | $ | 9,678 | | $ | 23,463 | | $ | 7,832 | | $ | 8,615 | | $ | 120,990 | | | | | | | |
Intersegment revenue(a) | 173 | | 23 | | 4,685 | | 3,259 | | 1 | | 8,142 | | | | | | | |
| 71,574 | | 9,701 | | 28,148 | | 11,092 | | 8,617 | | 129,132 | | | | | | | |
| Reconciliation of Revenue | | | | | | | | | | | | |
Other revenue(b) | | | | | | 2,982 | | | | | | | |
Eliminations(a) | | | | | | (8,383) | | | | | | | |
| Total consolidated revenue | | | | | | $ | 123,731 | | | | | | | |
| | | | | | | | | | | | |
Less segment expenses:(c) | | | | | | | | | | | | |
| Programming and production | $ | 16,881 | | | $ | 18,968 | | $ | 7,257 | | | | | | | | | |
| Marketing and promotion | | | 1,473 | | 1,483 | | | | | | | | | |
Other(d) | 27,355 | | 4,201 | | 4,577 | | 947 | | 5,668 | | | | | | | | |
Segment Adjusted EBITDA(e) | $ | 27,338 | | $ | 5,500 | | $ | 3,130 | | $ | 1,404 | | $ | 2,949 | | $ | 40,322 | | | | | | | |
| | | | | | | | | | | | |
| Reconciliation of total segment Adjusted EBITDA | | | | | | | | | | | |
Media, Studios and Theme Parks headquarters and other(f) | | | | | | (831) | | | | | | | |
Corporate and other(b)(e) | | | | | | (1,346) | | | | | | | |
| Eliminations | | | | | | (47) | | | | | | | |
| Depreciation | | | | | | (8,729) | | | | | | | |
| Amortization | | | | | | (6,072) | | | | | | | |
| Interest expense | | | | | | (4,134) | | | | | | | |
| Investment and other income (loss), net | | | | | | (490) | | | | | | | |
| Income before income taxes | | | | | | $ | 18,673 | | | | | | | |
| | | | | | | | | | | | | | | | | | | | | | | | | | |
| Year Ended December 31, 2023 | | | | | | |
| (in millions) | Residential Connectivity & Platforms | Business Services Connectivity | Media | Studios | Theme Parks | Total | | | | | | |
| Revenue from external customers | $ | 71,739 | | $ | 9,233 | | $ | 20,734 | | $ | 8,308 | | $ | 8,948 | | $ | 118,962 | | | | | | | |
Intersegment revenue(a) | 207 | | 22 | | 4,621 | | 3,317 | | (1) | | 8,166 | | | | | | | |
| 71,946 | | 9,255 | | 25,355 | | 11,625 | | 8,947 | | 127,128 | | | | | | | |
| Reconciliation of Revenue | | | | | | | | | | | | |
Other revenue(b) | | | | | | 2,827 | | | | | | | |
Eliminations(a) | | | | | | (8,383) | | | | | | | |
| Total consolidated revenue | | | | | | $ | 121,572 | | | | | | | |
| | | | | | | | | | | | |
Less segment expenses:(c) | | | | | | | | | | | | |
| Programming and production | $ | 18,067 | | | $ | 16,921 | | $ | 7,958 | | | | | | | | | |
| Marketing and promotion | | | 1,389 | | 1,579 | | | | | | | | | |
Other(d) | 26,932 | | 3,964 | | 4,091 | | 818 | | 5,602 | | | | | | | | |
Segment Adjusted EBITDA(e) | $ | 26,948 | | $ | 5,291 | | $ | 2,955 | | $ | 1,269 | | $ | 3,345 | | $ | 39,808 | | | | | | | |
| | | | | | | | | | | | |
| Reconciliation of total segment Adjusted EBITDA | | | | | | | | | | | |
Media, Studios and Theme Parks headquarters and other(f) | | | | | | (946) | | | | | | | |
Corporate and other(b)(e) | | | | | | (1,318) | | | | | | | |
| Eliminations | | | | | | 105 | | | | | | | |
| Depreciation | | | | | | (8,854) | | | | | | | |
| Amortization | | | | | | (5,482) | | | | | | | |
| Interest expense | | | | | | (4,087) | | | | | | | |
| Investment and other income (loss), net | | | | | | 1,252 | | | | | | | |
| Income before income taxes | | | | | | $ | 20,478 | | | | | | | |
| | | | | | | | |
| Comcast 2024 Annual Report on Form 10-K | 68 | |
| | | | | | | | | | | | | | | | | | | | | | | | | | |
| Year Ended December 31, 2022 | | | | | | |
| (in millions) | Residential Connectivity & Platforms | Business Services Connectivity | Media | Studios | Theme Parks | Total | | | | | | |
| Revenue from external customers | $ | 72,177 | | $ | 8,798 | | $ | 22,147 | | $ | 8,294 | | $ | 7,541 | | $ | 118,957 | | | | | | | |
Intersegment revenue(a) | 208 | | 21 | | 4,572 | | 3,963 | | 1 | | 8,765 | | | | | | | |
| 72,386 | | 8,819 | | 26,719 | | 12,257 | | 7,541 | | 127,722 | | | | | | | |
| Reconciliation of Revenue | | | | | | | | | | | | |
Other revenue(b) | | | | | | 2,737 | | | | | | | |
Eliminations(a) | | | | | | (9,032) | | | | | | | |
| Total consolidated revenue | | | | | | $ | 121,427 | | | | | | | |
| | | | | | | | | | | | |
Less segment expenses:(c) | | | | | | | | | | | | |
| Programming and production | $ | 18,500 | | | $ | 17,650 | | $ | 8,778 | | | | | | | | | |
| Marketing and promotion | | | 1,520 | | 1,699 | | | | | | | | | |
Other(d) | 27,775 | | 3,759 | | 3,951 | | 819 | | 4,858 | | | | | | | | |
Segment Adjusted EBITDA(e) | $ | 26,111 | | $ | 5,060 | | $ | 3,598 | | $ | 961 | | $ | 2,683 | | $ | 38,414 | | | | | | | |
| | | | | | | | | | | | |
| Reconciliation of total segment Adjusted EBITDA | | | | | | | | | | | |
Media, Studios and Theme Parks headquarters and other(f) | | | | | | (881) | | | | | | | |
Corporate and other(b)(e) | | | | | | (1,021) | | | | | | | |
| Eliminations | | | | | | (66) | | | | | | | |
| Depreciation | | | | | | (8,724) | | | | | | | |
| Amortization | | | | | | (5,097) | | | | | | | |
Goodwill and long-lived asset impairments(g) | | | | | | (8,583) | | | | | | | |
| Interest expense | | | | | | (3,896) | | | | | | | |
| Investment and other income (loss), net | | | | | | (861) | | | | | | | |
| Income before income taxes | | | | | | $ | 9,284 | | | | | | | |
(a)Our most significant intersegment revenue transactions include distribution revenue in Media related to fees from Residential Connectivity & Platforms for the rights to distribute television programming, and content licensing revenue in Studios for licenses of owned content to Media. Revenue for licenses of content from Studios to Media is generally recognized at a point in time, consistent with the recognition of transactions with third parties, when the content is delivered and made available for use. The costs of these licenses in Media are recognized as the content is used over the license period. The difference in timing of recognition between segments results in an Adjusted EBITDA impact in eliminations, as the profits (losses) on these transactions are deferred in our consolidated results and recognized as the content is used over the license period.
(b)Includes the operations of our Sky-branded video services and television networks in Germany; Comcast Spectacor, which owns the Philadelphia Flyers and the Wells Fargo Center arena in Philadelphia, Pennsylvania; and Xumo, our consolidated streaming platform joint venture with Charter Communications. Corporate and other also includes overhead and personnel costs for Corporate.
(c)The significant expense categories and amounts align with the segment-level information that is regularly provided to our chief operating decision maker. Intersegment expenses are included in the amounts shown.
(d)Other for each segment primarily includes:
Residential Connectivity & Platforms and Business Services Connectivity: technical and support; direct product costs; marketing and promotion; customer service; administrative personnel costs; franchise and other regulatory fees; fees paid to third parties where we sell advertising on their behalf; bad debt; and other business, headquarters and support costs, including building and office expenses, taxes and billing costs necessary to operate the Residential Connectivity & Platforms and Business Services Connectivity segments. Our chief operating decision maker uses aggregate expense information to manage the operations of the Business Services Connectivity segment.
Media and Studios: salaries, employee benefits, rent and other overhead expenses.
Theme Parks: theme park operations, including repairs and maintenance and related administrative expenses; food, beverage and merchandise costs; labor costs; and sales and marketing costs. Our chief operating decision maker uses aggregate expense information to manage the operations of the Theme Parks segment.
(e)We use Adjusted EBITDA as the measure of profit or loss for our segments. For each of our segments, our chief operating decision maker uses Adjusted EBITDA to measure operational strength and performance, assist in the evaluation of underlying trends, and allocate resources in the annual budget and forecasting process. Adjusted EBITDA is also a significant performance measure in our annual incentive compensation programs. From time to time we may report the impact of certain events, gains, losses or other charges related to our segments within Corporate and other.
(f)Includes overhead, personnel costs and other costs necessary to operate the Media, Studios and Theme Parks segments.
(g)Refer to Note 9 for a discussion of impairment charges in 2022 related to goodwill and long-lived assets.
| | | | | | | | |
| 69 | Comcast 2024 Annual Report on Form 10-K |
| | | | | | | | | | | | | | | | | |
| Year ended December 31 (in millions) | 2024 | | 2023 | | 2022 |
| Domestic broadband | $ | 26,228 | | | $ | 25,489 | | | $ | 24,469 | |
| Domestic wireless | 4,273 | | | 3,664 | | | 3,071 | |
| International connectivity | 4,854 | | | 4,207 | | | 3,426 | |
| Total residential connectivity | 35,355 | | | 33,359 | | | 30,966 | |
| Video | 26,872 | | | 28,797 | | | 30,496 | |
| Advertising | 4,089 | | | 3,969 | | | 4,546 | |
| Other | 5,259 | | | 5,820 | | | 6,378 | |
| Total Residential Connectivity & Platforms Segment | 71,574 | | | 71,946 | | | 72,386 | |
| | | | | |
| Total Business Services Connectivity Segment | 9,701 | | | 9,255 | | | 8,819 | |
| | | | | |
| Domestic advertising | 10,008 | | | 8,600 | | | 10,360 | |
| Domestic distribution | 11,826 | | | 10,663 | | | 10,525 | |
| International networks | 4,282 | | | 4,109 | | | 3,729 | |
| Other | 2,031 | | | 1,983 | | | 2,105 | |
| Total Media Segment | 28,148 | | | 25,355 | | | 26,719 | |
| | | | | |
| Content licensing | 8,063 | | | 8,231 | | | 9,348 | |
| Theatrical | 1,693 | | | 2,079 | | | 1,607 | |
| Other | 1,335 | | | 1,315 | | | 1,302 | |
| Total Studios Segment | 11,092 | | | 11,625 | | | 12,257 | |
| | | | | |
| Total Theme Parks Segment | 8,617 | | | 8,947 | | | 7,541 | |
| | | | | |
Other revenue(a) | 2,982 | | | 2,827 | | | 2,737 | |
Eliminations(a) | (8,383) | | | (8,383) | | | (9,032) | |
| Total revenue | $ | 123,731 | | | $ | 121,572 | | | $ | 121,427 | |
(a)See Note 2 for additional information on intersegment revenue transactions.
We operate primarily in the United States but also in select international markets. The table below summarizes our consolidated revenue from customers in certain geographic locations.
| | | | | | | | | | | | | | | | | |
| Year ended December 31 (in millions) | 2024 | | 2023 | | 2022 |
| United States | $ | 96,237 | | | $ | 94,375 | | | $ | 96,441 | |
| United Kingdom | 14,194 | | | 13,364 | | | 13,380 | |
| Other | 13,300 | | | 13,833 | | | 11,606 | |
| Total revenue | $ | 123,731 | | | $ | 121,572 | | | $ | 121,427 | |
Residential Connectivity & Platforms Segment
Residential Connectivity & Platforms generates revenue from customers that subscribe to our residential broadband and wireless connectivity services, residential and business video services and residential wireline voice services in the United States, the United Kingdom and Italy. We offer these services individually and as bundled services at a discounted rate.
Subscription rates and related charges vary according to the services and features customers receive, and customers are typically billed in advance and pay on a monthly basis. Revenue from customers that purchase bundled services at a discounted rate is allocated between the separate services based on the respective stand-alone selling prices. The stand-alone selling prices are determined based on the current prices at which we separately sell the services. Significant judgment is used to determine performance obligations that should be accounted for separately and the allocation of revenue when services are combined in a bundle.
| | | | | | | | |
| Comcast 2024 Annual Report on Form 10-K | 70 | |
While a portion of our customers are subject to contracts for their services, which are typically 1 month to 2 years in length, based on our evaluation of the terms of these contracts, we recognize revenue for these services primarily on a basis that is consistent with our customers that are not subject to contracts and recognize revenue as the services are provided on a monthly basis. Installation fees for these customers are deferred and recognized as revenue over the period of benefit to the customer, which is less than a year. Certain international customers are under contracts, with terms typically ranging from rolling monthly to 24 months, depending on the service, and may only discontinue service in accordance with the terms of their contracts. We recognize revenue for these customers as the services are provided over the contract period. At any given time, the amount of future revenue to be earned from these customers related to existing agreements is equal to less than 10% of our annual Residential Connectivity & Platforms revenue and will generally be recognized within 24 months. Sales commissions are generally expensed as incurred, as the related period of benefit is less than a year. Sales commissions for the international customers under contract are generally deferred and recognized over the respective contract terms.
Our services generally involve customer premise equipment, such as wireless gateways and set-top boxes, that are generally considered part of our services for revenue recognition. We recognize revenue from the sale of devices, including wireless devices and Sky Glass smart televisions, when they are transferred to the customer. Under an equipment installment plan, customers typically have the option to finance wireless devices and Sky Glass smart televisions interest-free over 24 months, and up to 48 months for international customers. Equipment installment plan receivables under these arrangements are recorded net of imputed interest when the devices are transferred to the customer.
We also have arrangements to sell certain DTC streaming services to our customers. We have concluded we are the sales agent in these arrangements, and we record net commission revenue as earned, which is generally as customers are billed on a monthly basis, within domestic broadband and international connectivity revenue.
Under the terms of our domestic cable franchise agreements, we are generally required to pay the cable franchising authority an amount based on gross video revenue. We generally pass these and other similar fees through to our domestic customers and classify these fees in the respective Residential Connectivity & Platforms services revenue, with the corresponding costs included in other operating and administrative expenses.
Advertising
Revenue is generated from the sale of advertising and technology, tools and solutions relating to advertising businesses. As part of distribution agreements with domestic cable networks, we generally receive an allocation of scheduled advertising time that we sell to advertisers. In addition, we generate revenue from the sale of advertising on our owned Sky-branded entertainment television networks and our digital platforms. In most cases, the available advertising units are sold by our sales force. We also enter into representation agreements under which we sell advertising on behalf of third parties. Since we are acting as the principal in these arrangements, we record the advertising that is sold in advertising revenue and the fees paid to the third parties in other operating and administrative expenses. In some cases, we work with representation firms as an extension of our sales force to sell a portion of the advertising units allocated to us and record the revenue net of agency commissions.
We have determined that a contract exists for our advertising sales arrangements once all terms and conditions are agreed upon, typically when the number of advertising units is specifically identified and scheduled. Advertisements are generally aired or delivered within one year once all terms and conditions are agreed upon. Revenue from these arrangements is recognized in the period in which advertisements are aired or delivered. Payment terms vary by contract, although terms generally require payment within 30 to 60 days from when advertisements are aired or delivered. We also provide technology, tools, data-driven services and marketplace solutions to customers in the media industry to facilitate the more effective engagement of advertisers with their target audiences and recognize revenue when these services are provided.
Business Services Connectivity Segment
Business Services Connectivity generates revenue from subscribers to a variety of our products and services which are offered to businesses. Our connectivity service offerings for small business locations in the United States primarily include broadband, wireline voice and wireless services that are similar to those provided to our residential customers and include certain other features specific to businesses. Our enterprise solutions offerings for medium-sized customers and larger enterprises also include ethernet network services, advanced voice services and a software-defined networking product. We also have certain business connectivity service offerings in the United Kingdom.
| | | | | | | | |
| 71 | Comcast 2024 Annual Report on Form 10-K |
We recognize revenue as the services are provided over the contract period. Substantially all of our customers are initially under contracts, with terms typically ranging from 2 years for small and medium-sized businesses to up to 5 years for larger enterprises. Customers with contracts may only discontinue service in accordance with the terms of their contracts. At any given time, the amount of future revenue to be earned related to fixed pricing under existing agreements is equal to approximately half of our annual Business Services Connectivity segment revenue, of which the substantial majority will be recognized within 2 years. Customers under contract typically pay on a monthly basis. Installation revenue and sales commissions are generally deferred and recognized over the respective contract terms.
Media Segment
Advertising
Media generates revenue from the sale of advertising on our linear television networks, Peacock and other digital properties.
We have determined that a contract exists for our advertising sales once all terms and conditions are agreed upon, typically when the number of advertising units is specifically identified and scheduled. Advertisements are generally aired or delivered within one year once all terms and conditions are agreed upon. Revenue is recognized, net of agency commissions, in the period in which advertisements are aired or delivered and payment occurs thereafter, with payment generally required within 30 days. In some instances, we guarantee audience ratings for the advertisements. To the extent there is a shortfall in contracts where the ratings were guaranteed, a portion of the revenue is deferred until the shortfall is settled, typically by providing additional advertising units generally within one year of the original airing.
Distribution
Media generates revenue from the distribution of television programming in the United States and internationally to traditional multichannel video providers, such as our Residential Connectivity & Platforms segment, and to virtual multichannel video providers that offer streamed linear television networks. This revenue includes amounts under NBC and Telemundo retransmission consent agreements, and we also receive associated fees from NBC-affiliated and Telemundo-affiliated local broadcast television stations. We also receive monthly subscription fees for our Peacock service either directly from customers or from companies who sell Peacock to customers on our behalf. We have determined that we are principal in these arrangements and in the event we do not have transparency into the pricing charged by a company selling Peacock on our behalf, the amount of revenue recognized is limited to the fees receivable from that company pursuant to our arrangement.
Monthly fees received under distribution agreements with multichannel video providers are generally under multiyear agreements with revenue based on the number of subscribers receiving the programming on our television networks and a per subscriber fee, although revenue for certain of our television networks is based on a fixed fee. Payment terms and conditions vary by contract type, although terms generally include payment within 60 days. These arrangements are accounted for as licenses of functional intellectual property and revenue is recognized as programming is provided.
Studios Segment
Content Licensing
Studios generates revenue from the worldwide licensing of our owned film and television content to television networks and DTC streaming service providers, as well as through video on demand services provided by multichannel video providers and other service providers. Our agreements generally include fixed pricing and span multiple years. For example, following a film’s theatrical release, Studios may license the exhibition rights of a film to different customers over multiple successive distribution windows.
We recognize revenue when the content is delivered and available for use by the licensee. When the term of an existing agreement is renewed or extended, we recognize revenue when the licensed content becomes available under the renewal or extension. Payment terms and conditions vary by contract type, although payments are generally collected over the license term. The amount of future revenue to be earned related to fixed pricing under existing third-party agreements at any given time equals approximately one-half year to 1 year of annual Studios content licensing revenue, which is the segment with the largest portion of this future revenue. The majority of this revenue will be recognized within 2 years. This amount may fluctuate from period to period depending on the timing of the releases and the availability of content under existing agreements and may not represent the total revenue expected to be recognized as it does not include revenue from future agreements or from variable pricing or optional purchases under existing agreements.
For our agreements that include variable pricing, such as pricing based on the number of subscribers to a DTC streaming service sold by our customers, we generally recognize revenue as our customers sell to their subscribers.
| | | | | | | | |
| Comcast 2024 Annual Report on Form 10-K | 72 | |
Theatrical
Studios generates revenue from the worldwide distribution of our produced and acquired films for exhibition in movie theaters. Our arrangements with exhibitors generally entitle us to a percentage of ticket sales. We recognize revenue as the films are viewed and exhibited in theaters and payment generally occurs within 30 days after exhibition.
Theme Parks Segment
Theme Parks generates revenue primarily from guest spending at our Universal theme parks in Orlando, Florida; Hollywood, California; Osaka, Japan; and Beijing, China. Guest spending includes ticket sales and in-park spending on food, beverages and merchandise. We also generate revenue from our consumer products business. Additionally, we license the right to use the Universal Studios brand name and other intellectual property and provide other services to third parties, including the party that owns and operates the Universal Studios Singapore theme park on Sentosa Island, Singapore. We recognize revenue from ticket sales when the tickets are used, generally within a year from the date of purchase. For annual passes, we generally recognize revenue on a straight-line basis over the period the pass is available to be used. We recognize revenue from in-park spending and consumer products at the point of sale.
Consolidated Balance Sheets
The table below summarizes our accounts receivable, other balances that are not separately presented in our consolidated balance sheets that relate to the recognition of revenue and collection of the related cash, and deferred costs associated with our contracts with customers.
| | | | | | | | | | | |
| December 31 (in millions) | 2024 | | 2023 |
| Receivables, gross | $ | 14,399 | | | $ | 14,511 | |
| Less: Allowance for credit losses | 738 | | | 698 | |
| Receivables, net | $ | 13,661 | | | $ | 13,813 | |
| Noncurrent receivables, net (included in other noncurrent assets, net) | $ | 1,853 | | | $ | 1,914 | |
Contract acquisition and fulfillment costs (included in other noncurrent assets, net)(a) | $ | 1,184 | | | $ | 1,088 | |
| Noncurrent deferred revenue (included in other noncurrent liabilities) | $ | 665 | | | $ | 618 | |
(a) Amortization of contract acquisition and fulfillment costs totaled $716 million, $692 million and $707 million in 2024, 2023 and 2022, respectively, included in marketing and promotion and other operating and administrative expenses.
| | | | | | | | | | | | | | | | | |
| Changes in Allowance for Credit Losses | | | | | |
| (in millions) | 2024 | | 2023 | | 2022 |
| Beginning balance | $ | 698 | | | $ | 736 | | | $ | 658 | |
| Current-period provision for expected credit losses | 747 | | | 775 | | | 758 | |
| Write-offs charged against the allowance, net of recoveries and other | (707) | | | (812) | | | (680) | |
| Ending balance | $ | 738 | | | $ | 698 | | | $ | 736 | |
Our accounts receivables include amounts not yet billed related to equipment installment plans, as summarized in the table below.
| | | | | | | | | | | |
| December 31 (in millions) | 2024 | | 2023 |
| Receivables, net | $ | 1,827 | | | $ | 1,695 | |
| Noncurrent receivables, net (included in other noncurrent assets, net) | 1,225 | | | 1,223 | |
| | | |
| Total | $ | 3,052 | | | $ | 2,918 | |
| | |
| Note 4: Programming and Production Costs |
| | | | | | | | | | | | | | | | | |
| Year ended December 31 (in millions) | 2024 | | 2023 | | 2022 |
| Video distribution programming | $ | 11,428 | | | $ | 12,460 | | | $ | 13,013 | |
| Film and television content: | | | | | |
Owned(a) | 9,617 | | | 10,224 | | | 10,765 | |
| Licensed, including sports rights | 14,668 | | | 12,619 | | | 13,151 | |
| Other | 1,314 | | | 1,459 | | | 1,283 | |
| Total programming and production costs | $ | 37,026 | | | $ | 36,762 | | | $ | 38,213 | |
(a) Amount includes amortization of owned content of $7.8 billion, $7.8 billion and $8.6 billion for the year ended December 31, 2024, 2023 and 2022, respectively, as well as participations and residuals expenses.
| | | | | | | | |
| 73 | Comcast 2024 Annual Report on Form 10-K |
Video Distribution Programming Expenses
We incur programming expenses related to the license of the rights to distribute or integrate third-party programmed television networks, platforms and related content included in video services we sell to end consumers. Programming is generally acquired under multiyear distribution agreements, with fees typically based on the number of customers receiving the television network programming and a per subscriber fee. Programming distribution arrangements are accounted for as executory contracts with expenses generally recognized based on the rates in the agreements, and the arrangements are not subject to impairment.
Film and Television Content
We incur costs related to the production of owned content and the license of the rights to use content owned by third parties and sports rights on our owned television networks and digital properties, which are described as owned and licensed content, respectively. We have determined that the predominant monetization strategy for the substantial majority of our content is on an individual basis.
Capitalized Film and Television Costs
| | | | | | | | | | | |
| December 31 (in millions) | 2024 | | 2023 |
| Owned: | | | |
| In production and in development | $ | 3,342 | | | $ | 2,893 | |
| Completed, not released | 209 | | | 317 | |
| Released, less amortization | 4,545 | | | 4,340 | |
| 8,095 | | | 7,551 | |
| Licensed, including sports advances | 4,446 | | | 5,369 | |
| | | |
| | | |
| | | |
| Film and television costs | $ | 12,541 | | | $ | 12,920 | |
Production tax incentives reduced capitalized owned film and television costs by $455 million and $418 million as of December 31, 2024 and 2023, respectively, and resulted in a reduction of programming and production costs of $652 million, $578 million and $733 million in 2024, 2023 and 2022, respectively. We have receivables related to our production tax incentives of $2.2 billion and $1.9 billion as of December 31, 2024 and 2023, respectively, a substantial majority of which are reflected in other noncurrent assets in our consolidated balance sheets.
The table below summarizes estimated future amortization expense for the capitalized film and television costs recorded in our consolidated balance sheets as of December 31, 2024.
| | | | | | | | | | | | | | | | |
| (in millions) | | | | | | Owned | | Licensed |
| Completed, not released: | | | | | | | | |
| 2025 | | | | | | $ | 127 | | | |
| | | | | | | | |
| Released and licensed content: | | | | | | | | |
| 2025 | | | | | | $ | 2,299 | | | $ | 2,373 | |
| 2026 | | | | | | $ | 842 | | | $ | 1,471 | |
| 2027 | | | | | | $ | 452 | | | $ | 351 | |
We have future minimum commitments for licensed content that are not recognized in our consolidated balance sheet as of December 31, 2024 totaling $2.8 billion.
The following table summarizes the amount of accrued participation and residual liabilities that we expect to pay during the upcoming operating cycle.
| | | | | | | | | | | |
| December 31 (in millions) | 2024 | | 2023 |
| Current portion of accrued participations and residuals | $ | 1,444 | | | $ | 1,671 | |
| | | | | | | | |
| Comcast 2024 Annual Report on Form 10-K | 74 | |
Capitalization and Recognition of Film and Television Content
We capitalize costs for owned film and television content, including direct costs, production overhead, print costs, development costs and interest, as well as acquired libraries. Amortization for owned content predominantly monetized on an individual basis and accrued costs associated with participations and residuals payments are recorded using the individual film forecast computation method, which recognizes the costs in the same ratio as the associated ultimate revenue. Estimates of ultimate revenue and total costs are based on anticipated release patterns and distribution strategies, public acceptance and historical results for similar productions. Amortization for content predominantly monetized with other owned or licensed content is recorded based on estimated usage. In determining the method of amortization and estimated life of an acquired film or television library, we generally use the method and the life that most closely follow the undiscounted cash flows over the estimated life of the asset. We do not capitalize costs related to the distribution of a film in movie theaters or the licensing or sale of a film or television production, which primarily include costs associated with marketing and distribution.
We capitalize the costs of licensed content when the license period begins, the content is made available for use and the costs of the licenses are known. Licensed content is amortized as the associated programs are used, incorporating estimated viewing patterns.
Owned and licensed content are presented as noncurrent assets in film and television costs. We present amortization of owned and licensed content and accrued costs associated with participations and residuals payments in programming and production costs.
Film and television productions may be eligible for tax incentives from certain state, local or foreign jurisdictions. These incentives generally provide for transferable or redeemable tax credits upon meeting established levels of qualified production spending within a participating jurisdiction. We record a receivable for a production tax incentive program when there is a reasonable assurance of collection with a corresponding reduction of capitalized film and television costs, and the related amortization.
We may enter into co-financing arrangements with third parties to jointly finance or distribute certain of our film productions. These arrangements can take various forms, but in most cases involve the grant of an economic interest in a film to an investor who owns an undivided copyright interest in the film. The number of investors and the terms of these arrangements can vary, although investors generally assume the full risks and rewards of ownership proportionate to their ownership in the film. We account for the proceeds received from the investor under these arrangements as a reduction of our capitalized film costs and the investor’s interest in the profit or loss of the film is recorded as either a charge or a benefit, respectively, in programming and production costs. The investor’s interest in the profit or loss of a film is recorded each period using the individual film forecast computation method.
When an event or a change in circumstance occurs that was known or knowable as of the balance sheet date and that indicates the fair value of either owned or licensed content is less than the unamortized costs in the balance sheet, we determine the fair value and record an impairment charge to the extent the unamortized costs exceed the fair value. Owned content is assessed either individually or in identified film groups, for content predominantly monetized on an individual basis or with other content, respectively. The substantial majority of our owned content is evaluated for impairment on an individual title basis. Licensed content that is not part of a film group is generally assessed in packages, channels or dayparts. A daypart is an aggregation of programs broadcast during a particular time of day or programs of a similar type. Licensed content is tested for impairment primarily on a channel, network or platform basis, with the exception of our broadcast networks and owned local broadcast television stations, which are tested on a daypart basis. Estimated fair values of owned and licensed content are generally based on Level 3 inputs including analysis of market participant estimates of future cash flows. We record charges related to impairments or content that is substantively abandoned to programming and production costs.
Sports Rights
We recognize the costs of multiyear, live-event sports rights as the rights are used over the contract term based on estimated relative value. Estimated relative value is generally based on the terms of the contract and the nature of and potential revenue generation of the deliverables within the contract. Sports rights are accounted for as executory contracts and are not subject to impairment. When cash payments, including advanced payments, exceed the relative value of the sports rights delivered, we recognize an asset in licensed content. Production costs incurred in advance of airing are also presented in licensed content.
| | | | | | | | |
| 75 | Comcast 2024 Annual Report on Form 10-K |
| | | | | | | | | | | | | | | | | |
| Income (Loss) Before Income Taxes | | | | | |
| Year ended December 31 (in millions) | 2024 | | 2023 | | 2022 |
| | | | | |
| Domestic | $ | 19,615 | | | $ | 22,164 | | | $ | 19,329 | |
| Foreign | (942) | | | (1,686) | | | (10,045) | |
| $ | 18,673 | | | $ | 20,478 | | | $ | 9,284 | |
| | | | | | | | | | | | | | | | | |
| Components of Income Tax Expense | | | | | |
| Year ended December 31 (in millions) | 2024 | | 2023 | | 2022 |
| Current Expense (Benefit): | | | | | |
| Federal | $ | 2,194 | | | $ | 6,270 | | | $ | 4,025 | |
| State | 1,115 | | | 1,591 | | | 961 | |
| Foreign | 389 | | | 249 | | | 207 | |
| 3,698 | | | 8,110 | | | 5,193 | |
| Deferred Expense (Benefit): | | | | | |
| Federal | (599) | | | (2,126) | | | (281) | |
| State | (49) | | | (468) | | | (483) | |
| Foreign | (253) | | | (145) | | | (70) | |
| (902) | | | (2,739) | | | (834) | |
| Income tax expense (benefit) | $ | 2,796 | | | $ | 5,371 | | | $ | 4,359 | |
Our income tax expense (benefit) differs from the federal statutory amount because of the effect of the items detailed in the table below.
| | | | | | | | | | | | | | | | | |
| Year ended December 31 (in millions) | 2024 | | 2023 | | 2022 |
| Federal tax at statutory rate | $ | 3,921 | | | $ | 4,300 | | | $ | 1,950 | |
| State income taxes, net of federal benefit | 363 | | | 418 | | | 454 | |
Foreign income taxed at different rates(a) | 363 | | | 455 | | | 586 | |
| | | | | |
| | | | | |
| Adjustments to uncertain and effectively settled tax positions, net | 332 | | | 353 | | | 179 | |
| | | | | |
| | | | | |
Tax credits(a) | (328) | | | (280) | | | (171) | |
| Excess tax benefits recognized on share-based compensation | (4) | | | 4 | | | (30) | |
| Tax legislation | (24) | | | 8 | | | (287) | |
| Internal corporate reorganization | (1,920) | | | — | | | — | |
| Goodwill impairment | — | | | — | | | 1,666 | |
| Other | 93 | | | 113 | | | 12 | |
| Income tax expense (benefit) | $ | 2,796 | | | $ | 5,371 | | | $ | 4,359 | |
(a) We updated our presentation in 2024 to include all federal tax credits within the “tax credits” caption, which results in reclassification of prior period amounts. Federal tax credits for foreign income taxes previously presented within the “foreign income taxed at different rates” caption and federal research and development credits previously presented in a stand-alone caption are now presented within the “tax credits” caption.
We base our provision for income taxes on our current period income, changes in our deferred income tax assets and liabilities, income tax rates, changes in estimates of our uncertain tax positions, tax planning opportunities available in the jurisdictions in which we operate and excess tax benefits or deficiencies that arise when the tax consequences of share-based compensation differ from amounts previously recognized in the statements of income. We recognize deferred tax assets and liabilities when there are temporary differences between the financial reporting basis and tax basis of our assets and liabilities and for the expected benefits of using net operating loss carryforwards. When a change in the tax rate or tax law has an impact on deferred taxes, we apply the change based on the years in which the temporary differences are expected to reverse. We record the change in our consolidated financial statements in the period of enactment.
| | | | | | | | |
| Comcast 2024 Annual Report on Form 10-K | 76 | |
The determination of the income tax consequences of a business combination includes identifying the tax basis of assets and liabilities acquired and any contingencies associated with uncertain tax positions assumed or resulting from the business combination. Deferred tax assets and liabilities related to temporary differences of an acquired entity are recorded as of the date of the business combination and are based on our estimate of the ultimate tax basis that will be accepted by the various tax authorities. We record liabilities for contingencies associated with prior tax returns filed by the acquired entity based on criteria set forth in the appropriate accounting guidance. We adjust the deferred tax accounts and the liabilities periodically to reflect any revised estimated tax basis and any estimated settlements with the various tax authorities. The effects of these adjustments are recorded to income tax expense.
From time to time, we engage in transactions in which the tax consequences may be subject to uncertainty. In these cases, we evaluate our tax position using the recognition threshold and the measurement attribute in accordance with the accounting guidance related to uncertain tax positions. Examples of these transactions include business acquisitions and dispositions, including consideration paid or received in connection with these transactions, certain financing transactions, and the allocation of income among state and local tax jurisdictions. Significant judgment is required in assessing and estimating the tax consequences of these transactions. We determine whether it is more likely than not that a tax position will be sustained on examination, including the resolution of any related appeals or litigation processes, based on the technical merits of the position. A tax position that meets the more-likely-than-not recognition threshold is measured to determine the amount of benefit to be recognized in our consolidated financial statements. We classify interest and penalties, if any, associated with our uncertain tax positions as a component of income tax expense (benefit).
| | | | | | | | | | | |
| Components of Net Deferred Tax Liability | | | |
| December 31 (in millions) | 2024 | | 2023 |
| Deferred Tax Assets: | | | |
| Net operating loss and other loss carryforwards | $ | 4,415 | | | $ | 3,530 | |
| Advance on sale of investment (see Note 7) | 2,437 | | | 2,367 | |
| | | |
| Nondeductible accruals and other | 4,232 | | | 4,100 | |
| Less: Valuation allowance | 4,498 | | | 3,679 | |
| | 6,586 | | | 6,318 | |
| Deferred Tax Liabilities: | | | |
| Property and equipment and intangible assets | 28,672 | | | 29,337 | |
| Investments | 934 | | | 1,002 | |
| Debt | 2,055 | | | 1,814 | |
| | | |
| Foreign subsidiaries and undistributed foreign earnings | 43 | | | 59 | |
| | | |
| 31,704 | | | 32,212 | |
| Net deferred tax liability | $ | 25,118 | | | $ | 25,894 | |
| | | | | | | | | | | | | | | | | |
| Changes in our Valuation Allowance for Deferred Tax Assets | | | | | |
| (in millions) | 2024 | | 2023 | | 2022 |
| Beginning balance | $ | 3,679 | | | $ | 3,295 | | | $ | 2,907 | |
| Additions charged to income tax expense and other accounts | 910 | | | 469 | | | 433 | |
| Deductions from reserves | (91) | | | (84) | | | (45) | |
| Ending balance | $ | 4,498 | | | $ | 3,679 | | | $ | 3,295 | |
Changes in our net deferred tax liability in 2024 that were not recorded as deferred income tax expense (benefit) are primarily related to an increase of $124 million associated with items included in other comprehensive income (loss).
As of December 31, 2024, net operating loss and other carryforwards primarily reflects foreign net operating loss carryforwards of $11.8 billion, which primarily relate to our foreign operations in Europe and the majority of which can be carried forward indefinitely. The determination of the realization of the foreign net operating loss carryforwards is dependent on our subsidiaries’ taxable income or loss, redetermination from taxing authorities, and foreign laws that can change from year to year and impact the amount of such carryforwards. We recognize a valuation allowance if we determine it is more likely than not that some portion, or all, of a deferred tax asset will not be realized. As of December 31, 2024 and 2023, our valuation allowance was primarily related to our foreign net operating loss carryforwards.
| | | | | | | | |
| 77 | Comcast 2024 Annual Report on Form 10-K |
During 2024, we completed an internal corporate reorganization related to certain foreign subsidiaries, which resulted in a federal net capital loss of $9.1 billion as of December 31, 2024. This capital loss can be carried back and applied against capital gains recognized on our prior federal income tax returns for 2021 through 2023, and as a result, we recognized an income tax benefit and a corresponding refund receivable of $1.9 billion. Deferred federal income tax has not been recognized on the excess of the financial reporting basis over the tax basis in foreign subsidiaries resulting from the reorganization where indefinite reversal criteria have been met. Any liabilities would be recognized upon a taxable disposition of such subsidiaries; however, the determination of the amount of any unrecognized deferred income tax liabilities is not practicable.
A net current federal tax receivable of $2.0 billion is included in other current assets within our consolidated balance sheet as of December 31, 2024. There were no net current federal tax receivables as of December 31, 2023.
Uncertain Tax Positions
| | | | | | | | | | | | | | | | | |
| Reconciliation of Unrecognized Tax Benefits | | | | | |
| (in millions) | 2024 | | 2023 | | 2022 |
| Gross unrecognized tax benefits, January 1 | $ | 2,593 | | | $ | 2,161 | | | $ | 2,042 | |
| Additions based on tax positions related to the current year | 396 | | | 546 | | | 380 | |
| Additions based on tax positions related to prior years | 201 | | | 1 | | | 56 | |
| | | | | |
| Reductions for tax positions of prior years | (268) | | | (43) | | | (145) | |
| Reductions due to expiration of statutes of limitations | (29) | | | (56) | | | (148) | |
| Settlements with tax authorities and other | (28) | | | (15) | | | (24) | |
| Gross unrecognized tax benefits, December 31 | $ | 2,865 | | | $ | 2,593 | | | $ | 2,161 | |
| | | | | |
| | | | | |
Our gross unrecognized tax benefits include both amounts related to positions for which we have recorded liabilities for potential payment obligations and those for which tax has been assessed and paid. The amounts exclude the federal benefits on state tax positions that were recorded to deferred income taxes. If we were to recognize our gross unrecognized tax benefits in the future, $2.2 billion would impact our effective tax rate and the remaining amount would increase our deferred income tax liability. The amount and timing of the recognition of any such tax benefit is dependent on the completion of examinations of our tax filings by the various tax authorities and the expiration of statutes of limitations. It is reasonably possible that certain tax contests could be resolved within the next 12 months that may result in a decrease in our effective tax rate. Accrued interest and penalties associated with our liability for uncertain tax positions were not material in any period presented.
The IRS has completed its examination of our income tax returns for all years through 2022. Various states are examining our state tax returns and the tax years of those tax returns currently under examination vary by state, with most of the periods relating to tax years 2011 and forward. Various foreign jurisdictions are examining our tax returns and the tax years of those tax returns currently under examination vary by country, with most of the periods relating to tax years 2010 and forward.
| | | | | | | | | | | | | | | | | | | | |
| Debt Outstanding | | | | | | |
| December 31 (in billions) | Weighted-Average Interest Rate as of December 31, 2024 | | Weighted-Average Interest Rate as of December 31, 2023 | | 2024(b) | 2023(b) |
| | | | | | |
| | | | | | |
| Term loans | 3.2 | % | | 3.2 | % | | $ | 3.1 | | $ | 3.1 | |
| Senior notes with maturities of 5 years or less, at face value | 3.4 | % | | 3.5 | % | | 26.7 | | 25.9 | |
| Senior notes with maturities between 5 and 10 years, at face value | 3.6 | % | | 3.3 | % | | 18.1 | | 18.8 | |
| Senior notes with maturities greater than 10 years, at face value | 3.9 | % | | 3.8 | % | | 55.4 | | 53.4 | |
| Finance lease obligations and other | | | | | 1.9 | | 2.0 | |
| Debt issuance costs, premiums, discounts, fair value adjustments for acquisition accounting and hedged positions, net | | | | | (6.0) | | (6.1) | |
| Total debt | 4.1 | % | (a) | 4.0 | % | (a) | 99.1 | | 97.1 | |
| Less: Current portion | | | | | 4.9 | | 2.1 | |
| Noncurrent portion of debt | | | | | $ | 94.2 | | $ | 95.0 | |
(a)Rate represents an effective interest rate and includes the effects of amortization of debt issuance costs, premiums, discounts, fair value adjustments for acquisition accounting and hedged positions, as well as the effects of our derivative financial instruments.
| | | | | | | | |
| Comcast 2024 Annual Report on Form 10-K | 78 | |
(b)As of December 31, 2024, included in our outstanding debt were foreign currency denominated senior notes and term loans with principal amounts of £3.3 billion, €8.5 billion and ¥22.3 billion RMB. As of December 31, 2023, included in our outstanding debt were foreign currency denominated senior notes and term loans with principal amounts of £2.6 billion, €6.7 billion and ¥22.1 billion RMB.
Our senior notes are unsubordinated and unsecured obligations and are subject to parent and/or subsidiary guarantees. As of December 31, 2024 and 2023, substantially all of our debt obligations were fixed-rate debt and our debt had an estimated fair value of $89.8 billion and $92.2 billion, respectively. The estimated fair value of our publicly traded debt was primarily based on Level 1 inputs that use quoted market value for the debt. The estimated fair value of debt for which there are no quoted market prices was based on Level 2 inputs that use interest rates available to us for debt with similar terms and remaining maturities.
| | | | | |
| Principal Maturities of Debt | |
| (in billions) | |
| 2025 | $ | 4.9 | |
| 2026 | $ | 4.9 | |
| 2027 | $ | 5.7 | |
| 2028 | $ | 7.0 | |
| 2029 | $ | 4.8 | |
| Thereafter | $ | 77.7 | |
Revolving Credit Facility and Commercial Paper Program
In May 2024, we entered into a new $11.8 billion revolving credit facility with a syndicate of banks, due May 17, 2029, that may be used for general corporate purposes. We may increase the commitments under the facility up to a total of $14.8 billion, as well as extend the expiration date to no later than May 17, 2031, subject to the approval of the lenders. The interest rate consists of a benchmark rate plus a borrowing margin that is determined based on Comcast’s credit rating. As of December 31, 2024, the borrowing margin for borrowings based on the Adjusted Term SOFR Rate, as defined in the agreement, was 0.875%. The facility requires that we maintain a certain financial ratio based on debt and EBITDA, as defined in the agreement. In connection with our entry into the new credit facility, we terminated our prior credit facility dated as of March 30, 2021.
Our commercial paper program is supported by our revolving credit facility and provides a lower cost source of borrowing to fund short-term working capital requirements.
As of December 31, 2024 and 2023, we had no borrowings outstanding under our revolving credit facility or our commercial paper program. As of December 31, 2024, amounts available under our revolving credit facility, net of amounts outstanding under our commercial paper program and outstanding letters of credit and bank guarantees, totaled $11.8 billion.
Letters of Credit and Bank Guarantees
As of December 31, 2024, we and certain of our subsidiaries had undrawn irrevocable standby letters of credit and bank guarantees totaling $288 million to cover potential fundings under various agreements.
| | | | | | | | |
| 79 | Comcast 2024 Annual Report on Form 10-K |
Derivatives and Hedging
We use financial instruments designated as hedging instruments primarily to manage exposures to (1) foreign exchange rate fluctuations resulting from certain foreign currency denominated debt obligations and intercompany funding arrangements and from the consolidation of our foreign operations; and (2) interest rate risk relating to our debt. Our objective is to manage the financial and operational exposure arising from these risks by offsetting gains and losses on underlying exposures with gains and losses on the instruments used to hedge them.
| | | | | | | | | | | | | | | | | |
| | December 31, 2024 | December 31, 2023 |
| (in billions) | Designation | Notional | Net Derivative Asset (Liability) | Notional | Net Derivative Asset (Liability) |
| Foreign Exchange Risk | | | | | |
| Foreign Currency Denominated Debt | | | | | |
| Cross-currency swaps | Fair value hedge | $ | 1.9 | | $ | (0.1) | | $ | — | | $ | — | |
| Cross-currency swaps | Cash flow hedge | 0.8 | | (0.2) | | 0.8 | | (0.2) | |
| Intercompany Loans | | | | |
| Foreign currency forwards | Fair value hedge | 1.7 | | 0.1 | | 2.0 | | — | |
| Net Investments in Foreign Subsidiaries | | | | | |
Foreign currency denominated debt(a) | Net investment hedge | 7.3 | | | 7.4 | | |
| Cross-currency swaps | Net investment hedge | 1.7 | | 0.4 | | 2.8 | | — | |
| Interest Rate Risk | | | | | |
| Fixed-to-variable interest rate swaps | Fair value hedge | $ | 2.5 | | $ | (0.2) | | $ | 2.5 | | $ | (0.2) | |
(a)Our foreign currency denominated debt designated as net investment hedges are non-derivative instruments and amount shown is the value of debt designated as a hedge.
The fair value of our derivative financial instruments are primarily measured using Level 2 inputs using a market-based approach. Net cash received or paid related to our derivative instruments is classified in our consolidated statements of cash flows based on the objective of the instrument and the classifications of the applicable underlying cash flows.
Changes in the fair value of derivative instruments accounted for as fair value hedges are primarily recorded within earnings and changes in the fair value of cash flow hedges are recorded as a component of accumulated other comprehensive income (loss) until the hedged items affect earnings. The earnings impacts are recorded within the same line item as the item being hedged. The table below summarizes the impact of our hedged foreign currency denominated debt and intercompany loans and the associated derivative contracts on the other income (loss) component of investment and other income (loss).
| | | | | | | | | | | | | | | | | |
| (in billions) | 2024 | | 2023 | | 2022 |
| Foreign currency transaction gains (losses) | $ | — | | | $ | (0.2) | | | $ | (0.6) | |
| Derivative gains (losses) | $ | 0.1 | | | $ | 0.3 | | | $ | 0.6 | |
Transaction gains and losses resulting from currency movements on debt and changes in the fair value of cross-currency swaps designated as net investment hedges are recorded within the currency translation adjustments component of accumulated other comprehensive income (loss). The table below summarizes the amount of pre-tax gains (losses) related to net investment hedges recognized in the cumulative translation adjustments component of other comprehensive income (loss).
| | | | | | | | | | | | | | | | | |
| (in billions) | 2024 | | 2023 | | 2022 |
| Effect of net investment hedges | $ | 0.9 | | | $ | 0.3 | | | $ | (0.4) | |
| | | | | | | | |
| Comcast 2024 Annual Report on Form 10-K | 80 | |
| | |
| Note 7: Investments and Variable Interest Entities |
| | | | | | | | | | | | | | | | | |
| Investment and Other Income (Loss), Net | | | | | |
| Year ended December 31 (in millions) | 2024 | | 2023 | | 2022 |
| Equity in net income (losses) of investees, net | $ | (680) | | | $ | 789 | | | $ | (537) | |
| Realized and unrealized gains (losses) on equity securities, net | (313) | | | (130) | | | (320) | |
| Other income (loss), net | 502 | | | 592 | | | (3) | |
| Investment and other income (loss), net | $ | (490) | | | $ | 1,252 | | | $ | (861) | |
The amount of unrealized gains (losses), net recognized in 2024, 2023 and 2022 that related to marketable and nonmarketable equity securities still held as of the end of each reporting period was $(288) million, $(140) million and $(394) million, respectively.
| | | | | | | | | | | |
| Investments | | | |
| December 31 (in millions) | 2024 | | 2023 |
| Equity method | $ | 7,252 | | | $ | 7,615 | |
| Marketable equity securities | 11 | | | 39 | |
| Nonmarketable equity securities | 1,221 | | | 1,482 | |
| Other investments | 184 | | | 559 | |
| Total investments | 8,668 | | | 9,694 | |
| Less: Current investments | 21 | | | 310 | |
| Noncurrent investments | $ | 8,647 | | | $ | 9,385 | |
Equity Method
We use the equity method to account for investments in which we have the ability to exercise significant influence over the investee’s operating and financial policies, or in which we hold a partnership or limited liability company interest in an entity with specific ownership accounts, unless we have virtually no influence over the investee’s operating and financial policies. Equity method investments are recorded at cost and are adjusted to recognize (1) our share, based on percentage ownership or other contractual basis, of the investee’s net income or loss after the date of investment, (2) amortization of the recorded investment that exceeds our share of the book value of the investee’s net assets, (3) additional contributions made and dividends or other distributions received, and (4) impairments resulting from other-than-temporary declines in fair value. For some investments, we record our share of the investee’s net income or loss one quarter in arrears due to the timing of our receipt of such information. Gains or losses on the sale of equity method investments are recorded to other income (loss), net. If an equity method investee were to issue additional securities that would change our proportionate share of the entity, we would recognize the change, if any, as a gain or loss to other income (loss), net. Cash distributions received from equity method investments are considered returns on investment and are presented within operating activities in the consolidated statements of cash flows to the extent of cumulative equity in net income of the investee. Additional distributions are presented as investing activities. Distributions presented within operating activities totaled $297 million, $217 million and $162 million in 2024, 2023 and 2022, respectively.
Atairos
On January 1, 2016, we established Atairos Group, Inc., a strategic company focused on investing in and operating companies in a range of industries and business sectors, both domestically and internationally. Atairos is controlled by management companies led by our former CFO through interests that carry all of the voting rights. We are the only third-party investor in Atairos.
In November 2020, we amended our agreement with Atairos, which primarily extended the investment term of the agreement from up to 12 years to up to 16.5 years, extended the period in which capital can be recycled to the full investment period and decreased our commitment to fund Atairos from up to $5 billion to up to $4.5 billion in the aggregate at any one time, subject to certain offsets, with the maximum amount of annual capital calls reduced to $400 million, plus certain amounts previously distributed. In addition, we have separately committed to fund Atairos $40 million annually for a management fee, subject to certain adjustments. The management company investors have committed to fund from $50 million to $100 million, with at least $40 million to be funded by our former CFO, subject to his continued role with Atairos. Our economic interests do not carry voting rights and obligate us to absorb approximately 99% of any losses and they provide us the right to receive approximately 86% of any residual returns in Atairos, in either case on a cumulative basis.
| | | | | | | | |
| 81 | Comcast 2024 Annual Report on Form 10-K |
We have concluded that Atairos is a VIE, that we do not have the power to direct the activities that most significantly impact the economic performance of Atairos as we have no voting rights and only certain consent rights, and that we are not a related party with our former CFO or the management companies. We therefore do not consolidate Atairos and account for our investment as an equity method investment. Certain distributions retained by Atairos on our behalf are accounted for as advances and classified within other investments. Atairos may pledge our remaining unfunded capital commitment as security to lenders in connection with certain financing arrangements. This has no effect on our funding commitments. There are no other liquidity arrangements, guarantees or other financial commitments between Comcast and Atairos, and therefore our maximum risk of financial loss is our investment balance and our remaining unfunded capital commitment of $1.4 billion as of December 31, 2024.
Atairos follows investment company accounting and records its investments at their fair values each reporting period with the net gains or losses reflected in its statement of operations. We recognize our share of these gains and losses in equity in net income (losses) of investees, net. In 2024, 2023 and 2022, we made cash capital contributions totaling $73 million, $145 million, and $52 million, respectively, to Atairos. As of December 31, 2024 and 2023, our investment, inclusive of advances classified within other investments, was $5.1 billion and $5.5 billion, respectively.
Hulu and Collateralized Obligation
In 2019, we entered into a series of agreements with The Walt Disney Company and certain of its subsidiaries, whereby we relinquished our board seats and substantially all voting rights associated with our investment in Hulu, and Disney assumed full operational control. Concurrent with these agreements, we also acquired additional ownership interest in Hulu previously held by AT&T. Following these transactions, our interest was approximately 33% and we had the right, but not the obligation, to fund our proportionate share of future equity capital calls. The agreements included put and call provisions regarding our ownership interest in Hulu, pursuant to which, as early as January 2024, we could require Disney to buy, and Disney could require us to sell our interest, in either case, for fair value at that future time subject to a minimum equity value of $27.5 billion for 100% of the equity of Hulu. In the third quarter of 2023, we amended these agreements and agreed, among other things, that the put/call provisions regarding our interest could be exercised in November 2023 (in addition to subsequent periods) and that we would fund our share of prior equity capital calls if the put/call was exercised in November 2023.
In November 2023, we exercised our put right requiring Disney to purchase our interest in Hulu. As a result, in the fourth quarter of 2023, Disney paid us $8.6 billion, representing $9.2 billion for our share of Hulu’s minimum equity value, less $557 million for our share of prior capital calls. Additional proceeds for any excess of the fair value of our interest over the $9.2 billion minimum equity value will be due following final determination of Hulu’s fair value pursuant to a third-party appraisal process. In connection with the transaction, Disney also agreed to share with us 50% of the future tax benefits resulting from the purchase of our interest in Hulu. Because we continue to hold our interest in Hulu, the $9.2 billion payment from Disney is treated as an advance on the sale of our interest, which will be recognized following the finalization of the appraisal process. The receipt of the minimum proceeds resulted in a tax gain in 2023. The recorded value of our investment in Hulu of $883 million and $863 million as of December 31, 2024 and 2023, respectively, continues to reflect our historical cost in applying the equity method, and therefore, is less than its fair value.
In 2019, we entered into a financing arrangement with a syndicate of banks whereby we received proceeds of $5.2 billion under a term loan facility, which was fully collateralized by the minimum guaranteed proceeds of the put/call option related to our investment in Hulu. The term loan was due at the earlier of March 2024 or upon receipt of the proceeds under the put/call provisions and was repaid in the fourth quarter of 2023.
We present the advance on the sale of our investment and the term loan separately in our consolidated balance sheets in the captions “advance on sale of investment” and “collateralized obligation,” respectively.
Marketable Equity Securities
We classify investments with readily determinable fair values that are not accounted for under the equity method as marketable equity securities and the carrying values are primarily presented in other current assets. The changes in fair value of our marketable equity securities between measurement dates are recorded in realized and unrealized gains (losses) on equity securities, net. The fair values of our marketable equity securities are based on Level 1 inputs that use quoted market prices.
| | | | | | | | |
| Comcast 2024 Annual Report on Form 10-K | 82 | |
Nonmarketable Equity Securities
We classify investments without readily determinable fair values that are not accounted for under the equity method as nonmarketable equity securities. The accounting guidance requires nonmarketable equity securities to be recorded at cost and adjusted to fair value at each reporting period. However, the guidance allows for a measurement alternative, which is to record the investments at cost, less impairment, if any, and subsequently adjust for observable price changes of identical or similar investments of the same issuer. We generally apply the measurement alternative, adjusting the investments for observable price changes of identical or similar investments of the same issuer, to our nonmarketable equity securities. When an observable event occurs, we estimate the fair values of our nonmarketable equity securities primarily based on Level 2 inputs that are derived from observable price changes of similar securities adjusted for insignificant differences in rights and obligations. The changes in value are recorded in realized and unrealized gains (losses) on equity securities, net.
Other Investments
Other investments also includes certain short-term instruments with maturities over three months when purchased, such as commercial paper, certificates of deposit and U.S. government obligations, that are generally accounted for at amortized cost. We had no short-term instruments as of December 31, 2024. As of December 31, 2023, these short-term instruments totaled $254 million. The carrying amounts of these investments approximate their fair values, which are primarily based on Level 2 inputs that use interest rates for instruments with similar terms and remaining maturities. Proceeds from short-term instruments in 2024, 2023 and 2022 were $702 million, $560 million and $1.6 billion, respectively. Purchases of short-term instruments in 2024, 2023 and 2022 were $443 million, $506 million and $1.8 billion, respectively.
Impairment Testing of Investments
We review our investment portfolio, other than our marketable equity securities, each reporting period to determine whether there are identified events or circumstances that would indicate there is a decline in the fair value. For our nonpublic investments, if there are no identified events or circumstances that would have a significant adverse effect on the fair value of the investment, then the fair value is not estimated. For our equity method investments, if an investment is deemed to have experienced an other-than-temporary decline below its cost basis, we reduce the carrying amount of the investment to its quoted or estimated fair value, as applicable, and establish a new cost basis for the investment. For our nonmarketable equity securities, we record the impairment to realized and unrealized gains (losses) on equity securities, net. For our equity method investments, we record the impairment to other income (loss), net.
Consolidated Variable Interest Entity
Universal Beijing Resort
In 2018, we entered into an agreement with a consortium of Chinese state-owned companies to build and operate a Universal theme park and resort in Beijing, China (“Universal Beijing Resort”), which opened in September 2021. We own a 30% interest in Universal Beijing Resort and the construction was funded through a combination of debt financing and equity contributions from the partners in accordance with their equity interests. The debt financing, which is being provided by a syndicate of Chinese financial institutions, contains certain covenants and a maximum borrowing limit of ¥29.7 billion RMB (approximately $4.2 billion). The debt financing is secured by the assets of Universal Beijing Resort and the equity interests of the investors. As of December 31, 2024, Universal Beijing Resort had $3.4 billion of debt outstanding, including $3.0 billion principal amount of a term loan outstanding under the debt financing agreement. As of December 31, 2023, Universal Beijing Resort had $3.5 billion of debt outstanding, including $3.1 billion principal amount of a term loan outstanding under the debt financing agreement.
We have concluded that Universal Beijing Resort is a VIE based on its governance structure, and we consolidate it because we have the power to direct activities that most significantly impact its economic performance. There are no liquidity arrangements, guarantees or other financial commitments between us and Universal Beijing Resort, and therefore our maximum risk of financial loss is our 30% interest. Universal Beijing Resort’s results of operations are reported in our Theme Parks segment. Our consolidated statements of cash flows includes the costs of construction and related borrowings in the “construction of Universal Beijing Resort” and “proceeds from borrowings” captions, respectively, and equity contributions from the noncontrolling interests are included in other financing activities.
As of December 31, 2024, our consolidated balance sheets included assets and liabilities of Universal Beijing Resort totaling $7.3 billion and $7.0 billion, respectively. As of December 31, 2023, our consolidated balance sheets included assets and liabilities of Universal Beijing Resort totaling $7.8 billion and $7.2 billion, respectively. The assets and liabilities of Universal Beijing Resort primarily consist of property and equipment, operating lease assets and liabilities, and debt.
| | | | | | | | |
| 83 | Comcast 2024 Annual Report on Form 10-K |
| | |
| Note 8: Property and Equipment |
| | | | | | | | | | | | | | | | | |
| December 31 (in billions) | Weighted-Average
Original Useful Life
as of December 31, 2024 | | 2024 | | 2023 |
| Distribution systems | 11 years | | $ | 47.8 | | | $ | 45.7 | |
| Customer premise equipment | 6 years | | 23.2 | | | 25.0 | |
| Buildings, theme park infrastructure and leasehold improvements | 32 years | | 22.1 | | | 20.9 | |
| Other equipment | 11 years | | 18.1 | | | 17.5 | |
| Construction in process | N/A | | 8.6 | | | 7.1 | |
| Land | N/A | | 2.2 | | | 2.2 | |
| Property and equipment, at cost | | | 122.1 | | | 118.4 | |
| Less: Accumulated depreciation | | | 59.5 | | | 58.7 | |
| Property and equipment, net | | | $ | 62.5 | | | $ | 59.7 | |
| | | | | | | | | | | |
| Property and Equipment by Geographic Location | | | |
| December 31 (in billions) | 2024 | | 2023 |
| United States | $ | 52.6 | | | $ | 48.7 | |
| Other | 10.0 | | | 11.0 | |
| Property and equipment, net | $ | 62.5 | | | $ | 59.7 | |
Property and equipment are stated at cost. We capitalize improvements that extend asset lives and expense repairs and maintenance costs as incurred. We record depreciation using the straight-line method over the asset’s estimated useful life. For assets that are sold or retired, we remove the applicable cost and accumulated depreciation and, unless the gain or loss on disposition is presented separately, we recognize it as a component of depreciation expense. Capital expenditures for the construction of Universal Beijing Resort are presented separately in our consolidated statements of cash flows.
We capitalize the costs associated with the construction of and improvements to our HFC network, including scalable infrastructure and line extensions; costs associated with acquiring and deploying new customer premise equipment; and costs associated with installation of our services, including the customer’s connection to our network, in accordance with the accounting guidance related to cable television companies. Costs capitalized include all direct costs for labor and materials, as well as various indirect costs. Costs incurred in connection with subsequent disconnects, and reconnects of previously deployed customer premise equipment, are expensed as they are incurred.
We evaluate the recoverability of our property and equipment whenever events or substantive changes in circumstances indicate that the carrying amount may not be recoverable. The evaluation is based on the cash flows generated by the underlying asset groups, including estimated future operating results, trends or other determinants of fair value. If the total of the expected future undiscounted cash flows were less than the carrying amount of the asset group, we would recognize an impairment charge to the extent the carrying amount of the asset group exceeded its estimated fair value. Unless presented separately, the impairment charge is included as a component of depreciation expense.
Certain of our cable franchise agreements and lease agreements contain provisions requiring us to restore facilities or remove property in the event that the franchise or lease agreement is not renewed. We expect to continually renew our cable franchise agreements and therefore cannot reasonably estimate liabilities associated with such agreements. A remote possibility exists that franchise agreements could be terminated unexpectedly, which could result in us incurring significant expense in complying with restoration or removal provisions. We do not have any material liabilities related to asset retirement obligations recorded in our consolidated financial statements.
| | | | | | | | |
| Comcast 2024 Annual Report on Form 10-K | 84 | |
| | |
| Note 9: Goodwill and Intangible Assets |
| | | | | | | | | | | | | | | | | | | | | | | | | | | | | | | | | |
| | | | | | | | | | | | |
| (in billions) | Cable
Communications | Residential Connectivity & Platforms | Business Services Connectivity | Media | Studios | Theme
Parks | Sky | | Total | | | | | | |
| Balance, December 31, 2022 | | | | | | | | | | | | | | | |
| Goodwill | $ | 16.2 | | $ | — | | $ | — | | $ | 14.7 | | $ | 3.7 | | $ | 5.8 | | $ | 26.0 | | | $ | 66.4 | | | | | | | |
Accumulated impairment losses(a) | — | | — | | — | | — | | — | | — | | (7.9) | | | (7.9) | | | | | | | |
| $ | 16.2 | | $ | — | | $ | — | | $ | 14.7 | | $ | 3.7 | | $ | 5.8 | | $ | 18.1 | | | $ | 58.5 | | | | | | | |
| Segment change | (16.2) | | 27.4 | | 2.2 | | 4.7 | | — | | — | | (18.1) | | | — | | | | | | | |
| Foreign currency translation and other | — | | 0.8 | | — | | 0.3 | | — | | (0.3) | | — | | | 0.8 | | | | | | | |
| Balance, December 31, 2023 | | | | | | | | | | | | | | | |
| Goodwill | $ | — | | $ | 34.5 | | $ | 2.2 | | $ | 21.9 | | $ | 3.7 | | $ | 5.4 | | $ | — | | | $ | 67.8 | | | | | | | |
Accumulated impairment losses(a) | — | | (6.3) | | — | | (2.2) | | — | | — | | — | | | (8.5) | | | | | | | |
| $ | — | | $ | 28.2 | | $ | 2.2 | | $ | 19.7 | | $ | 3.7 | | $ | 5.4 | | $ | — | | | $ | 59.3 | | | | | | | |
| | | | | | | | | | | | | | | |
| Foreign currency translation and other | — | | (0.4) | | — | | (0.2) | | — | | (0.5) | | — | | | (1.0) | | | | | | | |
| Balance, December 31, 2024 | | | | | | | | | | | | | | | |
| Goodwill | $ | — | | $ | 33.9 | | $ | 2.2 | | $ | 21.7 | | $ | 3.7 | | $ | 5.0 | | $ | — | | | $ | 66.4 | | | | | | | |
Accumulated impairment losses(a) | — | | (6.1) | | — | | (2.2) | | — | | — | | — | | | (8.2) | | | | | | | |
| $ | — | | $ | 27.8 | | $ | 2.2 | | $ | 19.5 | | $ | 3.7 | | $ | 5.0 | | $ | — | | | $ | 58.2 | | | | | | | |
| | | | | | | | | | | | | | | |
| | | | | | | | | | | | | | | |
| | | | | | | | | | | | | | | |
(a) Amounts relate to the 2022 impairment related to Sky, with the 2023 amounts allocated to our new segments on a consistent basis with goodwill. Amounts are impacted by foreign currency translation each period.
Goodwill is calculated as the excess of the consideration transferred over the identifiable net assets acquired in a business combination and represents the future economic benefits expected to arise from anticipated synergies and intangible assets acquired that do not qualify for separate recognition, including increased footprint, assembled workforce, noncontractual relationships and other agreements. We assess the recoverability of our goodwill annually, or more frequently whenever events or substantive changes in circumstances indicate that the carrying amount of a reporting unit may exceed its fair value. We test goodwill for impairment at the reporting unit level. To determine our reporting units, we evaluate the components one level below the segment level and we aggregate the components if they have similar economic characteristics. We evaluate the determination of our reporting units used to test for impairment periodically or whenever events or substantive changes in circumstances occur. The assessment of recoverability may first consider qualitative factors to determine whether the existence of events or circumstances leads to a determination that it is more likely than not that the fair value of a reporting unit is less than its carrying amount. A quantitative assessment is performed if the qualitative assessment results in a more-likely-than-not determination or if a qualitative assessment is not performed. The quantitative assessment considers whether the carrying amount of a reporting unit exceeds its fair value, in which case an impairment charge is recorded to the extent the reporting unit’s carrying value exceeds its fair value. Unless presented separately, the impairment charge is included as a component of amortization expense.
In 2022, we recorded a goodwill impairment of $8.1 billion in our Sky reporting unit. The fair value of the reporting unit was estimated using a discounted cash flow analysis. When performing this analysis, we also considered multiples of earnings from comparable public companies and recent market transactions. The decline in fair value primarily resulted from an increased discount rate and reduced estimated future cash flows as a result of macroeconomic conditions in the Sky territories. The impairment is presented in goodwill and long-lived asset impairments in the consolidated statements of income.
| | | | | | | | |
| 85 | Comcast 2024 Annual Report on Form 10-K |
| | | | | | | | | | | | | | | | | |
| Intangible Assets | | | | | |
| | | 2024 | 2023 |
| December 31 (in billions) | Weighted-Average Original Useful Life as of December 31, 2024 | Gross Carrying Amount | Accumulated Amortization | Gross Carrying Amount | Accumulated Amortization |
| Indefinite-Lived Intangible Assets: | | | | | |
| Franchise rights | N/A | $ | 59.4 | | | $ | 59.4 | | |
| FCC licenses | N/A | 2.8 | | | 2.8 | | |
| Total | | $ | 62.2 | | | $ | 62.2 | | |
| | | | | |
| Finite-Lived Intangible Assets: | | | | | |
| Customer relationships | 13 years | $ | 20.5 | | $ | (15.1) | | $ | 20.8 | | $ | (13.3) | |
| Software | 5 years | 24.9 | | (16.2) | | 23.2 | | (14.8) | |
| Other agreements and rights | 27 years | 11.4 | | (2.7) | | 11.3 | | (2.2) | |
| Total | | $ | 56.8 | | $ | (34.0) | | $ | 55.3 | | $ | (30.3) | |
Indefinite-Lived Intangible Assets
Indefinite-lived intangible assets consist primarily of our cable franchise rights. Our cable franchise rights represent the values we attributed to agreements with state and local authorities that allow access to homes and businesses in cable service areas acquired in business combinations. We do not amortize our cable franchise rights because we have determined that they meet the definition of indefinite-lived intangible assets since there are no legal, regulatory, contractual, competitive, economic or other factors that limit the period over which these rights will contribute to our cash flows. We reassess this determination periodically or whenever events or substantive changes in circumstances occur. The purchase of spectrum rights is presented separately in our consolidated statements of cash flows.
We assess the recoverability of our cable franchise rights and other indefinite-lived intangible assets annually, or more frequently whenever events or substantive changes in circumstances indicate that the assets might be impaired. We evaluate the unit of account used to test for impairment of our cable franchise rights and other indefinite-lived intangible assets periodically or whenever events or substantive changes in circumstances occur to ensure impairment testing is performed at an appropriate level. The assessment of recoverability may first consider qualitative factors to determine whether it is more likely than not that the fair value of an indefinite-lived intangible asset is less than its carrying amount. A quantitative assessment is performed if the qualitative assessment results in a more-likely-than-not determination or if a qualitative assessment is not performed. When performing a quantitative assessment, we estimate the fair value of our cable franchise rights and other indefinite-lived intangible assets. If the fair value of our cable franchise rights or other indefinite-lived intangible assets were less than the carrying amount, we would recognize an impairment charge for the difference between the estimated fair value and the carrying value of the assets. Unless presented separately, the impairment charge is included as a component of amortization expense.
Finite-Lived Intangible Assets
Finite-lived intangible assets are subject to amortization and consist primarily of customer relationships acquired in business combinations, software, trade names and intellectual property rights. Our finite-lived intangible assets are amortized primarily on a straight-line basis over their estimated useful life or the term of the associated agreement.
The table below presents the estimated amortization expense of our customer relationships and other agreements and rights, including trade names and intellectual property rights.
| | | | | |
| Estimated Amortization Expense | |
| (in billions) | |
| 2025 | $ | 3.0 | |
| 2026 | $ | 2.8 | |
| 2027 | $ | 0.6 | |
| 2028 | $ | 0.5 | |
| 2029 | $ | 0.5 | |
| | | | | | | | |
| Comcast 2024 Annual Report on Form 10-K | 86 | |
We capitalize direct development costs associated with internal-use software, including external direct costs of material and services and payroll costs for employees devoting time to these software projects. We also capitalize costs associated with arrangements that constitute the purchase of, or convey a license to, software licenses. We generally amortize them on a straight-line basis over a period not to exceed five years. We expense maintenance and training costs, as well as costs incurred during the preliminary stage of a project, as they are incurred. We capitalize initial operating system software costs and amortize them over the life of the associated hardware.
We evaluate the recoverability of our finite-lived intangible assets whenever events or substantive changes in circumstances indicate that the carrying amount may not be recoverable. The evaluation is based on the cash flows generated by the underlying asset groups, including estimated future operating results, trends or other determinants of fair value. If the total of the expected future undiscounted cash flows were less than the carrying amount of the asset group, we would recognize an impairment charge to the extent the carrying amount of the asset group exceeded its estimated fair value. Unless presented separately, the impairment charge is included as a component of amortization expense.
In 2022, in connection with our annual goodwill impairment assessment, we also recorded impairments of intangible assets, which primarily related to customer relationship assets resulting from our Sky acquisition. These impairments totaled $485 million and are presented in goodwill and long-lived asset impairments in the consolidated statements of income.
| | |
| Note 10: Employee Benefit Plans |
Deferred Compensation Plans
| | | | | | | | | | | |
| As of and for the year ended December 31 (in millions) | 2024 | 2023 | 2022 |
| Benefit obligation | $ | 4,812 | | $ | 4,507 | | $ | 4,158 | |
| Interest expense | $ | 370 | | $ | 341 | | $ | 272 | |
We maintain unfunded, nonqualified deferred compensation plans for certain members of management and nonemployee directors. The amount of compensation deferred by each participant is based on participant elections. Participant accounts are credited with income primarily based on a fixed annual rate. Participants are eligible to receive distributions from their account based on elected deferral periods that are consistent with the plans and applicable tax law.
We have purchased life insurance policies to recover a portion of the future payments related to our deferred compensation plans. As of December 31, 2024 and 2023, the cash surrender value of these policies, which is recorded to other noncurrent assets, net, was $566 million and $512 million, respectively.
Pension and Postretirement Benefit Plans
We sponsor several 401(k) defined contribution retirement plans that allow eligible employees to contribute a portion of their compensation through payroll deductions in accordance with specified plan guidelines. We make contributions to the plans that include matching a percentage of the employees’ contributions up to certain limits. In 2024, 2023 and 2022, expenses related to these plans totaled $661 million, $650 million and $632 million, respectively.
We participate in various multiemployer benefit plans, including pension and postretirement benefit plans, that cover some of our employees and temporary employees who are represented by labor unions. We also participate in other multiemployer benefit plans that provide health and welfare and retirement savings benefits to active and retired participants. If we cease to be obligated to make contributions or were to otherwise withdraw from participation in any of these plans, applicable law would require us to fund our allocable share of the unfunded vested benefits, which is known as a withdrawal liability. In addition, actions taken by other participating employers may lead to adverse changes in the financial condition of one of these plans, which could result in an increase in our withdrawal liability. Total contributions we made to multiemployer benefit plans and any potential withdrawal liabilities were not material in any of the periods presented.
| | | | | | | | |
| 87 | Comcast 2024 Annual Report on Form 10-K |
Common Stock
In the aggregate, holders of our Class A common stock have 662/3% of the voting power of our common stock and holders of our Class B common stock have 331/3% of the voting power of our common stock, which percentage is generally non-dilutable under the terms of our articles of incorporation. Each share of our Class B common stock is entitled to 15 votes. The number of votes held by each share of our Class A common stock depends on the number of shares of Class A and Class B common stock outstanding at any given time. The 331/3% aggregate voting power of our Class B common stock cannot be diluted by additional issuances of any other class of common stock. Our Class B common stock is convertible, share for share, into Class A common stock, subject to certain restrictions.
We present excise tax payments related to repurchases of common stock within repurchases of common stock under repurchase program and employee plans in the consolidated statements of cash flows.
| | | | | | | | | | | | | |
| Shares of Common Stock Outstanding | | | | | |
| (in millions) | Class A | | | | Class B |
| Balance, December 31, 2021 | 4,524 | | | | | 9 | |
| Stock compensation plans | 12 | | | | | — | |
| Repurchases and retirements of common stock | (332) | | | | | — | |
| Employee stock purchase plans | 7 | | | | | — | |
| | | | | |
| | | | | |
| Balance, December 31, 2022 | 4,211 | | | | | 9 | |
| Stock compensation plans | 14 | | | | | — | |
| Repurchases and retirements of common stock | (262) | | | | | — | |
| Employee stock purchase plans | 7 | | | | | — | |
| Balance, December 31, 2023 | 3,969 | | | | | 9 | |
| Stock compensation plans | 14 | | | | | — | |
| Repurchases and retirements of common stock | (212) | | | | | — | |
| Employee stock purchase plans | 6 | | | | | — | |
| Balance, December 31, 2024 | 3,778 | | | | | 9 | |
| | | | | | | | | | | | |
| Weighted-Average Common Shares Outstanding | | | | |
| Year ended December 31 (in millions) | 2024 | 2023 | 2022 | |
| Weighted-average number of common shares outstanding – basic | 3,885 | | 4,122 | | 4,406 | | |
| Effect of dilutive securities | 24 | | 25 | | 24 | | |
Weighted-average number of common shares outstanding – diluted | 3,908 | | 4,148 | | 4,430 | | |
| Antidilutive securities | 184 | | 169 | | 176 | | |
Weighted-average common shares outstanding used in calculating diluted earnings per common share attributable to Comcast Corporation shareholders (“diluted EPS”) considers the impact of potentially dilutive securities using the treasury stock method. Our potentially dilutive securities include potential common shares related to our stock options and our restricted share units (“RSUs”). Diluted EPS excludes the impact of potential common shares related to our stock options in periods in which the combination of the option exercise price and the associated unrecognized compensation expense is greater than the average market price of our common stock. Antidilutive securities represent the number of potential common shares related to share-based compensation awards that were excluded from diluted EPS because their effect would have been antidilutive.
| | | | | | | | | | | |
| Accumulated Other Comprehensive Income (Loss) | | | |
| December 31 (in millions) | 2024 | | 2023 |
| Cumulative translation adjustments | $ | (2,474) | | | $ | (1,596) | |
| | | |
| Deferred gains (losses) on cash flow hedges | 106 | | | 49 | |
| Unrecognized gains (losses) on employee benefit obligations and other | 325 | | | 293 | |
| | | |
| | | |
| Accumulated other comprehensive income (loss), net of deferred taxes | $ | (2,043) | | | $ | (1,253) | |
| | | | | | | | |
| Comcast 2024 Annual Report on Form 10-K | 88 | |
| | |
| Note 12: Share-Based Compensation |
| | | | | | | | | | | | | | | | | |
| | | | | |
| Year ended December 31 (in millions) | 2024 | | 2023 | | 2022 |
| Share-based compensation expense | $ | 1,069 | | | $ | 1,021 | | | $ | 1,100 | |
| Related income tax benefit | $ | 222 | | | $ | 203 | | | $ | 248 | |
Our share-based compensation plans consist primarily of awards of RSUs and stock options to certain employees and directors as part of our long-term incentive compensation structure. Awards generally vest over a period of 5 years and, in the case of stock options, have a 10 year term. RSUs include performance stock units awarded to certain senior executives with vesting after 3 years based upon the achievement of certain performance conditions. These performance stock units are not material to our consolidated results of operations in any period presented. As of December 31, 2024, virtually all of our stock options outstanding were net settled stock options, which result in fewer shares being issued and no cash proceeds being received by us when the options are exercised. Additionally, eligible employees may purchase shares of our common stock at a discount under our employee stock purchase plans.
| | | | | | | | | | | |
| Stock Options and Restricted Share Units | | | |
| As of December 31, 2024, unless otherwise stated (in millions, except per share data) | Stock
Options | | RSUs |
| Awards granted during 2024 | 4 | | | 35 | |
| Weighted-average exercise price of awards granted during 2024 | $ | 40.72 | | | |
| Stock options outstanding and unvested RSUs | 224 | | | 62 | |
| Weighted-average exercise price of stock options outstanding | $ | 41.70 | | | |
| Weighted-average fair value at grant date of unvested RSUs | | | $ | 42.11 | |
The cost associated with our share-based compensation is based on an award’s estimated fair value at the date of grant and is recognized over the period in which any related services are provided. RSUs are primarily valued based on the closing price of our common stock on the date of grant and are discounted for the lack of dividends, if any, during the vesting period. We use the Black-Scholes option pricing model to estimate the fair value of stock option awards.
The table below presents the weighted-average fair value on the date of grant of RSUs and stock options awarded under our various plans and the related weighted-average valuation assumptions.
| | | | | | | | | | | | | | | | | |
| Year ended December 31 | 2024 | | 2023 | | 2022 |
| RSUs fair value | $ | 42.23 | | | $ | 37.14 | | | $ | 45.20 | |
| Stock options fair value | $ | 9.93 | | | $ | 8.41 | | | $ | 8.77 | |
| Stock Option Valuation Assumptions: | | | | | |
| Dividend yield | 2.9 | % | | 3.2 | % | | 2.4 | % |
| Expected volatility | 24.8 | % | | 26.2 | % | | 25.0 | % |
| Risk-free interest rate | 4.2 | % | | 4.2 | % | | 1.8 | % |
| Expected option life (in years) | 5.1 | | 5.9 | | 5.8 |
As of December 31, 2024, we had unrecognized pretax compensation expense of $2.1 billion related to unvested RSUs and unvested stock options that will be recognized over a weighted-average period of approximately 1.6 years.
| | | | | | | | |
| 89 | Comcast 2024 Annual Report on Form 10-K |
| | |
| Note 13: Supplemental Financial Information |
| | | | | | | | | | | |
| Cash Payments for Interest and Income Taxes | | | |
| Year ended December 31 (in millions) | 2024 | 2023 | 2022 |
| Interest | $ | 3,657 | | $ | 3,711 | | $ | 3,413 | |
Income taxes(a)(b) | $ | 7,096 | | $ | 5,107 | | $ | 5,265 | |
(a) Cash payments for income taxes in 2024 includes $1.7 billion related to the purchase of third-party transferable tax credits.(b) Changes in other operating assets and liabilities in the consolidated statements of cash flows included an increase in current tax receivables and a decrease in current taxes payable for the year ended December 31, 2024, and an increase in current taxes payable for the year ended December 31, 2023. See Notes 5 and 7.
Noncash Activities
During 2024:
•we acquired $2.8 billion of property and equipment and intangible assets that were accrued but unpaid
•we recorded a liability of $1.2 billion for a quarterly cash dividend of $0.31 per common share paid in January 2025
During 2023:
•we acquired $2.1 billion of property and equipment and intangible assets that were accrued but unpaid
•we recorded a liability of $1.2 billion for a quarterly cash dividend of $0.29 per common share paid in January 2024
During 2022:
•we acquired $2.0 billion of property and equipment and intangible assets that were accrued but unpaid
•we recorded a liability of $1.1 billion for a quarterly cash dividend of $0.27 per common share paid in January 2023
Cash, Cash Equivalents and Restricted Cash
The following table provides a reconciliation of cash, cash equivalents and restricted cash reported in the consolidated balance sheets to the total of the amounts reported in our consolidated statements of cash flows.
| | | | | | | | |
| December 31 (in millions) | 2024 | 2023 |
| Cash and cash equivalents | $ | 7,322 | | $ | 6,215 | |
| Restricted cash included in other current assets and other noncurrent assets, net | 55 | | 67 | |
| Cash, cash equivalents and restricted cash, end of year | $ | 7,377 | | $ | 6,282 | |
Our cash equivalents consist primarily of money market funds and U.S. government obligations, as well as commercial paper and certificates of deposit with maturities of three months or less when purchased. The carrying amounts of our cash equivalents approximate their fair values, which are primarily based on Level 1 inputs.
| | |
| Note 14: Commitments and Contingencies |
Licensed Content
We have significant fixed-price purchase obligations related to long-term agreements for licensed content. Refer to Note 4 for additional information.
Leases
Our leases consist primarily of real estate, vehicles and other equipment. We determine if an arrangement is a lease at inception. Lease assets and liabilities are recognized upon commencement of the lease based on the present value of the future minimum lease payments over the lease term. The lease term includes options to extend the lease when it is reasonably certain that we will exercise that option. We generally use our incremental borrowing rate based on information available at the commencement of the lease in determining the present value of future payments. The lease asset also includes any lease payments made and initial direct costs incurred and excludes lease incentives. Lease assets and liabilities are not recorded for leases with an initial term of one year or less.
| | | | | | | | |
| Comcast 2024 Annual Report on Form 10-K | 90 | |
For our operating leases recorded in the balance sheets, lease expense is based on the future minimum lease payments recognized on a straight-line basis over the term of the lease plus any variable lease costs. In 2024, 2023 and 2022, operating lease expenses, inclusive of short-term and variable lease expenses, recognized in our consolidated statements of income were each $1.2 billion.
| | | | | | | | | | | |
| Operating Lease Assets and Liabilities Recorded in our Consolidated Balance Sheet |
| December 31 (in millions) | 2024 | | 2023 |
| Other noncurrent assets, net | $ | 5,524 | | | $ | 5,786 | |
| Accrued expenses and other current liabilities | $ | 751 | | | $ | 748 | |
| Other noncurrent liabilities | $ | 5,569 | | | $ | 5,838 | |
| | | | | | |
| Future Minimum Lease Commitments for Operating Leases | | |
| (in millions) | | December 31,
2024 |
| 2025 | | $ | 965 | |
| 2026 | | 896 | |
| 2027 | | 787 | |
| 2028 | | 624 | |
| 2029 | | 406 | |
| Thereafter | | 6,163 | |
| Total future minimum lease payments | | 9,840 | |
| Less: imputed interest | | (3,521) | |
| Total liability | | $ | 6,319 | |
The weighted-average remaining lease terms for operating leases and the weighted-average discount rates used to calculate our operating lease liabilities as of December 31, 2024 were 17 years and 4.2%, respectively, and as of December 31, 2023 were 17 years and 4.1%, respectively.
In 2024, 2023 and 2022, cash payments for operating leases recorded in the consolidated balance sheets were $1.0 billion, $963 million and $965 million, respectively. Lease assets and liabilities associated with operating leases entered into or modified were not material in any period presented.
Contractual Obligation
We are party to a contractual obligation that involves an interest held by a third party in the revenue of certain theme parks. The arrangement provides the counterparty with the right to periodic payments associated with current period revenue which are recorded as an operating expense, and beginning in June 2017, the option to require NBCUniversal to purchase the interest for cash in an amount based on a contractual formula. The contractual formula is based on an average of specified historical theme park revenue at the time of exercise, which amount could be significantly higher than our carrying value. As of December 31, 2024, our carrying value was $1.1 billion, and the estimated value of the contractual obligation was $1.8 billion based on inputs to the contractual formula as of that date.
Contingencies
We are subject to legal proceedings and claims that arise in the ordinary course of our business. While the amount of ultimate liability with respect to such proceedings and claims is not expected to materially affect our results of operations, cash flows or financial position, any such legal proceedings or claims could be time-consuming and injure our reputation.
| | | | | | | | |
| 91 | Comcast 2024 Annual Report on Form 10-K |
Item 9: Changes in and Disagreements with Accountants on Accounting and Financial Disclosure
None.
Item 9A: Controls and Procedures
Conclusions regarding disclosure controls and procedures
Our principal executive and principal financial officers, after evaluating the effectiveness of our disclosure controls and procedures (as defined in Exchange Act Rules 13a-15(e) and 15d-15(e)) as of the end of the period covered by this report, have concluded that, based on the evaluation of these controls and procedures required by paragraph (b) of Exchange Act Rules 13a-15 or 15d-15, such disclosure controls and procedures were effective.
Management’s annual report on internal control over financial reporting
Refer to Management’s Report on Internal Control Over Financial Reporting on page 57.
Attestation report of the registered public accounting firm
Refer to Report of Independent Registered Public Accounting Firm on page 58.
Changes in internal control over financial reporting
There were no changes in internal control over financial reporting identified in connection with the evaluation required by paragraph (d) of Exchange Act Rules 13a-15 or 15d-15 that occurred during the last fiscal quarter that have materially affected, or are reasonably likely to materially affect, our internal control over financial reporting.
Item 9B: Other Information
On January 28, 2025, the Company’s Board of Directors adopted Amended and Restated Bylaws of the Company, effective immediately. The Amended and Restated Bylaws were amended to specify that proposals of business that would have an adverse effect on the rights, powers or preferences of a class of capital stock that require consent of one or more classes of stock in order to be effected may be made only by the Board or holder(s) of any class of capital stock that would be adversely affected. The Amended and Restated Bylaws also incorporate other minor clean-up and conforming changes. The foregoing description is qualified in its entirety by reference to the Amended and Restated Bylaws, which are filed as Exhibit 3.2 to this Annual Report on Form 10-K and incorporated herein by reference.
Item 9C: Disclosure Regarding Foreign Jurisdictions that Prevent Inspections
Not applicable.
| | | | | | | | |
| Comcast 2024 Annual Report on Form 10-K | 92 | |
Part III
Item 10: Directors, Executive Officers and Corporate Governance
Except for the information regarding executive officers required by Item 401 of Regulation S-K, we incorporate the information required by this item by reference to our definitive proxy statement for our annual meeting of shareholders. We refer to this proxy statement as the 2025 Proxy Statement.
The term of office of each of our executive officers continues until his successor is selected and qualified or until his earlier death, resignation or removal. The following table sets forth information concerning our executive officers, including their ages, positions and tenure, as of the date hereof.
| | | | | | | | | | | |
| Name | Age | Officer Since | Position with Comcast |
| Brian L. Roberts | 65 | 1986 | Chairman and Chief Executive Officer |
| Michael J. Cavanagh | 59 | 2015 | President |
| Jason S. Armstrong | 48 | 2023 | Chief Financial Officer |
| Jennifer Khoury | 51 | 2023 | Chief Communications Officer |
| Daniel C. Murdock | 51 | 2017 | Executive Vice President; Chief Accounting Officer and Controller |
| Thomas J. Reid | 60 | 2019 | Chief Legal Officer and Secretary |
Brian L. Roberts has served as a director and as Chairman of the Board and Chief Executive Officer for more than five years. Mr. Roberts previously served as President until October 2022. As of December 31, 2024, Mr. Roberts had sole voting power over approximately 331/3% of the combined voting power of our two classes of common stock. He is a son of our late founder, Mr. Ralph J. Roberts.
Michael J. Cavanagh has served as President since October 2022 and Chief Financial Officer between July 2015 and January 2023. Prior to joining our company, Mr. Cavanagh had been Co-President and Co-Chief Operating Officer for The Carlyle Group, a global investment firm, since 2014. Prior to that, Mr. Cavanagh was the Co-Chief Executive Officer of the Corporate & Investment Bank of JPMorgan Chase & Co. from 2012 until 2014; the Chief Executive Officer of JPMorgan Chase & Co.’s Treasury & Securities Services business from 2010 to 2012; and the Chief Financial Officer of JPMorgan Chase & Co. from 2004 to 2010.
Jason S. Armstrong has served as Chief Financial Officer since January 2023. He previously served as Treasurer between July 2020 and October 2023 and as Deputy Chief Financial Officer between January 2022 and January 2023, and held various other senior positions since joining our company in 2014, including as Chief Financial Officer of Sky Limited and as Senior Vice President of Investor Relations. Prior to that, Mr. Armstrong spent 14 years at Goldman Sachs & Co. LLC where he most recently served as Managing Director, Deputy Business Unit Leader of the firm’s Technology, Media and Telecommunications Research Group.
Jennifer Khoury has served as Chief Communications Officer since February 2020. She had held various other senior positions since joining our company in 1999, including Senior Vice President of Corporate and Digital Communications, leading communications for Comcast Cable and the corporation’s digital and social media. Previously, Ms. Khoury led communications, public affairs and social responsibility programs and campaigns for AT&T Broadband and MediaOne and served as a strategic consultant for ML Strategies, LLC.
Daniel C. Murdock has served as an Executive Vice President since March 2020, Chief Accounting Officer since March 2017 and Controller since July 2015. Prior to joining our company, Mr. Murdock had been with the U.S. Securities and Exchange Commission where he served as the Deputy Chief Accountant in the agency’s Office of the Chief Accountant since 2013. Prior to that, he was Deloitte & Touche’s Audit/Industry Professional Practice Director for media and entertainment.
Thomas J. Reid has served as Chief Legal Officer and Secretary since April 2019. Prior to joining our company, Mr. Reid had served as the Chairman and Managing Partner of Davis Polk & Wardwell LLP, a global law firm, since 2011. Prior to that, Mr. Reid was a partner at Davis Polk & Wardwell LLP from 2003 to 2011 and a Managing Director in the Investment Banking Division of Morgan Stanley from 2000 to 2003.
Item 11: Executive Compensation
We incorporate the information required by this item by reference to our 2025 Proxy Statement.
| | | | | | | | |
| 93 | Comcast 2024 Annual Report on Form 10-K |
Item 12: Security Ownership of Certain Beneficial Owners and Management and Related Stockholder Matters
We incorporate the information required by this item by reference to our 2025 Proxy Statement.
Item 13: Certain Relationships and Related Transactions, and Director Independence
We incorporate the information required by this item by reference to our 2025 Proxy Statement.
Item 14: Principal Accountant Fees and Services
We incorporate the information required by this item relating to our principal accountant, Deloitte & Touche LLP (PCAOB ID No. 34), by reference to our 2025 Proxy Statement.
| | | | | | | | |
| Comcast 2024 Annual Report on Form 10-K | 94 | |
Part IV
Item 15: Exhibits and Financial Statement Schedules
(a) Our consolidated financial statements are filed as a part of this report on Form 10-K in Item 8, Financial Statements and Supplementary Data, and a list of Comcast’s consolidated financial statements are found on page 56 of this report. Financial statement schedules are omitted because the required information is not applicable, or because the information required is included in the consolidated financial statements and notes thereto.
(b) Exhibits required to be filed by Item 601 of Regulation S-K (all of which are under Commission File No. 001-32871, except as otherwise noted):
| | | | | | | | |
| | Amended and Restated Articles of Incorporation of Comcast Corporation (incorporated by reference to Exhibit 3.1 to Comcast’s Current Report on Form 8-K filed on December 15, 2015). |
| |
| | Certificate of a Change of Registered Office Provider (incorporated by reference to Exhibit 3.1.1 to Comcast’s Annual Report on Form 10-K for the year ended December 31, 2023). |
| | |
| | Amended and Restated By-Laws of Comcast Corporation. |
| |
| | Specimen Class A Common Stock Certificate (incorporated by reference to Exhibit 4.1 to Comcast’s Annual Report on Form 10-K for the year ended December 31, 2002). |
| |
| | Indenture, dated January 7, 2003, between Comcast Corporation, the subsidiary guarantor party thereto, and The Bank of New York Mellon (f/k/a The Bank of New York), as trustee (incorporated by reference to Exhibit 4.4 to Comcast’s Annual Report on Form 10-K for the year ended December 31, 2008). |
| |
| | First Supplemental Indenture, dated March 25, 2003, to the Indenture between Comcast Corporation, the subsidiary guarantors party thereto, and The Bank of New York Mellon (f/k/a The Bank of New York), as trustee, dated January 7, 2003 (incorporated by reference to Exhibit 4.5 to Comcast’s Annual Report on Form 10-K for the year ended December 31, 2008). |
| | |
| | Second Supplemental Indenture, dated August 31, 2009, to the Indenture between Comcast Corporation, the subsidiary guarantors party thereto, and The Bank of New York Mellon, as Trustee, dated January 7, 2003, as supplemented by a First Supplemental Indenture dated March 25, 2003 (incorporated by reference to Exhibit 4.1 to Comcast’s Current Report on Form 8-K filed on September 2, 2009). |
| |
| | Third Supplemental Indenture, dated March 27, 2013, to the Indenture between Comcast Corporation, the subsidiary guarantors party thereto, and The Bank of New York Mellon (f/k/a The Bank of New York), as trustee, dated January 7, 2003, as supplemented by a First Supplemental Indenture dated March 25, 2003 and a second Supplemental Indenture dated August 31, 2009 (incorporated by reference to Exhibit 4.4 to Comcast’s Quarterly Report on Form 10-Q for the quarter ended March 31, 2013). |
| |
| | Fourth Supplemental Indenture, dated October 1, 2015, to the Indenture dated January 7, 2003 between Comcast Corporation, the subsidiary guarantors party thereto, and The Bank of New York Mellon (f/k/a The Bank of New York), as trustee, as supplemented by a First Supplemental Indenture dated March 25, 2003, a second Supplemental Indenture dated August 31, 2009 and a Third Supplemental Indenture dated March 27, 2013 (incorporated by reference to Exhibit 4.1 to Comcast’s Quarterly Report on Form 10-Q for the quarter ended September 30, 2015). |
| | |
| | Senior Indenture dated September 18, 2013, among Comcast Corporation, the guarantors party thereto and The Bank of New York Mellon, as trustee (incorporated by reference to Exhibit 4.3 to Comcast’s Registration Statement on Form S-3 filed September 18, 2013). |
| |
| | First Supplemental Indenture dated as of November 17, 2015, to the Senior Indenture dated September 18, 2013, among Comcast Corporation, the guarantors party thereto, and The Bank of New York Mellon, as trustee (incorporated by reference to Exhibit 4.4 to Post Effective Amendment No. 2 to Comcast’s Registration Statement on Form S-3 filed November 23, 2015). |
| | |
| | Second Supplemental Indenture dated as of July 29, 2022, to the Senior Indenture dated September 18, 2013, among Comcast Corporation, the guarantors party thereto, and The Bank of New York Mellon, as trustee, as supplemented by a First Supplemental Indenture dated November 17, 2015 (incorporated by reference to Exhibit 4.4 to Comcast’s Registration Statement on Form S-3 filed July 29, 2022). |
| |
| | Indenture, dated as of April 30, 2010, between NBC Universal, Inc. (n/k/a NBCUniversal Media, LLC) and The Bank of New York Mellon, as trustee (incorporated by reference to Exhibit 4 to the Registration Statement on Form S-4 of NBCUniversal Media, LLC (Commission File No. 333-174175) filed on May 13, 2011). |
| | |
| | | | | | | | |
| 95 | Comcast 2024 Annual Report on Form 10-K |
| | | | | | | | |
| | First Supplemental Indenture, dated March 27, 2013, to the Indenture between NBCUniversal Media, LLC (f/k/a NBC Universal, Inc.) and The Bank of New York Mellon, as trustee, dated April 30, 2010 (incorporated by reference to Exhibit 4.3 to Comcast’s Quarterly Report on Form 10-Q for the quarter ended March 31, 2013). |
| | |
| | Second Supplemental Indenture, dated October 1, 2015, to the Indenture dated April 30, 2010 between NBC Universal, Inc. (n/k/a NBCUniversal Media, LLC) and The Bank of New York Mellon, as trustee, as supplemented by a First Supplemental Indenture dated March 27, 2013 (incorporated by reference to Exhibit 4.2 to Comcast’s Quarterly Report on Form 10-Q for the quarter ended September 30, 2015). |
| | |
| | Trust Deed dated September 5, 2014 among BSKYB Finance UK plc, British Sky Broadcasting Group plc, the initial guarantors party thereto and BNY Mellon Corporate Trustee Services Limited, as trustee (incorporated by reference to Exhibit 4.13 to Comcast’s Annual Report on Form 10-K for the year ended December 31, 2018). |
| | |
| | Supplemental Trust Deed dated March 18, 2015 among Sky Group Finance plc (f/k/a BSKYB Finance UK plc), Sky plc (f/k/a British Sky Broadcasting Group plc), the initial guarantors party thereto and BNY Mellon Corporate Trustee Services Limited, as trustee (incorporated by reference to Exhibit 4.14 to Comcast’s Annual Report on Form 10-K for the year ended December 31, 2018). |
| | |
| | Description of Comcast Corporation’s securities registered pursuant to Section 12 of the Securities Exchange Act. |
| | |
| | Certain instruments defining the rights of holders of long-term obligation of the registrant and certain of its subsidiaries (the total amount of securities authorized under each of which does not exceed ten percent of the total assets of the registrant and its subsidiaries on a consolidated basis), are omitted pursuant to Item 601(b)(4)(iii)(A) of Regulation S-K. We agree to furnish copies of any such instruments to the SEC upon request. |
| | |
| | Credit Agreement dated as of May 17, 2024, among Comcast Corporation, the financial institutions party thereto, JPMorgan Chase Bank, N.A., as administrative agent, Citibank, N.A., as syndication agent, and Bank of America, N.A., Barclays Bank PLC, Mizuho Bank, Ltd., Morgan Stanley MUFG Partners, LLC and Wells Fargo Bank, National Association, as co-documentation agents (incorporated by reference to Exhibit 10.1 to Comcast’s Current Report on Form 8-K filed on May 17, 2024). |
| | |
| | Comcast Select Deferred Compensation Plan, as amended and restated effective October 12, 2021 (incorporated by reference to Exhibit 10.3 to Comcast’s Annual Report on Form 10-K for the year ended December 31, 2021). |
| | |
| | Comcast Corporation 2003 Stock Option Plan, as amended and restated April 10, 2020 (incorporated by reference to Exhibit 10.4 to Comcast’s Quarterly Report on Form 10-Q for the quarter ended March 31, 2020). |
| |
| | Comcast Corporation 2002 Deferred Compensation Plan, as amended and restated effective March 1, 2021 (incorporated by reference to Exhibit 10.2 to Comcast’s Quarterly Report on Form 10-Q for the quarter ended March 31, 2021). |
| |
| | Comcast Corporation 2005 Deferred Compensation Plan, as amended and restated effective May 14, 2024. |
| | |
| | Comcast Corporation 2002 Restricted Stock Plan, as amended and restated effective May 14, 2024. |
| |
| | Comcast Corporation 2006 Cash Bonus Plan, as amended and restated effective February 18, 2015 (incorporated by reference to Exhibit 10.11 to Comcast’s Annual Report on Form 10-K for the year ended December 31, 2015). |
| |
| | Comcast Corporation Non-Employee Director Compensation Plan, as amended and restated effective July 11, 2023 (incorporated by reference to Exhibit 10.3 to Comcast’s Quarterly Report on Form 10-Q for the quarter ended June 30, 2023). |
| | |
| | Comcast Corporation 2002 Employee Stock Purchase Plan, as amended and restated effective May 14, 2024. |
| |
| | Comcast-NBCUniversal 2011 Employee Stock Purchase Plan, as amended and restated effective May 14, 2024. |
| |
| | Comcast Corporation 2023 Omnibus Equity Incentive Plan, effective June 7, 2023 (incorporated by reference to Exhibit 10.1 to Comcast’s Current Report on Form 8-K filed on June 9, 2023). |
| | |
| | Employment Agreement with Brian L. Roberts, dated as of July 26, 2017 (incorporated by reference to Exhibit 10.2 to Comcast’s Quarterly Report on Form 10-Q for the quarter ended June 30, 2017). |
| | |
| | Amendment No. 1 to Employment Agreement with Brian L. Roberts, dated as of December 16, 2019 (incorporated by reference to Exhibit 10.20 to Comcast’s Annual Report on Form 10-K for the year ended December 31, 2019). |
| | |
| | Employment Agreement dated as of December 27, 2022 between Comcast Corporation and Michael J. Cavanagh (incorporated by reference to Exhibit 10.15 to Comcast’s Annual Report on Form 10-K for the year ended December 31, 2022). |
| | |
| | | | | | | | |
| Comcast 2024 Annual Report on Form 10-K | 96 | |
| | | | | | | | |
| | Employment Agreement dated as of January 6, 2023 between Comcast Corporation and Jason S. Armstrong (incorporated by reference to Exhibit 10.16 to Comcast’s Annual Report on Form 10-K for the year ended December 31, 2022). |
| | |
| | Employment Agreement between Comcast Corporation and Jennifer Khoury, dated as of December 31, 2022 (incorporated by reference to Exhibit 10.2 to Comcast’s Quarterly Report on Form 10-Q for the quarter ended June 30, 2024). |
| | |
| | Employment Agreement between Comcast Corporation and Thomas J. Reid, dated as of April 17, 2024 (incorporated by reference to Exhibit 10.3 to Comcast’s Quarterly Report on Form 10-Q for the quarter ended June 30, 2024). |
| | |
| | Form of Non-Qualified Stock Option and Long-Term Incentive Awards Summary Schedule under the Comcast Corporation 2003 Stock Option Plan. |
| | |
| | Form of Non-Qualified Stock Option and Long-Term Incentive Awards Summary Schedule under the Comcast Corporation 2023 Omnibus Equity Incentive Plan. |
| | |
| | Form of Performance-Based Restricted Stock Unit Award and Long-Term Incentive Awards Summary Schedule under the Comcast Corporation 2002 Restricted Stock Plan (incorporated by reference to Exhibit 10.37 to Comcast’s Annual Report on Form 10-K for the year ended December 31, 2020). |
| | |
| | Form of Performance-Based Stock Option Award (incorporated by reference to Exhibit 10.24 to Comcast’s Annual Report on Form 10-K for the year ended December 31, 2022). |
| | |
| | Form of Performance-Based Restricted Stock Unit Award and Long-Term Incentive Awards Summary Schedule. |
| | |
| | Form of Time-Based Restricted Stock Unit Award. |
| | |
| | Form of Airplane Time Sharing Agreement (incorporated by reference to Exhibit 10.60 to Comcast’s Annual Report on Form 10-K for the year ended December 31, 2014). |
| |
| | Form of Director Indemnification Agreement (incorporated by reference to Exhibit 10.3 to Comcast’s Quarterly Report on Form 10-Q for the quarter ended June 30, 2009). |
| | |
| | Fourth Amended and Restated Shareholders Agreement, dated as of April 15, 2022, among Atairos Group, Inc., Comcast AG Holdings, LLC, Atairos Partners, L.P., Atairos Management, L.P. and Comcast Corporation (incorporated by reference to Exhibit 10.27 to Comcast’s Annual Report on Form 10-K for the year ended December 31, 2022). |
| | |
| | First Amendment dated June 2, 2023 to Fourth Amended and Restated Shareholders Agreement, dated as of April 15, 2022, among Atairos Group, Inc., Comcast AG Holdings, LLC, Atairos Partners, L.P. and Atairos Management, L.P. (incorporated by reference to Exhibit 10.28 to Comcast’s Annual Report on Form 10-K for the year ended December 31, 2023). |
| | |
| | Second Amendment dated February 26, 2024 to Fourth Amended and Restated Shareholders Agreement, dated as of April 15, 2022, among Atairos Group, Inc., Comcast AG Holdings, LLC, Atairos Partners, L.P. and Atairos Management, L.P. |
| | |
| | Consultant Agreement, dated as of January 20, 1987, between Steven Spielberg and Universal City Florida Partners (incorporated by reference to Exhibit 10.49 to the Registration Statement on Form S-4 of Universal City Development Partners, Ltd. and UCDP Finance, Inc. filed on January 20, 2010 (File No. 333-164431)). |
| |
| | Amendment dated February 5, 2001 to the Consultant Agreement dated as of January 20, 1987, between the Consultant and Universal City Florida Partners (incorporated by reference to Exhibit 10.50 to the Registration Statement on Form S-4 of Universal City Development Partners, Ltd. and UCDP Finance, Inc. filed on January 20, 2010 (File No. 333-164431)). |
| |
| | Amendment to the Consultant Agreement, dated as of October 18, 2009, between Steven Spielberg, Diamond Lane Productions, Inc. and Universal City Development Partners, Ltd. (incorporated by reference to Exhibit 10.52 to the Registration Statement on Form S-4 of Universal City Development Partners, Ltd. and UCDP Finance, Inc. filed on January 20, 2010 (File No. 333-164431)). |
| | |
| | Letter Agreement dated July 15, 2003, among Diamond Lane Productions, Vivendi Universal Entertainment LLLP and Universal City Development Partners, Ltd. (incorporated by reference to Exhibit 10.51 to the Registration Statement on Form S-4 of Universal City Development Partners, Ltd. and UCDP Finance, Inc. filed on January 20, 2010 (File No. 333-164431)). |
| |
| | Comcast Corporation Insider Trading Policies. |
| |
| | List of subsidiaries. |
| | | | | | | | |
| 97 | Comcast 2024 Annual Report on Form 10-K |
| | | | | | | | |
| |
| | Subsidiary guarantors and issuers of guaranteed securities and affiliates whose securities collateralize securities of the registrant. |
| | |
| | Consent of Deloitte & Touche LLP. |
| | |
| | Certification of Chief Executive Officer and Chief Financial Officer pursuant to Section 302 of the Sarbanes-Oxley Act of 2002. |
| | |
| | Certification of Chief Executive Officer and Chief Financial Officer pursuant to Section 906 of the Sarbanes-Oxley Act of 2002. |
| | |
| | Comcast Corporation Recoupment Policy (incorporated by reference to Exhibit 97 to Comcast’s Annual Report on Form 10-K for the year ended December 31, 2023). |
| | |
| 101 | | The following financial statements from Comcast Corporation’s Annual Report on Form 10-K for the year ended December 31, 2024, filed with the Securities and Exchange Commission on January 31, 2025, formatted in Inline Extensible Business Reporting Language (iXBRL): (1) the Consolidated Statement of Income; (2) the Consolidated Statement of Comprehensive Income; (3) the Consolidated Statement of Cash Flows; (4) the Consolidated Balance Sheet; (5) the Consolidated Statement of Changes in Equity; and (6) the Notes to Consolidated Financial Statements. |
| 104 | | Cover Page Interactive Data File (embedded within the iXBRL document) |
| * | | Constitutes a management contract or compensatory plan or arrangement. |
Item 16: Form 10-K Summary
None.
| | | | | | | | |
| Comcast 2024 Annual Report on Form 10-K | 98 | |
Signatures
Pursuant to the requirements of Section 13 or 15(d) of the Securities Exchange Act of 1934, the Registrant has duly caused this report to be signed on its behalf by the undersigned, thereunto duly authorized in Philadelphia, Pennsylvania on January 31, 2025.
| | | | | | | | | | | |
| By: | | /s/ BRIAN L. ROBERTS |
| | | Brian L. Roberts |
| | | Chairman and Chief Executive Officer |
Pursuant to the requirements of the Securities Exchange Act of 1934, this report has been signed below by the following persons on behalf of the Registrant and in the capacities and on the dates indicated.
| | | | | | | | | | | | | | |
| Signature | | Title | | Date |
| | |
| /s/ BRIAN L. ROBERTS | | Chairman and Chief Executive Officer; Director (Principal Executive Officer) | | January 31, 2025 |
| Brian L. Roberts | | |
| | |
| /s/ JASON S. ARMSTRONG | | Chief Financial Officer (Principal Financial Officer) | | January 31, 2025 |
| Jason S. Armstrong | | |
| | |
| /s/ DANIEL C. MURDOCK | | Executive Vice President, Chief Accounting Officer and Controller (Principal Accounting Officer) | | January 31, 2025 |
| Daniel C. Murdock | | |
| | | | |
| /s/ KENNETH J. BACON | | Director | | January 31, 2025 |
| Kenneth J. Bacon | | |
| | | | |
| /s/ THOMAS J. BALTIMORE, JR. | | Director | | January 31, 2025 |
| Thomas J. Baltimore, Jr. | | |
| | | | |
| /s/ LOUISE F. BRADY | | Director | | January 31, 2025 |
| Louise F. Brady | | |
| | | | |
| /s/ MADELINE S. BELL | | Director | | January 31, 2025 |
| Madeline S. Bell | | |
| | |
| /s/ EDWARD D. BREEN | | Director | | January 31, 2025 |
| Edward D. Breen | | |
| | |
| /s/ JEFFREY A. HONICKMAN | | Director | | January 31, 2025 |
| Jeffrey A. Honickman | | |
| | |
| /s/ WONYA Y. LUCAS | | Director | | January 31, 2025 |
| Wonya Y. Lucas | | |
| | | |
| /s/ ASUKA NAKAHARA | | Director | | January 31, 2025 |
| Asuka Nakahara | | |
| | | | |
| /s/ DAVID C. NOVAK | | Director | | January 31, 2025 |
| David C. Novak | | |
| | |
| | | | | | | | |
| 99 | Comcast 2024 Annual Report on Form 10-K |