Table of Contents
UNITED STATES
SECURITIES AND EXCHANGE COMMISSION
WASHINGTON, D.C. 20549
FORM N-CSR
CERTIFIED SHAREHOLDER REPORT OF REGISTERED
MANAGEMENT INVESTMENT COMPANIES
Investment Company Act file number: 811-21034
SANFORD C. BERNSTEIN FUND II, INC.
(Exact name of registrant as specified in charter)
1345 Avenue of the Americas, New York, New York 10105
(Address of principal executive offices) (Zip code)
Joseph J. Mantineo
AllianceBernstein L.P.
1345 Avenue of the Americas
New York, New York 10105
(Name and address of agent for service)
Registrant’s telephone number, including area code: (800) 221-5672
Date of fiscal year end: September 30, 2013
Date of reporting period: September 30, 2013
Table of Contents
ITEM 1. REPORTS TO STOCKHOLDERS.
Table of Contents
SANFORD C. BERNSTEIN FUND II, INC.
INTERMEDIATE DURATION INSTITUTIONAL PORTFOLIO
ANNUAL REPORT
SEPTEMBER 30, 2013
Table of Contents
| 1 | ||||
| 3 | ||||
| 6 | ||||
| 7 | ||||
| 8 | ||||
| 20 | ||||
| 21 | ||||
| 22 | ||||
| 23 | ||||
| 24 | ||||
| 39 |
Before investing in the Sanford C. Bernstein Fund II, Inc., a prospective investor should consider carefully the portfolio’s investment objectives and policies, charges, expenses and risks. These and other matters of importance to prospective investors are contained in the portfolio’s prospectus, an additional copy of which may be obtained by visiting our website at www.bernstein.com and clicking on “Investments”, then “Stocks” or “Bonds”, then “Prospectuses, SAIs and Shareholder Reports” or by calling your financial advisor or by calling Bernstein’s mutual fund shareholder help line at 212.756.4097. Please read the prospectus carefully before investing.
For performance information current to the most recent month-end, please visit our website at www.bernstein.com and click on “Investments”, then “Stocks” or “Bonds”, then “Prospectuses, SAIs and Shareholder Reports.”
This shareholder report must be preceded or accompanied by the Sanford C. Bernstein Fund II, Inc. prospectus for individuals who are not shareholders of the Fund.
You may obtain a description of the Fund’s proxy voting policies and procedures, and information regarding how the Fund voted proxies relating to portfolio securities during the most recent 12-month period ended June 30, without charge. Simply visit www.alliancebernstein.com, or go to the Securities and Exchange Commission’s website at www.sec.gov, or call AllianceBernstein at 800.227.4618.
The Fund will file its complete schedule of portfolio holdings with the Commission for the first and third quarters of each fiscal year on Form N-Q. The Fund’s Form N-Q is available on the Commission’s website at www.sec.gov. The Fund’s Form N-Q may also be reviewed and copied at the Commission’s Public Reference Room in Washington, D.C.; information on the operation of the Public Reference Room may be obtained by calling 800.SEC.0330.
Investment Products Offered: · Are Not FDIC Insured · May Lose Value · Are Not Bank Guaranteed
Table of Contents
Portfolio Manager Commentary (Unaudited)
To Our Shareholders—November 14, 2013
This report provides management’s discussion of fund performance for Sanford C. Bernstein Fund II, Inc. Intermediate Duration Institutional Portfolio (the “Portfolio”) for the annual reporting period ended September 30, 2013.
Investment Objectives and Policies
The Portfolio’s investment objective is to provide safety of principal and a moderate to high rate of current income. The Portfolio seeks to maintain an average portfolio quality minimum of A, based on ratings given to the Portfolio’s securities by national rating agencies (or, if unrated, determined by AllianceBernstein L.P. (the “Adviser”), to be of comparable quality). Many types of securities may be purchased by the Portfolio, including corporate bonds, notes, U.S. Government and agency securities, asset-backed securities, mortgage-related securities, bank loan debt, preferred stock and inflation-protected securities, as well as others. The Portfolio may also invest up to 25% of its total assets in fixed-income, non-U.S. dollar denominated foreign securities, and may invest without limit in fixed-income, U.S. dollar denominated foreign securities, in each case in developed or emerging-market countries.
The Portfolio may use derivatives, such as options, futures, forwards and swaps. The Portfolio may invest up to 25% of its total assets in fixed-income securities rated below investment grade (BB or below) by national rating agencies (commonly known as “junk bonds”). No more than 5% of the Portfolio’s total assets may be invested in fixed-income securities rated CCC by national rating agencies. The Portfolio seeks to maintain an effective duration of three to six years under normal market conditions. The Portfolio may enter into foreign currency transactions on a spot (i.e., cash) basis or through the use of derivatives transactions, such as forward currency exchange contracts, currency futures and options thereon, and options on currencies.
Investment Results
The table on page 6 shows the Portfolio’s performance compared to its benchmark, the Barclays U.S. Aggregate Bond Index, and the Lipper Core Bond Funds Average (a comparison to peers of similarly managed funds, the “Lipper Average”) for the six- and 12-month periods ended September 30, 2013.
The Portfolio outperformed its benchmark and underperformed the Lipper Average for the 12-month period, while it underperformed both the benchmark and Lipper Average for the six-month period. For the 12-month period, security selection in investment-grade corporate holdings, particularly in financials, was favorable. Security selection in agency mortgage positions as well as commercial mortgage-backed securities (“CMBS”) detracted. Within agency mortgage holdings, an underweight to medium- and high-coupon mortgage securities detracted from returns, as these securities held up better than lower-coupon mortgages as rates began to climb. For the six-month period, security selection was the primary detractor; agency mortgage holdings as well as government agency and CMBS detracted. Security selection within the Portfolio’s investment-grade positions was a modest positive. Overall sector allocation did not have a meaningful impact on performance. An overweight to investment-grade corporates and exposure to high yield contributed positively. Yield curve positioning (the Portfolio’s exposure to bonds of varying maturities) had an immaterial impact for both periods.
The Portfolio utilized derivatives including interest rate swaps and Treasury futures in efforts to manage yield curve positioning and duration; credit default swaps for investment purposes, which had an immaterial impact during both periods; and currency forwards to hedge out currency risk within the Portfolio.
Market Review and Investment Strategy
The policy direction of the U.S. Federal Reserve (the “Fed”) continued to be a primary driver of market behavior during the 12-month period. After a positive start to the period, capital markets stumbled in the second quarter. After initially setting cyclical highs, equities lost ground and yields on U.S. Treasuries rose in response to signals by the Fed that it would soon temper its aggressive bond-buying program. The Fed-induced sell-off prompted outflows from fixed-income mutual funds, both in the U.S. and around the world, reinforcing the volatility.
Fixed-income markets rallied by September, buoyed by the Fed’s announcement that its aggressive reflationary policies would remain in place for at least another month and, quite possibly, into next year. This defied market expectations, as the conventional wisdom was that the Fed was prepared to begin scaling back its massive bond-purchasing program at its mid-month meeting. Market optimism was somewhat undercut by political uncertainty, particularly in the U.S., where the deadlocked budget and debt-ceiling negotiations ultimately led to a government shutdown by the end of the period.
(Portfolio Manager Commentary continued on next page)
| 2013 Annual Report | 1 |
Table of Contents
Portfolio Manager Commentary (continued)
Most major bond sectors fell into negative territory for the annual period, as yields rose. As measured by the benchmark, CMBS and high yield outperformed, providing positive returns. Investment-grade corporates posted negative returns, but outperformed Treasuries and the broader fixed-income market in duration-neutral terms as spreads narrowed. The corporate sector was helped by solid returns within financials. For the year, U.S. Treasuries declined as yields rose across the maturity spectrum, except for the shortest maturities; the 10-year Treasury yield, which moves in reverse direction to price, rose.
| 2 | Sanford C. Bernstein Fund II, Inc. |
Table of Contents
Disclosures and Risks (Unaudited)
None of the following indices or averages reflects fees and expenses associated with the active management of a mutual fund portfolio. The Barclays U.S. Aggregate Bond Index represents the performance of securities within the U.S. investment-grade fixed-rate bond market, with index components for government and corporate securities, mortgage pass-through securities, asset-backed securities, and commercial mortgaged-backed securities. The Lipper Core Bond Funds Average is the equal-weighted average returns of the portfolios in the relevant Lipper Inc. category; the average portfolios in a category may differ in composition from the Portfolio. The Lipper Core Bond Funds Average contains portfolios that invest primarily in investment-grade debt issues (rated in the top four grades) with dollar-weighted average maturities of five to ten years. An investor cannot invest directly in an index or average, and their results are not indicative of the performance for any specific investment, including the Portfolio.
A Word About Risk
The share price of the Portfolio will fluctuate and you may lose money. There is no guarantee that the Portfolio will achieve its investment objective.
Interest Rate Risk: This is the risk that changes in interest rates will affect the value of the Portfolio’s investments in fixed-income debt securities such as bonds and notes. Interest rates in the United States have recently been historically low. Increases in interest rates may cause the value of the Portfolio’s investments to decline and this decrease in value may not be offset by higher income from new investments. Interest rate risk is generally greater for fixed-income securities with longer maturities or durations.
Credit Risk: This is the risk that the issuer or the guarantor of a debt security, or the counterparty to a derivatives or other contract, will be unable or unwilling to make timely principal and/or interest payments, or to otherwise honor its obligations. The issuer or guarantor may default, causing a loss of the full principal amount of a security. The degree of risk for a particular security may be reflected in its credit rating. There is the possibility that the credit rating of a fixed-income security may be downgraded after purchase, which may adversely affect the value of the security. Investments in fixed-income securities with lower ratings tend to have a higher probability that an issuer will default or fail to meet its payment obligations.
Duration Risk: The duration of a fixed-income security may be shorter than or equal to full maturity of a fixed-income security. Fixed-income securities with longer durations have more risk and will decrease in price as interest rates rise. For example, a fixed-income security with a duration of three years will decrease in value by approximately 3% if interest rates increase by 1%.
Inflation Risk: This is the risk that the value of assets or income from investments will be less in the future as inflation decreases the value of money. As inflation increases, the value of the Portfolio’s assets can decline as can the value of the Portfolio’s distributions. This risk is significantly greater for fixed-income securities with longer maturities.
Inflation-Protected Securities Risk: The terms of inflation-protected securities provide for the coupon and/or maturity value to be adjusted based on changes in inflation. Decreases in the inflation rate or in investors’ expectations about inflation could cause these securities to underperform non-inflation-adjusted securities on a total-return basis. In addition, these securities may have limited liquidity in the secondary market.
Foreign (Non-U.S.) Securities Risk: Investments in foreign securities entail significant risks in addition to those customarily associated with investing in U.S. securities. These risks include risks related to adverse market, economic, political and regulatory factors and social instability, all of which could disrupt the financial markets in which the Portfolio invests and adversely affect the value of the Portfolio’s assets.
Emerging Markets Securities Risk: The risks of investing in foreign (non-U.S.) securities are heightened with respect to issuers in emerging-market countries, because the markets are less developed and less liquid and there may be a greater amount of economic, political and social uncertainty.
Derivatives Risk: The Portfolio may use derivatives as direct investments to earn income, enhance return and broaden portfolio diversification, which entail greater risk than if used solely for hedging purposes. In addition to other risks such as the credit risk of the counterparty, derivatives involve the risk that changes in the value of the derivative may not correlate with relevant assets, rates or indices. Derivatives may be illiquid and difficult to price or unwind, and small changes may produce disproportionate losses for the Portfolio. Assets required to be set aside or posted to cover or secure derivatives positions may themselves go down in value, and these collateral and other requirements may limit investment
Disclosures & Risks continued on next page
| 2013 Annual Report | 3 |
Table of Contents
Disclosures and Risks (continued)
flexibility. Some derivatives involve leverage, which can make the Portfolio more volatile and can compound other risks. Recent legislation calls for new regulation of the derivatives markets. The extent and impact of the regulation are not yet fully known and may not be for some time. The regulation may make derivatives more costly, may limit their availability, or may otherwise adversely affect their value or performance.
Mortgage-Related Securities Risk: In the case of investments in mortgage-related securities, a loss could be incurred if the collateral backing these securities is insufficient.
Prepayment and Extension Risk: Prepayment risk is the risk that a loan, bond or other security might be called or otherwise converted, prepaid or redeemed before maturity. If this happens, particularly during a time of declining interest rates or credit spreads, the Portfolio may not be able to invest the proceeds in securities providing as much income, resulting in a lower yield to the Portfolio. Conversely, extension risk is the risk that as interest rates rise or spreads widen, payments of securities may occur more slowly than anticipated by the market. When this happens, the values of these securities may go down because their interest rates are lower than current market rates and they remain outstanding longer than anticipated.
Subordination Risk: The Portfolio may invest in securities that are subordinated to more senior securities of an issuer, or which represent interests in pools of such subordinated securities. Subordinated securities will be disproportionately affected by a default or even a perceived decline in creditworthiness of the issuer. Subordinated securities are more likely to suffer a credit loss than non-subordinated securities of the same issuer, any loss incurred by the subordinated securities is likely to be proportionately greater, and any recovery of interest or principal may take more time.
Management Risk: The Portfolio is subject to management risk because it is an actively managed investment portfolio. The Manager will apply its investment techniques and risk analyses in making investment decisions for the Portfolio, but its decisions may not produce the desired results. In some cases, derivative and other investment techniques may be unavailable or the Manager may determine not to use them, possibly even under market conditions where their use could benefit the Portfolio.
Liquidity Risk: Liquidity risk exists when particular investments are difficult to purchase or sell, possibly preventing the Portfolio from selling out of these illiquid securities at an advantageous price. Illiquid securities may also be difficult to value. Derivatives and securities involving substantial market and credit risk tend to involve greater liquidity risk.
Foreign Currency Risk: This is the risk that changes in foreign (non-U.S.) currency exchange rates may negatively affect the value of the Portfolio’s investments or reduce the returns of the Portfolio. For example, the value of the Portfolio’s investments in foreign securities and foreign currency positions may decrease if the U.S. dollar is strong (i.e., gaining value relative to other currencies) and other currencies are weak (i.e., losing value relative to the U.S. dollar).
Actions by a Few Major Investors: In certain countries, volatility may be heightened by actions of a few major investors. For example, substantial increases or decreases in cash flows of mutual funds investing in these markets could significantly affect local securities prices and, therefore, share prices of the Portfolio.
Market Risk: The Portfolio is subject to market risk, which is the risk that bond prices in general may decline over short or extended periods. Equity and debt markets around the world have experienced unprecedented volatility, including as a result of the recent European sovereign debt crisis, and these market conditions may continue or get worse. This financial environment has caused a significant decline in the value and liquidity of many investments, and could make identifying investment risks and opportunities especially difficult. High public debt in the United States and other countries creates ongoing systemic and market risks and policy making uncertainty. In addition, policy and legislative changes in the United States and in other countries are affecting many aspects of financial regulation. The impact of these changes, and the practical implications for market participants, may not be fully known for some time.
Lower-rated Securities Risk: Lower-rated securities, or junk bonds/high yield securities, are subject to greater risk of loss of principal and interest and greater market risk than higher-rated securities. The capacity of issuers of lower-rated securities to pay interest and repay principal is more likely to weaken than is that of issuers of higher-rated securities in times of deteriorating economic conditions or rising interest rates.
These risks are fully discussed in the Portfolio’s prospectus.
Disclosures & Risks continued on next page
| 4 | Sanford C. Bernstein Fund II, Inc. |
Table of Contents
Disclosures and Risks (continued)
An Important Note About Historical Performance
The performance shown on page 6 represents past performance and does not guarantee future results. Performance information is as of the dates shown. Current performance may be lower or higher than the performance information shown. You may obtain performance information current to the most recent month-end by visiting www.bernstein.com or by calling 212.756.4097.
The investment return and principal value of an investment in the Portfolio will fluctuate, so that shares, when redeemed, may be worth more or less than their original cost. Investors should consider the investment objectives, risks, charges and expenses of the Portfolio carefully before investing. For copies of our prospectus or summary prospectus, which contain this and other information, visit www.bernstein.com, click on “Investments”, then “Stocks” or “Bonds”, then “Prospectuses, SAIs and Shareholder Reports” or by calling Bernstein’s mutual fund shareholder help line at 212.756.4097 or contact your Bernstein Advisor. Please read the prospectus and/or summary prospectus carefully before investing.
Except as noted, returns do not reflect the deduction of taxes that a shareholder would pay on portfolio distributions or the redemption of portfolio shares. All fees and expenses related to the operation of the Portfolio have been deducted.
| 2013 Annual Report | 5 |
Table of Contents
Historical Performance (Unaudited)
Intermediate Duration Institutional Portfolio vs. Its Benchmark and Lipper Average
| TOTAL RETURNS | AVERAGE ANNUAL TOTAL RETURNS | |||||||||||||||||||||
| THROUGH SEPTEMBER 30, 2013 | PAST 6 MONTHS | PAST 12 MONTHS | PAST FIVE YEARS | PAST 10 YEARS | SINCE INCEPTION | INCEPTION DATE | ||||||||||||||||
Intermediate Duration Institutional Portfolio† | -2.15 | %* | -1.67 | %* | 7.02 | % | 4.82 | % | 5.21 | % | May 17, 2002 | |||||||||||
Barclays U.S. Aggregate Bond Index | -1.77 | % | -1.68 | % | 5.41 | % | 4.59 | % | 5.09 | % | ||||||||||||
Lipper Core Bond Funds Average | -2.13 | % | -1.47 | % | 5.96 | % | 4.18 | % | 4.74 | % | ||||||||||||
| † | There are no sales charges associated with an investment in the Portfolio. Total returns and average annual returns are therefore the same. |
| * | Includes the impact of proceeds received and credited to the Portfolio resulting from class action settlements, which enhanced the performance of the Portfolio for the six- and 12-month periods ended September 30, 2013 by 0.01%. |
During the reporting period, the Adviser waived a portion of its advisory fee or reimbursed the Portfolio for a portion of its expenses to the extent necessary to limit the Portfolio’s expenses to 0.45%. This waiver extends through January 31, 2014 and may be extended by the Adviser for additional one-year terms. Without the waiver, the Portfolio’s expenses would have been higher (0.54%, as of 1/31/13) and its performance would have been lower than that shown.
| Intermediate Duration Institutional Portfolio |
Growth of a $25,000 Investment in the Portfolio | ||||
|
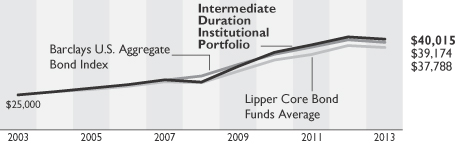
The chart shows the growth of $25,000 for the Portfolio and its benchmark and Lipper Average from September 30, 2003 through September 30, 2013.
Portfolio Summary—September 30, 2013 (Unaudited)
| Intermediate Duration Institutional Portfolio | ||||
| Security Type Breakdown* | ||||
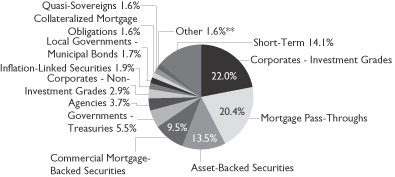 |
| * | All data are as of September 30, 2013. The Portfolio’s security type breakdown is expressed as a percentage of total investments and may vary over time. The Portfolio also invests in other financial instruments including derivative transactions, which provide investment exposure to a variety of asset classes (see “Schedule of Investments” section of the report for additional details). |
| ** | “Other” represents less than 0.9% in Governments - Sovereign Bonds, Emerging Markets - Corporate Bonds, Preferred Stocks, and Bank Loans. |
See Disclosures, Risks and Note about Historical Performance on pages 3-5.
| 6 | Sanford C. Bernstein Fund II, Inc. |
Table of Contents
Expense Example—September 30, 2013 (Unaudited)
As a shareholder of the Fund, you incur various types of costs including management fees and other Fund expenses. This example is intended to help you understand your ongoing costs (in dollars) of investing in the Fund and to compare these costs with the ongoing costs of investing in other mutual funds. The example is based on an investment of $1,000 invested at the beginning of the period and held for the entire period as indicated below.
Actual Expenses—The first line of the table below provides information about actual account values and actual expenses. You may use the information in this line, together with the amount you invested, to estimate the expenses that you paid over the period. Simply divide your account value by $1,000 (for example, an $8,600 account value divided by $1,000 = 8.6), then multiply the result by the number in the first line under the heading entitled “Expenses Paid During Period” to estimate the expenses you paid on your account during this period.
Hypothetical Example for Comparison Purposes—The second line of the table below provides information about hypothetical account values and hypothetical expenses based on the Fund’s actual expense ratio and an assumed annual rate of return of 5% before expenses, which is not the Fund’s actual return. The hypothetical account values and expenses may not be used to estimate the actual ending account balance or expenses you paid for the period. You may use this information to compare the ongoing costs of investing in the Fund and other funds by comparing this 5% hypothetical example with the 5% hypothetical examples that appear in the shareholder reports of other funds. Please note that the expenses shown in the table are meant to highlight your ongoing costs only and do not reflect any transactional costs, such as sales charges (loads), or contingent deferred sales charges on redemptions. Therefore, the second line of the table is useful in comparing ongoing costs only, and will not help you determine the relative total costs of owning different funds. In addition, if these transactional costs were included, your costs would have been higher.
| BEGINNING ACCOUNT VALUE APRIL 1, 2013 | ENDING ACCOUNT VALUE | EXPENSES PAID DURING PERIOD* | ANNUALIZED EXPENSE RATIO* | |||||||||||||
SCB II Intermediate Duration Institutional Portfolio | ||||||||||||||||
Actual | $ | 1,000 | $ | 978.50 | $ | 2.23 | 0.45 | % | ||||||||
Hypothetical** | $ | 1,000 | $ | 1,022.81 | $ | 2.28 | 0.45 | % | ||||||||
| * | Expenses are equal to the Fund’s annualized expense ratio, shown in the table above, multiplied by the average account value over the period, multiplied by 183/365 (to reflect the one-half year period). |
| ** | Assumes 5% annual return before expenses. |
| 2013 Annual Report | 7 |
Table of Contents
Sanford C. Bernstein Fund II, Inc.
Schedule of Investments
Intermediate Duration Institutional Portfolio
September 30, 2013
| Principal Amount (000) | U.S. $ Value | |||||||||||
| CORPORATES—INVESTMENT GRADES–25.7% | ||||||||||||
| Industrial–12.4% | ||||||||||||
| Basic–1.8% | ||||||||||||
Basell Finance Co. BV | U.S.$ | 805 | $ | 1,016,475 | ||||||||
BHP Billiton Finance USA Ltd. | 10 | 9,924 | ||||||||||
Cia Minera Milpo SAA | 1,126 | 1,002,717 | ||||||||||
Dow Chemical Co. (The) | 802 | 693,366 | ||||||||||
7.375%, 11/01/29 |
| 170 | 213,762 | |||||||||
8.55%, 5/15/19 | 699 | 891,486 | ||||||||||
Gerdau Trade, Inc. | 2,000 | 1,781,928 | ||||||||||
5.75%, 1/30/21(a) | 114 | 111,720 | ||||||||||
Glencore Funding LLC | 2,445 | 2,291,879 | ||||||||||
International Paper Co. | 1,155 | 1,216,395 | ||||||||||
7.95%, 6/15/18 | 408 | 506,420 | ||||||||||
LyondellBasell Industries NV | 1,481 | 1,656,389 | ||||||||||
Sociedad Quimica y Minera de Chile SA | 1,043 | 905,445 | ||||||||||
Vale SA | 1,215 | 1,059,789 | ||||||||||
|
| |||||||||||
| 13,357,695 | ||||||||||||
|
| |||||||||||
| Capital Goods–0.8% | ||||||||||||
Embraer SA | 759 | 736,230 | ||||||||||
Odebrecht Finance Ltd. | 960 | 928,800 | ||||||||||
Owens Corning | 1,694 | 1,890,777 | ||||||||||
Republic Services, Inc. | ||||||||||||
3.80%, 5/15/18 | 16 | 17,038 | ||||||||||
5.25%, 11/15/21 | 978 | 1,072,825 | ||||||||||
5.50%, 9/15/19 | 1,303 | 1,472,489 | ||||||||||
|
| |||||||||||
| 6,118,159 | ||||||||||||
|
| |||||||||||
| Communications—Media–1.6% | ||||||||||||
CBS Corp. | 29 | 37,072 | ||||||||||
Comcast Cable Communications | 1,170 | 1,649,378 | ||||||||||
DirecTV Holdings LLC/DirecTV Financing Co., Inc. | ||||||||||||
3.80%, 3/15/22 | 1,935 | 1,806,030 | ||||||||||
4.75%, 10/01/14 | 950 | 987,340 | ||||||||||
NBCUniversal Enterprise, Inc. | 1,155 | 1,143,450 | ||||||||||
| Principal Amount (000) | U.S. $ Value | |||||||||||
News America, Inc. | ||||||||||||
4.50%, 2/15/21 | U.S.$ | 40 | $ | 42,477 | ||||||||
6.15%, 3/01/37–2/15/41 | 1,388 | 1,528,581 | ||||||||||
6.55%, 3/15/33 | 780 | 887,979 | ||||||||||
Omnicom Group, Inc. | 839 | 804,693 | ||||||||||
TCI Communications, Inc. | 130 | 169,988 | ||||||||||
Time Warner Cable, Inc. | ||||||||||||
4.00%, 9/01/21 | 25 | 23,324 | ||||||||||
5.00%, 2/01/20 | 10 | 10,125 | ||||||||||
7.50%, 4/01/14 | 1,135 | 1,171,904 | ||||||||||
Time Warner Entertainment Co. LP | 1,480 | 1,726,334 | ||||||||||
|
| |||||||||||
| 11,988,675 | ||||||||||||
|
| |||||||||||
| Communications—Telecommunications–1.8% | ||||||||||||
American Tower Corp. | ||||||||||||
4.70%, 3/15/22 | 30 | 29,149 | ||||||||||
5.05%, 9/01/20 | 2,205 | 2,287,236 | ||||||||||
AT&T, Inc. | ||||||||||||
3.00%, 2/15/22 | 20 | 18,756 | ||||||||||
4.30%, 12/15/42 | 567 | 472,068 | ||||||||||
5.35%, 9/01/40 | 524 | 508,568 | ||||||||||
BellSouth Telecommunications, Inc. | 135 | 154,956 | ||||||||||
British Telecommunications PLC | 23 | 34,058 | ||||||||||
Deutsche Telekom International Finance BV | 1,262 | 1,188,582 | ||||||||||
New Cingular Wireless Services, Inc. | 10 | 13,789 | ||||||||||
Pacific Bell Telephone Co. | 170 | 172,217 | ||||||||||
Rogers Communications, Inc. | CAD | 256 | 245,838 | |||||||||
Telecom Italia Capital SA | U.S.$ | 935 | 1,028,020 | |||||||||
Telefonica Emisiones SAU | 1,100 | 1,126,358 | ||||||||||
United States Cellular Corp. | 1,410 | 1,368,588 | ||||||||||
Verizon Communications, Inc. | ||||||||||||
4.60%, 4/01/21 | 177 | 188,091 | ||||||||||
5.15%, 9/15/23 | 1,522 | 1,631,258 | ||||||||||
6.55%, 9/15/43 | 2,422 | 2,734,286 | ||||||||||
Vodafone Group PLC | 15 | 15,687 | ||||||||||
|
| |||||||||||
| 13,217,505 | ||||||||||||
|
| |||||||||||
| Consumer Cyclical—Automotive–0.9% | ||||||||||||
Ford Motor Credit Co. LLC | 4,132 | 4,526,817 | ||||||||||
Harley-Davidson Funding Corp. | 1,821 | 1,919,955 | ||||||||||
|
| |||||||||||
| 6,446,772 | ||||||||||||
|
| |||||||||||
| Consumer Cyclical—Entertainment–0.3% | ||||||||||||
Time Warner, Inc. | 40 | 38,830 | ||||||||||
| 8 | Sanford C. Bernstein Fund II, Inc. |
Table of Contents
| Principal Amount (000) | U.S. $ Value | |||||||||||
4.70%, 1/15/21 | U.S.$ | 1,150 | $ | 1,229,045 | ||||||||
7.625%, 4/15/31 | 155 | 192,920 | ||||||||||
Viacom, Inc. | 510 | 578,297 | ||||||||||
6.25%, 4/30/16 | 5 | 5,584 | ||||||||||
|
| |||||||||||
| 2,044,676 | ||||||||||||
|
| |||||||||||
| Consumer Cyclical—Other–0.0% | ||||||||||||
Wyndham Worldwide Corp. | 35 | 34,653 | ||||||||||
|
| |||||||||||
| Consumer Cyclical—Retailers–0.1% | ||||||||||||
Dollar General Corp. | 468 | 497,373 | ||||||||||
Gap Inc/The | 25 | 27,700 | ||||||||||
|
| |||||||||||
| 525,073 | ||||||||||||
|
| |||||||||||
| Consumer Non-Cyclical–1.5% | ||||||||||||
Ahold Finance USA LLC | 2,305 | 2,734,972 | ||||||||||
Altria Group, Inc. | 25 | 26,523 | ||||||||||
Bunge Ltd. Finance Corp. | 1,108 | 1,179,433 | ||||||||||
8.50%, 6/15/19 | 19 | 23,658 | ||||||||||
Cadbury Schweppes US Finance LLC | 2,325 | 2,325,000 | ||||||||||
Diageo Capital PLC | 40 | 40,781 | ||||||||||
Kimberly-Clark Corp. | 35 | 37,123 | ||||||||||
Kroger Co. (The) | 1,915 | 1,864,067 | ||||||||||
Pfizer, Inc. | 6 | 6,410 | ||||||||||
Reynolds American, Inc. | 1,309 | 1,204,966 | ||||||||||
Tyson Foods, Inc. | 1,429 | 1,483,189 | ||||||||||
|
| |||||||||||
| 10,926,122 | ||||||||||||
|
| |||||||||||
| Energy–2.0% | ||||||||||||
Anadarko Petroleum Corp. | 5 | 5,812 | ||||||||||
6.45%, 9/15/36 | 720 | 826,871 | ||||||||||
ConocoPhillips | 6 | 6,304 | ||||||||||
6.00%, 1/15/20 | 15 | 17,759 | ||||||||||
ConocoPhillips Holding Co. | 50 | 63,119 | ||||||||||
Encana Corp. | 3,460 | 3,467,719 | ||||||||||
Nabors Industries, Inc. | 7 | 7,036 | ||||||||||
5.10%, 9/15/23(a) | 1,140 | 1,153,514 | ||||||||||
Noble Energy, Inc. | 10 | 10,411 | ||||||||||
8.25%, 3/01/19 | 2,308 | 2,884,144 | ||||||||||
Noble Holding International Ltd. | U.S.$ | 200 | $ | 210,807 | ||||||||
Reliance Holdings USA, Inc. | 1,471 | 1,450,278 | ||||||||||
Transocean, Inc. | 677 | 637,457 | ||||||||||
6.375%, 12/15/21 | 5 | 5,558 | ||||||||||
6.50%, 11/15/20 | 977 | 1,090,572 | ||||||||||
Weatherford International Ltd./Bermuda | 1,595 | 1,662,858 | ||||||||||
6.00%, 3/15/18 | 164 | 183,845 | ||||||||||
9.625%, 3/01/19 | 1,095 | 1,378,611 | ||||||||||
|
| |||||||||||
| 15,062,675 | ||||||||||||
|
| |||||||||||
| Technology–0.8% | ||||||||||||
Baidu, Inc. | 408 | 401,306 | ||||||||||
3.25%, 8/06/18 | 1,079 | 1,078,508 | ||||||||||
Hewlett-Packard Co. | 911 | 894,701 | ||||||||||
HP Enterprise Services LLC | 25 | 26,897 | ||||||||||
Motorola Solutions, Inc. | 1,537 | 1,434,992 | ||||||||||
3.75%, 5/15/22 | 25 | 23,866 | ||||||||||
7.50%, 5/15/25 | 245 | 296,832 | ||||||||||
Oracle Corp. | 25 | 26,590 | ||||||||||
5.25%, 1/15/16 | 53 | 58,282 | ||||||||||
Total System Services, Inc. | 671 | 654,595 | ||||||||||
3.75%, 6/01/23 | 688 | 636,803 | ||||||||||
Xerox Corp. | 20 | 20,905 | ||||||||||
|
| |||||||||||
| 5,554,277 | ||||||||||||
|
| |||||||||||
| Transportation—Airlines–0.3% | ||||||||||||
Southwest Airlines Co. | 1,235 | 1,283,987 | ||||||||||
5.75%, 12/15/16 | 885 | 986,653 | ||||||||||
|
| |||||||||||
| 2,270,640 | ||||||||||||
|
| |||||||||||
| Transportation—Railroads–0.0% | ||||||||||||
CSX Corp. | 60 | 57,269 | ||||||||||
|
| |||||||||||
| Transportation—Services–0.5% | ||||||||||||
Asciano Finance Ltd. | 2,585 | 2,637,194 | ||||||||||
Ryder System, Inc. | 700 | 779,515 | ||||||||||
|
| |||||||||||
| 3,416,709 | ||||||||||||
|
| |||||||||||
| 91,020,900 | ||||||||||||
|
| |||||||||||
| 2013 Annual Report | 9 |
Table of Contents
Schedule of Investments (continued)
| Principal Amount (000) | U.S. $ Value | |||||||||||
| Financial Institutions–9.6% | ||||||||||||
| Banking–5.5% | ||||||||||||
American Express Co. | U.S.$ | 11 | $ | 10,103 | ||||||||
Bank of America Corp. | 10 | 10,636 | ||||||||||
5.625%, 7/01/20 | 100 | 112,042 | ||||||||||
5.70%, 1/24/22 | 320 | 357,460 | ||||||||||
5.875%, 1/05/21–2/07/42 | 1,021 | 1,133,828 | ||||||||||
7.375%, 5/15/14 | 15 | 15,613 | ||||||||||
7.625%, 6/01/19 | 1,435 | 1,759,687 | ||||||||||
Barclays Bank PLC | EUR | 1,770 | 2,742,564 | |||||||||
Bear Stearns Cos. LLC (The) | U.S.$ | 80 | 86,590 | |||||||||
BNP Paribas SA | 512 | 517,171 | ||||||||||
Capital One Financial Corp. | 21 | 21,894 | ||||||||||
Compass Bank | 3,199 | 3,196,012 | ||||||||||
Cooperatieve Centrale Raiffeisen-Boerenleenbank BA/Netherlands | 1,189 | 1,140,804 | ||||||||||
Countrywide Financial Corp. | 1,040 | 1,150,034 | ||||||||||
Credit Suisse AG | 1,624 | 1,669,308 | ||||||||||
Danske Bank A/S | GBP | 1,054 | 1,693,524 | |||||||||
Goldman Sachs Group, Inc. (The) | U.S.$ | 230 | 250,755 | |||||||||
Series D | 2,350 | 2,668,411 | ||||||||||
JPMorgan Chase & Co. | 10 | 10,359 | ||||||||||
4.625%, 5/10/21 | 60 | 63,945 | ||||||||||
4.75%, 3/01/15 | 6 | 6,321 | ||||||||||
Series Q | 750 | 656,250 | ||||||||||
Macquarie Bank Ltd. | 514 | 560,568 | ||||||||||
Macquarie Group Ltd. | 1,075 | 1,157,215 | ||||||||||
Merrill Lynch & Co., Inc. | 125 | 128,741 | ||||||||||
Morgan Stanley | 25 | 30,628 | ||||||||||
Series G | 2,830 | 3,117,183 | ||||||||||
Murray Street Investment Trust I | 270 | 287,954 | ||||||||||
National Capital Trust II Delaware | 655 | 669,737 | ||||||||||
Nationwide Building Society | U.S.$ | 2,605 | $ | 2,945,677 | ||||||||
PNC Funding Corp. | 35 | 38,932 | ||||||||||
Rabobank Capital Funding Trust III | 745 | 756,175 | ||||||||||
Royal Bank of Scotland PLC (The) | 693 | 796,950 | ||||||||||
Santander US Debt SAU | 2,555 | 2,555,409 | ||||||||||
Skandinaviska Enskilda Banken AB | 343 | 349,003 | ||||||||||
Societe Generale SA | 1,235 | 1,240,310 | ||||||||||
SouthTrust Corp. | 45 | 46,588 | ||||||||||
Standard Chartered PLC | 2,175 | 2,196,532 | ||||||||||
UBS AG/Stamford CT | 1,334 | 1,474,821 | ||||||||||
Unicredit Luxembourg Finance SA | 1,042 | 1,085,133 | ||||||||||
Wachovia Bank NA | 150 | 165,680 | ||||||||||
5.85%, 2/01/37 | 1,270 | 1,417,215 | ||||||||||
|
| |||||||||||
| 40,293,762 | ||||||||||||
|
| |||||||||||
| Finance–0.0% | ||||||||||||
General Electric Capital Corp. | 22 | 22,997 | ||||||||||
5.875%, 1/14/38 | 43 | 47,467 | ||||||||||
Series G | 115 | 131,955 | ||||||||||
HSBC Finance Corp. | 101 | 115,338 | ||||||||||
|
| |||||||||||
| 317,757 | ||||||||||||
|
| |||||||||||
| Insurance–2.9% | ||||||||||||
Allied World Assurance Co., Ltd. | 780 | 906,151 | ||||||||||
American International Group, Inc. | 215 | 228,655 | ||||||||||
4.875%, 6/01/22 | 1,590 | 1,705,690 | ||||||||||
6.40%, 12/15/20 | 1,230 | 1,449,448 | ||||||||||
Coventry Health Care, Inc. | 545 | 617,847 | ||||||||||
6.125%, 1/15/15 | 205 | 218,429 | ||||||||||
6.30%, 8/15/14 | 1,670 | 1,748,782 | ||||||||||
Guardian Life Insurance Co. of America | 884 | 1,120,227 | ||||||||||
Hartford Financial Services Group, Inc. | 505 | 526,113 | ||||||||||
5.125%, 4/15/22 | 1,090 | 1,192,970 | ||||||||||
5.50%, 3/30/20 | 1,373 | 1,549,302 | ||||||||||
6.10%, 10/01/41 | 130 | 149,224 | ||||||||||
| 10 | Sanford C. Bernstein Fund II, Inc. |
Table of Contents
| Principal Amount (000) | U.S. $ Value | |||||||||||
Humana, Inc. | U.S.$ | 220 | $ | 253,572 | ||||||||
6.45%, 6/01/16 | 245 | 275,325 | ||||||||||
7.20%, 6/15/18 | 610 | 730,678 | ||||||||||
Lincoln National Corp. | 681 | 882,419 | ||||||||||
Massachusetts Mutual Life Insurance Co. | 620 | 897,750 | ||||||||||
MetLife Capital Trust IV | 970 | 1,091,250 | ||||||||||
MetLife, Inc. | 350 | 382,685 | ||||||||||
6.75%, 6/01/16 | 25 | 28,648 | ||||||||||
7.717%, 2/15/19 | 519 | 650,031 | ||||||||||
10.75%, 8/01/39 | 5 | 7,350 | ||||||||||
Nationwide Mutual Insurance Co. | 890 | 1,226,525 | ||||||||||
Prudential Financial, Inc. | 19 | 20,414 | ||||||||||
5.625%, 6/15/43 | 1,775 | 1,671,837 | ||||||||||
XL Group PLC | 1,570 | 1,635,910 | ||||||||||
6.25%, 5/15/27 | 175 | 196,827 | ||||||||||
|
| |||||||||||
| 21,364,059 | ||||||||||||
|
| |||||||||||
| Other Finance–0.3% | ||||||||||||
ORIX Corp. | 1,874 | 1,967,839 | ||||||||||
|
| |||||||||||
| REITS–0.9% | ||||||||||||
ERP Operating LP | 185 | 192,803 | ||||||||||
HCP, Inc. | 3,010 | 3,275,046 | ||||||||||
Health Care REIT, Inc. | 3,010 | 3,216,555 | ||||||||||
Healthcare Realty Trust, Inc. | 10 | 11,221 | ||||||||||
|
| |||||||||||
| 6,695,625 | ||||||||||||
|
| |||||||||||
| 70,639,042 | ||||||||||||
|
| |||||||||||
| Utility–3.2% | ||||||||||||
| Electric–0.7% | ||||||||||||
CMS Energy Corp. | 345 | 369,543 | ||||||||||
Constellation Energy Group, Inc. | 559 | 605,268 | ||||||||||
Duke Energy Carolinas LLC | 42 | 44,500 | ||||||||||
Enersis SA/Cayman Island | 80 | 81,280 | ||||||||||
Pacific Gas & Electric Co. | 10 | 11,125 | ||||||||||
SPI Electricity & Gas Australia Holdings | 1,080 | 1,086,691 | ||||||||||
TECO Finance, Inc. | U.S.$ | 550 | $ | 583,583 | ||||||||
5.15%, 3/15/20 | 685 | 746,964 | ||||||||||
Wisconsin Electric Power Co. | 23 | 25,690 | ||||||||||
Wisconsin Energy Corp. | 1,186 | 1,209,720 | ||||||||||
|
| |||||||||||
| 4,764,364 | ||||||||||||
|
| |||||||||||
| Natural Gas–2.5% | ||||||||||||
DCP Midstream LLC | 563 | 602,940 | ||||||||||
Energy Transfer Partners LP | 25 | 25,668 | ||||||||||
6.125%, 2/15/17 | 140 | 158,368 | ||||||||||
6.625%, 10/15/36 | 120 | 127,552 | ||||||||||
6.70%, 7/01/18 | 734 | 859,614 | ||||||||||
7.50%, 7/01/38 | 1,685 | 1,945,459 | ||||||||||
Enterprise Products Operating LLC | 30 | 28,393 | ||||||||||
5.20%, 9/01/20 | 521 | 579,763 | ||||||||||
Kinder Morgan Energy Partners LP | 3,189 | 3,135,447 | ||||||||||
4.15%, 3/01/22 | 683 | 686,488 | ||||||||||
ONEOK, Inc. | 2,855 | 2,670,216 | ||||||||||
Talent Yield Investments Ltd. | 2,845 | 2,831,495 | ||||||||||
TransCanada PipeLines Ltd. | 10 | 10,490 | ||||||||||
6.35%, 5/15/67 | 2,515 | 2,595,352 | ||||||||||
Williams Partners LP | 30 | 29,555 | ||||||||||
5.25%, 3/15/20 | 1,834 | 1,977,507 | ||||||||||
|
| |||||||||||
| 18,264,307 | ||||||||||||
|
| |||||||||||
| 23,028,671 | ||||||||||||
|
| |||||||||||
| Non Corporate Sectors–0.5% | ||||||||||||
| Agencies—Not Government Guaranteed–0.5% | ||||||||||||
CNOOC Finance 2013 Ltd. | 1,870 | 1,680,769 | ||||||||||
Gazprom OAO Via Gaz Capital SA | 1,978 | 2,166,108 | ||||||||||
Petrobras International Finance Co.–Pifco | 20 | 20,781 | ||||||||||
|
| |||||||||||
| 3,867,658 | ||||||||||||
|
| |||||||||||
| Total Corporates—Investment Grades (cost $180,668,446) | 188,556,271 | |||||||||||
|
| |||||||||||
| 2013 Annual Report | 11 |
Table of Contents
Schedule of Investments (continued)
| Principal Amount (000) | U.S. $ Value | |||||||||||
| MORTGAGE PASS-THROUGHS–23.8% | ||||||||||||
| Agency Fixed Rate 30-Year–18.8% | ||||||||||||
Federal Home Loan Mortgage Corp. Gold | U.S.$ | 2,730 | $ | 2,853,276 | ||||||||
4.50%, 10/01/39–2/01/41 | 11,396 | 12,125,661 | ||||||||||
Series 2005 | 46 | 49,636 | ||||||||||
Series 2007 | 966 | 1,055,532 | ||||||||||
Federal National Mortgage Association | 15,075 | 14,726,391 | ||||||||||
3.50%, 10/01/43, TBA | 43,435 | 44,215,475 | ||||||||||
4.00%, 10/01/43, TBA | 22,585 | 23,689,546 | ||||||||||
4.50%, 10/01/43, TBA | 8,010 | 8,554,430 | ||||||||||
5.00%, 10/01/43, TBA | 6,255 | 6,782,766 | ||||||||||
Series 2003 | 2,744 | 2,996,897 | ||||||||||
Series 2004 | 2,450 | 2,678,375 | ||||||||||
Series 2005 | 2,306 | 2,466,467 | ||||||||||
5.50%, 2/01/35 | 2,692 | 2,940,524 | ||||||||||
Series 2006 | 612 | 666,875 | ||||||||||
Series 2007 | 2,045 | 2,190,349 | ||||||||||
5.50%, 5/01/36–8/01/37 | 239 | 260,844 | ||||||||||
Series 2013 | 9,100 | 9,290,087 | ||||||||||
|
| |||||||||||
| 137,543,131 | ||||||||||||
|
| |||||||||||
| Agency Fixed Rate 15-Year–4.0% | ||||||||||||
Federal National Mortgage Association | 29,050 | 29,213,406 | ||||||||||
|
| |||||||||||
| Agency ARMs–1.0% | ||||||||||||
Federal Home Loan Mortgage Corp. | 1,760 | 1,870,778 | ||||||||||
2.385%, 11/01/35(b) | 3,083 | 3,279,950 | ||||||||||
2.62%, 5/01/35(b) | 751 | 793,849 | ||||||||||
Series 2006 | 2 | 1,927 | ||||||||||
Series 2007 | 3 | 2,786 | ||||||||||
Series 2008 | 364 | 385,927 | ||||||||||
Federal National Mortgage Association | 712 | 760,312 | ||||||||||
Series 2007 | 5 | 5,146 | ||||||||||
2.378%, 3/01/34(c) | 666 | 703,603 | ||||||||||
2.673%, 3/01/37(c) | 6 | 6,848 | ||||||||||
|
| |||||||||||
| 7,811,126 | ||||||||||||
|
| |||||||||||
| Total Mortgage Pass-Throughs (cost $169,176,612) | 174,567,663 | |||||||||||
|
| |||||||||||
| ASSET-BACKED SECURITIES–15.8% | ||||||||||||
| Autos—Fixed Rate–10.6% | ||||||||||||
Ally Auto Receivables Trust | U.S.$ | 3,803 | $ | 3,805,295 | ||||||||
Ally Master Owner Trust | 180 | 181,324 | ||||||||||
Series 2012-4, Class A | 2,525 | 2,519,331 | ||||||||||
AmeriCredit Automobile Receivables Trust | 3,225 | 3,232,234 | ||||||||||
Series 2013-1, Class A2 | 1,971 | 1,969,917 | ||||||||||
Series 2013-3, Class A3 | 3,380 | 3,378,575 | ||||||||||
Series 2013-4, Class A3 | 1,205 | 1,206,788 | ||||||||||
ARI Fleet Lease Trust | 2,238 | 2,235,571 | ||||||||||
Avis Budget Rental Car Funding AESOP LLC | 2,170 | 2,164,130 | ||||||||||
Series 2013-2A, Class A | 2,535 | 2,582,274 | ||||||||||
Bank of America Auto Trust | 1,825 | 1,835,322 | ||||||||||
Capital Auto Receivables Asset Trust | 2,500 | 2,505,435 | ||||||||||
Capital Auto Receivables Asset Trust/Ally | 1,955 | 1,953,053 | ||||||||||
CarMax Auto Owner Trust | 1,460 | 1,464,895 | ||||||||||
Exeter Automobile Receivables Trust | 1,561 | 1,563,993 | ||||||||||
Series 2013-1A, Class A | 1,104 | 1,101,150 | ||||||||||
Fifth Third Auto Trust | 1,943 | 1,938,806 | ||||||||||
Flagship Credit Auto Trust | 920 | 918,924 | ||||||||||
Ford Auto Securitization Trust | CAD | 1,674 | 1,627,829 | |||||||||
Series 2013-R4A, Class A1 | 1,230 | 1,194,117 | ||||||||||
| 12 | Sanford C. Bernstein Fund II, Inc. |
Table of Contents
| Principal Amount (000) | U.S. $ Value | |||||||||||
Ford Credit Auto Owner Trust | U.S.$ | 1,865 | $ | 1,873,943 | ||||||||
Series 2012-D, Class B | 860 | 849,777 | ||||||||||
Ford Credit Floorplan Master Owner Trust | 6,590 | 6,593,375 | ||||||||||
Series 2013-1, Class A1 | 1,689 | 1,686,314 | ||||||||||
Hertz Vehicle Financing LLC | 1,665 | 1,653,507 | ||||||||||
Series 2013-1A, Class A2 | 3,745 | 3,681,921 | ||||||||||
Hyundai Auto Lease Securitization Trust | 2,693 | 2,692,457 | ||||||||||
M&T Bank Auto Receivables Trust | 1,875 | 1,874,995 | ||||||||||
Mercedes-Benz Auto Lease Trust | 1,665 | 1,664,165 | ||||||||||
Mercedes-Benz Master Owner Trust | 4,203 | 4,184,591 | ||||||||||
Navistar Financial Corp. Owner Trust | 1,204 | 1,204,393 | ||||||||||
Nissan Auto Lease Trust | 648 | 648,312 | ||||||||||
Porsche Innovative Lease Owner Trust | 427 | 426,733 | ||||||||||
Santander Drive Auto Receivables Trust | 3,125 | 3,130,853 | ||||||||||
Series 2013-3, Class C | 2,404 | 2,355,583 | ||||||||||
Series 2013-4, Class A3 | 2,650 | 2,653,739 | ||||||||||
SMART Trust/Australia | 1,370 | 1,369,270 | ||||||||||
|
| |||||||||||
| 77,922,891 | ||||||||||||
|
| |||||||||||
| Credit Cards—Fixed Rate–2.0% | ||||||||||||
Cabela’s Master Credit Card Trust | 2,485 | 2,336,901 | ||||||||||
Chase Issuance Trust | 1,020 | 1,003,690 | ||||||||||
Discover Card Execution Note Trust | U.S.$ | 1,593 | $ | 1,599,332 | ||||||||
Discover Card Master Trust | 1,908 | 1,917,755 | ||||||||||
Dryrock Issuance Trust | 3,070 | 3,066,284 | ||||||||||
GE Capital Credit Card Master Note Trust | 2,660 | 2,558,385 | ||||||||||
World Financial Network Credit Card Master Trust | 1,815 | 1,814,906 | ||||||||||
|
| |||||||||||
| 14,297,253 | ||||||||||||
|
| |||||||||||
| Autos—Floating Rate–1.5% | ||||||||||||
BMW Floorplan Master Owner Trust | 3,257 | 3,257,118 | ||||||||||
Ford Credit Floorplan Master Owner Trust | 3,630 | 3,696,629 | ||||||||||
GE Dealer Floorplan Master Note Trust | 4,370 | 4,379,308 | ||||||||||
|
| |||||||||||
| 11,333,055 | ||||||||||||
|
| |||||||||||
| Other ABS—Fixed Rate–0.9% | ||||||||||||
CIT Equipment Collateral | 1,628 | 1,630,221 | ||||||||||
CNH Equipment Trust | 2,070 | 2,075,409 | ||||||||||
Series 2013-C, Class A2 | 1,649 | 1,649,302 | ||||||||||
GE Equipment Midticket LLC | 824 | 825,338 | ||||||||||
GE Equipment Small Ticket LLC | 55 | 54,967 | ||||||||||
|
| |||||||||||
| 6,235,237 | ||||||||||||
|
| |||||||||||
| Credit Cards—Floating Rate–0.4% | ||||||||||||
Penarth Master Issuer PLC | 3,298 | 3,302,100 | ||||||||||
|
| |||||||||||
| Home Equity Loans—Floating Rate–0.3% | ||||||||||||
Asset Backed Funding Certificates | 308 | 292,784 | ||||||||||
| 2013 Annual Report | 13 |
Table of Contents
Schedule of Investments (continued)
| Principal Amount (000) | U.S. $ Value | |||||||||||
GSAA Home Equity Trust | U.S.$ | 2,090 | $ | 1,353,154 | ||||||||
HSBC Home Equity Loan Trust | 360 | 352,944 | ||||||||||
Series 2006-1, Class M1 | 60 | 57,373 | ||||||||||
Wells Fargo Home Equity Trust | 141 | 134,357 | ||||||||||
|
| |||||||||||
| 2,190,612 | ||||||||||||
|
| |||||||||||
| Home Equity Loans—Fixed Rate–0.1% | ||||||||||||
Citifinancial Mortgage Securities, Inc. | 285 | 291,234 | ||||||||||
Credit-Based Asset Servicing and Securitization LLC | 201 | 198,998 | ||||||||||
|
| |||||||||||
| 490,232 | ||||||||||||
|
| |||||||||||
| Total Asset-Backed Securities (cost $116,226,151) | 115,771,380 | |||||||||||
|
| |||||||||||
| COMMERCIAL MORTGAGE-BACKED SECURITIES–11.1% | ||||||||||||
| Non-Agency Fixed Rate CMBS–10.2% | ||||||||||||
Bear Stearns Commercial Mortgage Securities, Inc. | 1,375 | 1,511,231 | ||||||||||
CGRBS Commercial Mortgage Trust | 2,495 | 2,384,359 | ||||||||||
Citigroup Commercial Mortgage Trust | 387 | 392,606 | ||||||||||
Series 2006-C4, Class A1A | 732 | 799,931 | ||||||||||
Commercial Mortgage Pass-Through Certificates | 1,575 | 1,669,930 | ||||||||||
Series 2013-CR6, Class A2 | 65 | 65,363 | ||||||||||
Series 2013-SFS, Class A1 | 1,228 | 1,192,495 | ||||||||||
Credit Suisse Commercial Mortgage Trust | 5,067 | 5,543,783 | ||||||||||
Series 2006-C3, Class AJ | 1,015 | 1,026,998 | ||||||||||
Credit Suisse First Boston Mortgage Securities Corp. | 530 | 531,682 | ||||||||||
Series 2005-C1, Class A4 | U.S.$ | 4,029 | $ | 4,170,653 | ||||||||
CW Capital Cobalt Ltd. | 1,589 | 1,774,999 | ||||||||||
Extended Stay America Trust | 1,740 | 1,711,849 | ||||||||||
Greenwich Capital Commercial Funding Corp. | 30 | 26,590 | ||||||||||
Series 2007-GG9, Class A4 | 4,745 | 5,250,168 | ||||||||||
GS Mortgage Securities Corp. II | 274 | 279,111 | ||||||||||
Series 2013-KING, Class A | 2,842 | 2,815,579 | ||||||||||
JP Morgan Chase Commercial Mortgage Securities Trust | 4,370 | 4,830,162 | ||||||||||
Series 2007-CB20, Class A1A | 3,904 | 4,372,659 | ||||||||||
Series 2007-LD11, Class A4 | 1,504 | 1,691,777 | ||||||||||
Series 2007-LDPX, Class A3 | 5,075 | 5,608,819 | ||||||||||
Series 2010-C2, Class A1 | 2,204 | 2,266,160 | ||||||||||
LB-UBS Commercial Mortgage Trust | 170 | 172,712 | ||||||||||
Merrill Lynch Mortgage Trust | 23 | 22,686 | ||||||||||
Series 2006-C2, Class A1A | 1,631 | 1,803,307 | ||||||||||
Merrill Lynch/Countrywide Commercial Mortgage Trust | 25 | 27,333 | ||||||||||
Series 2006-4, Class A1A | 6,090 | 6,669,964 | ||||||||||
Series 2007-9, Class A4 | 315 | 352,549 | ||||||||||
Morgan Stanley Capital I Trust | 3,810 | 4,303,991 | ||||||||||
Motel 6 Trust | 2,019 | 1,979,726 | ||||||||||
UBS-Barclays Commercial Mortgage Trust | 1,061 | 1,017,360 | ||||||||||
| 14 | Sanford C. Bernstein Fund II, Inc. |
Table of Contents
| Principal Amount (000) | U.S. $ Value | |||||||||||
Series 2012-C4, Class A5 | U.S.$ | 2,117 | $ | 1,975,230 | ||||||||
Wachovia Bank Commercial Mortgage Trust | 4,188 | 4,563,143 | ||||||||||
WF-RBS Commercial Mortgage Trust | 2,247 | 2,176,205 | ||||||||||
|
| |||||||||||
| 74,981,110 | ||||||||||||
|
| |||||||||||
| Non-Agency Floating Rate CMBS–0.9% | ||||||||||||
Extended Stay America Trust | 1,345 | 1,335,748 | ||||||||||
GS Mortgage Securities Corp. II | 2,700 | 2,674,335 | ||||||||||
GS Mortgage Securities Corp. II Trust | 1,110 | 1,113,544 | ||||||||||
GS Mortgage Securities Trust | 1,499 | 1,426,604 | ||||||||||
|
| |||||||||||
| 6,550,231 | ||||||||||||
|
| |||||||||||
| Agency CMBS–0.0% | ||||||||||||
Federal Home Loan Mortgage Corp. | 59 | 62,131 | ||||||||||
FHLMC Multifamily Structured Pass Through Certificates | 78 | 81,277 | ||||||||||
|
| |||||||||||
| 143,408 | ||||||||||||
|
| |||||||||||
| Total Commercial Mortgage-Backed Securities (cost $80,823,435) | 81,674,749 | |||||||||||
|
| |||||||||||
| GOVERNMENTS—TREASURIES–6.4% | ||||||||||||
| United States–6.4% | ||||||||||||
U.S. Treasury Bonds | 50 | 41,445 | ||||||||||
3.125%, 2/15/43 | 50 | 44,797 | ||||||||||
3.625%, 8/15/43 | 5,880 | 5,812,015 | ||||||||||
4.625%, 2/15/40 | 13,611 | 16,007,815 | ||||||||||
5.375%, 2/15/31 | 40 | 51,012 | ||||||||||
8.125%, 8/15/21 | 384 | 550,770 | ||||||||||
U.S. Treasury Notes | 395 | 395,077 | ||||||||||
0.25%, 2/28/14 | 390 | 390,320 | ||||||||||
0.50%, 7/31/17 | 235 | 230,575 | ||||||||||
0.625%, 4/30/18 | 55 | 53,462 | ||||||||||
0.75%, 6/30/17–2/28/18 | 220 | 216,494 | ||||||||||
0.875%, 11/30/16–1/31/18 | 960 | 961,244 | ||||||||||
| Principal Amount (000) | U.S. $ Value | |||||||||||
1.375%, 9/30/18 | U.S.$ | 3,010 | $ | 3,007,884 | ||||||||
1.50%, 6/30/16 | 160 | 164,088 | ||||||||||
1.625%, 8/15/22–11/15/22 | 245 | 227,891 | ||||||||||
2.00%, 11/15/21–2/15/22 | 125 | 121,815 | ||||||||||
2.125%, 8/15/21 | 125 | 123,984 | ||||||||||
2.50%, 8/15/23 | 17,240 | 17,064,911 | ||||||||||
2.625%, 4/30/16–11/15/20 | 1,659 | 1,730,642 | ||||||||||
|
| |||||||||||
Total Governments—Treasuries | 47,196,241 | |||||||||||
|
| |||||||||||
| AGENCIES–4.4% | ||||||||||||
| Agency Debentures–4.4% | ||||||||||||
Federal National Mortgage Association 6.25%, 5/15/29 | 8,051 | 10,304,298 | ||||||||||
6.625%, 11/15/30 | 5,575 | 7,451,852 | ||||||||||
Residual Funding Corp. Principal Strip Zero Coupon, 7/15/20 | 16,846 | 14,302,742 | ||||||||||
|
| |||||||||||
Total Agencies | 32,058,892 | |||||||||||
|
| |||||||||||
| CORPORATES—NON-INVESTMENT GRADES–3.4% | ||||||||||||
| Financial Institutions–1.8% | ||||||||||||
| Banking–1.5% | ||||||||||||
ABN Amro Bank NV | EUR | 570 | 737,118 | |||||||||
Bank of America Corp. | U.S.$ | 1,725 | 1,509,375 | |||||||||
Barclays Bank PLC | 1,645 | 1,630,606 | ||||||||||
Citigroup, Inc. | 2,630 | 2,452,475 | ||||||||||
HBOS Capital Funding LP | 784 | 767,340 | ||||||||||
LBG Capital No. 1 PLC | 1,240 | 1,296,172 | ||||||||||
LBG Capital No. 2 PLC | EUR | 755 | 1,494,312 | |||||||||
Royal Bank of Scotland Group PLC 5.00%, 10/01/14 | U.S.$ | 105 | 107,616 | |||||||||
Societe Generale SA | ||||||||||||
4.196%, 1/26/15 | EUR | 404 | 541,769 | |||||||||
5.922%, 4/05/17(a) | U.S.$ | 225 | 229,500 | |||||||||
|
| |||||||||||
| 10,766,283 | ||||||||||||
|
| |||||||||||
| Finance – 0.2% | ||||||||||||
SLM Corp. | 1,179 | 1,204,054 | ||||||||||
|
| |||||||||||
| Other Finance–0.1% | ||||||||||||
Aviation Capital Group Corp. | 955 | 1,037,690 | ||||||||||
|
| |||||||||||
| 13,008,027 | ||||||||||||
|
| |||||||||||
| 2013 Annual Report | 15 |
Table of Contents
Schedule of Investments (continued)
| Principal Amount (000) | U.S. $ Value | |||||||||||
| Industrial–1.5% | ||||||||||||
| Capital Goods–0.3% | ||||||||||||
B/E Aerospace, Inc. | U.S.$ | 1,740 | $ | 1,726,950 | ||||||||
Sealed Air Corp. | 736 | 697,360 | ||||||||||
|
| |||||||||||
| 2,424,310 | ||||||||||||
|
| |||||||||||
| Communications—Media–0.2% | ||||||||||||
DISH DBS Corp. | 910 | 844,025 | ||||||||||
Sirius XM Radio, Inc. | 923 | 842,238 | ||||||||||
|
| |||||||||||
| 1,686,263 | ||||||||||||
|
| |||||||||||
| Communications—Telecommunications–0.3% | ||||||||||||
MetroPCS Wireless, Inc. | 835 | 837,087 | ||||||||||
Sprint Corp. | 885 | 902,700 | ||||||||||
|
| |||||||||||
| 1,739,787 | ||||||||||||
|
| |||||||||||
| Consumer Cyclical—Automotive–0.1% | ||||||||||||
Dana Holding Corp. | 322 | 319,585 | ||||||||||
|
| |||||||||||
| Consumer Cyclical—Other–0.3% | ||||||||||||
MCE Finance Ltd. | 418 | 403,370 | ||||||||||
Wynn Las Vegas LLC/Wynn Las Vegas Capital Corp. | 1,745 | 1,753,725 | ||||||||||
|
| |||||||||||
| 2,157,095 | ||||||||||||
|
| |||||||||||
| Consumer Non-Cyclical–0.1% | ||||||||||||
HCA, Inc. | 900 | 847,125 | ||||||||||
|
| |||||||||||
| Energy–0.2% | ||||||||||||
Cimarex Energy Co. | 832 | 840,320 | ||||||||||
Denbury Resources, Inc. | 915 | 837,225 | ||||||||||
|
| |||||||||||
| 1,677,545 | ||||||||||||
|
| |||||||||||
| 10,851,710 | ||||||||||||
|
| |||||||||||
| Utility–0.1% | ||||||||||||
| Natural Gas–0.1% | ||||||||||||
MarkWest Energy Partners LP/MarkWest | 583 | 549,477 | ||||||||||
Regency Energy Partners LP/Regency | 251 | 227,155 | ||||||||||
|
| |||||||||||
| 776,632 | ||||||||||||
|
| |||||||||||
| Total Corporates—Non-Investment Grades (cost $23,331,362) | 24,636,369 | |||||||||||
|
| |||||||||||
| Principal Amount (000) | U.S. $ Value | |||||||||||
| INFLATION-LINKED SECURITIES–2.3% | ||||||||||||
| United States–2.3% | ||||||||||||
U.S. Treasury Inflation Index | U.S.$ | 16,181 | $ | 16,605,855 | ||||||||
|
| |||||||||||
| LOCAL GOVERNMENTS—MUNICIPAL BONDS–1.9% | ||||||||||||
| United States – 1.9% | ||||||||||||
California GO | 1,945 | 2,543,029 | ||||||||||
City Public Service Board of San Antonio |
| 2,310 | 2,397,041 | |||||||||
Metropolitan Transportation Authority |
| 2,200 | 2,230,448 | |||||||||
New York St Thruway Auth |
| 2,185 | 2,253,325 | |||||||||
Sacramento Unified School District | 2,315 | 2,362,504 | ||||||||||
University of California | 2,190 | 2,304,143 | ||||||||||
|
| |||||||||||
| Total Local Governments—Municipal Bonds (cost $13,308,532) | 14,090,490 | |||||||||||
|
| |||||||||||
| COLLATERALIZED MORTGAGE OBLIGATIONS–1.9% | ||||||||||||
| Non-Agency Fixed Rate–0.7% | ||||||||||||
Citigroup Mortgage Loan Trust, Inc. | 917 | 906,403 | ||||||||||
Countrywide Alternative Loan Trust | 2,292 | 1,505,438 | ||||||||||
Countrywide Home Loan Mortgage Pass-Through Trust | 1,726 | 1,352,341 | ||||||||||
First Horizon Alternative Mortgage | 1,306 | 1,104,134 | ||||||||||
JP Morgan Alternative Loan Trust | 400 | 287,113 | ||||||||||
Merrill Lynch Mortgage Investors Trust | 41 | 40,976 | ||||||||||
Residential Funding Mortgage Securities I | 31 | 29,151 | ||||||||||
|
| |||||||||||
| 5,225,556 | ||||||||||||
|
| |||||||||||
| Non-Agency Floating Rate–0.7% | ||||||||||||
Deutsche Alt-A Securities Mortgage Loan Trust | 2,136 | 1,214,842 | ||||||||||
| 16 | Sanford C. Bernstein Fund II, Inc. |
Table of Contents
| Principal Amount (000) | U.S. $ Value | |||||||||||
HomeBanc Mortgage Trust | U.S.$ | 1,149 | $ | 938,194 | ||||||||
IndyMac Index Mortgage Loan Trust | 1,641 | 1,205,421 | ||||||||||
Series 2006-AR27, Class 2A2 0.379%, 10/25/36(b) | 1,725 | 1,419,996 | ||||||||||
Sequoia Mortgage Trust | 111 | 99,170 | ||||||||||
Washington Mutual Mortgage Pass | 82 | 64,798 | ||||||||||
|
| |||||||||||
| 4,942,421 | ||||||||||||
|
| |||||||||||
| Agency Fixed Rate–0.5% | ||||||||||||
Fannie Mae Grantor Trust | 323 | 279,973 | ||||||||||
Federal National Mortgage Association | 6,951 | 1,248,787 | ||||||||||
Freddie Mac | 8,270 | 1,290,338 | ||||||||||
Freddie Mac Strips | 5,673 | 899,315 | ||||||||||
|
| |||||||||||
| 3,718,413 | ||||||||||||
|
| |||||||||||
| Total Collateralized Mortgage Obligations (cost $15,134,820) | 13,886,390 | |||||||||||
|
| |||||||||||
| QUASI-SOVEREIGNS–1.9% | ||||||||||||
| Quasi-Sovereign Bonds–1.9% | ||||||||||||
| Indonesia–0.3% | ||||||||||||
Perusahaan Listrik Negara PT | 2,009 | 1,918,595 | ||||||||||
|
| |||||||||||
| Kazakhstan–0.2% | ||||||||||||
KazMunayGas National Co. JSC | 1,426 | 1,607,815 | ||||||||||
|
| |||||||||||
| Malaysia–0.4% | ||||||||||||
Petronas Capital Ltd. | 2,675 | 2,962,763 | ||||||||||
|
| |||||||||||
| Mexico–0.2% | ||||||||||||
Petroleos Mexicanos Co. | 1,206 | 1,221,075 | ||||||||||
|
| |||||||||||
| South Korea–0.4% | ||||||||||||
Korea National Oil Corp. | 2,845 | 2,924,501 | ||||||||||
|
| |||||||||||
| United Arab Emirates–0.4% | ||||||||||||
IPIC GMTN Ltd. | 2,815 | 2,976,862 | ||||||||||
|
| |||||||||||
| Total Quasi-Sovereigns (cost $12,939,801) | 13,611,611 | |||||||||||
|
| |||||||||||
| Principal Amount (000) | U.S. $ Value | |||||||||||
| GOVERNMENTS—SOVEREIGN BONDS–1.0% | ||||||||||||
| Indonesia–0.2% | ||||||||||||
Republic of Indonesia | ||||||||||||
3.375%, 4/15/23(a) | U.S.$ | 620 | $ | 528,550 | ||||||||
5.25%, 1/17/42(a) | 1,407 | 1,192,433 | ||||||||||
|
| |||||||||||
| 1,720,983 | ||||||||||||
|
| |||||||||||
| Poland–0.0% | ||||||||||||
Poland Government International Bond | 54 | 56,635 | ||||||||||
|
| |||||||||||
| Qatar–0.4% | ||||||||||||
Qatar Government International Bond | 2,532 | 2,699,618 | ||||||||||
|
| |||||||||||
| Russia–0.2% | ||||||||||||
Russian Foreign Bond–Eurobond | 1,344 | 1,584,113 | ||||||||||
|
| |||||||||||
| Turkey–0.2% | ||||||||||||
Turkey Government International Bond | 1,821 | 1,502,325 | ||||||||||
|
| |||||||||||
| Total Governments—Sovereign Bonds (cost $7,806,358) | 7,563,674 | |||||||||||
|
| |||||||||||
| EMERGING MARKETS—CORPORATE BONDS–0.5% | ||||||||||||
| Industrial–0.5% | ||||||||||||
| Basic–0.1% | ||||||||||||
AngloGold Ashanti Holdings PLC | 380 | 339,467 | ||||||||||
|
| |||||||||||
| Capital Goods–0.1% | ||||||||||||
Cemex SAB de CV | 480 | 477,229 | ||||||||||
|
| |||||||||||
| Communications—Telecommunications–0.1% | ||||||||||||
MTS International Funding Ltd. | 390 | 362,579 | ||||||||||
VimpelCom Holdings BV | 692 | 686,374 | ||||||||||
|
| |||||||||||
| 1,048,953 | ||||||||||||
|
| |||||||||||
| Consumer Non-Cyclical–0.1% | ||||||||||||
Marfrig Overseas Ltd. | 945 | 878,850 | ||||||||||
|
| |||||||||||
| Energy–0.1% | ||||||||||||
Pacific Rubiales Energy Corp. | 554 | 504,469 | ||||||||||
|
| |||||||||||
| 3,248,968 | ||||||||||||
|
| |||||||||||
| Non Corporate Sectors–0.0% | ||||||||||||
| Agencies—Not Government Guaranteed–0.0% | ||||||||||||
Israel Electric Corp., Ltd. | 265 | 284,769 | ||||||||||
|
| |||||||||||
| Total Emerging Markets—Corporate Bonds (cost $3,708,228) | 3,533,737 | |||||||||||
|
| |||||||||||
| 2013 Annual Report | 17 |
Table of Contents
Schedule of Investments (continued)
| Company | Shares | U.S. $ Value | ||||||||||
| PREFERRED STOCKS–0.3% | ||||||||||||
| Financial Institutions–0.3% | ||||||||||||
| Insurance–0.3% | ||||||||||||
Allstate Corp. (The) | 82,828 | $ | 1,921,610 | |||||||||
|
| |||||||||||
| Principal Amount (000) | ||||||||||||
| BANK LOANS–0.1% | ||||||||||||
| Industrial–0.1% | ||||||||||||
| Technology–0.1% | ||||||||||||
IPC Systems, Inc. | U.S.$ | 750 | 624,375 | |||||||||
|
| |||||||||||
| GOVERNMENTS—SOVEREIGN AGENCIES–0.0% | ||||||||||||
| Germany–0.0% | ||||||||||||
Landwirtschaftliche Rentenbank | 20 | 22,726 | ||||||||||
|
| |||||||||||
| Company | Shares | U.S. $ Value | ||||||||||
| SHORT-TERM INVESTMENTS–16.5% | ||||||||||||
| Investment Companies–13.4% | ||||||||||||
AllianceBernstein Fixed-Income Shares, Inc.– |
| 98,162,483 | $ | 98,162,483 | ||||||||
|
| |||||||||||
| Principal Amount (000) | ||||||||||||
| Governments—Treasuries–3.1% | ||||||||||||
Japan Treasury Discount Bill | JPY | 2,260,000 | 22,990,074 | |||||||||
|
| |||||||||||
Total Short-Term Investments (cost $121,206,474) | 121,152,557 | |||||||||||
|
| |||||||||||
| Total Investments—117.0% (cost $838,725,335) | 857,474,590 | |||||||||||
Other assets less liabilities—(17.0)% |
| (124,685,021 | ) | |||||||||
|
| |||||||||||
| Net Assets—100.0% | $ | 732,789,569 | ||||||||||
|
| |||||||||||
| FUTURES (see Note 3) | ||||||||||||||||||||||
| Type | Number of Contracts | Expiration Month | Original Value | Value at September 30, 2013 | Unrealized Appreciation/ (Depreciation) | |||||||||||||||||
| Purchased Contracts | ||||||||||||||||||||||
U.S. T-Bond 30 Yr Futures | 123 | December 2013 | $ | 16,118,726 | $ | 16,405,125 | $ | 286,399 | ||||||||||||||
U.S. T-Note 5 Yr Futures | 69 | December 2013 | 8,244,531 | 8,352,234 | 107,703 | |||||||||||||||||
U.S. T-Note 10 Yr (CBT) Futures | 89 | December 2013 | 11,117,453 | 11,248,766 | 131,313 | |||||||||||||||||
| Sold Contracts | ||||||||||||||||||||||
U.S. T-Note 2 Yr Futures | 39 | December 2013 | 8,568,360 | 8,590,359 | (21,999 | ) | ||||||||||||||||
|
| |||||||||||||||||||||
| $ | 503,416 | |||||||||||||||||||||
|
| |||||||||||||||||||||
FORWARD CURRENCY EXCHANGE CONTRACTS (see Note 3) |
| |||||||||||||||||||
| Counterparty | Contracts to Deliver (000) | In Exchange For (000) | Settlement Date | Unrealized Appreciation/ (Depreciation) | ||||||||||||||||
Barclays Bank PLC Wholesale | GBP | 989 | USD | 1,573 | 11/08/13 | $ | (28,090 | ) | ||||||||||||
Deutsche Bank AG London | CAD | 3,655 | USD | 3,479 | 10/17/13 | (68,641 | ) | |||||||||||||
JPMorgan Chase Bank, NA | USD | 207 | CAD | 212 | 10/17/13 | (1,601 | ) | |||||||||||||
Royal Bank of Scotland PLC | JPY | 2,260,000 | USD | 22,861 | 11/25/13 | (137,531 | ) | |||||||||||||
State Street Bank & Trust Co. | USD | 281 | CAD | 290 | 10/17/13 | 103 | ||||||||||||||
UBS AG | EUR | 4,657 | USD | 6,221 | 11/08/13 | (79,492 | ) | |||||||||||||
|
| |||||||||||||||||||
| $ | (315,252 | ) | ||||||||||||||||||
|
| |||||||||||||||||||
| 18 | Sanford C. Bernstein Fund II, Inc. |
Table of Contents
| CENTRALLY CLEARED INTEREST RATE SWAPS (See Note 3) | ||||||||||||||||||
Rate Type | ||||||||||||||||||
| Clearing Agent/(Exchange) | Notional Amount (000) | Termination Date | Payments made by the Fund | Payments received by the Fund | Unrealized Appreciation/ (Depreciation) | |||||||||||||
Citigroup Global Markets, Inc./(CME Group) | EUR | 12,050 | 5/21/23 | 1.566% | 6 Month EURIBOR | $ 597,993 | ||||||||||||
Morgan Stanley & Co. LLC/(CME Group) | $ | 2,000 | 9/25/43 | 3 Month LIBOR | 3.722% | 25,321 | ||||||||||||
|
| |||||||||||||||||
| $ 623,314 | ||||||||||||||||||
|
| |||||||||||||||||
| INTEREST RATE SWAPS (See Note 3) | ||||||||||||||||||
Rate Type | ||||||||||||||||||
| Swap Counterparty | Notional Amount (000) | Termination Date | Payments made by the Fund | Payments received by the Fund | Unrealized Appreciation/ (Depreciation) | |||||||||||||
JPMorgan Chase Bank, NA | $11,590 | 1/30/17 | 1.059% | 3 Month LIBOR | $(79,913) | |||||||||||||
JPMorgan Chase Bank, NA | 12,780 | 2/07/22 | 2.043% | 3 Month LIBOR | 403,152 | |||||||||||||
|
| |||||||||||||||||
| $ 323,239 | ||||||||||||||||||
|
| |||||||||||||||||
| CREDIT DEFAULT SWAPS (see Note 3) | ||||||||||||||||||||||
| Swap Counterparty & Referenced Obligation | Fixed Rate (Pay) Receive | Implied Credit Spread at | Notional Amount (000) | Market Value | Upfront Premiums Paid (Received) | Unrealized Appreciation/ (Depreciation) | ||||||||||||||||
| Sale Contracts | ||||||||||||||||||||||
Credit Suisse International: | ||||||||||||||||||||||
Anadarko Petroleum Corp., 5.95%, 9/15/16, 9/20/17* | 1.00 | % | 0.60% | $ | 3,000 | $ | 46,082 | $ | (83,838 | ) | $ | 129,920 | ||||||||||
| * | Termination date |
| + | To obtain a copy of the fund’s financial statements, please go to the Securities Exchange Commission’s website at www.sec.gov, or call AllianceBernstein at (800) 227-4618. |
| (a) | Security is exempt from registration under Rule 144A of the Securities Act of 1933. These securities are considered liquid and may be resold in transactions exempt from registration, normally to qualified institutional buyers. At September 30, 2013, the aggregate market value of these securities amounted to $142,731,039 or 19.5% of net assets. |
| (b) | Floating Rate Security. Stated interest rate was in effect at September 30, 2013. |
| (c) | Variable rate coupon, rate shown as of September 30, 2013. |
| (d) | IO—Interest Only |
| (e) | Investment in affiliated money market mutual fund. The rate shown represents the 7-day yield as of period end. |
Currency Abbreviations:
CAD—Canadian Dollar
EUR—Euro
GBP—Great British Pound
JPY—Japanese Yen
USD—United States Dollar
Glossary:
ABS—Asset-Backed Securities
ARMs—Adjustable Rate Mortgages
CBT—Chicago Board of Trade
CDX-NAHY—North American High Yield Credit Default Swap Index
CMBS—Commercial Mortgage-Backed Securities
CME—Chicago Mercantile Exchange
EURIBOR—Euro Interbank Offered Rate
FHLMC—Federal Home Loan Mortgage Corporation
GO—General Obligation
JSC—Joint Stock Company
LIBOR—London Interbank Offered Rates
REIT—Real Estate Investment Trust
SPI—Share Price Index
TBA—To Be Announced
TIPS—Treasury Inflation Protected Security
See notes to financial statements.
| 2013 Annual Report | 19 |
Table of Contents
Statement of Assets and Liabilities—September 30, 2013
| INTERMEDIATE DURATION INSTITUTIONAL PORTFOLIO | ||||
| ASSETS | ||||
Investments in securities, at value | ||||
Unaffiliated issuers (cost $740,562,852) | $ | 759,312,107 | ||
Affiliated issuers (cost $98,162,483) (a) | 98,162,483 | |||
Foreign currencies, at value (cost $1,474,969) | 1,475,255 | |||
Cash (b)(c) | 2,487,481 | |||
Receivables: | ||||
Interest & dividends | 4,470,539 | |||
Investment securities sold | 23,710,509 | |||
Capital shares sold | 150,231 | |||
Unrealized appreciation of interest rate swaps | 403,152 | |||
Unrealized appreciation of credit default swaps | 129,920 | |||
Unrealized appreciation of forward currency exchange contracts | 103 | |||
|
| |||
Total assets | 890,301,780 | |||
|
| |||
| LIABILITIES | ||||
Payables: | ||||
Dividends to shareholders | 468,162 | |||
Investment securities purchased and foreign currency transactions | 154,794,233 | |||
Advisory fee | 243,978 | |||
Capital shares redeemed | 304,354 | |||
Margin owed to broker on futures | 1,102 | |||
Margin owed to broker on centrally cleared swaps | 19,474 | |||
Terminated centrally cleared swaps | 656,003 | |||
Accrued expenses | 151,799 | |||
Unrealized depreciation of interest rate swaps | 79,913 | |||
Unrealized depreciation of forward currency exchange contracts | 315,355 | |||
Collateral received from broker | 394,000 | |||
Premium received on credit default swaps | 83,838 | |||
|
| |||
Total liabilities | 157,512,211 | |||
|
| |||
NET ASSETS | $ | 732,789,569 | ||
|
| |||
SHARES OF CAPITAL STOCK OUTSTANDING | 47,208,868 | |||
|
| |||
NET ASSET VALUE, OFFERING AND REDEMPTION PRICE PER SHARE | $ | 15.52 | ||
|
| |||
| NET ASSETS CONSIST OF: | ||||
Capital stock, at par* | $ | 47,209 | ||
Additional paid-in capital | 712,190,519 | |||
Undistributed net investment income | 19,370 | |||
Accumulated net realized gain on investment and foreign currency transactions | 513,801 | |||
Net unrealized appreciation/depreciation of: | ||||
Investments, futures and swap transactions | 20,329,144 | |||
Foreign currency denominated assets and liabilities | (310,474 | ) | ||
|
| |||
| $ | 732,789,569 | |||
|
| |||
(a) Includes investment of cash collateral of $394,000 received from broker for OTC derivatives outstanding at September 30, 2013.
(b) An amount of $495,025 has been segregated to collateralize margin requirements for the open futures outstanding at September 30, 2013.
(c) An amount of $157,878 has been segregated to collateralize margin requirements for open centrally cleared swaps outstanding at September 30, 2013.
* The Sanford C. Bernstein Fund II, Inc., has authorized 18 billion shares of common stock with par value of $.001 per share.
See Notes to Financial Statements.
| 20 | Sanford C. Bernstein Fund II, Inc. |
Table of Contents
Statement of Operations—for the year ended September 30, 2013
| INTERMEDIATE DURATION INSTITUTIONAL PORTFOLIO | ||||
| INVESTMENT INCOME | ||||
Income: | ||||
Interest | $ | 30,118,857 | ||
Dividends | ||||
Unaffiliated issuers (a) | 52,820 | |||
Affiliated issuers | 84,204 | |||
|
| |||
Total income | 30,255,881 | |||
|
| |||
Expenses: | ||||
Advisory fee (see Note 2A) | 4,850,417 | |||
Custodian fee | 240,637 | |||
Transfer Agent fee | 15,759 | |||
Auditing and tax fees | 70,933 | |||
Directors’ fees and expenses | 58,805 | |||
Printing fees | 28,012 | |||
Registration fees | 14,893 | |||
Legal fees | 10,780 | |||
Miscellaneous | 61,532 | |||
|
| |||
Total expenses | 5,351,768 | |||
Less: expenses waived and reimbursed by the Adviser (see Note 2A) | (979,702 | ) | ||
|
| |||
Net expenses | 4,372,066 | |||
|
| |||
Net investment income | 25,883,815 | |||
|
| |||
REALIZED AND UNREALIZED GAIN (LOSS) ON INVESTMENT AND FOREIGN CURRENCY TRANSACTIONS | ||||
Net realized gain (loss) on: | ||||
Investment transactions | 4,137,565 | |||
Futures | 145,689 | |||
Swaps | (953,840 | ) | ||
Foreign currency transactions | 436,278 | |||
|
| |||
Net realized gain on investment and foreign currency transactions | 3,765,692 | |||
|
| |||
Net change in unrealized appreciation/depreciation of: | ||||
Investments | (49,096,585 | ) | ||
Futures | 511,669 | |||
Swaps | 1,820,893 | |||
Foreign currency denominated assets and liabilities and other assets | (287,168 | ) | ||
|
| |||
Net change in unrealized appreciation/depreciation of investments and foreign currency denominated assets and liabilities | (47,051,191 | ) | ||
|
| |||
Net realized and unrealized loss on investment and foreign currency transactions | (43,285,499 | ) | ||
|
| |||
Net decrease in net assets resulting from operations | $ | (17,401,684 | ) | |
|
| |||
(a) Net of foreign withholding taxes of $14.
See Notes to Financial Statements.
| 2013 Annual Report | 21 |
Table of Contents
Statement of Changes in Net Assets
| INTERMEDIATE DURATION INSTITUTIONAL PORTFOLIO | ||||||||
| YEAR ENDED 9/30/13 | YEAR ENDED 9/30/12 | |||||||
| INCREASE (DECREASE) IN NET ASSETS FROM | ||||||||
Operations: | ||||||||
Net investment income | $ | 25,883,815 | $ | 29,077,867 | ||||
Net realized gain on investment and foreign currency transactions | 3,765,692 | 13,304,930 | * | |||||
Net change in unrealized appreciation/depreciation of investments and foreign currency denominated assets and liabilities and other assets | (47,051,191 | ) | 19,592,157 | |||||
Contributions from Adviser (see Note 2) | 0 | 954,688 | * | |||||
|
|
|
| |||||
Net increase (decrease) in net assets resulting from operations | (17,401,684 | ) | 62,929,642 | |||||
|
|
|
| |||||
Dividends and distributions to shareholders: | ||||||||
Dividends from net investment income | (30,779,134 | ) | (30,847,179 | ) | ||||
Distributions from net realized gain on investment transactions | (6,245,586 | ) | (16,909,302 | ) | ||||
|
|
|
| |||||
Total dividends and distributions to shareholders | (37,024,720 | ) | (47,756,481 | ) | ||||
|
|
|
| |||||
Capital-share transactions: | ||||||||
Net proceeds from sales of shares | 220,573,541 | 280,546,608 | ||||||
Net proceeds from sales of shares issued to shareholders on reinvestment of dividends and distributions | 29,480,795 | 34,218,300 | ||||||
|
|
|
| |||||
Total proceeds from shares sold | 250,054,336 | 314,764,908 | ||||||
Cost of shares redeemed | (568,065,035 | ) | (432,303,989 | ) | ||||
|
|
|
| |||||
Net decrease in net assets from capital-share transactions | (318,010,699 | ) | (117,539,081 | ) | ||||
|
|
|
| |||||
Net decrease in net assets | (372,437,103 | ) | (102,365,920 | ) | ||||
| NET ASSETS: | ||||||||
Beginning of period | 1,105,226,672 | 1,207,592,592 | ||||||
|
|
|
| |||||
End of period (a) | $ | 732,789,569 | $ | 1,105,226,672 | ||||
|
|
|
| |||||
(a) Includes undistributed net investment income of: | $ | 19,370 | $ | 2,973,963 | ||||
|
|
|
| |||||
* Amount reclassified from realized gain (loss) on investment transactions.
See Notes to Financial Statements.
| 22 | Sanford C. Bernstein Fund II, Inc. |
Table of Contents
Selected per-share data and ratios for a share of capital stock outstanding for the Portfolio for each of the periods presented:
| INTERMEDIATE DURATION INSTITUTIONAL PORTFOLIO | ||||||||||||||||||||
| YEAR ENDED 9/30/13 | YEAR ENDED 9/30/12 | YEAR ENDED 9/30/11 | YEAR ENDED 9/30/10 | YEAR ENDED 9/30/09 | ||||||||||||||||
Net asset value, beginning of period | $ | 16.39 | $ | 16.17 | $ | 16.08 | $ | 15.10 | $ | 13.93 | ||||||||||
|
|
|
|
|
|
|
|
|
| |||||||||||
Income from investment operations | ||||||||||||||||||||
Investment income, net† | 0.43 | 0.41 | 0.57 | 0.65 | 0.70 | |||||||||||||||
Net realized and unrealized gain (loss) on investment and foreign currency transactions | (0.70 | ) | 0.47 | * | 0.25 | 1.08 | 1.26 | |||||||||||||
Contributions from Adviser | 0 | 0.01 | * | 0 | 0 | 0 | ||||||||||||||
|
|
|
|
|
|
|
|
|
| |||||||||||
Total from investment operations | (0.27 | ) | 0.89 | 0.82 | 1.73 | 1.96 | ||||||||||||||
|
|
|
|
|
|
|
|
|
| |||||||||||
Less dividends and distributions: | ||||||||||||||||||||
Dividends from net investment income | (0.50 | ) | (0.43 | ) | (0.58 | ) | (0.66 | ) | (0.71 | ) | ||||||||||
Dividends from net realized gain on investment transactions | (0.10 | ) | (0.24 | ) | (0.15 | ) | (0.09 | ) | (0.08 | ) | ||||||||||
|
|
|
|
|
|
|
|
|
| |||||||||||
Total dividends and distributions | (0.60 | ) | (0.67 | ) | (0.73 | ) | (0.75 | ) | (0.79 | ) | ||||||||||
|
|
|
|
|
|
|
|
|
| |||||||||||
Net asset value, end of period | $ | 15.52 | $ | 16.39 | $ | 16.17 | $ | 16.08 | $ | 15.10 | ||||||||||
|
|
|
|
|
|
|
|
|
| |||||||||||
Total return (a) | (1.67 | )%** | 5.70% | # | 5.30% | 11.76% | 14.80% | |||||||||||||
| RATIOS/SUPPLEMENTAL DATA | ||||||||||||||||||||
Net assets, end of period (000 omitted) | $732,790 | $1,105,227 | $1,207,593 | $1,123,905 | $1,026,838 | |||||||||||||||
Average net assets (000 omitted) | $970,083 | $1,146,019 | $1,143,740 | $1,105,250 | $967,750 | |||||||||||||||
Ratio to average net assets of: | ||||||||||||||||||||
Expenses, net of waivers/reimbursements | 0.45% | 0.45% | 0.45% | 0.45% | + | 0.45% | ||||||||||||||
Expenses, before waivers/reimbursements | 0.55% | 0.54% | 0.54% | 0.54% | + | 0.54% | ||||||||||||||
Net investment income | 2.67% | 2.54% | 3.61% | 4.19% | + | 5.05% | ||||||||||||||
Portfolio turnover rate | 193% | 136% | 121% | 105% | 75% | |||||||||||||||
| † | Based on average shares outstanding. |
| * | Amount reclassified from realized gain (loss) on investment transactions. |
| ** | Includes the impact of proceeds received and credited to the Portfolio resulting from class action settlements, which enhanced the performance of the Portfolio for the year ended September 30, 2013 by 0.01%. |
| # | Includes the Adviser’s reimbursement in respect of the Lehman Bankruptcy Claim which contributed to the Portfolio’s performance by 0.08% for the year ended September 30, 2012, (see Note 2). |
| + | The ratio includes expenses attributable to costs of proxy solicitation. |
| (a) | Total investment return is calculated assuming an initial investment made at the net asset value at the beginning of the period, reinvestment of all dividends and distributions at net asset value during the period, and redemption on the last day of the period. Total return does not reflect the deduction of taxes that a shareholder would pay on fund distributions or the redemption of fund shares. Total investment return calculated for a period of less than one year is not annualized. |
See Notes to Financial Statements.
| 2013 Annual Report | 23 |
Table of Contents
| NOTE 1. | Organization and Significant Accounting Policies |
Sanford C. Bernstein Fund II, Inc. (the “Fund”) is a managed open-end registered investment company incorporated in Maryland on February 7, 2002. The Fund, currently comprises one portfolio, the Intermediate Duration Institutional Portfolio (the “Portfolio”). The preparation of financial statements in accordance with U.S. generally accepted accounting principles (“U.S. GAAP”) requires management to make estimates and assumptions that affect the reported amounts and disclosures in the financial statements. Actual results could differ from those estimates. The following is a summary of significant accounting policies followed by the Fund.
| A. | Portfolio Valuation |
Portfolio securities are valued at their current market value determined on the basis of market quotations or, if market quotations are not readily available or are deemed unreliable, at “fair value” as determined in accordance with procedures established by and under the general supervision of the Fund’s Board of Directors (the “Board”).
In general, the market values of securities which are readily available and deemed reliable are determined as follows: securities listed on a national securities exchange (other than securities listed on the NASDAQ Stock Market, Inc. (“NASDAQ”)) or on a foreign securities exchange are valued at the last sale price at the close of the exchange or foreign securities exchange. If there has been no sale on such day, the securities are valued at the last traded price from the previous day. Securities listed on more than one exchange are valued by reference to the principal exchange on which the securities are traded; securities listed only on NASDAQ are valued in accordance with the NASDAQ Official Closing Price; listed or over the counter (“OTC”) market put or call options are valued at the mid level between the current bid and ask prices. If either a current bid or current ask price is unavailable, AllianceBernstein L.P. (the “Adviser”) will have discretion to determine the best valuation (e.g. last trade price in the case of listed options); open futures are valued using the closing settlement price or, in the absence of such a price, the most recent quoted bid price. If there are no quotations available for the day of valuation, the last available closing settlement price is used; U.S. government securities and other debt instruments having 60 days or less remaining until maturity are valued at amortized cost if their original maturity was 60 days or less; or by amortizing their fair value as of the 61st day prior to maturity if their original term to maturity exceeded 60 days; fixed-income securities, including mortgage-backed and asset-backed securities, may be valued on the basis of prices provided by a pricing service or at a price obtained from one or more of the major broker-dealers. In cases where broker-dealer quotes are obtained, the Adviser may establish procedures whereby changes in market yields or spreads are used to adjust, on a daily basis, a recently obtained quoted price on a security. Swaps and other derivatives are valued daily, primarily using independent pricing services, independent pricing models using market inputs, as well as third party broker-dealers or counterparties. Investments in money market funds are valued at their net asset value each day.
Securities for which market quotations are not readily available (including restricted securities) or are deemed unreliable are valued at fair value. Factors considered in making this determination may include, but are not limited to, information obtained by contacting the issuer, analysts, analysis of the issuer’s financial statements or other available documents. In addition, the Fund may use fair value pricing for securities primarily traded in non-U.S. markets because most foreign markets close well before the Fund values its securities at 4:00 p.m., Eastern Time. The earlier close of these foreign markets gives rise to the possibility that significant events, including broad market moves, may have occurred in the interim and may materially affect the value of those securities.
| B. | Fair Value Measurements |
In accordance with U.S. GAAP regarding fair value measurements, fair value is defined as the price that the Portfolio would receive to sell an asset or pay to transfer a liability in an orderly transaction between market participants at the measurement date. U.S. GAAP establishes a framework for measuring fair value, and a three-level hierarchy for fair value measurements based upon the transparency of inputs to the valuation of an asset or liability (including those based on their market values as described in Note A above). Inputs may be observable or unobservable and refer broadly to the assumptions that market participants would use in pricing the asset or liability. Observable inputs reflect the assumptions market participants would use in pricing the asset or liability based on market data obtained from sources independent of the Portfolio. Unobservable inputs reflect the Portfolio’s own assumptions about the assumptions that market participants
| 24 | Sanford C. Bernstein Fund II, Inc. |
Table of Contents
would use in pricing the asset or liability based on the best information available in the circumstances. Each investment is assigned a level based upon the observability of the inputs which are significant to the overall valuation. The three-tier hierarchy of inputs is summarized below.
| • | Level 1—quoted prices in active markets for identical investments |
| • | Level 2—other significant observable inputs (including quoted prices for similar investments, interest rates, prepayment speeds, credit risk, etc.) |
| • | Level 3—significant unobservable inputs (including the Portfolio’s own assumptions in determining the fair value of investments) |
The fair value of debt instruments, such as bonds, and over-the-counter derivatives is generally based on market price quotations, recently executed market transactions (where observable) or industry recognized modeling techniques and are generally classified as Level 2. Pricing vendor inputs to Level 2 valuations may include quoted prices for similar investments in active markets, interest rate curves, coupon rates, currency rates, yield curves, option adjusted spreads, default rates, credit spreads and other unique security features in order to estimate the relevant cash flows which is then discounted to calculate fair values. If these inputs are unobservable and significant to the fair value, these investments will be classified as Level 3. In addition, non-agency rated investments are classified as Level 3.
Where readily available market prices or relevant bid prices are not available for certain equity investments, such investments may be valued based on similar publicly traded investments, movements in relevant indices since last available prices or based upon underlying company fundamentals and comparable company data (such as multiples to earnings or other multiples to equity). Where an investment is valued using an observable input, such as another publicly traded security, the investment will be classified as Level 2. If management determines that an adjustment is appropriate based on restrictions on resale, illiquidity or uncertainty, and such adjustment is a significant component of the valuation, the investment will be classified as Level 3. An investment will also be classified as Level 3 where management uses company fundamentals and other significant inputs to determine the valuation.
Valuations of mortgage-backed or other asset-backed securities, by pricing vendors, are based on both proprietary and industry recognized models and discounted cash flow techniques. Significant inputs to the valuation of these instruments are value of the collateral, the rates and timing of delinquencies, the rates and timing of prepayments, and default and loss expectations, which are driven in part by housing prices for residential mortgages. Significant inputs are determined based on relative value analyses, which incorporate comparisons to instruments with similar collateral and risk profiles, including relevant indices. Mortgage and asset-backed securities for which management has collected current observable data through pricing services are generally categorized within Level 2. Those investments for which current observable data has not been provided are classified as Level 3.
Bank loan prices are provided by third party pricing services and consist of a composite of the quotes received by the vendor into a consensus price. Bank loans are classified as Level 3, as a significant input used in the fair value measurement of these instruments is the market quotes that are received by the vendor and these inputs are not observable.
Other fixed income investments, including non-U.S. government and corporate debt, are generally valued using quoted market prices, if available, which are typically impacted by current interest rates, maturity dates and any perceived credit risk of the issuer. Additionally, in the absence of quoted market prices, these inputs are used by pricing vendors to derive a valuation based upon industry or proprietary models which incorporate issuer specific data with relevant yield/spread comparisons with more widely quoted bonds with similar key characteristics. Those investments for which there are observable inputs are classified as Level 2. Where the inputs are not observable, the investments are classified as Level 3.
| 2013 Annual Report | 25 |
Table of Contents
Notes to Financial Statements (continued)
The following table summarizes the valuation of the Portfolio’s investments by the above fair value hierarchy levels as of September 30, 2013:
| INVESTMENTSIN SECURITIES: | LEVEL 1 | LEVEL 2 | LEVEL 3 | TOTAL | ||||||||||||
Assets: | ||||||||||||||||
Corporates—Investment Grades | $ | — | $ | 188,556,271 | $ | — | $ | 188,556,271 | ||||||||
Mortgage Pass-Throughs | — | 174,567,663 | — | 174,567,663 | ||||||||||||
Asset-Backed Securities | — | 106,855,299 | 8,916,081 | 115,771,380 | ||||||||||||
Commercial Mortgage-Backed Securities | — | 77,815,840 | 3,858,909 | 81,674,749 | ||||||||||||
Governments—Treasuries | — | 47,196,241 | — | 47,196,241 | ||||||||||||
Agencies | — | 32,058,892 | — | 32,058,892 | ||||||||||||
Corporates—Non-Investment Grades | — | 24,636,369 | — | 24,636,369 | ||||||||||||
Inflation-Linked Securities | — | 16,605,855 | — | 16,605,855 | ||||||||||||
Local Governments—Municipal Bonds | — | 14,090,490 | — | 14,090,490 | ||||||||||||
Collateralized Mortgage Obligations | — | 3,718,413 | 10,167,977 | 13,886,390 | ||||||||||||
Quasi-Sovereigns | — | 13,611,611 | — | 13,611,611 | ||||||||||||
Governments—Sovereign Bonds | — | 7,563,674 | — | 7,563,674 | ||||||||||||
Emerging Markets—Corporate Bonds | — | 3,533,737 | — | 3,533,737 | ||||||||||||
Preferred Stocks | 1,921,610 | — | — | 1,921,610 | ||||||||||||
Bank Loans | — | — | 624,375 | 624,375 | ||||||||||||
Governments—Sovereign Agencies | — | 22,726 | — | 22,726 | ||||||||||||
Short-Term Investments: | ||||||||||||||||
Investment Companies | 98,162,483 | — | — | 98,162,483 | ||||||||||||
Governments-Treasuries | — | 22,990,074 | — | 22,990,074 | ||||||||||||
Total Investments in Securities | 100,084,093 | 733,823,155 | 23,567,342 | 857,474,590 | ||||||||||||
Other Financial Instruments* : | ||||||||||||||||
Assets: | ||||||||||||||||
Futures | 525,415 | — | — | 525,415 | # | |||||||||||
Forward Currency Exchange Contracts | — | 103 | — | 103 | ||||||||||||
Centrally Cleared Interest Rate Swaps | — | 623,314 | — | 623,314 | # | |||||||||||
Interest Rate Swaps | — | 403,152 | — | 403,152 | ||||||||||||
Credit Default Swaps | — | 129,920 | — | 129,920 | ||||||||||||
Liabilities: | ||||||||||||||||
Futures | (21,999 | ) | — | — | (21,999 | ) # | ||||||||||
Forward Currency Exchange Contracts | — | (315,355 | ) | — | (315,355 | ) | ||||||||||
Interest Rate Swaps | — | (79,913 | ) | — | (79,913 | ) | ||||||||||
Total+ | $ | 100,587,509 | $ | 734,584,376 | $ | 23,567,342 | $ | 858,739,227 | ||||||||
| * | Other financial instruments are derivative instruments, such as futures, forwards and swaps, which are valued at the unrealized appreciation/depreciation on the instrument. |
| # | Only variation margin receivable/payable at period end is reported within the statement of assets and liabilities. This amount reflects cumulative appreciation/depreciation as reported in the schedule of investments. |
| + | There were no transfers between Level 1 and Level 2 during the reporting period. |
The Portfolio recognizes all transfers between levels of the fair value hierarchy assuming the financial instruments were transferred at the beginning of the reporting period.
| 26 | Sanford C. Bernstein Fund II, Inc. |
Table of Contents
The following is a reconciliation of investments in which significant unobservable inputs (Level 3) were used in determining fair value.
| ASSET- BACKED SECURITIES | COMMERCIAL MORTGAGE- BACKED SECURITIES | COLLATERALIZED MORTGAGE OBLIGATIONS | ||||||||||
Balance as of 9/30/12 | $ | 14,500,930 | $ | 7,106,163 | $ | 3,811,820 | ||||||
Accrued discounts/(premiums) | 12,765 | (56,386 | ) | 34,217 | ||||||||
Realized gain (loss) | (799,154 | ) | 251,313 | (545,298 | ) | |||||||
Change in unrealized appreciation/depreciation | 725,296 | (220,112 | ) | 309,531 | ||||||||
Purchases | 3,381,359 | 1,135,855 | 8,086,418 | |||||||||
Sales | (4,729,556 | ) | (4,357,924 | ) | (1,249,712 | ) | ||||||
Transfers in to Level 3 | — | — | — | |||||||||
Transfers out of Level 3 | (4,175,559 | ) | — | (278,999 | ) | |||||||
|
|
|
|
|
| |||||||
Balance as of 9/30/13+ | $ | 8,916,081 | $ | 3,858,909 | $ | 10,167,977 | ||||||
|
|
|
|
|
| |||||||
Net change in unrealized appreciation/depreciation from Investments held as of 9/30/13* | $ | (76,568 | ) | $ | (217,523 | ) | $ | 152,432 | ||||
| BANK LOANS | WARRANTS^ | TOTAL | ||||||||||
Balance as of 9/30/12 | $ | 658,315 | $ | — | $ | 26,077,228 | ||||||
Accrued discounts/(premiums) | 348 | — | (9,056 | ) | ||||||||
Realized gain (loss) | (251,808 | ) | — | (1,344,947 | ) | |||||||
Change in unrealized appreciation/depreciation | 244,989 | — | 1,059,704 | |||||||||
Purchases | — | — | 12,603,632 | |||||||||
Sales | (27,469 | ) | — | (10,364,661 | ) | |||||||
Transfers in to Level 3 | — | — | — | |||||||||
Transfers out of Level 3 | — | — | (4,454,558 | ) | ||||||||
|
|
|
|
|
| |||||||
Balance as of 9/30/13 | $ | 624,375 | $ | — | $ | 23,567,342 | ||||||
|
|
|
|
|
| |||||||
Net change in unrealized appreciation/depreciation from Investments held as of 9/30/13* | $ | (13,125 | ) | $ | — | $ | (154,784 | ) | ||||
| + | There were de minimis transfers under 1% of net assets during the reporting period. |
| ^ | The Portfolio held securities with zero market value that were written off during the reporting period. |
| * | The unrealized appreciation/depreciation is included in net change in unrealized appreciation/depreciation of investments in the accompanying statement of operations. |
The following presents information about significant unobservable inputs related to the Portfolio with material categories of Level 3 investments at September 30, 2013:
QUANTITATIVE INFORMATIONABOUT LEVEL 3 FAIR VALUE MEASUREMENTS | ||||||||||||
| FAIR VALUEAT 9/30/13 | VALUATION TECHNIQUE | UNOBSERVABLE INPUT | RANGE/ WEIGHTED AVERAGE | |||||||||
Asset-Backed Securities | $ | 8,916,081 | Third Party Vendor | Evaluated Quotes | $64.74-$102.20/ $94.47 | |||||||
Commercial Mortgage-Backed Securities | $ | 3,858,909 | Third Party Vendor | Evaluated Quotes | $88.63-$112.48/ $105.80 | |||||||
Collateralized Mortgage Obligations | $ | 10,167,977 | Third Party Vendor | Evaluated Quotes | $56.87-$100.16/ $76.75 | |||||||
Bank Loans | $ | 624,375 | Third Party Vendor | Vendor Quotes | $83.25/ N/A | |||||||
| 2013 Annual Report | 27 |
Table of Contents
Notes to Financial Statements (continued)
The Adviser has established a Valuation Committee (the “Committee”) which is responsible for overseeing the pricing and valuation of all securities held in the Portfolio. The Committee operates under pricing and valuation policies and procedures established by the Adviser and approved by the Board, including pricing policies which set forth the mechanisms and processes to be employed on a daily basis to implement these policies and procedures. In particular, the pricing policies describe how to determine market quotations for securities and other instruments. The Committee’s responsibilities include: 1) fair value and liquidity determinations (and oversight of any third parties to whom any responsibility for fair value and liquidity determinations is delegated), and 2) regular monitoring of the Adviser’s pricing and valuation policies and procedures and modification or enhancement of these policies and procedures (or recommendation of the modification of these policies and procedures) as the Committee believes appropriate.
The Committee is also responsible for monitoring the implementation of the pricing policies by the Adviser’s Pricing Group (the “Pricing Group”) and a third party which performs certain pricing functions in accordance with the pricing policies. The Pricing Group is responsible for the oversight of the third party on a day-to-day basis. The Committee and the Pricing Group perform a series of activities to provide reasonable assurance of the accuracy of prices including: 1) periodic vendor due diligence meetings, review of methodologies, new developments and process at vendors, 2) daily compare of security valuation versus prior day for all securities that exceeded established thresholds, and 3) daily review of unpriced, stale, and variance reports with exceptions reviewed by senior management and the Committee.
In addition, several processes outside of the pricing process are used to monitor valuation issues including: 1) performance and performance attribution reports are monitored for anomalous impacts based upon benchmark performance, and 2) portfolio managers review all portfolios for performance and analytics (which are generated using the Adviser’s prices).
| C. | Foreign Currency Translation |
The accounting records of the Portfolio are maintained in U.S. dollars. Prices of securities and other assets and liabilities denominated in non-U.S. currencies are translated into U.S. dollars using the exchange rate at 4:00 p.m., Eastern Time. Amounts related to the purchases and sales of securities, investment income and expenses are translated at the rates of exchange prevailing on the respective dates of such transactions.
Net realized gain or loss on foreign currency transactions represents net foreign exchange gains or losses from the closure of forward currency exchange contracts, disposition of foreign currencies, currency gains or losses realized between the trade and settlement dates on security transactions and the difference between the amount of dividends, interest and foreign withholding taxes recorded on the Portfolio’s books and the U.S. dollar equivalent amount actually received or paid. Net unrealized currency gains and losses arising from valuing foreign currency denominated assets and liabilities, other than security investments, at the current exchange rate are reflected as part of unrealized appreciation/depreciation on foreign currencies.
The Portfolio does not isolate that portion of the results of operations arising as a result of changes in the foreign exchange rates from the changes in the market prices of securities held at period end. The Portfolio does not isolate the effect of changes in foreign exchange rates from changes in market prices of equity securities sold during the year. The Portfolio does isolate the effect of changes in foreign exchange rates from changes in market prices of debt securities sold during the year, as required by the Internal Revenue Code.
The Portfolio may invest in foreign securities and foreign currency transactions that may involve risks not associated with domestic investments as a result of the level of governmental supervision and regulation of foreign securities markets and the possibility of political or economic instability, among others.
| D. | Taxes |
The Portfolio intends to continue to comply with the requirements of Subchapter M of the Internal Revenue Code of 1986 as they apply to regulated investment companies. By so complying, the Portfolio will not be subject to federal and state income taxes to the extent that all of its income is distributed. The Portfolio may be subject to taxes imposed by countries in which it invests. Such taxes are generally based on income and/or capital gains earned or repatriated. Taxes are accrued and applied to net investment income, net realized gains and net unrealized appreciation/depreciation as such income and/or gains are earned based on management’s understanding of applicable local tax law.
| 28 | Sanford C. Bernstein Fund II, Inc. |
Table of Contents
In accordance with U.S. GAAP requirements regarding accounting for uncertainties in income taxes, management has analyzed the Portfolio’s tax positions taken or expected to be taken on federal and state income tax returns for all open tax years (the current and the prior three tax years) and has concluded that no provision for income tax is required in the Portfolio’s financial statements.
| E. | Security Transactions and Related Investment Income |
Security transactions are accounted for on the trade date (the date the buy or sell order is executed). Securities gains and losses are calculated on the identified cost basis. Interest income is recorded on the accrual basis and dividend income is recorded on the ex-dividend date or as soon as the Fund is informed of the dividend. The Portfolio amortizes premiums and accretes discounts as adjustments to interest income.
| F. | Securities Transactions on a When-Issued or Delayed-Delivery Basis |
The Portfolio may purchase securities on a when-issued basis or purchase or sell securities on a delayed-delivery basis. At the time the Portfolio commits to purchase a security on a when-issued or delayed-delivery basis, the Portfolio will record the transaction and use the security’s value in determining the Portfolio’s net asset value. At the time the Portfolio commits to sell a security on a delayed-delivery basis, the Portfolio will record the transaction and exclude the security’s value in determining the Portfolio’s net asset value.
| G. | Distribution of Income and Gains |
Net investment income of the Portfolio is declared and recorded as a dividend to shareholders daily and is payable to shareholders monthly.
Distributions of net realized gains, less any available loss carryforwards, if any, for the Portfolio will be paid to shareholders at least once a year, and recorded on the ex-dividend date.
Elements of realized gains and net investment income may be recorded in different accounting periods for financial reporting (book) and federal income tax (tax) purposes (temporary differences). To the extent that such distributions required for tax purposes exceed income and gains recorded for book purposes as a result of such temporary differences, “excess distributions” are reflected in the accompanying statement of assets and liabilities. To the extent distributions exceed income and gains for tax purposes, such distributions would be shown as “return of capital” on the statement of changes in net assets. Certain other differences—permanent differences—arise because treatment of elements of income and gains is different between book and tax accounting. Permanent differences are reclassified in the year they arise.
Permanent differences have no effect on net assets. The effect of such permanent differences on the Portfolio, which includes reclassifications of foreign currency gain (loss), paydown gain (loss), swap income (loss), the tax treatment of partnership investments and the redesignation of dividends, is reflected as an adjustment to the components of capital as of September 30, 2013, as shown below:
INCREASE (DECREASE) TO ADDITIONAL PAID-IN CAPITAL | INCREASE (DECREASE) TO UNDISTRIBUTED NET INVESTMENT INCOME (LOSS) | INCREASE (DECREASE) NET REALIZED GAIN (LOSS) | ||||||||||
| $ | 0 | $ | 1,940,726 | ($ | 1,940,726 | ) | ||||||
| H. | Repurchase Agreements |
It is the Portfolio’s policy that its custodian or designated subcustodian take control of securities as collateral under repurchase agreements and to determine on a daily basis that the value of such securities are sufficient to cover the value of the repurchase agreements. If the seller defaults and the value of the collateral declines or if bankruptcy proceedings are commenced with respect to the seller of the security, realization of collateral by the Portfolio may be delayed or limited.
| 2013 Annual Report | 29 |
Table of Contents
Notes to Financial Statements (continued)
| NOTE 2. | Investment Management and Transactions with Affiliated Persons |
| A. | Advisory Fee |
Under the Advisory Agreement between the Fund and the Adviser, the Adviser manages the investment of the Portfolio’s assets, places purchase and sale orders, and bears various expenses, including the salaries and expenses of all personnel except those of outside directors. In addition, the Adviser agrees to permit its directors, officers and employees who may be elected directors or officers of the Fund to serve in the capacities to which they are elected. The Adviser renders these services subject to the general oversight of the Board.
The Portfolio pays the Adviser an advisory fee at an annual rate of 0.50% of the average daily net assets of the Portfolio for the first $1 billion and 0.45% thereafter. Pursuant to an Expense Limitation Agreement, during the reporting period, the Adviser waived a portion of its advisory fee or reimbursed the Portfolio for a portion of its expenses to the extent necessary to limit the Portfolio’s expenses to 0.45%. This waiver extends through January 31, 2014 and may be extended by the Adviser for additional one-year terms. For the year ended September 30, 2013, the aggregate amount of such fee waiver was $979,702.
| B. | Distribution Arrangements |
Under the Distribution Agreement between the Fund, on behalf of the Portfolio, and Sanford C. Bernstein & Co., LLC (the “Distributor”), the Distributor agrees to act as agent to sell shares of the Portfolio. The Distributor receives no fee for this service, and furthermore agrees to pay all expenses arising from the performance of its obligations under this agreement. The Distributor is a wholly owned subsidiary of the Adviser.
| C. | Investments and other transactions with Affiliated Issuers |
The Portfolio may invest in the AllianceBernstein Fixed-Income Shares, Inc.—Government STIF Portfolio (“Government STIF Portfolio”), an open-end management investment company managed by the Adviser. The Government STIF Portfolio is offered as a cash management option to mutual funds and other institutional accounts of the Adviser, and is not available for direct purchase by members of the public. The Government STIF Portfolio pays no investment management fees but does bear its own expenses. A summary of the Portfolio’s transactions in shares of the Government STIF Portfolio for the year ended September 30, 2013 is as follows:
MARKET VALUE SEPTEMBER 30, 2012 (000) | PURCHASES AT COST (000) | SALES PROCEEDS (000) | MARKET VALUE SEPTEMBER 30, 2013 (000) | DIVIDEND INCOME (000) | ||||||||||||||||
| $31,407 | $ | 1,036,823 | $ | 970,068 | $ | 98,162 | $ | 84 | ||||||||||||
Brokerage commissions paid on investment transactions for the year ended September 30, 2013 amounted to $2,140, of which $0 and $0, respectively, was paid to Sanford C. Bernstein & Co., LLC and Sanford C. Bernstein & Co., Ltd., affiliates of the Adviser.
Prior to September 15, 2008, the Portfolio had swap counterparty exposure to Lehman Brothers Holdings Inc. (“Lehman Brothers”), as a guarantor for Lehman Brothers Special Financing Inc. (“LBSF”), which filed for bankruptcy on September 15, 2008. As a result, on September 15, 2008, the Portfolio terminated all outstanding swap contracts with LBSF prior to their scheduled maturity dates in accordance with the terms of the swap agreements. Upon the termination of the swap contracts, Lehman Brothers’ obligations to the Portfolio amounted to $1,918,971. The Portfolio’s claim to these obligations was subject to the bankruptcy proceeding against the Lehman Brothers estate (the “Bankruptcy Claim”). In accordance with its error correction policy, the Adviser has agreed to make the Portfolio whole in respect of the amount of the recovery that was to be paid on the Bankruptcy Claim in the event the Bankruptcy Claim was not honored by the Lehman Brothers estate, or with respect to any diminution in value upon the sale of the Bankruptcy Claim, in either case resulting from the manner in which the Bankruptcy Claim was processed by the Adviser. On April 9, 2012, the portfolio management team determined to dispose of the position held by the Portfolio that reflects the Bankruptcy Claim (thereby realizing upon the corresponding undertaking of the Adviser to make payment in respect of the Bankruptcy Claim to make the Portfolio whole). On that date, the Bankruptcy Claim was being valued at $954,688 (49.75% of the Bankruptcy Claim), based upon the estimated recovery value. Accordingly, on April 13, 2012, the Adviser reimbursed the Portfolio in an amount equal to $954,688.
| 30 | Sanford C. Bernstein Fund II, Inc. |
Table of Contents
| NOTE 3. | Investment Security Transactions |
| A. | Purchases and Sales |
For the year ended September 30, 2013, the Portfolio had purchases and sales transactions, excluding transactions in short-term instruments, as follows:
| PURCHASES | SALES | |||||||
Investment securities (excluding U.S. government securities) | $ | 267,062,663 | $ | 286,218,763 | ||||
U.S. government securities | 1,578,388,375 | 1,793,140,774 | ||||||
The cost of investments for federal income tax purposes, gross unrealized appreciation and unrealized depreciation (excluding futures, foreign currency and swap transactions) are as follows:
Cost | $ | 838,795,261 | ||
|
| |||
Gross unrealized appreciation | $ | 27,011,686 | ||
Gross unrealized depreciation | (8,332,357 | ) | ||
|
| |||
Net unrealized appreciation | $ | 18,679,329 | ||
|
|
| B. | Derivative Financial Instruments |
The Portfolio may use derivatives in an effort to earn income and enhance returns, to replace more traditional direct investments, to obtain exposure to otherwise inaccessible markets (collectively, “investment purposes”), or to hedge or adjust the risk profile of its portfolio.
The principal types of derivatives utilized by the Portfolio, as well as the methods in which they may be used are:
| • | Futures |
The Portfolio may buy or sell futures for investment purposes or for the purpose of hedging its portfolio against adverse effects of potential movements in the market. The Portfolio bears the market risk that arises from changes in the value of these instruments and the imperfect correlation between movements in the price of the futures and movements in the price of the assets, reference rates or indices which they are designed to track. Among other things, the Portfolio may purchase or sell futures for foreign currencies or options thereon for non-hedging purposes as a means of making direct investment in foreign currencies, as described below under “Currency Transactions”.
At the time the Portfolio enters into futures, the Portfolio deposits and maintains as collateral an initial margin with the broker, as required by the exchange on which the transaction is effected. Pursuant to the contract, the Portfolio agrees to receive from or pay to the broker an amount of cash equal to the daily fluctuation in the value of the contract. Such receipts or payments are known as variation margin and are recorded by the Portfolio as unrealized gains or losses. Risks may arise from the potential inability of a counterparty to meet the terms of the contract. The credit/counterparty risk for exchange-traded futures is generally less than privately negotiated futures, since the clearinghouse, which is the issuer or counterparty to each exchange-traded future, has robust risk mitigation standards, including the requirement to provide initial and variation margin. When the contract is closed, the Portfolio records a realized gain or loss equal to the difference between the value of the contract at the time it was opened and the time it was closed.
Use of long futures subjects the Portfolio to risk of loss in excess of the amounts shown on the statement of assets and liabilities, up to the notional value of the futures. Use of short futures subjects the Portfolio to unlimited risk of loss. The Portfolio may enter into futures only on exchanges or boards of trade. The exchange or board of trade acts as the counterparty to each futures transaction; therefore, the Portfolio’s credit risk is limited to failure of the exchange or board of trade. Under some circumstances, futures exchanges may establish daily limits on the amount that the price of futures can vary from the previous day’s settlement price, which could effectively prevent liquidation of unfavorable positions.
During the year ended September 30, 2013, the Portfolio held futures for hedging purposes.
| 2013 Annual Report | 31 |
Table of Contents
Notes to Financial Statements (continued)
| • | Forward Currency Exchange Contracts |
The Portfolio may enter into forward currency exchange contracts in order to hedge its exposure to changes in foreign currency exchange rates on its foreign portfolio holdings, to hedge certain firm purchase and sale commitments denominated in foreign currencies and for non-hedging purposes as a means of making direct investments in foreign currencies, as described below under “Currency Transactions”.
A forward currency exchange contract is a commitment to purchase or sell a foreign currency at a future date at a negotiated forward rate. The gain or loss arising from the difference between the original contract and the closing of such contract would be included in net realized gain or loss on foreign currency transactions. Fluctuations in the value of open forward currency exchange contracts are recorded for financial reporting purposes as unrealized appreciation and/or depreciation by the Portfolio. Risks may arise from the potential inability of a counterparty to meet the terms of a contract and from unanticipated movements in the value of a foreign currency relative to the U.S. dollar.
During the year ended September 30, 2013, the Portfolio held forward currency exchange contracts for hedging purposes.
| • | Swaps |
The Portfolio may enter into swaps to hedge its exposure to interest rates, credit risk, or currencies. The Portfolio may also enter into swaps for non-hedging purposes as a means of gaining market exposures including by making direct investments in foreign currencies, as described below under “Currency Transactions”. A swap is an agreement that obligates two parties to exchange a series of cash flows at specified intervals based upon or calculated by reference to changes in specified prices or rates for a specified amount of an underlying asset. The payment flows are usually netted against each other, with the difference being paid by one party to the other. In addition, collateral may be pledged or received by the Portfolio in accordance with the terms of the respective swaps to provide value and recourse to the Portfolio or its counterparties in the event of default, bankruptcy or insolvency by one of the parties to the swap.
Risks may arise as a result of the failure of the counterparty to the swap to comply with the terms of the swap. The loss incurred by the failure of a counterparty is generally limited to the net interim payment to be received by the Portfolio, and/or the termination value at the end of the contract. Therefore, the Portfolio considers the creditworthiness of each counterparty to a swap in evaluating potential counterparty risk. This risk is mitigated by having a netting arrangement between the Portfolio and the counterparty and by the posting of collateral by the counterparty to the Portfolio to cover the Portfolio’s exposure to the counterparty. Additionally, risks may arise from unanticipated movements in interest rates or in the value of the underlying securities. The Portfolio accrues for the interim payments on swaps on a daily basis, with the net amount recorded within unrealized appreciation/depreciation of swaps on the statement of assets and liabilities, where applicable. Once the interim payments are settled in cash, the net amount is recorded as realized gain/(loss) on swaps on the statement of operations, in addition to any realized gain/(loss) recorded upon the termination of swaps. Upfront premiums paid or received are recognized as cost or proceeds on the statement of assets and liabilities and are amortized on a straight line basis over the life of the contract. Amortized upfront premiums are included in net realized gain/(loss) from swaps on the statement of operations. Fluctuations in the value of swaps are recorded as a component of net change in unrealized appreciation/depreciation of swaps on the statement of operations.
Certain standardized swaps, including certain interest rate swaps and credit default swaps, are (or soon will be) subject to mandatory central clearing. Cleared swaps are transacted through futures commission merchants (“FCMs”) that are members of central clearinghouses, with the clearinghouse serving as central counterparty, similar to transactions in futures contracts. Centralized clearing will be required for additional categories of swaps on a phased-in basis based on requirements published by the Securities Exchange Commission and Commodity Futures Trading Commission.
At the time the Portfolio enters into a centrally cleared swap, the Portfolio deposits and maintains as collateral an initial margin with the broker, as required by the exchange on which the transaction is effected. Pursuant to the contract, the Portfolio agrees to receive from or pay to the broker an amount of cash equal to the daily fluctuation in the value of the contract.
Such receipts or payments are known as variation margin and are recorded by the Portfolio as unrealized gains or losses. Risks may arise from the potential of a counterparty to meet the terms of the contract. The credit/counterparty risk for exchange-traded swaps is generally less than privately negotiated swaps, since the clearinghouse, which is the issuer or counterparty to each exchange-traded swap, has robust risk mitigation standards, including the requirement to provide initial and variation margin. When the contract is closed, the Portfolio records a realized gain or loss equal to the difference between the value of the contract at the time it was opened and the time it was closed.
| 32 | Sanford C. Bernstein Fund II, Inc. |
Table of Contents
Interest Rate Swaps:
The Portfolio is subject to interest rate risk exposure in the normal course of pursuing its investment objectives. Because the Portfolio holds fixed rate bonds, the value of these bonds may decrease if interest rates rise. To help hedge against this risk and to maintain its ability to generate income at prevailing market rates, the Portfolio may enter into interest rate swaps. Interest rate swaps are agreements between two parties to exchange cash flows based on a notional amount. The Portfolio may elect to pay a fixed rate and receive a floating rate, or, receive a fixed rate and pay a floating rate on a notional amount.
In addition, the Portfolio may also enter into interest rate swap transactions to preserve a return or spread on a particular investment or portion of its portfolio, or protecting against an increase in the price of securities the Portfolio anticipates purchasing at a later date. Interest rate swaps involve the exchange by a Portfolio with another party of their respective commitments to pay or receive interest (e.g., an exchange of floating rate payments for fixed rate payments) computed based on a contractually-based principal (or “notional”) amount. Interest rate swaps are entered into on a net basis (i.e., the two payment streams are netted out, with the Portfolio receiving or paying, as the case may be, only the net amount of the two payments).
During the year ended September 30, 2013, the Portfolio held interest rate swaps for hedging purposes.
Credit Default Swaps:
The Portfolio may enter into credit default swaps for multiple reasons, including to manage its exposure to the market or certain sectors of the market, to reduce its risk exposure to defaults by corporate and sovereign issuers held by the Portfolio, or to create exposure to corporate or sovereign issuers to which it is not otherwise exposed. The Portfolio may purchase credit protection (“Buy Contract”) or provide credit protection (“Sale Contract”) on the referenced obligation of the credit default swap. During the term of the swap, the Portfolio receives/(pays) fixed payments from/(to) the respective counterparty, calculated at the agreed upon rate applied to the notional amount. If the Portfolio is a buyer/(seller) of protection and a credit event occurs, as defined under the terms of the swap, the Portfolio will either (i) receive from the seller/(pay to the buyer) of protection an amount equal to the notional amount of the swap (the “Maximum Payout Amount”) and deliver/(take delivery of) the referenced obligation or (ii) receive/(pay) a net settlement amount in the form of cash or securities equal to the notional amount of the swap less the recovery value of the referenced obligation.
Credit default swaps may involve greater risks than if a Portfolio had invested in the referenced obligation directly. Credit default swaps are subject to general market risk, liquidity risk, counterparty risk and credit risk. If the Portfolio is a buyer of protection and no credit event occurs, it will lose the payments it made to its counterparty. If the Portfolio is a seller of protection and a credit event occurs, the value of the referenced obligation received by the Portfolio coupled with the periodic payments previously received, may be less than the Maximum Payout Amount it pays to the buyer, resulting in a net loss to the Portfolio.
During the year ended September 30, 2013, the Portfolio held credit default swaps for non-hedging purposes.
Implied credit spreads utilized in determining the market value of credit default swaps on issuers as of period end are disclosed in the schedule of investments. The implied spreads serve as an indicator of the current status of the payment/performance risk and typically reflect the likelihood of default by the issuer of the referenced obligation. The implied credit spread of a particular reference obligation also reflects the cost of buying/selling protection and may reflect upfront payments required to be made to enter into the agreement. Widening credit spreads typically represent a deterioration of the referenced obligation’s credit soundness and greater likelihood of default or other credit event occurring as defined under the terms of the agreement. A credit spread identified as “Defaulted” indicates a credit event has occurred for the referenced obligation.
At September 30, 2013, the Portfolio had Sale Contracts outstanding with Maximum Payout Amounts aggregating $3,000,000, with unrealized appreciation of $129,920, and terms of less than 4 years, as reflected in the schedule of investments.
In certain circumstances Maximum Payout Amounts may be partially offset by recovery values of the respective referenced obligations, upfront premium received upon entering into the agreement, or net amounts received from settlement of buy protection credit default swaps entered into by the Portfolio for the same reference obligation with the same counterparty.
As of September 30, 2013, the Portfolio had no Buy Contracts outstanding with respect to the same referenced obligation and same counterparty for its Sale Contracts outstanding.
| 2013 Annual Report | 33 |
Table of Contents
Notes to Financial Statements (continued)
Documentation governing the Portfolio’s OTC derivatives may contain provisions for early termination of such transaction in the event the net assets of the Portfolio decline below specific levels set forth in the documentation (“net asset contingent features”). If these levels are triggered, the Portfolio’s counterparty has the right to terminate such transaction and require the Portfolio to pay or receive a settlement amount in connection with the terminated transaction. As of September 30, 2013, the Portfolio had OTC derivatives with contingent features in net liability positions in the amount of $313,754. If a trigger event had occurred at September 30, 2013, for those derivatives in a net liability position, an amount of $313,754 would be required to be posted by the Portfolio.
At September 30, 2013, the Portfolio had entered into the following derivatives:
| ASSET DERIVATIVES | LIABILITY DERIVATIVES | |||||||||||
| DERIVATIVE TYPE | STATEMENTOF ASSETS AND LIABILITIES LOCATION | FAIR VALUE | STATEMENTOF ASSETS AND LIABILITIES LOCATION | FAIR VALUE | ||||||||
Interest rate contracts | Margin due from/ owed to broker on futures | $ | 525,415 | * | Margin due from/ owed to broker on futures | $ | 21,999 | * | ||||
Foreign exchange contracts | Unrealized appreciation of forward currency exchange contracts | 103 | Unrealized depreciation of forward currency exchange contracts | 315,355 | ||||||||
Interest rate contracts | Unrealized appreciation on interest rate swaps | 403,152 | Unrealized depreciation on interest rate swaps | 79,913 | ||||||||
Interest rate contracts | Margin due from/ owed to broker on centrally cleared swaps | 623,314 | * | |||||||||
Credit contracts | Unrealized appreciation on credit default swaps | 129,920 | ||||||||||
Total | $ | 1,681,904 | $ | 417,267 | ||||||||
| * | Only variation margin receivable/payable at period end is reported within the statement of assets and liabilities. This amount reflects cumulative appreciation/(depreciation) as reported in the schedule of investments. |
The effect of derivative instruments on the statement of operations for the year ended September 30, 2013:
| DERIVATIVE TYPE | LOCATION OF GAIN OR (LOSS) ON DERIVATIVES | REALIZED GAIN OR (LOSS)ON DERIVATIVES | CHANGE IN UNREALIZED APPRECIATIONOR (DEPRECIATION) | |||||||
Interest Rate contracts | Net realized gain (loss) on futures; Net change in unrealized appreciation/depreciation of futures | $ | 145,689 | $ | 511,669 | |||||
Foreign exchange contracts | Net realized gain (loss) on foreign currency transactions; Net change in unrealized appreciation/depreciation of foreign currency denominated assets and liabilities | 21,056 | (289,498 | ) | ||||||
Interest rate contracts | Net realized gain (loss) on swaps; Net change in unrealized appreciation/depreciation of swaps | (1,058,741 | ) | 1,072,026 | ||||||
Interest rate contracts | Net realized gain (loss) on swaps; Net change in unrealized appreciation/depreciation of swaps | 84,071 | 623,314 | |||||||
Credit contracts | Net realized gain (loss) on swaps; Net change in unrealized appreciation/depreciation of swaps | 20,830 | 125,553 | |||||||
Total | $ | (787,095 | ) | $ | 2,043,064 | |||||
| 34 | Sanford C. Bernstein Fund II, Inc. |
Table of Contents
The following table represents the volume of the Portfolio’s derivative transactions during the year ended September 30, 2013:
Futures: | ||||||
Average original value of buy contracts | $ | 23,286,277 | (a) | |||
Average original value of sale contracts | $ | 11,200,858 | ||||
Forward Currency Exchange Contracts: | ||||||
Average principal amount of buy contracts | $ | 359,674 | (b) | |||
Average principal amount of sale contracts | $ | 39,207,238 | ||||
Interest Rate Swaps: | ||||||
Average notional amount | $ | 27,415,076 | ||||
Centrally Cleared Interest Rate Swaps: | ||||||
Average notional amount | $ | 27,385,061 | (c) | |||
Credit Default Swaps: | ||||||
Average notional amount of sale contracts | $ | 3,107,692 | ||||
Centrally Cleared Credit Default Swaps: | ||||||
Average notional amount of buy contracts | $ | 10,500,000 | (d) | |||
Average notional amount of sale contracts | $ | 10,500,000 | (d) | |||
| (a) | Positions were open for three months during the period. |
| (b) | Positions were open for eight months during the period. |
| (c) | Positions were open for five months during the period. |
| (d) | Positions were open for one month during the period. |
| C. | Currency Transactions |
The Portfolio may invest in non-U.S. Dollar securities on a currency hedged or unhedged basis. The Portfolio may seek investment opportunities by taking long or short positions in currencies through the use of currency-related derivatives, including forward currency exchange contracts, futures and options on futures, swaps, and other options. The Portfolio may enter into transactions for investment opportunities when it anticipates that a foreign currency will appreciate or depreciate in value but securities denominated in that currency are not held by the Portfolio and do not present attractive investment opportunities. Such transactions may also be used when the Adviser believes that it may be more efficient than a direct investment in a foreign currency-denominated security. The Portfolio may also conduct currency exchange contracts on a spot basis (i.e., for cash at the spot rate prevailing in the currency exchange market for buying or selling currencies).
| D. | Mortgage-Backed Dollar Rolls |
The Portfolio may enter into dollar rolls. Dollar rolls involve sales by the Portfolio of securities for delivery in the current month and the Portfolio simultaneously contracting to repurchase substantially similar (same type and coupon) securities on a specified future date. During the roll period, the Portfolio forgoes principal and interest paid on the securities. The Portfolio is compensated by the difference between the current sales price and the lower forward price for the future purchase (often referred to as the “drop”) as well as by the interest earned on the cash proceeds of the initial sale. Dollar rolls involve the risk that the market value of the securities the Portfolio is obligated to repurchase under the agreement may decline below the repurchase price. Dollar rolls are speculative techniques and may be considered to be borrowings by the Portfolio. For the year ended September 30, 2013, the Portfolio earned drop income of $2,211,260 which is included in interest income in the accompanying statement of operations.
| E. | Reverse Repurchase Agreements |
Under a reverse repurchase agreement, the Portfolio sells securities and agrees to repurchase them at a mutually agreed upon date and price. At the time the Portfolio enters into a reverse repurchase agreement, it will establish a segregated account with the custodian containing liquid assets having a value at least equal to the repurchase price. For the year
| 2013 Annual Report | 35 |
Table of Contents
Notes to Financial Statements (continued)
ended September 30, 2013, the average amount of reverse repurchase agreements outstanding was $2,515,488 and the daily weighted average interest rate was (0.91)%. During the year, the Portfolio received net interest payments from counterparties.
| NOTE 4. | Distributions to Shareholders |
The tax character of distributions paid during the fiscal years ended September 30, 2013 and September 30, 2012 were as follows:
| 2013 | 2012 | |||||||
Distributions paid from: | ||||||||
Ordinary income | $ | 31,680,559 | $ | 32,819,931 | ||||
Net long-term capital gains | 5,344,161 | 14,936,550 | ||||||
|
|
|
| |||||
Total distributions paid | $ | 37,024,720 | $ | 47,756,481 | ||||
|
|
|
| |||||
As of September 30, 2013, the components of accumulated earnings/(deficit) on a tax basis were as follows:
UNDISTRIBUTED INCOME | UNDISTRIBUTED LONG-TERM CAPITAL GAINS | ACCUMULATED CAPITAL AND GAINS (LOSSES)(a) | UNREALIZED APPRECIATION/ | TOTAL ACCUMULATED EARNINGS/ (DEFICIT)(c) | ||||||||||||
$91,523 | $ | 1,083,874 | ($ | 1,609 | ) | $ | 19,846,218 | $ | 21,020,006 | |||||||
| (a) | For the year ended September 30, 2013, the Portfolio elected to defer $1,609 of straddle losses. |
| (b) | The differences between book-basis and tax-basis unrealized appreciation (depreciation) are attributable primarily to tax deferral of losses on wash sales, the tax treatment of swaps, Treasury inflation-protected securities, and the realization for tax purposes of gains/losses on certain derivative instruments. |
| (c) | The difference between book-basis and tax-basis components of accumulated earnings/(deficit) is attributable to dividends payable. |
For tax purposes, net capital losses may be carried over to offset future capital gains, if any. Under the Regulated Investment Company Modernization Act of 2010, funds are permitted to carry forward capital losses incurred in taxable years beginning after December 22, 2010 for an indefinite period. These post-enactment capital losses must be utilized prior to the pre-enactment capital losses, which are subject to expiration. Post-enactment capital loss carryforwards will retain their character as either short-term or long-term capital losses rather than being considered short-term as under previous regulation. As of September 30, 2013, the Portfolio did not have any capital loss carryforwards.
| NOTE 5. | Risks Involved in Investing in the Portfolio |
Interest Rate Risk and Credit Risk—Interest rate risk is the risk that changes in interest rates will affect the value of a Portfolio’s investments in fixed-income debt securities such as bonds or notes. Increases in interest rates may cause the value of a Portfolio’s investments to decline. Credit risk is the risk that the issuer or guarantor of a debt security, or the counterparty to a derivative contract, will be unable or unwilling to make timely principal and/or interest payments, or to otherwise honor its obligations. The degree of risk for a particular security may be reflected in its credit risk rating. Credit risk is greater for medium quality and lower-rated securities. Lower-rated debt securities and similar unrated securities (commonly known as “junk bonds”) have speculative elements or are predominantly speculative risks.
Actions by a Few Major Investors—In certain countries, volatility may be heightened by actions of a few major investors. For example, substantial increases or decreases in cash flows of mutual funds investing in these markets could significantly affect local stock prices and, therefore, share prices of the Portfolio.
Duration Risk—Duration is the measure that relates the expected price volatility of a fixed-income security to changes in interest rates. The duration of a fixed-income security may be shorter than or equal to full maturity of a fixed-income security. Fixed-income securities with longer durations have more risk and will decrease in price as interest rates rise. For example, a fixed-income security with a duration of three years will decrease in value by approximately 3% if interest rates increase by 1%.
| 36 | Sanford C. Bernstein Fund II, Inc. |
Table of Contents
Inflation Risk—This is the risk that the value of assets or income from investments will be less in the future as inflation decreases the value of money. As inflation increases, the value of the Portfolio’s assets can decline as can the value of the Portfolio’s distributions.
Inflation-Protected Securities Risk—The terms of inflation-protected securities provide for the coupon and/or maturity value to be adjusted based on changes in inflation. Decreases in the inflation rate or in investors’ expectations about inflation could cause these securities to underperform non-inflation-adjusted securities on a total-return basis.
Foreign (Non-U.S.) Securities Risk—Investments in foreign securities entail significant risks in addition to those customarily associated with investing in U.S. securities. These risks include risks related to economic, political and social instability, which could disrupt the financial markets in which the Portfolio invests and adversely affect the value of the Portfolio’s assets. The risks of investing in foreign (non-U.S.) securities are heightened with respect to investments in emerging-market countries, where there is an even greater amount of economic, political and social instability.
Foreign Currency Risk—This is the risk that changes in foreign (non-U.S.) currency exchange rates may negatively affect the value of the Portfolio’s investments or reduce the returns of the Portfolio. For example, the value of the Portfolio’s investments in foreign stocks and foreign currency positions may decrease if the U.S. dollar is strong (i.e., gaining value relative to other currencies) and other currencies are weak (i.e., losing value relative to the U.S. dollar).
Derivatives Risk–The Portfolio may enter into derivative transactions such as forwards, options, futures and swaps. Derivatives may be illiquid, difficult to price, and leveraged so that small changes may produce disproportionate losses for the Portfolio, and subject to counterparty risk to a greater degree than more traditional investments. Derivatives may result in significant losses, including losses that are far greater than the value of the derivatives reflected in the statement of assets and liabilities.
Mortgage-Related Securities Risk—In the case of mortgage-related securities that are not backed by the U.S. Government or one of its agencies, a loss could be incurred if the collateral backing these securities is insufficient.
Prepayment and Extension Risk—Prepayment risk is the risk that a loan, bond or other security might be called or otherwise converted, prepaid or redeemed before maturity. If this happens, particularly during a time of declining interest rates or credit spreads, the Portfolio may not be able to invest the proceeds in securities providing as much income, resulting in a lower yield to the Portfolio. Conversely, extension risk is the risk that as interest rates rise or spreads widen, payments of securities may occur more slowly than anticipated by the market. When this happens, the values of these securities may go down because their interest rates are lower than current market rates and they remain outstanding longer than anticipated.
Subordination Risk—The Portfolio may invest in securities that are subordinated to more senior securities of an issuer, or which represent interests in pools of such subordinated securities. Subordinated securities will be disproportionately affected by a default or even a perceived decline in creditworthiness of the issuer. Subordinated securities are more likely to suffer a credit loss than non-subordinated securities of the same issuer, any loss incurred by the subordinated securities is likely to be proportionately greater, and any recovery of interest or principal may take more time. As a result, even a perceived decline in creditworthiness of the issuer is likely to have a greater impact on them.
Liquidity Risk—Liquidity risk exists when particular investments are difficult to purchase or sell, possibly preventing the Portfolio from selling out of these illiquid securities at an advantageous price. Illiquid securities may also be difficult to value.
Indemnification Risk—In the ordinary course of business, the Portfolio enters into contracts that contain a variety of indemnifications. The Portfolio’s maximum exposure under these arrangements is unknown. However, the Portfolio has not had prior claims or losses pursuant to these indemnification provisions and expects the risk of loss thereunder to be remote. Therefore, the Portfolio has not accrued any liability in connection with these indemnification provisions.
| 2013 Annual Report | 37 |
Table of Contents
Notes to Financial Statements (continued)
| NOTE 6. | Capital-Share Transactions |
Share transactions for the years ended September 30, 2013 and September 30, 2012, were as follows:
| INTERMEDIATE DURATION INSTITUTIONAL PORTFOLIO | ||||||||
| YEAR ENDED 9/30/13 | YEAR ENDED 9/30/12 | |||||||
Shares sold | 13,602,168 | 17,473,142 | ||||||
Shares issued to shareholders on reinvestment of dividends and distributions | 1,837,504 | 2,134,511 | ||||||
Shares redeemed | (35,653,898 | ) | (26,866,409 | ) | ||||
|
|
|
| |||||
Net decrease in shares outstanding | (20,214,226 | ) | (7,258,756 | ) | ||||
Shares outstanding at beginning of period | 67,423,094 | 74,681,850 | ||||||
|
|
|
| |||||
Shares outstanding at end of period | 47,208,868 | 67,423,094 | ||||||
|
|
|
| |||||
| NOTE 7. | Line of Credit |
A number of open-end mutual funds managed by the Adviser, including the Portfolio, participate in a $140 million revolving credit facility (the “Facility”) intended to provide short-term financing, if necessary, subject to certain restrictions in connection with abnormal redemption activity. Commitment fees related to the Facility are paid by the participating funds and are included in miscellaneous expenses in the statement of operations. The Portfolio did not utilize the Facility during the year ended September 30, 2013.
| NOTE 8. | Recent Accounting Pronouncements |
In December 2011, the Financial Accounting Standards Board (“FASB”) issued an Accounting Standards Update (“ASU”) related to disclosures about offsetting assets and liabilities in financial statements. The amendments in this update require an entity to disclose both gross and net information for derivatives and other financial instruments that are either offset in the statement of assets and liabilities or subject to an enforceable master netting arrangement or similar agreement. In January 2013, the FASB issued an ASU to clarify the scope of disclosures about offsetting assets and liabilities. The ASU limits the scope of the new balance sheet offsetting disclosures to derivatives, repurchase agreements and securities lending transactions. The ASU is effective during interim or annual reporting periods beginning on or after January 1, 2013. At this time, management is evaluating the implication of this ASU and its impact on the financial statements has not been determined.
| NOTE 9. | Subsequent Events |
Management has evaluated subsequent events for possible recognition or disclosure in the financial statements through the date the financial statements are issued. Management has determined that there are no material events that would require disclosure in the Portfolio’s financial statements through this date.
| 38 | Sanford C. Bernstein Fund II, Inc. |
Table of Contents
Report of Independent Registered Public Accounting Firm
To the Board of Directors of Sanford C. Bernstein Fund II, Inc. and Shareholders of Intermediate Duration Institutional Portfolio:
We have audited the accompanying statement of assets and liabilities, including the portfolio of investments, of Intermediate Duration Institutional Portfolio (the series constituting Sanford C. Bernstein Fund II, Inc. (the “Fund”)) as of September 30, 2013, and the related statement of operations for the year then ended, the statements of changes in net assets for each of the two years in the period then ended, and the financial highlights for each of the four years in the period then ended. These financial statements and financial highlights are the responsibility of the Fund’s management. Our responsibility is to express an opinion on these financial statements and financial highlights based on our audits. The financial highlights for the year ended September 30, 2009 were audited by other auditors whose report dated November 25, 2009 expressed an unqualified opinion on those financial highlights.
We conducted our audits in accordance with the standards of the Public Company Accounting Oversight Board (United States). Those standards require that we plan and perform the audit to obtain reasonable assurance about whether the financial statements and financial highlights are free of material misstatement. We were not engaged to perform an audit of the Fund’s internal control over financial reporting. Our audits included consideration of internal control over financial reporting as a basis for designing audit procedures that are appropriate in the circumstances, but not for the purpose of expressing an opinion on the effectiveness of the Fund’s internal control over financial reporting. Accordingly, we express no such opinion. An audit also includes examining, on a test basis, evidence supporting the amounts and disclosures in the financial statements and financial highlights, assessing the accounting principles used and significant estimates made by management, and evaluating the overall financial statement presentation. Our procedures included confirmation of securities owned as of September 30, 2013 by correspondence with the custodian and others or by other appropriate auditing procedures where replies from others were not received. We believe that our audits provide a reasonable basis for our opinion.
In our opinion, the financial statements and financial highlights referred to above present fairly, in all material respects, the financial position of Intermediate Duration Institutional Portfolio of Sanford C. Bernstein Fund II, Inc. at September 30, 2013, the results of its operations for the year then ended, the changes in its net assets for each of two years in the period then ended, and the financial highlights for each of the four years in the period then ended, in conformity with U.S. generally accepted accounting principles.

New York, New York
November 27, 2013
| 2013 Annual Report | 39 |
Table of Contents
2013 Federal Tax Information (Unaudited)
For Federal income tax purposes, the following information is furnished with respect to the distributions paid by the Portfolio during the taxable year ended September 30, 2013. For corporate shareholders, 0.16% of dividends paid qualify for the dividends received deduction. For foreign shareholders, 76.44% of ordinary income dividends paid may be considered to be qualifying to be taxed as interest-related dividends.
For the taxable year ended September 30, 2013, the Portfolio designates $52,803 as the maximum amount that may be considered qualified dividend income for individual shareholders.
Shareholders should not use the above information to prepare their tax returns. The information necessary to complete your income tax returns will be included with your Form 1099-DIV which will be sent to you separately in January 2014.
| 40 | Sanford C. Bernstein Fund II, Inc. |
Table of Contents
Sanford C. Bernstein Fund II, Inc.
BOARDOF DIRECTORS
William H. Foulk, Jr.*+
Chairman
John H. Dobkin*
Michael J. Downey*
D. James Guzy*
Nancy P. Jacklin*
Robert M. Keith
President and Chief Executive Officer
Garry L. Moody*
Marshall C. Turner, Jr.*
Earl D. Weiner*
OFFICERS**
Philip L. Kirstein
Senior Vice President and Independent Compliance Officer
Paul J. DeNoon
Vice President
Shawn E. Keegan
Vice President
Alison M. Martier
Vice President
Douglas J. Peebles
Vice President
Greg J. Wilensky
Vice President
Emilie D. Wrapp
Secretary
Joseph J. Mantineo
Treasurer and Chief Financial Officer
Stephen M. Woetzel
Controller
INDEPENDENT REGISTEREDPUBLIC ACCOUNTING FIRM
Ernst & Young LLP
5 Times Square
New York, New York 10036
LEGAL COUNSEL
Willkie Farr & Gallagher LLP
787 Seventh Avenue
New York, New York 10019
CUSTODIANAND ACCOUNTING AGENTAND TRANSFER AGENT
State Street Bank and Trust Company
One Lincoln Street
Boston, Massachusetts 02111
INVESTMENT ADVISER
AllianceBernstein L.P.
1345 Avenue of the Americas
New York, New York 10105
* Member of the Audit Committee, the Governance and Nominating Committee and the Independent Directors Committee.
+ Member of the Fair Value Pricing Committee.
** The day-to-day management of, and investment decisions for, Sanford C. Bernstein Fund II, Inc.’s portfolio are made by the U.S. Investment Grade: Core Fixed Income Team. Messrs. DeNoon, Keegan, Peebles and Wilensky and Ms. Martier are the investment professionals with the most significant responsibility for the day-to-day management of the Fund’s portfolio.
| 2013 Annual Report | 41 |
Table of Contents
Sanford C. Bernstein Fund II, Inc. (continued)
DIRECTORS’ INFORMATION |
| |||||||
| Name, Address* and Age (Year First Elected**) | Principal Occupation(s) During Past Five Years and Other Relevant Qualifications*** | Portfolios in Complex Overseen By Director | Other Directorship(s) Held by Director in the Past Five Years | |||||
INTERESTED DIRECTOR | ||||||||
Robert M. Keith+ 1345 Avenue of the Americas New York, NY 10105 53 (2010) | Senior Vice President of the Adviser and the head of AllianceBernstein Investments, Inc. (“ABI”) since July 2008; Director of ABI and President of the AllianceBernstein Mutual Funds. Previously, he served as Executive Managing Director of ABI from December 2006 to June 2008. Prior to joining ABI in 2006, Executive Managing Director of Bernstein Global Wealth Management, and prior thereto, Senior Managing Director and Global Head of Client Service and Sales of the Adviser’s institutional investment management business since 2004. Prior thereto, he was Managing Director and Head of North American Client Service and Sales in the Adviser’s institutional investment management business, with which he had been associated since prior to 2004. | 100 | None | |||||
DISINTERESTED DIRECTORS | ||||||||
Chairman of the Board William H. Foulk, Jr.,†++ 81 (2002) | Investment Adviser and an Independent Consultant prior to 2008. Previously, he was Senior Manager of Barrett Associates, Inc., a registered investment adviser. He was formerly Deputy Comptroller and Chief Investment Officer of the State of New York and, prior thereto, Chief Investment Officer of the New York Bank for Savings. He has served as a director or trustee of various AllianceBernstein Funds since 1983 and has been Chairman of the AllianceBernstein Funds and of the Independent Directors Committee of such Funds since 2003. He is also active in a number of mutual fund related organizations and committees. | 100 | None | |||||
John H. Dobkin,† 71 (2002) | Independent Consultant since prior to 2008. Formerly, President of Save Venice, Inc. (preservation organization) from 2001-2002; Senior Adviser from June 1999-June 2000 and President of Historic Hudson Valley (historic preservation) from December 1989-May 1999. Previously, Director of the National Academy of Design. He has served | 100 | None | |||||
| 42 | Sanford C. Bernstein Fund II, Inc. |
Table of Contents
DIRECTORS’ INFORMATION (continued) |
| |||||||
| Name, Address* and Age (Year First Elected**) | Principal Occupation(s) During Past Five Years and Other Relevant Qualifications*** | Portfolios in Complex Overseen By Director | Other Directorship(s) Held by Director in the Past Five Years | |||||
| as a director or trustee of various AllianceBernstein Funds since 1992, and as Chairman of the Audit Committees of a number of such Funds from 2001-2008. | ||||||||
Michael J. Downey,† 69 (2005) | Private Investor since prior to 2008. Formerly, managing partner of Lexington Capital, LLC (investment advisory firm) from December 1997 until December 2003. From 1987 until 1993, Chairman and CEO of Prudential Mutual Fund Management. director of the Prudential mutual funds, and member of the Executive Committee of Prudential Securities, Inc. He has served as a director or trustee of the AllianceBernstein Funds since 2005 and is a director and Chairman of one other registered investment company. | 100 | Asia Pacific Fund, Inc. since prior to 2008, Prospect Acquisition Corp. (financial services) from 2007 until 2009, and The Merger Fund since prior to 2008 until 2013 | |||||
D. James Guzy,† 77 (2005) | Chairman of the Board of PLX Technology (semi-conductors) and of SRC Computers Inc., with which he has been associated since prior to 2008. He was a director of Intel Corporation (semi-conductors) from 1969 until 2008, and served as Chairman of the Finance Committee of such company for several years until May 2008. He has served as a director or trustee of one or more of the AllianceBernstein Funds since 1982. | 100 | PLX Technology (semi-conductors) since prior to 2008, Cirrus Logic Corporation (semi-conductors) since prior to 2008 until July 2011, and Intel Corporation (semi-conductors) until 2008 | |||||
Nancy P. Jacklin,† 65 (2006) | Professorial Lecturer at the Johns Hopkins School of Advanced International Studies since 2008. Formerly, U.S. Executive Director of the International Monetary Fund (December 2002-May 2006); Partner, Clifford Chance (1992-2002); Sector Counsel, International Banking and Finance, and Associate General Counsel, Citicorp (1985-1992); Assistant General Counsel (International), Federal Reserve Board of Governors (1982-1985); and Attorney Advisor, U.S. Department of the Treasury (1973-1982). Member of the Bar of the District of Columbia and of New York; and member of the Council on Foreign Relations. She has served as a director or trustee of the AllianceBernstein Funds since 2006. | 100 | None | |||||
| 2013 Annual Report | 43 |
Table of Contents
Sanford C. Bernstein Fund II, Inc. (continued)
DIRECTORS’ INFORMATION (continued) |
| |||||||
| Name, Address* and Age (Year First Elected**) | Principal Occupation(s) During Past Five Years and Other Relevant Qualifications*** | Portfolios in Complex Overseen By Director | Other Directorship(s) Held by Director in the Past Five Years | |||||
Garry L. Moody,† 61 (2008) | Independent Consultant. Formerly, Partner, Deloitte & Touche LLP, (1995-2008) where he held a number of senior positions, including Vice Chairman, and U.S. and Global Investment Management Practice Managing Partner; President, Fidelity Accounting and Custody Services Company (1993-1995); and Partner, Ernst & Young LLP (1975-1993), where he served as the National Director of Mutual Fund Tax Services and Managing Partner of its Chicago office tax department. He is also a member of both the Governing Council of the Independent Directors Council (IDC), an organization of independent directors of mutual funds and the Trustee Advisory Board at BoardIQ, a biweekly publication focused on issues and news affecting directors of mutual funds. He has served as a director or trustee, and as Chairman of the Audit Committee, of the AllianceBernstein Funds since 2008. | 100 | Greenbacker Renewable Energy Company LLC (renewable energy and energy efficiency projects) since August 2013 | |||||
Marshall C. Turner, Jr.,† 72 (2005) | Private Investor since prior to 2008. Interim CEO of MEMC Electronic Materials, Inc. (semi-conductor and solar cell substrates) from November 2008 until March 2009. He was Chairman and CEO of Dupont Photomasks, Inc. (components of semi-conductor manufacturing), 2003-2005, and President and CEO, 2005-2006, after the company was acquired and renamed Toppan Photomasks, Inc. He has extensive experience in venture capital investing including prior service as general partner of three institutional venture capital partnerships, and serves on the boards of a number of education and science-related non-profit organizations. He has served as a director or trustee of one or more of the AllianceBernstein Funds since 1992. | 100 | Xilinx, Inc. (programmable logic semi-conductors) and MEMC Electronic Materials, Inc. (semi-conductor and solar cell substrates), since prior to 2008 | |||||
Earl D. Weiner,† 74 (2007) | Of Counsel, and Partner prior to January 2007, of the law firm Sullivan & Cromwell LLP and member of ABA Federal Regulation of Securities Committee Task Force to draft editions of the Fund Director’s Guidebook. He also serves as a director or | 100 | None | |||||
| 44 | Sanford C. Bernstein Fund II, Inc. |
Table of Contents
DIRECTORS’ INFORMATION (continued) | ||||||
| Name, Address* and Age (Year First Elected**) | Principal Occupation(s) During Past Five Years and Other Relevant Qualifications*** | Portfolios in Complex Overseen By Director | Other Directorship(s) Held by Director in the Past Five Years | |||
| trustee of various non-profit organizations and has served as Chairman or Vice Chairman of a number of them. He has served as a director or trustee of the AllianceBernstein Funds since 2007 and is Chairman of the Governance and Nominating Committees of the Funds. | ||||||
* The address for each of the Fund’s disinterested Directors is c/o AllianceBernstein L.P., Attention: Philip L. Kirstein, 1345 Avenue of the Americas, New York, NY 10105.
** There is no stated term of office for the Fund’s Directors.
*** The information above includes each Director’s principal occupation during the last five years and other information relating to the experience, attributes, and skills relevant to each Director’s qualifications to serve as a Director, which led to the conclusion that each Director should serve as a Director for the Fund.
† Member of the Audit Committee, the Governance and Nominating Committee and the Independent Directors Committee.
+ Mr. Keith is an “interested person”, of the Fund, as defined in the Investment Company Act of 1940, due to his position as a Senior Vice President of the Adviser.
++ Member of the Fair Value Pricing Committee.
| 2013 Annual Report | 45 |
Table of Contents
Sanford C. Bernstein Fund II, Inc. (continued)
OFFICERS’ INFORMATION | ||||
| Name, Address* and Age | Principal Position(s) Held with Fund | Principal Occupation During Past 5 Years | ||
Robert M. Keith, 53 | President and Chief Executive Officer | See biography above. | ||
Philip L. Kirstein, 68 | Senior Vice President and Independent Compliance Officer | Senior Vice President and Independent Compliance Officer of the AllianceBernstein Funds, with which he has been associated since October 2004. Prior thereto, he was Of Counsel to Kirkpatrick & Lockhart, LLP from October 2003 to October 2004, and General Counsel of Merrill Lynch Investment Managers, L.P. since prior to March 2003. | ||
Paul J. DeNoon, 51 | Vice President | Senior Vice President of the Adviser† with which he has been associated since prior to 2008. | ||
Shawn E. Keegan, 42 | Vice President | Vice President of the Adviser† with which he has been associated since prior to 2008. | ||
Alison M. Martier, 56 | Vice President | Senior Vice President of the Adviser† with which she has been associated since prior to 2008. | ||
Douglas J. Peebles, 48 | Vice President | Senior Vice President of the Adviser† with which he has been associated since prior to 2008. | ||
Greg J. Wilensky, 46 | Vice President | Senior Vice President of the Adviser† with which he has been associated since prior to 2008. | ||
Emilie D. Wrapp, 57 | Secretary | Senior Vice President, Assistant General Counsel and Assistant Secretary of ABI† with which she has been associated since prior to 2008. | ||
Joseph J. Mantineo, 54 | Treasurer and Chief Financial Officer | Senior Vice President of AllianceBernstein Investor Services, Inc. (“ABIS”)† with which he has been associated since prior to 2008. | ||
Stephen M. Woetzel, 42 | Controller | Vice President of ABIS† with which he has been associated since prior to 2008. | ||
* The address for each of the Fund’s Officers is 1345 Avenue of the Americas, New York, NY 10105.
†The Adviser, ABI and ABIS are affiliates of the Fund.
The Fund’s Statement of Additional Information (“SAI”) has additional information about the Fund’s Directors and Officers and is available without charge upon request. Contact your financial representative or AllianceBernstein at 1-800-227-4618, or visit www.alliancebernstein.com, for a free prospectus or SAI.
| 46 | Sanford C. Bernstein Fund II, Inc. |
Table of Contents
The Following Is Not Part of the Shareholder Report or the Financial Statements
SUMMARY OF SENIOR OFFICER’S EVALUATION OF INVESTMENT ADVISORY AGREEMENT1
The following is a summary of the evaluation of the Investment Advisory Agreement between AllianceBernstein L.P. (the “Adviser”) and Sanford C. Bernstein Fund II, Inc. – Intermediate Duration Institutional Portfolio (the “Fund”),2 prepared by Philip L. Kirstein, the Senior Officer of the Fund for the Directors of the Fund, as required by the August 2004 agreement between the Adviser and the New York State Attorney General (the “NYAG”). The Senior Officer’s evaluation of the Investment Advisory Agreement is not meant to diminish the responsibility or authority of the Board of Directors to perform its duties pursuant to Section 15 of the Investment Company Act of 1940 (the “40 Act”) and applicable state law. The purpose of the summary is to provide shareholders with a synopsis of the independent evaluation of the reasonableness of the advisory fees proposed to be paid by the Fund which was provided to the Directors in connection with their review of the proposed approval of the continuance of the Investment Advisory Agreement.
The Senior Officer’s evaluation considered the following factors:
| 1. | Advisory fees charged to institutional and other clients of the Adviser for like services; |
| 2. | Advisory fees charged by other mutual fund companies for like services; |
| 3. | Costs to the Adviser and its affiliates of supplying services pursuant to the advisory agreement, excluding any intra-corporate profit; |
| 4. | Profit margins of the Adviser and its affiliates from supplying such services; |
| 5. | Possible economies of scale as the Fund grows larger; and |
| 6. | Nature and quality of the Adviser’s services including the performance of the Fund. |
These factors, with the exception of the first factor, are generally referred to as the “Gartenberg factors,” which were articulated by the United States Court of Appeals for the Second Circuit in 1982. Gartenberg v. Merrill Lynch Asset Management, Inc., 694 F. 2d 923 (2d Cir. 1982). On March 30, 2010, the Supreme Court held the Gartenberg decision was correct in its basic formulation of what §36(b) requires: to face liability under §36(b), “an investment adviser must charge a fee that is so disproportionately large that it bears no reasonable relationship to the services rendered and could not have been the product of arm’s length bargaining.” Jones v. Harris Associates L.P., 130 S. Ct. 1418 (2010). In Jones, the Court stated the Gartenberg approach fully incorporates the correct understanding of fiduciary duty within the context of section 36(b) and noted with approval that “Gartenberg insists that all relevant circumstances be taken into account” and “uses the range of fees that might result from arm’s length bargaining as the benchmark for reviewing challenged fees.”3
ADVISORY FEES, NET ASSETS, & EXPENSE RATIOS
The Adviser proposed that the Fund pay the advisory fee set forth in the table below for receiving the services to be provided pursuant to the Investment Advisory Agreement.4 Also shown are the Fund’s net assets on September 30, 2012.
| FUND | ADVISORY FEE BASED ON % OF AVERAGE DAILY NET ASSETS | NET ASSETS 09/30/12 ($MM) | ||
Intermediate Duration Institutional Portfolio5 | 50 bp on 1st 1 billion 45 bp on the balance | $1,123.9 |
1 The information in the fee evaluation was completed on October 25, 2012 and discussed with the Board of Directors on November 6-8, 2012.
2 Future references to the Fund do not include “Sanford C. Bernstein Fund II, Inc.”
3 Jones v. Harris at 1427.
4 Most of the AllianceBernstein Mutual Funds, which the Adviser manages, were affected by the Adviser’s settlement with the NYAG. The Fund was not affected by the Adviser’s agreement with the NYAG since the Fund’s fee schedule already had lower breakpoints than the NYAG regulated fee schedule for AllianceBernstein Mutual Funds with a category of “High Income.”
5 The Fund has an expense cap of 0.45%, which effectively reduces the advisory fee.
| 2013 Annual Report | 47 |
Table of Contents
The Following Is Not Part of the Shareholder Report or the Financial Statements (continued)
The Adviser has agreed to waive that portion of its advisory fees and/or reimburse the Fund for that portion of the Fund’ total operating expenses to the degree necessary to limit the Fund’s expense ratio to the amounts set forth below for the Fund’s current fiscal year. The waiver is terminable by the Adviser prior to the Fund’s new Prospectus date upon at least 60 days written notice. In addition, set forth below is the gross expense ratio of the Fund, annualized for the most recent semi-annual period:6
| FUND | EXPENSE CAP PURSUANT TO EXPENSE LIMITATION UNDERTAKING | GROSS (3/31/12)7 | FISCAL YEAR END | |||||||||
| Intermediate Duration Institutional Portfolio | 0.45 | % | 0.54 | % | September 30 | |||||||
I. ADVISORY FEES CHARGED TO INSTITUTIONAL AND OTHER CLIENTS
The advisory fees charged to investment companies which the Adviser manages and sponsors are normally higher than those charged to similar sized institutional accounts, including pension plans and sub-advised investment companies. The fee differential reflects, among other things, different services provided to such clients, and different liabilities assumed. Services provided by the Adviser to the Fund that are not provided to non-investment company clients and sub-advised investment companies include providing office space and personnel to serve as Fund Officers, who among other responsibilities make the certifications required under the Sarbanes–Oxley Act of 2002, and coordinating with and monitoring the Fund’ third party service providers such as Fund counsel, auditors, custodians, transfer agents and pricing services. The accounting, administrative, legal and compliance requirements for the Fund are more costly than those for institutional assets due to the greater complexities and time required for investment companies. The Adviser also believes that it incurs substantial entrepreneurial risk when offering a new mutual fund since establishing a new mutual fund requires a large upfront investment and it may take a long time for the fund to achieve profitability since the fund must be priced to scale from inception in order to be competitive and assets are acquired one account at a time. In addition, managing the cash flow of an investment company may be more difficult than managing that of a stable pool of assets, such as an institutional account with little cash movement in either direction, particularly, if a fund is in net redemption and the Adviser is frequently forced to sell securities to raise cash for redemptions. However, managing a fund with positive cash flow may be easier at times than managing a stable pool of assets. Finally, in recent years, investment advisers have been sued by institutional clients and have suffered reputational damage both by the attendant publicity and outcomes other than complete victories. Accordingly, the legal and reputational risks associated with institutional accounts are greater than previously thought, although still not equal to those related to the mutual fund industry.
Notwithstanding the Adviser’s view that managing an investment company is not comparable to managing other institutional accounts because the services provided are different, the Supreme Court has indicated consideration should be given to the advisory fees charged to institutional accounts with a similar investment style as the Fund.8 In addition to the AllianceBernstein Institutional fee schedule, set forth below is what would have been the effective advisory fee of the Fund had the AllianceBernstein Institutional fee schedule been applicable to the Fund versus the Fund’s advisory fee based on September 30, 2012 net assets:9
| FUND | NET ASSETS 9/30/12 ($MM) | ALLIANCEBERNSTEIN FEE SCHEDULE | EFFECTIVE AB INST. ADV. FEE (%) | FUND ADVISORY FEE (%) | ||||||
| Intermediate Duration Institutional Portfolio | $1,123.9 | U.S. Strategic Core Plus Schedule 50 bp on 1st $30 million 20 bp on the balance Minimum Account Size: $25 m | 0.208% | 0.489% | ||||||
6 Semi-annual total expense ratios are unaudited.
7 Annualized.
8 The Supreme Court stated that “courts may give such comparisons the weight that they merit in light of the similarities and differences between the services that the clients in question require, but the courts must be wary of inapt comparisons.” Among the significant differences the Supreme Court noted that may exist between services provided to mutual funds and institutional accounts are “higher marketing costs.” Jones v. Harris at 1428.
9 The Adviser has indicated that with respect to institutional accounts with assets greater than $300 million, it will negotiate a fee schedule. Discounts that are negotiated vary based upon each client relationship.
| 48 | Sanford C. Bernstein Fund II, Inc. |
Table of Contents
The Adviser manages Sanford C. Bernstein Fund, Inc. (“SCB Fund”), an open-end management investment company. The Intermediate Duration Portfolio of SCB Fund has a similar investment style as the Fund, and its advisory fee schedule is shown below. In addition, set forth is what would have been the effective fee for the Fund had the advisory fee schedule of Intermediate Duration Portfolio been applicable to the Fund versus the Fund’s advisory fee based on September 30, 2012 net assets:
| FUND | SCB FUND PORTFOLIO | FEE SCHEDULE | SCB FUND EFFECTIVE FEE (%) | FUND ADVISORY FEE (%) | ||||
| Intermediate Duration Institutional Portfolio | Intermediate Duration Portfolio | 50 bp on 1st $1 billion 45 bp on next $2 billion 40 bp on next $2 billion 35 bp on next $2 billion 30 bp thereafter | 0.494% | 0.489%10 |
The AllianceBernstein Variable Products Series Fund, Inc. (“AVPS”), which is managed by the Adviser and is available through variable annuity and variable life contracts offered by other financial institutions, offers policyholders the option to utilize certain AVPS portfolios as the investment option underlying their insurance contracts. The AVPS Intermediate Bond Portfolio has a similar investment style as the Fund, and its advisory fee schedule is set forth below.11 Also shown is what would have been the effective advisory fee of the Fund had the AVPS fee schedule been applicable to the Fund versus the Fund’s advisory fee based on September 30, 2012 net assets.
| FUND | AVPS PORTFOLIO | FEE SCHEDULE | AVPS EFFECTIVE FEE (%) | FUND ADVISORY FEE (%) | ||||
| Intermediate Duration Institutional Portfolio | Intermediate Bond Portfolio | 0.45% on first $2.5 billion 0.40% on next $2.5 billion 0.35% on the balance | 0.450% | 0.489%10 |
The Adviser represented that it does not sub-advise any registered investment companies of other fund families with a substantially similar investment style as the Fund.
| II. | MANAGEMENT FEES CHARGED BY OTHER MUTUAL FUND COMPANIES FOR LIKE SERVICES. |
Lipper, Inc. (“Lipper”), an analytical service that is not affiliated with the Adviser, compared the fees charged to the Fund with fees charged to other investment companies for similar services offered by other investment advisers.12 Lipper’s analysis included the comparison of the Fund’s contractual management fee, estimated at the approximate current asset level of the Fund, to the median of the Fund’s Lipper Expense Group (“EG”)13 and the Fund’s contractual management fee ranking.14
Lipper describes an EG as a representative sample of comparable funds. Lipper’s standard methodology for screening funds to be included in an EG entails the consideration of several fund criteria, including fund type, investment classification/objective, load type and similar 12b-1/non-12b-1 service fees, asset (size) comparability, expense components and attributes. An EG will typically consist of seven to twenty funds.
10 The Fund has an expense cap 0.45% which effectively reduces the advisory fees by at least five basis points.
11 AVPS was also affected by the settlement between the Adviser and the NYAG.
12 The Supreme Court cautioned against accepting mutual fund fee comparisons without careful scrutiny since “these comparisons are problematic because these fees, like those challenged, may not be the product of negotiations conducted at arm’s length.” Jones v. Harris at 1429.
13 Lipper does not consider average account size when constructing EGs. Funds with relatively small average account sizes tend to have higher transfer agent expense ratio than comparable sized funds that have relatively large average account sizes. Note that there are limitations on Lipper expense category data because different funds categorize expenses differently.
14 The contractual management fee is calculated by Lipper using the Fund’s contractual management fee rate at a hypothetical asset level. The hypothetical asset level is based on the combined net assets of all classes of the Fund, rounded up to the next $25 million. Lipper’s total expense ratio information is based on the most recent annual report except as otherwise noted. A ranking of “1” would mean that the Fund had the lowest effective fee rate in the Lipper peer group.
| 2013 Annual Report | 49 |
Table of Contents
The Following Is Not Part of the Shareholder Report or the Financial Statements (continued)
| FUND | CONTRACTUAL FEE (%)15 | LIPPER EXP. GROUP MEDIAN (%) | LIPPER RANK | |||
| Intermediate Duration Institutional Portfolio | 0.493 | 0.487 | 8/14 |
Lipper also compared the Fund’s total expense ratio to the medians of the Fund’s EG and Lipper Expense Universe (“EU”). The EU is a broader group compared to the EG, consisting of all funds that have the same investment classifications/objective and load type as the subject Fund.
| FUND | EXPENSE RATIO (%)16 | LIPPER EXP. GROUP | LIPPER GROUP RANK | LIPPER EXP. UNIVERSE MEDIAN (%) | LIPPER RANK | |||||
| Intermediate Duration Institutional Portfolio | 0.450 | 0.521 | 4/14 | 0.643 | 37/213 |
Based on this analysis, the Fund has a more favorable ranking on a total expense ratio basis than on a management fee basis.
| III. | COSTS TO THE ADVISER AND ITS AFFILIATES OF SUPPLYING SERVICES PURSUANT TO THE MANAGEMENT FEE ARRANGEMENT, EXCLUDING ANY INTRA-CORPORATE PROFIT. |
The Adviser utilizes two profitability reporting systems, which operate independently but are aligned with each other, to estimate the Adviser’s profitability in connection with investment advisory services provided to the Fund. The Senior Officer has retained a consultant to provide independent advice regarding the alignment of the two profitability systems as well as the methodologies and allocations utilized by both profitability systems. See Section IV for additional discussion.
| IV. | PROFIT MARGINS OF THE ADVISER AND ITS AFFILIATES FOR SUPPLYING SUCH SERVICES. |
The Fund’ profitability information, prepared by the Adviser for the Board of Directors, was reviewed by the Senior Officer and the consultant. The Adviser’s profitability from providing investment advisory services to the Fund increased during calendar year 2011, relative to 2010.
| V. | POSSIBLE ECONOMIES OF SCALE |
The Adviser has indicated that economies of scale are being shared with shareholders through pricing to scale, breakpoints, fee reductions/waivers and enhancement to services.
An independent consultant, retained by the Senior Officer, provided the Board of Directors information on the Adviser’s firm-wide average costs from 2005 through 2011 and the potential economies of scale. The independent consultant noted that from 2005 through 2007 the Adviser experienced significant growth in assets under management (“AUM”). During this period, operating expenses increased, in part to keep up with growth, and in part reflecting market returns. However, from 2008 through the first quarter of 2009, AUM rapidly and significantly decreased due to declines in market value and client withdrawals. When AUM rapidly decreased, some operating expenses categories, including base compensation and office space, adjusted more slowly during this period, resulting in an increase in average costs. Since 2009, AUM has experienced less significant changes. The independent consultant noted that changes in operating expenses reflect changes in business composition and business practices in response to changes in financial markets. Finally, the independent consultant concluded that the increase in average cost and the decline in net operating margin across the Adviser since late 2008 are inconsistent with the view that there are currently reductions in average costs due to economies of scale that can be shared with the AllianceBernstein Mutual Funds managed by the Adviser through lower fees.
15 The contractual management fee does not reflect any expense reimbursements made by the Fund to the Adviser for certain clerical, legal, accounting, administrative, and other services. In addition, the contractual management fee does not reflect any advisory fee waivers or expense reimbursements made by the Adviser that would effectively reduce the actual effective management fee.
16 Most recently completed fiscal year total expense ratio.
| 50 | Sanford C. Bernstein Fund II, Inc. |
Table of Contents
Previously in February 2008, the independent consultant provided the Board of Directors an update of the Deli17 study on advisory fees and various fund characteristics.18 The independent consultant first reiterated the results of his previous two dimensional comparison analysis (fund size and family size) with the Board of Directors.19 The independent consultant then discussed the results of the regression model that was utilized to study the effects of various factors on advisory fees. The regression model output indicated that the bulk of the variation in fees predicted were explained by various factors, but substantially by fund AUM, family AUM, index fund indicator and investment style. The independent consultant also compared the advisory fees of the AllianceBernstein Mutual Funds to similar funds managed by 19 other large asset managers, regardless of the fund size and each Adviser’s proportion of mutual fund assets to non-mutual fund assets.
| VI. | NATURE AND QUALITY OF THE ADVISER’S SERVICES, INCLUDING THE PERFORMANCE OF THE FUND |
With assets under management of approximately $419 billion as of September 30, 2012, the Adviser has the investment experience to manage and provide non-investment services (described in Section I) to the Fund.
The information prepared by Lipper shows the 1, 3, 5 and 10 year performance returns and rankings20 of the Fund relative to its Lipper Performance Group (“PG”) and Lipper Performance Universe (“PU”)21 for the periods ended July 31, 2012.22
FUND RETURN (%) | PG MEDIAN (%) | PU MEDIAN (%) | PG RANK | PU RANK | ||||||||||||||||
Intermediate Duration Institutional Portfolio | ||||||||||||||||||||
1 year | 6.47 | 7.53 | 7.41 | 13/14 | 245/302 | |||||||||||||||
3 year | 8.65 | 9.07 | 8.06 | 10/14 | 73/255 | |||||||||||||||
5 year | 7.21 | 7.21 | 6.84 | 7/13 | 74/199 | |||||||||||||||
10 year | 5.91 | 5.91 | 5.68 | 6/11 | 48/122 | |||||||||||||||
Set forth below are the 1, 3, 5 year and since inception performance returns of the Fund (in bold) versus its benchmark.23 Fund and benchmark volatility and reward-to-variability ratio (“Sharpe Ratio”) information is also shown. 24
17 The Deli study, originally published in 2002 based on 1997 data and updated for the February 2008 Presentation, may be of diminished value due to the age of the data used in the presentation and the changes experienced in the industry over the last four years.
18 As mentioned previously, the Supreme Court cautioned against accepting mutual fund fee comparisons without careful scrutiny since the fees may not be the product of negotiations conducted at arm’s length. See Jones V. Harris at 1429.
19 The two dimensional analysis showed patterns of lower advisory fees for funds with larger asset sizes and funds from larger family sizes compared to funds with smaller asset sizes and funds from smaller family sizes, which according to the independent consultant is indicative of a sharing of economies of scale and scope. However, in less liquid and active markets, such is not the case, as the empirical analysis showed potential for diseconomies of scale in those markets. The empirical analysis also showed diminishing economies of scale and scope as funds surpassed a certain high level of assets.
20 Fund performance returns were provided by Lipper.
21 The Fund’s PG is identical to the Fund’s EG. The Fund’s PU is not identical to the Fund’s EU as the criteria for including/excluding a fund from a PU is somewhat different from that of an EU.
22 The current Lipper investment classification/objective dictates the PG and PU throughout the life of the Fund even if a Fund had a different investment classification/objective at a different point in time.
23 The Adviser provided Fund and benchmark performance return information for periods through July 31, 2012.
24 Fund and benchmark volatility and Sharpe Ratio information was obtained through Lipper LANA, a database maintained by Lipper. Volatility is a statistical measure of the tendency of a market price or yield to vary over time. A Sharpe Ratio is a risk adjusted measure of return that divides a fund’s return in excess of the riskless return by the fund’s standard deviation. A fund with a greater volatility would be viewed as more risky than a fund with equivalent performance but lower volatility; for that reason, a greater return would be demanded for the more risky fund. A fund with a higher Sharpe Ratio would be viewed as better performing than a fund with a lower Sharpe Ratio.
| 2013 Annual Report | 51 |
Table of Contents
The Following Is Not Part of the Shareholder Report or the Financial Statements (continued)
| PERIODS ENDING JULY 31, 2012 ANNUALIZED NET PERFORMANCE (%) | ||||||||||||||||||||||||||||||||
| 1 YEAR (%) | 3 YEAR (%) | 5 YEAR (%) | 10 YEAR (%) | SINCE INCEPTION (%) | ANNUALIZED | RISK PERIOD (YEAR) | ||||||||||||||||||||||||||
| VOLATILITY (%) | SHARPE (%) | |||||||||||||||||||||||||||||||
Intermediate Duration Institutional Portfolio | 6.47 | 8.65 | 7.21 | 5.91 | 5.93 | 4.23 | 0.92 | 10 | ||||||||||||||||||||||||
Barclays Capital U.S Aggregate Bond Index | 7.25 | 6.85 | 6.91 | 5.65 | 5.84 | 3.62 | 1.01 | 10 | ||||||||||||||||||||||||
Inception Date: May 17, 2002 |
| |||||||||||||||||||||||||||||||
CONCLUSION:
Based on the factors discussed above the Senior Officer’s conclusion is that the proposed advisory fee for the Fund is reasonable and within the range of what would have been negotiated at arm’s length in light of all the surrounding circumstances. This conclusion in respect of the Fund is based on an evaluation of all of these factors and no single factor was dispositive.
Dated: December 3, 2012
| 52 | Sanford C. Bernstein Fund II, Inc. |
Table of Contents

SANFORD C. BERNSTEIN & CO., LLC
A subsidiary of AllianceBernstein L.P.
Distributor
SANFORD C. BERNSTEIN FUND II, INC.
1345 AVENUEOFTHE AMERICAS, NEW YORK, NY 10105
(212) 756-4097
SCBII–2038–0913
Table of Contents
ITEM 2. CODE OF ETHICS.
(a) The registrant has adopted a code of ethics that applies to its principal executive officer, principal financial officer and principal accounting officer. A copy of the registrant’s code of ethics is filed herewith as Exhibit 12(a)(1).
(b) During the period covered by this report, no material amendments were made to the provisions of the code of ethics adopted in 2(a) above.
(c) During the period covered by this report, no implicit or explicit waivers to the provisions of the code of ethics adopted in 2(a) above were granted.
ITEM 3. AUDIT COMMITTEE FINANCIAL EXPERT.
The registrant’s Board of Directors has determined that independent directors Garry L. Moody and William H. Foulk, Jr. qualify as audit committee financial experts.
ITEM 4. PRINCIPAL ACCOUNTANT FEES AND SERVICES.
(a) - (c) The following table sets forth the aggregate fees billed by the independent registered public accounting firm Ernst & Young LLP, for the Fund’s last two fiscal years, for professional services rendered for: (i) the audit of the Fund’s annual financial statements included in the Fund’s annual report to stockholders; (ii) assurance and related services that are reasonably related to the performance of the audit of the Fund’s financial statements and are not reported under (i), which include advice and education related to accounting and auditing issues, quarterly press release review (for those Funds that issue quarterly press releases), and preferred stock maintenance testing (for those Funds that issue preferred stock); and (iii) tax compliance, tax advice and tax return preparation.
| Audit Fees | Audit-Related Fees | Tax Fees | ||||||||||||||
Bernstein Intermediate Duration Institutional Portfolio | 2012 | $ | 57,500 | $ | 500 | $ | 13,748 | |||||||||
| 2013 | $ | 57,500 | $ | — | $ | 13,344 | ||||||||||
(d) Not applicable.
(e) (1) Beginning with audit and non-audit service contracts entered into on or after May 6, 2003, the Fund’s Audit Committee policies and procedures require the pre-approval of all audit and non-audit services provided to the Fund by the Fund’s independent registered public accounting firm. The Fund’s Audit Committee policies and procedures also require pre-approval of all audit and non-audit services provided to the Adviser and Service Affiliates to the extent that these services are directly related to the operations or financial reporting of the Fund.
(e) (2) All of the amounts for Audit Fees, Audit-Related Fees and Tax Fees in the table under Item 4 (a)–(c) are for services pre-approved by the Fund’s Audit Committee.
Table of Contents
(f) Not applicable.
(g) The following table sets forth the aggregate non-audit services provided to the Fund, the Fund’s Adviser and entities that control, are controlled by or under common control with the Adviser that provide ongoing services to the Fund:
| All Fees for Non-Audit Services Provided to the Portfolio, the Adviser and Service Affiliates | Total Amount of Foregoing Column Pre- approved by the Audit Committee (Portion Comprised of Audit Related Fees) (Portion Comprised of Tax Fees) | |||||||||
Bernstein Intermediate Duration Institutional Portfolio | 2012 | $ | 632,888 | $ $ $ | 14,248 (500 (13,748 | ) ) | ||||
| 2013 | $ | 386,515 | $ $ $ | 13,344 — (13,344 |
) | |||||
(h) The Audit Committee of the Fund has considered whether the provision of any non-audit services not pre-approved by the Audit Committee provided by the Fund’s independent registered public accounting firm to the Adviser and Service Affiliates is compatible with maintaining the auditor’s independence.
| ITEM 5. | AUDIT COMMITTEE OF LISTED REGISTRANTS. |
Not applicable to the registrant.
ITEM 6. SCHEDULE OF INVESTMENTS.
Please see Schedule of Investments contained in the Report to Shareholders included under Item 1 of this Form N-CSR.
ITEM 7. DISCLOSURE OF PROXY VOTING POLICIES AND PROCEDURES FOR CLOSED-END MANAGEMENT INVESTMENT COMPANIES.
Not applicable to the registrant.
Table of Contents
ITEM 8. PORTFOLIO MANAGERS OF CLOSED-END MANAGEMENT INVESTMENT COMPANIES.
Not applicable to the registrant.
ITEM 9. PURCHASES OF EQUITY SECURITIES BY CLOSED-END MANAGEMENT INVESTMENT COMPANY AND AFFILIATED PURCHASERS.
Not applicable to the registrant.
ITEM 10. SUBMISSION OF MATTERS TO A VOTE OF SECURITY HOLDERS.
There have been no material changes to the procedures by which shareholders may recommend nominees to the Fund’s Board of Directors since the Fund last provided disclosure in response to this item.
ITEM 11. CONTROLS AND PROCEDURES.
(a) The registrant’s principal executive officer and principal financial officer have concluded that the registrant’s disclosure controls and procedures (as defined in Rule 30a-2(c) under the Investment Company Act of 1940, as amended) are effective at the reasonable assurance level based on their evaluation of these controls and procedures as of a date within 90 days of the filing date of this document.
(b) There were no significant changes in the registrant’s internal controls over financial reporting during the second fiscal quarter of the period that could significantly affect these controls subsequent to the date of their evaluation, including any corrective actions with regard to significant deficiencies and material weaknesses.
Table of Contents
ITEM 12. EXHIBITS.
The following exhibits are attached to this Form N-CSR:
EXHIBIT NO. | DESCRIPTION OF EXHIBIT | |
| 12 (a) (1) | Code of Ethics that is subject to the disclosure of Item 2 hereof | |
| 12 (b) (1) | Certification of Principal Executive Officer Pursuant to Section 302 of the Sarbanes-Oxley Act of 2002 | |
| 12 (b) (2) | Certification of Principal Financial Officer Pursuant to Section 302 of the Sarbanes-Oxley Act of 2002 | |
| 12 (c) | Certification of Principal Executive Officer and Principal Financial Officer Pursuant to Section 906 of the Sarbanes-Oxley Act of 2002 | |
Table of Contents
SIGNATURES
Pursuant to the requirements of the Securities Exchange Act of 1934 and the Investment Company Act of 1940, the registrant has duly caused this report to be signed on its behalf by the undersigned, thereunto duly authorized.
(Registrant): Sanford C. Bernstein Fund II, Inc.
| By: | /s/ Robert M. Keith | |
| Robert M. Keith | ||
| President | ||
| Date: | November 22, 2013 | |
Pursuant to the requirements of the Securities Exchange Act of 1934 and the Investment Company Act of 1940, this report has been signed below by the following persons on behalf of the registrant and in the capacities and on the dates indicated.
| By: | /s/ Robert M. Keith | |
| Robert M. Keith | ||
| President | ||
| Date: | November 22, 2013 | |
| By: | /s/ Joseph J. Mantineo | |
| Joseph J. Mantineo | ||
| Treasurer and Chief Financial Officer | ||
| Date: | November 22, 2013 | |