NETWORK MAP
| | |
1 | | Chairman’s Letter to Shareholders |
2 | | Chief Executive Officer’s Letter to Shareholders |
3 | | Management’s Discussion and Analysis |
55 | | Financial Statements |
100 | | Five-Year Summary |
102 | | Shareholder Information |
104 | | Directors and Committees |
105 | | Senior Officers of the Company |
CHAIRMAN’S LETTER TO SHAREHOLDERS
The Board of Directors recognizes that strong and experienced leadership is critical to drive shareholder value and to advance the best interests of Canadian Pacific’s investors, its employees, its customers and all other stakeholders.
CP’s independent Board is composed of directors with extensive, relevant experience in railroads and complementary industries including energy, natural resources, food and agriculture, as well as leaders from the fields of law, government, banking and finance. During the past year, the Board was pleased to announce the addition of Rick George. Mr. George is the Chief Executive Officer of Suncor Energy, Canada’s largest integrated energy company, a position he has held since 1991. Rick has had significant experience with the rail industry, as Suncor is both a supplier of fuel to the industry and a shipper of petroleum products by rail.
In 2011, the Board also announced the addition of Tony Ingram and Ed Harris, seasoned railroad executives who served at four of the seven Class I railroads in North America and together bring over 80 years of rail experience. Mr. Ingram and Mr. Harris have joined the Safety, Operations and Environment Committee, tasked by the Board with monitoring the progress of the Multi-Year Plan developed by management and fully endorsed by the Board. The additions of Rick, Tony and Ed have significantly strengthened our Board, and we look forward to benefiting from their broad range of experience for many years to come.
Under the close oversight of the Board, CP’s management team has been aggressively and successfully executing on the Plan and its core pillars of driving volume growth, expanding network capacity to safely and efficiently support higher volumes, and controlling costs. The disciplined implementation has led to materially enhanced operational efficiency and further increased service quality and reliability, setting the stage for additional meaningful improvements of key operating and financial metrics going forward. These improvements will translate into enhanced value for shareholders.
The Board as well as the Safety, Operations and Environment Committee are encouraged by the Plan’s most recent successes and will continue to hold CP’s senior management fully accountable for reaching an Operating Ratio of 70 to 72 per cent for 2014 and delivering further improvements thereafter.
To ensure that we continue to fulfill our responsibility of advancing the interest of shareholders, we continue our director education program to further expand our knowledge of CP and the railway industry. Over the past year we have received regular reports and presentations involving the changing regulatory and business environment. We have also made site visits to enhance our first-hand knowledge of rail operations, including a tour of the world-class TTCI transportation research and testing facility focused on the transportation industry, which provides emerging technology solutions that are central to CP’s strategy and Multi-Year Plan. I want to thank the directors for their ongoing, high level of engagement, their commitment to the railroad as well as for the extensive time they spend on CP matters every year.
Even through a challenging operating environment in 2011, CP has made great strides in the areas of governance, management and operations. The Board believes that Pershing Square’s demand for management change would put at severe risk the significant forward momentum the Company is making on the Multi-Year Plan.
On behalf of the Board, I would like to extend our appreciation to Fred Green and his management team for aggressively and successfully implementing our Multi-Year plan and creating superior value for our shareholders and customers.
I also thank all employees of CP for their continued hard work and their unremitting commitment to safely delivering against our objectives, achieving new operational records, and setting new efficiency benchmarks.
Thank you for your continued support of CP.
Sincerely,

John E. Cleghorn, O.C., FCA
Chairman of the Board
March 5, 2012
CHIEF EXECUTIVE OFFICER’S LETTER TO SHAREHOLDERS
Canadian Pacific’s mission is to deliver value to our shareholders by aggressively and successfully executing on the Multi-Year Plan. CP’s Multi-Year Plan is built on three pillars: driving volume growth, expanding network capacity to safely and efficiently support higher volumes and controlling costs. In addition, the Company is implementing its Multi-Year Plan through a focus on the organization’s core beliefs: service, safety, productivity and efficiency, people and growth.
In 2011, CP’s management team, with oversight from the Board of Directors, made meaningful progress in all three pillars of the Multi-Year Plan and we are beginning 2012 with operating momentum, excellent service and a stronger, more resilient rail network.
In the first half of 2011, the Company experienced extraordinary and prolonged weather that disrupted service and fluidity throughout the network. Our first priority was to re-establish the reputation for service which underpins our price and growth plans, and we have done just that. In grain, we filled 100 per cent of planned orders during the fourth quarter and achieved 92 per cent overall on-time daily car spotting. In Intermodal, we delivered on-time transcontinental train performance over 90 per cent during the fourth quarter.
CP also made improvements over the course of 2011 in our operating metrics, which are a leading indicator of both reliable service and financial results. Active cars online showed an improvement of 14 per cent versus fourth-quarter 2010 while handling five per cent more gross ton miles. We ended the year with record metrics in:
| ¨ | | Fuel efficiency of 1.17 gallons per 1,000 GTMs, matching the best-ever fourth-quarter performance; |
| ¨ | | Train weights, which set a new full-year record; and |
| ¨ | | Car miles per car day and terminal dwell, both fourth-quarter records, showing improvements of 20 per cent from the previous year. |
CP has made further improvements to its operating metrics in 2012. The improvements in these and other metrics are early evidence that our Multi-Year Plan is producing the desired results and we expect further improvements as the Plan progresses.
In 2011, the first year of CP’s post-recession multi-year capital program, we invested approximately $1.1 billion in our infrastructure. Under this program, we plan to invest between $1.1 and $1.2 billion in each of the next three years to deliver network improvements, locomotive upgrades and renewals, and enhanced information technology capability. The time, effort and capital invested in this program during 2011 contributed to CP achieving records in train weights, increased train speeds on our North Line and increased train lengths for export coal. These results are encouraging, but are only the first steps. We expect to see even greater operational and financial benefits as we deliver on years two, three and four of the capital program.
CP also finished the year with many successes in Marketing and Sales. During 2011, CP signed a number of commercial agreements with customers, terminal operators and ports that will drive supply chain improvement and enable growth. We have announced a new five-year agreement with Canadian Tire and a ten-year agreement with Canpotex. In addition, our scheduled grain program was successfully implemented in Canada.
CP is taking advantage of our network reach to expand markets for key bulk customers to meet Asian demand. We have used our Kansas City gateway and its Northeast U.S. destination points to extend our length of haul and increase revenue and profitability for oil and ethanol. Our successful market development activities have also enabled us to successfully take advantage of our access to the Bakken oil formation, the Marcellus gas formation and the Alberta oil sands area. As a result, CP is attracting new customers to invest in and ship energy-related products by rail. These products include crude oil, sulphur, fuels, diluents and materials key to the energy industry, such as frac sand and pipe. A key example of this kind of partnership is the recent announcement made by CP that it will be moving additional volumes of Bakken crude oil by unit train from the Van Hook logistics hub owned by the U.S. Development Group (USD), a high capacity facility that will become part of the largest crude by rail network in the US.
Given recent market successes and operating trends, in January we announced that we were able to narrow our operating ratio target for the next three years from the low 70s to 70-72 per cent, and we will not stop there — as the Company achieves its goals, we will set new targets. This team’s primary goal is to drive shareholder value by safely operating the business to realize our growth, service, and financial objectives.
Looking to 2012, CP expects to see continued strength in our operating performance and service reliability. These operating and service improvements are directly linked to the improved financial performance we expect starting in the first quarter of 2012. I would like to thank the employees of CP for their efforts in safely working through very challenging weather events in the first half of the year and delivering real operating improvements in the second half of 2011. We are already seeing the results of this hard work in 2012. In the year ahead, we are committed to delivering further operating improvement to drive enhanced financial performance and significant value for all stakeholders.
Sincerely,

Fred Green
President and Chief Executive Officer
March 5, 2012
MANAGEMENT’S DISCUSSION AND ANALYSIS
This Management’s Discussion and Analysis (“MD&A”) is provided in conjunction with the Consolidated Financial Statements and related notes for the year ended December 31, 2011 prepared in accordance with accounting principles generally accepted in the United States of America (“GAAP”). All information has been prepared in accordance with GAAP, except as described in Section 15, Non-GAAP Measures of this MD&A. Except where otherwise indicated, all financial information reflected herein is expressed in Canadian dollars.
March 5, 2012
In this MD&A, “our”, “us”, “we”, “CP” and “the Company” refer to Canadian Pacific Railway Limited (“CPRL”), CPRL and its subsidiaries, CPRL and one or more of its subsidiaries, or one or more of CPRL’s subsidiaries, as the context may require. Other terms not defined in the body of this MD&A are defined in Section 25, Glossary of Terms.
Unless otherwise indicated, all comparisons of results for 2011 and 2010 are against the results for 2010 and 2009, respectively. Unless otherwise indicated, all comparisons of results for the fourth quarter of 2011 are against the results for the fourth quarter of 2010.
1.BUSINESS PROFILE
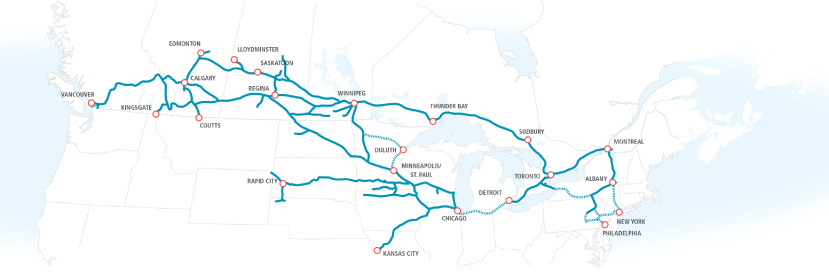
Canadian Pacific Railway Limited, through its subsidiaries, operates a transcontinental railway in Canada and the United States (“U.S.”) and provides logistics and supply chain expertise. Rail and intermodal transportation services are provided over a network of approximately 14,700 miles, serving the principal business centres of Canada from Montreal, Quebec, to Vancouver, British Columbia (“B.C.”), and the U.S. Northeast and Midwest regions. Our railway feeds directly into the U.S. heartland from the East and West coasts. Agreements with other carriers extend our market reach east of Montreal in Canada, throughout the U.S. and into Mexico. We transport bulk commodities, merchandise freight and intermodal traffic. Bulk commodities include grain, coal, sulphur and fertilizers. Merchandise freight consists of finished vehicles and automotive parts, as well as forest and industrial and consumer products. Intermodal traffic consists largely of high-value, time-sensitive retail goods in overseas containers that can be transported by train, ship and truck, and in domestic containers and trailers that can be moved by train and truck.
2.STRATEGY
Our vision is to become the safest and most fluid railway in North America. Our objective is to create long-term value for our customers, shareholders and employees by disciplined execution of our Integrated Operating Plan (“IOP”); by executing on our Multi-Year Plan which enhances and supports our IOP; and by aligning all parts of the organization around our five core beliefs:
| ¨ | | Service: Reliable and consistent service is our product. We are committed to executing our IOP in order to meet and exceed the needs of our customers in a cost-effective manner. |
| ¨ | | Safety: There is no job at CP that is so important that we can’t take the time to do it safely. Our comprehensive safety framework safeguards our employees, the communities we operate through, the environment and our customers’ freight enabling us to provide an effective transportation solution. |
| ¨ | | Productivity and Efficiency: Based on a culture of continuous improvement and accountability, we are always looking for better, less costly, more reliable ways to operate our business. |
| ¨ | | People: We pride ourselves in our well trained and knowledgeable team of railroaders. We are committed to executing the IOP and collaboratively working with our customers. |
| ¨ | | Growth: We invest in our franchise to enhance productivity and service, which allows us to capitalize on growth opportunities with new and existing customers at low incremental cost. |
Strategic Summary
We are taking a systematic approach to executing our strategy which is based on a disciplined execution of our IOP, the delivery of our Multi-Year Plan which supports the IOP and by ensuring clear accountabilities throughout the organization. CP’s Multi-Year Plan provides a clear blueprint with three key elements: driving volume growth, expanding network capacity to safely and efficiently support higher volumes and cost control. This strategy and related investments have set us firmly on track to deliver on our goal of bringing CP’s operating ratio down to 70% – 72% for 2014, and we will strive for continued improvement beyond 2014.
Integrated Operating Plan
The IOP is the foundation of our railway operations. All key aspects of the operation are scheduled to drive service reliability and on-time shipment performance. This encompasses road train operations, our First Mile-Last Mile program and all mechanical, engineering and other maintenance activities. The IOP continues to be enhanced through Lean continuous improvement, simplification and standardization of business processes and improved information systems. Our IOP is supported by a culture of accountability built on clear established metrics tied to each position in the organization and incentives tied to performance.
The underlying design principles of the IOP are:
| ¨ | | Velocity – keeping our assets moving through an efficient, scheduled 24/7 operation; |
| ¨ | | Balance – train and car movements are balanced daily in each corridor, yard and terminal, which drives efficiencies and asset velocity; and |
| ¨ | | Network – all aspects of the network’s operation are optimized to drive the best service, safety, productivity and efficiency outcome. |
We are continuing to improve the IOP with the following multi-year programs:
First Mile-Last Mile – this program drives improvements in service, asset velocity and enables low-cost growth by reducing railcars and creating additional terminal capacity.
Scheduled Bulk – we continue to schedule our bulk train operations as part of our IOP. In grain, our efforts involve leveraging our grain elevator footprint by scheduling all aspects of our grain shipments, including First Mile-Last Mile switching and bulk unit train operations, all centered around a simplified network of origin grain hubs.
Long Trains – this program is driving increased train lengths; improving service, safety, productivity and efficiency.
It includes targeted infrastructure enhancements and the use of proprietary train marshaling software, which maximizes the use of distributed locomotive power.
Fuel Efficiency – this program targets year-over-year improvements in fuel efficiency and reduced emissions. It consists of the acquisition of new locomotives, the remanufacturing of older locomotives and using new technologies which improve train handling and reduces idling. This program is enhanced by the disciplined execution of the IOP, improving velocity and driving fleet productivity.
Locomotive Reliability Centres – we are consolidating the number of major locomotive repair facilities from eight to four highly efficient super shops which will result in improved maintenance capabilities, lower unit costs, reduced overheads and improved locomotive availability and reliability.
Markets
Our Multi-Year Plan is based on three major sources of growth: Asian demand for commodities; growth in energy production and North American economic growth.
Strong long-term fundamentals support our bulk commodities business as Asian economies develop, expand and diversify. We have 10-year contracts with both Teck for metallurgical coal and with Canpotex for export potash. We continue to develop our extensive grain network through expansions at existing high-throughput grain elevators, new elevator development and collaboration in planned expansion of oil seed processing.
In the energy sector, our franchise accesses the Bakken Oil Formation in North Dakota and Saskatchewan, the Alberta Industrial Heartland supporting the Oilsands, and the Marcellus Gas Formation in the northeastern U.S. and allows us to develop new long-haul markets. With the strong global demand for energy we are growing our shipments in crude oil, ethanol and energy-related inputs such as pipe and frac sand.
North American economic growth will result in additional opportunities in a number of lines of business, including intermodal, automotive and forest products. We are leveraging our relationships, capital investments and the disciplined execution of our IOP to enable growth in these markets. In addition, we continue to enhance our intermodal franchise by expanding on our co-location model and terminal network.
Investments
CP is committed to the renewal of its infrastructure and making investments for productivity and growth through network enhancements, locomotive upgrades and information technology (“IT”) renewal. During 2011, we completed the first year of our multi-year accelerated capital program.
Our network investment plans include investing $75 to $100 million to increase the productivity in our Western Corridor which supports approximately 40% of our volumes. Our targeted infrastructure investments supports the operation of longer trains and enables low-cost growth.
In addition, approximately $250 million in upgrades over the next few years are underway on CP’s North Line, running from Winnipeg, Manitoba to Edmonton, Alberta. This program will result in an increase in track speeds and will support productivity and growth in potash, grain, energy related products and intermodal. By upgrading this portion of the network, route miles for some shipments will be reduced by between 5% – 10%. This upgrade will provide operating flexibility, with a second routing option for traffic currently traversing over the more southerly mainline, improving overall service reliability and network speed.
In order to capitalize on growth in energy, agriculture and potash shipments, we are investing approximately $90 million in enhancements to our North/ South corridors in the U.S. Midwest. These upgrades will increase capacity, enhance routing flexibility and lift the efficiency on all the business that travels on these lines. Similar to the North Line improvements, the investments will enhance network resiliency facilitating increased train speeds, car miles per car day, fuel efficiency and reducing terminal dwell.
Managing the movement of assets and information is a critical business process. Our multi-year IT program includes upgrades to our Shipment management and SAP suites. Predictive technologies will become important to driving even more efficiencies in field operations. These planned multi-year system upgrades position CP to enhance labour productivity, improve asset management and provide better shipment visibility to all parties.
CP has deployed a series of strategies expected to deliver a 1% – 2% per year improvement in fuel efficiency. Our plans include: expanding the application of fuel trip optimizer technology that assist train crews in efficient train handling; remanufacturing a portion of our older yard and local locomotive fleet at a 3 for 4 replacement ratio; the introduction of new stop-start technology that will reduce cold weather idling; and the renewal of our mainline locomotive fleet. In addition to improved fuel efficiency, reduced emissions and enhanced service reliability, this program will result in a more homogeneous fleet, further enhancing shop productivity. The re-manufacturing of older units will enhance inter-operability allowing for further productivity gains.
Finance
To support the Multi-Year Plan, which includes an accelerated capital program, the Company has continued to focus its efforts on the balance sheet to provide financial flexibility and preserve its investment grade rating while maintaining a competitive dividend.
Over the last three years, we have made $1.85 billion of solvency deficit contributions of which $1.75 billion were voluntary pension prepayments to our main Canadian defined benefit pension plan in order to provide stability and reduce volatility of our future funding requirements. These pension prepayments are accretive to earnings and are tax efficient resulting in low cash taxes over the next several years.
Additional measures taken to mitigate our pension funding volatility include, reducing our asset allocation to public equities, increasing our asset/liability interest rate matching and implementing a dynamic de-risking plan that will further reduce our allocation to public equities as our funded ratio increases.
We have taken advantage of attractive interest rates and have tendered and refinanced a number of debt maturities by blending and extending them further into the future. As a result, we have no significant debt maturities over the next several years.
Principal sources of liquidity are generated from cash from operations and, where necessary, access to a recently negotiated $1 billion four year revolving credit agreement.
People
To successfully execute our strategy, Canadian Pacific is committed to investing in its people. We continue to promote an engaged and stable workforce through:
| ¨ | | an organizational structure that provides for clear accountability and alignment across all functions; |
| ¨ | | an understanding and focus on our five core beliefs; |
| ¨ | | selection and development of the right employee for a required role; |
| ¨ | | training and appropriate resources for success; and |
| ¨ | | appropriate salary and incentive program that rewards performance. |
2011 Summary
The first half of 2011 was challenging as CP experienced significant disruptions to its operations across our network. These disruptions were mainly due to unusually severe winter weather and the impact of subsequent flooding, in one case causing a mainline outage lasting for three weeks. These extraordinary conditions resulted in slower train speeds, reduced productivity and asset velocity and lower than expected volumes in the first half of the year. Our priority was to re-establish our reputation for service which underpins our price and growth plans.
In the second half of the year, we successfully reset our network. There was a strong focus on rebuilding our customer confidence, through improved service reliability. Despite these challenges, we were able to complete our planned capital program in 2011. Our continued work on building new sidings and extending our current ones to support our long-train strategy paid dividends; CP set a new full-year record in train weights. In addition, we set full year records in both terminal dwell and car miles per car day as a result of implementing our First Mile-Last Mile program in Canada. We expect further improvements as we continue to tighten standards in Canada and roll out the program in the U.S. We completed the second phase of our Locomotive Reliability Centre strategy, which will reduce the number of major locomotive repair facilities from eight to four highly efficient super shops with improved repair capabilities. These improved efficiencies will allow us to do more with less and to reduce our asset pools and associated costs.
CP has signed several commercial agreements with customers, terminal operators and ports that will drive improvements in supply chain performance. In early 2012, we announced a new five-year agreement with Canadian Tire and a ten-year agreement with Canpotex. In addition, CP has worked with its customers, leveraging technology to enhance car request management and implementing new productivity tools. Our scheduled grain program has been successfully implemented in Canada and the U.S. program will be implemented by August 2012. We are also developing new volumes of Powder River Basin coal for export off the west coast of British Columbia.
During 2011, we continued to strengthen our balance sheet in order to maintain financial flexibility and reduce volatility. We put our surplus cash to work in 2011 on our strategic network enhancements, supporting our capital plans. In addition, we:
| ¨ | | managed our overall indebtedness by repaying US$246 million of maturing 2011 debt and called US$101 million of 2013 debt; |
| ¨ | | made a $600 million voluntary prepayment to our main Canadian defined benefit pension plan; |
| ¨ | | financed our voluntary pension prepayment and new locomotives at very attractive interest rates; and |
| ¨ | | delivered consistent dividend growth by increasing our quarterly dividend to common shareholders by 11%, from $0.27 to $0.30 in 2011. |
3.FORWARD-LOOKING INFORMATION
This MD&A contains certain forward-looking statements within the meaning of the United StatesPrivate Securities Litigation Reform Act of 1995 and other relevant securities legislation. These forward-looking statements include, but are not limited to statements concerning our operations, anticipated financial performance, business prospects and strategies as well as statements concerning the anticipation that cash flow from operations and various sources of financing will be sufficient to meet debt repayments and future obligations in the foreseeable future, statements regarding future payments including income taxes and pension contributions, and capital expenditures. Forward-looking information typically contains statements with words such as “anticipate”, “believe”, “expect”, “plan” or similar words suggesting future outcomes.
Readers are cautioned not to place undue reliance on forward-looking information because it is possible that we will not achieve predictions, forecasts, projections and other forms of forward-looking information. Current economic conditions render assumptions, although reasonable when made, subject to greater uncertainty. In addition, except as required by law, we undertake no obligation to update publicly or otherwise revise any forward-looking information, whether as a result of new information, future events or otherwise.
By its nature, our forward-looking information involves numerous assumptions, inherent risks and uncertainties, including but not limited to the following factors: changes in business strategies; general North American and global economic and business conditions; the availability and price of energy commodities; the effects of competition and pricing pressures; industry capacity; shifts in market demands; inflation; changes in laws and regulations, including regulation of rates; changes in taxes and tax rates; potential increases in maintenance and operating costs; uncertainties of investigations, proceedings or other types of claims and litigation; labour disputes; risks and liabilities arising from derailments; timing of completion of capital and maintenance projects; currency and interest rate fluctuations; effects of changes in market conditions on the financial position of pension plans and liquidity of investments; various events that could disrupt operations, including severe weather, droughts, floods, avalanches and earthquakes; security threats and governmental response to them; and technological changes.
There are more specific factors that could cause actual results to differ materially from those described in the forward-looking statements contained in this MD&A. These more specific factors are identified and discussed in Section 21, Business Risks and elsewhere in this MD&A. Other risks are detailed from time to time in reports filed by CP with securities regulators in Canada and the United States.
2012 Financial Assumptions
Defined benefit pension contributions are currently estimated to be between $100 million and $125 million in each of the next few years, a decrease from previous estimates of $125 million to $150 million. These contribution levels reflect the Company’s intentions with respect to the rate at which we apply the voluntary prepayments to reduce contribution requirements. Defined benefit pension expense for 2012 is expected to be $41 million. For 2013, defined benefit pension expense is expected to be approximately $125 million, assuming normal equity market returns and modest increases in bond yields in 2012, discussed further in Section 22, Critical Accounting Estimates.
It is expected that expenditures on capital programs will be in the range of $1.1 billion to $1.2 billion in 2012, discussed further in Section 14, Liquidity and Capital Resources.
A tax rate in the range of 25% to 27% is expected in 2012, discussed further in Section 10, Other Income Statement Items. Undue reliance should not be placed on these assumptions and other forward-looking information.
4. ADDITIONAL INFORMATION
Additional information, including our Consolidated Financial Statements, Annual Information Form, press releases and other required filing documents, is available on SEDAR at www.sedar.com in Canada, on EDGAR at www.sec.gov in the U.S. and on our website at www.cpr.ca. The aforementioned documents are issued and made available in accordance with legal requirements and are not incorporated by reference into this MD&A.
5. FINANCIAL HIGHLIGHTS
| | | | | | | | | | | | |
For the year ended December 31 (in millions, except percentages and per share data) | | 2011(1) | | | 2010 | | | 2009(2) | |
| | | | | | | | | | | | | |
Revenues | | $ | 5,177 | | | $ | 4,981 | | | $ | 4,402 | |
Operating income | | | 967 | | | | 1,116 | | | | 830 | |
Net income | | | 570 | | | | 651 | | | | 550 | |
| | | | | | | | | | | | | |
Basic earnings per share | | | 3.37 | | | | 3.86 | | | | 3.31 | |
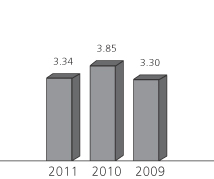
Diluted earnings per share (“EPS”) | | | 3.34 | | | | 3.85 | | | | 3.30 | |
Dividends declared per share | | | 1.1700 | | | | 1.0575 | | | | 0.9900 | |
| | | | | | | | | | | | | |
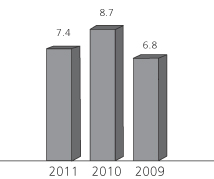
Return on capital employed (“ROCE”)(3) | | | 7.4 | % | | | 8.7 | % | | | 6.8 | % |
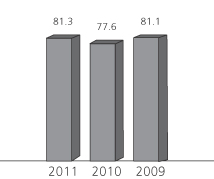
Operating ratio | | | 81.3 | % | | | 77.6 | % | | | 81.1 | % |
| | | | | | | | | | | | | |
Free cash(4)(5) | | | (724 | ) | | | (324 | ) | | | (91 | ) |
Voluntary prepayments to the main Canadian defined benefit pension plan (included in Free cash above) | | | (600 | ) | | | (650 | ) | | | (500 | ) |
| | | | | | | | | | | | | |
Total assets at December 31 | | | 14,110 | | | | 13,676 | | | | 14,155 | |
Total long-term financial liabilities at December 31(6) | | | 4,812 | | | | 4,170 | | | | 4,302 | |
| | | | | | | | | | | | | |
| | | | |
Diluted EPS ($) | | Operating ratio (%) | | Return on capital employed(3) (%) |
| | 
| | 
|
(1) The 2011 figures include a $37 million tax benefit resulting from the resolution of certain income tax matters and adjustments related to previous-year tax filings and estimates.
(2) The 2009 figures include a $79 million, or $68 million after tax, gain on sales of significant properties; $55 million, or $38 million after tax, loss on termination of lease with shortline railway; $56 million tax benefit; and $81 million, or $69 million after tax, gain on the sale of a partnership interest.
(3) ROCE is defined as earnings before interest and taxes, divided by the average for the year of total assets, less current liabilities excluding current portion of long-term debt, as measured under GAAP. It is an all-encompassing measure of performance which measures how productively the Company uses its assets.
(4) This measure has no standardized meaning prescribed by GAAP and, therefore, is unlikely to be comparable to similar measures of other companies. This measure is discussed further in Section 15, Non-GAAP Measures along with a reconciliation of free cash to GAAP cash position in Section 14, Liquidity and Capital Resources.
(5) Includes $600 million, $650 million and $500 million voluntary prepayments to the Company’s main Canadian defined benefit pension plan in 2011, 2010 and 2009, respectively, discussed further in Section 14, Liquidity and Capital Resources and Section 22, Critical Accounting Estimates.
(6) Excludes deferred taxes of $1,819 million, $1,945 million and $1,819 million, and other non-financial long-term liabilities of $1,620 million, $1,447 million and $1,770 million for the years 2011, 2010 and 2009, respectively.
6. OPERATING RESULTS
Income
Operating income was $967 million in 2011, a decrease of $149 million, or 13%, from $1,116 million in 2010.
This decrease was primarily due to:
| ¨ | | significant disruptions to train operations across the network in the first half of the year due to unusually severe winter weather and subsequent flooding; |
| ¨ | | the net unfavourable impact of higher fuel costs; |
| ¨ | | increased IT costs associated with outsourced infrastructure and maintenance services and planning expenses with respect to new applications in support of future growth; |
| ¨ | | higher crew training expenses to meet business demand and attrition; and |
| ¨ | | the net unfavourable impact of the change in foreign exchange (“FX”). |
This decrease was partially offset by lower incentive and stock-based compensation expenses.
Net income was $570 million in 2011, a decrease of $81 million, or 12%, from $651 million in 2010. This decrease was primarily due to lower operating income and the unfavourable impact of expenses associated with the redemption of the 2013 debt discussed further in Section 14, Liquidity and Capital Resources, the unfavourable impact of FX losses on working capital, along with increased advisory fees related to shareholder matters in Other income and charges. This decrease was partially offset by lower income tax expense, driven primarily by the resolution of certain income tax matters and lower taxable income, discussed further in Section 10, Other Income Statement Items.
Operating income was $1,116 million in 2010, an increase of $286 million, or 34%, from $830 million in 2009. This increase was primarily due to improved revenues as a result of a strengthened economy, discussed further in Section 8, Lines of Business, and continued cost management activities. The increase in 2010 Operating income reflected the fact that in 2009 CP incurred a loss of $55 million which arose from the termination of a lease with a shortline railway. This was partially offset by the 2009 gain on sales of significant properties and the unfavourable impact of the change in FX.
Net income was $651 million in 2010, an increase of $101 million, or 18%, from $550 million in 2009. This increase was primarily due to higher Operating income.
This increase was partially offset by:
| ¨ | | the 2009 gain on sale of a partnership interest, discussed further in Section 10, Other Income Statement Items; |
| ¨ | | an increase in income tax expense; and |
| ¨ | | income tax recoveries in 2009, discussed further in Section 10, Other Income Statement Items. |
Diluted Earnings per Share
Diluted EPS was $3.34 in 2011, a decrease of $0.51, or 13%, from $3.85 in 2010. This decrease was primarily due to lower Net income. Diluted EPS for 2011 includes a $0.22 per share income tax benefit, discussed further in Section 10, Other Income Statement Items. Diluted EPS was $3.85 in 2010, an increase of $0.55, or 17%, from $3.30 in 2009. This increase was primarily due to higher Net income, offset slightly by an increase in the number of common shares.
Operating Ratio
The operating ratio provides the percentage of revenues used to operate the railway, and is calculated as total operating expenses divided by total revenues. A lower percentage normally indicates higher efficiency in the operation of the railway. The operating ratio was 81.3% in 2011, an increase from 77.6% in 2010. The increase was primarily due to higher weather related costs and inefficiencies, higher fuel costs, increased IT costs and increased crew training costs. Our operating ratio was 77.6% in 2010, a decrease from 81.1% in 2009. This was primarily due to higher freight revenues and continued cost management initiatives.
Return on Capital Employed
Return on capital employed at December 31, 2011 was 7.4% compared with 8.7% in 2010 and 6.8% in 2009. Driving these fluctuations over this period were the changes in earnings. The decrease in 2011 was due to lower earnings while the 2010 increase reflected higher earnings.
Impact of Foreign Exchange on Earnings
Fluctuations in FX affect our results because U.S. dollar-denominated revenues and expenses are translated into Canadian dollars. U.S. dollar-denominated revenues and expenses decrease when the Canadian dollar strengthens in relation to the U.S. dollar.
| | | | | | | | | | | | |
Canadian to U.S. dollar Average exchange rates | | 2011 | | | 2010 | | | 2009 | |
| | | | | | | | | | | | | |
Year ended – December 31 | | $ | 0.99 | | | $ | 1.03 | | | $ | 1.15 | |
For the three months ended – December 31 | | $ | 1.02 | | | $ | 1.02 | | | $ | 1.07 | |
| | | | | | | | | | | | | |
| | | | | | | | | | | | |
Canadian to U.S. dollar Exchange rates | | 2011 | | | 2010 | | | 2009 | |
| | | | | | | | | | | | | |
Beginning of year – January 1 | | $ | 0.99 | | | $ | 1.05 | | | $ | 1.22 | |
Beginning of quarter – April 1 | | $ | 0.97 | | | $ | 1.02 | | | $ | 1.26 | |
Beginning of quarter – July 1 | | $ | 0.96 | | | $ | 1.06 | | | $ | 1.16 | |
Beginning of quarter – October 1 | | $ | 1.05 | | | $ | 1.03 | | | $ | 1.07 | |
End of quarter – December 31 | | $ | 1.02 | | | $ | 0.99 | | | $ | 1.05 | |
| | | | | | | | | | | | | |
| | | | | | | | | | | | |
Average Fuel Prices (U.S. dollars per U.S. gallon) | | 2011 | | | 2010 | | | 2009 | |
| | | | | | | | | | | | | |
Year ended – December 31 | | $ | 3.38 | | | $ | 2.50 | | | $ | 2.04 | |
For the three months ended – December 31 | | $ | 3.45 | | | $ | 2.68 | | | $ | 2.28 | |
| | | | | | | | | | | | | |
7. PERFORMANCE INDICATORS
| | | | | | | | | | | | | | | | | | | | |
| For the year ended December 31 | | 2011 | | | 2010(1) | | | 2009(1) | | | % Change | |
| | | | | 2011
vs. 2010 | | | 2010
vs. 2009 | |
| | | | | | | | | | | | | | | | | | | | | |
Operations performance | | | | | | | | | | | | | | | | | | | | |
Freight gross ton-miles (millions) | | | 247,955 | | | | 242,757 | | | | 209,475 | | | | 2 | | | | 16 | |
Train miles (thousands) | | | 40,145 | | | | 39,576 | | | | 34,757 | | | | 1 | | | | 14 | |
Average number of active employees – expense | | | 14,169 | | | | 13,879 | | | | 13,619 | | | | 2 | | | | 2 | |
Average daily active cars on-line (thousands)(2) | | | 51.4 | | | | 50.9 | | | | 46.6 | | | | 1 | | | | 9 | |
Average daily active road locomotives on-line | | | 1,085 | | | | 1,016 | | | | 785 | | | | 7 | | | | 29 | |
Average train speed – AAR definition (mph)(2) | | | 21.3 | | | | 22.7 | | | | 25.4 | | | | (6 | ) | | | (11 | ) |
Average terminal dwell – AAR definition (hours) | | | 19.9 | | | | 21.4 | | | | 21.9 | | | | (7 | ) | | | (2 | ) |
Car miles per car day(2) | | | 160.1 | | | | 159.4 | | | | 142.6 | | | | – | | | | 12 | |
Fuel efficiency(3) | | | 1.18 | | | | 1.17 | | | | 1.19 | | | | 1 | | | | (2 | ) |
Average train weight – excluding local traffic (tons)(2) | | | 6,593 | | | | 6,519 | | | | 6,416 | | | | 1 | | | | 2 | |
Average train length – excluding local traffic (feet)(2) | | | 5,665 | | | | 5,660 | | | | 5,608 | | | | – | | | | 1 | |
Locomotive productivity (daily average GTMs/active horse power (“HP”))(2) | | | 166.7 | | | | 176.6 | | | | 187.4 | | | | (6 | ) | | | (6 | ) |
Employee productivity (million GTMs/expense employee) | | | 17.5 | | | | 17.5 | | | | 15.4 | | | | – | | | | 14 | |
Safety indicators | | | | | | | | | | | | | | | | | | | | |
FRA personal injuries per 200,000 employee-hours | | | 1.86 | | | | 1.67 | | | | 1.92 | | | | 11 | | | | (13 | ) |
FRA train accidents per million train-miles | | | 1.85 | | | | 1.65 | | | | 1.81 | | | | 12 | | | | (9 | ) |
| | | | | | | | | | | | | | | | | | | | | |
(1) Certain prior period figures have been reclassified to conform with current presentation or have been updated to reflect new information.
(2)Certain figures are excluding Dakota, Minnesota & Eastern Railroad Corporation (“DM&E”) for 2009.
(3) Fuel efficiency is defined as U.S. gallons of locomotive fuel consumed per 1,000 GTMs – freight and yard.
The indicators listed in this table are key measures of our operating performance. Definitions of these performance indicators are provided in Section 25, Glossary of Terms.
In the first half of 2011, we experienced significant disruptions to train operations across the network due to unusually severe winter weather and subsequent flooding which are reflected in our year-to-date operating metrics. In the second half of 2011, we saw a recovery of our network, and this set the stage for certain record setting operating metrics in the fourth quarter of 2011. Refer to Section 12, Fourth-Quarter Summary for a detailed explanation and analysis of our performance indicators for the fourth quarter of 2011.
Operations Performance
GTMs for 2011 were 247,955 million, which increased by 2% compared with 242,757 million in 2010. This increase was primarily due to traffic mix changes. GTMs for 2010 were 242,757 million, which increased by 16% compared with 209,475 million in 2009. This increase was primarily due to an increase in traffic across all lines of business, other than grain which was relatively flat year-over-year.
Train miles for 2011 were relatively flat year-over-year. Train miles for 2010 increased by 14% compared with 2009. This increase was primarily due to increased traffic volumes and was partially offset by management’s strategy of consolidating and running longer, heavier trains.
The average number of active expense employees for 2011 increased by 290, or 2%, compared with 2010. This increase was primarily due to additional hiring to address volume growth projections and attrition. The average number of active expense employees for 2010 increased by 260, or 2%, compared with 2009. This increase was primarily due to higher traffic volumes resulting from a stronger economy.
The average daily active cars on-line was relatively flat year-over-year. In the fourth quarter of 2011, there was a 14% improvement in average daily active cars on-line compared to the same period of 2010, reflecting improvements in dwell and speed. The average daily active cars on-line for 2010 increased by approximately 4,300 cars, or 9%, compared with 2009. This increase was primarily due to an increase in traffic across all lines of business, other than grain which was relatively flat.
The average daily active road locomotives on-line for 2011 increased by 69 units, or 7%, compared with 2010. This was primarily due to significant disruptions to train operations across the network due to unusually severe winter weather and flooding in the first half of the year which reduced network speed and added train miles for rerouting of traffic. The second half of 2011 saw a return to more normalized numbers. The average daily active road locomotives on-line for 2010 increased by 231 units, or 29%, compared with 2009. This increase was primarily due to increased volumes, traffic mix, and supply chain pipeline issues.
Average train speed was 21.3 miles per hour in 2011, a decline of 6%, from 22.7 miles per hour in 2010. This decline was primarily due to increased volumes, traffic mix, supply chain pipeline issues and significant disruptions to train operations across the network due to unusually severe winter weather and flooding in the first half of the year. The fourth quarter average train speed improved by 8% compared to the same period of 2010. Average train speed was 22.7 miles per hour in 2010, a decline of 11%, from 25.4 miles per hour in 2009. This decline was primarily due to increased volumes, traffic mix, and supply chain pipeline issues.
Average terminal dwell, the average time a freight car resides in a terminal, improved by 7% in 2011 to 19.9 hours, from 21.4 hours in 2010. In addition to the year-over-year improvements in terminal dwell, we realized a 20% reduction in the fourth quarter of 2011 compared to the same period of 2010, a record for CP. Average terminal dwell improved by 2% in 2010 when compared to 2009. These improvements were primarily due to programs supporting the execution of our IOP designed to improve asset velocity and a continued focus on the storage of surplus cars.
Car miles per car day were 160.1 in 2011, relatively flat compared to 159.4 in 2010. This was primarily due to poor operating fluidity as a result of significant disruptions to train operations across the network due to unusually severe winter weather and flooding in the first half of the year and was partially offset by various initiatives in the design and execution of our IOP focused on improving asset velocity. Our fourth quarter car miles per car day improved 20% compared to the same period in 2010, this was a record for CP. Car miles per car day were 159.4 in 2010, an increase of 12% from 142.6 in 2009. This increase was primarily due to various initiatives in the design and execution of our IOP focused on improving asset velocity.
Fuel efficiency declined by 1% in 2011 compared to 2010. This decline was primarily due to significant disruptions to train operations across the network due to unusually severe winter weather and flooding in the first half of the year. This decline was partially offset by the new fuel savings technology introduced on over 260 locomotives and continued focus on fuel conservation programs including idle reduction and train handling practices. Our fourth quarter fuel efficiency improved 3% compared to the same period of 2010. Fuel efficiency improved by 2% in 2010 compared with 2009. This improvement was primarily due to new fuel saving technology introduced on 200 locomotives and continued focus on fuel conservation programs including idle reduction and train handling practices.
Average train weight improved 1% to 6,593 tons in 2011 compared to 2010. This improvement was primarily due to our continued implementation of the long-train strategy in the bulk franchise. This was a record for CP. Average train weight improved in 2010 by 103 tons or 2% from 2009. This improvement was primarily due to increased traffic volumes and management’s strategy of consolidating and running longer, heavier trains.
Average train length was relatively flat year-over-year. Average train length increased in 2010 by 52 feet, or 1%, from 2009. This increase was primarily due to increased traffic volumes and management’s strategy of consolidating and running longer, heavier trains.
Locomotive productivity, as measured by daily average GTMs per active horse power, decreased in 2011 by 6% from 2010. This decrease was primarily due to significant disruptions to train operations across the network due to unusually severe winter weather and flooding in the first half of
the year. Locomotive productivity decreased in 2010 by 6% from 2009. The decrease in 2010 was mainly due to increased traffic volumes and supply chain issues.
Employee productivity, as measured by million GTMs per expense employee, was unchanged in 2011, compared to 2010. Employee productivity increased in 2010 by 14% from 2009. The increase was primarily due to management’s strategy of consolidating and running longer, heavier trains.
Safety Indicators
Safety is a key priority for our management and Board of Directors. Our two main safety indicators, personal injuries and train accidents, follow strict U.S. Federal Railroad Administration (“FRA”) reporting guidelines. CP strives to continually improve its safety performance through key strategies and activities such as training and technology.
The FRA personal injury rate per 200,000 employee-hours for CP was 1.86 in 2011, 1.67 in 2010 and 1.92 in 2009. The increase in 2011 was primarily due to a higher number of minor injuries.
The FRA train accident rate for CP in 2011 was 1.85 accidents per million train-miles, compared with 1.65 in 2010 and 1.81 in 2009. The increase in 2011 was primarily due to difficult operating conditions in the first half of the year.
8. LINES OF BUSINESS
Revenues
| | | | | | | | | | | | | | | | | | | | |
| | | | | | | | | | | | % Change | |
For the year ended December 31 (in millions) | | | 2011 | | | | 2010 | | | | 2009 | | |
| 2011
vs. 2010 |
| |
| 2010
vs. 2009 |
|
| | | | | | | | | | | | | | | | | | | | | |
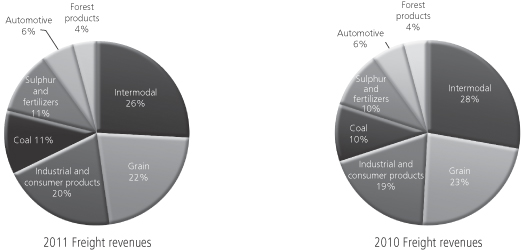
Freight revenues | | | | | | | | | | | | | | | | | | | | |
Grain | | $ | 1,100 | | | $ | 1,135 | | | $ | 1,137 | | | | (3 | ) | | | – | |
Coal | | | 556 | | | | 491 | | | | 444 | | | | 13 | | | | 11 | |
Sulphur and fertilizers | | | 549 | | | | 475 | | | | 309 | | | | 16 | | | | 54 | |
Forest products | | | 189 | | | | 185 | | | | 176 | | | | 2 | | | | 5 | |
Industrial and consumer products | | | 1,017 | | | | 903 | | | | 786 | | | | 13 | | | | 15 | |
Automotive | | | 338 | | | | 316 | | | | 230 | | | | 7 | | | | 37 | |
Intermodal | | | 1,303 | | | | 1,348 | | | | 1,198 | | | | (3 | ) | | | 13 | |
| | | | | | | | | | | | | | | | | | | | | |
Total freight revenues | | | 5,052 | | | | 4,853 | | | | 4,280 | | | | 4 | | | | 13 | |
Other revenue | | | 125 | | | | 128 | | | | 122 | | | | (2 | ) | | | 5 | |
| | | | | | | | | | | | | | | | | | | | | |
Total revenues | | $ | 5,177 | | | $ | 4,981 | | | $ | 4,402 | | | | 4 | | | | 13 | |
| | | | | | | | | | | | | | | | | | | | | |
Our revenues are primarily derived from transporting freight. Other revenue is generated from leasing of certain assets, switching fees, other engagements including logistical services, and contracts with passenger service operators.
In 2011, 2010 and 2009 no one customer comprised more than 10% of total revenues and accounts receivable.
2011 TO 2010 COMPARATIVES
Freight Revenues
Freight revenues are earned from transporting bulk, merchandise and intermodal goods, and include fuel recoveries billed to our customers. Freight revenues were $5,052 million in 2011, an increase of $199 million, or 4%, from $4,853 million in 2010.
This increase was primarily due to higher:
| ¨ | | shipments in industrial and consumer products, automotive, and potash; |
| ¨ | | fuel surcharge revenues due to the change in fuel price; and |
| ¨ | | freight rates for all lines of business. |
This increase was partially offset by:
| ¨ | | lower volumes of import/export intermodal traffic; |
| ¨ | | lower U.S. originating coal shipments; |
| ¨ | | lower U.S. originating grain shipments; and |
| ¨ | | the unfavourable impact of the change in FX. |
Fuel Cost Recovery Program
A change in fuel prices may adversely impact expenses and revenues. CP employs a fuel cost recovery program designed to mechanistically respond to fluctuations in fuel prices and help mitigate the financial impact of rising fuel prices.
Grain
Grain shipments consist of both whole grains, such as wheat, corn, soybeans, and canola, and processed products such as meals, oils, and flour. Canadian grain products are primarily transported to ports for export and to Canadian and U.S. markets for domestic consumption. U.S. grain products are shipped from the Midwestern U.S. to other points in the Midwest, the Pacific Northwest and Northeastern U.S. Grain revenue was $1,100 million in 2011, a decrease of $35 million, or 3%, from $1,135 million in 2010.
This decrease was primarily due to:
| ¨ | | lower U.S. originated shipments driven by reduced wheat production and export demand for feed grains; |
| ¨ | | lower Canadian grain shipments in the first half of the year due to unusually difficult weather and other supply chain issues; and |
| ¨ | | the unfavourable impact of the change in FX. |
This decrease was partially offset by:
| ¨ | | increased Canadian grain shipments resulting from the introduction of our scheduled grain program enabling us to recapture market share in the second half of the year; |
| ¨ | | higher fuel surcharge revenues due to the change in fuel prices; and |
| ¨ | | increased freight rates. |
Coal
Our Canadian coal business consists primarily of metallurgical coal transported from southeastern B.C. to the ports of Vancouver, B.C. and Thunder Bay, Ontario, and to the U.S. Midwest. Our U.S. coal business consists primarily of the transportation of thermal coal and petroleum coke within the U.S. Midwest and growing shipments of Powder River Basin coal for export off the Canadian west coast. Coal revenue was $556 million in 2011, an increase of $65 million, or 13%, from $491 million in 2010. This increase was primarily due to an increase in long-haul metallurgical coal shipments due to strong overall demand and increased freight rates for U.S. originated traffic. This increase was partially offset by lower U.S. originating volumes as certain short haul U.S. thermal coal contracts were not renewed, as well as the unfavourable impact of the change in FX.
Sulphur and Fertilizers
Sulphur and fertilizers include potash, chemical fertilizers and sulphur shipped mainly from western Canada to the ports of Vancouver, B.C., and Portland, Oregon, and to other Canadian and U.S. destinations. Sulphur and fertilizers revenue was $549 million in 2011, an increase of $74 million, or 16%, from $475 million in 2010.
This increase was primarily due to higher:
| ¨ | | export potash shipments as volumes fully recovered to pre-recession levels; |
| ¨ | | domestic potash and fertilizer shipments due to increased overall demand; |
| ¨ | | fuel surcharge revenues due to the change in fuel price; and |
This increase was partially offset by the unfavourable impact of the change in FX.
Forest Products
Forest products include lumber, wood pulp, paper products and panel transported from key producing areas in western Canada, Ontario and Quebec to various destinations in North America. Forest products revenue was $189 million in 2011, an increase of $4 million, or 2%, from $185 million in 2010.
This increase was primarily due to higher:
| ¨ | | shipments of pulp and paper products for the first three quarters of the year due to a re-opening of a mill on our line in 2010; |
| ¨ | | fuel surcharge revenues due to the change in fuel price; and |
This increase was partially offset by the unfavourable impact of the change in FX.
Industrial and Consumer Products
Industrial and consumer products include chemicals, plastics, aggregates, steel, mine, ethanol and other energy-related products (other than coal) shipped throughout North America. Industrial and consumer products revenue was $1,017 million in 2011, an increase of $114 million, or 13%, from $903 million in 2010.
This increase was primarily due to higher:
| ¨ | | overall industrial products volumes due to strong market demand and growth in the Bakken Oil Formation, the Alberta Industrial Heartland and the Marcellus Gas Formation and for energy related inputs; |
| ¨ | | fuel surcharge revenues due to the change in fuel price; and |
This increase was partially offset by the unfavourable impact of the change in FX.
Automotive
Automotive consists primarily of three core finished-vehicle traffic segments: import vehicles, Canadian-produced vehicles and U.S.-produced vehicles. These segments move through Port Metro Vancouver to eastern Canadian markets; to the U.S. from Ontario production facilities; and to Canadian markets, respectively. Automotive revenue was $338 million in 2011, an increase of $22 million, or 7%, from $316 million in 2010.
This increase was primarily due to higher:
| ¨ | | shipments as a result of higher North American auto sales and higher overall auto production by domestic producers; |
| ¨ | | fuel surcharge revenues due to the change in fuel price; and |
This increase was partially offset by reduced import volumes through the Port Metro Vancouver and production at certain North American plants which suffered from component delivery disruptions following the earthquake and tsunami in Japan, and the unfavourable impact of the change in FX.
Intermodal
CP’s intermodal portfolio consists of domestic and international services. Our domestic business consists primarily of the movement of manufactured consumer products in containers within North America. The international business handles the movement of marine containers between ports and North American inland markets. Intermodal revenue was $1,303 million in 2011, a decrease of $45 million, or 3%, from $1,348 million in 2010.
This decrease was primarily due to:
| ¨ | | lower overall volumes due to the loss of market share as a result of significant disruptions to train operations across the network due to unusually severe winter weather and flooding in the first half of the year; |
| ¨ | | lower shipments through the Port Metro Vancouver; and |
| ¨ | | the unfavourable impact of the change in FX. |
This decrease was partially offset by increased freight rates and higher fuel cost recovery revenues due to the increase in fuel price.
Other Revenue
Other revenue was $125 million in 2011, a decrease of $3 million, or 2%, from $128 million in 2010. This decrease was primarily due to lower passenger revenues and the unfavourable impact of the change in FX, partially offset by higher leasing and switching revenues.
2010 TO 2009 COMPARATIVES
Revenue variances below compare 2010 to 2009 figures.
Freight Revenues
Freight revenues were $4,853 million in 2010, an increase of $573 million, or 13%, from $4,280 million in 2009.
This increase was primarily due to:
| ¨ | | higher traffic volumes due to an improved economy; |
| ¨ | | higher fuel surcharge revenues due to the change in fuel price; and |
| ¨ | | increased freight rates on average for all lines of business. |
This increase was partially offset by the unfavourable impact of the change in FX.
Grain
Grain revenue was $1,135 million in 2010, a decrease of $2 million from $1,137 million in 2009. This decrease was primarily due to lower Canadian grain shipments driven by lower overall production for the 2009/2010 crop year compared to above average production in the 2008/2009 crop year, and the unfavourable impact of the change in FX. The decrease was partially offset by increased U.S. originated shipments, higher fuel surcharge revenues due to the change in fuel prices, and increased freight rates.
Coal
Coal revenue was $491 million in 2010, an increase of $47 million, or 11%, from $444 million in 2009.
This increase was primarily due to:
| ¨ | | an increase in demand for metallurgical coal to Asia; |
| ¨ | | increased freight rates for U.S. originated traffic; and |
| ¨ | | higher fuel surcharge revenues due to the change in fuel price. |
This increase was partially offset by a reduced average length of haul as a result of changes in traffic mix, and the unfavourable impact of the change in FX.
Sulphur and Fertilizers
Sulphur and fertilizers revenue was $475 million in 2010, an increase of $166 million, or 54%, from $309 million in 2009.
This increase was primarily due to higher:
| ¨ | | export potash shipments as a result of the return of international buyers to the market; |
| ¨ | | domestic potash shipments due to increased overall demand and rising commodity prices, such as grain, in the second half of the year; |
| ¨ | | fuel surcharge revenues due to the change in fuel price; and |
This increase was partially offset by the unfavourable impact of the change in FX.
Forest Products
Forest products revenue was $185 million in 2010, an increase of $9 million, or 5%, from $176 million in 2009.
This increase was primarily due to:
| ¨ | | higher overall shipments of pulp and paper products due to the re-opening of a mill on our line in 2010; |
| ¨ | | higher fuel surcharge revenues due to the change in fuel price; and |
| ¨ | | increased freight rates and extended length of haul. |
The increase was partially offset by the unfavourable impact of the change in FX.
Industrial and Consumer Products
Industrial and consumer products revenue was $903 million in 2010, an increase of $117 million, or 15%, from $786 million from 2009.
This increase was primarily due to higher:
| ¨ | | shipments of steel, clay and aggregates driven by the improvement in the North American economy; |
| ¨ | | fuel surcharge revenues due to the change in fuel price; and |
This increase was partially offset by the unfavourable impact of the change in FX.
Automotive
Automotive revenue was $316 million in 2010, an increase of $86 million, or 37%, from $230 million in 2009.
This increase was primarily due to:
| ¨ | | increased overall auto production and higher North American auto sales; |
| ¨ | | the absence of a series of unusual plant shutdowns and curtailments of production caused by the restructuring of U.S. automakers in 2009; |
| ¨ | | higher fuel surcharge revenues due to the change in fuel price; and |
| ¨ | | increased freight rates. |
This increase was partially offset by the unfavourable impact of the change in FX.
Intermodal
Intermodal revenue was $1,348 million in 2010, an increase of $150 million, or 13%, from $1,198 million in 2009.
This increase was primarily due to:
| ¨ | | increased domestic container shipments particularly for cross border and retail traffic; |
| ¨ | | higher overall import/export volumes through the Port Metro Vancouver; |
| ¨ | | higher fuel surcharge revenues due to the change in fuel price; and |
| ¨ | | increased freight rates. |
This increase was partially offset by reduced volumes in short-haul lanes and the unfavourable impact of the change in FX and overall lower imports through the Eastern ports by CP served shipping lines.
Other Revenue
Other revenue was $128 million in 2010, an increase of $6 million, or 5%, from $122 million in 2009. This increase was primarily due to increased revenues from leasing and switching, partially offset by lower passenger revenues and the unfavourable impact of the change in FX.
Volumes
| | | | | | | | | | | | | | | | | | | | |
| | | | | | | | | | | | % Change | |
| For the year ended December 31 | | | 2011 | | | | 2010 | | | | 2009 | | |
| 2011 vs.
2010 |
| |
| 2010 vs.
2009 |
|
| | | | | | | | | | | | | | | | | | | | | |
| | | | | | | | | | | | | | | | | | | | |
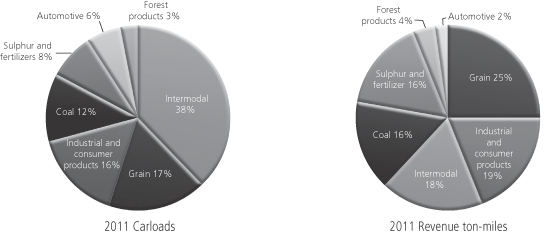
Carloads (in thousands) | | | | | | | | | | | | | | | | | | | | |
Grain | | | 450 | | | | 467 | | | | 469 | | | | (4 | ) | | | – | |
Coal | | | 313 | | | | 341 | | | | 305 | | | | (8 | ) | | | 12 | |
Sulphur and fertilizers | | | 199 | | | | 177 | | | | 109 | | | | 12 | | | | 62 | |
Forest products | | | 72 | | | | 72 | | | | 67 | | | | – | | | | 7 | |
Industrial and consumer products | | | 421 | | | | 397 | | | | 346 | | | | 6 | | | | 15 | |
Automotive | | | 145 | | | | 137 | | | | 104 | | | | 6 | | | | 32 | |
Intermodal | | | 997 | | | | 1,070 | | | | 963 | | | | (7 | ) | | | 11 | |
| | | | | | | | | | | | | | | | | | | | | |
Total carloads | | | 2,597 | | | | 2,661 | | | | 2,363 | | | | (2 | ) | | | 13 | |
| | | | | | | | | | | | | | | | | | | | | |
| | | | | | | | | | | | | | | | | | | | |
Revenue ton-miles (in millions) | | | | | | | | | | | | | | | | | | | | |
Grain | | | 32,481 | | | | 34,556 | | | | 34,838 | | | | (6 | ) | | | (1 | ) |
Coal | | | 21,041 | | | | 19,021 | | | | 16,997 | | | | 11 | | | | 12 | |
Sulphur and fertilizers | | | 20,468 | | | | 17,687 | | | | 9,362 | | | | 16 | | | | 89 | |
Forest products(1) | | | 4,960 | | | | 5,091 | | | | 4,470 | | | | (3 | ) | | | 14 | |
Industrial and consumer products(1) | | | 24,122 | | | | 22,143 | | | | 17,653 | | | | 9 | | | | 25 | |
Automotive | | | 2,080 | | | | 2,067 | | | | 1,607 | | | | 1 | | | | 29 | |
Intermodal | | | 23,907 | | | | 25,863 | | | | 23,425 | | | | (8 | ) | | | 10 | |
| | | | | | | | | | | | | | | | | | | | | |
Total revenue ton-miles | | | 129,059 | | | | 126,428 | | | | 108,352 | | | | 2 | | | | 17 | |
| | | | | | | | | | | | | | | | | | | | | |
| | | | | | | | | | | | | | | | | | | | |
(1)Certain prior period figures have been reclassified to conform with current presentation.
Changes in freight volumes generally contribute to corresponding changes in freight revenues and certain variable expenses, such as fuel, equipment rents and crew costs. Volumes in 2011, as measured by total carloads, decreased by approximately 64,000 units, or 2%, compared to 2010.
This decrease in carloads was primarily due to lower volumes of:
| ¨ | | import/export intermodal traffic; |
| ¨ | | U.S. originating coal; and |
| ¨ | | U.S. originating grain shipments. |
This decrease in carloads was partially offset by increased:
| ¨ | | volumes of industrial and consumer products traffic; |
| ¨ | | volumes of export and domestic potash; and |
Volumes in 2010, as measured by total carloads, increased by approximately 298,000 units, or 13%, compared to 2009. This increase in carloads was a result of higher demand driven by an improved economy, a rebound in coal and fertilizer volumes, and inventory replenishment by our customers benefiting the majority of our lines of business in the year.
Revenue ton-miles (“RTMs”) in 2011 increased by 2,631 million, or 2%, compared to 2010.
This increase was primarily due to higher:
| ¨ | | volumes in industrial and consumer products; |
| ¨ | | volumes of export and domestic potash; and |
| ¨ | | long-haul metallurgical coal shipments. |
This increase in RTMs was partially offset by lower U.S. originating grain shipments and lower volumes of import/export intermodal traffic.
RTMs in 2010 increased by 18,076 million, or 17%, compared to 2009. This increase was a result of higher demand driven by an improved economy, a rebound in coal and fertilizer volumes, and inventory replenishment by our customers benefiting the majority of our lines of business in the year.
Freight Revenue per Carload
| | | | | | | | | | | | | | | | | | | | |
| | | | | | | | | | | | % Change | |
For the year ended December 31 (dollars) | | | 2011 | | | | 2010(1) | | | | 2009(1) | | |
| 2011
vs. 2010 |
| |
| 2010
vs. 2009 |
|
| | | | | | | | | | | | | | | | | | | | | |
| | | | | | | | | | | | | | | | | | | | |
Freight revenue per carload | | | | | | | | | | | | | | | | | | | | |
Grain | | $ | 2,444 | | | $ | 2,430 | | | $ | 2,424 | | | | 1 | | | | – | |
Coal | | | 1,776 | | | | 1,440 | | | | 1,456 | | | | 23 | | | | (1 | ) |
Sulphur and fertilizers | | | 2,759 | | | | 2,684 | | | | 2,835 | | | | 3 | | | | (5 | ) |
Forest products | | | 2,625 | | | | 2,569 | | | | 2,627 | | | | 2 | | | | (2 | ) |
Industrial and consumer products | | | 2,416 | | | | 2,275 | | | | 2,272 | | | | 6 | | | | – | |
Automotive | | | 2,331 | | | | 2,307 | | | | 2,212 | | | | 1 | | | | 4 | |
Intermodal | | | 1,307 | | | | 1,260 | | | | 1,244 | | | | 4 | | | | 1 | |
| | | | | | | | | | | | | | | | | | | | | |
Total freight revenue per carload | | $ | 1,945 | | | $ | 1,824 | | | $ | 1,811 | | | | 7 | | | | 1 | |
| | | | | | | | | | | | | | | | | | | | | |
| | | | | | | | | | | | | | | | | | | | |
(1) Certain prior period figures have been reclassified to conform with current presentation.
Total freight revenue per carload in 2011 increased by 7% compared to 2010.
This increase was due to:
| ¨ | | higher fuel cost recovery revenues; |
| ¨ | | overall increased length of haul reflecting traffic mix changes; and |
| ¨ | | increased freight rates. |
This increase was partially offset by the unfavourable impact of the change in FX.
Total freight revenue per carload in 2010 increased by 1% compared to 2009. This increase was due to higher fuel surcharge revenues and increased freight rates. This increase was partially offset by the unfavourable impact of the change in FX.
Freight Revenue per Revenue Ton-Mile
| | | | | | | | | | | | | | | | | | | | |
| | | | | | | | | | | | % Change | |
For the year ended December 31 (cents) | | 2011 | | | 2010(1) | | | 2009(1) | | | 2011
vs. 2010 | | | 2010
vs. 2009 | |
| | | | | | | | | | | | | | | | | | | | | |
| | | | | | | | | | | | | | | | | | | | |
Freight Revenue per Revenue Ton-Mile | | | | | | | | | | | | | | | | | | | | |
Grain | | | 3.39 | | | | 3.28 | | | | 3.26 | | | | 3 | | | | 1 | |
Coal | | | 2.64 | | | | 2.58 | | | | 2.61 | | | | 2 | | | | (1 | ) |
Sulphur and fertilizers | | | 2.68 | | | | 2.69 | | | | 3.30 | | | | – | | | | (18 | ) |
Forest products | | | 3.81 | | | | 3.63 | | | | 3.94 | | | | 5 | | | | (8 | ) |
Industrial and consumer products | | | 4.22 | | | | 4.08 | | | | 4.45 | | | | 3 | | | | (8 | ) |
Automotive | | | 16.25 | | | | 15.29 | | | | 14.31 | | | | 6 | | | | 7 | |
Intermodal | | | 5.45 | | | | 5.21 | | | | 5.11 | | | | 5 | | | | 2 | |
| | | | | | | | | | | | | | | | | | | | | |
Total freight revenue per revenue ton-mile | | | 3.91 | | | | 3.84 | | | | 3.95 | | | | 2 | | | | (3 | ) |
| | | | | | | | | | | | | | | | | | | | | |
| | | | | | | | | | | | | | | | | | | | |
(1) Certain prior period figures have been reclassified to conform with current presentation.
Freight revenue per RTM is the amount of freight revenue earned for every RTM moved, calculated by dividing the freight revenue for a commodity by the number of RTMs of the commodity transported in the period. Freight revenue per RTM increased by 2% in 2011 compared to 2010. This increase was primarily due to increased fuel surcharge revenues and increased freight rates. This increase was partially offset by traffic mix changes including strong growth in the sulphur and fertilizers line of business, which generates lower revenue per RTM, and the unfavourable impact of the change in FX.
Freight revenue per RTM decreased by 3% in 2010 compared to 2009. This decrease was primarily due to the unfavourable impact of the change in FX and a significant increase in shipments of potash and metallurgical coal, which generate lower freight revenue per RTM. This decrease was partially offset by increased fuel surcharge revenues and increased freight rates.
9. OPERATING EXPENSES
| | | | | | | | | | | | | | | | | | | | |
For the year ended December 31 (in millions) | | 2011 | | | 2010 | | | 2009 | | | % Change | |
| | | | | 2011
vs. 2010 | | | 2010
vs. 2009 | |
| | | | | | | | | | | | | | | | | | | | | |
| | | | | | | | | | | | | | | | | | | | |
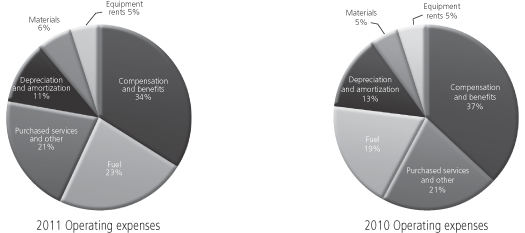
Operating expenses | | | | | | | | | | | | | | | | | | | | |
Compensation and benefits | | $ | 1,426 | | | $ | 1,431 | | | $ | 1,307 | | | | – | | | | 9 | |
Fuel | | | 968 | | | | 728 | | | | 580 | | | | 33 | | | | 26 | |
Materials | | | 243 | | | | 214 | | | | 217 | | | | 14 | | | | (1 | ) |
Equipment rents | | | 209 | | | | 206 | | | | 226 | | | | 1 | | | | (9 | ) |
Depreciation and amortization | | | 490 | | | | 489 | | | | 483 | | | | – | | | | 1 | |
Purchased services and other | | | 874 | | | | 797 | | | | 783 | | | | 10 | | | | 2 | |
| | | | | | | | | | | | | | | | | | | | | |
| | | 4,210 | | | | 3,865 | | | | 3,596 | | | | 9 | | | | 7 | |
Gain on sale of significant properties | | | – | | | | – | | | | (79 | ) | | | – | | | | – | |
Loss on termination of lease with shortline railway | | | – | | | | – | | | | 55 | | | | – | | | | – | |
| | | | | | | | | | | | | | | | | | | | | |
Total operating expenses | | $ | 4,210 | | | $ | 3,865 | | | $ | 3,572 | | | | 9 | | | | 8 | |
| | | | | | | | | | | | | | | | | | | | | |
| | | | | | | | | | | | | | | | | | | | |
Operating expenses were $4,210 million in 2011, an increase of $345 million, or 9%, from $3,865 million in 2010.
This was primarily due to higher:
| ¨ | | costs such as additional crew costs, wheel replacements and increased servicing of locomotives required to restore fluidity across our network due to significant disruptions to train operations across the network in the first half of the year due to unusually severe winter weather and subsequent flooding; |
| ¨ | | volume-related expenses; |
| ¨ | | IT costs associated with outsourced infrastructure and maintenance services and planning expenses with respect to new applications in support of future growth; |
| ¨ | | wage and benefits inflation; |
| ¨ | | crew training expenses due to increased hiring to meet business demand and attrition; and |
This increase was partially offset by lower incentive and stock-based compensation expense and the favourable impact of the change in FX.
2011 TO 2010 COMPARATIVES
Compensation and Benefits
Compensation and benefits expense includes employee wages, salaries and fringe benefits. Compensation and benefits expense was $1,426 million in 2011, a decrease of $5 million from $1,431 million in 2010. This decrease was primarily due to lower incentive and stock-based compensation and the favourable impact of the change in FX.
This decrease was partially offset by higher:
| ¨ | | crew costs driven by increased workload and less efficient operations due to significant disruptions to train operations across the network in the first half of the year due to unusually severe winter weather and subsequent flooding; |
| ¨ | | wage and benefits inflation; |
| ¨ | | crew training expenses as a result of increased hires to meet business demand and attrition; and |
Fuel
Fuel expense consists of fuel used by locomotives and includes provincial, state and federal fuel taxes and the impact of our hedging program. Fuel expense was $968 million in 2011, an increase of $240 million, or 33%, from $728 million in 2010. This increase was primarily due to higher fuel prices and increased consumption as a result of higher workload as measured by GTMs. This increase was partially offset by the favourable impact of the change in FX and hedging gains, discussed further in Section 17, Financial Instruments.
Materials
Materials expense includes the cost of material used for track, locomotive, freight car, and building maintenance. Materials expense was $243 million in 2011, an increase of $29 million or 14%, from $214 million in 2010.
This increase was primarily due to higher:
| ¨ | | number of wheels replaced for freight cars and higher servicing and repair costs for additional locomotives needed to assist in restoring fluidity across our entire network as a result of significant disruptions to train operations across the network in the first half of the year due to unusually severe winter weather and subsequent flooding; |
| ¨ | | non-locomotive fuel costs; and |
| ¨ | | workload as measured by GTMs, resulting in increased locomotive and freight car repair and servicing costs. |
This increase was partially offset by the favourable impact of the change in FX.
Equipment Rents
Equipment rents expense includes the cost to lease freight cars, intermodal equipment, and locomotives from other companies including railways, net of rent income received from other railways for the use of our equipment. Equipment rents expense was $209 million in 2011, an increase of $3 million or 1%, from $206 million in 2010. This increase was primarily due to higher workload as measured by GTMs, resulting in increased freight car and locomotive leasing costs including higher lease rates.
Depreciation and Amortization
Depreciation and amortization expense represents the charge associated with the use of track and roadway, buildings, rolling stock, information systems and other depreciable assets. Depreciation and amortization expense was $490 million in 2011, an increase of $1 million from $489 million in 2010. This increase was primarily due to higher depreciable assets. This increase was partially offset by the favourable impact of updated depreciation rates implemented in 2011 combined with the favourable impact of the change in FX.
Purchased Services and Other
| | | | | | | | | | | | | | | | | | | | |
For the year ended December 31 (in millions) | | 2011 | | | 2010(1) | | | 2009(1) | | | % Change | |
| | | | | 2011
vs. 2010 | | | 2010
vs. 2009 | |
| | | | | | | | | | | | | | | | | | | | | |
| | | | | | | | | | | | | | | | | | | | |
Purchased services and other | | | | | | | | | | | | | | | | | | | | |
Support and facilities | | $ | 382 | | | $ | 345 | | | $ | 319 | | | | 11 | | | | 8 | |
Track and operations | | | 191 | | | | 164 | | | | 142 | | | | 16 | | | | 15 | |
Intermodal | | | 147 | | | | 141 | | | | 136 | | �� | | 4 | | | | 4 | |
Equipment | | | 75 | | | | 83 | | | | 100 | | | | (10 | ) | | | (17 | ) |
Casualty | | | 80 | | | | 64 | | | | 98 | | | | 25 | | | | (35 | ) |
Other | | | 24 | | | | 28 | | | | 27 | | | | (14 | ) | | | 4 | |
| | | | | | | | | | | | | | | | | | | | | |
| | | 899 | | | | 825 | | | | 822 | | | | 9 | | | | – | |
Land sales | | | (25 | ) | | | (28 | ) | | | (39 | ) | | | (11 | ) | | | (28 | ) |
| | | | | | | | | | | | | | | | | | | | | |
Total purchased services and other | | $ | 874 | | | $ | 797 | | | $ | 783 | | | | 10 | | | | 2 | |
| | | | | | | | | | | | | | | | | | | | | |
| | | | | | | | | | | | | | | | | | | | |
(1)Certain prior period figures have been reclassified to conform with current presentation.
Purchased services and other expense encompasses a wide range of costs, including expenses for joint facilities, personal injuries and damage, environmental remediation, property and other taxes, contractor and consulting fees, insurance, gains on land sales and equity earnings. Purchased services and other expense was $874 million in 2011, an increase of $77 million, or 10%, from $797 million in 2010.
The increase was primarily due to higher:
| ¨ | | IT costs associated with outsourced infrastructure and maintenance services and planning expenses with respect to new applications in support of future growth; |
| ¨ | | Casualty expenses due to more costly mishaps and increased claims; |
| ¨ | | workload affecting Track and operations expenses; |
| ¨ | | locomotive overhaul costs performed by third parties affecting Equipment expenses; and |
| ¨ | | costs as a result of inefficient operations due to significant disruptions to train operations across the network in the first half of the year due to unusually severe winter weather and subsequent flooding. |
The increase was partially offset by the favourable impact of the change in FX and lower consulting costs.
2010 TO 2009 COMPARATIVES
Operating Expenses
Operating expenses were $3,865 million in 2010, an increase of $293 million, or 8%, from $3,572 million in 2009.
This increase was primarily due to the 2009 gain on sales of significant properties and increased volumes, resulting in higher labour costs and increased fuel consumption, and higher fuel prices.
This increase was partially offset by lower equipment rents due to reduced freight car and intermodal equipment leasing costs, the use of customer provided rail cars, the favourable impact of the change in FX and the 2009 loss on termination of a lease with a shortline railway.
Compensation and Benefits
Compensation and benefits expense was $1,431 million in 2010, an increase of $124 million, or 9%, from $1,307 million in 2009.
This increase was primarily due to:
| ¨ | | higher labour expenses driven by higher traffic volumes; |
| ¨ | | higher employee incentive compensation expenses driven by improved corporate performance; |
| ¨ | | wage and benefit inflation; |
| ¨ | | higher pension expense; and |
| ¨ | | restructuring charges in 2010 associated with the implementation of our structural cost initiatives. |
This increase was partially offset by the favourable impact of the change in FX.
Fuel
Fuel expense was $728 million in 2010, an increase of $148 million, or 26%, from $580 million in 2009. This increase was primarily due to higher fuel prices and increased consumption as a result of higher traffic volumes. This increase was partially offset by the favourable impact of the change in FX as well as improved efficiencies from ongoing fuel-conservation programs and the operation of longer trains.
Materials
Materials expense was $214 million in 2010, a decrease of $3 million, or 1%, from $217 million in 2009. This decrease was primarily due to the favourable impact of the change in FX and increased proceeds received from the scrapping of freight car material. This decrease was partially offset by higher locomotive material repair and servicing costs primarily due to the return from storage of locomotives to move higher volumes and improve fluidity.
Equipment Rents
Equipment rents expense was $206 million in 2010, a decrease of $20 million, or 9%, from $226 million in 2009. This decrease was primarily due to reduced freight car and intermodal equipment leasing costs resulting from the benefits of fleet reductions that occurred in 2009 and the favourable impact of the change in FX. This decrease was partially offset by higher car hire payments made to other railways as we made greater use of foreign freight cars on our lines to meet traffic demands and higher locomotive leasing costs due to higher volumes.
Depreciation and Amortization
Depreciation and amortization expense was $489 million in 2010, an increase of $6 million, or 1%, from $483 million in 2009. This increase was primarily due to more depreciable assets. This increase was partially offset by the favourable impact of the change in FX.
Purchased Services and Other
Purchased services and other expense was $797 million in 2010, an increase of $14 million, or 2%, from $783 million in 2009.
This increase was primarily due to:
| ¨ | | higher volume-related expenses; |
| ¨ | | higher IT project planning costs due to an increase in activity in preparation for 2011 projects; |
| ¨ | | lower gains on land sales which are recorded as reductions to operating expenses; |
| ¨ | | higher property and other taxes; |
| ¨ | | higher relocation costs related to CP’s structural cost initiatives; |
| ¨ | | increased consulting costs; and |
| ¨ | | increased maintenance costs performed by third parties. |
This increase was partially offset by the favourable impact of the change in FX and the absence of a 2009 charge to workers’ compensation benefit.
Operating expenses in 2009 included the following significant items:
Gain on Sales of Significant Properties
During 2009, the Company completed two significant real estate sales, resulting in gains of $79 million ($68 million after tax).
The Company sold Windsor Station in Montreal, for proceeds of $80 million, including the assumption of a mortgage of approximately $16 million due in 2011. CP will continue to occupy a portion of Windsor Station through a lease for a 10 year period after the sale. As a result, part of the transaction is considered to be a sale-leaseback and consequently a gain of $20 million related to this part of the transaction has been deferred and is being amortized over the remainder of the lease term. During 2011, the mortgage was received in full.
The Company sold land in western Canada for transit purposes for proceeds of $43 million.
Loss on Termination of Lease with Shortline Railway
During 2009, the Company made a payment of approximately $73 million to terminate a contract with a lessee in order to cease through-train operations over the CP owned rail branchline between Smiths Falls, Ontario and Sudbury, Ontario including a settlement of a $21 million existing liability. The contract with the lessee provided for the operation of a minimum number of CP freight trains over the leased branchline. The loss on the transaction recognized in the fourth quarter was $55 million ($38 million after tax).
10. OTHER INCOME STATEMENT ITEMS
Gain on Sale of Partnership Interest
During 2009, the Company completed the sale of a portion of its investment in the Detroit River Tunnel Partnership to its existing partner, reducing the Company’s ownership from 50% to 16.5%. The proceeds received from the transaction were approximately $110 million. Additional proceeds of approximately $22 million are contingent on achieving certain future freight volumes through the tunnel, and have not been recognized. The gain on this transaction was $81 million ($69 million after tax).
Other Income and Charges
Other income and charges consists of gains and losses from the change in foreign exchange on long-term debt (“FX on LTD”) and working capital, various costs related to financing, gains and losses associated with changes in the fair value of non-hedging derivative instruments and other non-operating expenditures. Other income and charges was an expense of $18 million in 2011, compared to income of $12 million in 2010.
This expense was primarily comprised of:
| ¨ | | a net loss due to the early redemption of our 5.75% Notes due in May 2013, discussed further in Section 14, Liquidity and Capital Resources; |
| ¨ | | advisory fees related to shareholder matters; and |
| ¨ | | FX losses on working capital and long-term debt. |
This expense was partially offset by a gain on sale of long-term floating rate notes.
Other income and charges was income of $12 million in 2010, compared to an expense of $12 million in 2009. This income was primarily due to the Company recognizing gains from FX on LTD and FX gains on the Company’s working capital position due to the weakening of the U.S. dollar.
Net Interest Expense
Net interest expense includes interest on long-term debt and capital leases, net of interest income of $3 million compared to $11 million in 2010. Net interest expense was $252 million in 2011, a decrease of $5 million, or 2%, from $257 million in 2010.
This decrease was primarily due to the retirement of debt securities, discussed further in Section 14, Liquidity and Capital Resources, and the favourable impact of the change in FX on U.S. dollar-denominated interest expense.
This decrease was partially offset by:
| ¨ | | interest on new debt issuances, discussed further in Section 14, Liquidity and Capital Resources; |
| ¨ | | lower interest capitalized on capital projects in 2011; and |
| ¨ | | lower interest income resulting from the collection of an interest bearing receivable during the second quarter of 2010. |
Net interest expense was $257 million in 2010, a decrease of $11 million, or 4%, from $268 million in 2009.
This decrease was primarily due to:
| ¨ | | the favourable impact of the change in FX on U.S. dollar-denominated interest expense; |
| ¨ | | the repayment of debt during the second quarter of 2010, discussed further in Section 14, Liquidity and Capital Resources; and |
| ¨ | | the repurchase of debt securities during the second quarter of 2009. |
This decrease was partially offset by interest on new debt issuances and lower interest income resulting from the collection of an interest bearing receivable during the second quarter of 2010.
Income Taxes
Income tax expense was $127 million in 2011, a decrease of $93 million, from $220 million in 2010. This decrease was primarily due to lower net earnings and the resolution of certain income tax matters related to previous year tax filings and estimates.
Income tax expense was $220 million in 2010, an increase of $139 million, from $81 million in 2009. This increase was primarily due to higher earnings.
The effective income tax rate for 2011 was 18%, compared with 25% and 13% for 2010 and 2009, respectively. The changes in the effective tax rates were primarily due to lower net earnings, lower Canadian federal and provincial corporate income tax rates, tax planning initiatives, completion of tax audits and a weak business environment in 2009.
We expect a 2012 effective income tax rate of between 25% and 27%. The 2012 outlook on our effective income tax rate is based on certain assumptions about events and developments that may or may not materialize or that may be offset entirely or partially by other events and developments, discussed further in Section 21, Business Risks and Section 22, Critical Accounting Estimates. We expect to have an increase in our cash tax payments in future years.
11. QUARTERLY FINANCIAL DATA
| | | | | | | | | | | | | | | | | | | | | | | | | | | | | | | | | | |
| For the quarter ended | | 2011 | | | | | 2010 | |
| (in millions, except per share data) | | Dec. 31 | | | Sept. 30 | | | Jun. 30 | | | Mar. 31 | | | | | Dec. 31 | | | Sept. 30 | | | Jun. 30 | | | Mar. 31 | |
| | | | | | | | | | | | | | | | | | | | | | | | | | | | | | | | | | | |
Total revenue | | $ | 1,408 | | | $ | 1,341 | | | $ | 1,265 | | | $ | 1,163 | | | | | $ | 1,294 | | | $ | 1,286 | | | $ | 1,234 | | | $ | 1,167 | |
Operating income | | | 303 | | | | 324 | | | | 231 | | | | 109 | | | | | | 298 | | | | 337 | | | | 274 | | | | 207 | |
Net income | | | 221 | | | | 187 | | | | 128 | | | | 34 | | | | | | 186 | | | | 197 | | | | 167 | | | | 101 | |
| | | | | | | | | | | | | | | | | | | | | | | | | | | | | | | | | | | |
Basic earnings per share | | $ | 1.31 | | | $ | 1.10 | | | $ | 0.76 | | | $ | 0.20 | | | | | $ | 1.10 | | | $ | 1.17 | | | $ | 0.99 | | | $ | 0.60 | |
Diluted earnings per share | | | 1.30 | | | | 1.10 | | | | 0.75 | | | | 0.20 | | | | | | 1.09 | | | | 1.17 | | | | 0.98 | | | | 0.60 | |
| | | | | | | | | | | | | | | | | | | | | | | | | | | | | | | | | | | |
Quarterly Trends
Volumes of and, therefore, revenues from certain goods are stronger during different periods of the year. First-quarter revenues can be lower mainly due to winter weather conditions, closure of the Great Lakes ports and reduced transportation of retail goods. Second- and third-quarter revenues generally improve over the first quarter as fertilizer volumes are typically highest during the second quarter and demand for construction-related goods is generally highest in the third quarter. Revenues are typically strongest in the fourth quarter, primarily as a result of the transportation of grain after the harvest, fall fertilizer programs and increased demand for retail goods moved by rail. Operating income is also affected by seasonal fluctuations. Operating income is typically lowest in the first quarter due to higher operating costs associated with winter conditions. Net income is also influenced by seasonal fluctuations in customer demand and weather-related issues.
12. FOURTH-QUARTER SUMMARY
| | | | | | | | | | | | |
For the three months ended December 31 (in millions) | | 2011 | | | 2010 | | | % Change | |
Revenues | | | | | | | | | | | | |
Grain | | $ | 323 | | | $ | 299 | | | | 8 | |
Coal | | | 158 | | | | 126 | | | | 25 | |
Sulphur and fertilizers | | | 133 | | | | 132 | | | | 1 | |
Forest products | | | 47 | | | | 50 | | | | (6 | ) |
Industrial and consumer products | | | 288 | | | | 240 | | | | 20 | |
Automotive | | | 94 | | | | 75 | | | | 25 | |
Intermodal | | | 332 | | | | 340 | | | | (2 | ) |
| | | | | | | | | | | | | |
Total freight revenues | | | 1,375 | | | | 1,262 | | | | 9 | |
Other revenue | | | 33 | | | | 32 | | | | 3 | |
| | | | | | | | | | | | | |
Total revenues | | | 1,408 | | | | 1,294 | | | | 9 | |
Operating expenses | | | | | | | | | | | | |
Compensation and benefits | | | 389 | | | | 362 | | | | 7 | |
Fuel | | | 267 | | | | 202 | | | | 32 | |
Materials | | | 58 | | | | 56 | | | | 4 | |
Equipment rents | | | 51 | | | | 48 | | | | 6 | |
Depreciation and amortization | | | 123 | | | | 121 | | | | 2 | |
Purchased services and other | | | 217 | | | | 207 | | | | 5 | |
| | | | | | | | | | | | | |
Total operating expenses | | �� | 1,105 | | | | 996 | | | | 11 | |
Operating income | | $ | 303 | | | $ | 298 | | | | 2 | |
Operating Results
Operating income was $303 million in the fourth quarter of 2011, an increase of $5 million, or 2%, from $298 million in the same period of 2010.
This increase was primarily due to:
| ¨ | | a favourable change in traffic mix and pricing; |
| ¨ | | lower incentive compensation expenses; and |
| ¨ | | benefits of efficiency improvements. |
This increase was partially offset by:
| ¨ | | higher stock-based compensation expenses resulting from the significant increase in our share price during the quarter; |
| ¨ | | higher crew training expenses as a result of increased hires to meet business demand and attrition; |
| ¨ | | the net unfavourable impact of higher fuel costs; and |
| ¨ | | higher locomotive servicing expenses. |
Net income was $221 million in the fourth quarter of 2011, an increase of $35 million, or 19%, from $186 million in the same period of 2010. This increase was primarily due to a lower effective income tax rate, driven by the resolution of certain income tax matters, discussed further in Section 10, Other Income Statement Items. This increase was partially offset by advisory fees related to shareholder matters reflected in Other Income and Charges.
Diluted Earnings per Share
Diluted EPS was $1.30 in the fourth quarter of 2011, an increase of $0.21, or 19%, from $1.09 in the same period of 2010. This increase was primarily due to higher net income.
Operating Ratio
Our operating ratio was 78.5% in the fourth quarter of 2011, compared with 77.0% in the same period of 2010. This increase was primarily due to increased crew training costs and higher fuel costs.
PERFORMANCE INDICATORS
| | | | | | | | | | | | |
| For the three months ended December 31 | | 2011 | | | 2010(1) | | | % Change | |
| | | | | | | | | | | | | |
Operations performance | | | | | | | | | | | | |
Freight gross ton-miles (millions) | | | 65,472 | | | | 62,498 | | | | 5 | |
Train miles (thousands) | | | 10,611 | | | | 10,132 | | | | 5 | |
Average number of active employees – expense | | | 14,459 | | | | 13,918 | | | | 4 | |
Average daily active cars on-line (thousands) | | | 46.7 | | | | 54.1 | | | | (14 | ) |
Average daily active road locomotives on-line | | | 1,085 | | | | 1,048 | | | | 4 | |
Average train speed – AAR definition (mph) | | | 23.4 | | | | 21.7 | | | | 8 | |
Average terminal dwell – AAR definition (hours) | | | 17.7 | | | | 22.2 | | | | (20 | ) |
Car miles per car day | | | 183.5 | | | | 152.7 | | | | 20 | |
Fuel efficiency(2) | | | 1.17 | | | | 1.20 | | | | (3 | ) |
Average train weight – excluding local traffic (tons) | | | 6,587 | | | | 6,559 | | | | – | |
Average train length – excluding local traffic (feet) | | | 5,654 | | | | 5,652 | | | | – | |
Locomotive productivity (daily average GTMs/active HP) | | | 175.1 | | | | 175.2 | | | | – | |
Employee productivity (million GTMs/expense employee) | | | 4.5 | | | | 4.5 | | | | – | |
Safety indicators | | | | | | | | | | | | |
FRA personal injuries per 200,000 employee-hours | | | 1.75 | | | | 1.80 | | | | (3 | ) |
FRA train accidents per million train-miles | | | 1.38 | | | | 1.27 | | | | 9 | |
| | | | | | | | | | | | | |
(1) Certain prior period figures have been reclassified to conform with current presentation or have been updated to reflect new information.
(2) Fuel efficiency is defined as U.S. gallons of locomotive fuel consumed per 1,000 GTMs – freight and yard.
Operations Performance
GTMs for the fourth quarter of 2011 were 65,472 million, which increased by 5% compared with 62,498 million in the same period of 2010. This increase was primarily due to higher volumes and more fluid operations.
Train miles for the fourth quarter of 2011 increased by 5% compared with the same period of 2010. This increase was primarily due to higher volumes and more fluid operations.
The average number of active expense employees for the fourth quarter of 2011 increased by 541, or 4%, compared with the same period of 2010. This increase was primarily due to additional hiring to address volume growth projections and attrition.
The average daily active cars on-line for the fourth quarter of 2011 decreased by approximately 7,400 cars, or 14% compared with the same period of 2010. This decrease was primarily due to improved network fluidity, our continued focus on the execution of our First Mile-Last Mile program and a focus on the storage of surplus cars.
The average daily active road locomotives on-line for 2011 increased by 37 units, or 4%, compared with 2010. This increase was primarily due to higher traffic volumes.
Average train speed was 23.4 miles per hour in the fourth quarter of 2011, an improvement of 8%, from 21.7 miles per hour in the same period of 2010. This improvement was primarily due to our capacity investments and our rigorous approach to executing the IOP.
Average terminal dwell, the average time a freight car resides in a terminal, improved by 20% in the fourth quarter of 2011 to 17.7 hours from 22.2 hours in the same period of 2010. This improvement was primarily due to various programs supporting the execution of the IOP to improve asset velocity and continued focus on the storage of surplus cars. This was a record for CP.
Car miles per car day were 183.5 in the fourth quarter of 2011, an improvement of 20% from 152.7 in the same period of 2010. This improvement was primarily due to various initiatives in the design and execution of the IOP to improve asset velocity and continued focus on the storage of surplus cars. This was a record for CP.
Fuel efficiency improved by 3% in the fourth quarter of 2011 compared to the same period of 2010. This improvement was primarily due to improved network fluidity and the new fuel savings technology introduced on over 260 locomotives and continued focus on fuel conservation programs including idle reduction and train handling practices. This tied a previous fourth quarter CP record.
Average train weight increased in the fourth quarter of 2011 by 28 tons from the same period of 2010. This was relatively flat quarter over quarter.
Average train length increased in the fourth quarter of 2011 by 2 feet from the same period of 2010. This was relatively flat quarter over quarter.
Locomotive productivity, as measured by daily average GTMs per active horse power, was relatively flat in the fourth quarter of 2011 compared to the same period of 2010.
Employee productivity, as measured by million GTMs/expense employee, was relatively flat in the fourth quarter of 2011 compared to the same period of 2010.
Safety Indicators
The FRA personal injury rate per 200,000 employee-hours for CP was 1.75 in the fourth quarter of 2011, compared to 1.80 in the same period of 2010.
The FRA train accident rate for CP in the fourth quarter of 2011 was 1.38 accidents per million train-miles, compared with 1.27 in the same period of 2010.
Freight Revenues
Freight revenues were $1,375 million in the fourth quarter of 2011, an increase of $113 million, or 9%, from $1,262 million in the same period of 2010.
This increase was primarily due to higher:
| ¨ | | volumes in industrial and consumer products, coal and grain; |
| ¨ | | fuel surcharge revenues resulting from the change in fuel price; and |
This increase was partially offset by lower shipments in intermodal and forest products.
Grain
Grain revenue was $323 million in the fourth quarter of 2011, an increase of $24 million, or 8%, from $299 million in the same period of 2010.
This increase was primarily due to higher:
| ¨ | | volumes of Canadian grain shipments resulting from the introduction of our scheduled grain program and strong export market demand; |
| ¨ | | fuel surcharge revenues due to the change in fuel price; and |
This increase was partially offset by lower U.S. originated shipments driven by lower wheat production and reduced export demand for feed grains.
Coal
Coal revenue was $158 million in the fourth quarter of 2011, an increase of $32 million, or 25%, from $126 million in the same period of 2010.
This increase was primarily due to:
| ¨ | | an increase in long-haul metallurgical coal shipments; |
| ¨ | | higher fuel surcharge revenues due to the change in fuel price; and |
| ¨ | | increased freight rates. |
This increase was partially offset by lower U.S. originated shipments as certain short haul U.S. thermal coal contracts were not renewed.
Sulphur and Fertilizers
Sulphur and fertilizers revenue was $133 million in the fourth quarter of 2011, an increase of $1 million, or 1%, from $132 million in the same period of 2010.
The increase was primarily due to higher:
| ¨ | | sulphur and fertilizer shipments due to increased overall demand; |
| ¨ | | fuel surcharge revenues due to the change in fuel price; and |
This increase was partially offset by lower export potash volumes reflecting high inventory and global pricing uncertainty, and lower domestic potash shipments due to high North American inventories pending spring application flow through.
Forest Products
Forest products revenue was $47 million in the fourth quarter of 2011, a decrease of $3 million, or 6%, from $50 million in the same period of 2010. This decrease was primarily due to lower lumber and panel volumes as a result of soft market demand and lower shipments of pulp and paper products due to reduced production driven by a mill outage on our line. This decrease was partially offset by higher fuel surcharge revenues due to the change in fuel price and increased freight rates.
Industrial and Consumer Products
Industrial and consumer products revenue was $288 million in the fourth quarter of 2011, an increase of $48 million, or 20%, from $240 million in the same period of 2010.
This increase was primarily due to higher:
| ¨ | | overall industrial products volumes due to strong market demand and growth in the Bakken Oil Formation, the Alberta Industrial Heartland and the Marcellus Gas Formation and for energy related inputs; |
| ¨ | | fuel surcharge revenues due to the change in fuel price; and |
Automotive
Automotive revenue was $94 million in the fourth quarter of 2011, an increase of $19 million, or 25%, from $75 million in the same period of 2010.
This increase was primarily due to higher:
| ¨ | | volumes as a result of higher North American auto sales and higher overall auto production; |
| ¨ | | fuel surcharge revenues due to the change in fuel price; and |
Intermodal
Intermodal revenue was $332 million in the fourth quarter of 2011, a decrease of $8 million, or 2%, from $340 million in the same period of 2010. This decrease was primarily due to lower volumes through the Port Metro Vancouver as a result of decreased demand for imported goods from Asia.
This decrease was partially offset by higher:
| ¨ | | domestic container shipments due to increased cross border sales; |
| ¨ | | fuel cost recovery revenues due to the increase in fuel price; and |
Other Revenue
Other revenue was $33 million in the fourth quarter of 2011, an increase of $1 million or 3%, from $32 million in the same period of 2010. This increase was primarily due to higher leasing, switching and passenger revenues.
Operating Expenses
Operating expenses were $1,105 million in the fourth quarter of 2011, an increase of $109 million, or 11%, from $996 million in the same period of 2010.
This increase was primarily due to:
| ¨ | | increased traffic volumes; |
| ¨ | | increased stock-based compensation expenses resulting from the significant increase in our share price during the quarter; |
| ¨ | | higher crew training costs as a result of increased hiring to meet business demand and attrition; and |
| ¨ | | wages and benefits inflation. |
This increase was partially offset by lower incentive compensation expenses.
Compensation and Benefits
Compensation and benefits expense was $389 million in the fourth quarter of 2011, an increase of $27 million, or 7%, from $362 million in the same period of 2010.
This increase was primarily due to:
| ¨ | | increased stock-based compensation expenses resulting from the significant increase in our share price during the quarter; |
| ¨ | | higher crew training expenses as a result of increased hires to meet business demand and attrition; |
| ¨ | | wages and benefits inflation; and |
| ¨ | | higher crew costs driven by increased workload. |
This increase was partially offset by lower incentive compensation expenses which reflect corporate performance.
Fuel
Fuel expense was $267 million in the fourth quarter of 2011, an increase of $65 million, or 32%, from $202 million in the same period of 2010. This increase was primarily due to higher fuel prices and increased consumption as a result of higher traffic volumes. This increase was partially offset by improved efficiencies.
Materials
Materials expense was $58 million in the fourth quarter of 2011, an increase of $2 million, or 4%, from $56 million in the same period of 2010. This increase was primarily due to higher non-locomotive fuel costs and increased volumes.
Equipment Rents
Equipment rents expense was $51 million in the fourth quarter of 2011, an increase of $3 million, or 6%, from $48 million in the same period of 2010. This increase was primarily due to higher lease rates and higher volumes. This increase was partially offset by reduced payments to foreign railways for the use of their freight cars on our lines.
Depreciation and Amortization
Depreciation and amortization expense was $123 million in the fourth quarter of 2011, an increase of $2 million, or 2%, from $121 million in the same period of 2010. This increase was primarily due to higher depreciable assets and the implementation of updated depreciation studies.
Purchased Services and Other
| | | | | | | | | | | | |
For the three months ended December 31 (in millions) | | 2011 | | | 2010(1) | | | % Change | |
| | | | | | | | | | | | | |
Purchased services and other | | | | | | | | | | | | |
Support and facilities | | $ | 102 | | | $ | 91 | | | | 12 | |
Track and operations | | | 50 | | | | 51 | | | | (2 | ) |
Intermodal | | | 39 | | | | 38 | | | | 3 | |
Equipment | | | 23 | | | | 25 | | | | (8 | ) |
Casualty | | | 18 | | | | 15 | | | | 20 | |
Other | | | 5 | | | | 9 | | | | (44 | ) |
| | | | | | | | | | | | | |
| | | 237 | | | | 229 | | | | 3 | |
Land sales | | | (20 | ) | | | (22 | ) | | | (9 | ) |
| | | | | | | | | | | | | |
Total purchased services and other | | $ | 217 | | | $ | 207 | | | | 5 | |
| | | | | | | | | | | | | |
(1) Certain prior period figures have been reclassified to conform with current presentation.
Purchased services and other expense was $217 million in the fourth quarter of 2011, an increase of $10 million, or 5%, from $207 million in the same period of 2010.
This increase was primarily due to higher:
| ¨ | | traffic volumes, affecting Track and operations expenses; |
| ¨ | | IT costs associated with outsourced infrastructure and maintenance services and planning expenses with respect to new applications in support of future growth; |
| ¨ | | locomotive overhaul costs, affecting Equipment expenses; and |
This increase was partially offset by lower relocation costs which were part of CP’s structural cost initiatives in 2010, affecting Track and operations expense, and reduced Equipment expenses due to the impact of the locomotive shop consolidation strategy which allowed for increased in-house servicing of locomotives.
Other Income Statement Items
Other Income and Charges
Other income and charges was an expense of $10 million in the fourth quarter of 2011, compared with income of $5 million in the same period of 2010.
The expense was primarily due to:
| ¨ | | advisory fees related to shareholder matters; |
| ¨ | | costs associated with the renewal of financing arrangements; and |
| ¨ | | a net loss of $1 million recognized with the tender of our 6.25% Notes due October 15, 2011, discussed further in Section 14, Liquidity and Capital Resources. |
This was partially offset by FX gains primarily on U.S. dollar denominated working capital.
Net Interest Expense
Net interest expense was $61 million in the fourth quarter of 2011, a decrease of $4 million, or 6%, from $65 million in the same period of 2010. This decrease was primarily due to the retirement of debt during 2011 offset in part by interest on new debt issuances during the fourth quarter of 2011, discussed further in Section 14, Liquidity and Capital Resources.
Income Taxes
Income tax expense was $11 million in the fourth quarter of 2011, a decrease of $41 million, or 79%, from $52 million in the same period of 2010. This decrease was primarily due to the resolution of certain income tax matters related to previous year tax filings and estimates.
The effective income tax rate for fourth-quarter 2011 was 5% compared with an effective tax rate of 22% in the same period of 2010. This change in tax rates is primarily due to a reduction in the Company’s uncertain tax positions due to the completion of tax audits.
Liquidity and Capital Resources
During the fourth quarter of 2011, the Company used cash and cash equivalents of $50 million, compared with $93 million generated in the same period of 2010.
This decrease in cash and cash equivalents was primarily due to:
| ¨ | | higher pension contributions in 2011 which included a $600 million voluntary prepayment to the Company’s main Canadian defined benefit pension plan, discussed further in Section 22, Critical Accounting Estimates; |
| ¨ | | the redemption of US$246 million 6.25% 10-year Notes in 2011 for a total cost of $251 million; and |
| ¨ | | higher additions to properties in 2011. |
This decrease in cash and cash equivalents was partially offset by:
| ¨ | | the issuance of $125 million 5.10% 10-year Notes, US$250 million 4.50% 10-year Notes and US$250 million 5.75% 30-year Notes for net proceeds of $618 million; |
| ¨ | | the issuance of US$139 million 3.88% Series A and B Senior Secured Notes due in 2026 for net proceeds of $139 million; and |
| ¨ | | an increase in short-term borrowings. |
13. CHANGES IN ACCOUNTING POLICY
2011 Accounting Change
Fair Value Measurement and Disclosure
In January 2010, the Financial Accounting Standards Board (“FASB”) amended the disclosure requirements related to fair value measurements. Most of the new disclosures and clarifications of existing disclosures were effective for interim and annual reporting periods beginning after December 15, 2009, except for the expanded disclosures in the Level 3 reconciliation, which are effective for fiscal years beginning after December 15, 2010. The Company has adopted the remaining guidance which did not impact the consolidated financial statements.
New Accounting Pronouncements Issued and Not Yet Adopted
Fair Value Measurement
In May 2011, the FASB issued amended guidance on fair value measurement which updates some of the measurement guidance and includes enhanced disclosure requirements. The amended guidance is effective for interim and annual periods beginning after December 15, 2011. Adoption is not expected to have a material impact on the results of operations or financial position but increased quantitative and qualitative disclosure regarding Level 3 measurements is expected.
Other Comprehensive Income
In June 2011, the FASB issued an accounting standard update on the Presentation of Comprehensive Income, which eliminates the current option to report other comprehensive income and its components in the Consolidated Statement of Changes in Shareholders’ Equity. The Company can elect to present items of net income and other comprehensive income in one continuous statement or in two separate, but consecutive, statements. The Company intends to present two separate but consecutive statements. In December 2011, the FASB deferred the guidance related to the presentation of reclassification adjustments. As the new guidance does not change those components that are recognized in net income or those components that are recognized in other comprehensive income, adoption is not expected to have a material impact on the results of operations and financial position. The guidance must be applied retrospectively for all periods presented in the financial statements and becomes effective for interim and annual periods beginning after December 15, 2011.
Intangibles – Goodwill and Other
In September 2011, the FASB issued amended guidance on the testing of goodwill for impairment. The amendments allow an entity to first assess qualitative factors to determine whether it is necessary to perform the two-step quantitative goodwill impairment test. Under these amendments, an entity would not be required to calculate the fair value of a reporting unit unless the entity determines, based on a qualitative assessment, that it is more likely than not that its fair value is less than its carrying amount. The amended guidance is effective for annual and interim goodwill impairment tests performed for fiscal years beginning after December 15, 2011. Adoption is expected to impact the goodwill impairment testing process but not the results of operations or financial position of the Company.
14. LIQUIDITY AND CAPITAL RESOURCES
We believe adequate amounts of cash and cash equivalents are available in the normal course of business to provide for ongoing operations, including the obligations identified in the tables in Section 19, Contractual Commitments and Section 20, Future Trends and Commitments. We are not aware of any trends or expected fluctuations in our liquidity that would create any deficiencies. Liquidity risk is discussed further in Section 21, Business Risks. The following discussion of operating, investing and financing activities describes our indicators of liquidity and capital resources.
Operating Activities
Cash provided by operating activities was $512 million in 2011, an increase of $10 million from cash provided by operating activities of $502 million in 2010.
This increase was primarily due to:
| ¨ | | lower pension contributions in 2011, which included $600 million of solvency deficit contributions all of which were represented by a voluntary prepayment to the Company’s main Canadian defined benefit pension plan. In 2010, solvency deficit contributions were $750 million, of which $650 million was a voluntary prepayment to the Company’s main Canadian defined benefit pension plan. In addition, the Company made scheduled contributions of approximately $100 million towards the main Canadian defined benefit pension plan’s deficit. The Company did not make a similar payment in 2011, discussed further in Section 22, Critical Accounting Estimates; and |
| ¨ | | the favourable impact of the change in working capital balances in 2011 stemming from higher trade payables. |
This increase was largely offset by lower earnings in 2011.
Cash provided by operating activities was $502 million in 2010, an increase of $51 million from cash provided by operating activities of $451 million in 2009. This increase was primarily due to higher earnings and a lower cash cost related to the partial unwind of the Company’s Total Return Swap (“TRS”) in 2009.
This increase was partially offset by:
| ¨ | | higher pension contributions. In 2010, solvency deficit contributions were $750 million, of which $650 million was a voluntary prepayment to the Company’s main Canadian defined benefit pension plan and the Company made scheduled contributions of approximately $100 million towards the main Canadian defined benefit pension plan’s deficit. In 2009, the Company made solvency deficit contributions of $500 million, all of which were voluntary prepayments to the Company’s main Canadian defined benefit pension plan; |
| ¨ | | the unfavourable impact of the change in working capital balances in 2010; and |
| ¨ | | cash tax payments in 2010 compared to tax recoveries in 2009. |
Investing Activities
Cash used in investing activities was $1,044 million in 2011, an increase of $409 million from cash used in investing activities of $635 million in 2010. This increase was primarily due to higher additions to properties associated with our accelerated capital program.
Cash used in investing activities was $635 million in 2010, an increase of $276 million from cash used in investing activities of $359 million in 2009. This increase was primarily due to the 2009 proceeds from the sale of significant properties and other assets and the sale of a partnership interest in 2009.
Additions to properties (“capital programs”) in 2012 are expected to be in the range of $1.1 billion to $1.2 billion. Planned capital programs include approximately $800 million to preserve existing capacities through replacement or renewal of depleted assets, $275 million for strategic network enhancements and $50 million to address capital regulated by governments, principally positive train control.
Capital Programs
| | | | | | | | | | | | |
For the year ended December 31 (in millions, except for miles and crossties) | | 2011 | | | 2010 | | | 2009 | |
| | | | | | | | | | | | | |
Additions to properties | | | | | | | | | | | | |
Track and roadway | | $ | 756 | | | $ | 589 | | | $ | 510 | |
Buildings | | | 47 | | | | 19 | | | | 12 | |
Rolling stock | | | 179 | | | | 26 | | | | 80 | |
Information systems | | | 99 | | | | 54 | | | | 41 | |
Other | | | 72 | | | | 55 | | | | 60 | |
| | | | | | | | | | | | | |
Total – accrued additions to properties | | | 1,153 | | | | 743 | | | | 703 | |
Less: | | | | | | | | | | | | |
Assets acquired through capital leases | | | – | | | | 1 | | | | 1 | |
Other non-cash transactions | | | 49 | | | | 16 | | | | (1 | ) |
| | | | | | | | | | | | | |
Cash invested in additions to properties (as per Consolidated Statements of Cash Flows) | | $ | 1,104 | | | $ | 726 | | | $ | 703 | |
| | | | | | | | | | | | | |
Track installation capital programs | | | | | | | | | | | | |
Track miles of rail laid (miles) | | | 532 | | | | 416 | | | | 395 | |
Track miles of rail capacity expansion (miles) | | | 31 | | | | 3 | | | | 1 | |
Crossties installed (thousands) | | | 885 | | | | 872 | | | | 870 | |
| | | | | | | | | | | | | |
Of the total capital additions to properties noted in the table above, costs of approximately $680 million for 2011 (2010 – $588 million; 2009 – $606 million) were for the renewal of the railway, including track and roadway, buildings and rolling stock. Costs of approximately $836 million during the year ended December 31, 2011 (2010 – $790 million; 2009 – $782 million) related to normal repairs and maintenance of the railway and have been expensed and presented within operating expenses for the year. Repairs and maintenance does not have a standardized definition and, therefore, is unlikely to be comparable to similar measures of other companies and definitions applied by regulators.
We intend to finance capital expenditures with available cash from operations, but may partially finance these expenditures with new debt, capital leases and temporary draws on our credit facility. Our decisions on funding equipment acquisitions will be influenced by such factors as optimizing our capital structure and maintaining our debt covenants and investment grade rating, as well as the amount of cash flow we believe can be generated from operations and the prevailing capital market conditions.
Financing Activities
Cash provided by financing activities was $217 million in 2011, as compared to cash used in financing activities of $168 million in 2010 and cash provided by financing activities of $490 million in 2009.
Cash provided by financing activities in 2011 was primarily from:
| ¨ | | the issuance of $125 million 5.10% 10-year Notes, US$250 million 4.50% 10-year Notes and US$250 million 5.75% 30-year Notes for net proceeds of $618 million. These proceeds were largely used to make a $600 million voluntary prepayment to the Company’s main Canadian defined benefit pension plan, discussed further in Section 22, Critical Accounting Estimates; |
| ¨ | | the issuance of US$139 million 3.88% Series A and B Senior Secured Notes due in 2026 for net proceeds of $139 million; and |
| ¨ | | $28 million in short-term borrowings. |
These proceeds were partially offset by:
| ¨ | | the redemption of US$246 million 6.25% 10-year Notes for a total cost of $251 million; |
| ¨ | | the redemption of US$101 million 5.75% 5-year Notes pursuant to a call offer for a total cost of $113 million, which included a redemption premium paid to note holders to redeem the Notes; and |
| ¨ | | the payments of dividends. |
Cash used in financing activities in 2010 was mainly for the redemption of $350 million 4.9% seven-year Medium Term Notes; $226 million bank loan, including $72 million in interest; which was offset in part by the collection of a related $220 million receivable, including $70 million in interest, from a financial institution; and the payment of dividends. These uses of cash were also partly offset by the issuance of US$350 million 4.45% 12.5-year Notes for net proceeds of $355 million.
Cash provided by financing activities in 2009 was mainly due to the issuance of:
| ¨ | | common shares under a final prospectus offering for net cash proceeds of approximately $489 million; |
| ¨ | | US$350 million 7.25% 10-year Notes for net proceeds of approximately $409 million; |
| ¨ | | $400 million 6.45% 30-year Notes for net proceeds of $398 million; and |
| ¨ | | US$65 million 5.57% Senior Secured Notes for net proceeds of $67 million. |
These proceeds were partially offset by the tendering of debt for a total cost of $572 million and the repayment of short-term borrowings and the payments of dividends.
The Company has available, as sources of financing, unused credit facilities of up to $691 million.
Debt to Total Capitalization
Debt to total capitalization is the sum of long-term debt, long-term debt maturing within one year and short-term borrowing, divided by debt plus total shareholders’ equity as presented on our Consolidated Balance Sheets. At December 31, 2011, our debt to total capitalization increased to 50.7%, compared with 47.2% at December 31, 2010.
This increase was primarily due to the issuance of long-term debt and an increase in the accumulated loss of the pension plan which decreased equity. This increase was partially offset by the redemption of long-term debt and an increase in equity driven by earnings.
At December 31, 2010, our debt to total capitalization decreased to 47.2%, compared with 50.5% at December 31, 2009. This decrease was primarily due to:
| ¨ | | redemption of long-term debt; |
| ¨ | | an increase in equity driven by earnings; and |
| ¨ | | the impact of the stronger Canadian dollar on U.S. dollar-denominated debt at December 31, 2010, compared with December 31, 2009. |
This decrease was partially offset by the issuance of long-term debt and an increase in the accumulated loss of the pension plan which decreased equity.
Interest Coverage Ratio
Interest coverage ratio is measured, on a rolling twelve month basis, as earnings before interest and taxes (“EBIT”) divided by net interest expense. The interest coverage ratio and EBIT are non-GAAP measures, discussed further in Section 15, Non-GAAP Measures. At December 31, 2011, our
interest coverage ratio was 3.8, compared with 4.4 at December 31, 2010. This decrease was primarily due to a year-over-year reduction in EBIT. At December 31, 2010, our interest coverage ratio was 4.4, compared with 3.4 at December 31, 2009. This increase was primarily due to a year-over-year improvement in EBIT.
Calculation of Free Cash(1)
| | | | | | | | | | | | |
| (Reconciliation of free cash to GAAP cash position) | | | | | | | | | |
| For the year ended December 31 (in millions) | | 2011 | | | 2010 | | | 2009 | |
| | | | | | | | | | | | | |
Voluntary prepayments to the main Canadian defined benefit pension plan | | $ | (600 | ) | | $ | (650 | ) | | $ | (500 | ) |
Other operating cash flows | | | 1,112 | | | | 1,152 | | | | 951 | |
| | | | | | | | | | | | | |
Cash provided by operating activities | | | 512 | | | | 502 | | | | 451 | |
Cash used in investing activities | | | (1,044 | ) | | | (635 | ) | | | (359 | ) |
Dividends paid | | | (193 | ) | | | (174 | ) | | | (163 | ) |
Foreign exchange effect on cash and cash equivalents | | | 1 | | | | (17 | ) | | | (20 | ) |
| | | | | | | | | | | | | |
Free cash(1) | | | (724 | ) | | | (324 | ) | | | (91 | ) |
Cash provided by financing activities, excluding dividend payment | | | 410 | | | | 6 | | | | 653 | |
| | | | | | | | | | | | | |
(Decrease) increase in cash and cash equivalents, as shown on the Consolidated Statements of Cash Flows | | | (314 | ) | | | (318 | ) | | | 562 | |
Cash and cash equivalents at beginning of year | | | 361 | | | | 679 | | | | 117 | |
| | | | | | | | | | | | | |
Cash and cash equivalents at end of year | | $ | 47 | | | $ | 361 | | | $ | 679 | |
| | | | | | | | | | | | | |
(1) Free cash has no standardized meaning prescribed by GAAP and, therefore, is unlikely to be comparable to similar measures of other companies. Free cash is discussed further in Section 15, Non-GAAP Measures.
There was negative free cash of $724 million in 2011, and negative free cash of $324 million in 2010. This increase was primarily due to higher additions to properties and lower earnings, partially offset by lower pension contributions, as 2011 included a $600 million voluntary prepayment to the Company’s main Canadian defined benefit pension plan compared with $650 million in 2010. In addition, in 2010 the Company made scheduled contributions of approximately $100 million towards the main Canadian defined benefit pension plan’s deficit. The Company did not make a similar payment in 2011, discussed further in Section 22, Critical Accounting Estimates.
There was negative free cash of $324 million in 2010, and negative free cash of $91 million in 2009.
This increase was primarily due to:
| ¨ | | a $650 million voluntary prepayment to the Company’s main Canadian defined benefit pension plan in 2010, compared to a $500 million voluntary prepayment in 2009. In addition, in 2010 the Company made scheduled contributions of approximately $100 million towards the main Canadian defined benefit pension plan’s deficit. The Company did not make a similar payment in 2009; |
| ¨ | | proceeds on the sales of a partnership interest and significant properties in 2009; |
| ¨ | | the unfavourable impact in working capital balances in 2010; and |
| ¨ | | cash tax payments in 2010 compared to tax recoveries in 2009. |
This increase was partially offset by higher earnings in 2010.
The Company made voluntary prepayments to its main Canadian defined benefit pension plan of $600 million, $650 million and $500 million in 2011, 2010 and 2009, respectively, in order to reduce, and provide greater stability of future contributions to this plan. It is expected that annual pension contributions will now be in the range of $100 million to $125 million for the next several years, whereas without the prepayments future contributions would be greater and more volatile from year to year. By ensuring that pension contributions will be more stable and predictable over the next few years, the Company is better able to plan and manage the use of cash in other areas of our business, including the accelerated capital program. Funding for the prepayments was through the issuance of debt at attractive interest rates which are lower than the rate of return on plan assets that the pension plan is expected to earn. Furthermore, the prepayments are fully tax deductible when made and have contributed to the extension of the timing of when CP will become cash taxable in Canada.
15. NON-GAAP MEASURES
We present non-GAAP measures and cash flow information to provide a basis for evaluating underlying earnings and liquidity trends in our business that can be compared with the results of our operations in prior periods. These non-GAAP measures exclude other specified items that are not among our normal ongoing revenues and operating expenses. These non-GAAP measures have no standardized meaning and are not defined by GAAP and, therefore, are unlikely to be comparable to similar measures presented by other companies.
Free cash is a non-GAAP measure that management considers to be an indicator of liquidity. The measure is used by management to provide information with respect to the relationship between cash provided by operating activities and investment decisions and provides a comparable measure for period to period changes. Free cash is calculated as cash provided by operating activities, less cash used in investing activities and dividends paid, adjusted for changes in cash and cash equivalent balances resulting from FX fluctuations. Free cash is discussed further and is reconciled to the change in cash and cash equivalents as presented in the financial statements in Section 14, Liquidity and Capital Resources.
Interest coverage ratio, a non-GAAP measure, is used in assessing the Company’s debt servicing capabilities, but does not have a comparable GAAP measure to which it can be reconciled. This ratio provides an indicator of our debt servicing capabilities, and how these have changed, period over period and in comparison to our peers. Interest coverage ratio includes EBIT, a non-GAAP measure, which can be calculated as Operating income less Other income and charges plus Gain on sale of partnership interest. The ratio, measured as EBIT divided by Net interest expense is reported quarterly and is measured on a twelve month rolling basis. Interest coverage ratio is discussed further in Section 14, Liquidity and Capital Resources.
16. BALANCE SHEET
Total Assets
Total assets were $14,110 million at December 31, 2011, compared with $13,676 million at December 31, 2010. This increase was primarily due to an increase in Net properties due to our 2011 capital plan additions in excess of depreciation, as well as an increase in Accounts Receivable, net, mostly reflecting increased billings. This increase was partially offset by a reduction in Cash and cash equivalents, discussed further in Section 14, Liquidity and Capital Resources, and a decrease in deferred income tax assets resulting from the amount which CP expects to utilize in 2012, as well as the net impact of the cancellation of share appreciation rights (“SARs”).
Total Liabilities
Total liabilities were $9,461 million at December 31, 2011, compared with $8,852 million at December 31, 2010.
This increase was primarily due to:
| ¨ | | a net increase in long-term debt due to the issuance of notes to fund voluntary prepayments to the Company’s main Canadian defined benefit pension plan and to fund locomotive purchases, discussed further in Section 14, Liquidity and Capital Resources; |
| ¨ | | an increase in Pension and other benefit liabilities arising from a reduction in discount rates and unfavourable 2011 equity returns, discussed further in Section 22, Critical Accounting Estimates; and |
| ¨ | | an increase in Accounts payable and accrued liabilities, partly due to higher trade payables associated with an increased capital program. |
This increase was partially offset by a reduction in long-term deferred tax liabilities resulting from an increase in non-current deferred tax assets associated with tax losses and tax credits, which are netted against such liabilities, and a decrease in Other long-term liabilities resulting from the resolution of certain income tax matters related to previous-year tax filings and estimates, discussed further in Section 10, Other Income Statement Items, as well as the reclassification of the liability related to certain SARs.
Shareholders’ Equity
At December 31, 2011, our Consolidated Balance Sheet reflected $4,649 million in equity, compared with $4,824 million at December 31, 2010. This decrease was primarily due to an increase in Accumulated other comprehensive loss (“AOCL”) driven by an increase in Pension and other benefit liabilities arising from a reduction in discount rates and unfavourable 2011 equity returns. This decrease was partially offset by net income in excess of dividends, and an increase in Additional paid-in capital due primarily to the reclassification of the liability related to cancelled SARs.
Share Capital
At March 5, 2012, 170,738,260 common shares and no preferred shares were issued and outstanding. In addition, CP has a Management Stock Option Incentive Plan (“MSOIP”) under which key officers and employees are granted options to purchase CP shares. Each option granted can be exercised for one Common Share. At March 5, 2012, 9.6 million options were outstanding under our MSOIP and Directors’ Stock Option Plan, and 0.4 million Common Shares have been reserved for issuance of future options.
Tandem Share Appreciation Rights
As a result of changes to Canadian tax legislation, which eliminated the favourable tax treatment on cash settled compensation awards, the Company offered employees the option of cancelling the outstanding SARs and keeping in place the outstanding option. During 2011, the Company cancelled 3.5 million SARs and reclassified the fair value of the previously recognized liability ($75 million) and the recognized deferred tax asset ($18 million) to Additional paid-in capital. The terms of the awards were not changed and as a result no incremental cost was recognized. The
weighted average fair value of the units cancelled was $23.75 per unit. Compensation cost will continue to be recognized over the remaining vesting period for those options not yet vested.
Dividends
Dividends declared by the Board of Directors in the last three years are as follows:
| | | | |
| Dividend amount | | Record date | | Payment date |
| | | | | |
$0.3000 | | March 30, 2012 | | April 30, 2012 |
$0.3000 | | December 30, 2011 | | January 30, 2012 |
$0.3000 | | September 30, 2011 | | October 31, 2011 |
$0.3000 | | June 24, 2011 | | July 25, 2011 |
$0.2700 | | March 25, 2011 | | April 25, 2011 |
$0.2700 | | December 31, 2010 | | January 31, 2011 |
$0.2700 | | September 24, 2010 | | October 25, 2010 |
$0.2700 | | June 25, 2010 | | July 26, 2010 |
$0.2475 | | March 26, 2010 | | April 26, 2010 |
$0.2475 | | December 31, 2009 | | January 25, 2010 |
$0.2475 | | September 25, 2009 | | October 26, 2009 |
$0.2475 | | June 26, 2009 | | July 27, 2009 |
$0.2475 | | March 27, 2009 | | April 27, 2009 |
| | | | | |
17. FINANCIAL INSTRUMENTS
Fair Value of Financial Instruments
The Company categorizes its financial assets and liabilities measured at fair value into one of three different levels depending on the observability of the inputs employed in the measurement.
| ¨ | | Level 1: Unadjusted quoted prices for identical assets and liabilities in active markets that are accessible at the measurement date. |
| ¨ | | Level 2: Directly or indirectly observable inputs other than quoted prices included within Level 1 or quoted prices for similar assets and liabilities. Derivative instruments in this category are valued using models or other industry standard valuation techniques derived from observable market data. |
| ¨ | | Level 3: Valuations based on inputs which are less observable, unavailable or where the observable data does not support a significant portion of the instruments’ fair value. Generally, Level 3 valuations are longer dated transactions, occur in less active markets, occur at locations where pricing information is not available, or have no binding broker quote to support Level 2 classifications. |
When possible, the estimated fair value is based on quoted market prices and, if not available, estimates from third party brokers. For non-exchange traded derivatives classified in Level 2, the Company uses standard valuation techniques to calculate fair value. Primary inputs to these techniques include observable market prices (interest, foreign exchange and commodity) and volatility, depending on the type of derivative and nature of the underlying risk. The Company uses inputs and data used by willing market participants when valuing derivatives and considers its own credit default swap spread as well as those of its counterparties in its determination of fair value. Wherever possible the Company uses observable inputs. All derivatives are classified as Level 2.
A detailed analysis of the techniques used to value the Company’s long-term floating rate notes, which are classified as Level 3, are discussed further in Section 22, Critical Accounting Estimates.
Carrying Value and Fair Value of Financial Instruments
The carrying values of financial instruments equal or approximate their fair values with the exception of long-term debt which has a fair value of approximately $5,314 million at December 31, 2011 (December 31, 2010 – $4,773 million) and a carrying value of $4,745 million at December 31, 2011 (December 31, 2010 – $4,315 million). The fair value of publicly traded long-term debt, determined based on market prices, was $4,390 million at December 31, 2011 (December 31, 2010 – $3,963 million) with a carrying value of $3,913 million (December 31, 2010 – $3,606 million).
Derivative Financial Instruments
The Company’s policy with respect to using derivative financial instruments is to selectively reduce volatility associated with fluctuations in interest rates, FX rates, the price of fuel and stock-based compensation expense. Where derivatives are designated as hedging instruments, the relationship
between the hedging instruments and their associated hedged items is documented, as well as the risk management objective and strategy for the use of the hedging instruments. This documentation includes linking the derivatives that are designated as fair value or cash flow hedges to specific assets or liabilities on the Consolidated Balance Sheet, commitments or forecasted transactions. At the time a derivative contract is entered into, and at least quarterly thereafter, an assessment is made whether the derivative item is effective in offsetting the changes in fair value or cash flows of the hedged items. The derivative qualifies for hedge accounting treatment if it is effective in substantially mitigating the risk it was designed to address.
It is not the Company’s intent to use financial derivatives or commodity instruments for trading or speculative purposes.
Credit Risk Management
Credit risk refers to the possibility that a customer or counterparty will fail to fulfil its obligations under a contract and as a result create a financial loss for the Company. The Company’s credit risk regarding its investment in long-term floating rate notes is discussed further in Section 22, Critical Accounting Estimates.
The Company predominantly serves financially established customers and the Company has experienced limited financial losses with respect to credit risk. The credit worthiness of customers is assessed using credit scores supplied by a third party, and through direct monitoring of their financial well-being on a continual basis. The Company establishes guidelines for customer credit limits and should thresholds in these areas be reached, appropriate precautions are taken to improve collectability.
Counterparties to financial instruments expose the Company to credit losses in the event of non-performance. Counterparties for derivative and cash transactions are limited to high credit quality financial institutions, which are monitored on an on-going basis. Counterparty credit assessments are based on the financial health of the institutions and their credit ratings from external agencies. The Company does not anticipate non-performance that would materially impact the Company’s financial statements. In addition, the Company believes there are no significant concentrations of credit risk.
Foreign Exchange Management
The Company is exposed to fluctuations in value of financial commitments, assets, liabilities, income or cash flows due to changes in FX rates. The Company conducts business transactions and owns assets in both Canada and the United States; as a result, revenues and expenses are incurred in both Canadian and U.S. dollars. The Company enters into foreign exchange risk management transactions primarily to manage fluctuations in the exchange rate between Canadian and U.S. currencies. In terms of net income, excluding FX on long-term debt, mitigation of U.S. dollar FX exposure is provided primarily through offsets created by revenues and expenses incurred in the same currency. Where appropriate, the Company negotiates with customers and suppliers to reduce the net exposure.
Occasionally the Company will enter into short-term FX forward contracts as part of its cash management strategy.
Net Investment Hedge
The FX gains and losses on long-term debt are mainly unrealized and can only be realized when U.S. dollar denominated long-term debt matures or is settled. The Company also has long-term FX exposure on its investment in U.S. affiliates. The majority of the Company’s U.S. dollar denominated long-term debt has been designated as a hedge of the net investment in foreign subsidiaries. This designation has the effect of mitigating volatility on net income by offsetting long-term FX gains and losses on long-term debt and gains and losses on its net investment. In addition, the Company may enter into FX forward contracts to lock-in the amount of Canadian dollars it has to pay on its U.S. denominated debt maturities.
Foreign Exchange Forward Contracts
During 2011, in anticipation of a cash tender to offer to redeem the Company’s US$101 million 5.75% May 2013 Notes, the Company unwound a similar amount of FX forward contracts, accounted for as cash flow hedges, to fix the exchange rate on these Notes, for total proceeds of $2 million.
At December 31, 2011, the Company had remaining FX forward contracts to fix the exchange rate on US$175 million of its 6.50% Notes due in May 2018, and US$100 million of its 7.25% Notes due in May 2019. These derivatives, which are accounted for as cash flow hedges, guarantee the amount of Canadian dollars that the Company will repay when these Notes mature.
During 2011, a combined realized and unrealized foreign exchange gain of $8 million (2010 – unrealized loss of $1 million) in Other income and charges was recorded in relation to these derivatives. During 2011, the gain recorded in Other income and charges was largely offset by the realized and unrealized losses on the underlying debt which the derivatives were designated to hedge. Similarly, the loss in 2010 was largely offset by unrealized gains on the underlying debt.
At December 31, 2011, the unrealized gain derived from these FX forwards was $6 million which was included in Other assets with the offset reflected as an unrealized loss of $1 million in Accumulated other comprehensive loss and as an unrealized gain of $7 million in Retained earnings. At December 31, 2010, the unrealized loss derived from these FX forwards was $2 million which was included in Other long-term liabilities with the offset reflected as an unrealized loss of $1 million in Accumulated other comprehensive loss and as an unrealized loss of $1 million in Retained earnings.
Interest Rate Management
The Company is exposed to interest rate risk, which is the risk that the fair value or future cash flows of a financial instrument will vary as a result of changes in market interest rates. In order to manage funding needs or capital structure goals, the Company enters into debt or capital lease agreements that are subject to either fixed market interest rates set at the time of issue or floating rates determined by on-going market conditions. Debt subject to variable interest rates exposes the Company to variability in interest expense, while debt subject to fixed interest rates exposes the Company to variability in the fair value of debt.
To manage interest rate exposure, the Company accesses diverse sources of financing and manages borrowings in line with a targeted range of capital structure, debt ratings, liquidity needs, maturity schedule, and currency and interest rate profiles. In anticipation of future debt issuances, the Company may enter into forward rate agreements such as treasury rate locks, bond forwards or forward starting swaps, designated as cash flow hedges, to substantially lock in all or a portion of the effective future interest expense. The Company may also enter into swap agreements, designated as fair value hedges, to manage the mix of fixed and floating rate debt.
Interest Rate Swaps
At December 31, 2011 and December 31, 2010, the Company had no outstanding interest rate swaps.
During 2011, the Company amortized $5 million (2010 – $4 million; 2009 – $6 million) of deferred gains to Net interest expense relating to interest rate swaps previously unwound in 2010 and 2009. In addition, during 2011 the Company amortized $2 million of deferred gains to Other income and charges as a result of the redemption of 5.75% 2013 Notes. These gains were deferred as a fair value adjustment to the underlying debts that were hedged and were amortized to Net interest expense until the debts were redeemed in 2011.
Treasury Rate Locks
At December 31, 2011, the Company had net unamortized losses related to interest rate locks, which are accounted for as cash flow hedges, settled in previous years totalling $22 million (December 31, 2010 – $22 million). This amount is composed of various unamortized gains and losses related to specific debts which are reflected in Accumulated other comprehensive loss and are amortized to Net interest expense in the period that interest on the related debt is charged. The amortization of these gains and losses resulted in a negligible increase to Net interest expense and Other comprehensive income in 2011 (2010 – $2 million; 2009 – $4 million).
At December 31, 2011, the Company expected that, during the next twelve months, a negligible amount of loss related to these previously settled derivatives would be reclassified to Net interest expense.
Stock-based Compensation Expense Management
The Company is exposed to stock-based compensation risk, which is the probability of increased compensation expense due to the increase in the Company’s share price.
The Company has a Total Return Swap (“TRS”) to reduce the volatility to the Company over time on three types of stock-based compensation programs: tandem share appreciation rights, deferred share units, and restricted share units. As the Company’s share price appreciates, these programs create increased compensation expense. The TRS is a derivative that provides a gain to offset increased compensation expense as the share price increases and a loss to offset reduced compensation expense when the share price falls. This derivative is not designated as a hedge and changes in fair value are recognized in net income in the period in which the change occurs.
During 2011, the Company reduced the size of the TRS program by 0.5 million share units (December 31, 2010 – 0.5 million) at minimal cost to reflect the cancellation of SARs in Canada.
At December 31, 2011, the Company had 0.6 million share units (December 31, 2010 – 1.1 million) remaining in the TRS with an unrealized loss of $3 million (December 31, 2010 – $6 million) which was included in Accounts payable and accrued liabilities on the Consolidated Balance Sheets.
Compensation and benefits expense on the Company’s Consolidated Statements of Income included a net gain on these swaps of $3 million in 2011 (2010 – $12 million; 2009 – $19 million).
Fuel Price Management
The Company is exposed to commodity risk related to purchases of diesel fuel and the potential reduction in net income due to increases in the price of diesel. Fuel expense constitutes a large portion of the Company’s operating costs and volatility in diesel fuel prices can have a significant impact on the Company’s income. Items affecting volatility in diesel prices include, but are not limited to, fluctuations in world markets for crude oil and distillate fuels, which can be affected by supply disruptions and geopolitical events.
The impact of variable fuel expense is mitigated substantially through fuel cost recovery programs which apportion incremental changes in fuel prices to shippers through price indices, tariffs, and by contract, within agreed upon guidelines. While these programs provide effective and meaningful
coverage, residual exposure remains as the fuel expense risk cannot be completely recovered from shippers due to timing and volatility in the market. The Company continually monitors residual exposure, and where appropriate, may enter into derivative instruments.
Energy Futures
Derivative instruments used by the Company to manage fuel expense risk may include, but are not limited to, swaps and options for crude oil, diesel and crack spreads.
At December 31, 2011, the Company had diesel futures contracts, which are accounted for as cash flow hedges, to purchase approximately 21 million U.S. gallons during the period January to December 2012 at an average price of $3.01 per U.S. gallon. This represents approximately 7% of estimated fuel purchases for this period. At December 31, 2011, the unrealized loss on these futures contracts was $3 million (December 31, 2010 – unrealized gain $4 million) and was reflected in Accounts payable and accrued liabilities (December 31, 2010 – Other current assets) with the offset, net of tax, reflected in Accumulated other comprehensive loss on the Consolidated Balance Sheets. At December 31, 2011, the Company expected that, during the next twelve months, $3 million of unrealized losses on diesel future contracts would be realized and recognized in Fuel expense as a result of these derivatives being settled.
The impact of settled commodity swaps decreased Fuel expense in 2011 by $8 million as a result of realized gains on diesel swaps (2010 – realized gains $3 million; 2009 – realized losses $5 million).
For every one cent increase in the price of a U.S. gallon of diesel, fuel expense before tax and hedging will increase by approximately $3 million on an annual basis, assuming current FX rates and fuel consumption levels. We have a fuel risk mitigation program to moderate the impact of increases in fuel prices, which includes these swaps and our fuel cost recovery program.
18. OFF-BALANCE SHEET ARRANGEMENTS
Guarantees
At December 31, 2011, the Company had residual value guarantees on operating lease commitments of $164 million. The maximum amount that could be payable under these and all of the Company’s other guarantees cannot be reasonably estimated due to the nature of certain of the guarantees. All or a portion of amounts paid under certain guarantees could be recoverable from other parties or through insurance. The Company has accrued for all guarantees that it expects to pay. As at December 31, 2011, these accruals amounted to $8 million (December 31, 2010 – $5 million).
19. CONTRACTUAL COMMITMENTS
The accompanying table indicates our obligations and commitments to make future payments for contracts, such as debt, capital lease and commercial arrangements.
At December 31, 2011
| | | | | | | | | | | | | | | | | | | | |
Payments due by period (in millions) | | Total | | | 2012 | | | 2013 &
2014 | | | 2015 &
2016 | | | 2017 &
beyond | |
| | | | | | | | | | | | | | | | | | | | | |
Contractual commitments | | | | | | | | | | | | | | | | | | | | |
Long-term debt | | $ | 4,489 | | | $ | 42 | | | $ | 92 | | | $ | 151 | | | $ | 4,204 | |
Capital lease | | | 288 | | | | 8 | | | | 143 | | | | 9 | | | | 128 | |
Operating lease(1) | | | 813 | | | | 145 | | | | 227 | | | | 148 | | | | 293 | |
Supplier purchase | | | 1,810 | | | | 239 | | | | 304 | | | | 299 | | | | 968 | |
Other long-term liabilities(2) | | | 721 | | | | 83 | | | | 154 | | | | 129 | | | | 355 | |
| | | | | | | | | | | | | | | | | | | | | |
Total contractual commitments | | $ | 8,121 | | | $ | 517 | | | $ | 920 | | | $ | 736 | | | $ | 5,948 | |
| | | | | | | | | | | | | | | | | | | | | |
(1) Residual value guarantees on certain leased equipment with a maximum exposure of $164 million, discussed further in Section 18, Off-Balance Sheet Arrangements, are not included in the minimum payments shown above, as management believes that we will not be required to make payments under these residual guarantees.
(2) Includes expected cash payments for restructuring, environmental remediation, asset retirement obligations, post-retirement benefits, workers’ compensation benefits, long-term disability benefits, pension benefit payments for our non-registered supplemental pension plan, deferred income tax liabilities and certain other long-term liabilities. Projected payments for post-retirement benefits, workers’ compensation benefits and long-term disability benefits include the anticipated payments for years 2012 to 2021. Pension contributions for our registered pension plans are not included due to the volatility in calculating them. Pension payments are discussed further in Section 22, Critical Accounting Estimates. Deferred income tax liabilities may vary according to changes in tax rates, tax regulations and the operating results of the Company. As the cash impact in any particular year cannot be reasonably determined, all long-term deferred tax liabilities have been reflected in the “2017 & beyond” category in this table. Deferred income taxes are discussed further in Section 22, Critical Accounting Estimates.
20. FUTURE TRENDS AND COMMITMENTS
Agreements and Recent Developments
Canpotex
On January 23, 2012, CP reached a ten-year agreement with Canpotex, commencing July 1, 2012. Under the agreement, CP will be Canpotex’s principal Canadian railway partner, transporting a large majority of potash shipments to Canpotex’s main terminal in Vancouver, B.C. In addition, in conjunction with Union Pacific Corporation, CP will transport all Canpotex potash shipments to Portland, Oregon.
Change in Executive Officer
On April 1, 2011, Mr. Ed Harris retired as Executive Vice-President and Chief Operations Officer and Mr. Michael Franczak was appointed Executive Vice-President, Operations. Mr. Harris acted as an advisor to Mr. Franczak until December 14, 2011. Mr. Franczak, who was subsequently appointed Executive Vice-President and Chief Operations Officer effective March 1, 2012, reports to the President and Chief Executive Officer and is responsible for operations activity across Canadian Pacific’s North American network.
Board Appointments
Canadian Pacific announced the appointment of Mr. Tony Ingram and Mr. Ed Harris to the Board of Directors on December 15, 2011.
Stock Price
The market value per CP common share, as listed on the Toronto Stock Exchange was $69.01 at December 31, 2011, an increase of $4.39 per share from $64.62 at December 31, 2010. The market value per CP common share, as listed on the Toronto Stock Exchange was $64.62 at December 31, 2010, an increase of $7.83 per share from $56.79 at December 31, 2009.
Environmental
Cash payments related to our environmental remediation program, described in Section 22, Critical Accounting Estimates, totalled $15 million in 2011, compared with $13 million in 2010 and $18 million in 2009. Cash payments for environmental initiatives are estimated to be approximately $15 million in 2012, $14 million in 2013, $11 million in 2014 and a total of approximately $57 million over the remaining years through 2021, which will be paid in decreasing amounts. All payments will be funded from general operations.
We continue to be responsible for remediation work on portions of a property in the State of Minnesota and continue to retain liability accruals for remaining future expected costs. The costs are expected to be incurred over approximately 10 years. The state’s voluntary investigation and remediation program will oversee the work to ensure it is completed in accordance with applicable standards.
Certain Other Financial Commitments
In addition to the financial commitments mentioned previously in Section 18, Off-Balance Sheet Arrangements and Section 19, Contractual Commitments, we are party to certain other financial commitments set forth in the table below.
At December 31, 2011
| | | | | | | | | | | | | | | | | | | | |
Amount of commitments per period (in millions) | | Total | | | 2012 | | | 2013 &
2014 | | | 2015 &
2016 | | | 2017 &
beyond | |
| | | | | | | | | | | | | | | | | | | | | |
Commitments | | | | | | | | | | | | | | | | | | | | |
Letters of credit | | $ | 407 | | | $ | 407 | | | $ | – | | | $ | – | | | $ | – | |
Capital commitments | | | 366 | | | | 357 | | | | 6 | | | | – | | | | 3 | |
| | | | | | | | | | | | | | | | | | | | | |
Total commitments | | $ | 773 | | | $ | 764 | | | $ | 6 | | | $ | – | | | $ | 3 | |
| | | | | | | | | | | | | | | | | | | | | |
Letters of Credit
Letters of credit are obtained mainly to provide security to third parties under the terms of various agreements, including workers’ compensation and our pension fund. We are liable for these contractual amounts in the case of non-performance under these agreements. As a result, our available line of credit is adjusted for contractual amounts obtained through letters of credit currently included within our revolving credit facility.
Capital Commitments
We remain committed to maintaining our current high level of plant quality and renewing our franchise. As part of this commitment, we have entered contracts with suppliers to make various capital purchases related to track programs. Payments for these commitments are due in 2012 through 2030. These expenditures are expected to be financed by cash generated from operations or by issuing new debt.
Pension Plan Deficit
A description of our future expectations related to the Company’s pension plans is included in Section 22, Critical Accounting Estimates.
Restructuring
Cash payments related to severance under all restructuring initiatives totalled $27 million in 2011, compared with $20 million in 2010 and $27 million in 2009. Cash payments for restructuring initiatives are estimated to be approximately $21 million in 2012, $12 million in 2013, $9 million in 2014, and a total of approximately $17 million over the remaining years through 2025. These amounts include residual payments to protected employees for previous restructuring plans that have been completed.
21. BUSINESS RISKS
In the normal course of our operations, we are exposed to various business risks and uncertainties that can have an effect on our financial condition. While some financial exposures are reduced through risk management strategies including the insurance and hedging programs we have in place, there are certain cases where the financial risks are not fully insurable or are driven by external factors beyond our influence or control.
As part of the preservation and delivery of value to our shareholders, we have developed an integrated Enterprise Risk Management framework to support consistent achievement of key business objectives through daily pro-active management of risk. The objective of the program is to identify events that result from risks, thereby requiring active management. Each event identified is assessed based on the potential impact and likelihood, taking account of financial, environmental, reputation impacts, and existing management control. Risk mitigation strategies are formulated to accept, treat, transfer, or eliminate the exposure to the identified events. Readers are cautioned that the following is not an exhaustive list of all the risks we are exposed to, nor will our mitigation strategies eliminate all risks listed.
Competition
We face significant competition for freight transportation in Canada and the U.S., including competition from other railways and trucking and barge companies. Competition is based mainly on price, quality of service and access to markets. Competition with the trucking industry is generally based on freight rates, flexibility of service and transit time performance. The cost structure and service of our competitors could impact our competitiveness and have a materially adverse impact on our business or operating results.
To mitigate competition risk, our strategies include:
| ¨ | | creating long-term value for customers, shareholders and employees by profitably growing within the reach of our rail franchise and through strategic additions to enhance access to markets and quality of service; |
| ¨ | | renewing and maintaining infrastructure to enable safe and fluid operations; |
| ¨ | | improving handling through IOP to reduce costs and enhance quality and reliability of service; and |
| ¨ | | exercising a disciplined yield approach to competitive contract renewals and bids. |
Liquidity
On October 31, 2011, CP completed arrangements with 12 highly rated financial institutions for a committed $1.0 billion four year revolving credit agreement with an accordion feature of up to $1.3 billion. This agreement incorporates a revolving facility limit of $600 million and a separate letter of credit facility limit of $400 million at pre-agreed pricing and has the ability to annually extend the term for an additional year with the consent of the lenders. At December 31, 2011, CP had available $429 million under the revolving facility limit and $156 million available under the letter of credit facility limit. In addition, CP also has available from a financial institution a revolving credit agreement of $106 million, of which $106 million was available on December 31, 2011. This agreement is available through the end of 2013. With respect to both agreements the company had utilized $390 million for letters of credit and $25 million as short-term borrowings, in addition to a bank overdraft of $2 million. The weighted average annual interest rate for short-term borrowings was 1.98% (2010 - not applicable; 2009 - 1.91%). Both agreements are required to maintain a maximum debt to total capitalization ratio and the $106 million agreement is currently subject to a minimum fixed charge coverage ratio. Should our senior unsecured debt not be rated at least investment grade by Moody’s and S&P, our $1.0 billion credit agreement will also be required to maintain a minimum fixed charge coverage ratio. At December 31, 2011, the Company satisfied the thresholds stipulated in both financial covenants.
It is CP’s intention to manage its long-term financing structure to maintain its investment grade rating.
Surplus cash is invested into a range of short dated money market instruments meeting or exceeding the parameters of our investment policy.
Regulatory Authorities
Regulatory Change
Our railway operations are subject to extensive federal laws, regulations and rules in both Canada and the U.S. which directly affect how we manage many aspects of our railway operation and business activities. Our operations are primarily regulated by the Canadian Transportation Agency (“the Agency”) and Transport Canada in Canada and the FRA and the STB in the U.S. Various other federal regulators directly and indirectly affect our operations in areas such as health, safety, security and environmental and other matters.
The Canada Transportation Act (“CTA”) provides shipper rate and service remedies, including Final Offer Arbitration (“FOA”), competitive line rates and compulsory inter-switching in Canada. The CTA regulates the grain revenue cap, commuter and passenger access, FOA, and charges for ancillary services and railway noise. No assurance can be given to the content, timing or effect on CP of any anticipated additional legislation or future legislative action.
For the grain crop year beginning August 1, 2011 the Agency announced a 3.5% increase in the Volume-Related Composite Price Index (“VRCPI”), a cost inflator used in calculating the grain maximum revenue entitlement for CP and Canadian National Railway. Grain revenues are impacted by several factors including volumes and VRCPI, additional factors are discussed further in this section.
Transport Canada regulates safety-related aspects of our railway operations in Canada. On March 26, 2011, the Canadian Parliament was dissolved for an election that was held on May 2, 2011. As a result, all outstanding business before the House of Commons, including Bill C-33 (an Act to amend the Railway Safety Act and make consequential amendments to the Canada Transportation Act) expired on the Order Paper. On October 7th, 2011, the Government of Canada re-introduced Bill C-33 in the Senate as Bill S-4. No assurance can be given to the effect on CP of this or future legislative action.
On August 12, 2008, the Minister of Transport, Infrastructure and Communities announced the Terms of Reference for the Rail Freight Service Review (“RFSR”). The review is focused on understanding the nature and extent of problems and best practices within the logistics chain, with a focus on railway performance in Canada. On March 18, 2011 the RFSR Panel released its final report and the Government of Canada announced its response to the RFSR. On the same day, the federal government announced a series of supply chain initiatives to take place over the next several months further to the release of the RFSR final report, including the intention to table a bill to give shippers the right to a service agreement. The Company will work with the government on these initiatives. It is too soon to determine if these initiatives will have a material impact on the Company’s financial condition and results of operation.
The FRA regulates safety-related aspects of our railway operations in the U.S. State and local regulatory agencies may also exercise limited jurisdiction over certain safety and operational matters of local significance. The Railway Safety Improvement Act requires, among other things, the introduction of Positive Train Control by the end of 2015, discussed further in Section 21, Business Risks; limits freight rail crews’ duty time; and requires development of a crew fatigue management plan. The requirements imposed by this legislation could have an adverse impact on the Company’s financial condition and results of operations.
The STB regulates commercial aspects of CP’s railway operations in the U.S. The STB is an economic regulatory agency that Congress charged with the fundamental mandate of resolving railroad rate and service disputes and reviewing proposed railroad mergers. The STB serves as both an adjudicatory and a regulatory body.
The STB revised rules relating to railway rate cases to address, among other things, concerns raised by small and medium sized shippers that the previous rules resulted in costly and lengthy proceedings. Few cases have been filed, and no case has been filed against the Company, under the new rules. It is too soon to assess the possible impact on CP of such new rules.
The STB held a hearing to review existing exemptions from railroad-transportation regulations for certain commodities, boxcar and intermodal freight and a hearing on rail competition. The industry and CP participated.
The Chairman and Ranking Republican on the Senate Commerce Committee reintroduced the Surface Transportation Board Reauthorization Act which was the subject of discussions with shippers and the rail industry during the last Congress. They are seeking to include more modest provisions as the “National Rail System Preservation, Expansion, and Development Act of 2012” in the omnibus “Moving Ahead for Progress in the 21st Century Act (‘MAP-21’)” surface transportation authorization bill now under consideration on the Senate floor. The Association of American Railroads issued a statement that, “As the Senate continues its floor consideration of MAP-21, AAR urges support for the Senate Commerce provisions and looks forward to continued dialogue with the Commerce Committee leadership on the final provisions of the legislation”. It is too soon to know whether the hearings or the reintroduced Surface Transportation Board Reauthorization Act will result in further proceedings and regulatory changes.
The railroad industry in the U.S., shippers and representatives of the Senate Commerce Committee met to discuss possible changes to the legislation which governs the STB’s mandate. The Senate Commerce Committee produced a draft Bill. To date, the House of Representatives has not produced a related Bill. It is too soon to determine if any Bill at all will be enacted, or if in the event any such Bill is enacted, whether it would have a material impact on the Company’s financial condition and results of operations.
To mitigate statutory and regulatory impacts, we are actively and extensively engaged throughout the different levels of government and regulators, both directly and indirectly through industry associations, including the Association of American Railroads (“AAR”) and the Railway Association of Canada (“RAC”).
Security
We are subject to statutory and regulatory directives in Canada and the U.S. that address security concerns. CP plays a critical role in the North American transportation system. Our rail lines, facilities, and equipment, including rail cars carrying hazardous materials, could be direct targets or indirect casualties of terrorist attacks. Regulations by the Department of Transportation and the Department of Homeland Security in the U.S. include speed restrictions, chain of custody and security measures which could cause service degradation and higher costs for the transportation of hazardous materials, especially toxic inhalation materials. In Canada, regulatory security requirements are expected to be issued in the future under Transportation of Dangerous Goods Act. In addition, insurance premiums for some or all of our current coverage could increase significantly, or certain coverage may not be available to us in the future. While CP will continue to work closely with Canadian and U.S. government agencies, future decisions by these agencies on security matters or decisions by the industry in response to security threats to the North American rail network could have a materially adverse effect on our business or operating results.
As we strive to ensure our customers have unlimited access to North American markets, we have taken the following steps to provide enhanced security and reduce the risks associated with the cross-border transportation of goods:
| ¨ | | to strengthen the overall supply chain and border security, we are a certified carrier in voluntary security programs, such as the Customs-Trade Partnership Against Terrorism and Partners in Protection; |
| ¨ | | to streamline clearances at the border, we have implemented several regulatory security frameworks that focus on the provision of advanced electronic cargo information and improved security technology at border crossings, including the implementation of the Vehicle and Cargo Inspection System at five of our border crossings; |
| ¨ | | to strengthen railway security in North America, we signed a revised voluntary Memorandum of Understanding with Transport Canada and worked with the AAR to develop and put in place an extensive industry-wide security plan to address terrorism and security-driven efforts seeking to restrict the routings and operational handlings of certain hazardous materials; |
| ¨ | | to reduce toxic inhalation risk in high threat urban areas, we are working with the Transportation Security Administration; and |
| ¨ | | to comply with new U.S. regulations for rail security sensitive materials, we have implemented procedures to maintain positive chain of custody and are performing annual route assessments to select and use the route posing the least overall safety and security risk. |
Positive Train Control
In the U.S., the Rail Safety Improvement Act requires Class I railroads to implement by December 31, 2015, interoperable Positive Train Control (“PTC”) on main track in the U.S. that has passenger rail traffic or toxic inhalant hazard commodity traffic. The legislation defines PTC as a system designed to prevent train-to-train collisions, over-speed derailments, incursions into established work zone limits, and the movement of a train through a switch left in the wrong position. The FRA has issued rules and regulations for the implementation of PTC, and CP filed its PTC Implementation Plans in April 2010, which outlined the Company’s solution for interoperability as well as its consideration of relative risk in the deployment plan. The Company is participating in industry and government working groups to evaluate the scope of effort that will be required to comply with these regulatory requirements, and to further the development of an industry standard interoperable solution that can be supplied in time to complete deployment. At this time CP estimates the cost to implement PTC as required for railway operations in the U.S. to be up to US$250 million. As at December 31, 2011, total expenditures related to PTC were approximately $42 million, (December 31, 2010 – approximately $14 million).
Labour Relations
Certain of our union agreements are currently under renegotiation. We cannot guarantee these negotiations will be resolved in a timely manner or on favourable terms. Work stoppage may occur if the negotiations are not resolved, which could materially impact our business or operating results.
At December 31, 2011, approximately 78% of our workforce was unionized and approximately 75% of our workforce was located in Canada. Unionized employees are represented by a total of 39 bargaining units. Agreements are in place with five of seven bargaining units that represent our employees in Canada and 22 of 32 bargaining units that represent employees in our U.S. operations.
Labour Relations – Canada
We are party to collective agreements with seven bargaining units in our Canadian operations. Currently, collective agreements are in effect with five of the seven bargaining units. Agreements with the Teamsters Canada Rail Conference (“TCRC”), representing running trades employees and the TCRC-Rail Canada Traffic Controllers (“TCRC-RCTC”), representing rail traffic controllers expired December 31, 2011. The terms of the collective agreement are in effect until a new agreement is reached. Of the five agreements that are in place, four expire at the end of 2012 (Canadian Pacific Police Association – representing CP police employees, United Steelworkers – representing clerical workers, TCRC-Maintenance of Way Employees Division – representing track maintenance employees and the International Brotherhood of Electrical Workers – representing signals employees). One agreement, with the Canadian Auto Workers (“CAW”), representing car and locomotive repair employees expires December 31, 2014. On February 17, 2012, we requested the Federal Minister of Labour appoint a conciliator to assist in progressing discussions on a new labour agreement
with the TCRC and TCRC-RCTC unions. The average conciliation process can last between 80 and 90 days. There can be no strike or lockout during this period.
Labour Relations – U.S.
We are party to collective agreements with fourteen bargaining units of our Soo Line subsidiary, thirteen bargaining units of our D&H subsidiary, and four bargaining units of our DM&E subsidiary, and have commenced first contract negotiations with a bargaining unit certified to represent DM&E track maintainers.
Soo Line has settled contracts with twelve of the fourteen bargaining units representing train service employees, car repair employees, locomotive engineers, yard supervisors, clerks, machinists, boilermakers and blacksmiths, electricians, signal maintainers, train dispatchers, sheet metal workers, and mechanical labourers. Mechanical supervisors opened for negotiation in January 2010 and have committed to stand by the outcome of wage, benefits, and rules negotiations at the national table. Soo Line has joined with the other U.S. Class I railroads in national bargaining for this upcoming round of negotiations. The bargaining units representing track maintainers have a tentative agreement with an anticipated ratification date of mid-April.
D&H has settled contracts for the last round of negotiations with all thirteen bargaining units, including locomotive engineers, train service employees, car repair employees, signal maintainers, yardmasters, electricians, machinists, mechanical labourers, track maintainers, clerks, police, engineering supervisors and mechanical supervisors. For the 2010 round of negotiations, D&H and its unions have committed to stand by the outcome of wage, benefits, and rules negotiations at the national table.
DM&E currently has an agreement in place with four bargaining units which cover all DM&E engineers and conductors, signal and communication workers and mechanics. Negotiations on the first contract to cover track maintainers continue in the first quarter of 2012.
Environmental Laws and Regulations
Our operations and real estate assets are subject to extensive federal, provincial, state and local environmental laws and regulations governing emissions to the air, discharges to waters and the handling, storage, transportation and disposal of waste and other materials. If we are found to have violated such laws or regulations it could materially affect our business or operating results. In addition, in operating a railway, it is possible that releases of hazardous materials during derailments or other accidents may occur that could cause harm to human health or to the environment. Costs of remediation, damages and changes in regulations could materially affect our operating results and reputation.
We have implemented a comprehensive Environmental Management System, to facilitate the reduction of environmental risk. CP’s annual Corporate and Operations Environmental Plans state our current environmental goals, objectives and strategies.
Specific environmental programs are in place to address areas such as air emissions, wastewater, management of vegetation, chemicals and waste, storage tanks and fuelling facilities. We also undertake environmental impact assessments. There is continued focus on preventing spills and other incidents that have a negative impact on the environment. There is an established Strategic Emergency Response Contractor network and spill equipment kits located across Canada and the U.S. to ensure a rapid and efficient response in the event of an environmental incident. In addition, emergency preparedness and response plans are regularly updated and tested.
We have developed an environmental audit program that comprehensively, systematically and regularly assesses our facilities for compliance with legal requirements and our policies for conformance to accepted industry standards. Included in this is a corrective action follow-up process and semi-annual review by the Safety, Operations and Environment Committee established by the Board of Directors.
We focus on key strategies, identifying tactics and actions to support commitments to the community. Our strategies include:
| ¨ | | protecting the environment; |
| ¨ | | ensuring compliance with applicable environmental laws and regulations; |
| ¨ | | promoting awareness and training; |
| ¨ | | managing emergencies through preparedness; and |
| ¨ | | encouraging involvement, consultation and dialogue with communities along our lines. |
Climate Change
In both Canada and the U.S., the federal governments have not designated railway transportation as a large final emitter with respect to greenhouse gas (“GHG”) emissions. The railway transportation industry is currently not regulated with respect to GHG emissions, nor do we operate under a regulated cap of GHG emissions. Growing support for climate change legislation is likely to result in changes to the regulatory framework in Canada and the U.S. However, the timing and specific nature of those changes are difficult to predict. Specific instruments such as carbon taxes, and technical and fuel standards have the ability to significantly affect the Company’s capital and operating costs. Restrictions, caps and/or taxes on the emissions of GHG could also affect the markets for, or the volume of, the goods the Company transports.
The fuel efficiency of railways creates a significant advantage over trucking, which currently handles a majority of the market share of ground transportation. Although trains are already three times more fuel efficient than trucks on a per ton-mile basis, we continue to adopt new technologies to minimize our fuel consumption and GHG emissions.
Potential physical risks associated with climate change include damage to railway infrastructure due to extreme weather effects, (i.e. increased flooding, winter storms). Improvements to infrastructure design and planning are used to mitigate the potential risks posed by weather events. The Company maintains flood plans, winter operating plans, an avalanche risk management program and geotechnical monitoring of slope stability.
Financial risks
Pension Funding Volatility
A description of our pension funding volatility related to the Company’s pension plans is included in Section 22, Critical Accounting Estimates.
Fuel Cost Volatility
Fuel expense constitutes a significant portion of CP’s operating costs and can be influenced by a number of factors, including, without limitation, worldwide oil demand, international politics, weather, refinery capacity, unplanned infrastructure failures, labour and political instability and the ability of certain countries to comply with agreed-upon production quotas.
Our primary mitigation strategy includes a fuel cost recovery program and from time to time derivative instruments specific instruments currently used are discussed further in Fuel Price Management in Section 17, Financial Instruments. The fuel cost recovery program reflects changes in fuel costs, which are included in freight rates. Freight rates will increase when fuel prices rise and will decrease when fuel costs decrease. While fluctuations in fuel cost are mitigated, the risk cannot be completely eliminated due to timing and the volatility in the market.
To address the residual portion of our fuel costs not mitigated by our fuel recovery programs, CP has a systematic hedge program with monthly rolling hedges of 10% – 12% of our fuel requirements. Using this approach CP will, at any point in time, have 5% – 7% of the next twelve months’ fuel consumption and 8% – 10% of the next quarter’s fuel consumption hedged.
Foreign Exchange Risk
Although we conduct our business primarily in Canada, a significant portion of our revenues, expenses, assets and liabilities including debt are denominated in U.S. dollars. Consequently, our results are affected by fluctuations in the exchange rate between these currencies. The value of the Canadian dollar is affected by a number of domestic and international factors, including, without limitation, economic performance, Canadian, U.S. and international monetary policies and U.S. debt levels. Changes in the exchange rate between the Canadian dollar and other currencies (including the U.S. dollar) make the goods transported by us more or less competitive in the world marketplace and, in turn, positively or negatively affect our revenues and expenses. To manage this exposure to fluctuations in exchange rates between Canadian and U.S. dollars, we may sell or purchase U.S. dollar forwards at fixed rates in future periods. Foreign exchange management is discussed further in Section 17, Financial Instruments.
Interest Rate Risk
In order to meet our funding requirements and our capital structure requirements, we may enter into long-term debt agreements. These debt agreements expose us to increased interest costs on future fixed debt instruments and existing variable rate debt instruments should market rates increase. In addition, the present value of our assets and liabilities will also vary with interest rate changes. To manage our interest rate exposure, we may enter into forward rate agreements such as treasury rate locks or bond forwards that lock in rates for a future date, thereby protecting ourselves against interest rate increases. We may also enter into swap agreements whereby one party agrees to pay a fixed rate of interest while the other party pays a floating rate. Contingent on the direction of interest rates, we may incur higher costs depending on our contracted rate. Interest rate management is discussed further in Section 17, Financial Instruments.
General and Other Risks
Transportation of Hazardous Materials
Railways, including CP, are legally required to transport hazardous materials as part of their common carrier obligations regardless of risk or potential exposure of loss. A train accident involving hazardous materials, including toxic inhalation hazard commodities such as chlorine and anhydrous ammonia could result in catastrophic losses from personal injury and property damage, which could have a material adverse effect on CP’s operations, financial condition and liquidity.
Supply Chain Disruptions
The North American transportation system is integrated. CP’s operations and service may be negatively impacted by service disruptions of other transportation links such as ports, handling facilities, customer facilities, and other railroads. A prolonged service disruption at one of these entities could have a material adverse effect on CP’s operations, financial conditions and liquidity.
Reliance on Technology and Technological Improvements
IT is critical to all aspects of our business. While we have business continuity and disaster recovery plans in place, a significant disruption or failure of one or more of our IT or communications systems could result in service interruptions or other failures and deficiencies which could have a material adverse effect on our results of operations, financial condition and liquidity. If we are unable to acquire or implement new technology, we may suffer a competitive disadvantage, which could also have an adverse effect on our results of operations, financial condition and liquidity.
Qualified Personnel
Changes in employee demographics, training requirements, and the availability of qualified personnel, particularly locomotive engineers and train-persons, could negatively impact the Company’s ability to meet demand for rail service. We have workforce planning tools and programs in place and are undertaking technological improvements to assist with manual tasks. Unpredictable increases in the demand for rail services may increase the risk of having insufficient numbers of trained personnel, which could have a material adverse effect on our results of operations and financial conditions.
Severe Weather
We are exposed to severe weather conditions including floods, avalanches, mudslides, extreme temperatures and significant precipitation that may cause business interruptions that can adversely affect our entire rail network and result in increased costs, increased liabilities, and decreased revenue, which could have a material adverse effect on CP’s operations and financial condition.
Supplier Concentration
Due to the complexity and specialized nature of rail equipment and infrastructure, there can be a limited number of suppliers of this equipment and material available. Should these specialized suppliers cease production or experience capacity or supply shortages, this concentration of suppliers could result in CP experiencing cost increases or difficulty in obtaining rail equipment and materials. While CP manages this risk by sourcing key products and services from multiple suppliers whenever possible, widespread business failures of suppliers could have a material adverse effect on CP’s operations and financial position.
General Risks
There are factors and developments that are beyond the influence or control of the railway industry generally and CP specifically which may have a material adverse effect on our business or operating results. Our freight volumes and revenues are largely dependent upon the performance of the North American and global economies, which remains uncertain, and other factors affecting the volumes and patterns of international trade. CP’s bulk traffic is dominated by grain, metallurgical coal, fertilizers and sulphur. Factors outside of CP’s control which affect bulk traffic include: (i) with respect to grain volumes, domestic production-related factors such as weather conditions, acreage plantings, yields and insect populations, (ii) with respect to coal volumes, global steel production, (iii) with respect to fertilizer volumes, grain and other crop markets, with both production levels and prices relevant, and (iv) with respect to sulphur volumes, gas production levels in southern Alberta, industrial production and fertilizer production, both in North America and abroad. The merchandise commodities transported by the Company include those relating to the forestry, energy, industrial, automotive and other consumer spending sectors. Factors outside of CP’s control which affect this portion of CP’s business include the general state of the North American economy, with North American industrial production, business investment and consumer spending being the general sources of economic demand. Housing, auto production and energy development are also specific sectors of importance. Factors outside of CP’s control which affect the Company’s intermodal traffic volumes include North American consumer spending and a technological shift toward containerization in the transportation industry that has expanded the range of goods moving by this means.
Adverse changes to any of the factors outside of CP’s control which affect CP’s bulk traffic, the merchandise commodities transported by CP or CP’s intermodal traffic volumes or adverse changes to fuel prices could have a material adverse effect on CP’s business, financial condition, results of operations and cash flows.
We are also sensitive to factors including, but not limited to, natural disasters, security threats, commodity pricing, global supply and demand, and supply chain efficiency. Other business risks include: potential increase in maintenance and operational costs, uncertainties of litigation, risks and liabilities arising from derailments and technological changes.
22. CRITICAL ACCOUNTING ESTIMATES
To prepare consolidated financial statements that conform with GAAP, we are required to make estimates and assumptions that affect the reported amounts of assets and liabilities, the disclosure of contingent assets and liabilities at the date of the consolidated financial statements and the reported amounts of revenues and expenses during the reported periods. Using the most current information available, we review our estimates on an ongoing basis, including those related to environmental liabilities, pensions and other benefits, property, plant and equipment, deferred income taxes, legal and personal injury liabilities, long-term floating rate notes and goodwill and intangible assets.
The development, selection and disclosure of these estimates, and this MD&A, have been reviewed by the Board of Directors’ Audit, Finance and Risk Committee, which is comprised entirely of independent directors.
Environmental Liabilities
We estimate the probable cost to be incurred in the remediation of property contaminated by past railway use. We screen and classify sites according to typical activities and scale of operations conducted, and we develop remediation strategies for each property based on the nature and extent of the contamination, as well as the location of the property and surrounding areas that may be adversely affected by the presence of contaminants. We also consider available technologies, treatment and disposal facilities and the acceptability of site-specific plans based on the local regulatory environment. Site-specific plans range from containment and risk management of the contaminants through to the removal and treatment of the contaminants and affected soils and ground water. The details of the estimates reflect the environmental liability at each property. We are committed to fully meeting our regulatory and legal obligations with respect to environmental matters.
Liabilities for environmental remediation may change from time to time as new information about previously untested sites becomes known. The net liability may also vary as the courts decide legal proceedings against outside parties responsible for contamination. These potential charges, which cannot be quantified at this time, are not expected to be material to our financial position, but may materially affect income in the period in which a charge is recognized. Material increases to costs would be reflected as increases to Other long-term liabilities on our Consolidated Balance Sheets and to Purchased services and other within operating expenses on our Consolidated Statements of Income.
At December 31, 2011, the accrual for environmental remediation on our Consolidated Balance Sheet amounted to $97 million (2010 – $107 million), of which the long-term portion amounting to $82 million (2010 – $91 million) was included in Other long-term liabilities and the short-term portion amounting to $15 million (2010 – $16 million) was included in Accounts payable and accrued liabilities. Total payments were $15 million in 2011 and $13 million in 2010. The U.S. dollar-denominated portion of the liability was affected by the change in FX, resulting in an increase in environmental liabilities of $2 million in 2011 and a decrease of $5 million in 2010.
Pensions and Other Benefits
We have defined benefit and defined contribution pension plans. Other benefits include post-retirement medical and life insurance for pensioners, and some post-employment workers’ compensation and long-term disability benefits in Canada. Workers’ compensation and long-term disability benefits are discussed in the Legal and Personal Injury Liabilities section below. Pension and post-retirement benefits liabilities are subject to various external influences and uncertainties.
Pension costs are actuarially determined using the projected-benefit method prorated over the credited service periods of employees. This method incorporates our best estimates of expected plan investment performance, salary escalation and retirement ages of employees. The expected return on fund assets is calculated using market-related asset values developed from a five-year average of market values for the fund’s public equity securities (with each prior year’s market value adjusted to the current date for assumed investment income during the intervening period) plus the market value of the fund’s fixed income, real estate and infrastructure securities, subject to the market-related asset value not being greater than 120% of the market value nor being less than 80% of the market value.
The discount rate we use to determine the benefit obligation is based on market interest rates on high-quality corporate debt instruments with matching cash flows. Unrecognized actuarial gains and losses in excess of 10% of the greater of the benefit obligation and the market-related value of plan assets are amortized over the expected average remaining service period of active employees expected to receive benefits under the plan (approximately 10 years). Prior service costs arising from collectively bargained amendments to pension plan benefit provisions are amortized over the term of the applicable union agreement. Prior service costs arising from all other sources are amortized over the expected average remaining service period of active employees who were expected to receive benefits under the plan at the date of amendment.
The obligations with respect to post-retirement benefits, including health care and life insurance, are actuarially determined and are accrued using the projected-benefit method prorated over the credited service periods of employees. The obligations with respect to post-employment benefits, including some workers’ compensation and long-term disability benefits in Canada are the actuarial present value of benefits payable to employees on disability.
We included pension benefit liabilities of $884 million in Pension and other benefit liabilities on our December 31, 2011 Consolidated Balance Sheet. We also included post-retirement benefits accruals of $383 million in Pension and other benefit liabilities and post-retirement benefits accruals of $21 million in Accounts payable and accrued liabilities on our December 31, 2011 Consolidated Balance Sheet. Accruals for self-insured workers compensation and long-term disability benefit plans are discussed in the Legal and Personal Injury Liabilities section below.
Fluctuations in the post-retirement benefit obligation can result from changes in the discount rate used. A 1.0 percentage point increase (decrease) in the discount rate would decrease (increase) the liability by approximately $50 million.
Net periodic benefit costs for pensions and post-retirement benefits were included in Compensation and benefits on our December 31, 2011 Consolidated Statement of Income. Combined net periodic benefit costs for pensions and post-retirement benefits (excluding self-insured workers compensation and long-term disability benefits) were $79 million in 2011, compared with $69 million in 2010.
Net periodic benefit costs for pensions were $51 million in 2011, compared with $39 million in 2010. The portion of this related to defined benefit pensions was $46 million in 2011, compared with $36 million in 2010, and the portion related to defined contribution pensions (equal to contributions) was $5 million for 2011, compared with $3 million for 2010. We estimate net periodic benefit costs for pensions in 2012 to equal approximately $47 million, including $41 million for defined benefit pensions and $6 million for defined contribution pensions. Net periodic benefit costs for post-retirement benefits were $28 million in 2011, compared with $29 million in 2010. Net periodic benefit costs for post-retirement benefits in 2012 are not expected to differ materially from the 2011 costs.
Fluctuations in net periodic benefit costs for pensions can result from favourable or unfavourable investment returns and changes in long-term interest rates. The impact of favourable or unfavourable investment returns is moderated by the use of a market-related asset value for the main Canadian defined benefit pension plan’s public equity securities. The impact of changes in long-term interest rates is moderated by the 60% matching of the sensitivities of the main Canadian plan’s fixed income assets and liabilities to movements in long Government of Canada bond yields contained in the plan’s investment policy. If the rate of investment return on the plans’ public equity securities in 2011 had been 10 percentage points higher (or lower) than the actual 2011 rate of investment return on such securities, 2012 net periodic benefit costs for pensions would be lower (or higher) by $14 million. If the yield spread between the high quality long-term Canadian corporate bonds used to calculate the discount rate and long-term Government of Canada bonds as at December 31, 2011 had been higher (or lower) by 0.1%, 2012 net periodic benefit costs for pensions would be lower (or higher) by $14 million. A change in long-term Government of Canada bond yields as at December 31, 2011, without a change in the spread between Canadian corporate and Government of Canada bond yields, would not have materially affected 2012 net periodic benefit costs for pensions due to the above asset/liability interest rate matching.
Pension Plan Deficit
We made contributions of $693 million to the defined benefit pension plans in 2011, compared with $837 million in 2010. Our 2011 contributions included a voluntary prepayment in December 2011 of $600 million to our main Canadian defined benefit pension plan. Our 2010 and 2009 contributions included voluntary prepayments of $650 million in September 2010 and $500 million in December 2009 to our main Canadian defined benefit pension plan. We have significant flexibility with respect to the rate at which we apply these voluntary prepayments to reduce future years’ pension contribution requirements, which allows us to manage the volatility of future pension funding requirements.
We estimate our aggregate pension contributions to be in the range of $100 million to $125 million in each of the next few years. These estimates reflect our current intentions with respect to the rate at which we will apply the December 2009, September 2010 and December 2011 voluntary prepayments against contribution requirements in the next few years.
Future pension contributions will be highly dependent on our actual experience with such variables as investment returns, interest rate fluctuations and demographic changes, on the rate at which the voluntary prepayments are applied against pension contribution requirements, and on any changes in the regulatory environment.
We estimate that every 1.0 percentage point increase (or decrease) in the discount rate attributable to changes in long Government of Canada bond yields can cause our defined benefit pension plans’ deficit to decrease (or increase) by approximately $600 million, reflecting the changes to both the pension obligations and the value of the pension funds’ debt securities. Similarly, for every 1.0 percentage point the actual return on assets varies above (or below) the estimated return for the year, the deficit would decrease (or increase) by approximately $90 million. Adverse experience with respect to these factors could eventually increase funding and pension expense significantly, while favourable experience with respect to these factors could eventually decrease funding and pension expense significantly.
The plans’ investment policies provide a target allocation of approximately 46% of the plans’ assets to be invested in public equity securities. As a result, stock market performance is the key driver in determining the pension funds’ asset performance. Most of the plans’ remaining assets are invested in debt securities which, as mentioned above, provide a partial offset to the increase (or decrease) in our pension deficit caused by decreases (or increases) in the discount rate.
The deficit will fluctuate according to future market conditions and funding will be revised as necessary to reflect such fluctuations. We will continue to make contributions to the pension plans that, at a minimum, meet pension legislative requirements.
Pension Funding Volatility
Our main Canadian defined benefit pension plan accounts for 97% of CP’s pension obligation and can produce significant volatility in pension funding requirements, given the pension fund’s size, the many factors that drive the pension plan’s funded status, and Canadian statutory pension funding requirements. Over the last several years, CP has made several changes to the plan’s investment policy to reduce this volatility, including the reduction of the plan’s public equity markets exposure. In addition, CP has made voluntary prepayments to our main Canadian defined benefit pension plan of $600 million in December 2011, $650 million in September 2010, and $500 million in December 2009 which will reduce pension
funding volatility, since we have significant flexibility with respect to the rate at which we apply these voluntary prepayments to reduce future years’ pension funding requirements.
Property, Plant and Equipment
CP performs depreciation studies of each property group approximately every three years to update depreciation rates. The depreciation studies are based on statistical analysis of historical retirements of properties in the group and incorporate engineering estimates of changes in current operations and of technological advances. We depreciate the cost of properties, net of salvage, on a straight-line basis over the estimated useful life of the property group. We follow the group depreciation method under which a single depreciation rate is applied to the total cost in a particular class of property, despite differences in the service life or salvage value of individual properties within the same class. The estimates of economic lives are uncertain and can vary due to technological changes or in the rate of wear. Additionally, the depreciation rates are updated to reflect the change in residual values of the assets in the class. Under the group depreciation method, retirements or disposals of properties in the normal course of business are accounted for by charging the cost of the property less any net salvage to accumulated depreciation. For the sale or retirement of larger groups of depreciable assets that are unusual and were not included in our depreciation studies, CP records a gain or loss for the difference between net proceeds and net book value of the assets sold or retired.
Due to the capital intensive nature of the railway industry, depreciation represents a significant part of our operating expenses. The estimated useful lives of properties have a direct impact on the amount of depreciation recorded as a component of Net properties on our Consolidated Balance Sheet. At December 31, 2011, accumulated depreciation was $5,970 million.
Revisions to the estimated useful lives and net salvage projections for properties constitute a change in accounting estimate and we address these prospectively by amending depreciation rates. It is anticipated that there will be changes in the estimates of weighted average useful lives and net salvage for each property group as assets are acquired, used and retired. Substantial changes in either the useful lives of properties or the salvage assumptions could result in significant changes to depreciation expense. For example, if the estimated average life of road locomotives, our largest asset group, increased (or decreased) by 5%, annual depreciation expense would decrease (or increase) by approximately $3 million.
We review the carrying amounts of our properties when circumstances indicate that such carrying amounts may not be recoverable based on future undiscounted cash flows. When such properties are determined to be impaired, recorded asset values are revised to their fair values and an impairment loss is recognized.
Deferred Income Taxes
We account for deferred income taxes based on the liability method. This method focuses on a Company’s balance sheet and the temporary differences otherwise calculated from the comparison of book versus tax values. It is assumed that such temporary differences will be settled in the deferred income tax assets and liabilities at the balance sheet date.
In determining deferred income taxes, we make estimates and assumptions regarding deferred tax matters, including estimating the timing of the realization and settlement of deferred income tax assets (including the benefit of tax losses) and liabilities. Deferred income taxes are calculated using enacted federal, provincial, and state future income tax rates, which may differ in future periods.
Deferred income tax expense totalling $187 million was included in income tax for 2011 and $211 million was included in income tax in 2010. The change in deferred income tax in 2011 was primarily due to lower taxable income. At December 31, 2011, deferred income tax liabilities of $1,819 million (2010 – $1,945 million) were recorded as a long-term liability and comprised largely of temporary differences related to accounting for properties. Deferred income tax benefits of $101 million realizable within one year were recorded as a current asset compared to $222 million at December 31, 2010.
Legal and Personal Injury Liabilities
We are involved in litigation in Canada and the U.S. related to our business. Management is required to establish estimates of the potential liability arising from incidents, claims and pending litigation, including personal injury claims and certain occupation-related and property damage claims.
These estimates are determined on a case-by-case basis. They are based on an assessment of the actual damages incurred and current legal advice with respect to settlements in other similar cases. We employ experienced claims adjusters who investigate and assess the validity of individual claims made against us and estimate the damages incurred.
A provision for incidents, claims or litigation is recorded based on the facts and circumstances known at the time. We accrue for likely claims when the facts of an incident become known and investigation results provide a reasonable basis for estimating the liability. The lower end of the range is accrued if the facts and circumstances permit only a range of reasonable estimates and no single amount in that range is a better estimate than any other. Additionally, for administrative expediency, we keep a general provision for lesser-value injury cases. Facts and circumstances related to asserted claims can change, and a process is in place to monitor accruals for changes in accounting estimates.
With respect to claims related to occupational health and safety in the provinces of Quebec, Ontario, Manitoba and B.C., claims administered through the Workers’ Compensation Board (“WCB”) are actuarially determined. In the provinces of Saskatchewan and Alberta, we are assessed for an annual WCB contribution. As a result, this amount is not subject to estimation by management.
Railway employees in the U.S. are not covered by a workers’ compensation program, but are covered by U.S. federal law for railway employees. Although we manage in the U.S. using a case-by-case comprehensive approach, for accrual purposes, a combination of case-by-case analysis and statistical analysis is utilized.
Provisions for incidents, claims and litigation charged to income, which are included in Purchased services and other on our Consolidated Statement of Income, amounted to $74 million in 2011 (2010 – $50 million; 2009 – $54 million).
Accruals for incidents, claims and litigation, including WCB accruals, totaled $172 million, net of insurance recoveries, at December 31, 2011 and $161 million at December 31, 2010. At December 31, 2011 and 2010 respectively, the total accrual included $106 million and $99 million in Pension and other benefit liabilities, $14 million and $13 million in Other long-term liabilities and $53 million and $52 million in Accounts payable and accrued liabilities, offset by $1 million and $1 million in Other assets and $Nil million and $2 million in Accounts receivable, net.
Long-term Floating Rate Notes
At December 31, 2011 and December 31, 2010, the Company held long-term floating rate notes, consisting almost entirely of Master Asset Vehicle (“MAV”) 2 notes with eligible assets, with a total settlement value of $105 million and $117 million, respectively, and carrying values of $79 million and $70 million, respectively. The carrying values, being the estimated fair values, are reported in Investments.
The MAV 2 Class A-1 notes received an A (high) rating from Dominion Bond Rating Service (“DBRS”), unchanged from 2010, however at December 31, 2011, the rating was Under Review with Positive Implications. On September 23, 2011, the rating of the MAV 2 Class A-2 notes was upgraded from BBB (low) to BBB (high).
During 2011, the Company sold all of its MAV 2 Class B and Class C and MAV 3 Class 9 notes for proceeds of $6 million and recorded a gain of $6 million. During 2010, the Company used notes to settle a $9 million credit facility with a major Canadian Bank and recorded a gain of $1 million. The notes had an estimated fair value of $8 million.
The valuation technique used by the Company to estimate the fair value of its investment in long-term floating rate notes at December 31, 2011 and December 31, 2010, incorporates probability weighted discounted cash flows considering the best available public information regarding market conditions and other factors that a market participant would consider for such investments. The above noted redemption of notes, accretion and changes in assumptions have resulted in gains of $15 million in 2011 (2010 – $9 million; 2009 – $9 million) which were reported in Other income and charges. The interest rates and maturities of the various long-term floating rate notes, discount rates and credit losses modelled December 31, 2011 and December 31, 2010, respectively, are:
| | | | |
| | | December 31, 2011 | | December 31, 2010 |
| | | | | |
Probability weighted average coupon interest rate | | 0.8% | | 0.8% |
Weighted average discount rate | | 6.1% | | 7.1% |
Expected repayments of long-term floating rate notes | | Approximately 5 years | | Approximately 6 years |
Credit losses | | MAV 2 eligible asset notes: | | MAV 2 eligible asset notes: |
| | nil | | 1% to 100% |
| | | | MAV 3 Class 9 Traditional Asset Tracking notes: 1% |
| | | | | |
The probability weighted discounted cash flows resulted in an estimated fair value of the Company’s long-term floating rate notes of $79 million at December 31, 2011 (December 31, 2010 – $70 million). The change in the original cost and estimated fair value of the Company’s long-term floating rate notes is as follows (representing a roll-forward of assets measured at fair value using Level 3 inputs):
| | | | | | | | | | | | | | | | |
| | | 2011 | | | 2010 | |
| (in millions of Canadian dollars) | | Original
cost | | | Estimated
fair value | | | Original
Cost | | | Estimated
fair value | |
| | | | | | | | | | | | | | | | | |
As at January 1 | | $ | 117 | | | $ | 70 | | | $ | 129 | | | $ | 70 | |
Redemption of notes | | | (12 | ) | | | – | | | | (12 | ) | | | (8 | ) |
Accretion | | | – | | | | 5 | | | | – | | | | 6 | |
Change in market assumptions | | | – | | | | 4 | | | | – | | | | 2 | |
| | | | | | | | | | | | | | | | | |
As at December 31 | | $ | 105 | | | $ | 79 | | | $ | 117 | | | $ | 70 | |
| | | | | | | | | | | | | | | | | |
Sensitivity analysis is presented below for key assumptions at December 31, 2011:
| | | | |
| (in millions of Canadian dollars) | | Change in fair value of long-term
floating rate notes | |
| | | | | |
Coupon interest rate | | | | |
50 basis point increase | | $ | 1 | |
50 basis point decrease | | $ | (1 | ) |
Discount rate | | | | |
50 basis point increase | | $ | (2 | ) |
50 basis point decrease | | $ | 2 | |
| | | | | |
Continuing uncertainties regarding the value of the assets which underlie the long-term floating rate notes and the amount and timing of cash flows could give rise to a further material change in the value of the Company’s investment in long-term floating rate notes which could impact the Company’s near-term earnings.
Goodwill and Intangible Assets
As part of the acquisition of DM&E in 2007, CP recognized goodwill of US$147 million on the allocation of the purchase price, determined as the excess of the purchase price over the fair value of the net assets acquired. Since the acquisition, the operations of DM&E have been integrated with CP’s U.S. operations and the related goodwill is now allocated to CP’s U.S. reporting unit. Goodwill is tested for impairment at least once per year as at October 1st. The goodwill impairment test determines if the fair value of the reporting unit continues to exceed its net book value, or whether an impairment charge is required. The fair value of the reporting unit is affected by projections of its profitability including estimates of revenue growth, which are inherently uncertain. The annual test for impairment determined that the fair value of CP’s U.S. reporting unit exceeded the carrying value of the allocated goodwill by approximately 42% in 2011 and 40% in 2010.
The impairment test was performed primarily using an income approach based on discounted cash flows. A discount rate of 9.5% (2010 – 8.5% to 9.0%) was used, based on the weighted average cost of capital. A change in discount rates of 0.25% would change the valuation by 5.0% to 6.0%. The valuation used revenue growth projections ranging from 4.5% to 11.2% (2010 – 4.3% to 7.1%) annually. A change in the long-term growth rate of 0.25% would change the valuation by 4.0% to 5.0%. These sensitivities indicate that a prolonged recession or increased borrowing rates could result in an impairment to the carrying value of goodwill in future periods. A secondary approach used in the valuation was a market approach which included a comparison of implied earnings multiples of CP U.S. to trading earnings multiples of comparable companies, adjusted for the inherent minority discount. The derived value of CP U.S. using the income approach fell within the range of the observable trading multiples. The income approach was chosen over the market approach as it takes into consideration the particular characteristics attributable to CP U.S.
As at December 31, 2011 goodwill was $150 million and $147 million at December 31, 2010. The carrying value of CP’s goodwill changes from period to period due to changes in the exchange rate.
23. SYSTEMS, PROCEDURES AND CONTROLS
The Company’s Chief Executive Officer and Chief Financial Officer are responsible for establishing and maintaining disclosure controls and procedures (as defined in Rules 13a-15(e) and 15d-15(e) of the U.S. Securities Exchange Act of 1934 (as amended)) to ensure that material information relating to the Company is made known to them. The Chief Executive Officer and Chief Financial Officer have a process to evaluate these disclosure controls and are satisfied that they are effective for ensuring that such material information is made known to them.
24. 2011 GUIDANCE UPDATES
2011 Financial Assumptions
In the 2010 annual MD&A, assumptions for 2011 were provided which included capital expenditures estimated to range from $950 million to $1.05 billion. CP expected its tax rate to be in the 24% to 26% range. The 2011 pension contributions were estimated to be between $100 million and $125 million.
2011 Third-Quarter Guidance Update
CP updated its assumptions as follows: Capital expenditures were estimated to be $1.1 billion in 2011. This increase included the purchase of additional locomotives and our ability to complete our planned capital program. We estimated our aggregate defined benefit pension contributions to equal approximately $100 million in 2011, and in the range of $125 million to $150 million in each of the subsequent three or four years.
Variance from 2011 Guidance
CP’s capital expenditures for 2011 came in at $1.1 billion, discussed further in Section 14, Liquidity and Capital Resources. The effective tax rate for 2011 was 18.2% including a 5.3% reduction for the impact of an income tax benefit resulting from the resolution of certain income tax matters related to previous-year tax filings and estimates, discussed further in Section 10, Other Income Statement Items. Excluding this income tax benefit, we were in line with the guidance provided. Our 2011 contributions to the defined benefit pension plans were $693 million, including a $600 million voluntary prepayment, discussed further in Section 22, Critical Accounting Estimates.
25. GLOSSARY OF TERMS
Average active employees – expense: The average number of actively employed workers during the period whose compensation costs are included in Compensation and Benefits Expense on the Consolidated Statement of Income. This includes employees who are taking vacation and statutory holidays and other forms of short-term paid leave, and excludes individuals who have a continuing employment relationship with us but are not currently working or who have not worked a minimum number of hours. This definition also excludes employees working on capital projects.
Average daily active cars on-line: The average number of freight cars that are in active status on CP’s network. This includes cars that are in need of light repairs. This excludes freight cars that require significant repairs, are in storage and cars spotted at customer facilities.
Average daily active road locomotives on-line:The average number of road locomotives that are in active status on CP’s network. This excludes locomotives in yard and short haul service, in repair status, in storage and in use on other railways.
Average terminal dwell: The average time a freight car resides at a specified terminal location. The timing starts with a train arriving in the terminal, a customer releasing the car to us, or a car arriving that is to be transferred to another railway. The timing ends when the train leaves, a customer receives the car from us or the freight car is transferred to another railway. Freight cars are excluded if: i) a train is moving through the terminal without stopping; ii) they are being stored at the terminal; iii) they are in need of repair; or iv) they are used in track repairs.
Average train length – excluding local traffic: The average length of CP trains, both loaded and empty. This excludes trains in short haul service, work trains used to move CP’s track equipment and materials and the haulage of other railways’ trains on CP’s network.
Average train speed: The average speed attained as a train travels between terminals, calculated by dividing the total train miles traveled by the total hours operated. This calculation does not include the travel time or the distance traveled by: i) trains used in or around CP’s yards; ii) passenger trains; and iii) trains used for repairing track. The calculation also does not include the time trains spend waiting in terminals.
Average train weight – excluding local traffic:The average gross weight of CP trains, both loaded and empty. This excludes trains in short haul service, work trains used to move CP’s track equipment and materials and the haulage of other railways’ trains on CP’s network.
Car miles per car day: The total car-miles for a period divided by the total number of active cars. Total car-miles include the distance travelled by every car on a revenue-producing train and a train used in or around our yards. A car-day is assumed to equal one active car-day. An active car is a revenue-producing car that is generating costs to CP on an hourly or mileage basis. Excluded from this count are i) cars that are not on the track or are being stored; ii) cars that are in need of repair; iii) cars that are used to carry materials for track repair; iv) cars owned by customers that are on the customer’s tracks; and v) cars that are idle and waiting to be reclaimed by CP.
Carloads: Revenue-generating shipments of containers, trailers and freight cars.
Casualty expenses: Includes costs associated with personal injuries, freight and property damages, and environmental mishaps.
CP, the Company: CPRL, CPRL and its subsidiaries, CPRL and one or more of its subsidiaries, or one or more of CPRL’s subsidiaries.
CPRL: Canadian Pacific Railway Limited.
D&H: Delaware and Hudson Railway Company, Inc., a wholly owned indirect U.S. subsidiary of CPRL.
DM&E: Dakota, Minnesota & Eastern Railroad Corporation.
Employee productivity:The total freight gross ton-miles divided by the average number of active expense employees.
FRA: U.S. Federal Railroad Administration, a regulatory agency whose purpose is to promulgate and enforce rail safety regulations; administer railroad assistance programs; conduct research and development in support of improved railroad safety and national rail transportation policy; provide for the rehabilitation of Northeast Corridor rail passenger service; and consolidate government support of rail transportation activities.
FRA personal injury rate per 200,000 employee-hours: The number of personal injuries multiplied by 200,000 and divided by total employee-hours. Personal injuries are defined as injuries that require employees to lose time away from work, modify their normal duties or obtain medical treatment beyond minor first aid. Employee-hours are the total hours worked, excluding vacation and sick time, by all employees, excluding contractors.
FRA train accidents rate: The number of train accidents, multiplied by 1,000,000 and divided by total train-miles. Train accidents included in this metric meet or exceed the FRA reporting threshold of US$9,400 in the U.S. or $9,800 in Canada in damage.
Freight revenue per carload: The amount of freight revenue earned for every carload moved, calculated by dividing the freight revenue for a commodity by the number of carloads of the commodity transported in the period.
Freight revenue per RTM: The amount of freight revenue earned for every RTM moved, calculated by dividing the total freight revenue by the total RTMs in the period.
FX or Foreign Exchange: The value of the Canadian dollar relative to the U.S. dollar (exclusive of any impact on market demand).
GAAP: Accounting principles generally accepted in the United States.
GTMs or gross ton-miles: The movement of total train weight over a distance of one mile. Total train weight is comprised of the weight of the freight cars, their contents and any inactive locomotives. An increase in GTMs indicates additional workload.
IOP: Integrated Operating Plan, the foundation for our scheduled railway operations.
Locomotive productivity: The daily average GTMs divided by the active road horse power. Active road horse power excludes locomotives in yard and short haul service, in repair status, in storage and in use on other railways.
Operating income: Calculated as total revenues less total operating expenses and is a common measure of profitability used by management.
Operating ratio: The ratio of total operating expenses to total revenues. A lower percentage normally indicates higher efficiency.
RTMs or revenue ton-miles: The movement of one revenue-producing ton of freight over a distance of one mile.
Soo Line: Soo Line Railroad Company, a wholly owned indirect U.S. subsidiary of CPRL.
STB: U.S. Surface Transportation Board, a regulatory agency with jurisdiction over railway rate and service issues and rail restructuring, including mergers and sales.
U.S. gallons of locomotive fuel consumed per 1,000 GTMs: The total fuel consumed in freight and yard operations for every 1,000 GTMs traveled. This is calculated by dividing the total amount of fuel issued to our locomotives, excluding commuter and non-freight activities, by the total freight-related GTMs. The result indicates how efficiently we are using fuel.
Canadian Pacific Railway Limited
CONSOLIDATED FINANCIAL STATEMENTS
Accounting Principles Generally Accepted In the United States of America
December 31, 2011
Except where otherwise indicated, all financial information
reflected herein is expressed in Canadian dollars
MANAGEMENT’S RESPONSIBILITY FOR FINANCIAL REPORTING
The information in this report is the responsibility of management. The consolidated financial statements have been prepared by management in accordance with accounting principles generally accepted in the United States of America (“GAAP”) and include some amounts based on management’s best estimates and careful judgment. The consolidated financial statements include the accounts of Canadian Pacific Railway Limited, Canadian Pacific Railway Company and all of its subsidiaries (the “Company”). The financial information of the Company included in the Company’s Annual Report is consistent with that in the consolidated financial statements. The consolidated financial statements have been approved by the Board of Directors.
Our Board of Directors is responsible for reviewing and approving the consolidated financial statements and for overseeing management’s performance of its financial reporting responsibilities. The Board of Directors carries out its responsibility for the consolidated financial statements principally through its Audit, Finance and Risk Committee (the “Audit Committee”), consisting of six members, all of whom are independent directors. The Audit Committee reviews the consolidated financial statements with management and the Independent Registered Chartered Accountants prior to submission to the Board for approval. The Audit Committee meets regularly with management, internal auditors, and the Independent Registered Chartered Accountants to review accounting policies, and financial reporting. The Audit Committee also reviews the recommendations of both the Independent Registered Chartered Accountants and internal auditors for improvements to internal controls, as well as the actions of management to implement such recommendations. The internal auditors and Independent Registered Chartered Accountants have full access to the Audit Committee, with or without the presence of management.
Management’s Report on Internal Control over Financial Reporting
Management is responsible for establishing and maintaining adequate internal control over financial reporting for the Company. Because of its inherent limitations, internal control over financial reporting may not prevent or detect misstatements. Also, projections of any evaluation of effectiveness to future periods are subject to the risk that controls may become inadequate because of changes in conditions, or that the degree of compliance with the policies or procedures may deteriorate.
Management has assessed the effectiveness of the Company’s internal control over financial reporting in accordance with the criteria set forth by the Committee of Sponsoring Organizations of the Treadway Commission in “Internal Control-Integrated Framework”. Based on this assessment, management determined that the Company maintained effective internal control over financial reporting as of December 31, 2011.
The effectiveness of the Company’s internal control over financial reporting as at December 31, 2011 has been audited by Deloitte & Touche LLP, Independent Registered Chartered Accountants, as stated in their report, which is included herein.
| | |
 | | |
| Kathryn B. McQuade | | Fred J. Green |
Executive Vice-President and
Chief Financial Officer | | President and Chief Executive Officer |
February 28, 2012
REPORT OF INDEPENDENT REGISTERED CHARTERED ACCOUNTANTS
To the Board of Directors and the Shareholders of Canadian Pacific Railway Limited:
We have audited the accompanying consolidated financial statements of Canadian Pacific Railway Limited and subsidiaries (the “Company”), which comprise the consolidated balance sheet as at December 31, 2011 and the consolidated statements of income, comprehensive income, cash flows and changes in shareholders’ equity for the year then ended, and a summary of significant accounting policies and other explanatory information.
Management’s Responsibility for the Consolidated Financial Statements
Management is responsible for the preparation and fair presentation of these consolidated financial statements in accordance with accounting principles generally accepted in the United States of America, and for such internal control as management determines is necessary to enable the preparation of consolidated financial statements that are free from material misstatement, whether due to fraud or error.
Auditor’s Responsibility
Our responsibility is to express an opinion on these consolidated financial statements based on our audit. We conducted our audit in accordance with Canadian generally accepted auditing standards and the standards of the Public Company Accounting Oversight Board (United States). Those standards require that we comply with ethical requirements and plan and perform the audit to obtain reasonable assurance about whether the consolidated financial statements are free from material misstatement.
An audit involves performing procedures to obtain audit evidence about the amounts and disclosures in the consolidated financial statements. The procedures selected depend on the auditor’s judgment, including the assessment of the risks of material misstatement of the consolidated financial statements, whether due to fraud or error. In making those risk assessments, the auditor considers internal control relevant to the entity’s preparation and fair presentation of the consolidated financial statements in order to design audit procedures that are appropriate in the circumstances. An audit also includes evaluating the appropriateness of accounting policies used and the reasonableness of accounting estimates made by management, as well as evaluating the overall presentation of the consolidated financial statements.
We believe that the audit evidence we have obtained in our audit is sufficient and appropriate to provide a basis for our audit opinion.
Opinion
In our opinion, the consolidated financial statements present fairly, in all material respects, the financial position of Canadian Pacific Railway Limited and subsidiaries as at December 31, 2011 and the results of their operations and cash flows for the year then ended in accordance with accounting principles generally accepted in the United States of America.
Other Matter
We have also audited, in accordance with the standards of the Public Company Accounting Oversight Board (United States), the Company’s internal control over financial reporting as at December 31, 2011, based on the criteria established inInternal Control – Integrated Framework issued by the Committee of Sponsoring Organizations of the Treadway Commission and our report dated February 28, 2012 expressed an unqualified opinion on the Company’s internal control over financial reporting.

Independent Registered Chartered Accountants
February 28, 2012
Calgary, Canada
REPORT OF INDEPENDENT REGISTERED CHARTERED ACCOUNTANTS
To the Board of Directors and the Shareholders of Canadian Pacific Railway Limited:
We have audited the internal control over financial reporting of Canadian Pacific Railway Limited and subsidiaries (the “Company”) as at December 31, 2011, based on the criteria established inInternal Control – Integrated Framework issued by the Committee of Sponsoring Organizations of the Treadway Commission. The Company’s management is responsible for maintaining effective internal control over financial reporting and for its assessment of the effectiveness of internal control over financial reporting, included in the accompanying Management’s Report on Internal Control over Financial Reporting. Our responsibility is to express an opinion on the Company’s internal control over financial reporting based on our audit.
We conducted our audit in accordance with the standards of the Public Company Accounting Oversight Board (United States). Those standards require that we plan and perform the audit to obtain reasonable assurance about whether effective internal control over financial reporting was maintained in all material respects. Our audit included obtaining an understanding of internal control over financial reporting, assessing the risk that a material weakness exists, testing and evaluating the design and operating effectiveness of internal control based on the assessed risk, and performing such other procedures as we considered necessary in the circumstances. We believe that our audit provides a reasonable basis for our opinion.
A company’s internal control over financial reporting is a process designed by, or under the supervision of, the company’s principal executive and principal financial officers, or persons performing similar functions, and effected by the company’s board of directors, management and other personnel to provide reasonable assurance regarding the reliability of financial reporting and the preparation of financial statements for external purposes in accordance with generally accepted accounting principles. A company’s internal control over financial reporting includes those policies and procedures that (1) pertain to the maintenance of records that, in reasonable detail, accurately and fairly reflect the transactions and dispositions of the assets of the company; (2) provide reasonable assurance that transactions are recorded as necessary to permit preparation of financial statements in accordance with generally accepted accounting principles, and that receipts and expenditures of the company are being made only in accordance with authorizations of management and directors of the company; and (3) provide reasonable assurance regarding prevention or timely detection of unauthorized acquisition, use or disposition of the company’s assets that could have a material effect on the financial statements.
Because of the inherent limitations of internal control over financial reporting, including the possibility of collusion or improper management override of controls, material misstatements due to error or fraud may not be prevented or detected on a timely basis. Also, projections of any evaluation of the effectiveness of the internal control over financial reporting to future periods are subject to the risk that the controls may become inadequate because of changes in conditions, or that the degree of compliance with the policies or procedures may deteriorate.
In our opinion, the Company maintained, in all material respects, effective internal control over financial reporting as at December 31, 2011, based on the criteria established inInternal Control – Integrated Framework issued by the Committee of Sponsoring Organizations of the Treadway Commission.
We have also audited, in accordance with Canadian generally accepted auditing standards and the standards of the Public Company Accounting Oversight Board (United States), the consolidated financial statements as at and for the year ended December 31, 2011 of the Company and our report dated February 28, 2012 expressed an unqualified opinion on those financial statements.
Independent Registered Chartered Accountants
February 28, 2012
Calgary, Canada
INDEPENDENT AUDITOR’S REPORT
To the Shareholders of Canadian Pacific Railway Limited
We have audited the consolidated balance sheet of Canadian Pacific Railway Limited as at December 31, 2010 and the consolidated statements of income, comprehensive income, cash flows, and changes in shareholders’ equity for each of the two years in the period ended December 31, 2010, and the related notes, which comprise a summary of significant accounting policies and other explanatory information.
Management’s responsibility for the consolidated financial statements
Management is responsible for the preparation and fair presentation of these consolidated financial statements in accordance with accounting principles generally accepted in the United States of America and for such internal control as management determines is necessary to enable the preparation of consolidated financial statements that are free from material misstatement, whether due to fraud or error.
Auditor’s responsibility
Our responsibility is to express an opinion on these consolidated financial statements based on our audits. We conducted our audits in accordance with Canadian generally accepted auditing standards and the standards of the Public Company Accounting Oversight Board (United States). Those standards require that we plan and perform the audit to obtain reasonable assurance about whether the consolidated financial statements are free from material misstatement. Canadian generally accepted auditing standards require that we comply with ethical requirements.
An audit involves performing procedures to obtain audit evidence about the amounts and disclosures in the consolidated financial statements. The procedures selected depend on the auditor’s judgment, including the assessment of the risks of material misstatement of the consolidated financial statements, whether due to fraud or error. Our audits included consideration of internal control over financial reporting as a basis for designing audit procedures that are appropriate in the circumstances, but not for the purpose of expressing an opinion on the effectiveness of the company’s internal control over financial reporting. Accordingly, we express no such opinion. An audit also includes evaluating the appropriateness of accounting policies used and the reasonableness of accounting estimates made by management, as well as evaluating the overall presentation of the consolidated financial statements.
We believe that the audit evidence we have obtained in our audits is sufficient and appropriate to provide a basis for our audit opinion.
Opinion
In our opinion, the consolidated financial statements present fairly, in all material respects, the financial position of Canadian Pacific Railway Limited as at December 31, 2010 and the results of its operations and its cash flows for each of the two years in the period ended December 31, 2010 in accordance with accounting principles generally accepted in the United States of America.

Chartered Accountants
February 24, 2011
Calgary, Alberta
For the fiscal year ended December 31, 2011CANADIAN PACIFIC RAILWAY LIMITED
CONSOLIDATED STATEMENTS OF INCOME
| | | | | | | | | | | | |
| | | | | | | | | | |
| Year ended December 31 (in millions of Canadian dollars, except per share data) | | 2011 | | | 2010 | | | 2009 | |
| | | | | | | | | | | | | |
| | | |
Revenues | | | | | | | | | | | | |
Freight | | $ | 5,052 | | | $ | 4,853 | | | $ | 4,280 | |
Other | | | 125 | | | | 128 | | | | 122 | |
| | | | | | | | | | | | | |
Total revenues | | | 5,177 | | | | 4,981 | | | | 4,402 | |
| | | | | | | | | | | | | |
Operating expenses | | | | | | | | | | | | |
Compensation and benefits | | | 1,426 | | | | 1,431 | | | | 1,307 | |
Fuel | | | 968 | | | | 728 | | | | 580 | |
Materials | | | 243 | | | | 214 | | | | 217 | |
Equipment rents | | | 209 | | | | 206 | | | | 226 | |
Depreciation and amortization | | | 490 | | | | 489 | | | | 483 | |
Purchased services and other | | | 874 | | | | 797 | | | | 783 | |
Gain on sales of significant properties (Note 3) | | | – | | | | – | | | | (79 | ) |
Loss on termination of lease with shortline railway (Note 5) | | | – | | | | – | | | | 55 | |
| | | | | | | | | | | | | |
Total operating expenses | | | 4,210 | | | | 3,865 | | | | 3,572 | |
| | | | | | | | | | | | | |
Operating income | | | 967 | | | | 1,116 | | | | 830 | |
Gain on sale of partnership interest (Note 4) | | | – | | | | – | | | | 81 | |
Less: | | | | | | | | | | | | |
Other income and charges (Note 6) | | | 18 | | | | (12 | ) | | | 12 | |
Net interest expense (Note 7) | | | 252 | | | | 257 | | | | 268 | |
| | | | | | | | | | | | | |
Income before income tax expense | | | 697 | | | | 871 | | | | 631 | |
Income tax expense (Note 8) | | | 127 | | | | 220 | | | | 81 | |
| | | | | | | | | | | | | |
Net income | | $ | 570 | | | $ | 651 | | | $ | 550 | |
| | | | | | | | | | | | | |
Earnings per share (Note 9) | | | | | | | | | | | | |
Basic earnings per share | | $ | 3.37 | | | $ | 3.86 | | | $ | 3.31 | |
Diluted earnings per share | | $ | 3.34 | | | $ | 3.85 | | | $ | 3.30 | |
| | | | | | | | | | | | | |
Weighted-average number of shares (millions) | | | | | | | | | | | | |
Basic | | | 169.5 | | | | 168.8 | | | | 166.3 | |
Diluted | | | 170.6 | | | | 169.2 | | | | 166.8 | |
| | | | | | | | | | | | | |
Dividends declared per share | | $ | 1.1700 | | | $ | 1.0575 | | | $ | 0.9900 | |
| | | | | | | | | | | | | |
See Notes to Consolidated Financial Statements.
CANADIAN PACIFIC RAILWAY LIMITED
CONSOLIDATED STATEMENTS OF COMPREHENSIVE INCOME
| | | | | | | | | | | | |
| Year ended December 31 (in millions of Canadian dollars) | | 2011 | | | 2010 | | | 2009 | |
| | | | | | | | | | | | | |
Net income | | $ | 570 | | | $ | 651 | | | $ | 550 | |
Net gain in foreign currency translation adjustments, net of hedging activities | | | – | | | | 18 | | | | 3 | |
Change in derivatives designated as cash flow hedges | | | (7 | ) | | | 2 | | | | 7 | |
Change in pension and post-retirement defined benefit plans | | | (883 | ) | | | (460 | ) | | | (662 | ) |
| | | | | | | | | | | | | |
Other comprehensive loss before income taxes | | | (890 | ) | | | (440 | ) | | | (652 | ) |
Income tax recovery | | | 240 | | | | 99 | | | | 132 | |
| | | | | | | | | | | | | |
Other comprehensive loss (Note 10) | | | (650 | ) | | | (341 | ) | | | (520 | ) |
| | | | | | | | | | | | | |
Comprehensive (loss) income | | $ | (80 | ) | | $ | 310 | | | $ | 30 | |
| | | | | | | | | | | | | |
See Notes to Consolidated Financial Statements.
CANADIAN PACIFIC RAILWAY LIMITED
CONSOLIDATED BALANCE SHEETS
| | | | | | | | |
| As at December 31 (in millions of Canadian dollars) | | 2011 | | | 2010 | |
| | | | | | | | | |
| | |
Assets | | | | | | | | |
Current assets | | | | | | | | |
Cash and cash equivalents (Note 12) | | $ | 47 | | | $ | 361 | |
Accounts receivable, net (Note 13) | | | 518 | | | | 459 | |
Materials and supplies | | | 138 | | | | 114 | |
Deferred income taxes (Note 8) | | | 101 | | | | 222 | |
Other current assets | | | 52 | | | | 48 | |
| | | | | | | | | |
| | | 856 | | | | 1,204 | |
Investments (Note 14) | | | 167 | | | | 145 | |
Net properties (Note 15) | | | 12,752 | | | | 11,997 | |
Goodwill and intangible assets (Note 17) | | | 192 | | | | 190 | |
Other assets (Note 18) | | | 143 | | | | 140 | |
| | | | | | | | | |
Total assets | | $ | 14,110 | | | $ | 13,676 | |
| | | | | | | | | |
Liabilities and shareholders’ equity | | | | | | | | |
Current liabilities | | | | | | | | |
Short-term borrowing (Note 29) | | $ | 27 | | | $ | – | |
Accounts payable and accrued liabilities (Note 19) | | | 1,133 | | | | 1,008 | |
Long-term debt maturing within one year (Note 20) | | | 50 | | | | 282 | |
| | | | | | | | | |
| | | 1,210 | | | | 1,290 | |
Pension and other benefit liabilities (Note 26) | | | 1,372 | | | | 1,116 | |
Other long-term liabilities (Note 22) | | | 365 | | | | 468 | |
Long-term debt (Note 20) | | | 4,695 | | | | 4,033 | |
Deferred income taxes (Note 8) | | | 1,819 | | | | 1,945 | |
| | | | | | | | | |
Total liabilities | | | 9,461 | | | | 8,852 | |
| | | | | | | | | |
Shareholders’ equity | | | | | | | | |
Share capital (Note 25) | | | 1,854 | | | | 1,813 | |
Authorized unlimited common shares without par value. Issued and outstanding are 170.0 million and 169.2 million at December 31, 2011 and 2010, respectively. | | | | | | | | |
Authorized unlimited number of first and second preferred shares; none outstanding. | | | | | | | | |
Additional paid-in capital | | | 86 | | | | 24 | |
Accumulated other comprehensive loss (Note 10) | | | (2,736 | ) | | | (2,086 | ) |
Retained earnings | | | 5,445 | | | | 5,073 | |
| | | | | | | | | |
| | | 4,649 | | | | 4,824 | |
| | | | | | | | | |
Total liabilities and shareholders’ equity | | $ | 14,110 | | | $ | 13,676 | |
| | | | | | | | | |
Commitments and contingencies (Note 29)
See Notes to Consolidated Financial Statements.
| | | | |
| Approved on behalf of the Board: | | | |  |
| | J.E. Cleghorn, Director, Chairman of the Board | | R. C. Kelly, Director, Chairman of Audit, Finance and Risk Committee |
CANADIAN PACIFIC RAILWAY LIMITED
CONSOLIDATED STATEMENTS OF CASH FLOWS
| | | | | | | | | | | | |
| Year ended December 31 (in millions of Canadian dollars) | | 2011 | | | 2010 | | | 2009 | |
| | | | | | | | | | | | | |
| | | |
Operating activities | | | | | | | | | | | | |
Net income | | $ | 570 | | | $ | 651 | | | $ | 550 | |
Reconciliation of net income to cash provided by operating activities: | | | | | | | | | | | | |
Depreciation and amortization | | | 490 | | | | 489 | | | | 483 | |
Deferred income taxes (Note 8) | | | 187 | | | | 211 | | | | 133 | |
Gain on sale of partnership interest (Note 4) | | | – | | | | – | | | | (81 | ) |
Gain on sales of significant properties (Note 3) | | | – | | | | – | | | | (79 | ) |
Pension funding in excess of expense (Note 26) | | | (647 | ) | | | (801 | ) | | | (572 | ) |
Other operating activities, net | | | (112 | ) | | | (32 | ) | | | (86 | ) |
Change in non-cash working capital balances related to operations (Note 11) | | | 24 | | | | (16 | ) | | | 103 | |
| | | | | | | | | | | | | |
Cash provided by operating activities | | | 512 | | | | 502 | | | | 451 | |
| | | | | | | | | | | | | |
Investing activities | | | | | | | | | | | | |
Additions to properties (Note 15) | | | (1,104 | ) | | | (726 | ) | | | (703 | ) |
Proceeds from sale of properties and other assets | | | 71 | | | | 89 | | | | 337 | |
Other | | | (11 | ) | | | 2 | | | | 7 | |
| | | | | | | | | | | | | |
Cash used in investing activities | | | (1,044 | ) | | | (635 | ) | | | (359 | ) |
| | | | | | | | | | | | | |
Financing activities | | | | | | | | | | | | |
Dividends paid | | | (193 | ) | | | (174 | ) | | | (163 | ) |
Issuance of common shares (Note 25) | | | 29 | | | | 32 | | | | 514 | |
Collection of receivable from financial institution (Note 13) | | | – | | | | 220 | | | | – | |
Issuance of long-term debt (Note 20) | | | 757 | | | | 355 | | | | 873 | |
Repayment of long-term debt | | | (401 | ) | | | (613 | ) | | | (618 | ) |
Net increase (decrease) in short-term borrowing | | | 28 | | | | 9 | | | | (150 | ) |
Other | | | (3 | ) | | | 3 | | | | 34 | |
| | | | | | | | | | | | | |
Cash provided by (used in) financing activities | | | 217 | | | | (168 | ) | | | 490 | |
| | | | | | | | | | | | | |
Effect of foreign currency fluctuations on U.S. dollar-denominated cash and cash equivalents | | | 1 | | | | (17 | ) | | | (20 | ) |
| | | | | | | | | | | | | |
Cash position | | | | | | | | | | | | |
(Decrease) increase in cash and cash equivalents | | | (314 | ) | | | (318 | ) | | | 562 | |
Cash and cash equivalents at beginning of year | | | 361 | | | | 679 | | | | 117 | |
| | | | | | | | | | | | | |
Cash and cash equivalents at end of year (Note 12) | | $ | 47 | | | $ | 361 | | | $ | 679 | |
| | | | | | | | | | | | | |
Supplemental disclosures of cash flow information: | | | | | | | | | | | | |
| | | | | | | | | | | | | |
Income taxes paid (refunded) | | $ | 4 | | | $ | 8 | | | $ | (39 | ) |
Interest paid | | $ | 271 | | | $ | 347 | | | $ | 289 | |
| | | | | | | | | | | | | |
See Notes to Consolidated Financial Statements.
CANADIAN PACIFIC RAILWAY LIMITED
CONSOLIDATED STATEMENTS OF CHANGES IN SHAREHOLDERS’ EQUITY
| | | | | | | | | | | | | | | | | | | | |
| (in millions of Canadian dollars) | | Share
capital | | | Additional
paid-in
capital | | | Accumulated
other
comprehensive
loss | | | Retained
earnings | | | Total
shareholders’
equity | |
| | | | | | | | | | | | | | | | | | | | | |
| | | | | |
Balance at December 31, 2008 | | $ | 1,242 | | | $ | 41 | | | $ | (1,225 | ) | | $ | 4,217 | | | $ | 4,275 | |
Net income | | | – | | | | – | | | | – | | | | 550 | | | | 550 | |
Other comprehensive loss (Note 10) | | | – | | | | – | | | | (520 | ) | | | – | | | | (520 | ) |
Dividends declared | | | – | | | | – | | | | – | | | | (166 | ) | | | (166 | ) |
Shares issued (Note 25) | | | 495 | | | | – | | | | – | | | | – | | | | 495 | |
Effect of stock-based compensation recovery | | | – | | | | (2 | ) | | | – | | | | – | | | | (2 | ) |
Shares issued under stock option plans (Note 25) | | | 34 | | | | (8 | ) | | | – | | | | – | | | | 26 | |
| | | | | | | | | | | | | | | | | | | | | |
Balance at December 31, 2009 | | | 1,771 | | | | 31 | | | | (1,745 | ) | | | 4,601 | | | | 4,658 | |
Net income | | | – | | | | – | | | | – | | | | 651 | | | | 651 | |
Other comprehensive loss (Note 10) | | | – | | | | – | | | | (341 | ) | | | – | | | | (341 | ) |
Dividends declared | | | – | | | | – | | | | – | | | | (179 | ) | | | (179 | ) |
Effect of stock-based compensation expense | | | – | | | | 1 | | | | – | | | | – | | | | 1 | |
Shares issued under stock option plans (Note 25) | | | 42 | | | | (8 | ) | | | – | | | | – | | | | 34 | |
| | | | | | | | | | | | | | | | | | | | | |
Balance at December 31, 2010 | | | 1,813 | | | | 24 | | | | (2,086 | ) | | | 5,073 | | | | 4,824 | |
Net income | | | – | | | | – | | | | – | | | | 570 | | | | 570 | |
Other comprehensive loss (Note 10) | | | – | | | | – | | | | (650 | ) | | | – | | | | (650 | ) |
Dividends declared | | | – | | | | – | | | | – | | | | (198 | ) | | | (198 | ) |
Effect of stock-based compensation expense | | | – | | | | 16 | | | | – | | | | – | | | | 16 | |
Change to stock compensation awards (Note 27) | | | – | | | | 57 | | | | – | | | | – | | | | 57 | |
Shares issued under stock option plans (Note 25) | | | 41 | | | | (11 | ) | | | – | | | | – | | | | 30 | |
| | | | | | | | | | | | | | | | | | | | | |
Balance at December 31, 2011 | | $ | 1,854 | | | $ | 86 | | | $ | (2,736 | ) | | $ | 5,445 | | | $ | 4,649 | |
| | | | | | | | | | | | | | | | | | | | | |
See Notes to Consolidated Financial Statements.
CANADIAN PACIFIC RAILWAY LIMITED
NOTES TO CONSOLIDATED FINANCIAL STATEMENTS
Nature Of OperationsCanadian Pacific Railway Limited (“CPRL”), through its subsidiaries (collectively referred to as “CP” or “the Company”), operates a transcontinental railway in Canada and the United States. CP provides rail and intermodal transportation services over a network of approximately 14,700 miles, serving the principal business centres of Canada from Montreal, Quebec, to Vancouver, British Columbia, and the U.S. Northeast and Midwest regions. CP’s railway network feeds directly into the U.S. heartland from the East and West coasts. Agreements with other carriers extend the Company’s market reach east of Montreal in Canada, throughout the U.S. and into Mexico. CP transports bulk commodities, merchandise freight and intermodal traffic. Bulk commodities include grain, coal, sulphur and fertilizers. Merchandise freight consists of finished vehicles and automotive parts, as well as forest and industrial and consumer products. Intermodal traffic consists largely of retail goods in overseas containers that can be transported by train, ship and truck, and in domestic containers and trailers that can be moved by train and truck.
1 Summary of significant accounting policies
U.S. Generally accepted accounting principles (“GAAP”)
These consolidated financial statements are expressed in Canadian dollars and have been prepared in accordance with GAAP as codified in the Financial Accounting Standards Board (“FASB”) Accounting Standards Codification.
Principles of consolidation
These consolidated financial statements include the accounts of CP and all of its subsidiaries. The Company’s investments in which it has significant influence are accounted for using the equity method. All intercompany accounts and transactions have been eliminated.
Use of estimates
The preparation of these consolidated financial statements in conformity with GAAP requires management to make estimates and assumptions that affect the reported amounts of revenues and expenses during the period, the reported amounts of assets and liabilities, and the disclosure of contingent assets and liabilities at the date of the financial statements. Management regularly reviews its estimates, including those related to investments, restructuring and environmental liabilities, pensions and other benefits, depreciable lives of properties and intangible assets, goodwill, stock-based compensation, deferred income tax assets and liabilities, as well as legal and personal injury liabilities based upon currently available information. Actual results could differ from these estimates.
Principal subsidiaries
The following list sets out CPRL’s principal railway operating subsidiaries, including the jurisdiction of incorporation. All of these subsidiaries are wholly owned, directly or indirectly, by CPRL as of December 31, 2011.
| | | | |
Principal subsidiary | |
| Incorporated under
the laws of |
|
| | | | | |
Canadian Pacific Railway Company | | | Canada | |
Soo Line Railroad Company (“Soo Line”) | | | Minnesota | |
Delaware and Hudson Railway Company, Inc. (“D&H”) | | | Delaware | |
Dakota, Minnesota & Eastern Railroad Corporation (“DM&E”) | | | Delaware | |
Mount Stephen Properties Inc. (“MSP”) | | | Canada | |
| | | | | |
Revenue recognition
Railway freight revenues are recognized based on the percentage of completed service method. The allocation of revenue between reporting periods is based on the relative transit time in each reporting period with expenses recognized as incurred. Volume rebates to customers are accrued as a reduction of freight revenues based on estimated volume and contract terms as freight service is provided. Other revenue, including passenger revenue, revenue from leasing certain assets and switching fees, is recognized as service is performed or contractual obligations are met. Revenues are presented net of taxes collected from customers and remitted to government authorities.
Cash and cash equivalents
Cash and cash equivalents includes highly-liquid short-term investments that are readily convertible to cash with original maturities of three months or less.
Foreign currency translation
Assets and liabilities denominated in foreign currencies, other than those held through foreign subsidiaries, are translated into Canadian dollars at the year-end exchange rate for monetary items and at the historical exchange rates for non-monetary items. Foreign currency revenues and expenses are translated at the exchange rate in effect on the dates of the related transactions. Foreign currency gains and losses, other than those arising from the translation of the Company’s net investment in foreign subsidiaries, are included in income.
The accounts of the Company’s foreign subsidiaries are translated into Canadian dollars using the year-end exchange rate for assets and liabilities and the average exchange rates during the year for revenues, expenses, gains and losses. Exchange gains and losses arising from translation of these foreign subsidiaries’ accounts are included in “Other comprehensive loss”. The majority of U.S. dollar-denominated long-term debt has been designated as a hedge of the net investment in foreign subsidiaries. As a result, unrealized foreign exchange (“FX”) gains and losses on this U.S. dollar-denominated long-term debt are offset against foreign exchange gains and losses arising from translation of foreign subsidiaries’ accounts in “Other comprehensive loss”.
Pensions and other benefits
Pension costs are actuarially determined using the projected-benefit method prorated over the credited service periods of employees. This method incorporates management��s best estimates of expected plan investment performance, salary escalation and retirement ages of employees. The expected return on fund assets is calculated using market-related asset values developed from a five-year average of market values for the fund’s public equity securities (with each prior year’s market value adjusted to the current date for assumed investment income during the intervening period) plus the market value of the fund’s fixed income, real estate and infrastructure securities, subject to the market-related asset value not being greater than 120% of the market value nor being less than 80% of the market value. The discount rate used to determine the projected benefit obligation is based on blended market interest rates on high-quality corporate debt instruments with matching cash flows. Unrecognized actuarial gains and losses in excess of 10% of the greater of the benefit obligation and the market-related value of plan assets are amortized over the expected average remaining service period of active employees expected to receive benefits under the plan (approximately 10 years). Prior service costs arising from collectively bargained amendments to pension plan benefit provisions are amortized over the term of the applicable union agreement. Prior service costs arising from all other sources are amortized over the expected average remaining service period of active employees who are expected to receive benefits under the plan at the date of amendment.
Costs for post-retirement and post-employment benefits other than pensions, including post-retirement health care and life insurance and some workers’ compensation and long-term disability benefits in Canada, are actuarially determined and accrued on a basis similar to pension costs.
The over or under funded status of defined benefit pension and other post-retirement benefit plans are recognized on the balance sheet. The over or under funded status is measured as the difference between the fair value of the plan assets and the benefit obligation. In addition, any unrecognized actuarial gains and losses and prior service costs and credits that arise during the period are recognized as a component of “Other comprehensive loss”, net of tax.
Gains and losses on post-employment benefits that do not vest or accumulate, including some workers’ compensation and long-term disability benefits in Canada, are included immediately in income as “Compensation and benefits”.
Materials and supplies
Materials and supplies are carried at the lower of average cost and market.
Properties
Fixed asset additions and major renewals are recorded at cost, including direct costs, attributable indirect costs and carrying costs, less accumulated depreciation and any impairments. When there is a legal obligation associated with the retirement of property, plant and equipment, a liability is initially recognized at its fair value and a corresponding asset retirement cost is added to the gross book value of the related asset and amortized to expense over the estimated term to retirement. The Company reviews the carrying amounts of its properties whenever changes in circumstances indicate that such carrying amounts may not be recoverable based on future undiscounted cash flows. When such properties are determined to be impaired, recorded asset values are revised to the fair value.
The Company recognizes expenditures as additions to properties or operating expenses based on whether the expenditures increase the output or service capacity, lower the associated operating costs or extend the useful life of the properties and whether the expenditures exceed minimum physical and financial thresholds.
Much of the additions to properties, both new and replacement properties, are self-constructed. These are initially recorded at cost, including direct costs and attributable indirect costs, overheads and carrying costs. Direct costs include, among other things, labour costs, purchased services, equipment costs and material costs. Attributable indirect costs and overheads include incremental long-term variable costs resulting from the execution of capital projects. Indirect costs include largely local crew facilities, highway vehicles, work trains and area management costs. Overheads primarily include a portion of the cost of the Company’s engineering department which plans, designs and administers these capital projects. These costs are allocated to projects by applying a measure consistent with the nature of the cost based on cost studies. For replacement properties, dismantling work is performed concurrently with the installation, the project costs are allocated to dismantling and installation based on cost studies.
Ballast programs including undercutting, shoulder ballasting and renewal programs which form part of the annual track program are capitalized as this work, and the related added ballast material, significantly improves drainage which in turn extends the life of ties and other track materials. These costs are tracked separately from the underlying assets and depreciated over the period to the next estimated similar ballast program. Spot replacement of ballast is considered a repair which is expensed as incurred.
The cost of large refurbishments are capitalized and locomotive overhauls are expensed as incurred.
The Company capitalizes development costs for major new computer systems.
The Company follows group depreciation which groups assets which are similar in nature and have similar economic lives. The property groups are depreciated based on their expected economic lives determined by studies of historical retirements of properties in the group and engineering estimates of changes in current operations and of technological advances. Actual use and retirement of assets may vary from current estimates, which would impact the amount of depreciation expense recognized in future periods.
When depreciable property is retired or otherwise disposed of in the normal course of business, the book value, less net salvage proceeds, is charged to accumulated depreciation and if different than the assumptions under the depreciation study could potentially result in adjusted depreciation expense over a period of years. However, when removal costs exceed the salvage value on assets and the Company had no legal obligation to remove the assets, the removal costs incurred are charged to income in the period in which the assets are removed and are not charged to accumulated depreciation.
For the sale or retirement of larger groups of depreciable assets that are unusual and were not considered in depreciation studies, CP records a gain or loss for the difference between net proceeds and net book value of the assets sold or retired.
Depreciation is calculated on the straight-line basis at rates based on the estimated service life, taking into consideration the projected annual usage of depreciable property, except for rail and other track material in the U.S., which is based directly on usage.
Equipment under capital lease is included in properties and depreciated over the period of expected use.
Assets held for sale
Assets to be disposed that meet the held for sale criteria are reported at the lower of their carrying amount and fair value, less costs to sell, and are no longer depreciated.
Goodwill and intangible assets
Goodwill represents the excess of the purchase price over the fair value of identifiable net assets upon acquisition of a business. Goodwill is assigned to the reporting units that are expected to benefit from the business acquisition which, after integration of operations with the railway network, may be different than the acquired business.
The carrying value of goodwill, which is not amortized, is assessed for impairment annually in the fourth quarter of each year, or more frequently as economic events dictate. The fair value of the reporting unit is compared to its carrying value, including goodwill. If the fair value of the reporting unit is less than its carrying value goodwill is potentially impaired. The impairment charge that would be recognized is the excess of the carrying value of the goodwill over the fair value of the goodwill, determined in the same manner as in a business combination.
Intangible assets with finite lives are amortized on a straight-line basis over the estimated useful lives of the respective assets. The option to expand the track network has an amortization period of 100 years. Favourable leases, customer relationships and interline contracts have amortization periods ranging from four to 20 years. When there is a change in the estimated useful life of an intangible asset with a finite life, amortization is adjusted prospectively.
Financial instruments
Financial instruments are contracts that give rise to a financial asset of one party and a financial liability or equity instrument of another party.
Financial instruments are recognized initially at fair value, which is the amount of consideration that would be agreed upon in an arm’s length transaction between willing parties.
Subsequent measurement depends on how the financial instrument has been classified. Accounts receivable and investments, classified as loans and receivables, are measured at amortized cost, using the effective interest method. Certain equity investments, classified as available for sale, are recognized at cost as fair value cannot be reliably established. Cash and cash equivalents and long-term floating rate notes are classified as held for trading and are measured at fair value. Accounts payable, accrued liabilities, short-term borrowings, dividends payable, other long-term liabilities and long-term debt, classified as financial liabilities, are also measured at amortized cost.
Derivative financial instruments
Derivative financial and commodity instruments may be used from time to time by the Company to manage its exposure to risks relating to foreign currency exchange rates, stock-based compensation, interest rates and fuel prices. When CP utilizes derivative instruments in hedging relationships, CP identifies, designates and documents those hedging transactions and regularly tests the transactions to demonstrate effectiveness in order to continue hedge accounting.
All derivative instruments are classified as held for trading and recorded at their fair value. Any change in the fair value of derivatives not designated as hedges is recognized in the period in which the change occurs in the Consolidated Statement of Income in the line item to which the derivative instrument is related. On the Consolidated Balance Sheet they are classified in “Other assets”, “Other long-term liabilities” and “Other current assets” or “Accounts payable and accrued liabilities” as applicable. Gains and losses arising from derivative instruments affect the following income statement lines: “Revenues”, “Compensation and benefits”, “Fuel”, “Other income and charges”, and “Net interest expense”.
For fair value hedges, the periodic change in value is recognized in income, on the same line as the changes in values of the hedged items are also recorded. For a cash flow hedge, the change in value of the effective portion is recognized in “Other comprehensive loss”. Any ineffectiveness within an effective cash flow hedge is recognized in income as it arises in the same income account as the hedged item. Should a cash flow hedge relationship become ineffective, previously unrealized gains and losses remain within “Accumulated other comprehensive loss” until the hedged item is settled and, prospectively, future changes in value of the derivative are recognized in income. The change in value of the effective portion of a cash flow hedge remains in “Accumulated other comprehensive loss” until the related hedged item settles, at which time amounts recognized in “Accumulated other comprehensive loss” are reclassified to the same income or balance sheet account that records the hedged item.
In the Consolidated Statement of Cash Flows, cash flows relating to derivative instruments designated as hedges are included in the same line as the related hedged item.
The Company from time to time enters into foreign exchange forward contracts to hedge anticipated sales in U.S. dollars, the related accounts receivable and future capital acquisitions. Foreign exchange translation gains and losses on foreign currency-denominated derivative financial instruments used to hedge anticipated U.S. dollar-denominated sales are recognized as an adjustment of the revenues when the sale is recorded. Those used to hedge future capital acquisitions are recognized as an adjustment of the property amount when the acquisition is recorded.
The Company also occasionally enters into foreign exchange forward contracts as part of its short-term cash management strategy. These contracts are not designated as hedges due to their short-term nature and are carried on the Consolidated Balance Sheet at fair value. Changes in fair value are recognized in income in the period in which the change occurs.
The Company enters into interest rate swaps to manage the risk related to interest rate fluctuations. These swap agreements require the periodic exchange of payments without the exchange of the principal amount on which the payments are based. Interest expense on the debt is adjusted to include the payments owing or receivable under the interest rate swaps.
The Company from time to time enters into bond forwards to fix interest rates for anticipated issuances of debt. These agreements are usually accounted for as cash flow hedges with gains and losses recorded in “Accumulated other comprehensive loss” and amortized to “Net interest expense” in the period that interest on the related debt is charged.
The Company has a fuel-hedging program under which CP acquires crude oil and/or diesel future contracts for a portion of its diesel fuel purchases to reduce the risk of price volatility affecting future cash flows. These agreements are usually accounted for as cash flow hedges, however, on occasion derivatives of a short-term duration may not be designated as a hedge for accounting purposes. The gains or losses on the hedge contracts are applied against the corresponding fuel purchases in the period during which the hedging contracts mature.
The Company entered into derivatives called Total Return Swaps (“TRS”) to mitigate fluctuations in tandem share appreciation rights (“TSAR”), deferred share units (“DSU”) and restricted share units (“RSU”). These are not designated as hedges and are recorded at market value with the offsetting gain or loss reflected in “Compensation and benefits”.
Restructuring accrual
Restructuring liabilities are recorded at their present value. The discount related to liabilities is amortized to “Compensation and benefits” over the payment period. Provisions for labour restructuring are recorded in “Other long-term liabilities”, except for the current portion, which is recorded in “Accounts payable and accrued liabilities”.
Environmental remediation
Environmental remediation accruals, recorded on an undiscounted basis, cover site-specific remediation programs. Provisions for environmental remediation costs are recorded in “Other long-term liabilities”, except for the current portion, which is recorded in “Accounts payable and accrued liabilities”.
Income taxes
The Company follows the liability method of accounting for income taxes. Deferred income tax assets and liabilities are determined based on differences between the financial reporting and tax bases of assets and liabilities using enacted tax rates and laws that will be in effect when the differences are expected to reverse. The effect of a change in income tax rates on deferred income tax assets and liabilities is recognized in income in the period during which the change occurs.
When appropriate, the Company records a valuation allowance against deferred tax assets to reflect that these tax assets may not be realized. In determining whether a valuation allowance is appropriate, we consider whether it is more likely than not that all or some portion of our deferred tax assets will not be realized, based on management’s judgments using available evidence about future events.
At times, tax benefit claims may be challenged by a tax authority. Tax benefits are recognized only for tax positions that are more likely than not sustainable upon examination by tax authorities. The amount recognized is measured as the largest amount of benefit that is greater than 50 percent likely to be realized upon settlement. A liability for “unrecognized tax benefits” is recorded for any tax benefits claimed in our tax returns that do not meet these recognition and measurement standards.
Investment and other similar tax credits are deferred on the Consolidated Balance Sheet and amortized to “Income tax expense” as the related asset is recognized in income.
Earnings per share
Basic earnings per share are calculated using the weighted-average number of Common Shares outstanding during the year. Diluted earnings per share are calculated using the treasury stock method for determining the dilutive effect of options.
Stock-based compensation
CP follows the fair value based approach to account for stock options. Compensation expense and an increase in additional paid-in capital are recognized for stock options over their vesting period, or over the period from the grant date to the date employees become eligible to retire when this is shorter than the vesting period, based on their estimated fair values on the grant date, as determined using the Black-Scholes option-pricing model.
With the granting of regular stock options, some employees have been simultaneously granted share appreciation rights, which provide the employee the choice to either exercise the stock option for shares, or to exercise the TSAR and thereby receive the intrinsic value of the stock option in cash. Options with TSARs are awards that may call for settlement in cash and, therefore, are recorded as liabilities. CP follows the fair value based approach, as determined by the Black-Scholes option pricing model, to account for the TSAR liability. The liability is fair valued and changes in the liability are recorded in “Compensation and benefits” over the vesting period, or over the period from the grant date to the date employees become eligible to retire when this is shorter than the vesting period, until exercised. If an employee chooses to exercise the option, thereby cancelling the TSAR, both the exercise price and the liability are settled to “Share capital”.
Forfeitures of options and tandem options are estimated at issuance and subsequently at the balance sheet date.
Any consideration paid by employees on exercise of stock options is credited to share capital when the option is exercised and the recorded fair value of the option is removed from additional paid-in capital and credited to share capital.
Compensation expense is also recognized for TSARs, DSUs, performance share units (“PSUs”) and RSUs using the fair value method. Forfeitures of TSARs, DSUs, PSUs and RSUs are estimated at issuance and subsequently at the balance sheet date.
The employee share purchase plan (“ESPP”) gives rise to compensation expense that is recognized using the issue price, by amortizing the cost over the vesting period or over the period from the grant date to the date employees become eligible to retire when this is shorter than the vesting period.
2 Accounting changes
Fair value measurement and disclosure
In January 2010, the FASB amended the disclosure requirements related to fair value measurements. Most of the new disclosures and clarifications of existing disclosures were effective for interim and annual reporting periods beginning after December 15, 2009, except for the expanded disclosures in the Level 3 reconciliation, which are effective for fiscal years beginning after December 15, 2010. The Company has adopted this guidance resulting in expanded note disclosure inNote 21.
Future accounting changes
Fair value measurement
In May 2011, the FASB issued amended guidance on fair value measurement which updates some of the measurement guidance and includes enhanced disclosure requirements. The amended guidance is effective for interim and annual periods beginning after December 15, 2011. Adoption is not expected to have a material impact on the results of operations or financial position but increased quantitative and qualitative disclosure regarding Level 3 measurements is expected.
Other comprehensive income
In June 2011, the FASB issued an accounting standard update on thePresentation of Comprehensive Income, which eliminates the current option to report other comprehensive income and its components in the Consolidated Statement of Changes in Shareholders’ Equity. The Company can elect to present items of net income and other comprehensive income in one continuous statement or in two separate, but consecutive, statements. The Company intends to present two separate but consecutive statements. In December 2011, the FASB deferred the guidance related to the
presentation of reclassification adjustments. As the new guidance does not change those components that are recognized in net income or those components that are recognized in other comprehensive income, adoption is not expected to have a material impact on the results of operations and financial position. The guidance must be applied retrospectively for all periods presented in the financial statements and becomes effective for interim and annual periods beginning after December 15, 2011.
Intangibles – goodwill and other
In September 2011, the FASB issued amended guidance on the testing of goodwill for impairment. The amendments allow an entity to first assess qualitative factors to determine whether it is necessary to perform the two-step quantitative goodwill impairment test. Under these amendments, an entity would not be required to calculate the fair value of a reporting unit unless the entity determines, based on a qualitative assessment, that it is more likely than not that its fair value is less than its carrying amount. The amended guidance is effective for annual and interim goodwill impairment tests performed for fiscal years beginning after December 15, 2011. Adoption is expected to impact the goodwill impairment testing process but not the results of operations or financial position of the Company.
3 Gain on sales of significant properties
During 2009, the Company completed two significant real estate sales, including Windsor Station and land in western Canada, resulting in gains of $79 million ($68 million after tax).
The Company sold Windsor Station, in Montreal, for proceeds of $80 million, including the assumption of a mortgage of $16 million that was settled in 2011. CP will continue to occupy a portion of Windsor Station through a lease for a 10-year period after the sale. As a result, part of the transaction is considered to be a sale-leaseback and consequently a gain of $20 million related to this part of the transaction has been deferred and is being amortized over the remainder of the lease term.
The Company sold land in western Canada for transit purposes for proceeds of $43 million.
4 Gain on sale of partnership interest
During 2009, the Company completed a sale of a portion of its investment in the Detroit River Tunnel Partnership (“DRTP”) to its existing partner, reducing the Company’s ownership from 50% to 16.5%. The proceeds received from the transaction were $110 million. Additional proceeds of approximately $22 million are contingent on achieving certain future freight volumes through the tunnel, and have not been recognized. The gain on this transaction was $81 million ($69 million after tax).
5 Loss on termination of lease with shortline railway
During 2009, the Company made a payment of approximately $73 million to terminate a contract with a lessee in order to cease through-train operations over the CP owned rail branchline between Smiths Falls, Ontario and Sudbury, Ontario including a settlement of a $21 million existing liability. The contract with the lessee provided for the operation of a minimum number of CP freight trains over the leased branchline. The loss on the transaction was $55 million ($38 million after tax).
6 Other income and charges
| | | | | | | | | | | | |
| (in millions of Canadian dollars) | | 2011 | | | 2010 | | | 2009 | |
| | | | | | | | | | | | | |
Accretion income on long-term floating rate notes(Note 21) | | $ | (5 | ) | | $ | (6 | ) | | $ | (3 | ) |
Gain in fair value of long-term floating rate notes(Note 21) | | | (10 | ) | | | (3 | ) | | | (6 | ) |
Net loss on repurchase of debt(Note 20) | | | 10 | | | | – | | | | 17 | |
Other foreign exchange losses (gains) | | | 3 | | | | (10 | ) | | | (1 | ) |
Foreign exchange loss (gain) on long-term debt | | | 3 | | | | (2 | ) | | | (4 | ) |
Advisory fees | | | 6 | | | | – | | | | – | |
Other | | | 11 | | | | 9 | | | | 9 | |
| | | | | | | | | | | | | |
Total other income and charges | | $ | 18 | | | $ | (12 | ) | | $ | 12 | |
| | | | | | | | | | | | | |
7 Net interest expense
| | | | | | | | | | | | |
| (in millions of Canadian dollars) | | 2011 | | | 2010 | | | 2009 | |
| | | | | | | | | | | | | |
Interest cost | | $ | 266 | | | $ | 288 | | | $ | 305 | |
Interest capitalized to net properties | | | (11 | ) | | | (20 | ) | | | (19 | ) |
| | | | | | | | | | | | | |
Interest expense | | | 255 | | | | 268 | | | | 286 | |
Interest income | | | (3 | ) | | | (11 | ) | | | (18 | ) |
| | | | | | | | | | | | | |
Net interest expense | | $ | 252 | | | $ | 257 | | | $ | 268 | |
| | | | | | | | | | | | | |
Interest expense includes interest on capital leases of $19 million for the year ended December 31, 2011 (2010 – $22 million; 2009 – $27 million).
8 Income taxes
The following is a summary of the major components of the Company’s income tax expense:
| | | | | | | | | | | | |
| (in millions of Canadian dollars) | | 2011 | | | 2010 | | | 2009 | |
| | | | | | | | | | | | | |
Current income tax (recovery) expense(1) | | $ | (60 | ) | | $ | 9 | | | $ | (52 | ) |
| | | | | | | | | | | | | |
Deferred income tax expense | | | | | | | | | | | | |
Origination and reversal of temporary differences | | | 194 | | | | 244 | | | | 243 | |
Effect of tax rate decreases | | | – | | | | – | | | | (35 | ) |
Effect of hedge of net investment in foreign subsidiaries | | | 8 | | | | (18 | ) | | | (32 | ) |
Tax credits | | | (15 | ) | | | (16 | ) | | | (16 | ) |
Other | | | – | | | | 1 | | | | (27 | ) |
| | | | | | | | | | | | | |
Total deferred income tax expense | | | 187 | | | | 211 | | | | 133 | |
| | | | | | | | | | | | | |
Total income taxes | | $ | 127 | | | $ | 220 | | | $ | 81 | |
| | | | | | | | | | | | | |
Income before income tax expense | | | | | | | | | | | | |
Canada | | $ | 430 | | | $ | 577 | | | $ | 602 | |
Foreign | | | 267 | | | | 294 | | | | 29 | |
| | | | | | | | | | | | | |
Total income before income tax expense | | $ | 697 | | | $ | 871 | | | $ | 631 | |
| | | | | | | | | | | | | |
Income tax (recovery) expense | | | | | | | | | | | | |
Current | | | | | | | | | | | | |
Canada | | $ | (59 | ) | | $ | (1 | ) | | $ | (51 | ) |
Foreign | | | (1 | ) | | | 10 | | | | (1 | ) |
| | | | | | | | | | | | | |
Total current income tax (recovery) expense | | | (60 | ) | | | 9 | | | | (52 | ) |
| | | | | | | | | | | | | |
Deferred | | | | | | | | | | | | |
Canada | | | 115 | | | | 122 | | | | 81 | |
Foreign | | | 72 | | | | 89 | | | | 52 | |
| | | | | | | | | | | | | |
Total deferred income tax expense | | | 187 | | | | 211 | | | | 133 | |
| | | | | | | | | | | | | |
Total income taxes | | $ | 127 | | | $ | 220 | | | $ | 81 | |
| | | | | | | | | | | | | |
(1) Current income tax recovery in 2011 includes a reduction to the Company’s uncertain tax positions.
The provision for deferred income taxes arises from temporary differences in the carrying values of assets and liabilities for financial statement and income tax purposes and the effect of loss carry forwards. The items comprising the deferred income tax assets and liabilities are as follows:
| | | | | | | | |
| (in millions of Canadian dollars) | | 2011 | | | 2010 | |
| | | | | | | | | |
Deferred income tax assets | | | | | | | | |
Restructuring liability | | $ | 16 | | | $ | 22 | |
Amount related to tax losses carried forward | | | 377 | | | | 334 | |
Liabilities carrying value in excess of tax basis | | | 327 | | | | 267 | |
Future environmental remediation costs | | | 34 | | | | 38 | |
Tax credits carried forward including minimum tax | | | 116 | | | | 94 | |
Other | | | 57 | | | | 29 | |
| | | | | | | | | |
Total deferred income tax assets | | | 927 | | | | 784 | |
| | | | | | | | | |
Deferred income tax liabilities | | | | | | | | |
Properties carrying value in excess of tax basis | | | 2,608 | | | | 2,466 | |
Other long-term assets carrying value in excess of tax basis | | | 18 | | | | 18 | |
Other | | | 19 | | | | 23 | |
| | | | | | | | | |
Total deferred income tax liabilities | | | 2,645 | | | | 2,507 | |
| | | | | | | | | |
Total net deferred income tax liabilities | | | 1,718 | | | | 1,723 | |
Current deferred income tax assets | | | 101 | | | | 222 | |
| | | | | | | | | |
Long-term deferred income tax liabilities | | $ | 1,819 | | | $ | 1,945 | |
| | | | | | | | | |
The Company’s consolidated effective income tax rate differs from the expected statutory tax rates. Expected income tax expense at statutory rates is reconciled to income tax expense as follows:
| | | | | | | | | | | | |
| (in millions of Canadian dollars, except percentage) | | 2011 | | | 2010 | | | 2009 | |
| | | | | | | | | | | | | |
Statutory federal and provincial income tax rate | | | 28.75 | % | | | 29.15 | % | | | 30.71 | % |
| | | | | | | | | | | | | |
Expected income tax expense at Canadian enacted statutory tax rates | | $ | 200 | | | $ | 254 | | | $ | 194 | |
Increase (decrease) in taxes resulting from: | | | | | | | | | | | | |
Items not subject to tax | | | (3 | ) | | | (3 | ) | | | (25 | ) |
Canadian tax rate differentials | | | (8 | ) | | | (10 | ) | | | (26 | ) |
Foreign tax rate differentials | | | (4 | ) | | | – | | | | (7 | ) |
Effect of tax rate decreases | | | – | | | | – | | | | (35 | ) |
Tax credits | | | (15 | ) | | | (16 | ) | | | (16 | ) |
Other(1) | | | (43 | ) | | | (5 | ) | | | (4 | ) |
| | | | | | | | | | | | | |
Income tax expense | | $ | 127 | | | $ | 220 | | | $ | 81 | |
| | | | | | | | | | | | | |
(1) Substantially all amounts relate to uncertain tax positions in 2011.
The Company has no unrecognized tax benefits from capital losses at December 31, 2011 and 2010.
The Company has not provided a deferred liability for the income taxes, if any, which might become payable on any temporary difference associated with its foreign investments because the Company intends to indefinitely reinvest in its foreign investments and has no intention to realize this difference by a sale of its interest in foreign investments.
At December 31, 2011, the Company has income tax operating losses carried forward of $1,411 million, which have been recognized as a deferred tax asset. Certain of these losses carried forward will begin to expire in 2015, with the majority expiring between 2026 and 2031. The Company also has minimum tax credits of approximately $38 million that will begin to expire in 2016 as well as investment tax credits of $30 million, certain of which will begin to expire in 2018, and track maintenance credits of $48 million which will begin to expire in 2025.
It is more likely than not that the Company will realize the majority of its deferred income tax assets from the generation of future taxable income, as the payments for provisions, reserves and accruals are made and losses and tax credits carried forward are utilized.
The following table provides a reconciliation of uncertain tax positions in relation to unrecognized tax benefits for Canada and the United States for the year ended December 31, 2011:
| | | | | | | | | | | | |
| (in millions of Canadian dollars) | | 2011 | | | 2010 | | | 2009 | |
| | | | | | | | | | | | | |
Unrecognized tax benefits at January 1 | | $ | 60 | | | $ | 61 | | | $ | 77 | |
Increase in unrecognized: | | | | | | | | | | | | |
Tax benefits related to the current year | | | 3 | | | | 5 | | | | 14 | |
Gross uncertain tax benefits related to prior years | | | 1 | | | | 2 | | | | 11 | |
Dispositions: | | | | | | | | | | | | |
Gross uncertain tax benefits related to prior years | | | (45 | ) | | | (5 | ) | | | (15 | ) |
Settlements with tax authorities | | | – | | | | (3 | ) | | | (26 | ) |
| | | | | | | | | | | | | |
Unrecognized tax benefits as at December 31 | | $ | 19 | | | $ | 60 | | | $ | 61 | |
| | | | | | | | | | | | | |
If these uncertain tax positions were recognized, all of the amount of unrecognized tax positions as at December 31, 2011 would impact the Company’s effective tax rate.
The Company recognizes accrued interest and penalties related to unrecognized tax benefits as a component of income tax expense in the Company’s Consolidated Statement of Income. The total amount of accrued interest and penalties in 2011 was a credit of $15 million (2010 – credit of $7 million; 2009 – expense of $18 million). The total amount of accrued interest and penalties associated with the unrecognized tax benefit at December 31, 2011 was $5 million (2010 – $20 million; 2009 – $27 million).
The Company and its subsidiaries are subject to either Canadian federal and provincial income tax, U.S. federal, state and local income tax, or the relevant income tax in other international jurisdictions. The Company has substantially concluded all Canadian federal and provincial income tax matters for the years through 2008. The federal and provincial income tax returns filed for 2009 and subsequent years remain subject to examination by the taxation authorities.
All U.S. federal income tax returns and generally all U.S. state and local income tax returns are closed to 2006. The income tax returns for 2007 and subsequent years continue to remain subject to examination by the taxation authorities.
The Company does not anticipate any material changes to the unrecognized tax benefits previously disclosed within the next 12 months as at December 31, 2011.
9 Earnings per share
Basic earnings per share have been calculated using net income for the year divided by the weighted-average number of shares outstanding during the year.
Diluted earnings per share have been calculated using the treasury stock method, which assumes that any proceeds received from the exercise of in-the-money options would be used to purchase Common Shares at the average market price for the period. For purposes of this calculation, at December 31, 2011, there were 4.7 million dilutive options outstanding (2010 – 2.7 million; 2009 – 1.6 million). These option totals at December 31, 2011 exclude 0.3 million options (2010 – 3.6 million; 2009 – 1.3 million) for which there are TSARs outstanding (Note 27), as these are not included in the dilution calculation.
The number of shares used in the earnings per share calculations is reconciled as follows:
| | | | | | | | | | | | |
| (in millions) | | 2011 | | | 2010 | | | 2009 | |
| | | | | | | | | | | | | |
Weighted-average shares outstanding | | | 169.5 | | | | 168.8 | | | | 166.3 | |
Dilutive effect of weighted-average number of stock options | | | 1.1 | | | | 0.4 | | | | 0.5 | |
| | | | | | | | | | | | | |
Weighted-average diluted shares outstanding | | | 170.6 | | | | 169.2 | | | | 166.8 | |
| | | | | | | | | | | | | |
In 2011, the number of options excluded from the computation of diluted earnings per share because their effect was not dilutive was 1.4 million (2010 – 0.9 million; 2009 – 2.5 million).
10 Other comprehensive loss and accumulated other comprehensive loss
The components of “Accumulated other comprehensive loss”, net of tax, are as follows:
| | | | | | | | |
| (in millions of Canadian dollars) | | 2011 | | | 2010 | |
| | | | | | | | | |
Unrealized foreign exchange loss on translation of the net investment in U.S. subsidiaries | | $ | (250 | ) | | $ | (309 | ) |
Unrealized foreign exchange gain on translation of the U.S. dollar-denominated long-term debt designated as a hedge of the net investment in U.S. subsidiaries | | | 322 | | | | 373 | |
Deferred loss on settled hedge instruments | | | (17 | ) | | | (17 | ) |
Unrealized effective (losses) gains on cash flow hedges | | | (3 | ) | | | 2 | |
Amounts for defined benefit pension and other post-retirement plans not recognized in income | | | (2,788 | ) | | | (2,135 | ) |
| | | | | | | | | |
Accumulated other comprehensive loss | | $ | (2,736 | ) | | $ | (2,086 | ) |
| | | | | | | | | |
Components of other comprehensive loss and the related tax effects are as follows:
| | | | | | | | | | | | |
| (in millions of Canadian dollars) | | Before
tax amount | | | Income tax
Recovery
(expense) | | | Net of tax
amount | |
| | | | | | | | | | | | | |
For the year ended December 31, 2011 | | | | | | | | | | | | |
Unrealized foreign exchange gain (loss) on: | | | | | | | | | | | | |
Translation of the net investment in U.S. subsidiaries | | $ | 59 | | | $ | – | | | $ | 59 | |
Translation of the U.S. dollar-denominated long-term debt designated as a hedge of the net investment in U.S. subsidiaries | | | (59 | ) | | | 8 | | | | (51 | ) |
Change in derivatives designated as cash flow hedges: | | | | | | | | | | | | |
Realized gain on cash flow hedges recognized in income | | | (17 | ) | | | 3 | | | | (14 | ) |
Unrealized gain on cash flow hedges | | | 10 | | | | (1 | ) | | | 9 | |
Change in pension and other benefits actuarial gains and losses | | | (892 | ) | | | 232 | | | | (660 | ) |
Change in prior service pension and other benefit costs | | | 9 | | | | (2 | ) | | | 7 | |
| | | | | | | | | | | | | |
Other comprehensive loss | | $ | (890 | ) | | $ | 240 | | | $ | (650 | ) |
| | | | | | | | | | | | | |
| | | |
For the year ended December 31, 2010 | | | | | | | | | | | | |
Unrealized foreign exchange (loss) gain on: | | | | | | | | | | | | |
Translation of the net investment in U.S. subsidiaries | | $ | (124 | ) | | $ | – | | | $ | (124 | ) |
Translation of the U.S. dollar-denominated long-term debt designated as a hedge of the net investment in U.S. subsidiaries | | | 142 | | | | (18 | ) | | | 124 | |
Change in derivatives designated as cash flow hedges: | | | | | | | | | | | | |
Unrealized gain on cash flow hedges | | | 2 | | | | (1 | ) | | | 1 | |
Change in pension and other benefits actuarial gains and losses | | | (472 | ) | | | 121 | | | | (351 | ) |
Change in prior service pension and other benefit costs | | | 12 | | | | (3 | ) | | | 9 | |
| | | | | | | | | | | | | |
Other comprehensive loss | | $ | (440 | ) | | $ | 99 | | | $ | (341 | ) |
| | | | | | | | | | | | | |
| | | |
For the year ended December 31, 2009 | | | | | | | | | | | | |
Unrealized foreign exchange (loss) gain on: | | | | | | | | | | | | |
Translation of the net investment in U.S. subsidiaries | | $ | (244 | ) | | $ | – | | | $ | (244 | ) |
Translation of the U.S. dollar-denominated long-term debt designated as a hedge of the net investment in U.S. subsidiaries | | | 247 | | | | (32 | ) | | | 215 | |
Change in derivatives designated as cash flow hedges: | | | | | | | | | | | | |
Realized loss on cash flow hedges recognized in income | | | 4 | | | | (1 | ) | | | 3 | |
Unrealized gain on cash flow hedges | | | 3 | | | | (1 | ) | | | 2 | |
Change in pension and other benefits actuarial gains and losses | | | (683 | ) | | | 171 | | | | (512 | ) |
Change in prior service pension and other benefit costs | | | 21 | | | | (5 | ) | | | 16 | |
| | | | | | | | | | | | | |
Other comprehensive loss | | $ | (652 | ) | | $ | 132 | | | $ | (520 | ) |
| | | | | | | | | | | | | |
11 Change in non-cash working capital balances related to operations
| | | | | | | | | | | | |
| (in millions of Canadian dollars) | | 2011 | | | 2010 | | | 2009 | |
(Use) source of cash: | | | | | | | | | | | | |
Accounts receivable, net | | $ | (69 | ) | | $ | (9 | ) | | $ | 206 | |
Materials and supplies | | | (15 | ) | | | 23 | | | | 76 | |
Other current assets | | | (8 | ) | | | (1 | ) | | | 19 | |
Accounts payable and accrued liabilities | | | 116 | | | | (29 | ) | | | (198 | ) |
| | | | | | | | | | | | | |
Change in non-cash working capital | | $ | 24 | | | $ | (16 | ) | | $ | 103 | |
12 Cash and cash equivalents
| | | | | | | | |
| (in millions of Canadian dollars) | | 2011 | | | 2010 | |
Cash | | $ | 17 | | | $ | 39 | |
Short-term investments: | | | | | | | | |
Government guaranteed investments | | | – | | | | 119 | |
Deposits with financial institutions | | | 30 | | | | 203 | |
| | | | | | | | | |
Total cash and cash equivalents | | $ | 47 | | | $ | 361 | |
13 Accounts receivable, net
| | | | | | | | |
| (in millions of Canadian dollars) | | 2011 | | | 2010 | |
Freight | | $ | 380 | | | $ | 327 | |
Non-freight | | | 172 | | | | 162 | |
| | | | | | | | | |
| | | 552 | | | | 489 | |
Allowance for doubtful accounts | | | (34 | ) | | | (30 | ) |
| | | | | | | | | |
Total accounts receivable, net | | $ | 518 | | | $ | 459 | �� |
The Company maintains an allowance for doubtful accounts based on expected collectability of accounts receivable. Credit losses are based on specific identification of uncollectible accounts, the application of historical percentages by aging category and an assessment of the current economic environment. At December 31, 2011, allowances of $34 million (2010 – $30 million) were recorded in “Accounts receivable, net”. During 2011, $2 million related to doubtful accounts (2010 – $5 million; 2009 – $5 million) was expensed within “Purchased services and other”.
In 2010, the Company collected $220 million, including accrued interest, in settlement of a receivable from a major Canadian bank which carried an effective interest rate of 5.883%.
14 Investments
| | | | | | | | |
| (in millions of Canadian dollars) | | 2011 | | | 2010 | |
Rail investments accounted for on an equity basis(Note 16) | | $ | 65 | | | $ | 58 | |
Long-term floating rate notes(Note 21) | | | 79 | | | | 70 | |
Other investments | | | 23 | | | | 17 | |
| | | | | | | | | |
Total investments | | $ | 167 | | | $ | 145 | |
15 Properties
| | | | | | | | | | | | | | | | | | | | | | | | | | | | |
| | | 2011 | | | 2011 | | | 2010 | |
| (in millions of Canadian dollars) | | Average
annual depreciation
rate | | | Cost | | | Accumulated
depreciation | | | Net book
value | | | Cost | | | Accumulated
depreciation | | | Net book
value | |
Track and roadway | | | 2.7 | % | | $ | 12,778 | | | $ | 3,552 | | | $ | 9,226 | | | $ | 11,980 | | | $ | 3,305 | | | $ | 8,675 | |
Buildings | | | 3.0 | % | | | 453 | | | | 255 | | | | 198 | | | | 440 | | | | 266 | | | | 174 | |
Rolling stock | | | 2.7 | % | | | 3,390 | | | | 1,362 | | | | 2,028 | | | | 3,245 | | | | 1,319 | | | | 1,926 | |
Information systems(1) | | | 9.5 | % | | | 665 | | | | 338 | | | | 327 | | | | 600 | | | | 303 | | | | 297 | |
Other | | | 4.8 | % | | | 1,436 | | | | 463 | | | | 973 | | | | 1,355 | | | | 430 | | | | 925 | |
| | | | | | | | | | | | | | | | | | | | | | | | | | | | | |
Total | | | | | | $ | 18,722 | | | $ | 5,970 | | | $ | 12,752 | | | $ | 17,620 | | | $ | 5,623 | | | $ | 11,997 | |
(1) Net additions during 2011 were $91 million (2010 – $54 million; 2009 – $39 million) and depreciation expense was $56 million (2010 – $54 million; 2009 – $40 million).
Capital leases included in properties
| | | | | | | | | | | | | | | | | | | | | | | | |
| | | 2011 | | | 2010 | |
| (in millions of Canadian dollars) | | Cost | | | Accumulated
depreciation | | | Net book
value | | | Cost | | | Accumulated
depreciation | | | Net book
value | |
Buildings | | $ | 1 | | | $ | – | | | $ | 1 | | | $ | 1 | | | $ | – | | | $ | 1 | |
Rolling stock | | | 515 | | | | 165 | | | | 350 | | | | 517 | | | | 152 | | | | 365 | |
Other | | | 2 | | | | 2 | | | | – | | | | 2 | | | | 1 | | | | 1 | |
| | | | | | | | | | | | | | | | | | | | | | | | | |
Total assets held under capital lease | | $ | 518 | | | $ | 167 | | | $ | 351 | | | $ | 520 | | | $ | 153 | | | $ | 367 | |
During 2011, properties were acquired under the Company’s capital program at an aggregate cost of $1,153 million (2010 – $743 million; 2009 – $703 million), none of which were acquired by means of capital leases (2010 – $1 million; 2009 – $1 million). Cash payments related to capital purchases were $1,104 million in 2011 (2010 – $726 million; 2009 – $703 million).
16 Equity income
Equity income from CP’s investment in the DRTP, over which the Company exerts significant influence, was $4 million in 2011 (2010 – $4 million; 2009 – $3 million). The equity income from the Company’s investment in the CNCP Niagara-Windsor Partnership was $nil in 2011 (2010 – $2 million; 2009 – $nil). CP’s investment in the Indiana Harbor Belt Railroad Company generated equity income of $4 million in 2011 (2010 – $4 million; 2009 – $2 million). Equity income from these rail investments is recorded in “Purchased services and other” on the Consolidated Statement of Income, as they form an integral part of CP’s rail operations.
17 Goodwill and intangible assets
| | | | | | | | | | | | | | | | |
| (in millions of Canadian dollars) | | Goodwill | | | Cost | | | Intangible assets
Accumulated
amortization | | | Net
carrying
amount | |
| | | | | | | | | | | | | | | | | |
Balance at December 31, 2009 | | $ | 155 | | | $ | 52 | | | $ | (5 | ) | | $ | 47 | |
Amortization | | | – | | | | – | | | | (1 | ) | | | (1 | ) |
Foreign exchange impact | | | (8 | ) | | | (3 | ) | | | – | | | | (3 | ) |
| | | | | | | | | | | | | | | | | |
Balance at December 31, 2010 | | $ | 147 | | | $ | 49 | | | $ | (6 | ) | | $ | 43 | |
Amortization | | | – | | | | – | | | | (2 | ) | | | (2 | ) |
Foreign exchange impact | | | 3 | | | | 1 | | | | – | | | | 1 | |
| | | | | | | | | | | | | | | | | |
Balance at December 31, 2011 | | $ | 150 | | | $ | 50 | | | $ | (8 | ) | | $ | 42 | |
As part of the acquisition of DM&E in 2007, CP recognized goodwill of US$147 million on the allocation of the purchase price, determined as the excess of the purchase price over the fair value of the net assets acquired. Since the acquisition, the operations of DM&E have been integrated with CP’s U.S. operations and the related goodwill is now allocated to CP’s U.S. reporting unit. Goodwill is tested for impairment at least once per year as at October 1st. The goodwill impairment test determines if the fair value of the reporting unit continues to exceed its net book value, or whether an impairment charge is required. The fair value of the reporting unit is affected by projections of its profitability including estimates of revenue growth, which are inherently uncertain. The annual test for impairment determined that the fair value of CP’s U.S. reporting unit exceeded the carrying value of the allocated goodwill by approximately 42% (2010 – 40%).
Intangible assets of $42 million (2010 – $43 million), acquired in the acquisition of DM&E, includes the unamortized costs of an option to expand the track network, favourable leases, customer relationships and interline contracts.
The estimated amortization expense for intangible assets for 2012 to 2016 is $1 million each year.
18 Other assets
| | | | | | | | |
| (in millions of Canadian dollars) | | 2011 | | | 2010 | |
Unamortized fees on long-term debt | | $ | 47 | | | $ | 50 | |
Contracted customer incentives | | | 11 | | | | 14 | |
Long-term materials | | | 11 | | | | 10 | |
Prepaid leases | | | 10 | | | | 11 | |
Other | | | 64 | | | | 55 | |
| | | | | | | | | |
Total other assets | | $ | 143 | | | $ | 140 | |
Fees on long-term debt and contracted customer incentives are amortized to income over the term of the related debt and over the term of the related revenue contract, respectively.
19 Accounts payable and accrued liabilities
| | | | | | | | |
| (in millions of Canadian dollars) | | 2011 | | | 2010 | |
Trade payables | | $ | 387 | | | $ | 226 | |
Accrued charges | | | 245 | | | | 191 | |
Payroll-related accruals | | | 103 | | | | 165 | |
Accrued vacation | | | 76 | | | | 77 | |
Accrued interest | | | 64 | | | | 64 | |
Personal injury and other claims provision | | | 53 | | | | 51 | |
Dividends payable | | | 51 | | | | 46 | |
Income and other taxes payable | | | 39 | | | | 31 | |
Provision for environmental remediation and restructuring | | | 35 | | | | 43 | |
Stock-based compensation liabilities | | | 32 | | | | 66 | |
Total return swap | | | 3 | | | | 6 | |
Other | | | 45 | | | | 42 | |
| | | | | | | | | |
Total accounts payable and accrued liabilities | | $ | 1,133 | | | $ | 1,008 | |
20 Long-term debt
| | | | | | | | | | | | | | | | | | |
| (in millions of Canadian dollars) | | Maturity | | | Currency
in which
payable | | | 2011 | | | 2010 | |
6.250% | | 10-year Notes(A) | | | Oct. 2011 | | | | US | $ | | | $ – | | | | $ 250 | |
5.750% | | 5-year Notes(A) | | | May 2013 | | | | US | $ | | | – | | | | 103 | |
6.500% | | 10-year Notes(A) | | | May 2018 | | | | US | $ | | | 279 | | | | 273 | |
6.250% | | 10-year Medium Term Notes(A) | | | June 2018 | | | | CDN | $ | | | 373 | | | | 373 | |
7.250% | | 10-year Notes(A) | | | May 2019 | | | | US | $ | | | 355 | | | | 345 | |
9.450% | | 30-year Debentures(A) | | | Aug. 2021 | | | | US | $ | | | 254 | | | | 248 | |
5.100% | | 10-year Debentures(A) | | | Jan. 2022 | | | | CDN | $ | | | 125 | | | | – | |
4.500% | | 10-year Debentures(A) | | | Jan. 2022 | | | | US | $ | | | 250 | | | | – | |
4.450% | | 12.5-year Notes(A) | | | Mar. 2023 | | | | US | $ | | | 354 | | | | 347 | |
7.125% | | 30-year Debentures(A) | | | Oct. 2031 | | | | US | $ | | | 356 | | | | 348 | |
5.750% | | 30-year Debentures (A) | | | Mar. 2033 | | | | US | $ | | | 246 | | | | 249 | |
5.950% | | 30-year Notes(A) | | | May 2037 | | | | US | $ | | | 450 | | | | 440 | |
6.450% | | 30-year Notes(A) | | | Nov. 2039 | | | | CDN | $ | | | 400 | | | | 400 | |
5.750% | | 30-year Debentures(A) | | | Jan. 2042 | | | | US | $ | | | 248 | | | | – | |
Secured Equipment Loan (B) | | | Aug. 2015 | | | | CDN | $ | | | 116 | | | | 128 | |
5.41% | | Senior Secured Notes(C) | | | Mar. 2024 | | | | US | $ | | | 120 | | | | 121 | |
6.91% | | Secured Equipment Notes(D) | | | Oct. 2024 | | | | CDN | $ | | | 186 | | | | 194 | |
5.57% | | Senior Secured Notes(E) | | | Dec. 2024 | | | | US | $ | | | 63 | | | | 63 | |
7.49% | | Equipment Trust Certificates(F) | | | Jan. 2021 | | | | US | $ | | | 102 | | | | 103 | |
3.88% | | Senior Secured Notes Series A & B (G) | | | Oct./Dec. 2026 | | | | US | $ | | | 141 | | | | – | |
Other long-term loans (nil% - 5.50%) | | | 2014 -2024 | | | | US | $ | | | 2 | | | | 4 | |
Obligations under capital leases
(4.90% - 7.63%)(H) | | | 2012 -2026 | | | | US | $ | | | 285 | | | | 287 | |
Obligations under capital leases
(12.77%)(H) | | | Jan. 2031 | | | | CDN | $ | | | 3 | | | | 3 | |
| | | | | | | | | | | | | | | | | | | |
| | | | | | | | | | | | | 4,708 | | | | 4,279 | |
Perpetual 4% Consolidated Debenture Stock(I) | | | | | | | US | $ | | | 31 | | | | 30 | |
Perpetual 4% Consolidated Debenture Stock(I) | | | | | | | GB | £ | | | 6 | | | | 6 | |
| | | | | | | | | | | | | | | | | | | |
| | | | | | | | | | | | | 4,745 | | | | 4,315 | |
Less: Long-term debt maturing within one year | | | | | | | | 50 | | | | 282 | |
| | | | | | | | | | | | | | | | | | | |
| | | | | | | | | | | | | | $ 4,695 | | | | $ 4,033 | |
At December 31, 2011, the gross amount of long-term debt denominated in U.S. dollars was US$3,508 million (2010 – US$3,234 million).
Annual maturities and principal repayment requirements, excluding those pertaining to capital leases, for each of the five years following 2011 are (in millions): 2012 – $42; 2013 – $45; 2014 – $47; 2015 – $122; 2016 – $29.
A. These debentures and notes pay interest semi-annually and are unsecured, but carry a negative pledge.
On September 30, 2011, the Company redeemed US$101 million 5.75% Notes due in May 2013 with a carrying amount of $107 million pursuant to a call offer for a total cost of $113 million. Upon redemption of the Notes a net loss of $9 million was recognized, to “Other income and charges”. The loss consisted largely of a redemption premium paid to note holders to redeem the Notes.
On September 13, 2011, the Company announced a cash tender offer and consent solicitation for any or all its outstanding US$246 million 6.25% Notes due October 15, 2011. Notes tendered with a principal value of US$204 million were redeemed on October 12, 2011, and the remaining US$42 million Notes not tendered were redeemed on October 17, 2011. Upon redemption of the Notes a net loss of $1 million was recognized to “Other income and charges”.
During December 2011, the Company issued $125 million 5.10% 10-year Notes, US$250 million 4.50% 10-year Notes and US$250 million 5.75% 30-year Notes. Net proceeds from these offerings were $618 million and were largely used to make a $600 million voluntary prepayment to the Company’s main Canadian defined benefit pension plan.
During 2010, the Company issued US$350 million of 4.45% Notes due March 15, 2023. Net proceeds from this offering were $355 million and were used to make a voluntary prepayment to the Company’s main Canadian defined benefit pension plan.
During 2009, the Company issued US$350 million 7.25% 10-year Notes for net proceeds of approximately $409 million. The proceeds from this offering contributed to the repurchase of debt with a carrying amount of $555 million, net of deferred costs of $1 million, pursuant to a tender offer for a total cost of $572 million. Upon repurchase of the debt a net loss of $17 million was recognized to “Other income and charges”. The loss consisted largely of premiums paid to bond holders to tender their debt, and the write-off of unamortized fees, partly offset by a fair value adjustment (gain) recognized on the unwind of interest rate swaps associated with the 6.250% Notes that were repurchased. The following table summarizes the principal amount, carrying amount and cost to redeem repurchased debt:
| | | | | | | | | | | | | | | | |
(in millions) | | | Maturity | | |
| Principal
amount
in USD |
| |
| Carrying
amount
in CDN(2) |
| |
| Cost to
redeem
in CDN |
|
6.25% Notes | | | 2011 | | | $ | 154 | | | $ | 184 | | | $ | 185 | |
5.75% Notes | | | 2013 | | | | 299 | | | | 343 | | | | 359 | |
6.50% Notes | | | 2018 | | | | 25 | (1) | | | 28 | | | | 28 | |
| | | | | | | | | | | | | | | | | |
Total debt tendered | | | | | | $ | 478 | | | $ | 555 | | | $ | 572 | |
(1) Includes US$3 million principal amount of debt repurchased prior to commencement of the debt tender.
(2)Net of deferred costs of $1 million.
During 2009, the Company issued $400 million 6.45% 30-year Notes. Net proceeds from this offering were $398 million. The proceeds from this offering were used for general corporate purposes.
B. The Secured Equipment Loan is collateralized by specific locomotive units with a carrying value of $113 million at December 31, 2011. The floating interest rate is calculated based on a six-month average Canadian Dollar Offered Rate (calculated based on an average of Bankers’ Acceptance rates) plus 53 basis points (2011 – 1.94%; 2010 – 1.39%; 2009 – 1.82%). The Company makes blended payments of principal and interest semi-annually. Final repayment of the remaining principal balance of $53 million is due in August 2015.
C. The 5.41% Senior Secured Notes are collateralized by specific locomotive units with a carrying value of $153 million at December 31, 2011. The Company pays equal blended semi-annual payments of principal and interest. Final repayment of the remaining principal of US$44 million is due in March 2024.
D. The 6.91% Secured Equipment Notes are full recourse obligations of the Company collateralized by a first charge on specific locomotive units with a carrying value of $154 million at December 31, 2011. The Company pays equal blended semi-annual payments of principal and interest up to and including October 2024.
E. During 2009, the Company issued US$65 million of 5.57% Senior Secured Notes for net proceeds of $67 million. The Notes are secured by specific locomotive units and other rolling stock with a combined carrying value of $69 million at December 31, 2011. The Company pays equal blended semi-annual payments of principal and interest up to and including December 2024. Final repayment of the remaining principal of US$31 million is due in December 2024.
F. The 7.49% Equipment Trust Certificates are secured by specific locomotive units with a carrying value of $108 million at December 31, 2011. The Company makes semi-annual payments that vary in amount and are interest-only payments or blended principal and interest payments. Final repayment of the remaining principal of US$11 million is due in January 2021.
G. During 2011, the Company issued US$139 million 3.88% Series A and B Senior Secured Notes due in 2026 for net proceeds of $139 million. These Notes are secured by locomotives previously acquired by the Company with a carrying value of $139 million at December 31, 2011. The Company pays equal blended semi-annual payments of principal and interest up to and including December 2026. Final repayment of the remaining principal of US$69 million is due in the fourth quarter of 2026.
H. At December 31, 2011, capital lease obligations included in long-term debt were as follows:
| | | | | | | | |
| (in millions of Canadian dollars) | | Year | | | Capital leases | |
Minimum lease payments in: | | | | | | | | |
| | | 2012 | | | $ | 28 | |
| | | 2013 | | | | 29 | |
| | | 2014 | | | | 162 | |
| | | 2015 | | | | 14 | |
| | | 2016 | | | | 14 | |
| | | Thereafter | | | | 180 | |
| | | | | | | | | |
Total minimum lease payments | | | | | | | 427 | |
Less: Imputed interest | | | | | | | (139 | ) |
| | | | | | | | | |
Present value of minimum lease payments | | | | | | | 288 | |
Less: Current portion | | | | | | | (8 | ) |
| | | | | | | | | |
Long-term portion of capital lease obligations | | | | | | $ | 280 | |
During the year the Company had no additions to property, plant and equipment under capital lease obligations (2010 – $1 million; 2009 –$1 million).
The carrying value of the assets collateralizing the capital lease obligations was $351 million at December 31, 2011.
I. The Consolidated Debenture Stock, authorized by an Act of Parliament of 1889, constitutes a first charge upon and over the whole of the undertaking, railways, works, rolling stock, plant, property and effects of the Company, with certain exceptions.
21 Financial instruments
A. Fair values of financial instruments
The Company uses the following methods and assumptions to estimate initial and subsequent fair values of each class of financial instrument for recognition and / or disclosure as follows:
Loans and receivables
Accounts receivable, net – The carrying amounts approximate fair value because of the short maturity of these instruments.
Investments – The fair value of long-term receivables is determined using discounted cash flow analysis and observable market based inputs.
Financial liabilities
Accounts payable and accrued liabilities – The carrying amounts approximate fair value because of the short maturity of these instruments.
Other long-term liabilities – The fair value of contractual amounts payable over a period greater than one year are valued at an amount equal to the discounted future cash flow using a discount rate that reflects market prices to settle liabilities with similar terms and maturities.
Long-term debt – The fair value of publicly traded long-term debt is determined based on market prices. The fair value of other long-term debt is estimated based on rates currently available to the Company for long-term borrowings with terms and conditions similar to those borrowings in place at the applicable Consolidated Balance Sheet date.
Available for sale
Investments – Certain equity investments, which do not represent control or significant influence and which are accounted for on a cost basis, have a carrying value that equals cost as fair value cannot be reliably established. There are no quoted prices from an active market for these investments.
Held for trading
Derivative instruments are classified as held for trading and measured at fair value determined by using quoted market prices for similar instruments. Changes in fair values of such derivatives are recognized in net income as they arise.
Cash and cash equivalents – The carrying amount is equal to fair value because of the short maturity of these instruments.
Investments – Long-term floating rate notes are carried at fair value, which has been determined using valuation techniques that incorporate probability weighted discounted future cash flows reflecting market conditions and other factors that a market participant would consider. The carrying values of financial instruments equal or approximate their fair values with the exception of long-term debt which has a fair value of approximately $5,314 million at December 31, 2011 (December 31, 2010 – $4,773 million) and a carrying value of $4,745 million at December 31, 2011 (December 31, 2010 – $4,315 million). The fair value of publicly traded long-term debt, determined based on market prices, was $4,390 million at December 31, 2011 (December 31, 2010 – $3,963 million) with a carrying value of $3,913 million (December 31, 2010 – $3,606 million).
The Company categorizes its financial assets and liabilities measured at fair value into one of three different levels depending on the observability of the inputs employed in the measurement.
| ¨ | | Level 1: Unadjusted quoted prices for identical assets and liabilities in active markets that are accessible at the measurement date. |
| ¨ | | Level 2: Directly or indirectly observable inputs other than quoted prices included within Level 1 or quoted prices for similar assets and liabilities. Derivative instruments in this category are valued using models or other industry standard valuation techniques derived from observable market data. |
| ¨ | | Level 3: Valuations based on inputs which are less observable, unavailable or where the observable data does not support a significant portion of the instruments’ fair value. Generally, Level 3 valuations are longer dated transactions, occur in less active markets, occur at locations where pricing information is not available, or have no binding broker quote to support Level 2 classifications. |
When possible, the estimated fair value is based on quoted market prices and, if not available, estimates from third party brokers. For non-exchange traded derivatives classified in Level 2, the Company uses standard valuation techniques to calculate fair value. Primary inputs to these techniques include observable market prices (interest, foreign exchange and commodity) and volatility, depending on the type of derivative and nature of the underlying risk. The Company uses inputs and data used by willing market participants when valuing derivatives and considers its own credit default swap spread as well as those of its counterparties in its determination of fair value. Wherever possible the Company uses observable inputs. All derivatives are classified as Level 2.
A detailed analysis of the techniques used to value long-term floating rate notes, which are classified as Level 3, is discussed below:
Long-term floating rate notes
At December 31, 2011 and December 31, 2010, the Company held long-term floating rate notes, consisting almost entirely of Master Asset Vehicle (“MAV”) 2 notes with eligible assets, with a total settlement value of $105 million and $117 million, respectively, and carrying values of $79 million and $70 million, respectively. The carrying values, being the estimated fair values, are reported in “Investments”.
The MAV 2 Class A-1 notes received an A (high) rating from Dominion Bond Rating Service (“DBRS”), unchanged from 2010, however at December 31, 2011, the rating was Under Review with Positive Implications. On September 23, 2011, the rating of the MAV 2 Class A-2 notes was upgraded from BBB (low) to BBB (high).
During 2011, the Company sold all of its MAV 2 Class B and Class C and MAV 3 Class 9 notes for proceeds of $6 million and recorded a gain of $6 million. During 2010, the Company used notes to settle a $9 million credit facility with a major Canadian Bank and recorded a gain of $1 million. The notes had an estimated fair value of $8 million.
The valuation technique used by the Company to estimate the fair value of its investment in long-term floating rate notes at December 31, 2011 and December 31, 2010, incorporates probability weighted discounted cash flows considering the best available public information regarding market conditions and other factors that a market participant would consider for such investments. The above noted redemption of notes, accretion and changes in assumptions have resulted in gains of $15 million in 2011 (2010 – $9 million; 2009 – $9 million) which was reported in “Other income and charges”. The interest rates and maturities of the various long-term floating rate notes, discount rates and credit losses modelled December 31, 2011 and December 31, 2010, respectively, are:
| | | | |
| | | December 31, 2011 | | December 31, 2010 |
Probability weighted-average coupon interest rate | | 0.8% | | 0.8% |
Weighted-average discount rate | | 6.1% | | 7.1% |
Expected repayments of long-term floating rate notes | | Approximately 5 years | | Approximately 6 years |
Credit losses | | MAV 2 eligible asset notes: | | MAV 2 eligible asset notes: |
| | nil | | 1% to 100% |
| | | | MAV 3 Class 9 Traditional |
| | | | | Asset Tracking notes: 1% |
The probability weighted discounted cash flows resulted in an estimated fair value of the Company’s long-term floating rate notes of $79 million at December 31, 2011 (December 31, 2010 – $70 million). The change in the original cost and estimated fair value of the Company’s long-term floating rate notes is as follows (representing a roll-forward of assets measured at fair value using Level 3 inputs):
| | | | | | | | | | | | | | | | |
| | | 2011 | | | 2010 | |
| (in millions of Canadian dollars) | | Original
cost | | | Estimated
fair value | | | Original
cost | | | Estimated
fair value | |
As at January 1 | | $ | 117 | | | $ | 70 | | | $ | 129 | | | $ | 70 | |
Redemption of notes | | | (12 | ) | | | – | | | | (12 | ) | | | (8 | ) |
Accretion | | | – | | | | 5 | | | | – | | | | 6 | |
Change in market assumptions | | | – | | | | 4 | | | | – | | | | 2 | |
| | | | | | | | | | | | | | | | | |
As at December 31 | | $ | 105 | | | $ | 79 | | | $ | 117 | | | $ | 70 | |
Sensitivity analysis is presented below for key assumptions at December 31, 2011:
| | | | |
| (in millions of Canadian dollars) | | Change in fair value of
long-term floating rate notes | |
Coupon interest rate | | | | |
50 basis point increase | | $ | 1 | |
50 basis point decrease | | $ | (1 | ) |
Discount rate | | | | |
50 basis point increase | | $ | (2 | ) |
50 basis point decrease | | $ | 2 | |
Continuing uncertainties regarding the value of the assets which underlie the long-term floating rate notes and the amount and timing of cash flows could give rise to a further material change in the value of the Company’s investment in long-term floating rate notes which could impact the Company’s near-term earnings.
B. Financial risk management
The Company’s policy with respect to using derivative financial instruments is to selectively reduce volatility associated with fluctuations in interest rates, foreign exchange (“FX”) rates, the price of fuel and stock-based compensation expense. Where derivatives are designated as hedging instruments, the relationship between the hedging instruments and their associated hedged items is documented, as well as the risk management objective and strategy for the use of the hedging instruments. This documentation includes linking the derivatives that are designated as fair value or cash flow hedges to specific assets or liabilities on the Consolidated Balance Sheet, commitments or forecasted transactions. At the time a derivative contract is entered into, and at least quarterly thereafter, an assessment is made whether the derivative item is effective in offsetting the changes in fair value or cash flows of the hedged items. The derivative qualifies for hedge accounting treatment if it is effective in substantially mitigating the risk it was designed to address.
It is not the Company’s intent to use financial derivatives or commodity instruments for trading or speculative purposes.
Credit risk management
Credit risk refers to the possibility that a customer or counterparty will fail to fulfil its obligations under a contract and as a result create a financial loss for the Company. The Company’s credit risk regarding its investment in long-term floating rate notes is discussed in more detail above.
The Company predominantly serves financially established customers and the Company has experienced limited financial losses with respect to credit risk. The credit worthiness of customers is assessed using credit scores supplied by a third party, and through direct monitoring of their financial well-being on a continual basis. The Company establishes guidelines for customer credit limits and should thresholds in these areas be reached, appropriate precautions are taken to improve collectability.
Counterparties to financial instruments expose the Company to credit losses in the event of non-performance. Counterparties for derivative and cash transactions are limited to high credit quality financial institutions, which are monitored on an on-going basis. Counterparty credit assessments are based on the financial health of the institutions and their credit ratings from external agencies. The Company does not anticipate non-performance that would materially impact the Company’s financial statements. In addition, the Company believes there are no significant concentrations of credit risk.
Foreign exchange management
The Company is exposed to fluctuations in the value of financial commitments, assets, liabilities, income or cash flows due to changes in FX rates. The Company conducts business transactions and owns assets in both Canada and the United States; as a result, revenues and expenses are incurred in both Canadian and U.S. dollars. The Company enters into foreign exchange risk management transactions primarily to manage fluctuations in the exchange rate between Canadian and U.S. currencies. In terms of net income, excluding FX on long-term debt, mitigation of U.S. dollar FX exposure is provided primarily through offsets created by revenues and expenses incurred in the same currency. Where appropriate, the Company negotiates with customers and suppliers to reduce the net exposure.
Occasionally the Company will enter into short-term FX forward contracts as part of its cash management strategy.
Net investment hedge
The FX gains and losses on long-term debt are mainly unrealized and can only be realized when U.S. dollar denominated long-term debt matures or is settled. The Company also has long-term FX exposure on its investment in U.S. affiliates. The majority of the Company’s U.S. dollar denominated long-term debt has been designated as a hedge of the net investment in foreign subsidiaries. This designation has the effect of mitigating volatility on net income by offsetting long-term FX gains and losses on long-term debt and gains and losses on its net investment. In addition, the Company may enter into FX forward contracts to lock-in the amount of Canadian dollars it has to pay on its U.S. denominated debt maturities.
Foreign exchange forward contracts
During 2011, in anticipation of a cash tender to offer to redeem the Company’s US$101 million 5.75% May 2013 Notes, the Company unwound a similar amount of FX forward contracts to fix the exchange rate on these Notes for total proceeds of $2 million(Note 20). These forward contracts were accounted for as cash flow hedges.
At December 31, 2011, the Company had remaining FX forward contracts to fix the exchange rate on US$175 million of its 6.50% Notes due in May 2018, and US$100 million of its 7.25% Notes due in May 2019. These derivatives, which are accounted for as cash flow hedges, guarantee the amount of Canadian dollars that the Company will repay when these Notes mature.
During 2011, a combined realized and unrealized foreign exchange gain of $8 million (2010 – unrealized loss of $1 million) in “Other income and charges” was recorded in relation to these derivatives. During 2011, the gain recorded in “Other income and charges” was largely offset by the realized and unrealized losses on the underlying debt which the derivatives were designated to hedge. Similarly the loss in 2010 was largely offset by unrealized gains on the underlying debt.
At December 31, 2011, the unrealized gain derived from these FX forwards was $6 million which was included in “Other assets” with the offset reflected as an unrealized loss of $1 million in “Accumulated other comprehensive loss” and as an unrealized gain of $7 million in “Retained earnings”. At December 31, 2010, the unrealized loss derived from these FX forwards was $2 million which was included in “Other long-term liabilities” with the offset reflected as an unrealized loss of $1 million in “Accumulated other comprehensive loss” and as an unrealized loss of $1 million in “Retained earnings”.
At December 31, 2011, the Company expected that, during the next twelve months, unrealized pre-tax losses of $1 million would be reclassified to “Other income and charges”.
Interest rate management
The Company is exposed to interest rate risk, which is the risk that the fair value or future cash flows of a financial instrument will vary as a result of changes in market interest rates. In order to manage funding needs or capital structure goals, the Company enters into debt or capital lease agreements that are subject to either fixed market interest rates set at the time of issue or floating rates determined by on-going market conditions. Debt subject to variable interest rates exposes the Company to variability in interest expense, while debt subject to fixed interest rates exposes the Company to variability in the fair value of debt.
To manage interest rate exposure, the Company accesses diverse sources of financing and manages borrowings in line with a targeted range of capital structure, debt ratings, liquidity needs, maturity schedule, and currency and interest rate profiles. In anticipation of future debt issuances, the Company may enter into forward rate agreements such as treasury rate locks, bond forwards or forward starting swaps, designated as cash flow hedges, to substantially lock in all or a portion of the effective future interest expense. The Company may also enter into swap agreements, designated as fair value hedges, to manage the mix of fixed and floating rate debt.
Interest rate swaps
At December 31, 2011 and December 31, 2010, the Company had no outstanding interest rate swaps.
During 2011, the Company amortized $5 million (2010 – $4 million; 2009 – $6 million) of deferred gains to “Net interest expense” relating to interest rate swaps previously unwound in 2010 and 2009. In addition, during 2011, the Company amortized $2 million of deferred gains to “Other income and charges” as a result of the redemption of 5.75% 2013 Notes(Note 20). These gains were deferred as a fair value adjustment to the underlying debts that were hedged and were amortized to “Net interest expense” until the debts were redeemed in 2011.
Treasury rate locks
At December 31, 2011, the Company had net unamortized losses related to interest rate locks, which are accounted for as cash flow hedges, settled in previous years totalling $22 million (December 31, 2010 – $22 million). This amount is composed of various unamortized gains and losses related to specific debts which are reflected in “Accumulated other comprehensive loss” and are amortized to “Net interest expense” in the period that interest on the related debt is charged. The amortization of these gains and losses resulted in a negligible increase to “Net interest expense” and “Other comprehensive income” in 2011 (2010 – $2 million; 2009 – $4 million).
At December 31, 2011, the Company expected that, during the next twelve months, a negligible amount of loss related to these previously settled derivatives would be reclassified to “Net interest expense”.
Stock-based compensation expense management
The Company is exposed to stock-based compensation risk, which is the probability of increased compensation expense due to the increase in the Company’s share price.
The Company has a Total Return Swap (“TRS”) to reduce the volatility to the Company over time on three types of stock-based compensation programs: TSARs, DSUs, and RSUs. As the Company’s share price appreciates, these programs create increased compensation expense. The TRS is a derivative that provides a gain to offset increased compensation expense as the share price increases and a loss to offset reduced compensation expense when the share price falls. This derivative is not designated as a hedge and changes in fair value are recognized in net income in the period in which the change occurs.
During 2011, the Company reduced the size of the TRS program by 0.5 million share units (December 31, 2010 – 0.5 million) at minimal cost to reflect the cancellation of SARs in Canada(Note 27).
At December 31, 2011, the Company had 0.6 million share units (December 31, 2010 – 1.1 million) remaining in the TRS with an unrealized loss of $3 million (December 31, 2010 – $6 million) which was included in “Accounts payable and accrued liabilities” on the Consolidated Balance Sheets.
“Compensation and benefits” expense on the Company’s Consolidated Statements of Income included a net gain on these swaps of $3 million in 2011 (2010 – $12 million; 2009 – $19 million).
Fuel price management
The Company is exposed to commodity risk related to purchases of diesel fuel and the potential reduction in net income due to increases in the price of diesel. Fuel expense constitutes a large portion of the Company’s operating costs and volatility in diesel fuel prices can have a significant impact on the Company’s income. Items affecting volatility in diesel prices include, but are not limited to, fluctuations in world markets for crude oil and distillate fuels, which can be affected by supply disruptions and geopolitical events.
The impact of variable fuel expense is mitigated substantially through fuel cost recovery programs which apportion incremental changes in fuel prices to shippers through price indices, tariffs, and by contract, within agreed upon guidelines. While these programs provide effective and meaningful coverage, residual exposure remains as the fuel expense risk cannot be completely recovered from shippers due to timing and volatility in the market. The Company continually monitors residual exposure, and where appropriate, may enter into derivative instruments.
Derivative instruments used by the Company to manage fuel expense risk may include, but are not limited to, swaps and options for crude oil, diesel and crack spreads.
Energy futures
At December 31, 2011, the Company had diesel futures contracts, which are accounted for as cash flow hedges, to purchase approximately 21 million U.S. gallons during the period January to December 2012 at an average price of $3.01 per U.S. gallon. This represents approximately 7% of estimated fuel purchases for this period. At December 31, 2011, the unrealized loss on these futures contracts was $3 million (December 31, 2010 – unrealized gain $4 million) and was reflected in “Accounts payable and accrued liabilities” (December 31, 2010 – “Other current assets”) with the offset, net of tax, reflected in “Accumulated other comprehensive loss” on the Consolidated Balance Sheets.
The impact of settled commodity swaps decreased “Fuel” expense in 2011 by $8 million as a result of realized gains on diesel swaps (2010 – realized gains $3 million; 2009 – realized losses $5 million). At December 31, 2011, the Company expected that, during the next twelve months, $3 million of unrealized pre-tax holding losses on diesel future contracts would be realized and recognized in “Fuel” expense as a result of these derivatives being settled.
The following table summarizes the fair values derivatives instruments on the Consolidated Balance Sheets at December 31, 2011 and December 31, 2010:
| | | | | | | | | | | | | | | | | | |
| | | | | Asset Derivatives | | | Liability Derivatives | |
| | | | | As at December 31, | | | As at December 31, | |
| (in millions of Canadian dollars) | | Balance Sheet Location | | 2011 | | | 2010 | | | 2011 | | | 2010 | |
Derivatives designated as hedging instruments | | | | | | | | | | | | | | | | | | |
Diesel future contracts | | Other current assets | | $ | – | | | $ | 4 | | | $ | – | | | $ | – | |
| | Accounts payable and accrued liabilities | | | – | | | | – | | | | 3 | | | | – | |
FX forward contracts | | Other assets | | | 6 | | | | – | | | | – | | | | – | |
| | Other long-term liabilities | | | – | | | | – | | | | – | | | | 2 | |
Derivatives not designated as hedging instruments | | | | | | | | | | | | | | | | | | |
Total return swap | | Accounts payable and accrued liabilities | | | – | | | | – | | | | 3 | | | | 6 | |
| | | | | | | | | | | | | | | | | | | |
| | | | | $ | 6 | | | $ | 4 | | | $ | 6 | | | $ | 8 | |
The following table summarizes information on the location and amounts of gains and losses, before tax, related to derivatives on the Consolidated Statements of Income and in Comprehensive (loss) income for the years 2011, 2010, and 2009:
| | | | | | | | | | | | | | | | | | | | | | | | | | | | |
| | | Location of gain
(loss) recognized in
income on
derivatives | | | Amount of gain (loss)
recognized in income on
derivatives | | | Amount of gain (loss)
recognized in other
comprehensive loss on
derivatives | |
| (in millions of Canadian dollars) | | | 2011 | | | 2010 | | | 2009 | | | 2011 | | | 2010 | | | 2009 | |
| | | | | | | |
Derivatives designated as hedging instruments | | | | | | | | | | | | | | | | | | | | | | | | | | | | |
Effective portion | | | | | | | | | | | | | | | | | | | | | | | | | | | | |
Crude oil swaps | | | Fuel expense | | | $ | – | | | $ | – | | | $ | 4 | | | $ | – | | | $ | – | | | $ | (3 | ) |
Diesel future contracts | | | Fuel expense | | | | 8 | | | | 3 | | | | (5 | ) | | | (7 | ) | | | 1 | | | | 6 | |
FX forward contracts | |
| Other income and
charges |
| | | 8 | | | | (1 | ) | | | – | | | | – | | | | (1 | ) | | | – | |
Interest rate swaps | | | Net interest expense | | | | 5 | | | | 4 | | | | 6 | | | | – | | | | – | | | | – | |
| |
| Other income and
charges |
| | | 2 | | | | – | | | | 6 | | | | – | | | | – | | | | – | |
Treasury rate locks | | | Net interest expense | | | | – | | | | (2 | ) | | | (4 | ) | | | – | | | | 2 | | | | 4 | |
| | | | | | | |
Derivatives not designated as hedging instruments | | | | | | | | | | | | | | | | | | | | | | | | | | | | |
Total return swaps | |
| Compensation and
benefits |
| | | 3 | | | | 12 | | | | 19 | | | | – | | | | – | | | | – | |
FX forward contracts | |
| Other income and
charges |
| | | – | | | | – | | | | (23 | ) | | | – | | | | – | | | | – | |
Treasury rate locks | | | Net interest expense | | | | – | | | | – | | | | (1 | ) | | | – | | | | – | | | | – | |
| | | | | | | $ | 26 | | | $ | 16 | | | $ | 2 | | | $ | (7 | ) | | $ | 2 | | | $ | 7 | |
There was no significant ineffectiveness related to derivatives designated as hedges.
The following table summarizes information on the effective and ineffective portions, before tax, of the Company’s net investment hedge on the Consolidated Statements of Income and in Comprehensive (loss) income for the years ended 2011, 2010 and 2009.
| | | | | | | | | | | | | | | | | | | | | | | | | | | | |
| | | Location of ineffective
portion recognized in
income | | | Ineffective portion
recognized in income
gain (loss) | | | Effective portion recognized
in other comprehensive
loss | |
| (in millions of Canadian dollars) | | | 2011 | | | 2010 | | | 2009 | | | 2011 | | | 2010 | | | 2009 | |
| | | | | | | |
FX on LTD within net investment hedge | | | Other income and charges | | | $ | – | | | $ | 3 | | | | $ (2) | | | | $ (59) | | | $ | 142 | | | | $ 247 | |
22 Other long-term liabilities
| | | | | | | | |
| (in millions of Canadian dollars) | | 2011 | | | 2010 | |
Provision for environmental remediation, net of current portion(1) | | $ | 82 | | | $ | 91 | |
Provision for restructuring, net of current portion(2)(Note 24) | | | 35 | | | | 45 | |
Deferred gains on sale leaseback transactions | | | 38 | | | | 41 | |
Deferred revenue on rights-of-way license agreements, net of current portion | | | 34 | | | | 36 | |
Deferred income credits | | | 32 | | | | 30 | |
Stock-based compensation liabilities, net of current portion | | | 61 | | | | 82 | |
Asset retirement obligations(Note 23) | | | 23 | | | | 22 | |
Other, net of current portion | | | 60 | | | | 121 | |
| | | | | | | | | |
Total other long-term liabilities | | $ | 365 | | | $ | 468 | |
(1) As at December 31, 2011, the aggregate provision for environmental remediation, including the current portion was $97 million (2010 – $107 million).
(2) As at December 31, 2011, the aggregate provision for restructuring, including the current portion was $55 million (2010 – $72 million).
The deferred revenue on rights-of-way license agreements, and deferred gains on sale leaseback transactions are being amortized to income on a straight-line basis over the related lease terms. Deferred income credits are being amortized over the life of the related asset.
Environmental remediation accruals
Environmental remediation accruals cover site-specific remediation programs. Environmental remediation accruals are measured on an undiscounted basis and are recorded when the costs to remediate are probable and reasonably estimable. The estimate of the probable costs to be incurred in the remediation of properties contaminated by past railway use reflects the nature of contamination at individual sites according to typical activities and scale of operations conducted. CP has developed remediation strategies for each property based on the nature and extent of the contamination, as well as the location of the property and surrounding areas that may be adversely affected by the presence of contaminants, considering available technologies, treatment and disposal facilities and the acceptability of site-specific plans based on the local regulatory environment. Site-specific plans range from containment and risk management of the contaminants through to the removal and treatment of the contaminants and affected soils and ground water. The details of the estimates reflect the environmental liability at each property. Provisions for environmental remediation costs are recorded in “Other long-term liabilities”, except for the current portion which is recorded in “Accounts payable and accrued liabilities”. Payments are expected to be made over 10 years to 2021.
The accruals for environmental remediation represent CP’s best estimate of its probable future obligation and includes both asserted and unasserted claims, without reduction for anticipated recoveries from third parties. Although the recorded accruals include CP’s best estimate of all probable costs, CP’s total environmental remediation costs cannot be predicted with certainty. Accruals for environmental remediation may change from time to time as new information about previously untested sites becomes known, environmental laws and regulations evolve and advances are made in environmental remediation technology. The accruals may also vary as the courts decide legal proceedings against outside parties responsible for contamination. These potential charges, which cannot be quantified at this time, may materially affect income in the particular period in which a charge is recognized. Costs related to existing, but as yet unknown, or future contamination will be accrued in the period in which they become probable and reasonably estimable. Changes to costs are reflected as changes to “Other long-term liabilities” or “Accounts payable and accrued liabilities” on the Consolidated Balance Sheets and to “Purchased services and other” within operating expenses on the Consolidated Statements of Income. The amount charged to income in 2011 was $3 million (2010 – $4 million; 2009 – $3 million).
23 Asset retirement obligations
Asset retirement obligations are recorded in “Other long-term liabilities”. The majority of these liabilities are discounted at 6.25%. Accretion expense is included in “Depreciation and amortization” on the Consolidated Statement of Income.
| | | | | | | | |
| (in millions of Canadian dollars) | | 2011 | | | 2010 | |
Opening balance, January 1 | | $ | 22 | | | $ | 27 | |
Accretion | | | 1 | | | | 1 | |
Liabilities settled | | | – | | | | (5 | ) |
Revision to estimated cash flows | | | – | | | | (1 | ) |
| |
Closing balance, December 31 | | $ | 23 | | | $ | 22 | |
Upon the ultimate retirement of grain-dependent branch lines, the Company has to pay a fee, levied under theCanada Transportation Act, of $30,000 per mile of abandoned track. The undiscounted amount of the liability was $41 million at December 31, 2011 (2010 – $41 million), which, when present valued, was $21 million at December 31, 2011 (2010 – $20 million). The payments are expected to be made in the 2012 – 2044 period.
The Company also has a liability on a joint facility that will have to be settled upon retirement based on a proportion of use during the life of the asset. The estimate of the obligation at December 31, 2011, was $18 million (2010 – $18 million), which, when present valued, was $2 million at December 31, 2011 (2010 – $2 million). For purposes of estimating this liability, the payment related to the retirement of the joint facility is anticipated to be made in 33 years.
24 Restructuring accrual
At December 31, 2011, the provision for restructuring was $55 million (2010 – $72 million). The restructuring accrual is primarily for labour liabilities arising from historic initiatives. Payments are expected to continue in diminishing amounts until 2025.
Set out below is a reconciliation of CP’s liabilities associated with its restructuring accrual:
| | | | | | | | |
| (in millions of Canadian dollars) | | 2011 | | | 2010 | |
Opening balance, January 1 | | $ | 72 | | | $ | 77 | |
Accrued | | | 8 | | | | 13 | |
Payments | | | (27 | ) | | | (20 | ) |
Amortization of discount(1) | | | 2 | | | | 3 | |
Foreign exchange impact | | | – | | | | (1 | ) |
| | |
Closing balance, December 31 | | $ | 55 | | | $ | 72 | |
(1) Amortization of discount is charged to income as “Compensation and benefits”.
25 Shareholders’ equity
Authorized and issued share capital
The Company’s Articles of Incorporation authorize for issuance an unlimited number of Common Shares and an unlimited number of First Preferred Shares and Second Preferred Shares. At December 31, 2011, no Preferred Shares had been issued.
An analysis of Common Share balances is as follows:
| | | | | | | | | | | | |
| (number of shares in millions) | | 2011 | | | 2010 | | | 2009 | |
Share capital, January 1 | | | 169.2 | | | | 168.5 | | | | 153.8 | |
Shares issued | | | – | | | | – | | | | 13.9 | |
Shares issued under stock option plans | | | 0.8 | | | | 0.7 | | | | 0.8 | |
| | |
Share capital, December 31 | | | 170.0 | | | | 169.2 | | | | 168.5 | |
On February 3, 2009, CP filed a final prospectus offering for sale to the public, primarily in Canada and the U.S., of up to 13,900,000 CP common shares at a price of $36.75 Canadian per share. The offering closed on February 11, 2009, at which time CP issued 13,900,000 common shares, including 1,300,000 common shares issued under the provisions of an over-allotment option available to the underwriters of the common share offering, for gross proceeds of approximately $511 million (proceeds net of fees and issue costs and including deferred taxes are $495 million).
The change in the “Share capital” balances includes $1 million (2010 – $2 million; 2009 – $1 million) related to the cancellation of the TSARs liability on exercise of tandem stock options, and $11 million (2010 – $8 million; 2009 – $8 million) of stock-based compensation transferred from “Additional paid-in capital”.
26 Pensions and other benefits
The Company has both defined benefit (“DB”) and defined contribution (“DC”) pension plans. At December 31, 2011, the Canadian pension plans represent approximately 99% of total combined pension plan assets and approximately 98% of total combined pension plan obligations.
The DB plans provide for pensions based principally on years of service and compensation rates near retirement. Pensions for Canadian pensioners are partially indexed to inflation. Annual employer contributions to the DB plans, which are actuarially determined, are made on the basis of being not less than the minimum amounts required by federal pension supervisory authorities.
The Company has other benefit plans including post-retirement health and life insurance for pensioners, and post-employment long-term disability and workers’ compensation benefits, which are based on Company-specific claims. At December 31, 2011, the Canadian other benefits plans represent approximately 95% of total combined other plan obligations.
The Pension Committee of the Board of Directors has approved an investment policy that establishes long-term asset mix targets which take into account the Company’s expected risk tolerances. Pension plan assets are managed by a suite of independent investment managers, with the allocation by manager reflecting these asset mix targets. Most of the assets are actively managed with the objective of outperforming applicable capital market indices. In accordance with the investment policy, derivative instruments are used to replicate stock market index returns, to partially hedge foreign currency exposures and to reduce asset/liability interest rate mismatch risk. The investment policy was revised effective April 1, 2011 to prohibit the managers from investing in securities of the Company or its subsidiaries; they are permitted to retain any such securities acquired prior to such date, subject to statutory requirements.
To develop the expected long-term rate of return assumption used in the calculation of net periodic benefit cost applicable to the market-related value of assets, the Company considers the expected composition of the plans’ assets, past experience and future estimates of long-term investment returns. Future estimates of investment returns reflect the expected annual yield on applicable fixed income capital market indices, the long-term expected risk premium (relative to long-term government bond yields) for public equity, real estate and infrastructure securities and the expected added value (relative to applicable capital market indices) from active management of pension fund assets.
The Company has elected to use a market-related value of assets for the purpose of calculating net periodic benefit cost, developed from a five-year average of market values for the plans’ public equity securities (with each prior year’s market value adjusted to the current date for assumed investment income during the intervening period) plus the market value of the plans’ fixed income, real estate and infrastructure securities.
The benefit obligation is discounted using a discount rate that is a blended interest rate for a portfolio of high-quality corporate debt instruments with matching cash flows. The discount rate is determined by management with the aid of third-party actuaries.
The elements of net periodic benefit cost for DB pension plans and other benefits recognized in the year included the following components:
| | | | | | | | | | | | | | | | | | | | | | | | | | |
| | | Pensions | | | | | Other benefits | |
| (in millions of Canadian dollars) | | 2011 | | | 2010 | | | 2009 | | | | | 2011 | | | 2010 | | | 2009 | |
Current service cost (benefits earned by employees in the year) | | $ | 105 | | | $ | 86 | | | $ | 67 | | | | | $ | 17 | | | $ | 16 | | | $ | 14 | |
Interest cost on benefit obligation | | | 460 | | | | 464 | | | | 482 | | | | | | 26 | | | | 28 | | | | 29 | |
Expected return on fund assets | | | (674 | ) | | | (598 | ) | | | (557 | ) | | | | | (1 | ) | | | (1 | ) | | | (1 | ) |
Recognized net actuarial loss | | | 142 | | | | 71 | | | | 7 | | | | | | 8 | | | | 2 | | | | 35 | |
Amortization of prior service costs | | | 13 | | | | 13 | | | | 23 | | | | | | (1 | ) | | | (2 | ) | | | (1 | ) |
Settlement gain(1) | | | – | | | | – | | | | – | | | | | | – | | | | – | | | | (8 | ) |
| |
Net periodic benefit cost | | $ | 46 | | | $ | 36 | | | $ | 22 | | | | | $ | 49 | | | $ | 43 | | | $ | 68 | |
(1) Settlement gains resulted from certain post-retirement benefit obligations being assumed by a U.S. national multi-employer benefit plan.
Information about the Company’s DB pension plans and other benefits, in aggregate, is as follows:
| | | | | | | | | | | | | | | | | | |
| | | Pensions | | | | | Other benefits | |
| (in millions of Canadian dollars) | | 2011 | | | 2010 | | | | | 2011 | | | 2010 | |
| | |
Change in projected benefit obligation: | | | | | | | | | | | | | | | | | | |
Benefit obligation at January 1 | | $ | 8,984 | | | $ | 8,033 | | | | | $ | 494 | | | $ | 484 | |
Current service cost | | | 105 | | | | 86 | | | | | | 17 | | | | 16 | |
Interest cost | | | 460 | | | | 464 | | | | | | 26 | | | | 28 | |
Employee contributions | | | 60 | | | | 54 | | | | | | – | | | | – | |
Benefits paid | | | (471 | ) | | | (469 | ) | | | | | (35 | ) | | | (35 | ) |
Foreign currency changes | | | 3 | | | | (8 | ) | | | | | – | | | | (1 | ) |
Plan amendments and other | | | (3 | ) | | | – | | | | | | 7 | | | | – | |
Actuarial loss | | | 961 | | | | 824 | | | | | | 27 | | | | 2 | |
| |
Projected benefit obligation at December 31 | | $ | 10,099 | | | $ | 8,984 | | | | | $ | 536 | | | $ | 494 | |
| | |
Change in fund assets: | | | | | | | | | | | | | | | | | | |
Fair value of fund assets at January 1 | | $ | 8,310 | | | $ | 7,014 | | | | | $ | 11 | | | $ | 12 | |
Actual return on fund assets | | | 621 | | | | 880 | | | | | | – | | | | – | |
Employer contributions | | | 693 | | | | 837 | | | | | | 35 | | | | 34 | |
Employee contributions | | | 60 | | | | 54 | | | | | | – | | | | – | |
Benefits paid | | | (471 | ) | | | (469 | ) | | | | | (35 | ) | | | (35 | ) |
Foreign currency changes | | | 2 | | | | (6 | ) | | | | | – | | | | – | |
| |
Fair value of fund assets at December 31 | | $ | 9,215 | | | $ | 8,310 | | | | | $ | 11 | | | $ | 11 | |
| |
Funded status – plan deficit | | $ | (884 | ) | | $ | (674 | ) | | | | $ | (525 | ) | | $ | (483 | ) |
| | | | | | | | | | | | | | | | | | | |
Amounts recognized in the Company’s Consolidated Balance Sheet are as follows:
| | | | | | | | | | | | | | | | | | |
| | | Pensions | | | | | Other benefits | |
| (in millions of Canadian dollars) | | 2011 | | | 2010 | | | | | 2011 | | | 2010 | |
| | | | | | | | | | | | | | | | | | | |
Accounts payable and accrued liabilities | | $ | – | | | $ | – | | | | | $ | 37 | | | $ | 41 | |
Pension and other benefit liabilities | | | 884 | | | | 674 | | | | | | 488 | | | | 442 | |
| |
Total amount recognized | | $ | 884 | | | $ | 674 | | | | | $ | 525 | | | $ | 483 | |
| | | | | | | | | | | | | | | | | | | |
The defined benefit pension plans’ accumulated benefit obligation as at December 31, 2011 was $9,618 million (2010 – $8,580 million). The accumulated benefit obligation is calculated on a basis similar to the projected benefit obligation, except no future salary increases are assumed in the projection of future benefits.
The measurement date used to determine the plan assets and the accrued benefit obligation is December 31. The most recent actuarial valuation for pension funding purposes for the Company’s main Canadian pension plan was performed as at January 1, 2011. During 2012, the Company expects to file a new valuation with the pension regulator.
Amounts recognized in accumulated other comprehensive loss are as follows:
| | | | | | | | | | | | | | | | | | |
| | | Pensions | | | | | Other benefits | |
| (in millions of Canadian dollars) | | 2011 | | | 2010 | | | | | 2011 | | | 2010 | |
| | |
Net actuarial loss: | | | | | | | | | | | | | | | | | | |
Other than deferred investment losses | | $ | 3,063 | | | $ | 2,309 | | | | | $ | 119 | | | $ | 99 | |
Deferred investment losses | | | 665 | | | | 547 | | | | | | – | | | | – | |
Prior service cost | | | 1 | | | | 17 | | | | | | 4 | | | | (3 | ) |
Deferred income tax | | | (1,030 | ) | | | (807 | ) | | | | | (34 | ) | | | (27 | ) |
| |
Total | | $ | 2,699 | | | $ | 2,066 | | | | | $ | 89 | | | $ | 69 | |
| | | | | | | | | | | | | | | | | | | |
The unamortized actuarial loss and the unamortized prior service cost included in “Accumulated other comprehensive loss” that is expected to be recognized in net periodic benefit cost during 2012 are $207 million and $2 million, respectively, for pensions and $6 million and a recovery of $1 million, respectively, for other post-retirement benefits.
Weighted-average actuarial assumptions used were approximately:
| | | | | | | | | | | | |
| (percentages) | | 2011 | | | 2010 | | | 2009 | |
| | |
Benefit obligation at December 31: | | | | | | | | | | | | |
Discount rate | | | 4.55 | | | | 5.20 | | | | 5.90 | |
Projected future salary increases | | | 3.00 | | | | 3.00 | | | | 3.00 | |
Health care cost trend rate | | | 8.00 | (1) | | | 8.00 | (1) | | | 8.50 | (2) |
Benefit cost for year ended December 31: | | | | | | | | | | | | |
Discount rate | | | 5.20 | | | | 5.90 | | | | 7.00 | |
Expected rate of return on fund assets | | | 7.75 | | | | 7.75 | | | | 7.75 | |
Projected future salary increases | | | 3.00 | | | | 3.00 | | | | 3.00 | |
Health care cost trend rate | | | 8.00 | (1) | | | 8.50 | (2) | | | 9.00 | (2) |
| | | | | | | | | | | | | |
(1) The health care cost trend rate is assumed to be 8.0% in 2012 and 2013, and then decreasing by 0.5% per year to an ultimate rate of 5.0% per year in 2019 and thereafter.
(2) The health care cost trend rate was previously projected to decrease by 0.5% per year to approximately 5.0% per year in 2017.
Assumed health care cost trend rates have a significant effect on the amounts reported for the health care plans. A one-percentage-point change in the assumed health care cost trend rate would have the following effects:
| | | | | | | | |
| (in millions of Canadian dollars) Favorable (unfavorable) | | One percentage
point increase | | | One percentage
point decrease | |
| | | | | | | | | |
Effect on the total of service and interest costs | | | (1 | ) | | | 1 | |
Effect on post-retirement benefit obligation | | | (9 | ) | | | 9 | |
| | | | | | | | | |
Plan assets
Plan assets are recorded at fair value. The major asset categories are public equity securities, debt securities, and real estate and infrastructure funds. The fair values of the public equity and debt securities (other than Level 3 mortgages) are based on quoted market prices. The fair value of each Level 3 mortgage is based on the yield of a similar term Government of Canada bond plus a yield spread provided by a third party that reflects the mortgage’s credit quality. Real estate values are based on annual valuations performed by external parties, taking into account current market conditions and recent sales transactions where practical and appropriate. Infrastructure values are based on the fair value of each fund’s assets as calculated by the fund manager, generally using a discounted cash flow analysis that takes into account current market conditions and recent sales transactions where practical and appropriate.
The Company’s pension plan asset allocation, the current weighted-average asset allocation targets and the current weighted-average policy range for each major asset class, were as follows:
| | | | | | | | | | | | | | |
| | | | | | | | Percentage of plan assets
at December 31 | |
| Asset allocation (percentage) | | Current asset allocation target | | | Current policy range | | 2011 | | | 2010 | |
| | | | | | | | | | | | | | | |
Public equity securities | | | 45.7 | | | 30 – 51 | | | 40.1 | | | | 47.7 | |
Debt securities | | | 42.3 | | | 39 – 53 | | | 49.2 | | | | 41.8 | |
Real estate and infrastructure | | | 12.0 | | | 10 – 17 | | | 10.7 | | | | 10.5 | |
| | | | | | | | | | | | | | | |
Total | | | | | | | | | 100.0 | | | | 100.0 | |
| | | | | | | | | | | | | | | |
The asset allocation, as at December 31, 2011, varies from the current asset allocation targets due to both the phasing in, over several months, of the investment of the $600 million voluntary prepayment made in December 2011 and the deferral of asset allocation rebalancing until the recent market volatility subsides.
The following is a summary of the assets of the Company’s defined benefit pension plans at fair values at December 31, 2011 and a comparative summary at December 31, 2010:
| | | | | | | | | | | | | | | | |
| (in millions of Canadian dollars) | | Quoted prices in
active markets for
identical assets
(Level 1) | | | Significant other
observable
inputs
(Level 2) | | | Significant
unobservable
inputs
(Level 3) | | | Total | |
| | | | | | | | | | | | | | | | | |
December 31, 2011 | | | | | | | | | | | | | | | | |
Cash and cash equivalents | | $ | 48 | | | $ | 299 | | | $ | – | | | $ | 347 | |
Government bonds | | | – | | | | 2,839 | | | | – | | | | 2,839 | |
Corporate bonds | | | – | | | | 1,264 | | | | – | | | | 1,264 | |
Mortgages | | | – | | | | 18 | | | | 4 | | | | 22 | |
Public equities | | | | | | | | | | | | | | | | |
• Canada | | | 882 | | | | 81 | | | | – | | | | 963 | |
• U.S. and international | | | 2,310 | | | | 30 | | | | – | | | | 2,340 | |
Real estate | | | – | | | | – | | | | 691 | | | | 691 | |
Infrastructure | | | – | | | | – | | | | 294 | | | | 294 | |
Derivative assets(1) | | | – | | | | 455 | | | | – | | | | 455 | |
| | | | | | | | | | | | | | | | | |
| | $ | 3,240 | | | $ | 4,986 | | | $ | 989 | | | $ | 9,215 | |
| | | | | | | | | | | | | | | | | |
December 31, 2010 | | | | | | | | | | | | | | | | |
Cash and cash equivalents | | $ | 35 | | | $ | 71 | | | $ | – | | | $ | 106 | |
Government bonds | | | – | | | | 2,398 | | | | – | | | | 2,398 | |
Corporate bonds | | | – | | | | 941 | | | | – | | | | 941 | |
Mortgages | | | – | | | | 16 | | | | 5 | | | | 21 | |
Public equities | | | | | | | | | | | | | | | | |
• Canada | | | 1,050 | | | | 67 | | | | – | | | | 1,117 | |
• U.S. and international | | | 2,438 | | | | 44 | | | | – | | | | 2,482 | |
Real estate | | | – | | | | – | | | | 620 | | | | 620 | |
Infrastructure | | | – | | | | – | | | | 254 | | | | 254 | |
Derivative assets(1) | | | – | | | | 371 | | | | – | | | | 371 | |
| | | | | | | | | | | | | | | | | |
| | $ | 3,523 | | | $ | 3,908 | | | $ | 879 | | | $ | 8,310 | |
| | | | | | | | | | | | | | | | | |
(1) The Company’s pension funds utilize the following derivative instruments: equity futures to replicate equity index returns (Level 2); currency forwards to partially hedge foreign currency exposures (Level 2); bond forwards to reduce asset/liability interest rate risk exposures (Level 2); interest rate swaps to manage duration and interest rate risk (Level 2); credit default swaps to manage credit risk (Level 2); and options to manage interest rate risk and volatility (Level 2).
During 2010 and 2011 the portion of the assets of the Company’s defined benefit pension plans measured at fair value using unobservable inputs (Level 3) changed as follows:
| | | | | | | | | | | | | | | | |
| (in millions of Canadian dollars) | | Mortgages | | | Real estate | | | Infrastructure | | | Total | |
| | | | | | | | | | | | | | | | | |
As at January 1, 2010 | | $ | 12 | | | $ | 576 | | | $ | 240 | | | $ | 828 | |
Contributions | | | – | | | | 10 | | | | 53 | | | | 63 | |
Disbursements | | | (7 | ) | | | (17 | ) | | | (44 | ) | | | (68 | ) |
Net realized gain (loss) | | | – | | | | 27 | | | | (2 | ) | | | 25 | |
Increase in net unrealized gains | | | – | | | | 24 | | | | 7 | | | | 31 | |
| | | | | | | | | | | | | | | | | |
As at December 31, 2010 | | $ | 5 | | | $ | 620 | | | $ | 254 | | | $ | 879 | |
Contributions | | | – | | | | 7 | | | | 17 | | | | 24 | |
Disbursements | | | (2 | ) | | | (10 | ) | | | – | | | | (12 | ) |
Net realized gain | | | – | | | | 4 | | | | – | | | | 4 | |
Increase in net unrealized gains | | | 1 | | | | 70 | | | | 23 | | | | 94 | |
| | | | | | | | | | | | | | | | | |
As at December 31, 2011 | | $ | 4 | | | $ | 691 | | | $ | 294 | | | $ | 989 | |
| | | | | | | | | | | | | | | | | |
The Company’s investment strategy is to achieve a long-term (five to ten-year period) real rate of return of 5.25%, net of all fees and expenses. The Company’s best estimate of long-term inflation of 2.5% yields an expected long-term nominal target of 7.75%, net of all fees and expenses. In identifying the asset allocation ranges, consideration was given to the long-term nature of the underlying plan liabilities, the solvency and going-concern financial position of the plan, long-term return expectations and the risks associated with key asset classes as well as the relationships of returns on key asset classes with each other, inflation and interest rates. When advantageous and with due consideration, derivative instruments may be utilized, provided the total value of the underlying assets represented by financial derivatives, excluding currency forwards, is limited to 30% of the market value of the fund.
When investing in foreign securities, the plans are exposed to foreign currency risk. Most of the plans’ non-Canadian public equity and infrastructure foreign currency exposures are 50% hedged. Most of the plans’ debt securities and all of the plans’ real estate holdings are Canadian-dollar denominated. Net of the above hedging, the plans were 9% exposed to the U.S. dollar, 5% exposed to European currencies, and 5% exposed to various other currencies, as at December 31, 2011.
At December 31, 2011, fund assets consisted primarily of listed stocks and bonds, including none of the Company’s Common Shares (2010 – 147,540) at a market value of $nil (2010 – $10 million), 6.91% Secured Equipment Notes issued by the Company at a par value of $2 million (2010 – $4 million) and a market value of $3 million (2010 – $4 million), and 6.25% Unsecured Notes issued by the Company at a par value of $2 million (2010 – $2 million) and a market value of $2 million (2010 – $2 million).
Cash flows
In 2011, the Company contributed $698 million to its pension plans (2010 – $840 million; 2009 – $598 million), including $5 million to the defined contribution plans (2010 – $3 million; 2009 – $3 million), $696 million to the Canadian registered and U.S. qualified defined benefit pension plans (2010 – $829 million; 2009 – $587 million), and a net refund of $3 million from the Canadian non-registered supplemental pension plan (2010 – $8 million contribution; 2009 – $8 million contribution). Contributions to the Canadian registered defined benefit plan included voluntary prepayments of $600 million in 2011, $650 million in 2010, and $500 million in 2009. The contributions to the U.S. qualified defined benefit pension plans included a voluntary prepayment of $7 million in 2009. These prepayments were made in order to reduce the volatility of future pension funding requirements. In addition, the Company made payments directly to employees, their beneficiaries or estates or to third-party benefit administrators of $35 million in 2011 (2010 – $34 million; 2009 – $38 million) with respect to other benefits.
Total contributions for all of the Company’s defined benefit pension plans are expected to be in the range of $100 million to $125 million in 2012.
Estimated future benefit payments
The estimated future defined benefit pension and other benefit payments to be paid by the plans for each of the next five years and the subsequent five-year period are as follows:
| | | | | | | | |
| (in millions of Canadian dollars) | | Pensions | | | Other benefits | |
| | | | | | | | | |
2012 | | $ | 473 | | | $ | 36 | |
2013 | | | 493 | | | | 37 | |
2014 | | | 504 | | | | 38 | |
2015 | | | 519 | | | | 39 | |
2016 | | | 535 | | | | 39 | |
2017 – 2021 | | | 2,867 | | | | 202 | |
| | | | | | | | | |
The benefit payments from the Canadian registered and U.S. qualified defined benefit pension plans are payable from their respective pension funds. Benefit payments from the supplemental pension plan and from the other benefits plans are payable directly from the Company.
Defined contribution plan
Canadian non-unionized employees hired prior to July 1, 2010 had the option to participate in the Canadian DC plan. All Canadian non-unionized employees hired after such date must participate in this plan. Employee contributions are based on a percentage of salary. The Company matches employee contributions to a maximum percentage each year.
Effective July 1, 2010, a new U.S. DC plan was established. All U.S. non-unionized employees hired after such date must participate in this plan. Employees do not contribute to the plan. The Company annually contributes a percentage of salary.
The DC plans provide a pension based on total employee and employer contributions plus investment income earned on those contributions.
In 2011, the net cost of the DC plans, which generally equals the employer’s required contribution, was $5 million (2010 – $3 million; 2009 – $3 million).
Contributions to multi-employer plans
Some of the Company’s unionized employees in the U.S. are members of a U.S. national multi-employer benefit plan. Contributions made by the Company to this plan in 2011 in respect of post-retirement medical benefits were $6 million (2010 – $5 million, 2009 – $3 million).
27 Stock-based compensation
At December 31, 2011, the Company had several stock-based compensation plans, including stock option plans, various cash settled liability plans and an employee stock savings plan. These plans resulted in an expense in 2011 of $43 million (2010 – $71 million; 2009 – $68 million).
A. Stock option plans
Regular options and TSARs
With the granting of regular options, employees may be simultaneously granted TSARs equivalent to the number of regular options granted (stock options granted prior to January 2009 were simultaneously granted TSARs equivalent to one-half the regular options granted). The last issue of TSARs was in April 2010. A TSAR entitles the holder to receive payment of an amount equal to the excess of the market value of a Common Share at the exercise date of the TSAR over the related option exercise price. The liability for TSARs is recognized and measured at its fair value. Regular options and TSARs may be exercised no earlier than two years and no later than 10 years after the grant date.
Where an option granted is a tandem award, the holder can choose to exercise an option or a TSAR of equal intrinsic value.
As a result of changes to Canadian tax legislation, which eliminated the favourable tax treatment on cash settled compensation awards, the Company offered employees the option of cancelling the outstanding SAR and keeping in place the outstanding option. During 2011, the Company cancelled 3.5 million SARs and reclassified the fair value of the previously recognized liability ($75 million) and the recognized deferred tax asset ($18 million) to “Additional paid-in capital”. The terms of the awards were not changed and as a result no incremental cost was recognized. The weighted-average fair value of the units cancelled was $23.75. Compensation cost will continue to be recognized over the remaining vesting period for those options not yet vested.
Performance options
Performance options, granted prior to 2007, vest after 48 months, unless certain performance targets are achieved, in which case vesting is accelerated, and will expire five years after the grant date (“performance-accelerated options”). Beginning in 2007, performance options granted will only vest when certain performance targets are achieved and will not vest if the performance targets are not achieved within a specific time frame. These options will expire five years and three months after the grant date (“performance-contingent options”).
Summary of regular and performance options
The following table summarizes the Company’s fixed stock option plans (that do not have a TSAR attached to them) as at December 31:
| | | | | | | | | | | | | | | | |
| | | Options outstanding | | | Nonvested options | |
| | | Number of
options | | | Weighted
average
exercise price | | | Number of
options | | | Weighted
average
grant date
fair value | |
| | | | | | | | | | | | | | | | | |
Outstanding, January 1, 2011 | | | 3,530,698 | | | $ | 53.36 | | | | 1,096,275 | | | $ | 18.18 | |
New options granted | | | 632,400 | | | | 65.03 | | | | 632,400 | | | | 19.44 | |
Transferred from TSARs | | | 3,534,910 | | | | 47.44 | | | | 1,563,675 | | | | 11.63 | |
Exercised | | | (752,085 | ) | | | 34.77 | | | | NA | | | | NA | |
Vested | | | NA | | | | NA | | | | (635,000 | ) | | | 12.19 | |
Forfeited | | | (30,600 | ) | | | 52.73 | | | | (7,300 | ) | | | 22.26 | |
| | | | | | | | | | | | | | | | |
Outstanding at December 31, 2011 | | | 6,915,323 | | | $ | 53.42 | | | | 2,650,050 | | | $ | 16.04 | |
| | | | | | | | | | | | | | | | |
Vested or expected to vest at December 31, 2011(1) | | | 6,050,046 | | | $ | 51.37 | | | | NA | | | $ | NA | |
| | | | | | | | | | | | | | | | |
Exercisable at December 31, 2011 | | | 4,265,273 | | | $ | 50.43 | | | | NA | | | $ | NA | |
| | | | | | | | | | | | | | | | | |
(1) As at December 31, 2011, the weighted-average remaining term of vested or expected to vest options was 5.3 years with an aggregate intrinsic value of $109 million.
The following table provides the number of stock options outstanding and exercisable as at December 31, 2011 by range of exercise price and their related intrinsic aggregate value, and for options outstanding, the weighted-average years to expiration. The table also provides the aggregate intrinsic value for in-the-money stock options, which represents the amount that would have been received by option holders had they exercised their options on December 31, 2011 at the Company’s closing stock price of $69.01.
| | | | | | | | | | | | | | | | | | | | | | | | | | | | |
| | | Options outstanding | | | Options exercisable | |
| Range of exercise prices | | Number of
options | | | Weighted
average
years to
expiration | | | Weighted
average
exercise
price | | | Aggregate
intrinsic
value
(millions) | | | Number of
options | | | Weighted
average
exercise
price | | | Aggregate
intrinsic
value
(millions) | |
| | | | | | | | | | | | | | | | | | | | | | | | | | | | | |
$27.62 – $40.47 | | | 1,743,998 | | | | 3.5 | | | $ | 33.66 | | | $ | 62 | | | | 1,396,948 | | | $ | 33.00 | | | $ | 50 | |
$42.05 – $60.69 | | | 2,244,775 | | | | 5.2 | | | | 51.19 | | | | 40 | | | | 1,431,675 | | | | 50.68 | | | | 26 | |
$62.56 – $74.89 | | | 2,926,550 | | | | 4.9 | | | | 66.82 | | | | 10 | | | | 1,436,650 | | | | 67.15 | | | | 5 | |
| | | | | | | | | | | | | | | | | | | | | | | | | | | | |
Total(1) | | | 6,915,323 | | | | 4.6 | | | $ | 53.42 | | | $ | 112 | | | | 4,265,273 | | | $ | 50.43 | | | $ | 81 | |
| | | | | | | | | | | | | | | | | | | | | | | | | | | | | |
(1) As at December 31, 2011, the total number of in-the-money stock options outstanding was 5,730,673 with a weighted-average exercise price of $49.60. The weighted-average years to expiration of exercisable stock options is 4.8 years.
Under the fair value method, the fair value of options at the grant date was approximately $12 million for options issued in 2011 (2010 – $1 million; 2009 – $nil). The weighted-average fair value assumptions were approximately:
| | | | | | | | | | | | |
| | | 2011 | | | 2010 | | | 2009 | |
| | | | | | | | | | | | | |
Expected option life (years)(1) | | | 6.30 | | | | 6.25 | | | | 5.00 | |
Risk-free interest rate(2) | | | 2.79 | % | | | 2.78 | % | | | 2.35 | % |
Expected stock price volatility(3) | | | 31 | % | | | 30 | % | | | 23 | % |
Expected annual dividends per share(4) | | $ | 1.20 | | | $ | 1.08 | | | $ | 0.99 | |
Estimated forfeiture rate(5) | | | 0.7 | % | | | 0.7 | % | | | 2.3 | % |
Weighted-average grant date fair value of options granted during the year | | $ | 19.44 | | | $ | 15.90 | | | $ | 6.52 | |
| | | | | | | | | | | | | |
(1) Represents the period of time that awards are expected to be outstanding. Historical data on exercise behaviour was used to estimate the expected life of the option.
(2) Based on the implied yield available on zero-coupon government issues with an equivalent remaining term at the time of the grant.
(3) Based on the historical stock price volatility of the Company’s stock over a period commensurate with the expected term of the option.
(4) Determined by the current annual dividend. The Company does not employ different dividend yields throughout the year.
(5) The Company estimated forfeitures based on past experience. The rate is monitored on a periodic basis.
In 2011, the expense for stock options (regular and performance) was $15 million (2010 – $2 million; 2009 – recovery of $1 million). At December 31, 2011, there was $5 million of total unrecognized compensation related to stock options which is expected to be recognized over a weighted-average period of approximately 0.9 years.
Currently, the Company is not subject to post vesting restrictions on its stock option plans prior to expiry.
At December 31, 2011, there were 3,459,831 (2010 – 1,048,531; 2009 – 1,831,361) Common Shares available for the granting of future options under the stock option plans, out of the 15,578,642 (2010 – 15,578,642; 2009 – 15,578,642) Common Shares currently authorized for issuance.
Summary of TSARs
The following table summarizes information related to the Company’s TSARs as at December 31:
| | | | | | | | | | | | | | | | |
| | | TSARs outstanding | | | Nonvested TSARs | |
| | | Number of
TSARs | | | Weighted
average
exercise price | | | Number of
TSARs | | | Weighted
average
grant date
fair value | |
| | | | | | | | | | | | | | | | | |
Outstanding, January 1, 2011 | | | 3,998,910 | | | $ | 47.43 | | | | 1,766,975 | | | $ | 11.54 | |
Exercised as TSARs | | | (1,300 | ) | | | 30.50 | | | | NA | | | | NA | |
Exercised as Options | | | (65,400 | ) | | | 41.01 | | | | NA | | | | NA | |
Vested | | | NA | | | | NA | | | | (142,500 | ) | | | 10.43 | |
Transferred to Options | | | (3,534,910 | ) | | | 47.44 | | | | (1,563,675 | ) | | | 11.63 | |
Forfeited | | | (13,900 | ) | | | 61.69 | | | | (4,200 | ) | | | 14.02 | |
| | | | | | | | | | | | | |
Outstanding at December 31, 2011 | | | 383,400 | | | $ | 47.97 | | | | 56,600 | | | $ | 11.73 | |
| | | | | | | | | | | | | |
Vested or expected to vest at December 31, 2011(1) | | | 383,400 | | | $ | 47.97 | | | | NA | | | $ | NA | |
| | | | | | | | | | | | | |
Exercisable at December 31, 2011 | | | 326,800 | | | $ | 48.28 | | | | NA | | | $ | NA | |
| | | | | | | | | | | | | | | | | |
(1) As at December 31, 2011, the weighted-average remaining term of vested or expected to vest TSARs was 4.2 years with an aggregate intrinsic value of $8 million.
The following table provides the number of TSARs outstanding and exercisable as at December 31, 2011 by range of exercise price and their related intrinsic value, and for TSARs outstanding, the weighted-average years to expiration. The table also provides the aggregate intrinsic value for in-the-money TSARs, which represents the amount that would have been received by TSAR holders had they exercised their TSAR on December 31, 2011 at the Company’s closing stock price of $69.01.
| | | | | | | | | | | | | | | | | | | | | | | | | | | | |
| | | TSARs outstanding | | | TSARs exercisable | |
| Range of exercise prices | | Number of
TSARs | | | Weighted
average
years to
expiration | | | Weighted
average
exercise
price | | | Aggregate
intrinsic
value
(millions) | | | Number of
TSARs | | | Weighted
average
exercise
price | | | Aggregate
intrinsic
value
(millions) | |
| | | | | | | | | | | | | | | | | | | | | | | | | | | | | |
$30.50 – $40.47 | | | 141,650 | | | | 3.1 | | | $ | 33.24 | | | $ | 5 | | | | 122,350 | | | $ | 32.76 | | | $ | 5 | |
$42.05 – $60.69 | | | 146,800 | | | | 4.7 | | | | 49.87 | | | | 3 | | | | 109,500 | | | | 49.40 | | | | 2 | |
$62.56 – $72.58 | | | 94,950 | | | | 4.9 | | | | 66.99 | | | | – | | | | 94,950 | | | | 66.99 | | | | – | |
| | | | | | | | | | | | | | | | | | | | | | | | | |
Total(1) | | | 383,400 | | | | 4.2 | | | $ | 47.97 | | | $ | 8 | | | | 326,800 | | | $ | 48.28 | | | $ | 7 | |
| | | | | | | | | | | | | | | | | | | | | | | | | | | | | |
(1) As at December 31, 2011, the total number of in-the-money TSARs outstanding was 337,750 with a weighted-average exercise price of $44.76. The weighted-average years to expiration of exercisable TSARs is 4.0 years.
There were no TSARs issued in 2011. Under the fair value method, the fair value of TSARs at the grant date was $12 million in 2010 (2009 – $6 million). The weighted-average fair value of TSARs granted during 2010 was $14.27 (2009 – $7.39).
In 2011, the expense for TSARs was $4 million (2010 – $32 million; 2009 – $43 million).
Summary of stock option plans
The following table refers to the total fair value of shares vested for all stock option plans (including TSARs) during the years ended December 31:
| | | | | | | | | | | | |
| (in millions of Canadian dollars) | | 2011 | | | 2010 | | | 2009 | |
| | | | | | | | | | | | | |
Regular stock option plan | | $ | 8 | | | $ | 6 | | | $ | 6 | |
TSARs | | | 1 | | | | 6 | | | | 6 | |
| | | | | | | | | | | | | |
Total | | $ | 9 | | | $ | 12 | | | $ | 12 | |
| | | | | | | | | | | | | |
The following table provides information related to all options exercised in the stock option plans during the years ended December 31:
| | | | | | | | | | | | |
| (in millions of Canadian dollars) | | 2011 | | | 2010 | | | 2009 | |
| | | | | | | | | | | | | |
Total intrinsic value | | $ | 17 | | | $ | 10 | | | $ | 8 | |
Cash received by the Company upon exercise of options | | | 29 | | | | 32 | | | | 24 | |
| | | | | | | | | | | | | |
B. Other share-based plans
Performance share unit (“PSU”) plan
During 2011, the Company issued 269,300 PSUs. These units attract dividend equivalents in the form of additional units based on the dividends paid on the Company’s Common Shares. PSUs vest and are settled in cash approximately three years after the grant date contingent upon CP’s performance (performance factor). The fair value of PSUs are measured, both on the grant date and each subsequent quarter until settlement, using a Monte Carlo simulation model. The model utilizes multiple input variables that determine the probability of satisfying the performance and market condition stipulated in the grant.
The following table summarizes information related to the Company’s PSUs as at December 31:
| | | | | | | | |
| | | 2011 | | | 2010 | |
| | | | | | | | | |
Outstanding, January 1 | | | 700,468 | | | | 422,534 | |
Granted | | | 269,300 | | | | 328,020 | |
Units, in lieu of dividends | | | 16,487 | | | | 10,707 | |
Vested | | | NA | | | | NA | |
Forfeited | | | (55,944 | ) | | | (60,793 | ) |
| | | | | | | | | |
Outstanding at December 31 | | | 930,311 | | | | 700,468 | |
| | | | | | | | | |
Vested, or expected to vest at December 31 | | | 359,532 | | | | – | |
| | | | | | | | | |
Under the fair value method, the fair value of PSUs at the grant date was $16 million for PSUs issued in 2011 (2010 – $15 million; 2009 – $15 million).
In 2011, the expense for PSUs was $15 million (2010 – $29 million; 2009 – $10 million). At December 31, 2011, there was $17 million of total unrecognized compensation related to PSUs which is expected to be recognized over a weighted-average period of approximately 1.6 years.
Deferred share unit plan
The Company established the DSU plan as a means to compensate and assist in attaining share ownership targets set for certain key employees and Directors. A DSU entitles the holder to receive, upon redemption, a cash payment equivalent to the market value of a Common Share at the redemption date. DSUs vest over various periods of up to 36 months and are only redeemable for a specified period after employment is terminated.
Key employees may choose to receive DSUs in lieu of cash payments for certain incentive programs. In addition, when acquiring Common Shares to meet share ownership targets, key employees may be granted a matching number of DSUs up to 33% of the shares and DSUs acquired during the first six months after becoming eligible under the plan and, thereafter, up to 25%. Key employees have five years to meet their ownership targets.
An expense to income for DSUs is recognized over the vesting period for both the initial subscription price and the change in value between reporting periods.
The following table summarizes information related to the DSUs as at December 31:
| | | | | | | | |
| | | 2011 | | | 2010 | |
| | | | | | | | | |
Outstanding, January 1 | | | 388,346 | | | | 345,843 | |
Granted | | | 67,306 | | | | 37,802 | |
Transferred from RSUs | | | – | | | | 18,756 | |
Units, in lieu of dividends | | | 7,732 | | | | 6,226 | |
Redeemed | | | (67,078 | ) | | | (20,281 | ) |
| | | | | | | | | |
Outstanding, December 31 | | | 396,306 | | | | 388,346 | |
| | | | | | | | | |
In 2011, the expense for DSUs was $5 million (2010 – $6 million; 2009 – $8 million).
Restricted share unit plan
The Company issued 64,470 RSUs in 2011 (2010 – 151; 2009 – 405). The fair value of RSUs at the grant date was $4 million. The RSUs are subject to time vesting. An expense to income for RSUs is recognized over the vesting period. At December 31, 2011, there was $4 million of total unrecognized compensation related to RSUs which is expected to be recognized over a weighted-average period of approximately 2.9 years.
Summary of share based liabilities paid
The following table summarizes the total share based liabilities paid for each of the years ended December 31:
| | | | | | | | | | | | |
| (in millions of Canadian dollars) | | 2011 | | | 2010 | | | 2009 | |
| | | | | | | | | | | | | |
Plan | | | | | | | | | | | | |
TSARs | | $ | – | | | $ | – | | | $ | 3 | |
DSUs | | | 4 | | | | 2 | | | | – | |
| | | | | | | | | | | | | |
Total | | $ | 4 | | | $ | 2 | | | $ | 3 | |
| | | | | | | | | | | | | |
C. Employee share purchase plan
The Company has an employee share purchase plan whereby both employee and Company contributions are used to purchase shares on the open market for employees. The Company’s contributions are expensed over the one-year vesting period. Under the plan, the Company matches $1 for every $3 contributed by employees up to a maximum employee contribution of 6% of annual salary. On April 1, 2009, the Company suspended its match to employee ESPP contributions. The match to non-union employee contributions was reinstated effective January 1, 2010.
At December 31, 2011, there were 13,984 participants (2010 – 13,525; 2009 – 13,261) in the plan. The total number of shares purchased in 2011 on behalf of participants, including the Company contribution, was 630,480 (2010 – 618,272; 2009 – 883,737). In 2011, the Company’s contributions totalled $4 million (2010 – $3 million; 2009 – $3 million) and the related expense was $4 million (2010 – $2 million; 2009 – $7 million).
28 Variable interest entities
The Company leases equipment from certain trusts, which have been determined to be variable interest entities financed by a combination of debt and equity provided by unrelated third parties. The lease agreements, which are classified as operating leases, have a fixed price purchase option which create the Company’s variable interest and result in the trusts being considered variable interest entities. These fixed price purchase options are set at the estimated fair market value as determined at the inception of the lease and could provide the Company with potential gains. These options are considered variable interests, however, they are not expected to provide a significant benefit to the Company.
Responsibility for maintaining and operating the leased assets according to specific contractual obligations outlined in the terms of the lease agreements and industry standards is the Company’s. The rigor of the contractual terms of the lease agreements and industry standards are such that the Company has limited discretion over the maintenance activities associated with these assets. As such the Company concluded these terms do not provide the Company with the power to direct the activities of the variable interest entities in a way that has a significant impact on the entities’ economic performance.
The financial exposure to the Company as a result of its involvement with the variable interest entities is equal to the fixed lease payments due to the trusts. In 2011, lease payments after tax were $8 million. Future minimum lease payments, before tax, of $226 million will be payable over the next 19 years(Note 29).
The Company does not guarantee the residual value of the assets to the lessor, however, it must deliver to the lessor the assets in good operating condition, subject to normal wear and tear, at the end of the lease term.
As the Company’s actions and decisions do not significantly affect the variable interest entities’ performance, and the Company’s fixed purchase price option is not considered to be potentially significant to the variable interest entities, the Company is not considered to be the primary beneficiary, and does not consolidate these variable interest entities. As the leases are considered to be operating leases, the Company does not recognize any balances in the Consolidated Balance Sheets in relation to the variable interest entities.
29 Commitments and contingencies
In the normal course of its operations, the Company becomes involved in various legal actions, including claims relating to injuries and damage to property. The Company maintains provisions it considers to be adequate for such actions. While the final outcome with respect to actions outstanding or pending at December 31, 2011, cannot be predicted with certainty, it is the opinion of management that their resolution will not have a material adverse effect on the Company’s financial position or results of operations.
At December 31, 2011, the Company had committed to total future capital expenditures amounting to $366 million and operating expenditures amounting to $1,810 million for the years 2012-2030.
On October 31, 2011, CP completed arrangements with 12 highly rated financial institutions for a committed $1.0 billion four year revolving credit agreement with an accordion feature of up to $1.3 billion. This agreement incorporates a revolving facility limit of $600 million and a separate letter of credit facility limit of $400 million at pre-agreed pricing and has the ability to annually extend the term for an additional year with the consent of the lenders. At December 31, 2011, CP had available $429 million under the revolving facility limit and $156 million available under the letter of credit facility limit. In addition, CP also has available from a financial institution a revolving credit agreement of $106 million, of which $106 million was available on December 31, 2011. This agreement is available through the end of 2013. With respect to both agreements the company had utilized $390 million for letters of credit and $25 million as short-term borrowings, in addition to a bank overdraft of $2 million. The weighted-average annual interest rate for short-term borrowings was 1.98% (2010 – not applicable; 2009 – 1.91%). Both agreements are required to maintain a maximum debt to total capitalization ratio and the $106 million agreement is currently subject to a minimum fixed charge coverage ratio. Should our senior unsecured debt not be rated at least investment grade by Moody’s and S&P, our $1.0 billion credit agreement will also be required to maintain a minimum fixed charge coverage ratio. At December 31, 2011, the Company satisfied the thresholds stipulated in both financial covenants.
Minimum payments under operating leases were estimated at $813 million in aggregate, with annual payments in each of the five years following 2011 of (in millions): 2012 – $145; 2013 – $131; 2014 – $96; 2015 – $83; 2016 – $65.
Expenses for operating leases for the year ended December 31, 2011 was $161 million (2010 – $169 million, 2009 – $196 million).
The DM&E was purchased for $1.5 billion in 2007 (Note 17). Future contingent payments of up to approximately US$1.2 billion consisting of US$431 million which would become due if construction of the Powder River Basin expansion project starts prior to December 31, 2025 and up to approximately US$769 million would become due upon the movement of specified volumes over the Powder River Basin extension prior to December 31, 2025. Certain interest and inflationary adjustments would also become payable up to December 31, 2025 upon achievement of certain milestones. The contingent payments would be accounted for as an increase in the purchase price.
30 Guarantees
In the normal course of operating the railway, the Company enters into contractual arrangements that involve providing certain guarantees, which extend over the term of the contracts. These guarantees include, but are not limited to:
| ¨ | | residual value guarantees on operating lease commitments of $164 million at December 31, 2011; |
| ¨ | | guarantees to pay other parties in the event of the occurrence of specified events, including damage to equipment, in relation to assets used in the operation of the railway through operating leases, rental agreements, easements, trackage and interline agreements; and |
| ¨ | | indemnifications of certain tax-related payments incurred by lessors and lenders. |
The maximum amount that could be payable under these guarantees, excluding residual value guarantees, cannot be reasonably estimated due to the nature of certain of these guarantees. All or a portion of amounts paid under guarantees to other parties in the event of the occurrence of specified events could be recoverable from other parties or through insurance. The Company has accrued for all guarantees that it expects to pay. At December 31, 2011, these accruals amounted to $8 million (2010 – $5 million), recorded in “Accounts payable and accrued liabilities”.
Indemnifications
Pursuant to a trust and custodial services agreement with the trustee of the Canadian Pacific Railway Company Pension Plan, the Company has undertaken to indemnify and save harmless the trustee, to the extent not paid by the fund, from any and all taxes, claims, liabilities, damages, costs and expenses arising out of the performance of the trustee’s obligations under the agreement, except as a result of misconduct by the trustee. The indemnity includes liabilities, costs or expenses relating to any legal reporting or notification obligations of the trustee with respect to the defined contribution option of the pension plans or otherwise with respect to the assets of the pension plans that are not part of the fund. The indemnity survives the termination or expiry of the agreement with respect to claims and liabilities arising prior to the termination or expiry. At December 31, 2011, the Company had not recorded a liability associated with this indemnification, as it does not expect to make any payments pertaining to it.
Pursuant to the Company’s by-laws, the Company indemnifies all current and former directors and officers. In addition to the indemnity provided for in the by-laws, the Company also indemnifies its directors and officers pursuant to indemnity agreements. The Company carries a liability insurance policy for directors and officers, subject to a maximum coverage limit and certain deductibles in cases where a director or officer is reimbursed for any loss covered by the policy.
31 Segmented information
Operating segment
The Company operates in only one operating segment: rail transportation. Operating results by geographic areas, railway corridors or other lower level components or units of operation are not reviewed by the Company’s chief operating decision maker to make decisions about the allocation of resources to, or the assessment of performance of, such geographic areas, corridors, components or units of operation.
In 2011, 2010 and 2009, no one customer comprised more than 10% of total revenues and accounts receivable.
Geographic information
| | | | | | | | | | | | |
| (in millions of Canadian dollars) | | Canada | | | United States | | | Total | |
| | | | | | | | | | | | | |
2011 | | | | | | | | | | | | |
Revenues | | $ | 3,766 | | | $ | 1,411 | | | $ | 5,177 | |
Long-term assets excluding financial instruments, mortgages receivable and
deferred tax assets | | $ | 8,854 | | | $ | 4,309 | | | $ | 13,163 | |
| | | |
2010 | | | | | | | | | | | | |
Revenues | | $ | 3,635 | | | $ | 1,346 | | | $ | 4,981 | |
Long-term assets excluding financial instruments, mortgages receivable and
deferred tax assets | | $ | 8,458 | | | $ | 4,013 | | | $ | 12,471 | |
| | | |
2009 | | | | | | | | | | | | |
Revenues | | $ | 3,166 | | | $ | 1,236 | | | $ | 4,402 | |
Long-term assets excluding financial instruments, mortgages receivable and
deferred tax assets | | $ | 8,364 | | | $ | 4,134 | | | $ | 12,498 | |
| | | | | | | | | | | | | |
FIVE-YEAR SUMMARY
| | | | | | | | | | | | | | | | | | | | |
| Year ended December 31 | | U.S. GAAP | |
| (in millions of Canadian dollars, except percentages and per share data) | | 2011 | | | 2010 | | | 2009 | | | 2008(2) | | | 2007(1) | |
Revenues | | | | | | | | | | | | | | | | | | | | |
Freight | | | | | | | | | | | | | | | | | | | | |
Grain | | $ | 1,100 | | | $ | 1,135 | | | $ | 1,137 | | | $ | 977 | | | $ | 944 | |
Coal | | | 556 | | | | 491 | | | | 444 | | | | 612 | | | | 577 | |
Sulphur and fertilizers | | | 549 | | | | 475 | | | | 309 | | | | 512 | | | | 505 | |
Forest products | | | 189 | | | | 185 | | | | 176 | | | | 241 | | | | 277 | |
Industrial and consumer products | | | 1,017 | | | | 903 | | | | 786 | | | | 772 | | | | 631 | |
Automotive | | | 338 | | | | 316 | | | | 230 | | | | 326 | | | | 321 | |
Intermodal | | | 1,303 | | | | 1,348 | | | | 1,198 | | | | 1,482 | | | | 1,368 | |
| | | | | | | | | | | | | | | | | | | | | |
| | | 5,052 | | | | 4,853 | | | | 4,280 | | | | 4,922 | | | | 4,623 | |
Other | | | 125 | | | | 128 | | | | 122 | | | | 127 | | | | 131 | |
| | | | | | | | | | | | | | | | | | | | | |
Total revenues | | | 5,177 | | | | 4,981 | | | | 4,402 | | | | 5,049 | | | | 4,754 | |
| | | | | | | | | | | | | | | | | | | | | |
Operating expenses | | | | | | | | | | | | | | | | | | | | |
Compensation and benefits | | | 1,426 | | | | 1,431 | | | | 1,307 | | | | 1,290 | | | | 1,266 | |
Fuel | | | 968 | | | | 728 | | | | 580 | | | | 1,006 | | | | 747 | |
Materials | | | 243 | | | | 214 | | | | 217 | | | | 258 | | | | 256 | |
Equipment rents | | | 209 | | | | 206 | | | | 226 | | | | 219 | | | | 235 | |
Depreciation and amortization | | | 490 | | | | 489 | | | | 483 | | | | 428 | | | | 413 | |
Purchased services and other | | | 874 | | | | 797 | | | | 783 | | | | 809 | �� | | | 677 | |
Gain on sales of significant properties | | | – | | | | – | | | | (79 | ) | | | – | | | | – | |
Loss on termination of lease with shortline railway | | | – | | | | – | | | | 55 | | | | – | | | | – | |
| | | | | | | | | | | | | | | | | | | | | |
Total operating expenses | | | 4,210 | | | | 3,865 | | | | 3,572 | | | | 4,010 | | | | 3,594 | |
| | | | | | | | | | | | | | | | | | | | | |
Operating income | | | 967 | | | | 1,116 | | | | 830 | | | | 1,039 | | | | 1,160 | |
Gain on sale of partnership interest | | | – | | | | – | | | | 81 | | | | – | | | | – | |
Equity income (net of tax) in Dakota, Minnesota & Eastern Railroad Corporation (DM&E) | | | – | | | | – | | | | – | | | | 51 | | | | 11 | |
Less: | | | | | | | | | | | | | | | | | | | | |
Other (income) and charges | | | 18 | | | | (12 | ) | | | 12 | | | | 72 | | | | (127 | ) |
Net interest expense | | | 252 | | | | 257 | | | | 268 | | | | 240 | | | | 190 | |
| | | | | | | | | | | | | | | | | | | | | |
Income before income tax expense | | | 697 | | | | 871 | | | | 631 | | | | 778 | | | | 1,108 | |
Income tax expense | | | 127 | | | | 220 | | | | 81 | | | | 150 | | | | 200 | |
| | | | | | | | | | | | | | | | | | | | | |
Net income | | $ | 570 | | | $ | 651 | | | $ | 550 | | | $ | 628 | | | $ | 908 | |
Earnings per share | | | | | | | | | | | | | | | | | | | | |
Basic earnings per share | | $ | 3.37 | | | $ | 3.86 | | | $ | 3.31 | | | $ | 4.08 | | | $ | 5.89 | |
Diluted earnings per share | | $ | 3.34 | | | $ | 3.85 | | | $ | 3.30 | | | $ | 4.04 | | | $ | 5.83 | |
| | | | | | | | | | | | | | | | | | | | | |
Operating Ratio | | | 81.3% | | | | 77.6% | | | | 81.1% | | | | 79.4% | | | | 75.6% | |
(1) The 2007 figures include equity income for DM&E from October 4, 2007 to December 31, 2007.
(2) The 2008 figures include the results of the DM&E on an equity accounting basis through October 29, 2008 and on a consolidated basis after that date.
FIVE-YEAR SUMMARY
Additional information
The following table identifies certain notable items within our income statements in each of the years 2007 to 2011.
| | | | | | | | | | | | | | | | | | | | |
(in millions of Canadian dollars, except per share data) | | | 2011 | | | | 2010 | | | | 2009 | | | | 2008 | | | | 2007 | |
| | | | | | | | | | | | | | | | | | | | | |
Foreign exchange gain (loss) on long-term debt | | $ | (3 | ) | | $ | 2 | | | $ | 4 | | | $ | (6 | ) | | $ | 169 | |
Tax impact (expense) recovery | | | 1 | | | | (8 | ) | | | (32 | ) | | | 37 | | | | (44 | ) |
| | | | |
Foreign exchange gain (loss) on long-term debt (net of tax) | | $ | (2 | ) | | $ | (6 | ) | | $ | (28 | ) | | $ | 31 | | | $ | 125 | |
Impact on diluted earnings per share | | $ | (0.01 | ) | | $ | (0.03 | ) | | $ | (0.17 | ) | | $ | 0.20 | | | $ | 0.81 | |
| | | | | | | | | | | | | | | | | | | | | |
Gain (loss) in fair value of long-term floating rate notes/third-party asset backed commercial paper | | $ | 10 | | | $ | 3 | | | $ | 6 | | | $ | (49 | ) | | $ | (22 | ) |
Tax impact (expense) recovery | | | (3 | ) | | | (1 | ) | | | (1 | ) | | | 14 | | | | 7 | |
| | | | |
Change in fair value of long-term floating rate notes (net of tax) | | $ | 7 | | | $ | 2 | | | $ | 5 | | | $ | (35 | ) | | $ | (15 | ) |
Impact on diluted earnings per share | | $ | 0.04 | | | $ | 0.01 | | | $ | 0.03 | | | $ | (0.22 | ) | | $ | (0.10 | ) |
| | | | | | | | | | | | | | | | | | | | | |
Gain on sale of partnership interest | | $ | – | | | $ | – | | | $ | 81 | | | $ | – | | | $ | – | |
Tax impact (expense) recovery | | | – | | | | – | | | | (12 | ) | | | – | | | | – | |
| | | | |
Gain on sale of partnership interest (net of tax) | | $ | – | | | $ | – | | | $ | 69 | | | $ | – | | | $ | – | |
Impact on diluted earnings per share | | $ | – | | | $ | – | | | $ | 0.41 | | | $ | – | | | $ | – | |
| | | | | | | | | | | | | | | | | | | | | |
Gain on sale of significant properties | | $ | – | | | $ | – | | | $ | 79 | | | $ | – | | | $ | – | |
Tax impact (expense) recovery | | | – | | | | – | | | | (11 | ) | | | – | | | | – | |
| | | | |
Gain on sale of significant properties (net of tax) | | $ | – | | | $ | – | | | $ | 68 | | | $ | – | | | $ | – | |
Impact on diluted earnings per share | | $ | – | | | $ | – | | | $ | 0.41 | | | $ | – | | | $ | – | |
| | | | | | | | | | | | | | | | | | | | | |
(Loss) on termination of lease with shortline railway | | $ | – | | | $ | – | | | $ | (55 | ) | | $ | – | | | $ | – | |
Tax impact (expense) recovery | | | – | | | | – | | | | 17 | | | | – | | | | – | |
| | | | |
(Loss) on termination of lease with shortline railway (net of tax) | | $ | – | | | $ | – | | | $ | (38 | ) | | $ | – | | | $ | – | |
Impact on diluted earnings per share | | $ | – | | | $ | – | | | $ | (0.23 | ) | | $ | – | | | $ | – | |
| | | | | | | | | | | | | | | | | | | | | |
Income tax benefits resulting from rate reductions and the resolution and settlement of certain matters related to prior years | | $ | 37 | | | $ | – | | | $ | 56 | | | $ | – | | | $ | 100 | |
Impact on diluted earnings per share | | $ | 0.22 | | | $ | – | | | $ | 0.34 | | | $ | – | | | $ | 0.64 | |
| | | | | | | | | | | | | | | | | | | | | |
The above items increased (decreased) the following income statement components: | | | | | | | | | | | | | | | | | | | | |
Total operating expenses | | $ | – | | | $ | – | | | $ | (24 | ) | | $ | – | | | $ | – | |
Operating income | | $ | – | | | $ | – | | | $ | 24 | | | $ | – | | | $ | – | |
| | | | | | | | | | | | | | | | | | | | | |
SHAREHOLDER INFORMATION
COMMON SHARE MARKET PRICES
| | | | | | | | | | | | | | | | | | | | | | | | | | |
| | | | | | | | | | | 2011 | | | 2010 | |
| Toronto Stock Exchange (Canadian dollars) | | High | | | Low | | | High | | | Low | |
| | | | | | | | | | | | | | | | | | | | | | | | | | | |
First Quarter | | | | | | | | | | | | | 69.48 | | | | 61.04 | | | | 57.54 | | | | 49.58 | |
Second Quarter | | | | | | | | | | | | | 63.66 | | | | 57.09 | | | | 62.90 | | | | 53.57 | |
Third Quarter | | | | | | | | | | | | | 61.58 | | | | 46.01 | | | | 65.82 | | | | 55.65 | |
Fourth Quarter | | | | | | | | | | | | | 69.45 | | | | 47.58 | | | | 67.50 | | | | 61.60 | |
| | | | | | | | | | | | | | | | | | | | | | | | | | | |
Year | | | | | | | | | | | | | 69.48 | | | | 46.01 | | | | 67.50 | | | | 49.58 | |
| | | | | | | | | | | | | | | | | | | | | | | | | | | |
| | | | | |
| | | | | | | | | | | 2011 | | | 2010 | |
| New York Stock Exchange (U.S. dollars) | | High | | | Low | | | High | | | Low | |
| | | | | | | | | | | | | | | | | | | | | | | | | | | |
First Quarter | | | | | | | | | | | | | 69.92 | | | | 61.97 | | | | 56.65 | | | | 46.13 | |
Second Quarter | | | | | | | | | | | | | 66.98 | | | | 58.13 | | | | 61.98 | | | | 49.98 | |
Third Quarter | | | | | | | | | | | | | 64.78 | | | | 44.76 | | | | 63.47 | | | | 52.15 | |
Fourth Quarter | | | | | | | | | | | | | 68.12 | | | | 44.98 | | | | 67.03 | | | | 60.14 | |
| | | | | | | | | | | | | | | | | | | | | | | | | | | |
Year | | | | | | | | | | | | | 69.92 | | | | 44.76 | | | | 67.03 | | | | 46.13 | |
| | | | | | | | | | | | | | | | | | | | | | | | | | | |
| | | | | | | |
Number of registered shareholders at year end: | | | 16,548 | | | | | | | | | | | | | | | | | | | | | | | |
Closing market prices at year end: | | | | | | | | | | | | | | | | | | | | | | | | | | |
Toronto Stock Exchange: | | $ | 69.01 | | | | CDN | | | | | | | | | | | | | | | | | | | |
New York Stock Exchange: | | $ | 67.67 | | | | US | | | | | | | | | | | | | | | | | | | |
| | | | | | | | | | | | | | | | | | | | | | | | | | | |
SHAREHOLDER ADMINISTRATION
COMMON SHARES
Computershare Investor Services Inc., with transfer facilities in Montreal, Toronto, Calgary and Vancouver, serves as transfer agent and registrar for the Common Shares in Canada. Computershare Trust Company NA, Denver, Colorado, serves as co-transfer agent and co-registrar for the Common Shares in the United States.
For information concerning dividends, lost share certificates, estate transfers or for change in share registration or address, please contact the transfer agent and registrar by telephone at 1-877-4-CP-RAIL (1-877-427-7245) toll free North America or International (514) 982-7555, visit their website at www.computershare.com/cp, or write to:
Computershare Investor Services Inc.
100 University Avenue, 9th Floor
Toronto, Ontario Canada M5J 2Y1
INFORMATION REGARDING DIRECT REGISTRATION
The Direct Registration System, or DRS, allows registered holders to hold securities in “book entry” form without having a physical certificate issued as evidence of ownership. Instead, securities are held in the name of the registered holder and registered electronically on the issuer’s records maintained by the issuer’s transfer agent. If you are a registered holder of shares and wish to hold your shares using the DRS, please contact the transfer agent at the phone number or address shown above, or for more information about direct registration, log on to Computershare’s website at www.computershare.com/investorcentrecanada and click on “Questions and Answers”.
DIRECT DEPOSIT OF DIVIDENDS
Registered shareholders are offered the option of having their Canadian and U.S. dollar dividends directly deposited into their personal bank accounts in Canada and the United States on the dividend payment dates. Shareholders can enroll for direct deposit either by phone or by completing a direct deposit enrolment form. For more information about direct deposit, please contact Computershare Investor Services Inc. at 1-877-4-CP-RAIL (1-877-427-7245).
4% CONSOLIDATED DEBENTURE STOCK
Inquiries with respect to Canadian Pacific Railway Company’s 4% Consolidated Debenture Stock should be directed as follows:
For stock denominated in U.S. currency – The Bank of New York Mellon at (212) 815-2719 or by e-mail at lesley.daley@bnymellon.com; and
For stock denominated in pounds sterling – BNY Trust Company of Canada at (416) 933-8504 or by e-mail at marcia.redway@bnymellon.com.
MARKET FOR SECURITIES
The Common Shares of Canadian Pacific Railway Limited are listed on the Toronto and New York stock exchanges. The Debenture Stock of Canadian Pacific Railway Company is listed on the London Stock Exchange (UK pounds sterling) and on the New York Stock Exchange (U.S. currency).
TRADING SYMBOL
Common Shares – CP
DUPLICATE ANNUAL REPORTS
While every effort is made to avoid duplication, some Canadian Pacific Railway Limited registered shareholders may receive multiple copies of shareholder information mailings such as this Annual Report. Registered shareholders who wish to consolidate any duplicate accounts which are registered in the same name are requested to write to Computershare Investor Services Inc.
CORPORATE GOVERNANCE
Canadian Pacific’s Board of Directors and its management are committed to a high standard of corporate governance. They believe effective corporate governance calls for the establishment of processes and structures that contribute to the sound direction and management of the Corporation’s business, with a view to enhancing shareholder value.
A detailed description of CP’s approach to corporate governance is contained in its Management Proxy Circular issued in connection with the 2012 Annual Meeting of Shareholders.
GOVERNANCE STANDARDS
Any significant differences between the Corporation’s corporate governance practices and those set forth in the corporate governance listing standards (“Listing Standards”) of the New York Stock Exchange (“NYSE”) are set forth on Canadian Pacific Railway Limited’s website www.cpr.ca under “Executive Leadership & Governance”.
CHIEF EXECUTIVE OFFICER AND CHIEF FINANCIAL OFFICER CERTIFICATION
The certifications (the “302 Certifications”) of the Chief Executive Officer and the Executive Vice-President and Chief Financial Officer of each of Canadian Pacific Railway Limited and Canadian Pacific Railway Company required by Section 302 of theSarbanes-Oxley Act of 2002 and the rules promulgated by the Securities and Exchange Commission (“SEC”) thereunder, have been filed with the SEC as an exhibit to the Annual Report of Canadian Pacific Railway Limited and Canadian Pacific Railway Company on Form 40-F. The 302 Certifications have also been filed in fulfillment of the requirements of National Instrument 52-109.
2012 ANNUAL MEETING
The Annual Meeting of Shareholders will be held on Thursday, May 17, 2012 in Calgary, Alberta.
SHAREHOLDER SERVICES
Shareholders having inquiries or wishing to obtain copies of the Corporation’s Annual Information Form may contact Shareholder Services at 1-866-861-4289 or (403) 319-7538, or by e-mail at shareholder@cpr.ca, or by writing to:
Shareholder Services, Office of the Corporate Secretary, Canadian Pacific, Suite 920, Gulf Canada Square, 401- 9th Avenue S.W., Calgary, Alberta, Canada T2P 4Z4
INVESTOR INFORMATION
Financial information is available under the “Invest in CP” section on CP’s website at www.cpr.ca.
COMMUNICATIONS AND PUBLIC AFFAIRS
Contact Communications and Public Affairs, Canadian Pacific, Suite 500, Gulf Canada Square, 401- 9th Avenue S.W., Calgary, Alberta, Canada, T2P 4Z4
DIRECTORS AND COMMITTEES
John E. Cleghorn, O.C., F.C.A.(2)
Chairman
Canadian Pacific Railway Limited
Toronto, Ontario
Tim W. Faithfull(2)(3)*(4)
Retired President and Chief Executive Officer
Shell Canada Limited
Oxford, Oxfordshire, England
Richard L. George(4)(5)
Chief Executive Officer
Suncor Energy Inc.
Calgary, Alberta
Frederic J. Green(3)
President and Chief Executive Officer
Canadian Pacific Railway Limited
Calgary, Alberta
Edmond L. Harris(3)(5)
Retired Executive Vice President and Chief
Operations Officer
Canadian Pacific Railway Limited
Spring Lake, Michigan
Krystyna T. Hoeg, C.A.(1)(5)
Former President and Chief Executive Officer
Corby Distilleries Limited
Toronto, Ontario
Tony L. Ingram(3)(4)
Former Executive Vice President and Chief
Operating Officer
CSX Transportation Inc.
Jacksonville, Florida
Richard C. Kelly(1)*(2)(3)
Retired Chairman, and Chief
Executive Officer
Xcel Energy Inc.
Denver, Colorado
The Honourable John P. Manley O.C.(1)(2)(5)*
President and Chief Executive Officer
Canadian Council of Chief Executives
Ottawa, Ontario
Linda J. Morgan(1)(3)
Partner
Nossaman LLP
Bethesda, Maryland
Madeleine Paquin(3)(4)
President and Chief Executive Officer
Logistec Corporation
Montreal, Quebec
Michael E.J. Phelps, O.C.(2)(4)*(5)
Chairman
Dornoch Capital Inc.
West Vancouver, British Columbia
Roger Phillips, O.C., S.O.M., F.Inst.P.(1)(2)*(5)
Retired President and Chief Executive Officer
IPSCO Inc.
Regina, Saskatchewan
David W. Raisbeck(4)(5)
Retired Vice-Chairman
Cargill Inc.
Sanibel, Florida
Hartley T. Richardson, C.M., O.M.(1)(3)
President and Chief Executive Officer
James Richardson & Sons, Limited
Winnipeg, Manitoba
| (1) | Audit, Finance and Risk Committee |
| (2) | Corporate Governance and Nominating Committee |
| (3) | Safety, Operations and Environment Committee |
| (4) | Management Resources and Compensation Committee |
| * | denotes chairman of the committee |
SENIOR OFFICERS OF THE COMPANY
John E. Cleghorn, O.C., F.C.A.
Chairman of the Board
Toronto, Ontario
Frederic J. Green(1)
President and Chief Executive Officer
Calgary, Alberta
Kathryn B. McQuade(1)
Executive Vice-President and Chief Financial Officer
Mesquite, Nevada
J. Michael Franczak(1)
Executive Vice-President and Chief Operations Officer
Calgary, Alberta
Jane O’Hagan(1)
Executive Vice-President and Chief Marketing Officer
Calgary, Alberta
Donald B. Campbell(1)
Senior Vice-President, Strategy and Financial Planning
Calgary, Alberta
Brian W. Grassby(1)
Senior Vice-President, Finance
Calgary, Alberta
Marlowe G. Allison
Vice-President and Treasurer
Calgary, Alberta
Peter J. Edwards(1)
Vice-President, Human Resources and Industrial Relations
Calgary, Alberta
Paul A. Guthrie, Q.C.(1)
Vice-President, Law and Risk Management
Municipal District of Rocky View, Alberta
Jeffrey D. Kampsen
Vice-President and Comptroller
Calgary, Alberta
Karen L. Fleming
General Counsel Corporate and Corporate Secretary
Calgary, Alberta
| (1) | Executive Committee of Canadian Pacific Railway Company |