Howe Barnes Hoefer & Arnett, Inc.
Annual Community Bank Conference
Community Bank Conference
August 13, 2007

Thomas E. Stanberry
Chairman of the Board, President & Chief Executive Officer
Douglas R. Gulling
Executive Vice President & Chief Financial Officer

Forward-looking Statements
Certain market and demographic information provided herein was obtained from SNL Financial, Inc. and
Demographics Now. Certain peer group information was obtained from the FDIC’s Uniform Bank Performance
Report. West Bancorporation, Inc. did not prepare this information. The inclusion of this information is not and
does not imply an affiliation, sponsorship, adoption, endorsement, approval, investigation, verification or
monitoring by West Bancorporation, Inc. of any such information. In no event shall West Bancorporation, Inc. be
responsible for such information or your use of such information. The information in this presentation does not
constitute an offer to sell or solicitation of an offer to buy any security.
The information contained in this presentation may contain forward-looking statements about the Company’s
growth and acquisition strategies, new products and services, and future financial performance, including earnings
and dividends per share, return on average assets, return on average equity, efficiency ratio and capital ratio.
Certain statements in this presentation constitute “forward-looking statements” within the meaning of the Private
Securities Litigation Reform Act of 1995. Such forward-looking information is based upon certain underlying
assumptions, risks and uncertainties. Because of the possibility of change in the underlying assumptions, risks
and uncertainties, actual results could differ materially from these forward-looking statements. Risks and
uncertainties that may affect future results include: competitive pressures, pricing pressures on loans and
deposits, actions of bank and non-bank competitors, changes in local and national economic conditions, changes
in regulatory requirements, actions of the Securities and Exchange Commission and/or the Federal Reserve
Board, and customer’s acceptance of the Company’s products and services. The Company undertakes no
obligation to revise or update such statements to reflect current events or circumstances after the date hereof or to
reflect the occurrence of unanticipated events.

Table of Contents
Company and Market Structure
Market Share
Key Attributes & Financial Performance
WB Capital Management Inc.
Strategic Plan
Summary & Discussion

Section I
Company &
Market Structure
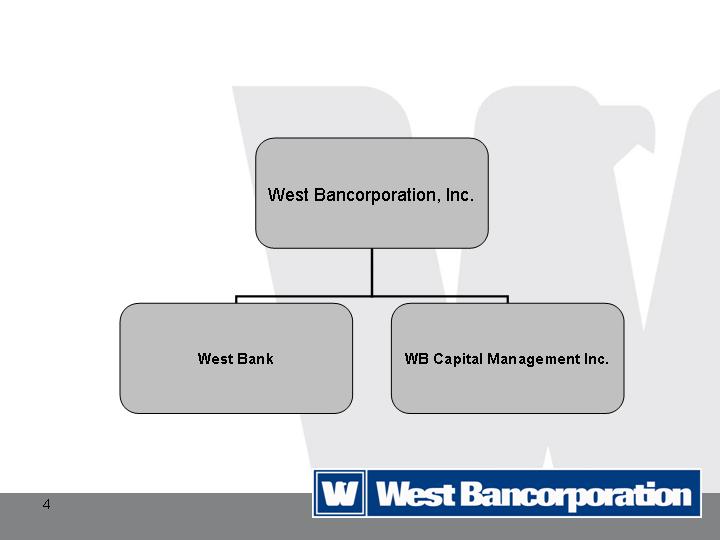
West Bancorporation, Inc. and
Wholly-owned Subsidiaries
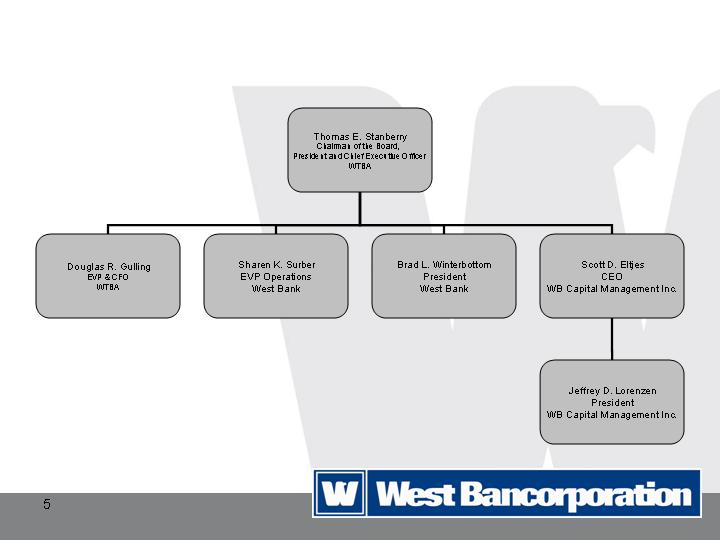
Executive Leadership
Community bank
founded in 1893
Two Markets
Des Moines Metro
(7 locations)
Iowa City/Coralville
(3 locations)
Money manager
founded in 2003
Mid-west offices
West Des Moines
(headquarters)
Coralville

Des Moines MSA
Des Moines is known for its
outstanding quality of life.
Four-time "All American City"
Political, economic and cultural
center of Iowa
All the amenities of a large city -
shopping, sports, attractions, and
the arts
Located in the heart of the Midwest
at the junction of I-80 and I-35

Iowa City MSA
Iowa City has long served as a locus
for culture and education.
The economy is based upon a thriving
commerce, a major university, and a
number of national and international
businesses.
The University of Iowa offers more
than 100 areas of study for its 29,000
students. The academic, arts and
research mission of the University,
along with the health care services
provided at its hospitals and clinics,
have a tremendous economic impact
on the area
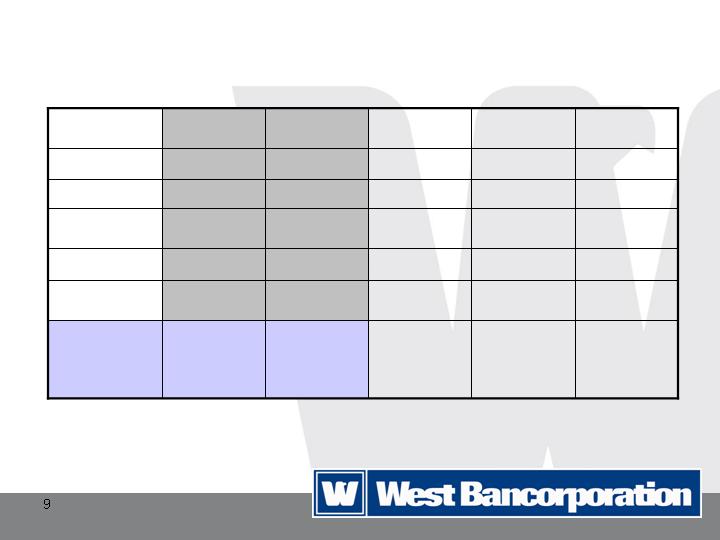
Iowa Growth Projections
53,978
321,679
151,767
58,868
221,204
Households
0.19%
6.98%
1.28%
7.39%
8.31%
Projected
population
change
2006-2011
750
990
973
1,051
992
Households per
branch
30,467
44,159
38,320
40,366
48,876
Deposits per
branch ($000)
143,086
14,351,696
5,977,858
2,260,468
10,410,612
Deposits ($000)
72
325
156
56
213
No. of Branches
Sioux City
Omaha-
Council Bluffs
Quad Cities
Iowa City
Des Moines
Section II
Market Share
Deposit Market Share Summary
State of Iowa
1.62
875,332
Stark Bank Group, Ltd.
10
1.69
911,430
Northwest Financial Corp
9
1.75
943,876
Bank of America corporation
8
1.78
961,220
BNP Paribus Group
7
1.91
1,029,941
West Bancorporation, Inc
6
1.99
1,076,746
Hills Bancorporation
5
2.20
1,186,871
Principal Financial Group, Inc.
4
2.35
1,270,925
BTC Financial Corp
3
7.30
3,940,559
U.S. Bancorp
2
8.96
4,841,476
Wells Fargo & Company
1
2006 Total
Market Share (%)
2006 Deposits in
market ($000)
Institution
2006
Rank
SNL Financial, Inc
Deposit Market Share Summary
Des Moines, IA - MSA
2.10
218,180
Iowa State Bank Holding Company
10
3.36
349,662
BNP Paribas Group
9
3.67
382,007
Stark Bank Group, Ltd.
8
3.91
406,565
Van Diest Investment Company
7
6.70
697,759
U.S. Bancorp
6
6.87
715,085
Bank of America Corporation
5
9.12
949,581
West Bancorporation, Inc.
4
10.77
1,121,012
BTC Financial Corporation
3
11.40
1,186,871
Principal Financial Group, Inc.
2
16.11
1,677,389
Wells Fargo & Company
1
2006 Total
Market Share (%)
2006 Deposits in
market ($000)
Institution
2006
Rank
SNL Financial, Inc.

Deposit Market Share Summary
Iowa City, IA - MSA
1.74
39,351
Solon Financial, Inc.
10
1.84
41,496
Wells Fargo & Company
9
2.64
59,758
Lone Tree Service Company
8
2.89
65,324
Washington Bancorp
7
3.56
80,360
West Bancorporation, Inc
6
5.10
115,242
Central Bancshares, Inc
5
6.62
149,555
W.S.B., Inc.
4
9.98
225,561
U.S. Bancorp
3
19.18
433,658
ISB Financial Corporation
2
37.36
844,525
Hills Bancorporation
1
2006 Total
Market Share (%)
2006 Deposits in
market ($000)
Institution
2006
Rank
SNL Financial, Inc

Section III
Key Attributes
& Financial
Performance

Key Attributes
Emphasis on small- and medium-sized
businesses
Relationship Based
Experienced management
Continuity and expertise of staff
Strong financial performance
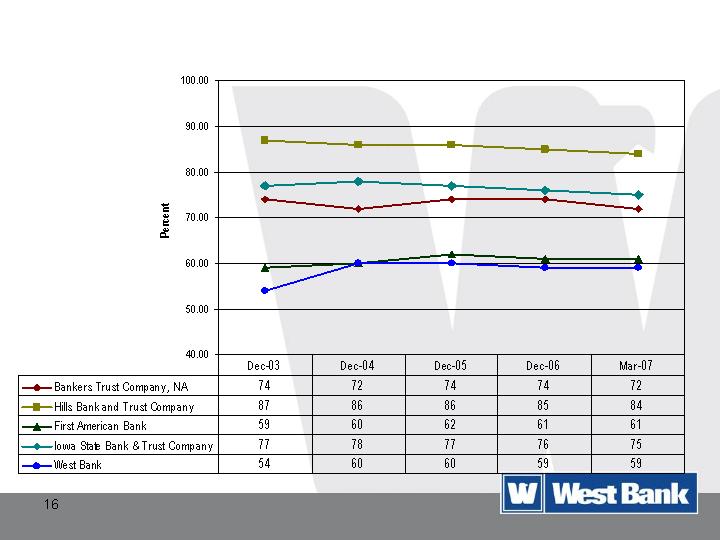
Loan Portfolio Composition – Real Estate

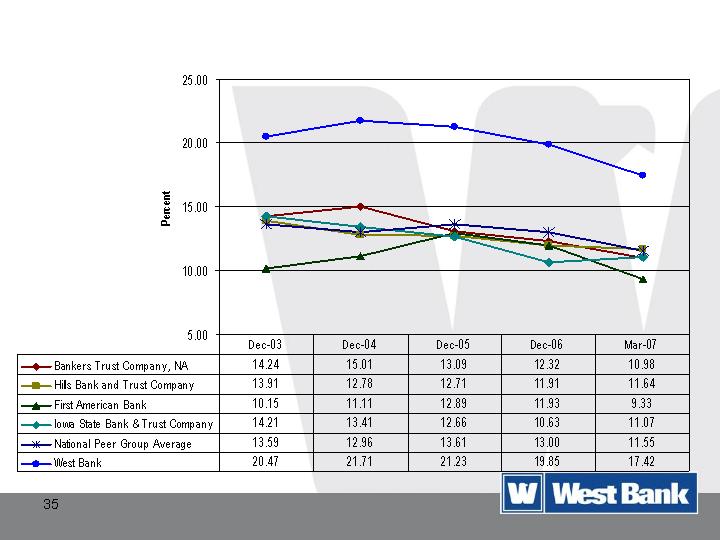
Loan Portfolio Composition – Commercial
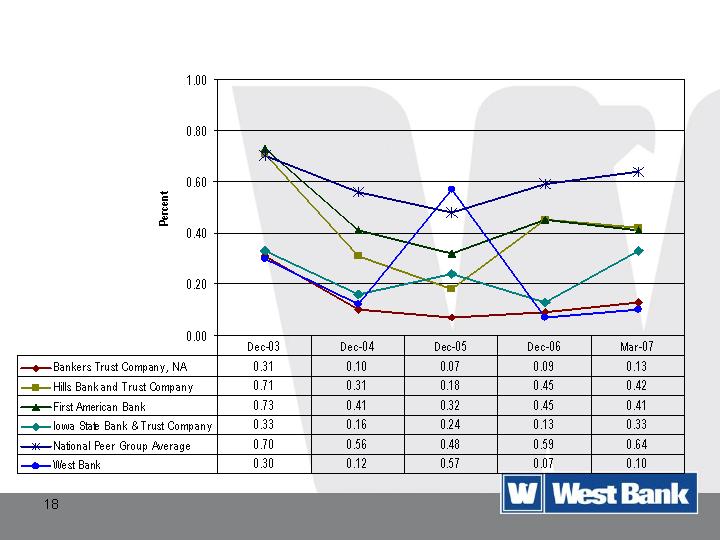
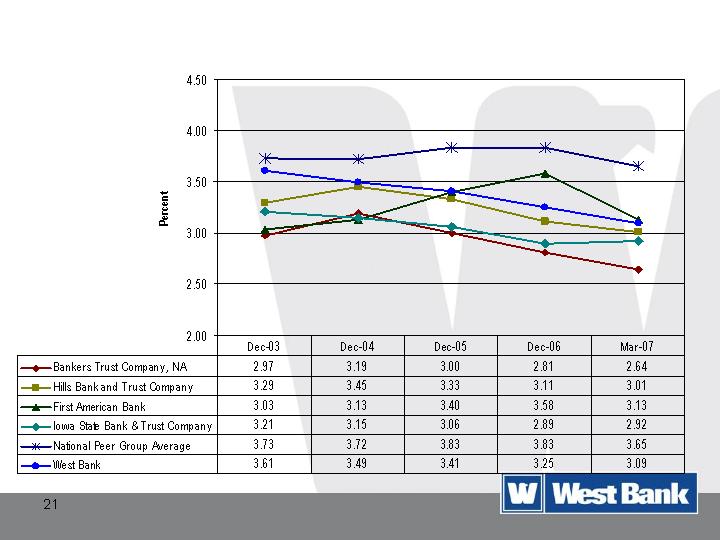
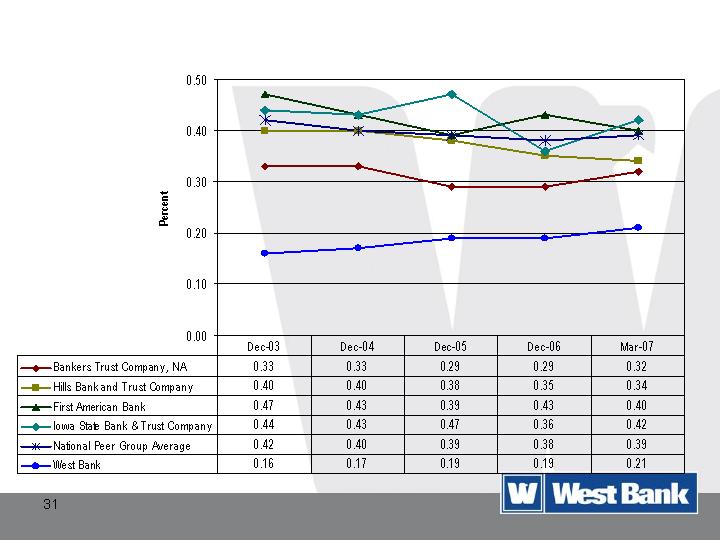
Non-Current Loans to Gross Loans

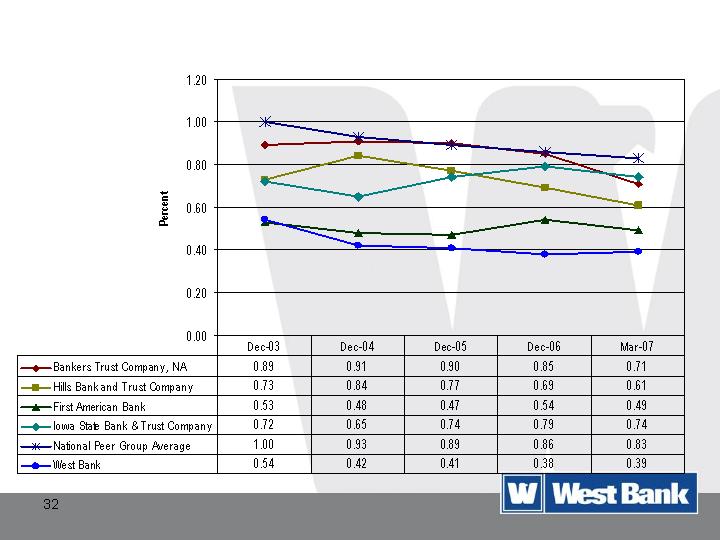
Net Charge-Offs to Average Loans
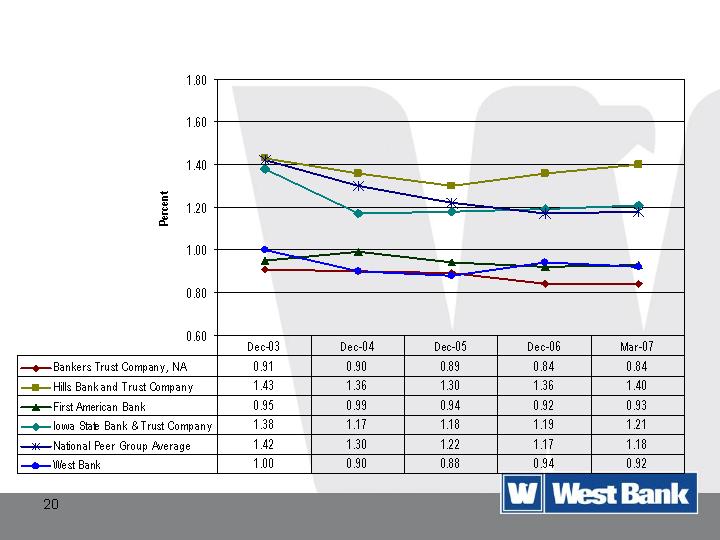
Loan Loss Reserve to Total Loans
Net Interest Margin
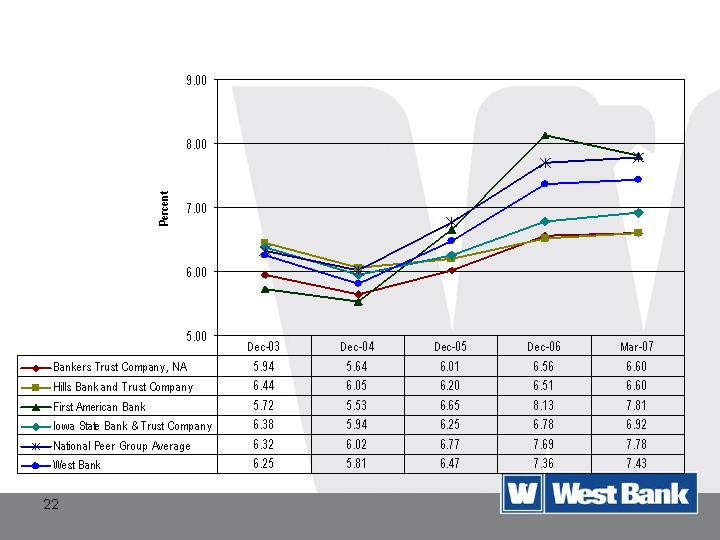
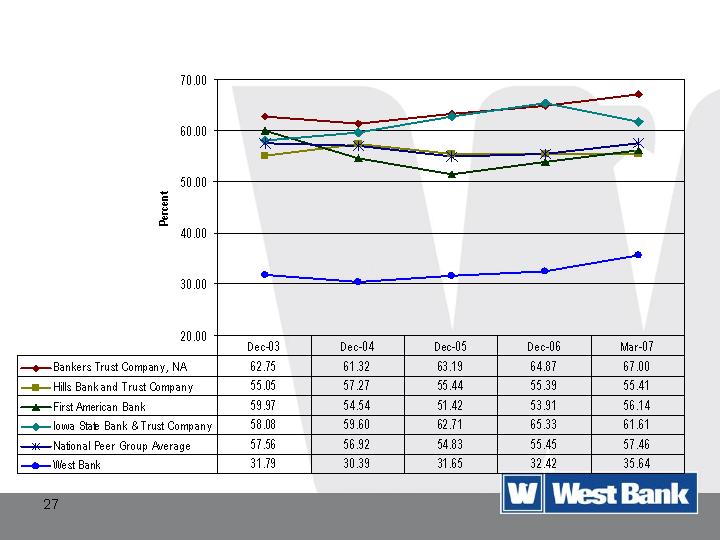
Average Yield on Total Loans

Average Yield on Real Estate Loans
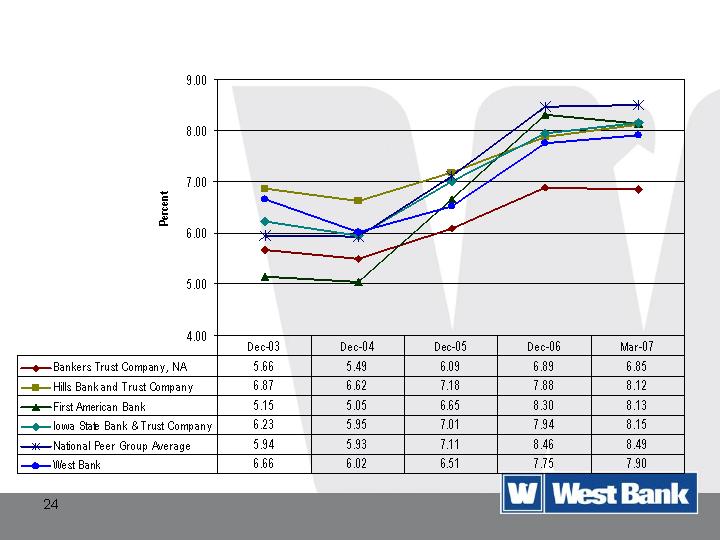
Average Yield on Commercial & Industrial Loans
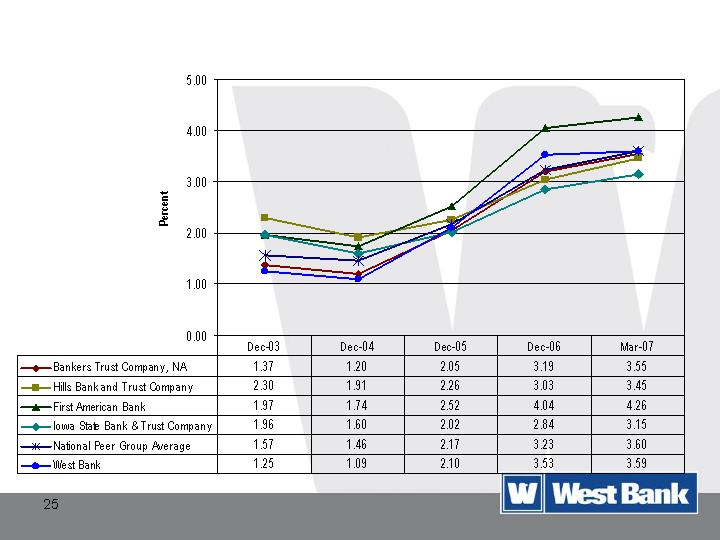
Average Rate Paid on Interest-Bearing Deposits

Average Yield on Total Investment Securities
Efficiency Ratio

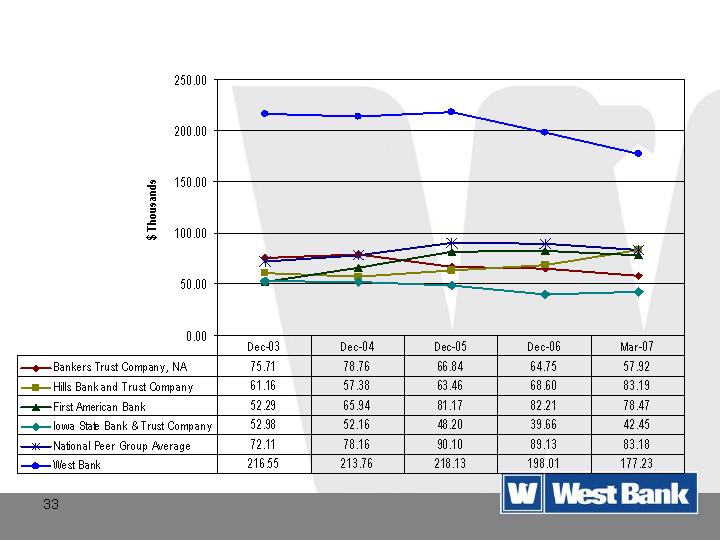
Assets per Employee

Loans per Employee

Personnel Expense as % of Average
Assets
Occupancy Expense as % of Average
Assets
Other Operating Expenses as % of
Average Assets
Net Income per Employee (pre-tax)

Return on Assets
Return on Equity

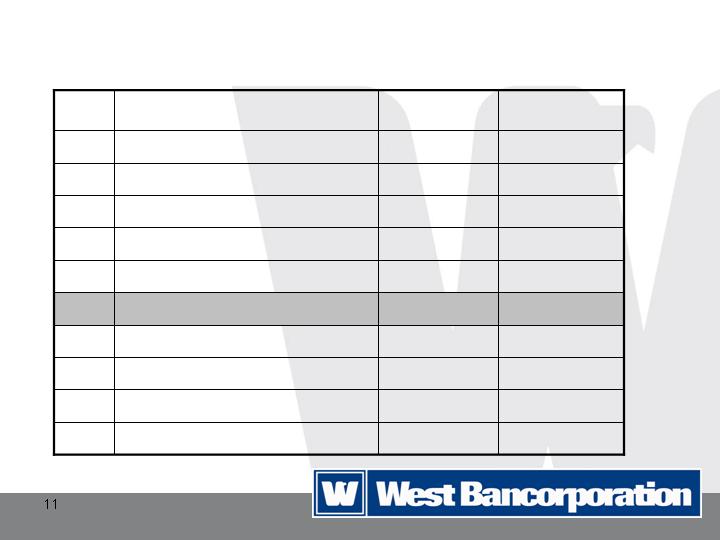
Consolidated Financial Results
44.25%
44.46%
43.35%
41.54%
Efficiency Ratio
3.39%
3.29%
3.35%
3.33%
Net Interest Margin
1.47%
1.47%
1.49%
1.55%
Return on Average
Assets
18.09%
16.84%
18.56%
17.80%
Return on Average Equity
$9,427
$9,571
$4,882
$5,127
Net income ($000)
2006
2007
2006
2007
Three months ended
June 30
Six months ended
June 30
Section IV
WB Capital
Management Inc.

Overview
WB Capital Management Inc. formed in
October 2003 as a registered investment
advisor
Acquired assets of VMF Capital, LLC on
October 1, 2003
Acquired assets of Investor’s Management
Group on December 21, 2005

Assets under management as of June 30, 2007
was approximately $4.4 billion
Provides portfolio management services to
individuals, retirement plans, corporations,
governmental entities,foundations and
endowments
Minimum investment is $250,000 per account
Investment Strategies
Investment decisions are driven by the opportunity to increase
returns while managing portfolio risk.
Fixed Income
The investment process emphasizes
three central tenets:
Capital preservation
Risk-aware portfolio construction
A focus on our long-term view of
the economy and financial
markets
Four investment strategies
Low Duration
Intermediate Core
Intermediate Government
Core Fixed Income
Equity
The investment process focuses on
three fundamental factors:
Cash flows
Return on assets
Risk controls such as sector and
individual security weights
Six investment Strategies
Core Forty
Large Cap Value
Mid Cap Equity
Small Cap Core Equity
SMID Capital
Core Select

Investment Performance Equity Composites*
9.87%
13.31%
15.93%
21.87%
6.23%
4.93%
-2.34%
Russell 1000 Value
7.62%
11.87%
15.60%
19.67%
9.06%
8.10%
-1.51%
Large Cap Value
13.37%
14.17%
15.15%
18.51%
11.98%
5.84%
-2.18%
S&P 400 Mid Cap Index
11.86%
16.39%
17.16%
20.83%
9.90%
5.30%
-2.25%
Russell Mid Cap
9.88%
10.90%
14.04%
19.32%
15.36%
7.65%
-1.05%
Mid-Cap
4.39%
9.28%
8.70%
19.04%
8.13%
6.86%
-1.49%
Russell 1000 Growth
7.12%
10.70%
11.67%
20.57%
6.95%
6.27%
-1.66%
S&P 500
7.58%
9.25%
9.07%
15.98%
3.56%
5.41%
-1.45%
Large-Cap Growth
7.12%
10.70%
11.67%
20.57%
6.95%
6.27%
-1.66%
S&P 500
5.47%
8.63%
10.84%
21.86%
8.18%
7.81%
-1.31%
Diversified Equity
11.27%
14.36%
14.47%
16.04%
8.56%
5.18%
-1.64%
S&P 600 Small-Cap Index
9.06%
13.88%
13.45%
16.43%
6.45%
4.41%
-1.46%
Russell 2000
n/a
18.28%
13.47%
22.54%
9.90%
6.17%
-0.67%
Small-Cap Core
6.86%
8.25%
8.38%
14.51%
4.78%
3.70%
-0.99%
S&P 500/SHLGCI
n/a
7.17%
7.03%
11.84%
2.82%
3.33%
-0.96%
Balanced Core
10 Year
5 Year
3 Year
1 Year
YTD
3 Month
1 Month
(Gross of Fees) as of 06.30.07
*Based on preliminary, unreconciled data

Investment Performance Fixed Composites*
5.06%
3.97%
3.62%
4.53%
0.51%
-0.34%
-0.26%
ML 2-17 Muni
4.75%
3.63%
3.27%
4.50%
0.66%
-0.25%
-0.29%
Core Municipal
6.01%
4.48%
3.98%
6.12%
0.98%
-0.52%
-0.29%
Lehman Aggregate
6.09%
4.48%
4.40%
6.26%
1.06%
-0.51%
-0.33%
Core Fixed Income
n/a
3.19%
3.15%
5.34%
2.16%
0.71%
0.43%
Lehm 1-3 Yr Govt/Credit
n/a
3.46%
3.68%
5.78%
2.18%
0.70%
0.33%
Low Duration
50% 3 Mo Treasury
n/a
2.98%
3.46%
5.27%
2.35%
0.99%
0.41%
50% Lehm 1-3 Yr Govt/Credit
n/a
3.33%
3.78%
5.26%
2.09%
0.72%
0.40%
Enhanced Cash
3.79%
2.76%
3.77%
5.21%
2.54%
1.27%
0.39%
3 Mo T-Bill
4.04%
2.94%
4.00%
5.42%
2.65%
1.32%
0.43%
Taxable Cash
10 Year
5 Year
3 Year
1 Year
YTD
3 Month
1 Month
(Gross of Fees) as of 06.30.07
*Based on preliminary, unreconciled data

Section V
Our Future

Strategic Initiatives
West Bank
Shift growth plans in new markets from
acquisition to de novo
Select markets with 15% per annum projected growth
and high households per branch
Create new bank as hub and add branches in
successive years
Expand presence in Iowa Markets
Additional central and eastern Iowa branches
Increase emphasis on consumer banking in defined
niches.

Strategic Initiatives
WB Capital Management Inc.
Focus on institutional money management with wealth
management capabilities
Provide consistent investment performance by
exceeding benchmarks over a rolling three-year period
Expand annual organic growth of assets under
management with new sales and service team approach
Shift assets under management mix to 25% equity/75%
fixed income
Increase net operating margin through improved
efficiencies
Section VI
Summary

Summary
Future is bright at West Bancorporation
West Bank
Consistently outperforms peer banks
Growth opportunities in current markets
Expansion into new markets
WB Capital Management Inc.
Consistent investment performance
Sales-, service- and compliance–driven culture
Strong growth opportunities

Discussion