UNITED STATES
SECURITIES AND EXCHANGE COMMISSION
Washington, D.C. 20549
SCHEDULE 14A
PROXY STATEMENT PURSUANT TO SECTION 14(a) OF THE
SECURITIES EXCHANGE ACT OF 1934
Filed by the Registrant x | Filed by a Party other than the Registrant o |
Check the appropriate box:
| ¨ | Preliminary Proxy Statement |
| ¨ | Confidential, for Use of the Commission Only (as permitted by Rule 14a-6(e)(2)) |
| x | Definitive Proxy Statement |
| ¨ | Definitive Additional Materials |
| ¨ | Soliciting Material Pursuant to §240.14a-12 |
WEST BANCORPORATION, INC.
(Name of Registrant as Specified In Its Charter)
(Name of Person(s) Filing Proxy Statement if other than the Registrant)
Payment of Filing Fee (Check the appropriate box):
| x | No fee required. |
| ¨ | Fee computed on table below per Exchange Act Rules 14a-6(i)(1) and 0-11. |
| (1) | Title of each class of securities to which transaction applies: | |
| (2) | Aggregate number of securities to which transaction applies: | |
| (3) | Per unit price or other underlying value of transaction computed pursuant to Exchange Act Rule 0-11 (set forth the amount on which the filing fee is calculated and state how it was determined): | |
| (4) | Proposed maximum aggregate value of transaction: | |
| (5) | Total fee paid: | |
| ¨ | Fee paid previously with preliminary materials. |
| ¨ | Check box if any part of the fee is offset as provided by Exchange Act Rule 0-11(a)(2) and identify the filing for which the offsetting fee was paid previously. Identify the previous filing by registration statement number, or the Form or Schedule and the date of its filing. |
| (1) | Amount Previously Paid: | |
| (2) | Form, Schedule or Registration Statement No.: | |
| (3) | Filing Party: | |
| (4) | Date Filed: | |
WEST BANCORPORATION, INC.
NOTICE OF ANNUAL SHAREHOLDERS’ MEETING
TO BE HELD APRIL 16, 2009
Dear Fellow Shareholders:
The West Bancorporation, Inc. Annual Meeting of Shareholders will be held in the David L. Miller Conference Center on the second floor of the West Bank building at 1601 22nd Street, West Des Moines, Iowa, on Thursday, April 16, 2009, at 4:00 p.m., central time. We will review the progress of the Company and answer questions during the meeting. We will also ask you to vote on the following matters:
| 1. | The election of 13 directors nominated in the Proxy Statement to serve as the Board of Directors until the next Annual Meeting and until their successors are elected and have qualified; |
| 2. | To approve, on a non-binding basis, the 2008 executive compensation disclosed in the Proxy Statement; |
| 3. | To ratify the appointment of McGladrey & Pullen, LLP as the independent registered public accounting firm for West Bancorporation, Inc. for the year ending December 31, 2009; and |
| 4. | Such other business as may properly come before the Annual Meeting or any adjournment thereof. |
The Board of Directors has fixed the close of business on February 20, 2009, as the record date for determination of Shareholders entitled to notice of and to vote at the Annual Meeting. A list of eligible Shareholders will be maintained at the Company’s offices at 1601 22nd Street, West Des Moines, Iowa, during the ten-day period preceding the Annual Meeting.
Whether or not you expect to attend the Annual Meeting, in order to make sure your vote is received, please complete and return the enclosed proxy card or vote your proxy electronically via the internet as instructed on the card. A prompt response would be appreciated.
Important Notice Regarding the Availability of Proxy Materials for the Shareholders’ Meeting to be held on April 16, 2009:
The documents included in this mailing, the proxy statement and summary annual report, are also available at www.snl.com/irweblinkx/docs.aspx?iid=1021570.
We hope you will personally attend the Annual Meeting, and look forward to seeing you there. Thank you for your interest in the Company.
| For the Board of Directors, | |
/s/ Thomas E. Stanberry | |
| Thomas E. Stanberry | |
| Chairman, President and Chief Executive Officer |
March 5, 2009
PROXY STATEMENT
TABLE OF CONTENTS
| INTRODUCTION | 2 |
| PROPOSALS FOR ANNUAL MEETING | 3 |
| Election of Directors | 3 |
| Approve the 2008 Compensation of the Company’s Named Executive Officers | 5 |
| Ratify the Appointment of Independent Registered Public Accounting Firm | 5 |
| Other Matters | 5 |
| BOARD OF DIRECTORS AND COMMITTEES OF THE BOARD | 5 |
| Audit Committee Report | 6 |
| Compensation Committee Interlocks and Insider Participation | 7 |
| Compensation Committee Report | 7 |
| Nominating and Corporate Governance Committee Report | 8 |
| 2008 Directors’ Compensation | 9 |
| Security Ownership of Certain Beneficial Owners and Executive Officers | 10 |
| Other Beneficial Owners | 11 |
| Section 16(a) Beneficial Ownership Reporting Compliance | 11 |
| Change in Control Agreements | 11 |
| EXECUTIVE COMPENSATION | 11 |
| Compensation Discussion and Analysis | 11 |
| Summary Compensation Table | 14 |
| Equity Compensation Plan Information | 15 |
| Potential Payments upon Termination or Change in Control | 15 |
| INDEPENDENT REGISTERED PUBLIC ACCOUNTING FIRM | 17 |
| Audit Fees | 17 |
| GENERAL MATTERS | 17 |
| Transactions with Related Persons | 17 |
| 2010 Shareholder Proposals | 18 |
| Shareholder Communications | 18 |
| Form 10-K | 18 |
| Delivery of Documents to Shareholders Sharing an Address | 19 |
1
WEST BANCORPORATION, INC.
1601 22nd Street
West Des Moines, IA 50266
PROXY STATEMENT
2009 ANNUAL MEETING OF SHAREHOLDERS
To Be Held on April 16, 2009
INTRODUCTION
This proxy statement is furnished in connection with the solicitation by the Board of Directors of West Bancorporation, Inc. (the “Board” and the “Company”) of proxies to be used at the Annual Meeting of Shareholders (“Annual Meeting”). The meeting will be held in the David L. Miller Conference Center at the Company’s headquarters, 1601 22nd Street, West Des Moines, Iowa, on April 16, 2009, at 4:00 p.m., central time, and at any and all adjournments thereof. A copy of the Company’s 2008 summary annual report to Shareholders and appendix to the proxy statement containing the annual report to Shareholders, including financial statements, accompany this proxy statement. This proxy statement, form of proxy, and other accompanying materials are first being mailed to Shareholders on or about March 9, 2009.
Only Shareholders of record at the close of business on February 20, 2009, (“Shareholders” or “Shareholder”) are entitled to notice of and to vote at the Annual Meeting. There were 17,403,882 shares of the Company's Common Stock outstanding at the close of business on that date, all of which are eligible to vote at the Annual Meeting. The presence, in person or by proxy, of the holders of a majority of the outstanding shares is necessary to constitute a quorum for the transaction of business at the Annual Meeting. Shareholders are entitled to one vote per share outstanding in their names on the record date on all matters to properly come before the Meeting.
The Company is not aware of any matters to be presented at the Annual Meeting other than the election of the 13 nominees described in this proxy statement, the approval of the 2008 executive compensation, and the ratification of the independent registered public accounting firm. The 13 directors elected will be those nominees who receive a plurality of those shares voting at the Annual Meeting in person or by proxy. Passage of the proposals to approve the 2008 executive compensation and to ratify the appointment of the independent registered public accounting firm require the affirmative vote of a plurality of the shares voting on the proposals at the Annual Meeting in person or by proxy. If any matters not described in this proxy statement are properly presented at the Annual Meeting, the proxies will use their personal judgment to determine how to vote your shares. If the Annual Meeting is adjourned, the proxies can vote your shares on the new meeting date as well, unless you have revoked your proxy instructions.
If you hold shares through a broker, follow the voting instructions provided by your broker. If you want to vote in person, a legal proxy must be obtained from your broker and brought to the Annual Meeting. If you do not submit voting instructions to your broker, generally your broker is permitted to vote your shares in its discretion. If a Shareholder abstains from voting on any matter, or if shares are held by a broker who has indicated that it does not have discretionary authority to vote on a particular matter, those shares will be considered to be present for the purpose of determining whether a quorum is present, but will not be counted as votes cast with respect to any matter to come before the Annual Meeting.
Holders of stock in the Company’s Employee Savings and Stock Ownership Plan (“the Plan”) can direct the Trustee of the Plan how to vote the number of shares held in the Plan for the benefit of the Holder as of the record date for any matter put to the vote of the Shareholders. If a Plan participant does not provide directions to the Trustee, then the Trustee shall vote those shares in the same proportion as the shares for which the Trustee received proper direction to vote.
A form of proxy is enclosed for use at the Annual Meeting. Before the Annual Meeting, you can appoint a proxy to vote your shares of stock by completing and signing the enclosed proxy card and mailing it in time to be received before the Annual Meeting, or by using the internet (http://www.illinoisstocktransfer.com). The electronic proxy appointment procedures are designed to confirm your identity and to allow you to give your proxy voting instructions. If you wish to vote via the internet, please follow the instructions on the proxy card.
If your proxy is properly signed and returned and is not withdrawn or revoked, your shares represented thereby will be voted in accordance with your instructions. If the manner of voting such shares is not indicated on the proxy, the shares will be voted FOR the election of the nominees for directors named herein, FOR approval of the 2008 executive compensation disclosed herein, and FOR the ratification of the independent registered public accounting firm.
2
If the enclosed proxy is executed and returned, it may nevertheless be revoked at any time prior to the Annual Meeting. You may revoke a proxy electronically by entering a new vote via the internet or by filing either a written revocation of the proxy or a duly executed proxy bearing a later date with the Secretary of the Company at the Company's principal office at 1601 22nd Street, West Des Moines, Iowa 50266, Attn: Alice A. Jensen, Corporate Secretary. You may also withdraw a proxy by attending the Annual Meeting and voting in person. Attendance at the Annual Meeting without voting in person will not serve as the revocation of a proxy.
The Company will bear the cost of solicitation of proxies. In addition to the use of mail, proxies may be solicited by officers, directors, and employees of the Company, without extra compensation, by telephone, e-mail, facsimile, or personal contact. It will greatly assist the Company in limiting expense in connection with the Annual Meeting if each Shareholder who does not expect to attend the Annual Meeting will promptly return a signed proxy or vote via the internet.
PROPOSALS FOR ANNUAL MEETING
1. Election of Directors. The Board currently consists of eight members. One director, Wendy L. Carlson, has informed the Company’s Nominating and Corporate Governance Committee of the Board of Directors of her intention not to stand for re-election. Ms. Carlson did not cite any disagreement with the Company in announcing her intention not to stand for re-election. The term for directors is until the next Annual Shareholders Meeting and until their successors are duly elected and qualified or until their earlier resignation, removal from office, death, or incapacity.
The Bylaws of the Company provide that the number of directors of the Company shall not be less than five or greater than 15. The Board has set the number of directors for 2009 at 13. Proxies cannot be voted for more than 13 persons.
The Board recommends a vote FOR the nominees listed in the table on the next page.
Proxies in the accompanying form will be voted FOR the election of the listed individuals, unless contrary instructions are given. If any nominee or nominees shall become unavailable for election, it is intended that the proxies will be voted for the election of the substitute nominees as the Board may propose. Any Shareholder has the option to withhold authority to vote for any or all nominees, or to withhold authority to vote for individual nominees. The effect of withholding authority to vote for any of the nominees is that the Shareholder is considered present at the Annual Meeting for quorum requirements, but the vote is not a vote in favor of the nominee for purposes of determining whether the nominee receives a plurality of the votes cast at the Annual Meeting.
Information concerning the nominees, including their ages, year first elected as director, and business experience during the previous five years as of February 20, 2009, is set forth in the following table. Of the nominees, Frank W. Berlin, Orville E. Crowley, George D. Milligan, Robert G. Pulver, Thomas E. Stanberry, Jack G. Wahlig, and Connie Wimer are currently serving as directors of the Company and all nominees, except Orville E. Crowley, also serve as directors of West Bank, a subsidiary of the Company. Mr. Crowley serves as an emeritus member of the West Bank board of directors. Of the nominees, Mr. Stanberry, Mr. Gulling, and Mr. Winterbottom are currently directors of WB Capital Management Inc. (“WB Capital”), a subsidiary of the Company.
The following individuals have been nominated by the Nominating and Corporate Governance Committee as new directors of the Company:
Thomas A. Carlstrom, Neurosurgeon, Private practice, Des Moines, Iowa
Joyce A. Chapman, Executive Vice President – Retired, West Bank
Douglas R. Gulling, Executive Vice President and Chief Financial Officer of the Company; Chief Financial Officer of West Bank; Interim Chief Executive Officer, Director, and Treasurer of WB Capital Management Inc.
Kaye R. Lozier, Director of Development, Community Foundation of Greater Des Moines
David R. Milligan, Senior Vice President, West Bank
Brad L. Winterbottom, Executive Vice President of the Company; President of West Bank
3
| Has Served | ||||
| Name | as a Director | Position with Company and its | ||
| (Age) | Since | Subsidiaries and/or Principal Occupation | ||
| Frank W. Berlin | 1995 | President, Frank W. Berlin & Associates, | ||
| (Age 63) | West Des Moines, Iowa | |||
| Thomas A. Carlstrom | - | Neurosurgeon, Private practice, | ||
| (Age 63) | Des Moines, Iowa | |||
| Joyce A. Chapman | - | Executive Vice President, West Bank - Retired | ||
| (Age 64) | ||||
| Orville E. Crowley | 1984 | President and Chief Operating Officer, | ||
| (Age 82) | Linden Lane Farms Company, Cumming, Iowa | |||
| Douglas R. Gulling | - | Executive Vice President and Chief Financial | ||
| (Age 55) | Officer of the Company; | |||
| Chief Financial Officer of West Bank; | ||||
| Interim Chief Executive Officer, Director and | ||||
| Treasurer of WB Capital Management Inc. | ||||
| Kaye R. Lozier | - | Director of Development, | ||
| (Age 63) | Community Foundation of Greater Des Moines, | |||
| Des Moines, Iowa | ||||
| David R. Milligan | - | Senior Vice President, West Bank | ||
| (Age 61) | ||||
| George D. Milligan | 2005 | President, The Graham Group, Inc., | ||
| (Age 52) | Des Moines, Iowa | |||
| Robert G. Pulver | 1984 | President and Chief Executive Officer, | ||
| (Age 61) | All-State Industries, Inc., West Des Moines, Iowa | |||
| Thomas E. Stanberry | 2003 | Chairman, President and Chief Executive | ||
| (Age 54) | Officer of the Company; | |||
| Chairman and Chief Executive Officer of West Bank; | ||||
| Chairman of WB Capital Management Inc. | ||||
| Jack G. Wahlig | 2001 | President, Integrus Financial, L.C., | ||
| (Age 76) | West Des Moines, Iowa | |||
| Connie Wimer | 1985 | Chairman, Business Publications Corporation, | ||
| (Age 76) | Des Moines, Iowa | |||
| Brad L. Winterbottom | - | Executive Vice President of the Company; | ||
| (Age 52) | President, West Bank; | |||
| Director, WB Capital Management Inc. |
In addition to the positions listed above, the nominees were employed in the following capacities during the past five years. Mr. David R. Milligan retired as Executive Vice President of the Company, as Chairman and Chief Executive Officer of West Bank, and as a director of WB Capital as of December 31, 2004. He served as a director of the Company from 2002 through 2004, and as Vice Chairman of West Bank until December 2006. He has been “Of Counsel” with Ahlers & Cooney, P.C. since March 2007. He resumed part-time employment at West Bank in February 2009. Ms. Chapman served as Executive Vice President of West Bank and retired as of December 31, 2006. None of the nominees for director have any family relationship with any other nominees or with any executive officers of the Company.
4
With the exception of Joyce A. Chapman, who is a director of American Equity Investment Life Holding Company, George D. Milligan, who is a director of United Fire & Casualty Company, and Robert G. Pulver, who is a director of Summit Hotel Properties, LLC, none of the other above nominees hold a directorship in any other company with a class of securities registered pursuant to Section 12 or subject to Section 15(d) of the Securities Exchange Act or registered as an investment company under the Investment Company Act of 1940.
None of the nominees for director have been involved in any legal proceedings during the past five years that require disclosure.
2. Approve the 2008 Compensation of the Company’s Named Executive Officers. The American Recovery and Reinvestment Act of 2009 requires the Company to permit a separate shareholder vote to approve, on a non-binding basis, the 2008 compensation of executives as disclosed in the “Executive Compensation” section of this Proxy Statement. The Company’s Board of Directors, at the recommendation of its Compensation Committee, has previously approved the 2008 compensation.
The Board recommends a vote FOR approval of the 2008 executive compensation. Proxies in the accompanying form will be voted FOR approval of 2008 executive compensation unless contrary instructions are given.
3. Ratify the Appointment of Independent Registered Public Accounting Firm. The Board of Directors of the Company, at the recommendation of the Audit Committee, has approved the accounting firm of McGladrey & Pullen, LLP, independent certified public accountants, as the independent registered public accounting firm for the Company for the year ending December 31, 2009. McGladrey & Pullen, LLP will conduct the audit examination of the Company and its subsidiaries for 2009. McGladrey & Pullen, LLP was also the independent registered public accounting firm and performed the Company’s audit for the years ending December 31, 2008 and 2007. The Company is asking its Shareholders to ratify the appointment of McGladrey & Pullen, LLP. For a description of the fees for services rendered by McGladrey & Pullen, LLP for 2008 and 2007, and a description of the Company’s policy regarding the approval of independent registered public accountants’ fees, see the section of this report titled “Independent Registered Public Accounting Firm.”
Although ratification by the Shareholders is not required by law, the Board has determined that it is desirable to request approval of this selection by the Shareholders. In the event the Shareholders fail to ratify the appointment, the Audit Committee will consider this factor when making any determination regarding McGladrey & Pullen, LLP. If the selection is ratified, the Audit Committee in its discretion may direct the appointment of a different independent registered public accounting firm at any time during the year if it determines that such a change would be in the best interests of the Company and its Shareholders.
The Board recommends a vote FOR the ratification of the appointment of McGladrey & Pullen, LLP as the independent registered public accounting firm for the year ending December 31, 2009. Proxies in the accompanying form will be voted FOR the ratification of the appointment of McGladrey & Pullen, LLP as the independent registered public accounting firm for the year ending December 31, 2009, unless contrary instructions are given.
4. Other Matters. Management does not know of any other matters to be presented at the Annual Meeting, but should other matters properly come before the Annual Meeting, the proxies will vote on such matters in accordance with their best judgment.
BOARD OF DIRECTORS AND COMMITTEES OF THE BOARD
The Board currently has eight directors. The Board has determined that the following seven directors are “independent” as defined by NASDAQ:
Frank W. Berlin
Wendy L. Carlson
Orville E. Crowley
George D. Milligan
Robert G. Pulver
Jack G. Wahlig
Connie Wimer
The Board has also determined that Thomas A. Carlstrom and Kaye R. Lozier would be independent directors if elected.
5
In 2008, the Board held four regularly scheduled quarterly meetings. One organizational meeting, two special meetings, and two Executive Committee meetings were also held. Each director is required to attend at least 75 percent of the full Board meetings and the meetings of any committees on which the director serves. This requirement was satisfied by all directors except Wendy L. Carlson. Ms. Carlson was absent from one regular meeting, one special meeting, and two Audit Committee meetings. Board members are encouraged to attend the Annual Shareholders’ Meeting, and all Board members attended the 2008 Annual Meeting, except Mr. Pulver.
The Board has established the following standing committees:
Audit Committee
Compensation Committee
Nominating and Corporate Governance Committee
The Board has adopted written charters for each standing committee. The charters may be seen on the Investor Relations, Corporate Governance section of the Company’s website (www.westbankiowa.com). The membership and primary responsibilities of the committees are described below. The 2008 report of each committee follows its description.
Consistent with the NASDAQ listing requirements, the independent directors regularly have the opportunity to meet without Thomas E. Stanberry or any member of management present. During 2008, the independent directors met in such capacity four times.
Audit Committee. The members of the Audit Committee are Jack G. Wahlig, Chair, Wendy L. Carlson, George D. Milligan, and Connie Wimer. Jack G. Wahlig is a “financial expert” as defined in the Sarbanes-Oxley Act of 2002 and related regulations. He retired in 1995 as the national managing partner of the public accounting firm of McGladrey & Pullen, LLP, after a 41-year career. The Committee recommends independent auditors to the Board; reviews with the independent auditors the plan, scope, and results of the auditors’ services; approves their fees; and reviews the Company’s financial reporting and internal control functions. Additionally, the Committee reviews all policies of the Company and its subsidiaries prior to submission of the policies to the Board of the Company for approval. The Committee also performs the duties set forth in its written charter. The Committee is also prepared to meet privately at any time at the request of the independent registered public accountants or members of management to review any special situation arising on any of the above subjects. The Audit Committee regularly reviews its written charter and recommends to the Board changes to the charter when deemed necessary. The Audit Committee met four times during 2008. George D. Milligan is the only member of the Audit Committee who also serves on the audit committee of another listed company.
Audit Committee Report
The incorporation by reference of this proxy statement into any document filed with the SEC by the Company shall not be deemed to include the following report unless such report is specifically stated to be incorporated by reference into such document.
The Audit Committee hereby states as follows:
| · | it has reviewed and discussed the audited financial statements as of and for the year ended December 31, 2008, with management, |
| · | it has discussed with the independent auditors the matters required to be discussed by the statement on Auditing Standards No. 61, as amended, (AICPA, Professional Standards, Vol. 1, AU section 380), as adopted by the Public Company Accounting Oversight Board in Rule 3200T, |
| · | it has received the written disclosures and the letter from the independent accountant required by applicable requirements of the Public Company Accounting Oversight Board regarding the independent accountant’s communications with the audit committee concerning independence, and has discussed with the independent accountant the independent accountant’s independence, |
| · | based on the review and discussions referred to immediately above, it recommended to the Board that the audited financial statements be included in the Company’s annual report on Form 10-K for the year ended December 31, 2008, for filing with the SEC, |
| · | it has reviewed and approved or ratified all related party transactions between the Company and its directors, and |
| · | the Board has approved the Audit Committee Charter. |
6
The undersigned members of the Audit Committee have submitted this report.
Jack G. Wahlig, Chair
Wendy L. Carlson
George D. Milligan
Connie Wimer
Compensation Committee. The current members of the Compensation Committee are Robert G. Pulver, Chair, Frank W. Berlin, Orville E. Crowley, and George D. Milligan. Each of the committee members are independent directors. The Compensation Committee reviews the Company’s compensation and benefit policies, including the individual salaries of the executive officers; makes recommendations to the Board as to the salary of the Chief Executive Officer; makes recommendations to the Board as to incentive compensation plans and employment agreements between the Company, the Chief Executive Officer, and other executive officers; and makes recommendations to the Board concerning director compensation. Additional details about the Committee’s processes and procedures are discussed in the Compensation Discussion and Analysis below. The Compensation Committee met seven times during 2008.
Compensation Committee Interlocks and Insider Participation
The members of the Compensation Committee are set forth above. No Committee members have ever been officers or employees of the Company or have been parties to any related-party transaction requiring disclosures.
Compensation Committee Report
The incorporation by reference of this proxy statement into any document filed with the SEC by the Company shall not be deemed to include the following report unless such report is specifically stated to be incorporated by reference into such document.
The Compensation Committee hereby states as follows:
| · | it has reviewed and discussed the Compensation Discussion & Analysis with management, and |
| · | based on the review and discussion referred to immediately above, it recommended to the Board that the Compensation Discussion & Analysis be included in the Company’s annual report on Form 10-K and this proxy statement. |
The undersigned members of the Compensation Committee have submitted this report.
Robert G. Pulver, Chair
Frank W. Berlin
Orville E. Crowley
George D. Milligan
Nominating and Corporate Governance Committee. The Nominating and Corporate Governance Committee members are Frank W. Berlin, Chair, Wendy L. Carlson, and Robert G. Pulver, all of whom are independent directors. During 2008, the Nominating and Corporate Governance Committee met one time. This Committee makes recommendations to the Board regarding the composition and structure of the Board and nominations for election of directors, including the director-nominees proposed in this proxy statement. It develops policies and processes regarding principles of corporate governance in order to ensure the Board’s compliance with its fiduciary duties to the Company and its Shareholders, including establishment and periodic review of a code of ethics and conduct for all directors and employees. This Committee will consider, as part of its nomination process, any director candidate recommended by a Shareholder who follows the procedures shown under the heading “2010 Shareholder Proposals.”
The Nominating and Corporate Governance Committee follows the process described below when identifying and evaluating nominees to the Board:
Procedures for identifying candidates:
| a) | Review current directors of the Company. |
| b) | Review current directors of the Company’s banking subsidiary, West Bank. |
| c) | Solicit input from existing directors and executive officers. |
| d) | Review submissions from Shareholders, if any. |
7
The following criteria will be considered when evaluating nominee candidates:
| a) | Composition |
The Board should be composed of:
| 1. | Directors chosen with a view to bringing to the Board a variety of experiences and backgrounds; |
| 2. | Directors who have high-level managerial experience or are accustomed to dealing with complex business problems; and |
| 3. | Directors who will represent the balanced, best interests of the Shareholders as a whole rather than special interest groups or constituencies, while also taking into consideration the overall composition and needs of the Board. |
A majority of the Board’s directors shall be independent directors under the criteria for independence required by the SEC and NASDAQ.
| b) | Selection Criteria |
In considering possible candidates for nomination as an independent director, the Committee and other directors should consider the following general guidelines and criteria:
| 1. | A director should be of the highest character and integrity, have experience at or demonstrated understanding of strategy/policy-setting, and have a reputation for working constructively with others; |
| 2. | A director should have sufficient time available to devote to the affairs of the Company in order to carry out the responsibilities of a director; |
| 3. | A director should be free of any conflict of interest that would interfere with the proper performance of the responsibilities of a director; and |
| 4. | The Chief Executive Officer is expected to be a director. Other members of senior management may be considered, but Board membership is not necessary or a prerequisite to a higher management position. |
Nominating and Corporate Governance Committee Report
The Nominating and Corporate Governance Committee evaluated the qualifications and performance of each of the members of the Board of Directors. In its evaluation, the Committee compared each of the current directors to the qualifications and characteristics of a director set forth in the Committee’s charter. The Committee then polled each director to determine his or her willingness to stand for re-election. In doing so, Ms. Wendy L. Carlson indicated it was her desire to not stand for re-election to the Board due to the additional demands on her time caused by her new position as Chief Executive Officer and President of American Equity Investment Life Holding Company. The Committee sought and reviewed information concerning potential director nominees.
The Committee determined that the Company would be benefited by adding six current West Bank directors to the holding company board. Accordingly, the Committee recommended to the Board that Thomas A. Carlstrom, Joyce A. Chapman, Douglas R. Gulling, Kaye R. Lozier, David R. Milligan, and Brad L. Winterbottom be nominated for election as directors. The Board approved the Committee’s recommendation. The Committee also concluded that each of the current Board members, other than Ms. Carlson, should be nominated for re-election at the Annual Meeting.
The Committee reviewed the adequacy of its charter and the charters of the Audit and Compensation Committees. The Committee did not recommend any modifications to its charter or the charters of the Audit Committee or Compensation Committee. The Committee also reviewed the Company’s Code of Conduct and did not recommend any modifications. The Committee performed all the other duties stated in its charter.
The undersigned members of the Nominating and Corporate Governance Committee have submitted this report.
Frank W. Berlin, Chair
Wendy L. Carlson
Robert G. Pulver
8
2008 Directors’ Compensation
Directors of the Company received an annual retainer of $8,000, payable quarterly, plus $500 per regular meeting (board and committee) or $600 for Audit Committee meetings. If a Committee meeting was on the same day as a regular board meeting, the fee paid for attending both meetings was $600 for an Audit Committee meeting and $500 for any other committee meeting. Directors of the Company who also served as directors of West Bank received fees of $450 for each West Bank board meeting attended (eleven meetings held) plus an annual retainer of $6,500, $500 for loan committee meetings attended, and $400 for other committee meetings attended. Mr. Stanberry and other employees do not receive director’s fees.
The Chairs of the Audit and Compensation Committee receive an additional meeting fee of $100. If there are multiple meetings on one day, the maximum fee paid will be the highest fee for one meeting.
Directors of the Company are eligible to receive grants of restricted stock under the Restricted Stock Compensation Plan. No awards were made under this plan during 2008.
The following table sets forth all compensation earned or paid to the directors for services rendered in the fiscal year ended December 31, 2008.
| Fees Paid | Fees Paid | All Other | ||||||||||||||
| Name | by Company | by Subsidiary | Compensation (1) | Total | ||||||||||||
| Frank W. Berlin | $ | 20,050 | $ | 17,450 | $ | - | $ | 37,500 | ||||||||
Wendy L. Carlson (2) | 11,700 | 900 | - | 12,600 | ||||||||||||
Orville E. Crowley | 18,775 | 5,225 | 5,126 | 29,126 | ||||||||||||
George D. Milligan | 21,850 | 16,950 | 400 | 39,200 | ||||||||||||
Robert G. Pulver | 19,750 | 17,450 | 491 | 37,691 | ||||||||||||
Jack G. Wahlig | 19,350 | 11,450 | 480 | 31,280 | ||||||||||||
Connie Wimer | 18,950 | 11,900 | 1,095 | 31,945 | ||||||||||||
| (1) | All other compensation consists of fees normally charged by the West Bank trust department, which were waived for the directors. |
| (2) | Received compensation for attending two West Bank meetings |
9
Security Ownership of Certain Beneficial Owners and Executive Officers
The following table contains the shares of Common Stock beneficially owned by each director, director nominee, named executive officer listed in the Summary Compensation Table, and all directors and executive officers of the Company and subsidiaries (including named executive officers) as a group. The ownership information is as of February 20, 2009.
| Shares Beneficially | Percent of Total | |||||||
| Name | Owned (1) (2) | Shares Outstanding | ||||||
| Frank W. Berlin | 46,856 | * | ||||||
| Wendy L. Carlson | 500 | * | ||||||
| Thomas A. Carlstrom | 17,997 | * | ||||||
Joyce A. Chapman (3) | - | * | ||||||
Orville E. Crowley (4) | 133,258 | * | ||||||
Scott D. Eltjes (5) | 9,074 | * | ||||||
| Douglas R. Gulling | 14,437 | * | ||||||
Jeffrey D. Lorenzen (6) | 2,399 | * | ||||||
| Kaye R. Lozier | 2,720 | * | ||||||
| David R. Milligan | 5,700 | * | ||||||
| George D. Milligan | 1,500 | * | ||||||
Robert G. Pulver (7) (8) | 72,845 | * | ||||||
Thomas E. Stanberry (9) | 21,960 | * | ||||||
| Jack G. Wahlig | - | * | ||||||
| Connie Wimer | 28,848 | * | ||||||
| Brad L. Winterbottom | 9,615 | * | ||||||
| Executive officers and directors | ||||||||
| as a group (16 persons) | 367,709 | 2.11 | % | |||||
* Indicates less than 1% ownership of outstanding shares.
| (1) | Shares “beneficially owned” include shares owned by or for, among others, the spouse and/or minor children of the named individual and any other relative who has the same home address as such individual, as well as other shares with respect to which the named individual has or shares voting or investment power. Beneficial ownership may be disclaimed as to certain of the shares. |
| (2) | Except as otherwise indicated in the following notes, each named individual owns his or her shares directly, or indirectly through a self-directed IRA or the Company’s Employee Savings and Stock Ownership Plan, and has sole investment and voting power with respect to such shares. |
| (3) | Ms. Chapman disclaims any beneficial ownership of 28,224 shares held in her spouse’s name. |
| (4) | Mr. Crowley disclaims any beneficial ownership of 297,675 shares held in his spouse’s name. |
| (5) | Mr. Eltjes resigned effective January 14, 2009. |
| (6) | Mr. Lorenzen resigned effective January 23, 2009. |
| (7) | Mr. Pulver disclaims any beneficial ownership of 6,614 shares held in his spouse’s name. |
| (8) | 59,875 of Mr. Pulver’s shares are pledged as security. |
| (9) | Mr. Stanberry disclaims any beneficial ownership of 495 shares held in his spouse’s name. |
10
Other Beneficial Owners
The following table sets forth certain information on each person known to the Company to be the beneficial owner, as of February 20, 2009, of more than five percent of the Company’s Common and Preferred Stock.
| Shares Beneficially | Percent of Total | |||||||
| Name and Address | Owned | Shares Outstanding | ||||||
| Common Stock: | ||||||||
| The Jay Newlin Trust | 1,041,952 | 5.99 | % | |||||
| 6165 NW 86th Street | ||||||||
| Johnston, IA 50131 | ||||||||
| American Equity Investment Life Holding Company | 1,457,051 | 8.37 | % | |||||
| 5000 Westown Parkway, Suite 440 | ||||||||
| West Des Moines, IA 50266 | ||||||||
| Preferred Stock: | ||||||||
| U.S. Department of the Treasury | 36,000 | 100.00 | % | |||||
| 1500 Pennsylvania Avenue, NW | ||||||||
| Washington, D.C. 20220 | ||||||||
Section 16(a) Beneficial Ownership Reporting Compliance
Section 16(a) of the Securities Exchange Act of 1934 requires that the Company's directors and executive officers and persons who own more than ten percent of the Company's Common Stock file initial reports of ownership and reports of changes of ownership with the SEC and NASDAQ. Reporting persons are required by the SEC regulations to furnish the Company with copies of all Section 16(a) forms they file. The Company has not received any Section 16(a) form indicating that any one person owns more than ten percent of the Company’s stock and the Company does not know of any one Shareholder who owns more than ten percent of the Company’s stock. Based solely on its review of the copies of Section 16(a) forms received from its directors and executive officers and written representations that no other reports were required, the Company believes that all Section 16(a) reports applicable to its directors and officers during 2008 were filed.
Change in Control Agreements
The Company does not know of any arrangements, including pledges that would result in a future change in control of the Company.
EXECUTIVE COMPENSATION
Compensation Discussion and Analysis
Compensation Philosophy and Objectives
The Company believes that a strong management team comprised of talented individuals in key positions is essential for the profitability and overall success of the Company. The Company’s executive compensation program should be a means for attracting, retaining, and motivating such individuals. Therefore, it is important that the Company’s named executive officers, who are indentified in the Summary Compensation Table below, receive an aggregate compensation package that is both competitive with compensation received by similarly-situated executive officers and reflective of each individual officer’s contributions to the success of the Company.
The Company has historically favored annual performance-based cash compensation over deferred cash or equity compensation. Annual compensation for the named executive officers consists of base salary, cash incentive bonus, and traditional benefits, including profit sharing through the Company’s Employee Savings and Stock Ownership Plan. The Company has authorized a restricted stock grant program, but has not yet used the program.
11
The Company’s executive compensation program is designed to promote the following main objectives:
| · | Create shareholder value by providing the Company the consistent ability to attract and retain outstanding and motivated employees; and |
| · | Provide the executive officers fair market rate total compensation for successfully implementing the Company’s Mission Statement and assisting the Board in developing successful strategic direction for the long-term success of the Company. |
Important factors considered by the Compensation Committee while pursuing the Company’s compensation objectives include:
| · | The financial performance of the Company based on a comparison of actual net income to budgeted net income; |
| · | Returns on assets and equity exceeding the returns of peers by a predetermined percentage; |
| · | In the case of all executives except the Chief Executive Officer, the Chief Executive Officer’s recommendations; and |
| · | Leadership, community involvement, and overall quality of contribution to the strategic success of the Company and its affiliates. |
With these objectives serving as a foundation, the Company, through its Compensation Committee, seeks to reward positive results, leadership, innovation, and entrepreneurship by its executive officers.
Administration, Process, and 2008 Compensation
The Company’s executive compensation program is administered by the Compensation Committee. The Compensation Committee’s Charter may be reviewed on the Company’s website under Investor Relations, Corporate Governance.
The Compensation Committee does not use formulaic or mechanical procedures in determining compensation amounts or allocation of specific elements of compensation, or in determining types of awards to be granted. Rather, the Compensation Committee establishes base salary and target performance levels based on a number of factors that are designed to further the Company’s compensation objectives.
The Compensation Committee meets periodically throughout the fiscal year. There were seven committee meetings in 2008. The Committee considers whether the Company’s compensation program is adequately competitive with other similar financial service businesses and monitors the financial performance of the Company, its subsidiaries, and the contributions of the senior executives. The Committee has previously used peer group analysis while determining the competitiveness of the Company’s senior executive compensation. However, peer group analysis was not used during 2008 because of the unprecedented adverse business and financial experiences of the Company and its peers. Peer group analysis will likely be used again in the future. The Compensation Committee has also previously used a compensation consultant, including in 2007, but did not do so in 2008 due to the unusual business stress on the Company and its subsidiaries. The Committee will likely use consultant services again in the future.
The Compensation Committee annually reviews and approves corporate goals and objectives related to Mr. Stanberry’s compensation. The Committee evaluates Mr. Stanberry’s performance in light of these goals and objectives and recommends a compensation package to the full Board based on this evaluation. Mr. Stanberry may not be present during the voting or any deliberation concerning his compensation. The Compensation Committee also makes annual recommendations to the Board concerning compensation of the Company’s executive officers, officers and employees of West Bank, and officers and employees of WB Capital. Mr. Stanberry participates in those committee deliberations.
Base salaries for Messrs. Stanberry, Gulling, and Winterbottom were determined for 2008 by reviewing information from various sources, including a 2007 compensation consultant analysis regarding the base salary paid to key executives in publicly-owned financial services organizations of similar size in the Midwest. The 2008 base salaries for Messrs. Stanberry, Gulling, and Winterbottom were $250,000, $210,000, and $210,000, respectively. Those base salaries will be paid in 2009 also. The base salaries are set in each officer’s employment agreement. They are to be reviewed at least annually by the Compensation Committee and they may be increased, but not decreased. The base salaries are to be the minimum annual compensation for these named executive officers.
The kind and amount of traditional benefits are determined on information available to the Compensation Committee regarding the type and amount of benefits made available to key executives of similar companies located in central and eastern Iowa. The named executive officers receive the same employee benefits as all other officers plus the club dues indicated in footnote 3 of the Summary Compensation Table. Those benefits are set at levels the Company believes to be competitive and fair in its marketplaces.
12
Profit sharing (part of the Company’s Employee Savings and Stock Ownership Plan) and cash incentive bonuses are the elements of the compensation program that are most directly tied to the performance of the Company. The named executive officers receive the same profit sharing percentage as other employees of the Company and its affiliates receive. The amount of the annual profit sharing award is determined by the Board based on annual earnings. In 2007 profit sharing awards were five percent of annual salary. The awards were reduced to three percent for 2008 due to the financial performance of the Company.
The named executive officers are also eligible to receive a cash incentive bonus payment. The Compensation Committee annually determines the target cash incentive bonus each named executive officer is eligible to receive in the following year. In 2008, the targets for incentive bonuses were $400,000, $100,000, and $120,000, respectively, for Messrs. Stanberry, Gulling, and Winterbottom. The target for Mr. Lorenzen was $131,000. Mr. Eltjes’ employment contract did not provide for a cash incentive bonus.
Awards, if any, may be smaller or greater than the target. At the end of each year, the Compensation Committee reviews its compensation factors and other material information, and determines the percentage of the target cash incentive bonus to actually award Messrs. Stanberry, Winterbottom, and Gulling. The most significant compensation factors applied by the Compensation Committee while determining cash incentive bonuses and the approximate weight of the factors in the decision are as follows:
| · | Actual net income as a percentage of budgeted net income on a consolidated basis and by individual subsidiary (85%); |
| · | Return on assets exceeding 140 percent of the Company’s peer group average (5%); |
| · | Return on equity exceeding 130 percent of the Company’s peer group average (5%); and |
| · | Strategic contribution, community involvement, and leadership of the Company (5%). |
The peer group consists of all bank holding companies in the United States with total assets between $1 billion and $3 billion.
Based on these factors and with the named executive officers’ input, the Compensation Committee recommended, and the Board approved, no 2008 cash incentive bonuses for Messrs. Stanberry, Gulling, and Winterbottom.
Emergency Economic Stabilization Act Certification
The Compensation Committee certifies that it has reviewed with senior risk officers (Messrs. Stanberry, Gulling, and Winterbottom) all incentive compensation arrangements and has made reasonable efforts to ensure that such arrangements do not encourage any officers to take unnecessary and excessive risks that might threaten the value of the Company or either of its subsidiaries.
13
Summary Compensation Table
The following table provides information concerning total compensation earned or paid to the Chief Executive Officer, the Chief Financial Officer, and the three other most highly compensated executive officers of the Company for services rendered in the year ended December 31, 2008. These five officers are referred to as the Named Executive Officers in this proxy statement.
In 2008, West Bank paid Messrs. Stanberry, Gulling, and Winterbottom, rather than the Company. Messrs. Eltjes and Lorenzen were paid by WB Capital.
| Non-Equity | ||||||||||||||||||||||
| Incentive Plan | All Other | |||||||||||||||||||||
| Name and Principal Positions | Year | Salary | Bonus | Compensation (2) | Compensation (3) | Total | ||||||||||||||||
| Thomas E. Stanberry, Chairman, President and | 2008 | $ | 250,000 | $ | 5,000 | (1) | $ | - | $ | 20,723 | $ | 275,723 | ||||||||||
| Chief Executive Officer of the Company | 2007 | 250,000 | 5,000 | (1) | 210,000 | 25,228 | 490,228 | |||||||||||||||
| Chairman and Chief Executive Officer of West Bank | 2006 | 250,000 | 5,000 | (1) | 276,000 | 27,762 | 558,762 | |||||||||||||||
| Chairman of WB Capital Management Inc. | ||||||||||||||||||||||
| Douglas R. Gulling, Executive Vice President and | 2008 | $ | 210,000 | $ | 4,200 | (1) | $ | - | $ | 16,915 | $ | 231,115 | ||||||||||
| Chief Financial Officer of the Company | 2007 | 200,000 | 4,000 | (1) | 35,000 | 18,781 | 257,781 | |||||||||||||||
| Director and Chief Financial Officer of West Bank | 2006 | 200,000 | 4,000 | (1) | 46,000 | 20,770 | 270,770 | |||||||||||||||
| Interim Chief Executive Officer, Director and | ||||||||||||||||||||||
| Treasurer of WB Capital Management Inc. | ||||||||||||||||||||||
| Brad L. Winterbottom, Executive Vice President | 2008 | $ | 210,000 | $ | 4,200 | (1) | $ | - | $ | 22,573 | $ | 236,773 | ||||||||||
| of the Company | 2007 | 200,000 | 4,000 | (1) | 70,000 | 25,598 | 299,598 | |||||||||||||||
| Director and President of West Bank | 2006 | 200,000 | 4,000 | (1) | 91,000 | 27,242 | 322,242 | |||||||||||||||
| Director of WB Capital Management Inc. | ||||||||||||||||||||||
| Scott D. Eltjes, Director and Chief Executive | 2008 | $ | 209,000 | $ | - | $ | - | $ | 14,947 | $ | 223,947 | |||||||||||
Officer of WB Capital Management Inc. (4) | 2007 | 209,000 | - | - | 19,127 | 228,127 | ||||||||||||||||
| 2006 | 209,000 | - | - | 6,489 | 215,489 | |||||||||||||||||
| Jeffrey D. Lorenzen, Director, President | 2008 | $ | 219,751 | $ | - | $ | - | $ | 21,702 | $ | 241,453 | |||||||||||
| and Chief Investment Officer of WB Capital | 2007 | 214,100 | 84,750 | - | 25,432 | 324,282 | ||||||||||||||||
Management Inc. (4) | 2006 | 209,000 | 110,770 | - | 35,049 | 354,819 | ||||||||||||||||
| (1) | Consists of a holiday bonus equal to two percent of annual salary, which is paid to all officers and employees of West Bank. |
| (2) | Amounts are shown in the year accrued. |
| (3) | Consists entirely of contributions made by the Company on behalf of the Named Executive Officer to the Company’s Employee Savings and Stock Ownership Plan (including 401(k) match and profit sharing contribution) except for the following amounts for 2008, 2007, and 2006, respectively, which represent premiums on group term life insurance coverage: Stanberry - $897, $897, and $897; Gulling - $1,367, $781, and $770; Winterbottom - $731, $748, and $503; Eltjes - $317, $317, and $219; and Lorenzen $336, $317, and $317; and club dues for Stanberry - $3,726, $4,081, and $4,865; Gulling - $850, $0, and $0; Winterbottom - $7,144, $6,850, and $6,739; and Lorenzen - $5,984, $5,919, and $5,967. |
| (4) | Mr. Eltjes and Mr. Lorenzen resigned effective January 14, 2009, and January 23, 2009, respectively. Mr. Gulling was named Interim Chief Executive Officer of WB Capital. |
14
Equity Compensation Plan Information
Restricted stock grants were authorized by the Shareholders in 2005; however, no grants have been awarded. The Board has to date determined that cash compensation paid annually has been in the best interests of the Company. The Company does not have a stock option plan.
Number of securities to be issued upon exercise of outstanding options, warrants and rights | Weighted-average exercise price of outstanding options, warrrants and rights | Number of securities remaining available for future issuance under equity compensation plans (excluding securities reflected in (a)) | ||||||||||
| Plan category | (a) | (b) | (c) | |||||||||
| Equity compensation plans approved by security holders | - | $ | - | 300,000 | ||||||||
| Equity compensation plans not approved by security holders | - | - | - | |||||||||
| Total | - | $ | - | 300,000 | ||||||||
Potential Payments Upon Termination or Change in Control as of December 31, 2008
The American Recovery and Reinvestment Act of 2009 (the “ARRA”) became law on February 17, 2009. The ARRA requires the Secretary of the Treasury to establish certain standards for executive compensation which will apply to the Company as long as any obligation arising from financial assistance provided the Company under the Emergency Economic Stabilization Act of 2008 remains outstanding. Those standards will prohibit the Company from paying its named executive officers any severance benefits. The following information describes the severance benefits that existed as of December 31, 2008, and which may again become effective sometime in the future.
The following table shows contract payments that would have been due certain named executive officers if their employment had been terminated on December 31, 2008, for various assumed reasons. No severance payments would have been due Messrs. Eltjes and Lorenzen if their employment had been terminated on December 31, 2008.
During 2008, the Company and Messrs. Stanberry, Gulling, and Winterbottom entered into new employment agreements. The contracts are similar to each other in form. The contracts originally ran through December 31, 2010. However, they automatically renew for a three-year term every January 1 unless the Company gives written notice of nonrenewal by November 30 of the preceding year. No such notice was given in 2008, and, therefore, as of January 1, 2009, the contracts run through December 31, 2011. The agreements contain restrictions on the use of the Company’s confidential information, intellectual property, and trade secrets. The agreements also contain provisions prohibiting certain competition, solicitation, or tampering during the terms of the contracts and for one year after termination or resignation of employment. Each contract contains an agreement that the Company’s rights may be enforced by injunctive relief. Disputes under or concerning the agreements must be resolved by amicable negotiations or confidential binding arbitration. The complete agreements are reproduced as attachments to the Company’s May 23, 2008, report on Form 8-K.
The agreements provide for severance payments to the officers if their employment is terminated for death, “permanent disability,” “without cause,” for “good reason,” or in the event of a “change in control” of the Company. The agreements do not provide for any severance payments if the Company terminates an agreement for “due cause” or if an executive voluntarily resigns for other than “good reason.” The phrases “permanent disability,” “due cause,” “good reason,” and “change in control” are defined in the agreements, and the Company believes the terms are reasonably typical of similar terms in other executive employment agreements.
If one of Messrs. Stanberry, Gulling, or Winterbottom had died on December 31, 2008, the Company would have been obligated to pay his designated beneficiary one month of base salary plus 75 percent of his incentive bonus target for 2008. The 2008 incentive bonus targets were $400,000, $100,000, and $120,000 for Messrs. Stanberry, Gulling, and Winterbottom respectively. As of December 31, 2008, the contractual death benefits for Messrs. Stanberry, Gulling, and Winterbottom would have been $320,833, $92,500, and $107,500.
15
If one of the three named executive officers becomes permanently disabled and eligible for long-term disability benefits under the Company’s long-term disability plan, the Company would supplement the first year of long-term disability insurance benefits so that the executive would be paid full base salary for twelve months after becoming disabled. Alternatively, if permanent disability is established by certification by one or more doctors acceptable to the Company and the officer, but no insurance benefit is available, then the Company shall pay the officer base salary for one year after the disability determination. In either instance, the executive would also receive 75 percent of the officer’s incentive compensation target for the year in which disability is determined, prorated to the date of disability. For a permanent disability starting on December 31, 2008, the maximum payments due Messrs. Stanberry, Gulling, and Winterbottom would have been $550,000, $285,000, and $300,000 respectively. Those payments would include lump sum payments of $300,000, $75,000, and $90,000 respectively, and the payment of base salary during the year following the disability determination.
If any of the three named executive officers are terminated without cause, they are contractually entitled to a severance benefit of three times base salary, to be paid within sixty days of termination, plus insurance premiums to provide the executive with family health coverage under COBRA for one year after termination. The lump sum without cause severance benefits for a termination on December 31, 2008, would have been $750,000, $630,000, and $630,000 for Messrs. Stanberry, Gulling, and Winterbottom, respectively, and the medical premium benefit would have cost approximately $10,500.
The employment agreements also provide for severance benefits if any of the three executives terminates employment for good reason, which generally means a termination after the executive’s job functions or location have been materially changed. In order to be eligible for a good reason severance benefit, the executive has to provide the Company a ninety-day notice of termination that includes a thirty-day cure period. If a good reason termination becomes effective, the executive is due a severance benefit of at least the amount of base salary plus 75 percent of the current incentive target, in the case of Mr. Stanberry, or $100,000 in the case of Messrs. Gulling or Winterbottom, for the remaining term of the employment agreement. The lump sum benefit must be paid within sixty days after the revocation period following execution of a required release of claims. In addition, the Company would pay insurance premiums to provide the executive with family health coverage under COBRA for one year after employment ceases. If the officer terminates an agreement for good reason and he was also then eligible for a change in control severance benefit (as described below), he may choose between the alternative benefits. The change in control severance benefit in most instances would be a larger payment than the good reason benefit, but the change in control benefit is contingent on additional efforts by the officer. The amounts of the good reason severance benefits, other than the change in control benefits, for a termination on December 31, 2008, would have been $1,100,000, $620,000, and $620,000 for Messrs. Stanberry, Gulling, and Winterbottom, respectively, plus approximately $10,500 for medical insurance premiums.
The change of control severance benefits are three times the sum of base salary plus 75 percent of the existing incentive bonus target for Mr. Stanberry and three times the sum of base salary plus $100,000 for Messrs. Gulling and Winterbottom. In addition, the Company would pay insurance premiums to provide the executive with family health coverage under COBRA for one year after employment ceases. The change in control benefits are not paid until after the officer makes himself available to work for the Company or its successor for a transition period of not more than six months after a change in control. The change of control benefits shall be paid within sixty days after the waiver or expiration of the transition period and after the expiration of any revocation period following the officer’s execution of a required release of claims. The amounts of this benefit for a change of control termination on December 31, 2008, would have been $1,650,000, $930,000, and $930,000 for Messrs. Stanberry, Gulling, and Winterbottom, respectively, plus approximately $10,500 for medical insurance premiums.
| Named Executive Officer | Death (1) | Due Cause | Permanent Disability (2) | Without Cause (3)(4) | Termination by Employee for Good Reason (3)(4) | Change of Control (3)(5) | ||||||||||||||||||
| Thomas E. Stanberry | $ | 320,833 | $ | - | $ | 550,000 | $ | 750,000 | $ | 1,100,000 | $ | 1,650,000 | ||||||||||||
| Douglas R. Gulling | 92,500 | - | 285,000 | 630,000 | 620,000 | 930,000 | ||||||||||||||||||
| Brad L. Winterbottom | 107,500 | - | 300,000 | 630,000 | 620,000 | 990,000 | ||||||||||||||||||
| (1) | Benefit is equal to one month of base pay plus 75 percent of incentive target compensation prorated to date of death. |
| (2) | These numbers would be applicable if there was no available disability insurance benefit. |
| (3) | COBRA medical benefits will also be paid for one year. |
| (4) | If the Change of Control benefit is applicable, the Named Executive Officer can choose the Change of Control benefit, if higher. |
| (5) | If requested, each of the Named Executive Officers must be employed six months after the Change in Control to receive full benefits. |
16
INDEPENDENT REGISTERED PUBLIC ACCOUNTING FIRM
The Board, at the recommendation of the Audit Committee, approved McGladrey & Pullen, LLP, an independent registered public accounting firm, as the principal accountant for the Company. McGladrey & Pullen, LLP, will conduct the audit of the Company and its subsidiaries for 2009. McGladrey & Pullen, LLP was also the principal accountant and performed the audit in 2008.
A representative from McGladrey & Pullen, LLP will be present at the Annual Meeting. He will have the opportunity to make a statement and will be available to respond to appropriate questions from Shareholders.
Audit Fees
The following table presents fees for professional audit services rendered by McGladrey & Pullen, LLP for the audit of the Company’s annual financial statements for the fiscal years ended December 31, 2008, and 2007, and fees billed for other services rendered by McGladrey & Pullen, LLP and its associated entity, RSM McGladrey, Inc.:
| 2008 | 2007 | |||||||
Audit fees (1) | $ | 220,900 | $ | 177,000 | ||||
Audit-related fees (2) | 23,700 | 43,500 | ||||||
Tax fees (3) | 26,500 | 20,000 | ||||||
All other fees (4) | 8,900 | - | ||||||
| Total | $ | 280,000 | $ | 240,500 | ||||
| (1) | Audit fees represent fees for professional services provided for the audit of the Company’s annual financial statements, review of the Company’s quarterly financial statements in connection with the filing of current and periodic reports, and reporting on internal controls in accordance with Section 404 of Sarbanes-Oxley. |
| (2) | Audit-related fees represent the audit of the Company’s profit sharing plan, agreed upon procedures for student lending, and various items on new or pending accounting pronouncements. |
| (3) | Tax fees represent fees for professional services related to tax compliance, which included preparation of tax returns and tax advice regarding acquisitions, investments, and tax credits. |
| (4) | All other fees represent fees for due diligence services on potential acquisition. |
Independence: The Audit Committee considered whether the non-audit services provided to the Company by McGladrey & Pullen, LLP and its associated entity, RSM McGladrey, Inc., are compatible with maintaining the independence of McGladrey & Pullen, LLP, and concluded that the independence of McGladrey & Pullen, LLP is not compromised by the provision of such services.
The Audit Committee pre-approves all auditing services and permitted non-audit services, including the fees and terms of those services, to be performed for the Company by its independent registered public accounting firm prior to engagement.
GENERAL MATTERS
Transactions with Related Persons
Certain directors and one executive officer of the Company have direct and indirect material interests in loans made by West Bank involving more than $120,000. All of the loans were made in West Bank’s ordinary course of business, on substantially the same terms, including interest rates and collateral, as those prevailing at the time for comparable loans with other persons not related to West Bank or the Company, and did not involve more than the normal risk of collectibility or present other unfavorable features. None of the loans have been classified as non-accrual, past due, restructured, or potential problem loans.
The Audit Committee’s Charter requires the Committee to review and approve all related party transactions that must be disclosed. All transactions between the Company or its subsidiaries and any related person, including loans made by West Bank, involving $120,000 or more, are reviewed to determine whether all material facts of the transaction are known to the Committee, the transaction complies with known legal requirements, and the transaction is fair to the Company or its subsidiaries. The Audit Committee completed the required review of the fiscal year 2008 related party transactions and all transactions were approved and ratified.
17
2010 Shareholder Proposals
In order for any proposals of Shareholders to be presented as an item of business at the Annual Meeting of Shareholders of the Company to be held in 2010, the proposal must be received at the Company's principal executive offices no later than November 7, 2009, and must be limited to 500 words. To be included in the Company’s proxy statement, the Shareholder must be a holder of record or beneficial owner of at least $2,000 in market value of the Company’s shares entitled to be voted on the proposal and have held the shares for at least one year, and shall continue to hold the shares through the date of the meeting. Either the Shareholder, or the Shareholder’s representative who is qualified under state law to present the proposal on his or her behalf, must attend the meeting to present the proposal. Shareholders may not submit more than one proposal. A Shareholder proposal submitted outside the procedures prescribed in Rule 14a-8 under the Securities Exchange Act of 1934 shall be considered untimely unless received not later than January 21, 2010.
Shareholders wishing to recommend names of individuals for possible nomination to the Board may do so according to the following procedures:
| 1. | Contact the Secretary of the Company to obtain the Board Membership Criteria established by the Board. |
| 2. | Make typewritten submission to the Secretary of the Company naming the proposed candidate and specifically noting how the candidate meets the criteria set forth by the Board. |
| 3. | Submit the recommendation to the Company by 120 days prior to the expected mailing date of the proxy. |
| 4. | Prove the person making the recommendation is a Shareholder who owns shares with a market value of at least $2,000 and who has held those shares for at least one year at the time the submission is made. |
| 5. | If the person being recommended is aware of the submission, he or she must sign a statement so indicating. |
| 6. | If the person being recommended is not aware of the submission, the submitter must explain why. |
The written submission must be mailed to:
Corporate Secretary
West Bancorporation, Inc.
1601 22nd Street
West Des Moines, Iowa 50266
Shareholder Communications
It is the general policy of the Board that management speaks for the Company. To the extent Shareholders would like to communicate with a Company representative, they may do so by contacting Doug Gulling, Chief Financial Officer, 1601 22nd Street, West Des Moines, Iowa 50266. Mr. Gulling may be reached by telephone at 515-222-2300 or by email at dgulling@westbankiowa.com.
The Company has a process for Shareholders to send communications to the Board or any of its individual members. Any Shareholder wishing to communicate with one or more Board members should address a written communication to Mr. Gulling at one of the addresses noted above. Mr. Gulling will forward all Shareholder communications to the full Board or its individual members as appropriate.
Form 10-K
The Company will provide, when available, a copy of its annual report on Form 10-K as filed with the SEC, without charge to each Shareholder, upon request. Such request should be directed to Alice A. Jensen, Corporate Secretary, West Bancorporation, Inc., 1601 22nd Street, West Des Moines, Iowa 50266 or by calling 515-222-2300. The Company’s Form 10-K will also be available on the SEC's internet website at http://www.sec.gov/edgar/searchedgar/webusers.htm and through a link at the Investor Relations, SEC Filings section of the Company’s website (www.westbankiowa.com).
18
Delivery of Documents to Shareholders Sharing an Address
In some instances, only one annual report or proxy statement is being delivered to two or more Shareholders who share an address. The Company has not received contrary instructions from any Shareholder. However, the Company will promptly deliver additional copies of its annual report or proxy statement to any Shareholder who makes such a request. Any Shareholder who wishes to receive separate copies of the annual report or proxy statement in the future may notify Alice A. Jensen, Corporate Secretary, at 1601 22nd Street, West Des Moines, Iowa 50266, or 515-222-2300. Alternatively, any Shareholders sharing an address who are receiving multiple copies of the annual reports or proxy statements may also notify Ms. Jensen to request delivery of only one copy.
| By Order of the Board of Directors, | |
| /s/ Alice A. Jensen | |
| Alice A. Jensen, Secretary |
March 5, 2009
19
WEST BANCORPORATION, INC.
APPENDIX TO THE PROXY STATEMENT
FISCAL YEAR 2008
This Appendix to the Proxy Statement shall serve as an Annual Report to Shareholders pursuant to Rule 14a-3 of the Securities Exchange Act of 1934.
TABLE OF CONTENTS
| PAGE | |
| General Information | 2 |
| Directors and Executive Officers | 3 |
| Selected Financial Data | 4 |
| Management’s Discussion and Analysis | 5 |
| Reports of Independent Registered Public Accounting Firm | 30 |
| Management’s Report on Internal Control over Financial Reporting | 32 |
| Consolidated Balance Sheets | 33 |
| Consolidated Statements of Income | 34 |
| Consolidated Statements of Stockholders’ Equity | 35 |
| Consolidated Statements of Cash Flows | 36 |
| Notes to Consolidated Financial Statements | 38 |
| Stock Information | 66 |
1
WEST BANCORPORATION, INC.
GENERAL INFORMATION
West Bancorporation, Inc. (the “Company”) is an Iowa corporation and financial holding company registered under the Bank Holding Company Act of 1956, as amended by the Gramm-Leach-Bliley Act of 1999. The Company was organized and incorporated in 1984 to serve as a holding company for its principal subsidiary, West Bank.
West Bank’s operations are conducted primarily within the Des Moines and Iowa City, Iowa, metropolitan areas. The principal sources of revenue are from interest and fees earned on loans, service charges on deposit accounts, trust services, and interest on fixed income securities.
WB Capital Management Inc. (“WB Capital”), a wholly-owned subsidiary, which is a registered investment advisor, has offices in West Des Moines and Coralville, Iowa. WB Capital provides portfolio management services to high net worth individuals, retirement plans, corporations, public funds, mutual funds, foundations, and endowments.
West Bancorporation Capital Trust I (the “Trust”) was formed for the purpose of issuing trust preferred securities. The Trust is recorded on the books of the Company using the equity method of accounting.
The Company’s stock trades on the NASDAQ Global Select Market under the symbol WTBA.
2
DIRECTORS AND EXECUTIVE OFFICERS
The following table sets forth summary information about the directors and executive officers of the Company and certain executive officers of West Bank and WB Capital Management Inc.
| Position with Company, West Bank or WB Capital Management Inc. | ||
| Name | and/or Principal Occupation | |
| Frank W. Berlin | Director of Company and West Bank; | |
| President, Frank W. Berlin & Associates, | ||
| West Des Moines, Iowa | ||
| Wendy L. Carlson | Director of Company; | |
| Director, Chief Executive Officer and President, | ||
| American Equity Investment Life Holding Company, | ||
| West Des Moines, Iowa | ||
| Orville E. Crowley | Director of Company; | |
| President and Chief Operating Officer, | ||
| Linden Lane Farms Company, Cumming, Iowa | ||
| Douglas R. Gulling | Executive Vice President and Chief Financial Officer of the Company; | |
| Director and Chief Financial Officer of West Bank; | ||
| Interim Chief Executive Officer, Director and Treasurer | ||
| of WB Capital Management Inc. | ||
| George D. Milligan | Director of Company and West Bank; | |
| President, The Graham Group, Inc., | ||
| Des Moines, Iowa | ||
| Robert G. Pulver | Director of Company and West Bank; | |
| President and Chief Executive Officer, | ||
| All-State Industries, Inc., West Des Moines, Iowa | ||
| Thomas E. Stanberry | Chairman, President and Chief Executive Officer of the Company; | |
| Chairman and Chief Executive Officer of West Bank; | ||
| Chairman of WB Capital Management Inc. | ||
| Jack G. Wahlig | Director of Company and West Bank; | |
| President, Integrus Financial, L.C., | ||
| West Des Moines, Iowa | ||
| Connie Wimer | Director of Company and West Bank; | |
| Chairman, Business Publications Corporation, | ||
| Des Moines, Iowa | ||
| Brad L. Winterbottom | Executive Vice President of the Company; | |
| Director and President of West Bank; | ||
| Director of WB Capital Management Inc. |
3
WEST BANCORPORATION, INC. AND SUBSIDIARIES
SELECTED FINANCIAL DATA
| Years Ended December 31 | ||||||||||||||||||||
| (in thousands, except per share amounts) | 2008 | 2007 | 2006 | 2005 | 2004 | |||||||||||||||
| Operating Results | ||||||||||||||||||||
| Interest income | $ | 72,531 | $ | 82,027 | $ | 79,736 | $ | 63,475 | $ | 49,599 | ||||||||||
| Interest expense | 31,431 | 43,823 | 40,669 | 25,102 | 13,952 | |||||||||||||||
| Net interest income | 41,100 | 38,204 | 39,067 | 38,373 | 35,647 | |||||||||||||||
| Provision for loan losses | 16,600 | 2,350 | 1,725 | 1,775 | 1,200 | |||||||||||||||
| Net interest income after provision for loan losses | 24,500 | 35,854 | 37,342 | 36,598 | 34,447 | |||||||||||||||
| Noninterest income | 11,706 | 16,365 | 16,168 | 11,744 | 10,860 | |||||||||||||||
| Noninterest expense | 26,946 | 24,823 | 24,975 | 18,872 | 17,122 | |||||||||||||||
| Income before income taxes | 9,260 | 27,396 | 28,535 | 29,470 | 28,185 | |||||||||||||||
| Income taxes | 1,624 | 8,476 | 9,128 | 9,395 | 9,571 | |||||||||||||||
| Net income | $ | 7,636 | $ | 18,920 | $ | 19,407 | $ | 20,075 | $ | 18,614 | ||||||||||
| Dividends and Per Share Data | ||||||||||||||||||||
| Cash dividends | $ | 11,138 | $ | 11,224 | $ | 10,956 | $ | 10,689 | $ | 10,484 | ||||||||||
| Cash dividends per share | 0.640 | 0.640 | 0.625 | 0.610 | 0.595 | |||||||||||||||
| Basic earnings per common share | 0.44 | 1.08 | 1.11 | 1.14 | 1.06 | |||||||||||||||
| Diluted earnings per common share | 0.44 | 1.08 | 1.11 | 1.14 | 1.06 | |||||||||||||||
| Average common shares outstanding | 17,405 | 17,536 | 17,537 | 17,537 | 17,599 | |||||||||||||||
| Year End Balances | ||||||||||||||||||||
| Total assets | $ | 1,553,188 | $ | 1,339,968 | $ | 1,268,536 | $ | 1,244,380 | $ | 1,148,435 | ||||||||||
| Investment securities | 189,608 | 237,378 | 261,578 | 274,719 | 347,052 | |||||||||||||||
| Loans | 1,101,753 | 985,423 | 904,422 | 867,504 | 725,845 | |||||||||||||||
| Allowance for loan losses | (15,441 | ) | (8,935 | ) | (8,494 | ) | (7,615 | ) | (6,527 | ) | ||||||||||
| Deposits | 1,154,787 | 910,925 | 925,334 | 944,893 | 865,932 | |||||||||||||||
| Long-term borrowings | 145,619 | 123,619 | 106,019 | 99,188 | 101,893 | |||||||||||||||
| Stockholders' equity | 150,063 | 121,606 | 113,812 | 104,521 | 97,620 | |||||||||||||||
| Equity to assets ratio | 9.66 | % | 9.08 | % | 8.97 | % | 8.40 | % | 8.50 | % | ||||||||||
| Years Ended December 31 | ||||||||||||||||||||
| (dollars in thousands) | 2008 | 2007 | 2006 | 2005 | 2004 | |||||||||||||||
| Net income | $ | 7,636 | $ | 18,920 | $ | 19,407 | $ | 20,075 | $ | 18,614 | ||||||||||
| Average assets | 1,371,401 | 1,309,119 | 1,298,410 | 1,192,208 | 1,066,511 | |||||||||||||||
| Average stockholders' equity | 118,090 | 116,683 | 107,345 | 100,392 | 94,209 | |||||||||||||||
| Return on assets (net income divided by average assets) | 0.56 | % | 1.45 | % | 1.49 | % | 1.68 | % | 1.75 | % | ||||||||||
| Return on equity (net income divided by average equity) | 6.47 | % | 16.21 | % | 18.08 | % | 20.00 | % | 19.76 | % | ||||||||||
| Efficiency ratio (noninterest expense divided by noninterest income plus tax-equivalent net interest income) | 45.25 | % | 44.23 | % | 43.71 | % | 36.50 | % | 35.99 | % | ||||||||||
| Dividend payout ratio (dividends paid divided by net income) | 145.86 | % | 59.32 | % | 56.45 | % | 53.25 | % | 56.32 | % | ||||||||||
| Equity to assets ratio (average equity divided by average assets) | 8.61 | % | 8.91 | % | 8.27 | % | 8.42 | % | 8.83 | % | ||||||||||
4
MANAGEMENT’S DISCUSSION AND ANALYSIS OF FINANCIAL CONDITION AND RESULTS OF OPERATIONS
INTRODUCTION
The following discussion is provided for the consolidated operations of the Company, which includes its wholly-owned banking subsidiary, West Bank, and its wholly-owned investment advisory subsidiary, WB Capital. The purpose of this discussion is to focus on significant factors affecting the Company’s financial condition and results of operations.
"SAFE HARBOR" STATEMENT UNDER THE PRIVATE SECURITIES LITIGATION REFORM ACT
The information contained in this report may contain forward-looking statements about the Company’s growth and acquisition strategies, new products and services, and future financial performance, including earnings and dividends per share, return on average assets, return on average equity, efficiency ratio, and capital ratio. Certain statements in this report constitute “forward-looking statements” within the meaning of the Private Securities Litigation Reform Act of 1995, including statements preceded by, followed by, or that include the words “believes,” “expects,” “should,” or “anticipates,” or references to estimates or similar expressions. Such forward-looking statements are based upon certain underlying assumptions, risks, and uncertainties. Because of the possibility of change in the underlying assumptions, actual results could differ materially from these forward-looking statements. Risks and uncertainties that may affect future results include: interest rate risk; competitive pressures; pricing pressures on loans and deposits; changes in credit and other risks posed by the Company’s loan and investment portfolios, including declines in commercial or residential real estate values or changes in the allowance for loan losses dictated by new market conditions or regulatory requirements; actions of bank and non-bank competitors; changes in local and national economic conditions; changes in regulatory requirements, including actions of the Securities and Exchange Commission and/or the Federal Reserve Board; changes in the Treasury’s Capital Purchase Program; and customers’ acceptance of the Company’s products and services. The Company undertakes no obligation to revise or update such forward-looking statements to reflect current events or circumstances after the date hereof or to reflect the occurrence of unanticipated events.
CRITICAL ACCOUNTING POLICIES
The “Management’s Discussion and Analysis of Financial Condition and Results of Operations,” and disclosures included within this report, are based on the Company’s audited consolidated financial statements. These statements have been prepared in accordance with accounting principles generally accepted in the United States of America. The financial information contained in these statements is based on the financial effects of transactions and events that have already occurred. However, the preparation of these statements requires management to make certain estimates and judgments that affect the reported amounts of assets, liabilities, revenues, and expenses.
The Company’s significant accounting policies are described in the “Notes to Consolidated Financial Statements.” Based on its consideration of accounting policies that involve the most complex and subjective estimates and judgments, management has identified its most critical accounting policies to be those related to asset impairment judgments, including fair value of available for sale investment securities and recoverability of goodwill, and the allowance for loan losses.
Securities available for sale are reported at fair value, with unrealized gains and losses reported as a separate component of accumulated other comprehensive income, net of deferred income taxes. Declines in fair value of individual securities, below their amortized cost, are evaluated by management to determine whether the decline is temporary or “other than temporary.” Declines in fair value of available for sale securities below their cost that are deemed “other than temporary” are reflected in earnings as impairment losses. In estimating “other-than-temporary” impairment losses, management considers a number of factors, including (1) the length of time and extent to which the fair value has been less than cost, (2) the financial condition and near-term prospects of the issuer, and (3) the intent and ability of the Company to retain its investment in the issuer for a period of time sufficient to allow for any anticipated recovery in fair value.
Goodwill is the excess of the cash paid over the net fair value of assets acquired and liabilities assumed in an acquisition, less the amount of identifiable intangible assets. Goodwill is tested for impairment annually or on an interim basis if events or circumstances indicate a possible inability to realize the carrying amount.
5
The allowance for loan losses is established through a provision for loan losses charged to expense. Loans are charged against the allowance for loan losses when management believes that collectibility of the principal is unlikely. The Company has policies and procedures for evaluating the overall credit quality of its loan portfolio, including timely identification of potential problem loans. On a quarterly basis, management reviews the appropriate level for the allowance for loan losses, incorporating a variety of risk considerations, both quantitative and qualitative. Quantitative factors include the Company’s historical loss experience, delinquency and charge-off trends, collateral values, known information about individual loans, and other factors. Qualitative factors include the general economic environment in the Company’s market areas and the expected trend of those economic conditions. To the extent actual results differ from forecasts and management’s judgment, the allowance for loan losses may be greater or less than future charge-offs.
(dollars in thousands, except per share amounts)
RESULTS OF OPERATIONS – 2008 COMPARED TO 2007
OVERVIEW
Net income for the year ended December 31, 2008, was $7,636, compared to $18,920 for 2007. Basic and diluted earnings per common share were $0.44 in 2008 compared to $1.08 in 2007. The Company’s return on average equity (ROE) was 6.47 percent in 2008, compared to 16.21 percent in 2007. The return on average assets (ROA) was 0.56 percent, compared to 1.45 percent for the prior year.
The reduction in 2008 earnings was primarily the result of a $14,250 increase in provision for loan losses compared to 2007 and recognition of $4,739 of investment security impairment losses on a Lehman Brothers Holdings, Inc. unsecured note, a pooled trust preferred security and an investment in a unit trust comprised of the common stock of several community banks and bank holding companies. Net income was also negatively impacted by the decision at WB Capital to purchase a defaulted Lehman Brothers Holdings, Inc. bond from the WB Capital Liquid Assets Fund, a money market mutual fund, to prevent the fund from dropping below $1.00 per share, which resulted in recognizing a loss of $458.
Offsetting these negative items were a $2,896 increase in net interest income and an increase in noninterest income, exclusive of impairment losses. Noninterest income, exclusive of impairment charges, was slightly higher than last year as increases in debit card usage fees and gain on sale of residential mortgages into the secondary market exceeded a decline in revenue from investment advisory fees.
Noninterest expense for 2008 was $2,123 higher than in 2007. The increase included the impact of higher costs related to carrying higher levels of foreclosed real estate compared to recording gains on the sale of foreclosed real estate in the prior year. Also contributing to the increase in noninterest expense were increases in professional fees and marketing expenses, the re-establishment of the FDIC assessment, and the previously mentioned loss recognized at WB Capital.
The $11,284 decline in net income in 2008 compared to 2007 included a reduction in West Bank net income of $10,201 due to the previously mentioned increase in provision for loan losses, investment securities impairment losses, and higher noninterest expense. Net interest income increased in 2008 compared to 2007 because the cost of funds declined more than the yield on a higher volume of earning assets.
Net income at WB Capital declined to $325 for 2008 compared to $568 for 2007. Revenues were lower than the prior year due to the severe decline in stock values, which reduced assets under management. Operating expenses were 1.7 percent lower than in 2007 despite the support provided to the Liquid Assets Fund described above.
The West Bank provision for loan losses was $16,600 in 2008, compared to $2,350 for 2007. The increase in provision for loan losses included specific provisions of $4,000 against two loans to a customer that had been the victim of a substantial fraud and $5,000 related to a large homebuilder and developer that failed. Net loans charged off totaled $10.1 million in 2008, compared to $1.9 million in 2007. Of the total net charge-offs in 2008, $4.7 million occurred in the second quarter and $4.0 million in the fourth quarter. The higher net charge-offs in these quarters were primarily related to the two customers mentioned previously.
The Company has consistently used the efficiency ratio to measure productivity. This ratio is computed by dividing noninterest expense by the sum of tax-equivalent net interest income plus noninterest income (excluding gains and losses from the sale of securities and impairment losses). For the year ended December 31, 2008, the Company’s efficiency ratio was 45.25 percent, up slightly from the prior year’s ratio of 44.23 percent. The ratio for both years is significantly better than peer group averages, which are generally around 63 percent according to data in the September 2008 Bank Holding Company Performance Report, a report prepared by the Federal Reserve Board’s Division of Banking Supervision and Regulation.
6
On December 31, 2008, the Company received $36 million from the U.S. Department of the Treasury (the “Treasury”) in exchange for issuing 36,000 shares of cumulative senior preferred stock and a warrant to purchase 474,100 shares of common stock under the Capital Purchase Program (“CPP”). The senior preferred shares qualify as Tier 1 capital for regulatory purposes and rank senior to common stock and bear a cumulative dividend rate of five percent per annum for the first five years they are outstanding and a rate of nine percent per annum thereafter. The senior preferred shares are non-voting, other than having voting rights on matters that could adversely affect the shares and having the right to elect directors under certain circumstances. The Board of Directors and management believe it was prudent to participate in the CPP because (i) the cost of capital under this program may be significantly lower than the cost of capital otherwise available to the Company at this time, and (ii) despite being well-capitalized, additional capital under this program provides the Company and West Bank additional flexibility to meet future capital needs that may arise in the current uncertain economic environment. The proceeds were initially used to pay off $2 million of borrowings at the Company, and the remaining $34 million was transferred to West Bank’s capital, where it will be used to support West Bank’s operations and for prudent lending transactions.
Net Interest Income
Net interest income increased $2,896, or 7.6 percent, to $41,100 for 2008, primarily due to the $109 million increase in average loan volume. Also, yields on earning assets declined at a slower pace than the rate paid on deposits and borrowings. The average yield on earning assets declined 105 basis points, while the average rate on interest-bearing liabilities declined 142 basis points. The net interest spread, which is the difference between the yield earned on assets and the rate paid on liabilities, increased to 2.87 percent from 2.50 percent a year earlier. Net interest margin, which is tax-equivalent net interest income as a percent of average earning assets, was 3.38 percent in 2008, up from 3.28 percent in 2007.
For additional details on changes in interest rates and yields and volume variances, see the section of this report titled, “Distribution of Assets, Liabilities and Stockholders’ Equity; Interest Rates; and Interest Differential.”
Loan Growth/Loan Quality
At December 31, 2008, total loans increased approximately $117 million to $1.1 billion from $984 million a year earlier. Most of the growth came in commercial and commercial real estate loans. Non-performing loans at December 31, 2008, totaled $28,835 or 2.62 percent of total loans. At December 31, 2007, non-performing loans totaled $5,877 or 0.60 percent of total loans. Non-performing loans include loans on non-accrual status, loans that have been renegotiated to below market interest rates or terms, and loans past due 90 days or more. For more discussion on loan quality, see the “Summary of the Allowance for Loan Losses” section of this report.
The allowance for loan losses, which totaled $15,441, represented 1.40 percent of total loans and 53.55 percent of non-performing loans at the end of 2008, compared to 0.91 percent and 152.03 percent for 2007. The provision for loan losses totaled $16,600 for 2008, up from $2,350 for 2007. The Company’s net charge-offs as a percent of average loans were 0.96 percent for 2008 compared to 0.20 percent for 2007. The amount of loans charged off in 2008 totaled $10,370, compared to $2,142 in 2007. Recoveries in 2008 from loans previously charged off were $276, up slightly from $233 in the prior year.
The allowance for loan losses represents a reserve available to absorb probable loan losses within the loan portfolio as of December 31, 2008. The allowance is based on management’s judgment after considering various factors such as the current and anticipated economic environment, historical loan loss experience, and evaluations of individual loans.
Management believed the allowance for loan losses at December 31, 2008, was sufficient to absorb probable loan losses within the portfolio.
7
Noninterest Income
The following table shows the variance from the prior year in the noninterest income categories shown in the Consolidated Statements of Income. In addition, accounts within the “Other income” category that represent significant variances are shown.
| Years ended December 31 | ||||||||||||||||
| 2008 | 2007 | Change | Change % | |||||||||||||
| Noninterest income: | ||||||||||||||||
| Service charges on deposit accounts | $ | 4,832 | $ | 4,794 | �� | $ | 38 | 0.79 | % | |||||||
| Trust services | 789 | 758 | 31 | 4.09 | % | |||||||||||
| Investment advisory fees | 7,401 | 7,920 | (519 | ) | -6.55 | % | ||||||||||
| Increase in cash value of bank-owned life insurance | 936 | 890 | 46 | 5.17 | % | |||||||||||
| Securities gains (losses), net | 73 | 5 | 68 | 1,360.00 | % | |||||||||||
| Investment securities impairment losses | (4,739 | ) | - | (4,739 | ) | N/A | ||||||||||
| Other income: | ||||||||||||||||
| Debit card usage fees | 880 | 659 | 221 | 33.54 | % | |||||||||||
| VISA/MasterCard income | 186 | 199 | (13 | ) | -6.53 | % | ||||||||||
| Gain and fees on sale of residential mortgages | 544 | 161 | 383 | 237.89 | % | |||||||||||
| Letter of credit fees | 150 | 196 | (46 | ) | -23.47 | % | ||||||||||
| All other income | 654 | 783 | (129 | ) | -16.48 | % | ||||||||||
| Total other income | 2,414 | 1,998 | 416 | 20.82 | % | |||||||||||
| Total noninterest income | $ | 11,706 | $ | 16,365 | $ | (4,659 | ) | -28.47 | % | |||||||
Service charges on deposit accounts increased slightly compared to the prior year. An increase in commercial fee income was offset by a decline in return check charges. Lower market interest rates resulted in a lower earnings credit on commercial checking accounts, which translated to a $227 increase in commercial service charge revenue. Return check charges declined $122 from 2007 as customers presented fewer checks against non-sufficient funds.
Trust fees have increased compared to prior year due to new business and additional assets added to existing accounts.
Investment advisory fees are fees earned by WB Capital. The reduction in 2008 compared to 2007 resulted from the combination of a $345, or 20 percent, decline in fees from the WB Capital Mutual Funds due to lower asset levels and a $375, or 8 percent, decline in advisory fees from separately managed accounts due to the severe decline in stock values and business lost due to the uncertain markets. Partially offsetting this decline was a $213, or 18 percent, increase in public funds revenue due to increased asset levels.
In September 2008, West Bank recorded a $1,725 impairment charge for an investment in an unsecured note of Lehman Brothers Holdings, Inc. The bond was written down an additional $75 in the fourth quarter of 2008. Net income for the fourth quarter was reduced by a $2,622 impairment charge for a pooled trust preferred security, as it was determined estimated cash flows to be received over the life of the security would not be sufficient to cover all of the principal and interest. The reduction to net income associated with this impairment was $1.7 million after tax. An investment owned by the Company in a unit trust comprised of the common stock of several community banks and bank holding companies was also deemed impaired. The impairment charge for this investment was $317. Since this loss was a non-deductible capital loss for the Company, there was no associated tax benefit. The most significant risk of a future impairment charge relates to investments West Bank has in trust preferred securities of other banks. At December 31, 2008, West Bank had seven trust preferred security issues with a cost of $5.8 million that had a fair market value of $2.9 million. These securities are being closely monitored on an ongoing basis.
Debit card usage fees increased because West Bank began offering a new product in April 2008 that encourages the use of electronic payments. This source of revenue is expected to continue to improve due to continued growth of the new product and the convenience factor of electronic payments. VISA/MasterCard income declined as a result of lower transaction volumes compared to 2007.
The volume of originations of residential mortgages sold into the secondary market increased over 118 percent compared to 2007, thus increasing the income from this source. The growth of this line of business is expected to continue as historically low interest rates cause consumers to refinance existing mortgages. Despite the downturn in the housing market, consumers are selectively purchasing real estate while locking in relatively low, long-term rates.
8
The all other income category declined in 2008 due to lower income related to West Bank’s official checks and letter of credit fees. All other income for 2007 included gains on disposals of fixed assets.
Noninterest Expense
The following table shows the variance from the prior year in the noninterest expense categories shown in the Consolidated Statements of Income. In addition, accounts within the “Other expenses” category that represent significant variances are shown.
| Years ended December 31 | ||||||||||||||||
| 2008 | 2007 | Change | Change % | |||||||||||||
| Noninterest expense: | ||||||||||||||||
| Salaries and employee benefits | $ | 13,362 | $ | 13,560 | $ | (198 | ) | -1.46 | % | |||||||
| Occupancy | 3,596 | 3,579 | 17 | 0.47 | % | |||||||||||
| Data processing | 2,287 | 2,225 | 62 | 2.79 | % | |||||||||||
| Other expenses: | ||||||||||||||||
| Insurance | 283 | 266 | 17 | 6.39 | % | |||||||||||
| Marketing | 732 | 457 | 275 | 60.18 | % | |||||||||||
| Business development | 430 | 348 | 82 | 23.56 | % | |||||||||||
| Professional fees | 1,011 | 703 | 308 | 43.81 | % | |||||||||||
| Consulting fees | 291 | 228 | 63 | 27.63 | % | |||||||||||
| Director fees | 278 | 270 | 8 | 2.96 | % | |||||||||||
| FDIC expense | 606 | 109 | 497 | 455.96 | % | |||||||||||
| Other real estate owned expense | 166 | (259 | ) | 425 | -164.09 | % | ||||||||||
| Training | 204 | 104 | 100 | 96.15 | % | |||||||||||
| Intangible amortization | 727 | 856 | (129 | ) | -15.07 | % | ||||||||||
| Miscellaneous losses | 513 | 66 | 447 | 677.27 | % | |||||||||||
| All other expenses | 2,460 | 2,311 | 149 | 6.45 | % | |||||||||||
| Total other expenses | 7,701 | 5,459 | 2,242 | 41.07 | % | |||||||||||
| Total noninterest expense | $ | 26,946 | $ | 24,823 | $ | 2,123 | 8.55 | % | ||||||||
The net decrease in salaries and employee benefits resulted from a reduction of $545 in bonuses and $161 in profit sharing expense because of the decline in 2008 net income. Offsetting these reductions were higher salaries due to annual merit increases and the addition of five employees at West Bank in 2008.
Occupancy expenses remained steady in 2008. West Bank discontinued renting space at a mall for three ATMs in the first quarter of 2008. Additionally, savings were realized by relocating the Cedar Rapids office of WB Capital to the Coralville bank office during the second quarter of 2007. The Company continues to market excess space available in the facility in which WB Capital is located in West Des Moines. A portion of the space has been leased and rental payments began in April 2008. West Bank has entered into a lease for a new office in Waukee, with an expected opening in the first quarter of 2009. The annual rental cost for this location is approximately $216.
Data processing expense has increased because of costs related to higher volumes of PIN and signature-based debit/ATM card transactions and higher volumes of transactions and accounts on West Bank’s various deposit and loan applications. Data processing expense is expected to decline in 2009 due to pricing concessions received for agreeing to a five-year contract extension with West Bank’s data processing provider.
Marketing and business development expenses were up as a result of a retail sales campaign for a new product offering and more aggressive sales efforts overall.
Professional fees increased in 2008 due to higher legal fees, primarily associated with loan collection efforts, and higher external audit and tax compliance-related fees. Consulting fees increased due to the implementation of a customer relationship management system during the second half of 2008.
9
FDIC expense increased as a result of the re-establishment of the FDIC assessment. West Bank’s share of a one-time assessment credit was almost fully utilized by March 31, 2008. The rate assessed to each bank is based upon risk factors including past due and non-performing loans, net loan charge-offs, and net income before taxes. As of December 31, 2008, West Bank was being assessed at the current maximum rate of seven basis points. In December 2008, the FDIC approved a premium increase for 2009 of an additional seven basis points for the first quarter of 2009 and a series of additional risk-based adjustments that will be implemented in the second quarter of 2009. Estimated 2009 expense will more than double compared to the current year, as the first quarter of 2008 included the remainder of the one-time assessment credit. This estimate includes the Company’s decision to participate in the FDIC’s Temporary Liquidity Guarantee Program (“TLGP”) which is in effect from mid-November 2008 through December 2009. The program removes the cap on the amount of deposit insurance coverage for non-interest bearing and low-rate NOW accounts. The fee associated with the TLGP is ten basis points on qualifying deposits over $250. The expected cost for 2009 is approximately $60.
Other real estate owned expense increased due to a write-down taken on one piece of property in the second quarter of 2008 and increased operating costs for a higher amount of properties held during 2008. The 2007 expense included gains on the sale of several other real estate properties, including a gain of $272 from the sale of farmland in eastern Iowa.
Training expense has increased as the result of an extensive sales training program for consumer branch managers, commercial bankers, and the investment advisory sales force.
Miscellaneous losses for 2008 included a loss that occurred at WB Capital in the third quarter. The WB Capital Liquid Assets Fund held a short-term Lehman Brothers Holdings, Inc. bond in its portfolio. After Lehman Brothers Holdings, Inc. filed bankruptcy, a decision was made to purchase the defaulted bond from the mutual fund to prevent the fund value from dropping below $1.00 per share, with a resulting loss of $458.
Income Taxes
The Company records a provision for income taxes currently payable, along with a provision for those taxes payable in the future. Such deferred taxes arise from differences in the timing of certain items for financial statement reporting compared to income tax reporting. The effective income tax rate differs from the federal statutory income tax rate primarily due to tax-exempt interest income, the tax-exempt increase in cash value of bank-owned life insurance, disallowed interest expense, tax-deductible dividends paid into the employee savings and stock ownership plan, and state income taxes. In 2008 and 2007, the effective tax rate was also impacted by West Bank’s 2007 investment in a qualified community development entity, which generated a federal new market tax credit. The credit, which totals $2,730, is being recognized over a seven-year period. The effective rate of income tax expense as a percent of income before income taxes was 17.5 percent for 2008, compared to 30.9 percent for 2007. The rate declined significantly as a result of the relatively high proportion of tax-exempt income compared to lower net income before taxes in 2008. The federal income tax expense was approximately $808 and $7,378 for 2008 and 2007, respectively, while state income tax expense was approximately $816 and $1,098, respectively. State income tax expense is higher than federal tax expense in 2008 due to establishing a deferred tax valuation allowance against a state net operating loss of the Company. The Company has recorded a valuation allowance against the tax effect of the state net operating loss and federal and state capital loss carryforwards as management believes it is more likely than not that such carryforwards will expire without being utilized.
RESULTS OF OPERATIONS – 2007 COMPARED TO 2006
OVERVIEW
Net income for the year ended December 31, 2007, was $18,920, compared to $19,407 for 2006. Earnings per share were $1.08 in 2007 compared to $1.11 in 2006. Net income declined primarily due to lower net interest income and a higher provision for loan losses.
The Company’s ROE was 16.21 percent in 2007, compared to 18.08 percent in 2006. The ROA was 1.45 percent, compared to 1.49 percent for the prior year.
The $487 decline in net income in 2007 compared to 2006 included a reduction in West Bank net income by $511, while net income from WB Capital was $303 higher. Expenses at the holding company accounted for the remaining decline in net income. West Bank’s net income was lower due to lower net interest income and a higher provision for loan losses. Net interest income declined in 2007 compared to 2006 because the cost of funds increased more than the yield on earning assets. Net income at WB Capital increased because of cost savings realized after WB Capital and Investors Management Group merged in late 2006.
10
The provision for loan losses was $2,350 in 2007, compared to $1,725 for 2006. Net loans charged off totaled $1,909 in 2007, compared to $846 in 2006. Of the total net charge-offs in 2007, $1.2 million occurred in the fourth quarter. The higher net charge-offs in the fourth quarter were primarily related to one customer. The customer, who was a real estate developer, informed West Bank it was ceasing operations. The customer’s operating line of credit with an outstanding balance of approximately $0.8 million was charged off.
For the year ended December 31, 2007, the Company’s efficiency ratio was 44.23 percent, up slightly from the prior year’s ratio of 43.71 percent.
Net Interest Income
Net interest income declined $863, or 2.2 percent, to $38,204 for 2007 as an increase in loan volume was more than offset by increases in deposit and borrowing rates. The average yield on earning assets increased 14 basis points, while the average rate on interest-bearing liabilities increased 30 basis points. The net interest spread declined to 2.50 percent from 2.66 percent a year earlier. Net interest margin was 3.28 percent in 2007, down from 3.38 percent in 2006. During most of 2007, the yield curve was flat or inverted, which means that long-term rates were similar to or lower than short-term rates.
Loan Growth/Loan Quality
At December 31, 2007, total loans increased approximately $80 million to $984 million from $904 million a year earlier. Most of the growth came in commercial and commercial real estate loans. Non-performing loans at December 31, 2007, totaled $5,877 or 0.60 percent of total loans. At December 31, 2006, non-performing loans totaled $650 or 0.07 percent of total loans.
The allowance for loan losses, which totaled $8,935, represented 152.0 percent of non-accrual loans and loans past due more than 90 days at the end of 2007, compared to 1,307 percent for 2006. The provision for loan losses totaled $2,350 for 2007, up from $1,725 for 2006. The Company’s net charge-offs as a percent of average loans were 0.20 percent for 2007 compared to 0.09 percent for 2006. The amount of loans charged off in 2007 totaled $2,142 compared to $1,140 in 2006. Recoveries in 2007 from loans previously charged off were $233, down from $294 in the prior year.
Management believed the allowance for loan losses at December 31, 2007, was sufficient to absorb probable loan losses within the portfolio.
Noninterest Income
The following table shows the variance from the prior year in the noninterest income categories shown in the Consolidated Statements of Income. In addition, accounts within the “Other income” category that represent significant variances are shown.
| Years ended December 31 | ||||||||||||||||
| 2007 | 2006 | Change | Change % | |||||||||||||
| Noninterest income: | ||||||||||||||||
| Service charges on deposit accounts | $ | 4,794 | $ | 4,821 | $ | (27 | ) | -0.56 | % | |||||||
| Trust services | 758 | 767 | (9 | ) | -1.17 | % | ||||||||||
| Investment advisory fees | 7,920 | 8,040 | (120 | ) | -1.49 | % | ||||||||||
| Increase in cash value of bank-owned life insurance | 890 | 857 | 33 | 3.85 | % | |||||||||||
| Securities gains (losses), net | 5 | (171 | ) | 176 | -102.92 | % | ||||||||||
| Other income: | ||||||||||||||||
| Debit card usage fees | 659 | 534 | 125 | 23.41 | % | |||||||||||
| VISA/MasterCard income | 199 | 166 | 33 | 19.88 | % | |||||||||||
| Check printing fees | 131 | 150 | (19 | ) | -12.67 | % | ||||||||||
| Gain and fees on sale of residential mortgages | 161 | 81 | 80 | 98.77 | % | |||||||||||
| Other loan fees | 49 | 69 | (20 | ) | -28.99 | % | ||||||||||
| Gain on sale of fixed assets | 15 | 112 | (97 | ) | N/A | |||||||||||
| All other income | 784 | 742 | 42 | 5.66 | % | |||||||||||
| Total other income | 1,998 | 1,854 | 144 | 7.77 | % | |||||||||||
| Total noninterest income | $ | 16,365 | $ | 16,168 | $ | 197 | 1.22 | % | ||||||||
11
Service charges on deposit accounts declined slightly because of a lower amount of fees collected from the retail sector. Return check charges, while increasing overall for 2007 compared to 2006, declined in the last half of 2007 as some customers more closely monitored their account balances to avoid fees.
The decline in investment advisory fees during 2007 compared to 2006 was primarily due to lower fees from the WB Capital Mutual Funds as a result of lower asset levels in the Funds.
The Company recognized losses from the sale of investment securities in 2006 as lower yielding investments were sold, with the proceeds being reinvested at higher yields.
Debit card usage fees continued to increase as a result of higher usage of this convenient payment method. VISA/MasterCard income increased as a result of the fees earned on an additional volume of cards issued, along with a rate increase in July 2006 on lower performing merchants. Check printing fees declined as customers continued to increase utilization of all forms of electronic payments, thus reducing the frequency of ordering checks.
The volume of originations of residential mortgages sold into the secondary market began to increase in 2007 because one experienced staff member was hired in May 2007 to devote all of his time to this line of business. As a result, the average income per residential loan increased approximately 36 basis points in 2007 compared to 2006.
Other loan fees for 2006 included a one-time fee for the origination of a loan on behalf of an insurance company. The gain on sale of fixed assets in 2006 consisted of a gain recognized on the sale of one of West Bank’s branch offices. The office was relocated to a new leased facility in a higher traffic area of the Des Moines metropolitan area. Other income for 2007 included $36 of discounts received on the purchase of Iowa wind energy and enterprise zone tax credits.
Noninterest Expense
The following table shows the variance from the prior year in the noninterest expense categories shown in the Consolidated Statements of Income. In addition, accounts within the “Other expenses” category that represent significant variances are shown.
| Years ended December 31 | ||||||||||||||||
| 2007 | 2006 | Change | Change % | |||||||||||||
| Noninterest expense: | ||||||||||||||||
| Salaries and employee benefits | $ | 13,560 | $ | 13,937 | $ | (377 | ) | -2.71 | % | |||||||
| Occupancy | 3,579 | 3,433 | 146 | 4.25 | % | |||||||||||
| Data processing | 2,225 | 2,217 | 8 | 0.36 | % | |||||||||||
| Other expenses: | ||||||||||||||||
| Insurance | 266 | 253 | 13 | 5.14 | % | |||||||||||
| Marketing | 457 | 554 | (97 | ) | -17.51 | % | ||||||||||
| Business development | 348 | 287 | 61 | 21.25 | % | |||||||||||
| Professional fees | 703 | 672 | 31 | 4.61 | % | |||||||||||
| Consulting fees | 228 | 206 | 22 | 10.68 | % | |||||||||||
| Director fees | 270 | 155 | 115 | 74.19 | % | |||||||||||
| Loss on disposal of fixed assets | 50 | 15 | 35 | 233.33 | % | |||||||||||
| Other real estate owned expense | (259 | ) | (1 | ) | (258 | ) | N/A | |||||||||
| Intangible amortization | 856 | 884 | (28 | ) | -3.17 | % | ||||||||||
| Recruitment fees | 77 | 37 | 40 | 108.11 | % | |||||||||||
| All other expenses | 2,463 | 2,326 | 137 | 5.89 | % | |||||||||||
| Total other expenses | 5,459 | 5,388 | 71 | 1.32 | % | |||||||||||
| Total noninterest expense | $ | 24,823 | $ | 24,975 | $ | (152 | ) | -0.61 | % | |||||||
The decline in salaries and employee benefits resulted from a reduction in full-time equivalent employees due to certain positions that were eliminated and other positions experiencing turnover, and a reduction in certain benefit expenses.
Occupancy expenses were higher in 2007 because of the relocation of one of the Des Moines metropolitan branches to a rented facility during the third quarter of 2006 and the rental of additional space for certain West Bank operational departments. There were savings realized by relocating the Cedar Rapids office of WB Capital to the Coralville bank office during the second quarter of 2007.
12
Insurance expense increased as the Company’s directors’ and officers’ policy renewed in the third quarter of 2007.
Marketing expenses for 2006 included costs related to the previously mentioned relocation of a branch office and several targeted advertising campaigns. Business development costs during the same time period increased due to continued efforts to increase and expand current and new customer relationships.
Professional fees increased in 2007 as fees for external and outsourced internal audit fees continued to increase. Consulting fees grew due to the retention of a firm to advise the Company’s Compensation Committee of the Board of Directors on executive compensation issues. Director fees increased in 2007 compared to 2006 as the result of an increase in quarterly retainer and meeting fees, which had not increased for several years. The loss on disposal of fixed assets in 2007 was primarily related to relocating the Cedar Rapids office of WB Capital. Other real estate owned expense declined as a result of selling several repossessed properties at gains. One sale of farmland in eastern Iowa resulted in a gain of $272. Due to the tight job market, recruitment fees were paid to executive search firms in 2007 related to the hiring of business development staff members.
Income Taxes
In 2007, the effective tax rate was impacted by the previously mentioned federal new market tax credit. The effective rate of income tax expense as a percent of income before income taxes was 30.9 percent for 2007, compared to 32.0 percent for 2006. The federal income tax expense was approximately $7,378 and $7,784 for 2007 and 2006, respectively, while state income tax expense was approximately $1,098 and $1,344, respectively.
13
DISTRIBUTION OF ASSETS, LIABILITIES AND STOCKHOLDERS’ EQUITY; INTEREST RATES; AND INTEREST DIFFERENTIAL
Average Balances and an Analysis of Average Rates Earned and Paid
The following tables show average balances and interest income or interest expense, with the resulting average yield or rate by category of average earning assets or interest-bearing liability for the years indicated. Interest income and the resulting net interest income are shown on a fully taxable basis.
| 2008 | 2007 | 2006 | ||||||||||||||||||||||||||||||||||
Average Balance | Revenue/ Expense | Yield/ Rate | Average Balance | Revenue/ Expense | Yield/ Rate | Average Balance | Revenue/ Expense | Yield/ Rate | ||||||||||||||||||||||||||||
Assets | ||||||||||||||||||||||||||||||||||||
| Interest-earning assets: | ||||||||||||||||||||||||||||||||||||
| Loans: (2) (3) | ||||||||||||||||||||||||||||||||||||
| Commercial | $ | 387,426 | $ | 22,174 | 5.72 | % | $ | 352,176 | $ | 27,574 | 7.83 | % | $ | 343,659 | $ | 26,534 | 7.72 | % | ||||||||||||||||||
| Real estate (1) | 653,381 | 40,944 | 6.27 | % | 579,249 | 41,890 | 7.23 | % | 560,673 | 39,971 | 7.13 | % | ||||||||||||||||||||||||
| Consumer and other loans | 13,751 | 867 | 6.30 | % | 14,244 | 1,034 | 7.26 | % | 14,660 | 1,026 | 7.00 | % | ||||||||||||||||||||||||
| Total loans | 1,054,558 | 63,985 | 6.07 | % | 945,669 | 70,498 | 7.45 | % | 918,992 | 67,531 | 7.35 | % | ||||||||||||||||||||||||
| Investment securities: | ||||||||||||||||||||||||||||||||||||
| Taxable | 96,560 | 4,763 | 4.93 | % | 165,683 | 7,758 | 4.68 | % | 172,265 | 7,925 | 4.60 | % | ||||||||||||||||||||||||
| Tax-exempt (1) | 92,646 | 5,392 | 5.82 | % | 86,794 | 4,581 | 5.28 | % | 98,219 | 5,105 | 5.20 | % | ||||||||||||||||||||||||
| Total investment securities | 189,206 | 10,155 | 5.37 | % | 252,477 | 12,339 | 4.89 | % | 270,484 | 13,030 | 4.82 | % | ||||||||||||||||||||||||
| Federal funds sold and other short-term investments | 33,113 | 467 | 1.41 | % | 14,534 | 752 | 5.17 | % | 17,465 | 903 | 5.17 | % | ||||||||||||||||||||||||
| Total interest-earning assets (1) | 1,276,877 | 74,607 | 5.84 | % | 1,212,680 | 83,589 | 6.89 | % | 1,206,941 | 81,464 | 6.75 | % | ||||||||||||||||||||||||
| Noninterest-earning assets: | ||||||||||||||||||||||||||||||||||||
| Cash and due from banks | 29,343 | 29,766 | 28,831 | |||||||||||||||||||||||||||||||||
| Premises and equipment, net | 4,976 | 5,303 | 5,511 | |||||||||||||||||||||||||||||||||
| Other, less allowance for loan losses | 60,205 | 61,370 | 57,127 | |||||||||||||||||||||||||||||||||
| Total noninterest-earning assets | 94,524 | 96,439 | 91,469 | |||||||||||||||||||||||||||||||||
| Total assets | $ | 1,371,401 | $ | 1,309,119 | $ | 1,298,410 | ||||||||||||||||||||||||||||||
Liabilites and Stockholders' Equity | ||||||||||||||||||||||||||||||||||||
| Interest-bearing liabilities: | ||||||||||||||||||||||||||||||||||||
| Deposits: | ||||||||||||||||||||||||||||||||||||
| Savings, interest-bearing demand, and money markets | $ | 325,850 | $ | 5,035 | 1.55 | % | $ | 304,138 | $ | 8,948 | 2.94 | % | $ | 306,254 | $ | 7,912 | 2.58 | % | ||||||||||||||||||
| Time deposits | 447,959 | 16,486 | 3.68 | % | 418,869 | 21,203 | 5.06 | % | 498,455 | 23,557 | 4.73 | % | ||||||||||||||||||||||||
| Total deposits | 773,809 | 21,521 | 2.78 | % | 723,007 | 30,151 | 4.17 | % | 804,709 | 31,469 | 3.91 | % | ||||||||||||||||||||||||
| Other borrowed funds | 285,249 | 9,910 | 3.47 | % | 274,721 | 13,672 | 4.98 | % | 189,967 | 9,200 | 4.84 | % | ||||||||||||||||||||||||
| Total interest-bearing liabilities | 1,059,058 | 31,431 | 2.97 | % | 997,728 | 43,823 | 4.39 | % | 994,676 | 40,669 | 4.09 | % | ||||||||||||||||||||||||
| Noninterest-bearing liabilities: | ||||||||||||||||||||||||||||||||||||
| Demand deposits | 180,614 | 180,965 | 186,894 | |||||||||||||||||||||||||||||||||
| Other liabilities | 13,639 | 13,743 | 9,495 | |||||||||||||||||||||||||||||||||
| Stockholders' equity | 118,090 | 116,683 | 107,345 | |||||||||||||||||||||||||||||||||
| Total liabilities and stockholders' equity | $ | 1,371,401 | $ | 1,309,119 | $ | 1,298,410 | ||||||||||||||||||||||||||||||
| Net interest income/net interest spread (1) | $ | 43,176 | 2.87 | % | $ | 39,766 | 2.50 | % | $ | 40,795 | 2.66 | % | ||||||||||||||||||||||||
| Net interest margin (1) | 3.38 | % | 3.28 | % | 3.38 | % | ||||||||||||||||||||||||||||||
| 1 | Tax-exempt income has been adjusted to a tax-equivalent basis using an incremental rate of 35% and is adjusted to reflect the effect of the nondeductible interest expense associated with owning tax-exempt investments. |
| 2 | Average loan balances include non-accrual loans. Interest income collected on non-accrual loans has been included. |
| 3 | Interest income on loans includes amortization of loan fees and costs, which are not material. |
14
Net Interest Income
The Company’s largest component of net income is net interest income, which is the difference between interest earned on earning assets, consisting primarily of loans and investments, and interest paid on interest-bearing liabilities, consisting of deposits and borrowings. Fluctuations in net interest income can result from the combination of changes in the balances of asset and liability categories and changes in interest rates. Interest rates earned and paid are also affected by general economic conditions, particularly changes in market interest rates, and by competitive factors, government policies, and the action of regulatory authorities. Net interest margin is a measure of the net return on interest-earning assets and is computed by dividing annualized tax-equivalent net interest income by the average of total interest-earning assets for the year. For the years ending December 31, 2008, 2007, and 2006, the Company’s net interest margin was 3.38 percent, 3.28 percent, and 3.38 percent, respectively.
Rate and Volume Analysis
The rate and volume analysis shown below, on a tax-equivalent basis, is used to determine how much of the change in interest income or expense is the result of a change in volume or a change in interest yield or rate. The change in interest that is due to both volume and rate has been allocated to the change due to volume and the change due to rate in proportion to the absolute value of the change in each.
| 2008 Compared to 2007 | 2007 Compared to 2006 | |||||||||||||||||||||||
| Volume | Rate | Total | Volume | Rate | Total | |||||||||||||||||||
| Interest Income | ||||||||||||||||||||||||
| Loans: (1) | ||||||||||||||||||||||||
| Commercial | $ | 2,559 | $ | (7,959 | ) | $ | (5,400 | ) | $ | 663 | $ | 377 | $ | 1,040 | ||||||||||
| Real estate (2) | 5,011 | (5,957 | ) | (946 | ) | 1,338 | 581 | 1,919 | ||||||||||||||||
| Consumer and other loans | (35 | ) | (132 | ) | (167 | ) | (30 | ) | 38 | 8 | ||||||||||||||
| Total loans (including fees) | 7,535 | (14,048 | ) | (6,513 | ) | 1,971 | 996 | 2,967 | ||||||||||||||||
| Investment securities: | ||||||||||||||||||||||||
| Taxable | (3,390 | ) | 395 | (2,995 | ) | (306 | ) | 139 | (167 | ) | ||||||||||||||
| Tax-exempt (2) | 321 | 490 | 811 | (602 | ) | 78 | (524 | ) | ||||||||||||||||
| Total investment securities | (3,069 | ) | 885 | (2,184 | ) | (908 | ) | 217 | (691 | ) | ||||||||||||||
| Federal funds sold and other short-term investments | 516 | (800 | ) | (284 | ) | (152 | ) | 1 | (151 | ) | ||||||||||||||
| Total interest income (2) | 4,982 | (13,963 | ) | (8,981 | ) | 911 | 1,214 | 2,125 | ||||||||||||||||
| Interest Expense | ||||||||||||||||||||||||
| Deposits: | ||||||||||||||||||||||||
| Savings, interest-bearing demand, and money markets | 599 | (4,512 | ) | (3,913 | ) | (55 | ) | 1,091 | 1,036 | |||||||||||||||
| Time deposits | 1,391 | (6,108 | ) | (4,717 | ) | (3,946 | ) | 1,592 | (2,354 | ) | ||||||||||||||
| Total deposits | 1,990 | (10,620 | ) | (8,630 | ) | (4,001 | ) | 2,683 | (1,318 | ) | ||||||||||||||
| Other borrowed funds | 506 | (4,268 | ) | (3,762 | ) | 4,211 | 261 | 4,472 | ||||||||||||||||
| Total interest expense | 2,496 | (14,888 | ) | (12,392 | ) | 210 | 2,944 | 3,154 | ||||||||||||||||
| Net interest income (2) | $ | 2,486 | $ | 925 | $ | 3,411 | $ | 701 | $ | (1,730 | ) | $ | (1,029 | ) | ||||||||||
| 1 | Balances of non-accrual loans have been included for computational purposes. |
| 2 | Tax-exempt income has been converted to a tax-equivalent basis using a federal income tax rate of 35% and is adjusted for the effect of the nondeductible interest expense associated with owning tax-exempt investments. |
15
Tax-equivalent interest income and fees on loans declined $6,513 for the year ended December 31, 2008, compared to 2007, as the combination of lower rates, reversals of previously accrued interest on loans charged off, and a higher volume of non-accrual loans exceeded the impact of the $108.9 million increase in the average volume of outstanding loans. The average yield on loans declined to 6.07 percent for 2008, compared to 7.45 percent for 2007. The yield on the Company’s loan portfolio is affected by the mix of the portfolio, the effects of competition, the interest rate environment, the amount of non-accrual loans, and reversals of previously accrued interest on charged-off loans. The interest rate environment can influence the volume of new loan originations and the mix of variable rate versus fixed rate loans. Loan pricing in the Company’s market areas remains very competitive.
The average balance of investment securities in 2008 was $63.3 million lower than 2007, while the yield increased 48 basis points. Investment securities totaling approximately $117 million were sold, called, or matured in 2008 and approximately $77 million of investment securities were purchased during the same period.
The average rate paid on deposits for the year ended December 31, 2008, declined to 2.78 percent from 4.17 percent for the year ended December 31, 2007. This decline is primarily the result of a significant decline in market interest rates on interest-bearing checking, money market savings, and certificates of deposit. The average balance of deposits increased approximately $50.8 million for the year ended December 31, 2008, with most of the growth occurring in the fourth quarter. Deposits grew as customers sought the safety of FDIC insured accounts. A considerable amount of the growth was in brokered time deposits as more customers are participating in the Certificate of Deposit Account Registry Service (CDARS) program to ensure the safety of their deposits. CDARS is a program that coordinates a network of banks to spread deposits exceeding the FDIC insurance coverage limits out to numerous institutions in order to provide insurance coverage for all participating deposits. CDARS also allows participating financial institutions to bid on excess deposits from other financial institutions participating in the CDARS network. West Bank obtains deposits in this manner when it is considered prudent to do so.
The average rate paid on other borrowings declined by 151 basis points compared to the year ended December 31, 2007. The average balance of borrowings for 2008 was $10.5 million higher than in 2007. The average rate paid on overnight borrowings declined 262 basis points, while the average balance declined $20.0 million. Average long-term borrowings increased $30.5 million, while the rates paid on borrowings declined 65 basis points compared to 2007. There were no changes in balances or rates of the outstanding subordinated notes.
The high level of competition in the local markets and the December 2008 drop in the targeted federal funds rate by the Federal Reserve to a range of zero to 0.25 percent are expected to continue to put downward pressure on the net interest margin of the Company.
INVESTMENT PORTFOLIO
The following table sets forth the composition of the Company’s securities available for sale for the three years indicated.
| As of December 31 | ||||||||||||
| 2008 | 2007 | 2006 | ||||||||||
| U.S. Treasury and government agencies and corporations | $ | 62,284 | $ | 120,829 | $ | 137,620 | ||||||
| States of the United States and political subdivisions | 107,175 | 89,566 | 97,162 | |||||||||
| Corporate notes and other investments | 11,975 | 21,032 | 21,949 | |||||||||
| Total | $ | 181,434 | $ | 231,427 | $ | 256,731 | ||||||
16
The investments presented in the following table are at carrying value and reported by contractual maturity as of the date indicated below. Expected maturities may differ from contractual maturities because issuers may have the right to call or prepay obligations with or without prepayment penalties.
December 31, 2008
Within one year | After one year but within five years | After five years but within ten years | After ten years | Total | ||||||||||||||||
| U.S. Treasury and government agencies and corporations | $ | - | $ | 35,990 | $ | 26,294 | $ | - | $ | 62,284 | ||||||||||
| States of the United States and political subdivisions | 2,134 | 14,064 | 28,046 | 62,931 | 107,175 | |||||||||||||||
| Corporate notes and other investments | 1,562 | 2,186 | 2,458 | 5,769 | 11,975 | |||||||||||||||
| Total | $ | 3,696 | $ | 52,240 | $ | 56,798 | $ | 68,700 | $ | 181,434 | ||||||||||
| Weighted average yield: | ||||||||||||||||||||
| U.S. Treasury and government agencies and corporations | - | 4.29 | % | 4.79 | % | - | ||||||||||||||
| States of the United States and political subdivisions (1) | 5.17 | % | 5.67 | % | 6.32 | % | 6.12 | % | ||||||||||||
| Corporate notes and other investments | 6.10 | % | 4.35 | % | 4.14 | % | 4.92 | % | ||||||||||||
| Total | 5.62 | % | 4.67 | % | 5.46 | % | 5.98 | % | ||||||||||||
| 1 | Yields on tax-exempt obligations have been computed on a tax-equivalent basis using an incremental tax rate of 35% and are adjusted to reflect the effect of the nondeductible interest expense associated with owning tax-exempt investments. |
The tables above include the three previously mentioned other than temporarily impaired securities at their adjusted carrying value and at a zero yield. The accrual of interest on an investment security is discontinued when a security is deemed other-than-temporarily impaired.
The world-wide financial and credit markets are experiencing considerable stress, due to the sub-prime turmoil and related negative developments. Despite substantial government intervention, the markets remain highly volatile. Investors seem to be hesitant to invest in any credit product except Treasuries and agencies until more stability returns to the market, thus contributing to pricing fluctuations. In many cases, bond prices may be the result of distressed selling rather than normal market transactions. Management believes some price fluctuations have more to do with the environment surrounding the credit markets than the inability to receive full principal payments.
On a quarterly basis, the investment securities portfolio is reviewed for other-than-temporary impairment. As of December 31, 2008, existing unrealized losses of $9.4 million are considered to be temporary in nature due to market interest rate fluctuations and illiquid markets, not estimated cash flows, and the Company has the ability and the intent to hold securities with unrealized losses for a period of time sufficient to allow for a recovery, which may be at maturity. Therefore, other than the three securities discussed earlier on which impairment losses were recognized, no other-than-temporary impairment adjustment has been recorded as of December 31, 2008.
At December 31, 2008, the most significant risk of a future impairment charge relates to West Bank’s investment in trust preferred securities of other banks which are included in corporate notes and other investments in the tables above. As of year end, seven trust preferred securities with an original cost of $5.8 million were valued at $2.9 million. In accordance with SFAS No. 115, the decline in fair market value has been charged against equity on an after income tax basis. Management has concluded these securities are not other-than-temporarily impaired. Any potential future loss that would be considered other-than-temporary impairment would negatively impact net income and regulatory capital; however, as previously noted, the fair market value adjustment at December 31, 2008, has already been recorded against equity.
Investments in States of the United States and political subdivisions represent purchases of municipal bonds issued by municipalities located primarily in the State of Iowa.
Investments in corporate notes and other investments include corporate debt obligations of companies located and doing business throughout the United States. The debt obligations were all within the credit ratings acceptable under West Bank’s investment policy.
As of December 31, 2008, the Company did not have securities from a single issuer, except for the United States government or its agencies, which exceeded 10 percent of consolidated stockholders’ equity.
17
LOAN PORTFOLIO
Types of Loans
The following table sets forth the composition of the Company’s loan portfolio as of the dates indicated.
| As of December 31 | ||||||||||||||||||||
| 2008 | 2007 | 2006 | 2005 | 2004 | ||||||||||||||||
| Commercial | $ | 391,926 | $ | 364,994 | $ | 327,985 | $ | 311,086 | $ | 260,706 | ||||||||||
| Real Estate: | ||||||||||||||||||||
| Construction, land and land development | 152,704 | 153,184 | 143,928 | 134,581 | 90,115 | |||||||||||||||
| 1-4 family residential | 103,134 | 91,714 | 88,978 | 86,485 | 79,456 | |||||||||||||||
| Commercial | 441,444 | 360,255 | 328,514 | 321,561 | 281,956 | |||||||||||||||
| Consumer and other loans | 11,884 | 13,790 | 15,752 | 14,957 | 14,545 | |||||||||||||||
| Total loans | 1,101,092 | 983,937 | 905,157 | 868,670 | 726,778 | |||||||||||||||
| Deferred loan fees, net | 357 | 372 | 871 | 1,166 | 1,057 | |||||||||||||||
| Total loans, net of deferred fees | $ | 1,100,735 | $ | 983,565 | $ | 904,286 | $ | 867,504 | $ | 725,721 | ||||||||||
The Company’s loan portfolio primarily consists of commercial, commercial real estate, real estate construction, land and land development, residential real estate, and consumer loans. As of December 31, 2008, gross loans totaled approximately $1.1 billion, which equals approximately 95.4 percent of total deposits and 70.9 percent of total assets. As of December 31, 2008, the vast majority of all loans were originated directly by West Bank to borrowers within West Bank’s principal market areas. There were no non-U.S. loans outstanding during the years presented.
Commercial loans consist primarily of loans to businesses for various purposes, including revolving lines to finance current operations, inventory and accounts receivable, and capital expenditure loans to finance equipment and other fixed assets. These loans generally have short maturities, have either adjustable or fixed rates, and are either unsecured or secured by inventory, accounts receivable, and/or equipment.
Real estate loans include various types of loans for which West Bank holds real property as collateral, and consist of loans on commercial properties and single and multi-family residences. Real estate loans are typically structured to balloon in 5 years based upon having a maximum amortization period of 30 years. The majority of construction loan volume is to contractors and developers to construct commercial buildings or develop residential real estate, and generally have maturities of up to 24 months. West Bank originates residential real estate loans for its portfolio and for sale in the secondary market for a fee.
Consumer loans include loans extended to individuals for household, family, and other personal expenditures not secured by real estate. The majority of West Bank’s consumer lending is for vehicles, consolidation of personal debts, and household improvements.
The interest rates charged on loans vary with the degree of risk, the amount of the loan, and the maturity of the loan. Competitive pressures, market interest rates, the availability of funds, and government regulation further influence the rate charged on a loan.
West Bank follows a loan policy that has been approved by West Bank’s Board of Directors and is administered by West Bank’s management. The loan policy is reviewed annually and updated as considered necessary. This policy establishes lending limits, review criteria, and other guidelines such as loan administration and allowance for loan losses. Loans are approved by West Bank’s Board of Directors and/or designated officers in accordance with respective guidelines and underwriting policies of West Bank. Loans to any one borrower are limited by applicable state banking laws. Loan officer credit limits generally vary according to the individual loan officer’s experience and expertise.
18
Maturities of Loans
The contractual maturities of the Company’s loan portfolio are as shown in the following table. Actual maturities may differ from contractual maturities because individual borrowers may have the right to prepay loans with or without prepayment penalties.
Loans as of December 31, 2008
Within one year | After one but within five years | After five years | Total | |||||||||||||
| Commercial | $ | 216,828 | $ | 164,176 | $ | 10,922 | $ | 391,926 | ||||||||
| Real Estate: | ||||||||||||||||
| Construction, land and land development | 110,031 | 35,380 | 7,293 | 152,704 | ||||||||||||
| 1-4 family residential | 30,461 | 58,717 | 13,956 | 103,134 | ||||||||||||
| Commercial | 60,550 | 263,059 | 117,835 | 441,444 | ||||||||||||
| Consumer and other loans | 5,909 | 5,915 | 60 | 11,884 | ||||||||||||
| Total Loans | $ | 423,779 | $ | 527,247 | $ | 150,066 | $ | 1,101,092 | ||||||||
After one but within five years | After five years | |||||||
| Loan maturities after one year with: | ||||||||
| Fixed rates | $ | 467,197 | $ | 114,085 | ||||
| Variable rates | 60,050 | 35,981 | ||||||
| $ | 527,247 | $ | 150,066 | |||||
Risk Elements
The following table sets forth information concerning the Company’s non-performing assets as of the dates indicated.
| Years Ended December 31 | ||||||||||||||||||||
| 2008 | 2007 | 2006 | 2005 | 2004 | ||||||||||||||||
| Non-accrual loans | $ | 21,367 | $ | 5,469 | $ | 495 | $ | 4,145 | $ | 785 | ||||||||||
| Loans past due 90 days and still accruing interest | 92 | 408 | 155 | 767 | 75 | |||||||||||||||
| Restructured loans | 7,376 | - | - | - | - | |||||||||||||||
| Total non-performing loans | 28,835 | 5,877 | 650 | 4,912 | 860 | |||||||||||||||
| Other real estate owned | 4,352 | 155 | 2,002 | 497 | 175 | |||||||||||||||
| Non-accrual investment securities | 2,575 | - | - | - | - | |||||||||||||||
| Total non-performing assets | $ | 35,762 | $ | 6,032 | $ | 2,652 | $ | 5,409 | $ | 1,035 | ||||||||||
| Non-performing loans to total loans | 2.62 | % | 0.60 | % | 0.07 | % | 0.57 | % | 0.12 | % | ||||||||||
| Non-performing assets to total assets | 2.30 | % | 0.45 | % | 0.21 | % | 0.43 | % | 0.09 | % | ||||||||||
The accrual of interest on past due and other impaired loans is generally discontinued when loan payments are past due 90 days or when, in the opinion of management, the borrower may be unable to make payments as they become due. Interest income is subsequently recognized only to the extent cash payments are received. In certain cases, interest may continue to accrue on loans past due more than 90 days when the value of the collateral is sufficient to cover both the principal amount of the loan and accrued interest. Interest income on restructured loans is recognized pursuant to the terms of the new loan agreement. Interest income on other impaired loans is monitored and based upon the terms of the underlying loan agreement. However, the recorded net investment in impaired loans, including accrued interest, is limited to the present value of the expected cash flows of the impaired loan or the observable fair market value of the loan’s collateral.
19
Outstanding loans of approximately $36.5 million were placed on non-accrual status during 2008, with total non-accrual loans equaling $21,367 as of December 31, 2008. The average balance of non-accrual loans during 2008 was approximately $13.1 million. Loans to thirteen customers totaling approximately $33.6 million accounted for the majority of the total placed on non-accrual status during 2008. Loans to these customers were primarily for the construction of single-family and multi-family homes, bio-fuel plants, and a customer who was the victim of a substantial fraud and conversion of all of its assets. In the latter case, the guarantor has turned over personal assets to West Bank to satisfy a portion of the corporate loan. Approximately $8.7 million of charge-offs were recorded in 2008 related to non-accrual loans and a portion was transferred to other real estate owned. Loans are placed on non-accrual status when there is doubt as to the collectability of scheduled principal and interest payments. A loan may be removed from non-accrual status when payments have resumed and it is reasonable to expect continued payment performance. For the years ended December 31, 2008, 2007, and 2006, interest income that would have been recorded during the non-accrual period under the original terms of such loans was approximately $795, $70, and $306, respectively.
As of December 31, 2008, West Bank had identified approximately $34.8 million of loans to nine real estate developers and $2.5 million of loans to one ethanol plant who were still performing their loan obligations despite experiencing varying degrees of increasing financial difficulty. It is not now possible to fully predict the degree of problems these loans may develop. However, West Bank considers these loans to be potential problem loans, and it intends to continue special monitoring of all real estate development loans for the foreseeable future.
SUMMARY OF THE ALLOWANCE FOR LOAN LOSSES
The provision for loan losses represents charges made to earnings to maintain an adequate allowance for loan losses. The allowance for loan losses is management’s best estimate of probable losses inherent in the loan portfolio as of the balance sheet date. Factors considered in establishing an appropriate allowance include: an assessment of the financial condition of the borrower; a realistic determination of value and adequacy of underlying collateral; the condition of the local economy and the condition of the specific industry of the borrower; an analysis of the levels and trends of loan categories; and a review of delinquent and classified loans.
The adequacy of the allowance for loan losses is evaluated quarterly by management and reviewed by West Bank’s Board of Directors. This evaluation focuses on factors such as specific loan reviews, changes in the type and volume of the loan portfolio given the current and forecasted economic conditions, and historical loss experience. Any one of the following conditions may result in the review of a specific loan: concern about whether the customer’s cash flow or net worth is sufficient to repay the loan; delinquency status; criticism of the loan in a regulatory examination; the suspension of interest accrual; or other reasons, including whether the loan has other special or unusual characteristics that suggest special monitoring is warranted.
While management uses available information to recognize losses on loans, further reduction in the carrying amounts of loans may be necessary based on changes in circumstances or later acquired information. Furthermore, changes in future economic activity are always uncertain. Identifiable sectors within the general economy are subject to additional volatility, which at any time may have a substantial impact on the loan portfolio. In addition, regulatory agencies, as an integral part of their examination process, periodically review the estimated losses on loans. Such agencies may require the Company to recognize additional losses based on their judgment about information available to them at the time of their examination.
Change in the Allowance for Loan Losses
The Company’s policy is to charge off loans when, in management’s opinion, the loan is deemed uncollectible, although concerted efforts are made to maximize future recoveries. The following table summarizes activity in the Company’s allowance for loan losses for the years indicated, including amounts of loans charged off, amounts of recoveries, additions to the allowance charged to income, and related ratios.
20
Analysis of the Allowance for Loan Losses for the Years Ended December 31 | ||||||||||||||||||||
| 2008 | 2007 | 2006 | 2005 | 2004 | ||||||||||||||||
| Balance at beginning of period | $ | 8,935 | $ | 8,494 | $ | 7,615 | $ | 6,527 | $ | 5,975 | ||||||||||
| Charge-offs: | ||||||||||||||||||||
| Commercial | 8,993 | 1,741 | 776 | 685 | 499 | |||||||||||||||
| Real Estate: | ||||||||||||||||||||
| Construction, land and land development | 952 | - | 295 | 6 | - | |||||||||||||||
| 1-4 family residential | 130 | 356 | 9 | 69 | 230 | |||||||||||||||
| Commercial | 36 | - | - | - | - | |||||||||||||||
| Consumer and other loans | 259 | 45 | 60 | 63 | 86 | |||||||||||||||
| 10,370 | 2,142 | 1,140 | 823 | 815 | ||||||||||||||||
| Recoveries: | ||||||||||||||||||||
| Commercial | 236 | 191 | 270 | 78 | 33 | |||||||||||||||
| Real Estate: | ||||||||||||||||||||
| Construction, land and land development | - | - | 6 | - | - | |||||||||||||||
| 1-4 family residential | 22 | 20 | 1 | 22 | 80 | |||||||||||||||
| Commercial | - | - | - | - | - | |||||||||||||||
| Consumer and other loans | 18 | 22 | 17 | 36 | 54 | |||||||||||||||
| 276 | 233 | 294 | 136 | 167 | ||||||||||||||||
| Net charge-offs | 10,094 | 1,909 | 846 | 687 | 648 | |||||||||||||||
| Provision for loan losses charged to operations | 16,600 | 2,350 | 1,725 | 1,775 | 1,200 | |||||||||||||||
| Balance at end of period | $ | 15,441 | $ | 8,935 | $ | 8,494 | $ | 7,615 | $ | 6,527 | ||||||||||
| Average loans outstanding | $ | 1,054,558 | $ | 945,669 | $ | 918,992 | $ | 785,164 | $ | 645,875 | ||||||||||
| Ratio of net charge-offs during the period to average loans outstanding | 0.96 | % | 0.20 | % | 0.09 | % | 0.09 | % | 0.10 | % | ||||||||||
| Ratio of allowance for loan losses to average loans outstanding | 1.46 | % | 0.94 | % | 0.92 | % | 0.97 | % | 1.01 | % | ||||||||||
As the previous table indicates, the provision for loan losses and the charge-off of commercial and construction loans are the most significant changes in the reserve level for the five-year period presented. The net charge-off ratios for 2004, 2005, and 2006 were 0.10 percent, 0.09 percent, and 0.09 percent, respectively, which were at levels that management considers good when compared to our peers. The net charge-off ratio for 2007 was 0.20 percent. The net charge-off ratio for 2008 was 0.96 percent, which is a historical high for the Company. According to the September 2008 Bank Holding Company Performance Report prepared by the Federal Reserve Board’s Division of Banking Supervision and Regulation, the percentage of net charge-offs to average loans for all banks with total assets between $1 billion and $3 billion was 0.47 percent for the first nine months of 2008.
Factors that are considered when determining the adequacy of the allowance include loan concentrations, loan growth, the economic outlook, and historical losses. The Company’s concentration risks include geographic concentration in central Iowa. The local economy is comprised primarily of service industries and state and county governments.
There has been a significant amount of publicity in the national media regarding sub-prime single-family mortgages and increases in foreclosure rates. West Bank does not originate sub-prime single-family mortgages. In addition, West Bank does not directly invest in sub-prime mortgages in its investment portfolio and the amount, if any, of sub-prime mortgages securing mortgage-backed securities owned by West Bank is not a material amount of the investment portfolio. While the foreclosure rate in Iowa has been increasing, the Company does not expect this to have a material impact on its operations. For several years, the majority of mortgage loans originated by West Bank have been sold in the secondary market and not retained on the Company’s balance sheet. West Bank has owned a portfolio of single-family loans for several years that may from time to time result in foreclosures, but the number of foreclosures is not expected to be material.
21
West Bank does have a significant portion of its loan portfolio in commercial real estate loans, commercial lines of credit, commercial term loans, and construction or land development loans. West Bank’s typical commercial borrower is a small or medium-sized, privately-owned Iowa business person or entity. West Bank’s commercial loans typically have greater credit risks than residential mortgage or consumer loans because they often have larger balances and repayment usually depends on the borrowers’ successful business operations. Commercial loans also involve some additional risk, because they generally are not fully repaid over the loan period and thus usually require refinancing or a large payoff at maturity. When the general economy turns downward, which is currently the case, commercial borrowers may not be able to repay their loans and the value of their assets, which are usually pledged as collateral, may decrease rapidly and significantly. Although management believes that the real estate markets in which West Bank makes loans are not as depressed as in some other parts of the country, we believe that real estate-related credit risks continue to be significant in our markets. The current economic conditions in West Bank’s market areas are putting considerable negative pressure on our existing loan customers and are limiting our ability to find attractive new loan customers.
Breakdown of Allowance for Loan Losses by Category
The following table sets forth information concerning the Company’s allocation of the allowance for loan losses as of the dates indicated.
2008 | 2007 | 2006 | 2005 | 2004 | ||||||||||||||||||||||||||||||||||||
Amount | % | * | Amount | % | * | Amount | % | * | Amount | % | * | Amount | % | * | ||||||||||||||||||||||||||
| Balance at end of period applicable to: | ||||||||||||||||||||||||||||||||||||||||
| Commercial | $ | 9,177 | 35.59 | % | $ | 2,762 | 37.10 | % | $ | 2,068 | 36.23 | % | $ | 2,717 | 35.81 | % | $ | 3,443 | 35.86 | % | ||||||||||||||||||||
| Real Estate: | ||||||||||||||||||||||||||||||||||||||||
| Construction, land and land development | 2,310 | 13.87 | % | 1,267 | 15.57 | % | 1,168 | 15.90 | % | 532 | 15.49 | % | 298 | 12.40 | % | |||||||||||||||||||||||||
| 1-4 family residential | 566 | 9.37 | % | 1,345 | 9.32 | % | 1,141 | 9.84 | % | 894 | 9.96 | % | 826 | 10.95 | % | |||||||||||||||||||||||||
| Commercial | 3,227 | 40.09 | % | 3,475 | 36.61 | % | 3,985 | 36.29 | % | 3,326 | 37.02 | % | 1,700 | 38.79 | % | |||||||||||||||||||||||||
| Consumer and other loans | 161 | 1.08 | % | 86 | 1.40 | % | 132 | 1.74 | % | 146 | 1.72 | % | 260 | 2.00 | % | |||||||||||||||||||||||||
| $ | 15,441 | 100.00 | % | $ | 8,935 | 100.00 | % | $ | 8,494 | 100.00 | % | $ | 7,615 | 100.00 | % | $ | 6,527 | 100.00 | % | |||||||||||||||||||||
*Percent of loans in each category to total loans.
The allocation of the allowance for loan losses is dependent upon the change in balances outstanding in the various categories, the historical net loss experience by category, which can vary over time, and management’s assessment of economic factors that may influence potential losses in the loan portfolio.
DEPOSITS
The Company’s primary source of funds is customer deposits. In April 2008, West Bank began an extensive sales campaign for a new product called “Reward Me Checking.” The product pays a certificate of deposit-like rate if the customer performs a certain number of electronic banking transactions and agrees to receive his or her monthly statements electronically. In addition, West Bank is the banking partner for a savings program called SmartyPig. SmartyPig is an innovative, internet-based savings and rewards program developed by SmartyPig, LLC. As of December 31, 2008, this program had gathered $8.5 million in deposits. An additional strategy for gathering and retaining core deposits was added in July 2008. New and current customers with a primary checking account at West Bank are eligible for a 50 basis point higher rate on time certificates. West Bank also offers a variety of interest-bearing accounts designed to attract both short-term and longer-term deposits from customers. Interest-bearing accounts earn interest at rates established by West Bank management based on competitive market factors and the Company’s need for funds.
While approximately 91 percent of West Bank’s certificates of deposit mature in the next year, it is anticipated that a majority of these certificates will be renewed. Rate-sensitive certificates of deposit in excess of $100,000 experience somewhat higher volatility with regard to renewal volume as West Bank adjusts rates based upon funding needs. In December 2008, management was utilizing wholesale deposits of approximately $376 million as a source of funding. Of the total wholesale deposits, approximately $274 million are certificates of deposit, the majority of which mature within one year. In the event a substantial volume of certificates is not renewed, the Company has sufficient liquid assets and borrowing lines to fund significant runoff. A sustained reduction in deposit volume would have a significant negative impact on the Company’s operations and liquidity.
22
The following table sets forth the average balances for each major category of deposits and the weighted average interest rate paid for deposits during the years indicated.
| Average Deposits by Type | ||||||||||||||||||||||||
| 2008 | 2007 | 2006 | ||||||||||||||||||||||
| Amount | Rate | Amount | Rate | Amount | Rate | |||||||||||||||||||
| Noninterest-bearing demand | $ | 180,614 | - | $ | 180,965 | - | $ | 186,894 | - | |||||||||||||||
| Interest-bearing demand | 87,264 | 1.40 | % | 75,013 | 2.44 | % | 46,434 | 1.00 | % | |||||||||||||||
| Money market | 200,569 | 1.74 | % | 190,044 | 3.52 | % | 204,722 | 3.24 | % | |||||||||||||||
| Savings | 38,017 | 0.87 | % | 39,081 | 1.08 | % | 55,098 | 1.47 | % | |||||||||||||||
| Time certificates | 447,959 | 3.68 | % | 418,869 | 5.06 | % | 498,455 | 4.73 | % | |||||||||||||||
| $ | 954,423 | $ | 903,972 | $ | 991,603 | |||||||||||||||||||
Certificates of Deposit
The following table shows the amounts and remaining maturities of time certificates of deposit with balances of $100,000 or more as of December 31, 2008.
| 3 months or less | $ | 139,188 | ||
| Over 3 through 6 months | 99,982 | |||
| Over 6 through 12 months | 27,302 | |||
| Over 12 months | 8,353 | |||
| $ | 274,825 |
BORROWED FUNDS
The following table summarizes the outstanding amount of and the weighted average rate on borrowed funds as of the dates indicated.
| As of December 31 | ||||||||||||||||||||||||
| 2008 | 2007 | 2006 | ||||||||||||||||||||||
| Balance | Rate | Balance | Rate | Balance | Rate | |||||||||||||||||||
| Subordinated notes | $ | 20,619 | 7.14 | % | $ | 20,619 | 7.14 | % | $ | 20,619 | 7.14 | % | ||||||||||||
| Long-term borrowings | 125,000 | 4.18 | % | 103,000 | 4.58 | % | 85,400 | 4.87 | % | |||||||||||||||
| Federal funds purchased and securities sold under agreements to repurchase | 93,111 | 0.48 | % | 166,930 | 4.16 | % | 109,346 | 5.20 | % | |||||||||||||||
| Other short-term borrowings | 245 | 0.00 | % | 2,672 | 4.00 | % | 1,929 | 5.04 | % | |||||||||||||||
| $ | 238,975 | 2.99 | % | $ | 293,221 | 4.51 | % | $ | 217,294 | 5.24 | % | |||||||||||||
Long-term borrowings at December 31, 2008, consisted of Federal Home Loan Bank (FHLB) advances. At December 31, 2007, long-term borrowings also included a note payable to a correspondent bank. At December 31, 2006, long-term borrowings included FHLB advances, a note payable to a correspondent bank and a note payable to VMF Capital, L.L.C. Other short-term borrowings as of the end of each year consisted of Treasury, Tax, and Loan option notes.
23
The following tables set forth the average amount of, the average rate paid, and the maximum outstanding balance on borrowed funds for the years indicated.
| Years Ended December 31 | ||||||||||||||||||||||||
| 2008 | 2007 | 2006 | ||||||||||||||||||||||
Average Balance | Average Rate | Average Balance | Average Rate | Average Balance | Average Rate | |||||||||||||||||||
| Subordinated notes | $ | 20,619 | 7.14 | % | $ | 20,619 | 7.14 | % | $ | 20,619 | 7.14 | % | ||||||||||||
| Long-term borrowings | 138,203 | 4.06 | % | 107,675 | 4.72 | % | 84,654 | 4.35 | % | |||||||||||||||
| Federal funds purchased and securities sold under agreements to repurchase | 125,110 | 2.23 | % | 139,622 | 4.85 | % | 83,726 | 4.78 | % | |||||||||||||||
| Other short-term borrowings | 1,317 | 2.98 | % | 6,805 | 5.07 | % | 968 | 4.77 | % | |||||||||||||||
| $ | 285,249 | 3.47 | % | $ | 274,721 | 4.98 | % | $ | 189,967 | 4.84 | % | |||||||||||||
| 2008 | 2007 | 2006 | ||||||||||||||||||||||
| Maximum amount outstanding during the year: | ||||||||||||||||||||||||
| Subordinated notes | $ | 20,619 | $ | 20,619 | $ | 20,619 | ||||||||||||||||||
| Long-term borrowings | 153,000 | 115,400 | 116,265 | |||||||||||||||||||||
Federal funds purchased and securities sold under agreements to repurchase | 198,917 | 199,205 | 143,245 | |||||||||||||||||||||
| Other short-term borrowings | 21,769 | 52,475 | 12,143 | |||||||||||||||||||||
OFF-BALANCE SHEET ARRANGEMENTS
In the normal course of business, West Bank commits to extend credit in the form of loan commitments and standby letters of credit in order to meet the financing needs of its customers. These commitments expose West Bank to varying degrees of credit and market risks in excess of the amounts recognized in the consolidated balance sheets and are subject to the same credit policies as are loans recorded on the balance sheets.
West Bank’s exposure to credit loss in the event of nonperformance by the other party to the financial instrument for commitments to extend credit and standby letters of credit is represented by the contractual amount of those instruments. West Bank uses the same credit policies in making commitments and conditional obligations as it does for on-balance sheet instruments. As of December 31, 2008 and 2007, West Bank had commitments to extend credit of approximately $301 million and $331 million, respectively, and standby letters of credit of approximately $20 million and $23 million, respectively.
Commitments to extend credit are agreements to lend to a customer as long as there is no violation of any condition established in the contract. Since many of the commitments are expected to expire without being drawn upon, the total commitment amounts do not necessarily represent future cash requirements. West Bank evaluates each customer’s creditworthiness on a case-by-case basis. The amount of collateral obtained is based on management’s credit evaluation of the party. Collateral held varies, but may include accounts receivable, inventory, property and equipment, residential real estate, and commercial properties.
Standby letters of credit are conditional commitments issued by West Bank to guarantee the performance of a customer to a third party. Those guarantees are primarily issued to support public and private borrowing arrangements. The credit risk involved in issuing letters of credit is essentially the same as that involved in extending loan facilities to customers. Collateral held varies as specified above, and is required in instances the Company deems necessary. In the event the customer does not perform in accordance with the terms of the agreement with the third party, West Bank would be required to fund the commitment. The maximum potential amount of future payments West Bank could be required to make is represented by the contractual amount disclosed above. If a commitment is funded, West Bank would be entitled to seek recovery from the customer. At December 31, 2008 and 2007, no amounts had been recorded as liabilities for West Bank’s potential obligations under these guarantees.
24
CONTRACTUAL OBLIGATIONS
The following table sets forth the balance of contractual obligations by maturity period as of December 31, 2008.
| Payments due by period | ||||||||||||||||||||
| Total | Less than one year | One to three years | Three to five years | More than five years | ||||||||||||||||
| Subordinated notes | $ | 20,619 | $ | - | $ | - | $ | - | $ | 20,619 | ||||||||||
| Long-term borrowings: | ||||||||||||||||||||
| Federal Home Loan Bank advances | 125,000 | - | 20,000 | - | 105,000 | |||||||||||||||
| Operating lease commitments | 16,105 | 1,748 | 2,846 | 2,294 | 9,217 | |||||||||||||||
| Total | $ | 161,724 | $ | 1,748 | $ | 22,846 | $ | 2,294 | $ | 134,836 | ||||||||||
LIQUIDITY AND CAPITAL RESOURCES
The objective of liquidity management is to ensure the availability of sufficient cash flows to meet all financial commitments and to capitalize on opportunities for profitable business expansion. The Company’s principal source of funds is deposits, including demand, money market, savings, and certificates of deposit. Other sources include principal repayments on loans, proceeds from the maturity and sale of investment securities, federal funds purchased, repurchase agreements, advances from the FHLB, and funds provided by operations. Liquidity management is conducted on both a daily and a long-term basis. Investments in liquid assets are adjusted based on expected loan demand, projected loan maturities and payments, expected deposit flows, and the objectives set by the Company’s asset-liability management policy. The Company had liquid assets (cash and cash equivalents) of $197.0 million at December 31, 2008, an increase of $147.1 from December 31, 2007. West Bank had additional borrowing capacity available from the FHLB of approximately $83 million at December 31, 2008. In addition, West Bank has $78 million in borrowing capacity available through unsecured federal funds lines of credit with correspondent banks. West Bank was not drawing on any of these lines of credit as of December 31, 2008. Net cash from operating activities contributed $24.1 million, $23.9 million, and $25.0 million to liquidity for the years 2008, 2007, and 2006, respectively. These cash flows from operations are expected to continue in the foreseeable future. The combination of high levels of potentially liquid assets, cash flows from operations, and additional borrowing capacity provided strong liquidity for the Company at December 31, 2008.
On December 31, 2008, the Company received $36 million from the Treasury in exchange for 36,000 shares of cumulative senior preferred stock and a warrant to purchase 474,100 shares of common stock under the CPP. The senior preferred shares qualify as Tier 1 capital for regulatory purposes and rank senior to common stock and bear a cumulative dividend rate of five percent per annum for the first five years they are outstanding and a rate of nine percent per annum thereafter. The Board of Directors and management believe it was prudent to participate in the CPP because (i) the cost of capital under this program may be significantly lower than the cost of capital otherwise available to the Company at this time, and (ii) despite being well-capitalized, additional capital under this program provides the Company and West Bank additional flexibility to meet future capital needs that may arise in the current uncertain economic environment. Of the total received, $34 million was transferred into capital in West Bank and $2 million was used to pay off long-term debt at the Company.
The Company’s total stockholders’ equity increased to $150.1 million at December 31, 2008, from $121.6 million at December 31, 2007. The change in equity was impacted by participation in the CPP, earnings less dividend payments, and the increase in accumulated comprehensive loss due to lower market values of available for sale securities. At December 31, 2008, stockholders’ equity was 9.66 percent of total assets, compared to 9.08 percent at December 31, 2007. No material capital expenditures or material changes in the capital resource mix are anticipated at this time. The capital levels of the Company exceed applicable regulatory guidelines as of December 31, 2008.
In April 2008, the Company’s Board of Directors authorized the buyback of up to $5 million of the Company’s common stock for a period of twelve months. No shares have been repurchased since the 2008 authorization. The Company repurchased 58,300 shares of its common stock at an average price of $13.53 in the first quarter of 2008 under a previous authorization. One of the stipulations of the CPP is that the Treasury’s consent is required for any share repurchases of common stock until December 31, 2011, unless the senior preferred stock has been redeemed or the Treasury has transferred all of the senior preferred stock to third parties.
25
INTEREST RATE RISK
Interest rate risk refers to the exposure of earnings and capital arising from changes in interest rates. Management’s objectives are to manage interest rate risk to work for consistent growth of earnings and capital. Interest rate risk management focuses on fluctuations in net interest income identified through computer simulations used to evaluate volatility, interest rate, spread, and volume assumptions. This risk is quantified and compared against tolerance levels.
The Company uses a purchased computer software simulation modeling program to measure its exposure to potential interest rate changes. For various assumed hypothetical changes in market interest rates, this analysis measures the estimated change in net interest income.
Another measure of interest rate sensitivity is the gap ratio. This ratio indicates the amount of interest-earning assets repricing within a given period in comparison to the amount of interest-bearing liabilities repricing within the same period of time. A gap ratio of 1.0 indicates a matched position, in which case the effect on net interest income due to interest rate movements will be minimal. A gap ratio of less than 1.0 indicates that more liabilities than assets reprice within the time period, and a ratio greater than 1.0 indicates that more assets reprice than liabilities. The Company’s gap ratio is shown on the following page.
QUANTITATIVE AND QUALITATIVE DISCLOSURES ABOUT MARKET RISK
The Company’s market risk is comprised primarily of interest rate risk arising from its core banking activities of lending and deposit taking. Interest rate risk is the risk that changes in market interest rates may adversely affect the Company’s net interest income. Management continually develops and applies strategies to mitigate this risk. Management does not believe that the Company’s primary market risk exposure and management of that exposure in 2008 materially changed compared to 2007.
The following table presents the estimated change in net interest income for the coming twelve months under several scenarios of assumed interest rate changes for the rate shock levels shown:
| Scenario | % Change | |||
| 300 basis points rising | 0.93 | % | ||
| 200 basis points rising | 0.00 | % | ||
| 100 basis points rising | -1.11 | % | ||
| Base | - | |||
As of December 31, 2008, the estimated effect of an immediate 300 basis point increase in interest rates would cause the Company’s net interest income to increase by approximately 0.93 percent, or $0.4 million, in 2009. The estimated effect of an immediate decrease in rates is not reasonably calculable due to the current historically-low interest rate environment. Because the majority of liabilities subject to interest rate movements in the short term are of the type that generally lag interest rate movements in the market, they do not change in the same magnitude in the short term as the change in market rates.
Computations of the prospective effects of hypothetical interest rate changes are based on numerous assumptions. Actual values may differ from those projections set forth above. Further, the computations do not contemplate any actions the Company may undertake in response to changes in interest rates.
26
The following table sets forth the estimated maturity or repricing, and the resulting interest sensitivity gap of the Company’s interest-earning assets and interest-bearing liabilities and the cumulative interest sensitivity gap at December 31, 2008. The expected maturities are presented on a contractual basis or, if more relevant, are based on projected call dates. Actual maturities may differ from contractual maturities because of prepayment assumptions and early withdrawal of deposits.
| Over 3 | Over 1 | |||||||||||||||||||
| 3 Months | Through 12 | Through | Over | |||||||||||||||||
| or Less | Months | 5 Years | 5 Years | Total | ||||||||||||||||
| Interest-earning assets: | ||||||||||||||||||||
| Loans | $ | 561,600 | $ | 119,264 | $ | 393,487 | $ | 27,402 | $ | 1,101,753 | ||||||||||
| Securities available for sale | 6,670 | 2,905 | 53,093 | 118,766 | 181,434 | |||||||||||||||
| Federal funds sold and other short-term investments | 173,257 | - | - | - | 173,257 | |||||||||||||||
| Federal Home Loan Bank stock | - | - | - | 8,174 | 8,174 | |||||||||||||||
| Total interest-earning assets | 741,527 | 122,169 | 446,580 | 154,342 | 1,464,618 | |||||||||||||||
| Interest-bearing liabilities: | ||||||||||||||||||||
| Interest-bearing deposits: | ||||||||||||||||||||
| Savings, money market and interest-bearing demand | 335,911 | - | - | - | 335,911 | |||||||||||||||
| Time | 298,417 | 290,285 | 55,103 | 436 | 644,241 | |||||||||||||||
| Federal funds purchased and securities sold under agreement to repurchase | 93,111 | - | - | - | 93,111 | |||||||||||||||
| Other short-term borrowings | 245 | - | - | - | 245 | |||||||||||||||
| Long-term borrowings | - | - | 20,000 | 125,619 | 145,619 | |||||||||||||||
| Total interest-bearing liabilities | 727,684 | 290,285 | 75,103 | 126,055 | 1,219,127 | |||||||||||||||
| Interest sensitivity gap per period | $ | 13,843 | $ | (168,116 | ) | $ | 371,477 | $ | 28,287 | $ | 245,491 | |||||||||
| Cumulative interest sensitivity gap | $ | 13,843 | $ | (154,273 | ) | $ | 217,204 | $ | 245,491 | $ | 245,491 | |||||||||
| Interest sensitivity gap ratio | 1.02 | 0.42 | 5.95 | 1.22 | 1.20 | |||||||||||||||
| Cumulative interest sensitivity gap ratio | 1.02 | 0.85 | 1.20 | 1.20 | 1.20 | |||||||||||||||
As of December 31, 2008, the Company’s cumulative gap ratio for assets and liabilities repricing within one year was 0.85, meaning that the Company is liability sensitive over the cumulative 12-month period. In other words, more interest-bearing liabilities will be subject to repricing within that time frame than interest-earning assets. However, the majority of the interest-bearing liabilities subject to repricing within these time frames are savings, money market, and interest–bearing demand deposits. These types of deposits generally do not reprice as quickly or with the same magnitude as changes in other short-term interest rates.
27
STOCK PRICE PERFORMANCE GRAPH
The following performance graph provides information regarding cumulative, five-year return on an indexed basis of the Common Stock as compared with the NASDAQ – Total US Index and the SNL Midwest Bank Index prepared by SNL Financial L.C. of Charlottesville, Virginia. The latter index reflects the performance of bank holding companies operating principally in the Midwest as selected by SNL Financial. The indices assume the investment of $100 on December 31, 2003, in the Common Stock, the NASDAQ – Total US Index, and the SNL Midwest Bank Index, with all dividends reinvested. The Company’s stock price performance shown in the following graph is not indicative of future stock price performance.
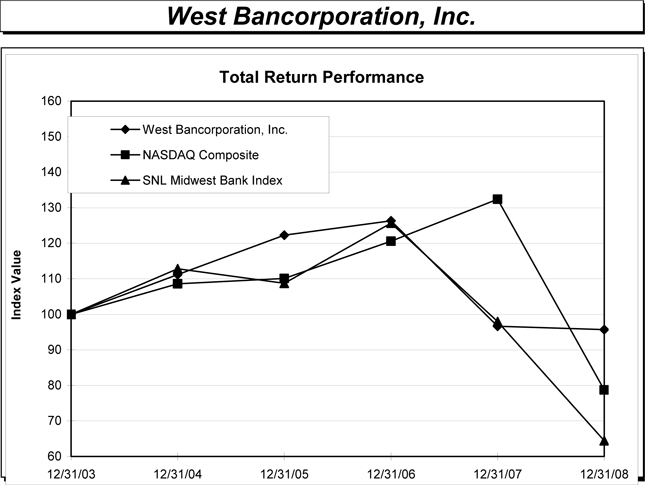
| Period Ending | ||||||||||||||||||||||||
| Index | 12/31/03 | 12/31/04 | 12/31/05 | 12/31/06 | 12/31/07 | 12/31/08 | ||||||||||||||||||
| West Bancorporation, Inc. | 100.00 | 111.17 | 122.30 | 126.32 | 96.62 | 95.72 | ||||||||||||||||||
| NASDAQ Composite | 100.00 | 108.59 | 110.08 | 120.56 | 132.39 | 78.72 | ||||||||||||||||||
| SNL Midwest Bank Index | 100.00 | 112.84 | 108.73 | 125.68 | 97.96 | 64.44 | ||||||||||||||||||
*Source: SNL Financial LC, Charlottesville, VA. Used with permission. All rights reserved.
28
EFFECTS OF NEW STATEMENTS OF FINANCIAL ACCOUNTING STANDARDS
In September 2006, the Financial Accounting Standards Board (FASB) issued Statement of Financial Accounting Standards (SFAS) No. 157, Fair Value Measurements. SFAS No. 157 defines fair value, establishes a framework for measuring fair value, and expands disclosures about fair value measurement. SFAS No. 157 also emphasizes that fair value is a market-based measurement, not an entity-specific measurement, and sets out a fair value hierarchy with the highest priority being quoted prices in active markets. Under SFAS No. 157, fair value measurements are disclosed by level within that hierarchy. The Company adopted SFAS No. 157 for the fiscal year beginning January 1, 2008, except for nonfinancial assets and nonfinancial liabilities that are recognized or disclosed at fair value in the financial statements on a nonrecurring basis for which delayed application is permitted until the fiscal year beginning January 1, 2009. Under the elected deferral, the following are assets and liabilities recognized or disclosed at fair value for which the Company has not yet applied the provisions of SFAS No. 157: other real estate owned, goodwill, and intangible assets. The adoption of the remaining provisions of SFAS No. 157 is not expected to have a material impact on the Company’s financial position, results of operations or cash flows.
In December 2007, the FASB issued SFAS No. 141 (revised), Business Combinations. This Statement applies to all transactions in which an entity obtains control of one or more businesses. The Statement establishes principles and requirements for how an acquirer recognizes and measures tangible assets acquired, liabilities assumed, goodwill, and any noncontrolling interests and identifies related disclosure requirements for business combinations. Measurement requirements will result in all assets, liabilities, contingencies and contingent consideration being recorded at fair value on the acquisition date, with limited exceptions. Acquisition costs and restructuring costs will generally be expensed as incurred. This Statement is effective for business combinations for which the acquisition date is on or after the beginning of the first annual reporting period beginning on or after December 15, 2008. Accordingly, this Statement is effective for the Company for business combinations in which the acquisition date is on or after January 1, 2009.
In February 2008, the FASB issued Financial Staff Position (FSP) No. 140−3, Accounting for Transfers of Financial Assets and Repurchase Financing Transactions. This FSP requires that an initial transfer of a financial asset and a repurchase financing that was entered into contemporaneously with, or in contemplation of, the initial transfer be evaluated together as a linked transaction under SFAS 140, unless certain criteria are met. FSP No. 140-3 is effective for fiscal years beginning after November 15, 2008. Accordingly, this Statement is effective for the Company beginning on January 1, 2009. The Company does not expect the adoption of this Statement to have a material impact on its financial position or results of operations.
INFLATION
The primary impact of inflation on the Company’s operation is increased asset yields, deposit costs, and operating overhead. Unlike most industries, virtually all of the assets and liabilities of a financial institution are monetary in nature. As a result, interest rates generally have a more significant impact on a financial institution’s performance than they would have on non-financial companies. Although interest rates do not necessarily move in the same direction or to the same extent as the prices of goods and services, increases in inflation generally have resulted in increased interest rates. The effects of inflation can magnify the growth of assets and, if significant, require that equity capital increase at a faster rate than otherwise would be necessary.
29
Report of Independent Registered Public Accounting Firm
To the Board of Directors and Stockholders
West Bancorporation, Inc.
West Des Moines, Iowa
We have audited the consolidated balance sheets of West Bancorporation, Inc. and subsidiaries as of December 31, 2008 and 2007, and the related consolidated statements of income, stockholders’ equity and cash flows for each of the three years in the period ended December 31, 2008. These financial statements are the responsibility of the Company’s management. Our responsibility is to express an opinion on these financial statements based on our audits.
We conducted our audits in accordance with the standards of the Public Company Accounting Oversight Board (United States). Those standards require that we plan and perform the audit to obtain reasonable assurance about whether the financial statements are free of material misstatement. An audit includes examining, on a test basis, evidence supporting the amounts and disclosures in the financial statements. An audit also includes assessing the accounting principles used and significant estimates made by management, as well as evaluating the overall financial statement presentation. We believe that our audits provide a reasonable basis for our opinion.
In our opinion, the consolidated financial statements referred to above present fairly, in all material respects, the financial position of West Bancorporation, Inc. and subsidiaries as of December 31, 2008 and 2007, and the results of their operations and their cash flows for each of the three years in the period ended December 31, 2008, in conformity with U.S. generally accepted accounting principles.
We also have audited, in accordance with the standards of the Public Company Accounting Oversight Board (United States), West Bancorporation, Inc. and subsidiaries’ internal control over financial reporting as of December 31, 2008, based on criteria established in Internal Control - Integrated Framework, issued by the Committee of Sponsoring Organizations of the Treadway Commission (COSO), and our report dated March 5, 2009 expressed an unqualified opinion on the effectiveness of West Bancorporation, Inc. and subsidiaries’ internal control over financial reporting.
| /s/ McGladrey & Pullen, LLP |
Des Moines, Iowa
March 5, 2009
McGladrey & Pullen, LLP is an independent member firm of RSM International,
an affiliation of separate and independent legal entities.
30
Report of Independent Registered Public Accounting Firm
To the Board of Directors and Stockholders
West Bancorporation, Inc.
We have audited West Bancorporation, Inc. and subsidiaries’ internal control over financial reporting as of December 31, 2008, based on criteria established in Internal Control - Integrated Framework, issued by the Committee of Sponsoring Organizations of the Treadway Commission (COSO). West Bancorporation, Inc. and subsidiaries’ management is responsible for maintaining effective internal control over financial reporting and for its assessment of the effectiveness of internal control over financial reporting included in the accompanying Management’s Report on Internal Control over Financial Reporting. Our responsibility is to express an opinion on the Company’s internal control over financial reporting based on our audit.
We conducted our audit in accordance with the standards of the Public Company Accounting Oversight Board (United States). Those standards require that we plan and perform the audit to obtain reasonable assurance about whether effective internal control over financial reporting was maintained in all material respects. Our audit included obtaining an understanding of internal control over financial reporting, assessing the risk that a material weakness exists, and testing and evaluating the design and operating effectiveness of internal control based on the assessed risk. Our audit also included performing such other procedures as we considered necessary in the circumstances. We believe that our audit provides a reasonable basis for our opinion.
A company’s internal control over financial reporting is a process designed to provide reasonable assurance regarding the reliability of financial reporting and the preparation of financial statements for external purposes in accordance with generally accepted accounting principles. A company’s internal control over financial reporting includes those policies and procedures that (1) pertain to the maintenance of records that, in reasonable detail, accurately and fairly reflect the transactions and dispositions of the assets of the company; (2) provide reasonable assurance that transactions are recorded as necessary to permit preparation of financial statements in accordance with generally accepted accounting principles, and that receipts and expenditures of the company are being made only in accordance with authorizations of management and directors of the company; and (3) provide reasonable assurance regarding prevention or timely detection of unauthorized acquisition, use, or disposition of the company’s assets that could have a material effect on the financial statements.
Because of its inherent limitations, internal control over financial reporting may not prevent or detect misstatements. Also, projections of any evaluation of effectiveness to future periods are subject to the risk that controls may become inadequate because of changes in conditions, or that the degree of compliance with the policies or procedures may deteriorate.
In our opinion, West Bancorporation, Inc. and subsidiaries maintained, in all material respects, effective internal control over financial reporting as of December 31, 2008, based on criteria established in Internal Control - Integrated Framework, issued by the Committee of Sponsoring Organizations of the Treadway Commission (COSO).
We also have audited, in accordance with the standards of the Public Company Accounting Oversight Board (United States), the balance sheets of West Bancorporation, Inc. and subsidiaries as of December 31, 2008 and 2007, and the related statements of income, stockholders’ equity and cash flows for each of the years in the three-year period ended December 31, 2008, and our report dated March 5, 2009 expressed an unqualified opinion.
Des Moines, Iowa
March 5, 2009
McGladrey & Pullen, LLP is an independent member firm of RSM International,
an affiliation of separate and independent legal entities.
31
Management’s Report on Internal Control over Financial Reporting
The management of West Bancorporation, Inc. (the Company) is responsible for establishing and maintaining adequate internal control over financial reporting. The Company’s internal control system was designed to provide reasonable assurance to the Company’s management and Board of Directors regarding the preparation and fair presentation of published financial statements. All internal control systems, no matter how well designed, have inherent limitations. Therefore, even those systems determined to be effective can provide only reasonable assurance with respect to financial statement preparation and presentation.
West Bancorporation, Inc.’s management assessed the effectiveness of the Company’s internal control over financial reporting as of December 31, 2008. In making this assessment, it used the criteria set forth by the Committee of Sponsoring Organizations of the Treadway Commission (COSO) in Internal Control - Integrated Framework. Based on our assessment, we believe that, as of December 31, 2008, the Company’s internal control over financial reporting is effective based on those criteria. The independent registered public accounting firm that audited the financial statements included in the annual report has issued an audit report on the effectiveness of the Company’s internal control over financial reporting.
/s/ Thomas E. Stanberry
Thomas E. Stanberry
Chairman, President and Chief Executive Officer
/s/ Douglas R. Gulling
Douglas R. Gulling
Executive Vice President and Chief Financial Officer
32
West Bancorporation, Inc. and Subsidiaries
Consolidated Balance Sheets
December 31, 2008 and 2007
| (in thousands, except per share data) | 2008 | 2007 | ||||||
| ASSETS | ||||||||
| Cash and due from banks | $ | 23,712 | $ | 49,529 | ||||
| Federal funds sold and other short-term investments | 173,257 | 414 | ||||||
| Cash and cash equivalents | 196,969 | 49,943 | ||||||
| Securities available for sale | 181,434 | 231,427 | ||||||
| Federal Home Loan Bank stock, at cost | 8,174 | 5,951 | ||||||
| Loans held for sale | 1,018 | 1,858 | ||||||
| Loans | 1,100,735 | 983,565 | ||||||
| Allowance for loan losses | (15,441 | ) | (8,935 | ) | ||||
| Loans, net | 1,085,294 | 974,630 | ||||||
| Premises and equipment, net | 4,916 | 5,181 | ||||||
| Accrued interest receivable | 6,415 | 7,829 | ||||||
| Goodwill | 24,930 | 24,930 | ||||||
| Other intangible assets | 1,404 | 2,131 | ||||||
| Bank-owned life insurance | 25,277 | 24,341 | ||||||
| Other assets | 17,357 | 11,747 | ||||||
| Total assets | $ | 1,553,188 | $ | 1,339,968 | ||||
| LIABILITIES AND STOCKHOLDERS’ EQUITY | ||||||||
| LIABILITIES | ||||||||
| Deposits: | ||||||||
| Noninterest-bearing demand | $ | 174,635 | $ | 196,698 | ||||
| Interest-bearing demand | 97,853 | 85,027 | ||||||
| Savings | 238,058 | 243,405 | ||||||
| Time of $100,000 or more | 274,825 | 160,936 | ||||||
| Other time | 369,416 | 224,859 | ||||||
| Total deposits | 1,154,787 | 910,925 | ||||||
| Federal funds purchased and securities sold under agreements to repurchase | 93,111 | 166,930 | ||||||
| Other short-term borrowings | 245 | 2,672 | ||||||
| Accrued expenses and other liabilities | 9,363 | 14,216 | ||||||
| Subordinated notes | 20,619 | 20,619 | ||||||
| Long-term borrowings | 125,000 | 103,000 | ||||||
| Total liabilities | 1,403,125 | 1,218,362 | ||||||
| COMMITMENTS AND CONTINGENCIES | ||||||||
| STOCKHOLDERS’ EQUITY | ||||||||
| Preferred stock, $0.01 par value, with a liquidation preference of $1,000 per share; authorized 50,000,000 shares; 36,000 shares issued and outstanding at December 31, 2008; no shares authorized at December 31, 2007 | 33,548 | - | ||||||
| Common stock, no par value; authorized 50,000,000 shares; 17,403,882 and 17,462,182 shares issued and outstanding at December 31, 2008 and 2007, respectively | 3,000 | 3,000 | ||||||
| Additional paid-in capital | 34,452 | 32,000 | ||||||
| Retained earnings | 82,793 | 87,084 | ||||||
| Accumulated other comprehensive (loss) | (3,730 | ) | (478 | ) | ||||
| Total stockholders’ equity | 150,063 | 121,606 | ||||||
| Total liabilities and stockholders’ equity | $ | 1,553,188 | $ | 1,339,968 | ||||
See Notes to Consolidated Financial Statements.
33
West Bancorporation, Inc. and Subsidiaries
Consolidated Statements of Income
Years Ended December 31, 2008, 2007, and 2006
| (in thousands, except per share data) | 2008 | 2007 | 2006 | |||||||||
| Interest income: | ||||||||||||
| Loans, including fees | $ | 63,524 | $ | 70,155 | $ | 67,176 | ||||||
| Securities: | ||||||||||||
| U.S. Treasury, government agencies and corporations | 2,903 | 5,834 | 6,046 | |||||||||
| States and political subdivisions | 4,152 | 3,742 | 4,117 | |||||||||
| Other | 1,485 | 1,544 | 1,494 | |||||||||
| Federal funds sold and other short-term investments | 467 | 752 | 903 | |||||||||
| Total interest income | 72,531 | 82,027 | 79,736 | |||||||||
| Interest expense: | ||||||||||||
| Demand deposits | 1,223 | 1,830 | 464 | |||||||||
| Savings deposits | 3,812 | 7,118 | 7,448 | |||||||||
| Time deposits | 16,486 | 21,203 | 23,557 | |||||||||
Federal funds purchased and securities sold under agreements to repurchase | 2,788 | 6,769 | 4,002 | |||||||||
| Other short-term borrowings | 39 | 345 | 46 | |||||||||
| Subordinated notes | 1,476 | 1,472 | 1,472 | |||||||||
| Long-term borrowings | 5,607 | 5,086 | 3,680 | |||||||||
| Total interest expense | 31,431 | 43,823 | 40,669 | |||||||||
| Net interest income | 41,100 | 38,204 | 39,067 | |||||||||
| Provision for loan losses | 16,600 | 2,350 | 1,725 | |||||||||
| Net interest income after provision for loan losses | 24,500 | 35,854 | 37,342 | |||||||||
| Noninterest income: | ||||||||||||
| Service charges on deposit accounts | 4,832 | 4,794 | 4,821 | |||||||||
| Trust services | 789 | 758 | 767 | |||||||||
| Investment advisory fees | 7,401 | 7,920 | 8,040 | |||||||||
| Increase in cash value of bank-owned life insurance | 936 | 890 | 857 | |||||||||
| Securities gains (losses), net | 73 | 5 | (171 | ) | ||||||||
| Investment securities impairment losses | (4,739 | ) | - | - | ||||||||
| Other income | 2,414 | 1,998 | 1,854 | |||||||||
| Total noninterest income | 11,706 | 16,365 | 16,168 | |||||||||
| Noninterest expense: | ||||||||||||
| Salaries and employee benefits | 13,362 | 13,560 | 13,937 | |||||||||
| Occupancy | 3,596 | 3,579 | 3,433 | |||||||||
| Data processing | 2,287 | 2,225 | 2,217 | |||||||||
| Other expenses | 7,701 | 5,459 | 5,388 | |||||||||
| Total noninterest expense | 26,946 | 24,823 | 24,975 | |||||||||
| Income before income taxes | 9,260 | 27,396 | 28,535 | |||||||||
| Income taxes | 1,624 | 8,476 | 9,128 | |||||||||
| Net income | $ | 7,636 | $ | 18,920 | $ | 19,407 | ||||||
| Earnings per common share, basic | $ | 0.44 | $ | 1.08 | $ | 1.11 | ||||||
| Earnings per common share, diluted | $ | 0.44 | $ | 1.08 | $ | 1.11 | ||||||
See Notes to Consolidated Financial Statements.
34
West Bancorporation, Inc. and Subsidiaries
Consolidated Statements of Stockholders’ Equity
Years Ended December 31, 2008, 2007, and 2006
(in thousands, except per share data)
| Accumulated | ||||||||||||||||||||||||||||
| Additional | Other | |||||||||||||||||||||||||||
| Comprehensive | Preferred | Common | Paid-in | Retained | Comprehensive | |||||||||||||||||||||||
Income | Stock | Stock | Capital | Earnings | Income (Loss) | Total | ||||||||||||||||||||||
| Balance, December 31, 2005 | $ | - | $ | 3,000 | $ | 32,000 | $ | 71,951 | $ | (2,430 | ) | $ | 104,521 | |||||||||||||||
| Comprehensive income: | ||||||||||||||||||||||||||||
| Net income | $ | 19,407 | - | - | - | 19,407 | - | 19,407 | ||||||||||||||||||||
| Other comprehensive income, unrealized gains on securities, net of reclassification adjustment, net of tax | 845 | - | - | - | - | 845 | 845 | |||||||||||||||||||||
| Total comprehensive income | $ | 20,252 | ||||||||||||||||||||||||||
| Purchase of fractional shares resulting from stock dividend | - | - | - | (5 | ) | - | (5 | ) | ||||||||||||||||||||
| Cash dividends declared, $0.625 per share | - | - | - | (10,956 | ) | - | (10,956 | ) | ||||||||||||||||||||
| Balance, December 31, 2006 | - | 3,000 | 32,000 | 80,397 | (1,585 | ) | 113,812 | |||||||||||||||||||||
| Comprehensive income: | ||||||||||||||||||||||||||||
| Net income | $ | 18,920 | - | - | - | 18,920 | - | 18,920 | ||||||||||||||||||||
Other comprehensive income, unrealized gains on securities, net of reclassification adjustment, net of tax | 1,107 | - | - | - | - | 1,107 | 1,107 | |||||||||||||||||||||
| Total comprehensive income | $ | 20,027 | ||||||||||||||||||||||||||
Shares reaquired and retired under the common stock repurchase plan | - | - | - | (974 | ) | - | (974 | ) | ||||||||||||||||||||
| Cash dividends declared, $0.640 per share | - | - | - | (11,224 | ) | - | (11,224 | ) | ||||||||||||||||||||
| Other | - | - | - | (35 | ) | - | (35 | ) | ||||||||||||||||||||
| Balance, December 31, 2007 | - | 3,000 | 32,000 | 87,084 | (478 | ) | 121,606 | |||||||||||||||||||||
| Comprehensive income: | ||||||||||||||||||||||||||||
| Net income | $ | 7,636 | - | - | - | 7,636 | - | 7,636 | ||||||||||||||||||||
| Other comprehensive loss, unrealized (losses) on securities, net of reclassification adjustment, net of tax | (3,252 | ) | - | - | - | - | (3,252 | ) | (3,252 | ) | ||||||||||||||||||
| Total comprehensive income | $ | 4,384 | ||||||||||||||||||||||||||
| Preferred shares and common stock warrant issued | 33,548 | - | 2,452 | - | - | 36,000 | ||||||||||||||||||||||
| Shares reaquired and retired under the common stock repurchase plan | - | - | - | (789 | ) | - | (789 | ) | ||||||||||||||||||||
| Cash dividends declared, $0.640 per share | - | - | - | (11,138 | ) | - | (11,138 | ) | ||||||||||||||||||||
| Balance, December 31, 2008 | $ | 33,548 | $ | 3,000 | $ | 34,452 | $ | 82,793 | $ | (3,730 | ) | $ | 150,063 | |||||||||||||||
See Notes to Consolidated Financial Statements.
35
West Bancorporation, Inc. and Subsidiaries
Consolidated Statements of Cash Flows
Years Ended December 31, 2008, 2007, and 2006
(in thousands) | 2008 | 2007 | 2006 | |||||||||
| CASH FLOWS FROM OPERATING ACTIVITIES | ||||||||||||
| Net income | $ | 7,636 | $ | 18,920 | $ | 19,407 | ||||||
| Adjustments to reconcile net income to net cash provided by operating activities: | ||||||||||||
| Provision for loan losses | 16,600 | 2,350 | 1,725 | |||||||||
| Net amortization and accretion | 1,015 | 1,450 | 395 | |||||||||
| (Gain) loss on disposition of premises and equipment | 23 | 35 | (97 | ) | ||||||||
| Securities (gains) losses, net | (73 | ) | (5 | ) | 171 | |||||||
| Investment securities impairment losses | 4,739 | - | - | |||||||||
| Net gains from sales of loans held for sale | (537 | ) | (162 | ) | (134 | ) | ||||||
| Proceeds from sales of loans held for sale | 34,905 | 13,816 | 11,288 | |||||||||
| Originations of loans held for sale | (33,528 | ) | (15,377 | ) | (11,290 | ) | ||||||
| Increase in cash value of bank-owned life insurance | (936 | ) | (890 | ) | (857 | ) | ||||||
| Depreciation | 899 | 899 | 912 | |||||||||
| Deferred income taxes | (3,211 | ) | 2 | 131 | ||||||||
| Net change in assets and liabilities: | ||||||||||||
| (Increase) decrease in accrued interest receivable | 1,414 | 758 | (725 | ) | ||||||||
| Increase (decrease) in accrued expenses and other liabilities | (4,853 | ) | 2,120 | 4,113 | ||||||||
| Net cash provided by operating activities | 24,093 | 23,916 | 25,039 | |||||||||
| CASH FLOWS FROM INVESTING ACTIVITIES | ||||||||||||
| Proceeds from sales, calls, and maturities of securities available for sale | 117,129 | 40,899 | 35,749 | |||||||||
| Purchases of securities available for sale | (77,318 | ) | (14,388 | ) | (21,722 | ) | ||||||
| Purchases of Federal Home Loan Bank stock | (5,628 | ) | (5,429 | ) | (2,758 | ) | ||||||
| Proceeds from redemption of Federal Home Loan Bank stock | 3,405 | 4,325 | 2,296 | |||||||||
| Net change in loans | (135,396 | ) | (81,342 | ) | (39,407 | ) | ||||||
| Proceeds from sales of premises and equipment | 10 | 29 | 382 | |||||||||
| Purchases of premises and equipment | (667 | ) | (769 | ) | (923 | ) | ||||||
| Purchase of bank-owned life insurance | - | (495 | ) | - | ||||||||
| Other | 7,709 | (1,766 | ) | (3,017 | ) | |||||||
| Net cash (used in) investing activities | (90,756 | ) | (58,936 | ) | (29,400 | ) | ||||||
| CASH FLOWS FROM FINANCING ACTIVITIES | ||||||||||||
| Net change in deposits | 243,862 | (14,409 | ) | (19,560 | ) | |||||||
Net change in federal funds purchased and securities sold under agreements to repurchase | (73,819 | ) | 57,584 | 24,598 | ||||||||
| Net change in other short-term borrowings | (2,427 | ) | 743 | (2,803 | ) | |||||||
| Proceeds from long-term borrowings | 75,000 | 30,000 | 50,000 | |||||||||
| Principal payments on long-term borrowings | (53,000 | ) | (12,400 | ) | (41,900 | ) | ||||||
| Proceeds from preferred shares and common stock warrant issued | 36,000 | - | - | |||||||||
| Payment for shares reaquired under common stock repurchase plan | (789 | ) | (974 | ) | - | |||||||
| Purchase of fractional shares resulting from stock dividend | - | - | (5 | ) | ||||||||
| Cash dividends | (11,138 | ) | (11,224 | ) | (10,956 | ) | ||||||
| Other | - | (35 | ) | - | ||||||||
| Net cash provided by (used in) financing activities | 213,689 | 49,285 | (626 | ) | ||||||||
| Net increase (decrease) in cash and cash equivalents | 147,026 | 14,265 | (4,987 | ) | ||||||||
| CASH AND CASH EQUIVALENTS | ||||||||||||
| Beginning | 49,943 | 35,678 | 40,665 | |||||||||
| Ending | $ | 196,969 | $ | 49,943 | $ | 35,678 | ||||||
(Continued)
36
West Bancorporation, Inc. and Subsidiaries
Consolidated Statements of Cash Flows (Continued)
Years Ended December 31, 2008, 2007, and 2006
| (in thousands) | 2008 | 2007 | 2006 | |||||||||
SUPPLEMENTAL DISCLOSURE OF CASH FLOW INFORMATION | ||||||||||||
| Cash payments for: | ||||||||||||
| Interest | $ | 31,934 | $ | 43,596 | $ | 39,276 | ||||||
| Income taxes | 4,080 | 8,464 | 9,269 | |||||||||
| SUPPLEMENTAL DISCLOSURE OF NONCASH INVESTING AND FINANCING ACTIVITIES | ||||||||||||
| Transfer of loans to other real estate | $ | 8,132 | $ | 354 | $ | 1,780 | ||||||
See Notes to Consolidated Financial Statements.
37
West Bancorporation, Inc. and Subsidiaries
Notes to Consolidated Financial Statements
(dollars in thousands, except per share data)
| Note 1. | Organization and Nature of Business and Summary of Significant Accounting Policies |
Organization and nature of business: West Bancorporation, Inc. (the Holding Company) is a holding company that has two wholly-owned subsidiaries: West Bank and WB Capital Management Inc. (WB Capital) (referred to collectively as the Company). West Bank is state chartered and has its main office in West Des Moines, Iowa, with seven branches located in the Des Moines metropolitan area, two branches located in Iowa City, Iowa, and one office located in Coralville, Iowa. WB Capital was formed in 2003 and is an investment advisory firm with offices located in West Des Moines, Iowa and Coralville, Iowa. In addition, the Company owns a nonconsolidated subsidiary, West Bancorporation Capital Trust I (the Trust), which was formed in 2003 for the purpose of issuing trust preferred securities.
Significant accounting policies:
Accounting estimates and assumptions: The consolidated financial statements have been prepared in conformity with generally accepted accounting principles. In preparing the financial statements, management is required to make estimates and assumptions that affect the reported amounts of assets and liabilities and disclosure of contingent assets and liabilities at the date of the financial statements and the reported amounts of revenue and expenses for the reporting period. Actual results could differ from those estimates. Material estimates that are particularly susceptible to significant change in the near term are the allowance for loan losses, fair value of financial instruments, and the goodwill impairment assessment.
Consolidation policy: The consolidated financial statements include the accounts of the Holding Company, West Bank, West Bank’s wholly-owned subsidiary, WB Funding Corporation (which owns an interest in a partnership), West Bank’s 99.9 percent owned subsidiary, ICD IV, LLC (a community development partnership), and WB Capital. All significant intercompany transactions and balances have been eliminated in consolidation. In accordance with Financial Accounting Standards Board (FASB) Interpretation No. 46(R), Consolidation of Variable Interest Entities, the Trust is not consolidated with the Company. The results of the Trust are recorded on the books of the Company using the equity method of accounting.
Comprehensive income: Comprehensive income consists of net income and other comprehensive income. Other comprehensive income includes the net change in unrealized gains and losses on the Company’s securities available for sale.
Cash and cash equivalents: For statement of cash flow purposes, the Company considers cash, due from banks, federal funds sold, and short-term investments, including money market mutual funds, to be cash and cash equivalents. Cash flows from loans and deposits are reported net.
Securities: Securities available for sale are reported at fair value, with unrealized gains and losses reported as a separate component of accumulated other comprehensive income, net of deferred income taxes. Available for sale securities may be sold for general liquidity needs, response to market interest rate fluctuations, implementation of asset-liability management strategies, funding increased loan demand, changes in securities prepayment risk, or other similar factors. Realized gains and losses on sales are computed on a specific identification basis based on amortized cost.
The amortized cost of debt securities classified as available for sale is adjusted for accretion of discounts to maturity and amortization of premiums over the estimated average life of each security or, in the case of callable securities, through the first call date, using the effective yield method. Such amortization and accretion is included in interest income. Interest income on securities is recognized using the interest method according to the terms of the security.
Declines in the fair value of individual securities, below their amortized cost, that are determined to be other than temporary, result in write-downs of the individual securities to their fair value with the resulting write-downs included in current earnings as realized losses. In estimating other-than-temporary impairment losses, quoted market values are used if it is believed those values are the result of an active market. Otherwise, the estimated cash flow projected to be received over the life of the security is discounted using a discount rate believed to be appropriate for the circumstances involved.
38
West Bancorporation, Inc. and Subsidiaries
Notes to Consolidated Financial Statements
(dollars in thousands, except per share data)
Loans held for sale: Loans held for sale include residential mortgages that were originated in accordance with secondary market pricing and underwriting standards and are stated at the lower of cost or market value determined on an aggregate basis. Gains and losses on loan sales are recorded in noninterest income.
Loans: Loans are stated at the principal amounts outstanding, net of unamortized loan fees and costs, with interest income recognized on the interest method based upon those outstanding loan balances. Loan origination fees, net of certain direct origination costs, are deferred and recognized as an adjustment of the related loan yield using the interest method.
The accrual of interest on past due and other impaired loans is generally discontinued at 90 days or when, in the opinion of management, the borrower may be unable to make payments as they become due. Unless considered collectible, all interest accrued but not collected for loans that are placed on nonaccrual or charged off is reversed against interest income, if accrued in the current year, or charged to the allowance for loan losses, if accrued in the prior year. Interest income is subsequently recognized only to the extent cash payments are received. Loans are returned to accrual status when all principal and interest amounts contractually due are brought current and future payments are reasonably assured. A loan is classified as a restructured loan when the interest rate is materially reduced or the term is extended beyond the original maturity date because of the inability of the borrower to service the loan at market terms. These loans are accounted for under FASB Statement of Financial Accounting Standards (SFAS) No. 114 as impaired loans until performance is established.
A loan is impaired when it is probable that West Bank will be unable to collect all contractual principal and interest payments due in accordance with the terms of the loan agreement. Impaired loans are measured based on the present value of expected future cash flows discounted at the loan’s effective interest rate or, as a practical expedient, at the loan’s observable market price or the fair value of the collateral if the loan is collateral dependent. The amount of impairment, if any, and any subsequent changes are included in the allowance for loan losses.
Allowance for loan losses: The allowance for loan losses is established through a provision for loan losses charged to expense. Loans are charged against the allowance for loan losses when management believes that collectibility of the principal is unlikely. The allowance is an amount that management believes will be adequate to absorb probable losses on existing loans, based on an evaluation of the collectibility of loans and prior loss experience. This evaluation also takes into consideration such factors as changes in the nature and volume of the loan portfolio, overall portfolio quality, review of specific problem loans, and current economic conditions that may affect the borrower’s ability to pay. While management uses the best information available to make its evaluation, future adjustments to the allowance may be necessary if there are significant changes in economic conditions or the other factors relied upon. In addition, regulatory agencies, as an integral part of their examination process, periodically review West Bank’s allowance for loan losses, and may require West Bank to make additions to the allowance based on their judgment about information available to them at the time of their examinations.
Premises and equipment: Premises and equipment are stated at cost less accumulated depreciation. The straight-line method of depreciation and amortization is used for calculating expense. Estimated useful lives of premises and equipment range up to 40 years for buildings, up to 10 years for furniture and equipment, and the shorter of the estimated useful life or lease term for leasehold improvements.
Trust assets: Assets held by West Bank in fiduciary or agency capacities, other than trust cash on deposit at West Bank, are not included in the consolidated financial statements.
Investment advisory assets under management: Assets managed by WB Capital are not included in the consolidated financial statements. Revenue associated with assets under management is recognized as income when services are performed and is based upon established fee schedules consisting of various percentages of market value of assets under management.
39
West Bancorporation, Inc. and Subsidiaries
Notes to Consolidated Financial Statements
(dollars in thousands, except per share data)
Goodwill and other intangible assets: Intangible assets consist of goodwill, core deposit premiums, client base, and employment/noncompete contracts. Goodwill is the excess of the cash paid over the net fair value of assets acquired and liabilities assumed in an acquisition, less the amount of identifiable intangible assets. The recoverability of goodwill is evaluated annually or on an interim basis if events or circumstances indicate a possible inability to realize the carrying amount. Intangible assets are also evaluated for impairment whenever events or changes in circumstances indicate a loss may have occurred. Other intangible assets are amortized over their estimated useful lives, using straight-line and accelerated methods.
Bank-owned life insurance: The carrying amount of bank-owned life insurance consists of the initial premium paid plus increases in cash value less the carrying amount associated with any death benefit received. Death benefits paid in excess of the applicable carrying amount are recognized as income, which is exempt from income taxes.
Transfer of financial assets: Transfers of financial assets are accounted for as sales when control over the assets has been surrendered. Control over transferred assets is deemed to be surrendered when the assets have been isolated from the Company, the transferee obtains the right, free of conditions that constrain it from taking advantage of that right, to pledge or exchange the transferred assets, and the Company does not maintain effective control over the transferred assets through an agreement to repurchase them before their maturity.
Preferred stock and common stock warrant: The proceeds from the issuance of preferred stock and a common stock warrant were allocated between the two based upon the proportionate fair value of each at the time of receipt. The resulting discount on preferred stock will be accreted to par using an effective yield method over a five-year period. The accretion results in an adjustment directly to retained earnings and will decrease the income available to common shareholders.
Income taxes: The Company files a consolidated federal income tax return. Income tax expense is generally allocated as if the Holding Company and its subsidiaries file separate income tax returns. Deferred taxes are provided on an asset and liability method whereby deferred tax assets are recognized for deductible temporary differences, operating loss and tax credit carryforwards, and deferred tax liabilities are recognized for taxable temporary differences. Temporary differences are the differences between the reported amounts of assets and liabilities and their tax basis. Deferred tax assets are reduced by a valuation allowance when, in the opinion of management, it is more likely than not that some portion or all of the deferred tax assets will not be realized.
When tax returns are filed, it is highly certain that some positions taken will be sustained upon examination by the taxing authorities, while others are subject to uncertainty about the merits of the position taken or the amount of the position that would be ultimately sustained. The benefit of a tax position is recognized in the consolidated financial statements in the period during which, based on all available evidence, management believes it is more likely than not that the position will be sustained upon examination, including the resolution of appeals or litigation processes, if any. The evaluation of a tax position taken is considered by itself and is not offset or aggregated with other positions. Tax positions that meet the more-likely-than-not recognition threshold are measured as the largest amount of tax benefit that is more than 50 percent likely of being realized upon settlement with the applicable taxing authority.
Interest and penalties related to income taxes are recorded as other noninterest expense in the consolidated statements of income.
40
West Bancorporation, Inc. and Subsidiaries
Notes to Consolidated Financial Statements
(dollars in thousands, except per share data)
Current accounting developments: In September 2006, the FASB issued SFAS No. 157, Fair Value Measurements. SFAS No. 157 defines fair value, establishes a framework for measuring fair value, and expands disclosures about fair value measurement. SFAS No. 157 also emphasizes that fair value is a market-based measurement, not an entity-specific measurement, and sets out a fair value hierarchy with the highest priority being quoted prices in active markets. Under SFAS No. 157, fair value measurements are disclosed by level within that hierarchy. The Company adopted SFAS No. 157 for the fiscal year beginning January 1, 2008, except for nonfinancial assets and nonfinancial liabilities that are recognized or disclosed at fair value in the financial statements on a nonrecurring basis for which delayed application is permitted until the fiscal year beginning January 1, 2009. Under the elected deferral, the following are assets and liabilities recognized or disclosed at fair value for which the Company has not yet applied the provisions of SFAS No. 157: other real estate owned, goodwill, and intangible assets. The adoption of the remaining provisions of SFAS No. 157 is not expected to have a material impact on the Company’s financial position, results of operations or cash flows.
In December 2007, the FASB issued SFAS No. 141 (revised), Business Combinations. This Statement applies to all transactions in which an entity obtains control of one or more businesses. The Statement establishes principles and requirements for how an acquirer recognizes and measures tangible assets acquired, liabilities assumed, goodwill and any noncontrolling interests and identifies related disclosure requirements for business combinations. Measurement requirements will result in all assets, liabilities, contingencies, and contingent consideration being recorded at fair value on the acquisition date, with limited exceptions. Acquisition costs and restructuring costs will generally be expensed as incurred. This Statement is effective for business combinations for which the acquisition date is on or after the beginning of the first annual reporting period beginning on or after December 15, 2008. Accordingly, this Statement is effective for the Company for business combinations in which the acquisition date is on or after January 1, 2009.
In February 2008, the FASB issued Financial Staff Position (FSP) No. 140−3, Accounting for Transfers of Financial Assets and Repurchase Financing Transactions. This FSP requires that an initial transfer of a financial asset and a repurchase financing that was entered into contemporaneously with, or in contemplation of, the initial transfer be evaluated together as a linked transaction under SFAS 140, unless certain criteria are met. FSP No. 140-3 is effective for fiscal years beginning after November 15, 2008. Accordingly, this Statement is effective for the Company beginning on January 1, 2009. The Company does not expect the adoption of this Statement will have a material impact on its financial position or results of operations.
Earnings per common share: Basic earnings per common share is computed by dividing income available to common stockholders by the weighted average number of common shares outstanding for the period. Income available to common stockholders is net income less preferred stock dividends and accretion of discount on preferred stock, treated as preferred stock dividends. Diluted earnings per common share reflects the potential dilution that could occur if the Company’s outstanding stock warrants were exercised and converted into common stock. The dilutive effect is computed using the treasury stock method, which assumes all outstanding warrants are exercised. The incremental shares, to the extent they would have been dilutive, are included in the denominator of the diluted earnings per common share calculation.
Reclassifications: Certain items in the financial statements for the years ended December 31, 2007 and 2006 were reclassified to be consistent with the classifications used in the December 31, 2008 financial statements. The reclassification has no effect on net income or stockholders’ equity.
41
West Bancorporation, Inc. and Subsidiaries
Notes to Consolidated Financial Statements
(dollars in thousands, except per share data)
| Note 2. | Securities |
Securities available for sale consist of the following as of December 31, 2008 and 2007:
| 2008 | ||||||||||||||||
| Gross | Gross | |||||||||||||||
| Amortized | Unrealized | Unrealized | Fair | |||||||||||||
| Cost | Gains | (Losses) | Value | |||||||||||||
| U.S. Treasury and government agencies and corporations | $ | 60,129 | $ | 2,155 | $ | - | $ | 62,284 | ||||||||
| State and political subdivisions | 109,682 | 1,271 | (3,778 | ) | 107,175 | |||||||||||
| Corporate notes and other investments | 17,639 | 3 | (5,667 | ) | 11,975 | |||||||||||
| $ | 187,450 | $ | 3,429 | $ | (9,445 | ) | $ | 181,434 | ||||||||
| 2007 | ||||||||||||||||
| Gross | Gross | |||||||||||||||
| Amortized | Unrealized | Unrealized | Fair | |||||||||||||
| Cost | Gains | (Losses) | Value | |||||||||||||
| U.S. Treasury and government agencies and corporations | $ | 120,350 | $ | 599 | $ | (120 | ) | $ | 120,829 | |||||||
| State and political subdivisions | 88,810 | 1,138 | (382 | ) | 89,566 | |||||||||||
| Corporate notes and other investments | 23,042 | 21 | (2,031 | ) | 21,032 | |||||||||||
| $ | 232,202 | $ | 1,758 | $ | (2,533 | ) | $ | 231,427 | ||||||||
42
West Bancorporation, Inc. and Subsidiaries
Notes to Consolidated Financial Statements
(dollars in thousands, except per share data)
The following tables show the fair value and gross unrealized losses, aggregated by investment category and length of time that individual securities have been in a continuous loss position, as of December 31, 2008 and 2007:
| 2008 | ||||||||||||||||||||||||
| Less than 12 months | 12 months or longer | Total | ||||||||||||||||||||||
| Gross | Gross | Gross | ||||||||||||||||||||||
| Fair | Unrealized | Fair | Unrealized | Fair | Unrealized | |||||||||||||||||||
| Value | (Losses) | Value | (Losses) | Value | (Losses) | |||||||||||||||||||
| U.S. Treasury and government agencies and corporations | $ | - | $ | - | $ | - | $ | - | $ | - | $ | - | ||||||||||||
| State and political subdivisions | 41,901 | (3,109 | ) | 5,937 | (669 | ) | 47,838 | (3,778 | ) | |||||||||||||||
| Corporate notes and other investments | 3,913 | (2,287 | ) | 1,852 | (3,380 | ) | 5,765 | (5,667 | ) | |||||||||||||||
| $ | 45,814 | $ | (5,396 | ) | $ | 7,789 | $ | (4,049 | ) | $ | 53,603 | $ | (9,445 | ) | ||||||||||
| 2007 | ||||||||||||||||||||||||
| Less than 12 months | 12 months or longer | Total | ||||||||||||||||||||||
| Gross | Gross | Gross | ||||||||||||||||||||||
| Fair | Unrealized | Fair | Unrealized | Fair | Unrealized | |||||||||||||||||||
| Value | (Losses) | Value | (Losses) | Value | (Losses) | |||||||||||||||||||
| U.S. Treasury and government agencies and corporations | $ | 2,973 | $ | (27 | ) | $ | 31,580 | $ | (93 | ) | $ | 34,553 | $ | (120 | ) | |||||||||
| State and political subdivisions | 7,143 | (202 | ) | 26,959 | (180 | ) | 34,102 | (382 | ) | |||||||||||||||
| Corporate notes and other investments | 8,988 | (1,214 | ) | 8,743 | (817 | ) | 17,731 | (2,031 | ) | |||||||||||||||
| $ | 19,104 | $ | (1,443 | ) | $ | 67,282 | $ | (1,090 | ) | $ | 86,386 | $ | (2,533 | ) | ||||||||||
As of December 31, 2008, the available for sale investment portfolio included 20 municipal securities and 4 corporate notes with current unrealized losses that have existed for longer than one year. The majority of the municipal obligations are with Iowa communities considered to be acceptable credit risks. Because the declines in fair value were due to changes in market conditions, not in estimated cash flows, and the Company has the ability and the intent to hold these securities for a period of time sufficient to allow for a recovery, which may be at maturity, no other-than-temporary impairment was recorded at December 31, 2008 or 2007 on the above securities.
During 2008, the Company recognized a $1,800 write-down of an investment in a senior unsecured note issued by Lehman Brothers Holdings, Inc., resulting in an “other-than-temporary” impairment. The carrying value of the $2,000 note was written down to $200. Additionally, during 2008, the Company recognized “other-than-temporary” impairments of $2,622 and $317, respectively, on a pooled trust preferred security and on an investment in a trust that holds common stock of community bank holding companies. The carrying values of the securities were written down to $2,325 and $183, respectively, based upon estimated cash flows to be received over the life of the securities. Income accruals for these securities have been suspended.
43
West Bancorporation, Inc. and Subsidiaries
Notes to Consolidated Financial Statements
(dollars in thousands, except per share data)
The amortized cost and fair value of securities available for sale as of December 31, 2008 and 2007 by contractual maturity are shown below:
| 2008 | ||||||||
| Amortized | Fair | |||||||
| Cost | Value | |||||||
| Due in one year or less | $ | 4,176 | $ | 3,696 | ||||
| Due after one year through five years | 50,528 | 52,240 | ||||||
| Due after five years through ten years | 58,580 | 56,798 | ||||||
| Due after ten years | 74,166 | 68,700 | ||||||
| $ | 187,450 | $ | 181,434 | |||||
For the years ended December 31, 2008, 2007, and 2006, proceeds from sales of securities available for sale amounted to $9,854, $9,983, and $22,433, respectively. Gross security gains of $73, $21, and $10 were realized for the years ended December 31, 2008, 2007, and 2006, respectively. There were no security losses realized for the year ended December 31, 2008. Gross security losses of $16 and $181 were realized for the years ended December 31, 2007, and 2006, respectively.
Securities with an amortized cost of approximately $161,765 and $192,666 as of December 31, 2008 and 2007, respectively, were pledged as collateral on the Treasury Tax and Loan option notes, securities sold under agreements to repurchase, and for other purposes as required or permitted by law or regulation. Securities sold under agreements to repurchase are held in safekeeping on behalf of the Company.
The components of other comprehensive income (loss), net unrealized gains (losses) on securities available for sale, net of tax for the years ended December 31, 2008, 2007, and 2006, are as follows:
| 2008 | 2007 | 2006 | ||||||||||
| Unrealized holding gains (losses) arising during the period | $ | (9,907 | ) | $ | 1,787 | $ | 1,190 | |||||
| Realized net (gains) losses reclassified into net income | (73 | ) | (5 | ) | 171 | |||||||
| Realized impairment losses reclassified into net income | 4,739 | - | - | |||||||||
| Other comprehensive income (loss), net unrealized gains (losses) on securities available for sale before tax (expense) credit | (5,241 | ) | 1,782 | 1,361 | ||||||||
| Tax (expense) credit | 1,989 | (675 | ) | (516 | ) | |||||||
| Other comprehensive income (loss), net unrealized gains (losses) on securities available for sale, net of tax | $ | (3,252 | ) | $ | 1,107 | $ | 845 | |||||
44
West Bancorporation, Inc. and Subsidiaries
Notes to Consolidated Financial Statements
(dollars in thousands, except per share data)
| Note 3. | Loans and Allowance for Loan Losses |
Loans consist of the following as of December 31, 2008 and 2007:
| 2008 | 2007 | |||||||
| Commercial | $ | 391,926 | $ | 364,994 | ||||
| Real estate: | ||||||||
| Construction, land and land development | 152,704 | 153,184 | ||||||
| 1-4 family residential | 103,134 | 91,714 | ||||||
| Commercial | 441,444 | 360,255 | ||||||
| Consumer and other loans | 11,884 | 13,790 | ||||||
| 1,101,092 | 983,937 | |||||||
| Net unamortized fees and costs | 357 | 372 | ||||||
| $ | 1,100,735 | $ | 983,565 | |||||
The loan portfolio includes approximately $589,469 and $514,467 of fixed rate loans and $511,623 and $469,470 of variable rate loans as of December 31, 2008 and 2007, respectively.
Loans of approximately $117 and $190 as of December 31, 2008 and 2007, respectively, were pledged as collateral on the Treasury, Tax and Loan option notes and for other purposes as required or permitted by regulation.
Changes in the allowance for loan losses were as follows for the years ended December 31, 2008, 2007, and 2006:
| 2008 | 2007 | 2006 | ||||||||||
| Balance, at beginning of year | $ | 8,935 | $ | 8,494 | $ | 7,615 | ||||||
| Provision for loan losses | 16,600 | 2,350 | 1,725 | |||||||||
| Recoveries | 276 | 233 | 294 | |||||||||
| Charge-offs | (10,370 | ) | (2,142 | ) | (1,140 | ) | ||||||
| Balance, at end of year | $ | 15,441 | $ | 8,935 | $ | 8,494 | ||||||
A loan is impaired when it is probable that West Bank will be unable to collect all contractual principal and interest payments due in accordance with the terms of the loan agreement. Impaired loans are measured based on the present value of expected future cash flows discounted at the loan’s effective interest rate or at the fair value of the collateral if the loan is collateral dependent. The amount of the impairment is included in the allowance for loan losses. The following is a recap of impaired loans at December 31, 2008 and 2007:
| 2008 | 2007 | |||||||
| Impaired loans without an allowance | $ | 18,067 | $ | 5,469 | ||||
| Impaired loans with an allowance | 23,044 | - | ||||||
| Total impaired loans | $ | 41,111 | $ | 5,469 | ||||
| Allowance for loan losses related to impaired loans | $ | 3,590 | $ | - | ||||
45
West Bancorporation, Inc. and Subsidiaries
Notes to Consolidated Financial Statements
(dollars in thousands, except per share data)
The following table reconciles the balance of non-accrual loans with impaired loans carried at fair value as of December 31, 2008 and 2007:
| 2008 | 2007 | |||||||
| Non-accrual loans | $ | 21,367 | $ | 5,469 | ||||
| Restructured loans | 7,376 | - | ||||||
| Other impaired loans still accruing interest | 12,368 | - | ||||||
| Total impaired loans | $ | 41,111 | $ | 5,469 | ||||
The balance of impaired loans at December 31, 2008, was comprised of 40 different borrowers and the balance of impaired loans at December 31, 2007, was comprised of 11 different borrowers. West Bank has no commitments to advance additional funds on either of the two restructured loans.
The average recorded investments in impaired loans during 2008, 2007, and 2006 totaled approximately $13,664, $1,023, and $4,070, respectively. Interest income forgone on impaired loans was approximately $795 during 2008, $70 during 2007, and $306 during 2006. Interest income recognized on impaired loans was an immaterial amount in 2008, 2007, and 2006. Loans past due 90 days or more and still accruing interest totaled $92 and $408 at December 31, 2008 and 2007, respectively. Other real estate owned as the result of loan foreclosures totaled $4,352 and $155 at December 31, 2008 and 2007, respectively.
The Company has had, and may be expected to have in the future, banking transactions in the ordinary course of business with directors, executive officers, their immediate families, and affiliated companies in which they are principal stockholders (commonly referred to as related parties), all of which have been, in the opinion of management, on the same terms, including interest rates and collateral, as those prevailing at the time for comparable transactions with unrelated parties.
Loan transactions with related parties were as follows for the years ended December 31, 2008 and 2007:
| 2008 | 2007 | |||||||
| Balance, beginning of year | $ | 14,586 | $ | 18,426 | ||||
| New loans | 13,563 | 9,176 | ||||||
| Repayments | (6,036 | ) | (8,658 | ) | ||||
| Change in classification | 333 | (4,358 | ) | |||||
| Balance, end of year | $ | 22,446 | $ | 14,586 | ||||
| Note 4. | Premises and Equipment, Net |
Premises and equipment consisted of the following as of December 31, 2008 and 2007:
| 2008 | 2007 | |||||||
| Land | $ | 1,251 | $ | 1,251 | ||||
| Building | 787 | 777 | ||||||
| Furniture and equipment | 5,572 | 5,519 | ||||||
| Leasehold improvements | 1,974 | 1,737 | ||||||
| 9,584 | 9,284 | |||||||
| Accumulated depreciation | 4,668 | 4,103 | ||||||
| $ | 4,916 | $ | 5,181 | |||||
46
West Bancorporation, Inc. and Subsidiaries
Notes to Consolidated Financial Statements
(dollars in thousands, except per share data)
| Note 5. | Goodwill and Other Intangible Assets |
Goodwill and other intangible assets resulted from the acquisitions of Hawkeye State Bank, VMF Capital, L.L.C., and Investors Management Group.
Goodwill is the excess of the cash paid over the net fair value of assets acquired and liabilities assumed in an acquisition, less the amount of identifiable intangible assets. Goodwill is not amortized, but, at a minimum, is evaluated annually for impairment. The Company has determined that there is no impairment of goodwill.
Other intangible assets are those that can be separately identified and assigned a value. Other intangible assets are amortized over their estimated lives using an appropriate amortization method. The Company is using the straight-line method to amortize the core deposit intangible by deposit category and employment/noncompete contracts and accelerated methods to amortize the intangible assets associated with client lists. The value of the core deposit intangible was determined according to four major deposit categories: noninterest-bearing demand deposits, interest-bearing demand deposits, savings deposits, and money market deposits. A separate estimated life was determined for each category, ranging from four to eight years. The intangible assets associated with employment/noncompete contracts and client lists are being amortized over estimated lives, which range from four to ten years.
The gross carrying amount of intangible assets and the accumulated amortization at December 31, 2008 and 2007 are presented in the following table:
| 2008 | 2007 | |||||||||||||||
| Accumulated | Accumulated | |||||||||||||||
| Gross | Amortization | Gross | Amortization | |||||||||||||
| Goodwill | $ | 24,930 | $ | - | $ | 24,930 | $ | - | ||||||||
| Amortizing intangible assets: | ||||||||||||||||
| Core deposit | $ | 1,680 | $ | 1,203 | $ | 1,680 | $ | 965 | ||||||||
| Client base | 2,508 | 1,665 | 2,508 | 1,274 | ||||||||||||
| Employment/noncompete contracts | 502 | 418 | 502 | 320 | ||||||||||||
| Total other intangible assets | $ | 4,690 | $ | 3,286 | $ | 4,690 | $ | 2,559 | ||||||||
47
West Bancorporation, Inc. and Subsidiaries
Notes to Consolidated Financial Statements
(dollars in thousands, except per share data)
Amortization expense for the years ended December 31, 2008, 2007, and 2006 totaled $727, $856, and $884, respectively. The future scheduled amortization as of December 31, 2008 is as follows:
| Employment/ | ||||||||||||||||
| Noncompete | ||||||||||||||||
| Core Deposit | Client Base | Contracts | Total | |||||||||||||
| 2009 | $ | 205 | $ | 288 | $ | 84 | $ | 577 | ||||||||
| 2010 | 148 | 208 | - | 356 | ||||||||||||
| 2011 | 124 | 126 | - | 250 | ||||||||||||
| 2012 | - | 92 | - | 92 | ||||||||||||
| 2013 | - | 55 | - | 55 | ||||||||||||
| Thereafter | - | 74 | - | 74 | ||||||||||||
| $ | 477 | $ | 843 | $ | 84 | $ | 1,404 | |||||||||
| Deposits |
At December 31, 2008, the scheduled maturities of time deposits were as follows:
| $ | 589,083 | |||
| 2010 | 25,477 | |||
| 2011 | 9,603 | |||
| 2012 | 11,301 | |||
| 2013 and thereafter | 8,777 | |||
| $ | 644,241 |
Time deposits included $326,497 of Certificate of Deposit Account Registry Service (CDARS) deposits, which is a program that coordinates a network of banks to spread deposits exceeding the FDIC insurance coverage limits out to numerous institutions in order to provide insurance coverage for all participating deposits. Total CDARS deposits included $157,333 of wholesale deposits which are used by the Company as an alternative source of funds. Wholesale deposits come through intermediaries acting on behalf of the ultimate depositor.
| Note 7. | Other Short-Term Borrowings |
Short-term borrowings as of December 31, 2008 and 2007 consisted of Treasury, Tax and Loan option notes. The Treasury, Tax and Loan option notes are collateralized by certain loans and investment securities.
| Note 8. | Subordinated Notes |
On July 18, 2003, the Company obtained $20,619 in trust preferred securities from its participation in the issuance of a pooled trust preferred security. The security has a 30-year maturity, does not require any principal amortization, and is callable in 2010 at par at the issuer’s option. The interest rate is fixed until 2010 at 6.975% and then becomes variable based on the three-month LIBOR rate plus 3.05%. Interest is payable quarterly. The effective cost of this security, including amortization of the discount fee, is 7.14%. Holders of the subordinated notes have no voting rights, are unsecured, and rank junior in priority to all of the Company’s indebtedness and senior to the Company’s common and preferred stock. See Note 1 for a discussion of the accounting principles related to this debt.
48
West Bancorporation, Inc. and Subsidiaries
Notes to Consolidated Financial Statements
(dollars in thousands, except per share data)
| Note 9. | Long-Term Borrowings |
The following table presents the balance of the long-term debt at December 31, 2008 and 2007, and the related rates:
| 2008 | 2007 | |||||||
| Federal Home Loan Bank advances; interest due monthly with rates ranging from 2.70% to 5.96% | $ | 125,000 | $ | 100,000 | ||||
| Note payable, correspondent bank, interest due quarterly; interest rate 5.50% at December 31, 2007 | - | 3,000 | ||||||
| Total long-term borrowings | $ | 125,000 | $ | 103,000 | ||||
The Federal Home Loan Bank (FHLB) advances are collateralized by FHLB stock and real estate loans, as required by the FHLB’s collateral policy. Advances totaling $45,000 are callable on a quarterly basis. An advance of $25,000 with a maturity date of 2016 is first callable in 2009, and is callable on a quarterly basis thereafter. An advance of $30,000 with a maturity date of 2017 is first callable in 2010, and is callable on a quarterly basis thereafter. An advance of $25,000 with a maturity date of 2018 is first callable in 2011, and is callable on a quarterly basis thereafter.
On December 30, 2005, the Company obtained a $10,000 variable rate note payable to a regional correspondent bank. Principal was payable in quarterly installments of $250 plus a final payment which was due on December 30, 2010, with no prepayment penalty, and interest was payable quarterly. During 2008, a $2,000 prepayment was made to pay off the loan, and a line of credit was canceled.
The aggregate annual maturities of long-term debt obligations (based on final maturity dates) as of December 31, 2008 are as follows:
| $ | - | |||
| 2010 | 20,000 | |||
| 2011 | - | |||
| 2012 | - | |||
| 2013 | - | |||
| Thereafter | 105,000 | |||
| Total | $ | 125,000 |
At December 31, 2008, West Bank had arrangements to borrow approximately $78,000 in unsecured federal funds lines of credit at correspondent banks which are available under the correspondent bank’s normal terms. The lines have no stated expiration date. As of December 31, 2008, no balance was outstanding under these arrangements. West Bank also has additional borrowing capacity of approximately $61,000 at the FHLB as of December 31, 2008.
49
West Bancorporation, Inc. and Subsidiaries
Notes to Consolidated Financial Statements
(dollars in thousands, except per share data)
| Note 10. | Income Taxes |
The Company files income tax returns in the U.S. federal and Iowa and Utah State jurisdictions. Income tax returns for the years 2005 through 2008, with few exceptions, remain open to examination by Federal and State taxing authorities.
The Company recognizes interest and penalties related to unrecognized tax benefits in other noninterest expense. During the years ended December 31, 2008, 2007, and 2006, the Company recognized no material interest or penalties. No accrued interest or penalties are included in accrued tax expenses in the balance sheet at December 31, 2008 and 2007.
The components of income tax expense consisted of the following for the years ended December 31, 2008, 2007, and 2006:
| 2008 | 2007 | 2006 | ||||||||||
| Current: | ||||||||||||
| Federal | $ | 3,917 | $ | 7,330 | $ | 7,652 | ||||||
| State | 918 | 1,144 | 1,345 | |||||||||
| Deferred: | ||||||||||||
| Federal | (3,109 | ) | 48 | 132 | ||||||||
| State | (102 | ) | (46 | ) | (1 | ) | ||||||
| $ | 1,624 | $ | 8,476 | $ | 9,128 | |||||||
Total income tax expense differed from the amounts computed by applying the U.S. federal income tax rate of 35% to income before income taxes as a result of the following:
| Years Ended December 31, | ||||||||||||||||||||||||
| 2008 | 2007 | 2006 | ||||||||||||||||||||||
| Percent | Percent | Percent | ||||||||||||||||||||||
| of Pretax | of Pretax | of Pretax | ||||||||||||||||||||||
| Amount | Income | Amount | Income | Amount | Income | |||||||||||||||||||
| Computed expected tax expense | $ | 3,241 | 35.0 | % | $ | 9,589 | 35.0 | % | $ | 9,987 | 35.0 | % | ||||||||||||
| State income tax, net of federal income tax benefit | 495 | 5.3 | 698 | 2.5 | 873 | 3.1 | ||||||||||||||||||
| Tax-exempt interest income | (1,700 | ) | (18.4 | ) | (1,525 | ) | (5.6 | ) | (1,668 | ) | (5.8 | ) | ||||||||||||
| Nondeductible interest expense to own tax-exempts | 187 | 2.0 | 265 | 1.0 | 283 | 1.0 | ||||||||||||||||||
| Tax-exempt increase in cash value of life insurance | (327 | ) | (3.5 | ) | (311 | ) | (1.1 | ) | (300 | ) | (1.1 | ) | ||||||||||||
| Valuation allowance for capital loss carryover | 111 | 1.2 | - | - | - | - | ||||||||||||||||||
| New market tax credit | (228 | ) | (2.4 | ) | (228 | ) | (0.8 | ) | - | - | ||||||||||||||
| Other, net | (155 | ) | (1.7 | ) | (12 | ) | (0.1 | ) | (47 | ) | (0.2 | ) | ||||||||||||
| $ | 1,624 | 17.5 | % | $ | 8,476 | 30.9 | % | $ | 9,128 | 32.0 | % | |||||||||||||
50
West Bancorporation, Inc. and Subsidiaries
Notes to Consolidated Financial Statements
(dollars in thousands, except per share data)
The tax effects of temporary differences that give rise to net deferred tax assets consist of the following as of December 31, 2008 and 2007:
| 2008 | 2007 | |||||||
| Deferred tax assets: | ||||||||
| Allowance for loan losses | $ | 5,868 | $ | 3,395 | ||||
| Net unrealized losses on securities available for sale | 2,286 | 297 | ||||||
| Investment security impairment | 997 | - | ||||||
| State net operating loss carryforward | 259 | 177 | ||||||
| Capital loss carryforward | 130 | - | ||||||
| Other | 548 | 253 | ||||||
| 10,088 | 4,122 | |||||||
| Deferred tax liabilities: | ||||||||
| Net deferred loan fees and costs | 358 | 312 | ||||||
| Intangibles | 2,676 | 2,515 | ||||||
| Premises and equipment | 374 | 370 | ||||||
| Loans | 266 | 133 | ||||||
| Other | 164 | 132 | ||||||
| 3,838 | 3,462 | |||||||
| Net deferred tax asset before valuation allowance | 6,250 | 660 | ||||||
| Valuation allowance for deferred tax asset | (389 | ) | - | |||||
| Net deferred tax asset | $ | 5,861 | $ | 660 | ||||
The Company has approximately $4,307 of state operating loss carryforwards available to the Holding Company and WB Capital to offset future state taxable income. The Company has approximately $317 of capital loss carryforwards available to offset future capital gains. The Company has recorded a valuation allowance against the tax effect of the state net operating loss and federal and state capital loss carryforwards as management believes it is more likely than not that such carryforwards will expire without being utilized. The state operating loss carryforwards expire in 2019 and thereafter and the capital loss carryforwards expire five years after recognition for tax purposes.
| Note 11. | Regulatory Capital Requirements |
The Company and West Bank are subject to various regulatory capital requirements administered by Federal and State banking agencies. Failure to meet minimum capital requirements can result in certain mandatory and possibly additional discretionary actions by regulators which, if undertaken, could have a direct material effect on the Company’s consolidated financial statements. Under capital adequacy guidelines and regulatory framework for prompt corrective action, the Company and West Bank must meet specific capital guidelines that involve quantitative measures of their assets, liabilities, and certain off-balance-sheet items as calculated under regulatory accounting practices. The Company’s and West Bank’s capital amounts and classification are also subject to qualitative judgments by the regulators about components, risk weightings, and other factors.
Quantitative measures established by regulation to ensure capital adequacy require the Company and West Bank to maintain minimum amounts and ratios (set forth in the following table) of total and Tier I capital to risk-weighted assets and of Tier I capital to average assets. Management believes the Company and Bank met all capital adequacy requirements to which they were subject as of December 31, 2008. Prompt corrective action provisions are not applicable to the Holding Company.
51
West Bancorporation, Inc. and Subsidiaries
Notes to Consolidated Financial Statements
(dollars in thousands, except per share data)
As of December 31, 2008, the most recent notification from regulatory agencies categorized West Bank as well-capitalized under the regulatory framework for prompt corrective action. There are no conditions or events since that notification that management believes have changed West Bank’s category.
The Company’s and West Bank’s capital amounts and ratios are presented in the following table:
| To Be Well- | ||||||||||||||||||||||||
| Capitalized Under | ||||||||||||||||||||||||
| For Capital | Prompt Corrective | |||||||||||||||||||||||
Actual | Adequacy Purposes | Action Provisions | ||||||||||||||||||||||
Amount | Ratio | Amount | Ratio | Amount | Ratio | |||||||||||||||||||
| As of December 31, 2008: | ||||||||||||||||||||||||
Total Capital (to Risk-Weighted Assets) | ||||||||||||||||||||||||
| Consolidated | $ | 165,458 | 13.3 | % | $ | 99,383 | 8.0 | % | n/a | n/a | ||||||||||||||
| West Bank | 161,790 | 13.1 | 99,073 | 8.0 | $ | 123,841 | 10.0 | % | ||||||||||||||||
Tier I Capital (to Risk-Weighted Assets) | ||||||||||||||||||||||||
| Consolidated | 150,017 | 12.1 | 49,692 | 4.0 | n/a | n/a | ||||||||||||||||||
| West Bank | 136,349 | 11.0 | 49,536 | 4.0 | 74,305 | 6.0 | ||||||||||||||||||
Tier I Capital (to Average Assets) | ||||||||||||||||||||||||
| Consolidated | 150,017 | 10.3 | 58,244 | 4.0 | n/a | n/a | ||||||||||||||||||
| West Bank | 136,349 | 9.4 | 58,066 | 4.0 | 72,583 | 5.0 | ||||||||||||||||||
| As of December 31, 2007: | ||||||||||||||||||||||||
Total Capital (to Risk-Weighted Assets) | ||||||||||||||||||||||||
| Consolidated | $ | 123,912 | 11.1 | % | $ | 89,096 | 8.0 | % | n/a | n/a | ||||||||||||||
| West Bank | 119,604 | 10.8 | 88,747 | 8.0 | $ | 110,934 | 10.0 | % | ||||||||||||||||
Tier I Capital (to Risk- Weighted Assets) | ||||||||||||||||||||||||
| Consolidated | 114,977 | 10.3 | 44,548 | 4.0 | n/a | n/a | ||||||||||||||||||
| West Bank | 100,669 | 9.1 | 44,374 | 4.0 | 66,560 | 6.0 | ||||||||||||||||||
Tier I Capital (to Average Assets) | ||||||||||||||||||||||||
| Consolidated | 114,977 | 8.9 | 51,486 | 4.0 | n/a | n/a | ||||||||||||||||||
| West Bank | 100,669 | 7.9 | 51,316 | 4.0 | 64,145 | 5.0 | ||||||||||||||||||
West Bank is restricted as to the amount of dividends that may be paid to the Holding Company without prior regulatory approval. West Bank may not pay dividends that would result in its capital levels being reduced below the minimum requirements. As of December 31, 2008, West Bank had approximately $30,677 of retained earnings available for dividends.
52
West Bancorporation, Inc. and Subsidiaries
Notes to Consolidated Financial Statements
(dollars in thousands, except per share data)
| Note 12. | Stockholders’ Equity and Earnings per Common Share |
Preferred Stock: On December 23, 2008, the shareholders of the Company approved a proposal to amend the Company’s Restated Articles of Incorporation to authorize a class of 50 million shares of preferred stock.
On December 31, 2008, the Company issued 36,000 shares of perpetual cumulative senior preferred stock to the U.S. Department of the Treasury (the Treasury) under the Capital Purchase Program (CPP). The preferred stock has a par value of $0.01 per share and a liquidation preference of $1,000 per share, or $36,000. Dividends are payable quarterly at the rate of five percent per annum until the fifth anniversary date of the issuance and at a rate of nine percent per annum thereafter. The dividends are computed on the basis of a 360-day year consisting of twelve 30-day months. The dividends are payable quarterly in arrears on February 15, May 15, August 15, and November 15 of each year.
The senior preferred stock is non-voting, other than class voting rights on any authorization or issuance of shares ranking senior to the senior preferred stock, any amendment to the rights of senior preferred stock, or any merger, exchange, or similar transaction that would adversely affect the rights of the senior preferred stock. If dividends are not paid in full for six dividend periods, whether or not consecutive, the Treasury will have the right to elect two directors to the Company’s Board. The right to elect directors would end when full dividends have been paid for four consecutive dividend periods.
Effective February 17, 2009, the American Recovery and Reinvestment Act of 2009 (AARA) eliminates the restrictions on the source of repayment and the waiting period. The AARA allows the Company the option to repay the funds received under the CPP without regard to whether the Company has replaced the funds from other sources or any waiting period, subject to consultation with the Federal Reserve and the FDIC.
The CPP requires that the Company be subject to Treasury standards for executive compensation and corporate governance as long as any obligation arising from financial assistance provided under the statute remains outstanding. The CPP requires that the Treasury’s preferred stock be the senior debt of the Company for any future borrowings. The Congress and Treasury may create additional provisions that could become retroactively applicable to the preferred stock.
Common Stock: On April 16, 2008, and April 18, 2007, respectively, the Board of Directors authorized the buyback of the Company’s common stock for a period of 12 months, in amounts not to exceed $5,000 each. During the 2007 authorization period, 74,500 shares were purchased at a cost of $974 in the fourth quarter of 2007, and 58,300 shares were purchased at a cost of $789 in the first quarter of 2008. No shares have been purchased since the 2008 authorization. Under the CPP, the Treasury’s consent is required for any share repurchases of common stock until December 31, 2011, unless the senior preferred stock has been redeemed or the Treasury has transferred all of the senior preferred stock to third parties.
Any proposed dividend increase above the quarterly dividend amount paid in the quarter ended September 30, 2008, is subject to the approval of the Treasury until December 31, 2011, unless the senior preferred stock has been redeemed or the Treasury has transferred all of the senior preferred stock to third parties.
On April 12, 2005, shareholders approved the West Bancorporation, Inc. Restricted Stock Compensation Plan. The plan provides awards to be made until March 1, 2015, with a maximum of 300,000 shares purchased in the open market to be issued as awards, subject to certain restrictions. The Compensation Committee of the Company’s Board of Directors administers the Plan. As of December 31, 2008, no awards had been granted under this plan.
53
West Bancorporation, Inc. and Subsidiaries
Notes to Consolidated Financial Statements
(dollars in thousands, except per share data)
Common Stock Warrants: In connection with the CPP described above, a common stock warrant exercisable for 474,100 shares of common stock was issued and is exercisable on or before December 31, 2018. The warrant entitles the Treasury to purchase 474,100 shares of common stock at $11.39 per share. The difference between the market value of a share of common stock and the exercise price of a share of common stock under the warrant was $0.86 per share as of December 31, 2008. If the Company issues common stock with aggregate gross proceeds of $36,000 or more prior to December 31, 2009, the number of common shares underlying the warrant is reduced to 237,050 shares. Per the ARRA, if the Company repays the CPP funds in full, the Treasury would be required to liquidate the warrant at the current market price.
As holder of the common stock warrant, the Treasury is not entitled to vote, to receive dividends, or to exercise any other rights of common shareholders for any purpose until such warrants have been duly exercised. The Treasury has agreed not to exercise voting power with respect to any shares of common stock issued upon exercise. The Company intends to file and maintain at all times during the period the preferred stock is outstanding and during the period the warrant is exercisable, a “shelf” registration statement relating to the issuance of common shares underlying the warrant for the benefit of the warrant holder.
Earnings per Common Share: The calculation of earnings per common share and diluted earnings per common share for 2008, 2007, and 2006 is presented below. See Note 1, Organization and Nature of Business and Summary of Significant Accounting Policies, for a discussion on the calculation of earnings per common share.
| 2008 | 2007 | 2006 | ||||||||||
| Earnings per common share: | ||||||||||||
| Net income | $ | 7,636 | $ | 18,920 | $ | 19,407 | ||||||
| Preferred stock dividends* | - | - | - | |||||||||
| Preferred stock discount accretion* | - | - | - | |||||||||
| Net income available to common shareholders | $ | 7,636 | $ | 18,920 | $ | 19,407 | ||||||
| Weighted average common shares outstanding | 17,405 | 17,536 | 17,537 | |||||||||
| Earnings per common share | $ | 0.44 | $ | 1.08 | $ | 1.11 | ||||||
| Diluted earnings per common share: | ||||||||||||
| Net income available to common shareholders | $ | 7,636 | $ | 18,920 | $ | 19,407 | ||||||
| Weighted average common shares outstanding | 17,405 | 17,536 | 17,537 | |||||||||
| Effect of dilutive securities: | ||||||||||||
| Common stock warrant* | - | - | - | |||||||||
| Total diluted average common shares issued and outstanding | 17,405 | 17,536 | 17,537 | |||||||||
| Diluted earnings per common share | $ | 0.44 | $ | 1.08 | $ | 1.11 | ||||||
*Preferred stock and the common stock warrant were issued on December 31, 2008, and therefore had no effect in 2008.
| Note 13. | Commitments and Contingencies |
The Company leases real estate under several noncancelable operating lease agreements. Rent expense related to these leases was approximately $1,574, $1,627, and $1,494 for the years ended December 31, 2008, 2007, and 2006, respectively.
54
West Bancorporation, Inc. and Subsidiaries
Notes to Consolidated Financial Statements
(dollars in thousands, except per share data)
The approximate total minimum rental commitments as of December 31, 2008 consisted of the following:
| 2009 | $ | 1,748 | ||
| 2010 | 1,635 | |||
| 2011 | 1,211 | |||
| 2012 | 1,147 | |||
| 2013 | 1,147 | |||
| Thereafter | 9,217 | |||
| $ | 16,105 |
Required reserve balances: West Bank is required to maintain an average reserve balance with the Federal Reserve Bank which is included in cash and due from banks. Required reserve balances were approximately $2,323 and $1,001 as of December 31, 2008 and 2007, respectively.
Financial instruments with off-balance-sheet risk: The Company is party to financial instruments with off-balance-sheet risk in the normal course of business to meet the financing needs of its customers. These financial instruments include commitments to extend credit and standby letters of credit. These instruments involve, to varying degrees, elements of credit risk in excess of the amount recognized in the consolidated balance sheets.
The Company’s exposure to credit loss in the event of nonperformance by the other party to the financial instrument for commitments to extend credit and standby letters of credit is represented by the contractual amount of those instruments. The Company uses the same credit policies in making commitments and conditional obligations as it does for on-balance-sheet instruments. The Company’s commitments as of December 31, 2008 and 2007 consisted of the following approximate amounts:
| 2008 | 2007 | |||||||
| Commitments to extend credit | $ | 301,214 | $ | 330,769 | ||||
| Standby letters of credit | 19,788 | 22,682 | ||||||
| $ | 321,002 | $ | 353,451 | |||||
Commitments to extend credit are agreements to lend to a customer as long as there is no violation of any condition established in the contract. Commitments to extend credit generally expire within one year. Home equity commitments to extend credit of approximately $8,637 at December 31, 2008, expire within 10 years. Since many of the commitments are expected to expire without being drawn upon, the total commitment amounts do not necessarily represent future cash requirements. The Company evaluates each customer’s creditworthiness on a case-by-case basis. The amount of collateral obtained is based on management’s credit evaluation of the party. Collateral held varies, but may include accounts receivable, inventory, property and equipment, residential real estate, and commercial properties.
Standby letters of credit are conditional commitments issued by the Company to guarantee the performance of a customer to a third party, and generally expire within one year. Those guarantees are primarily issued to support public and private borrowing arrangements. The credit risk involved in issuing letters of credit is essentially the same as that involved in extending loan facilities to customers. Collateral held varies as specified above, and is required in instances the Company deems necessary. In the event the customer does not perform in accordance with the terms of the agreement with the third party, West Bank would be required to fund the commitment. The maximum potential amount of future payments West Bank could be required to make is represented by the contractual amount for letters of credit shown in the table above. If the commitment is funded, West Bank would be entitled to seek recovery from the customer. At December 31, 2008 and 2007, no amounts have been recorded as liabilities for West Bank’s potential obligations under these guarantees.
55
West Bancorporation, Inc. and Subsidiaries
Notes to Consolidated Financial Statements
(dollars in thousands, except per share data)
Concentrations of credit risk: Substantially all of the Company’s loans, commitments to extend credit, and standby letters of credit have been granted to customers in the Company’s market area (a 50-mile radius of the greater Des Moines, Iowa, metropolitan area and a 30-mile radius of the Iowa City, Iowa, metropolitan area). Securities issued by State and political subdivisions primarily involve governmental entities within the state of Iowa. The concentrations of credit by type of loan are set forth in Note 3. The distribution of commitments to extend credit approximates the distribution of loans outstanding. Standby letters of credit were granted primarily to commercial borrowers.
Contingencies: In the normal course of business, the Company is involved in various legal proceedings. In the opinion of management, any liability resulting from such proceedings would not have a material adverse effect on the consolidated financial statements.
| Note 14. | Employee Savings and Stock Ownership Plan |
The Company has an employee savings and stock ownership plan covering substantially all of its employees. The plan consists of two components. One component is an employee stock ownership plan. The other component is a profit sharing plan. Both components have qualified cash or deferred arrangement under Internal Revenue Code Section 401(k). The purpose of the plan is to offer participants a systematic program for the accumulation of retirement and savings income, as well as a means by which to obtain beneficial interest of ownership in company stock. The stock ownership component of the plan, which is optional, is intended to invest exclusively in common stock of the Company.
The contributions made by the Company to the profit sharing component are determined annually by the Board of Directors. Profit sharing expense for the years ended December 31, 2008, 2007, and 2006 totaled approximately $276, $436, and $522, respectively.
The plan allows eligible employees to defer a portion of their compensation ranging from 1% to the maximum dollar amount allowed by current law. The Company is required to match a portion of the employees’ contributions. Beginning January 1, 2007, the Company’s match is 100% of the first 3% of employee deferrals and 50% of the next 2% of employee deferrals. Prior to January 1, 2007, the Company’s match was 100% of the first 2% of employee deferrals and 50% of the next 2% of employee deferrals. Beginning January 1, 2007, forfeitures are used to reduce employer contributions. Expense for the years ended December 31, 2008, 2007, and 2006 totaled approximately $360, $308, and $273, respectively.
As of December 31, 2008 and 2007, the plan held 263,322 and 255,524 shares, respectively, of Company stock. These shares are included in the computation of earnings per share. Dividends on shares held in the plan may be reinvested in Company stock or paid in cash to the participants, at the election of the participants.
56
West Bancorporation, Inc. and Subsidiaries
Notes to Consolidated Financial Statements
(dollars in thousands, except per share data)
| Note 15. | Fair Value Measurements |
Effective January 1, 2008, the Company partially adopted SFAS No. 157, Fair Value Measurements, which defines fair value, establishes a framework for measuring fair value, and expands disclosure for those assets and liabilities carried in the balance sheet on a fair value basis. The FASB has deferred the effective date of SFAS No. 157 until 2009 for nonfinancial assets and nonfinancial liabilities which are recognized at fair value on a nonrecurring basis. For the Company, this deferral applies to other real estate owned, goodwill, and intangible assets.
In October 2008, the FASB issued FSP No. 157-3, Determining the Fair Value of a Financial Asset in a Market that is not Active, which amended SFAS No. 157. The FSP, which was effective September 30, 2008, clarifies how the fair value of a financial instrument is determined when the market for that financial asset is inactive.
The Company’s balance sheet contains securities available for sale that are recorded at fair value on a recurring basis. SFAS No. 157 requires that assets and liabilities carried at fair value be classified and disclosed according to the process for determining fair value. There are three levels of determining fair value.
Level 1 uses quoted market prices in active markets for identical assets or liabilities.
Level 2 uses observable market based inputs or unobservable inputs that are corroborated by market data.
Level 3 uses unobservable inputs that are not corroborated by market data.
When available, quoted market prices are used to determine the fair value of investment securities and such items are classified within Level 1 of the fair value hierarchy. An example is U.S. Treasury securities. For other securities, the Company determines fair value based on various sources and may apply matrix pricing with observable prices for similar bonds where a price for the identical bond is not observable. Securities measured at fair value by such methods are classified as Level 2. Certain securities are not valued based on observable transactions and are, therefore, classified as Level 3. The fair value of these securities is based on management’s best estimates.
The following table presents the balances of assets measured at fair value on a recurring basis by level as of December 31, 2008:
| Quoted Prices | ||||||||||||||||
| in Active Markets | Significant Other | Significant | ||||||||||||||
| for Identical Assets | Observable Inputs | Unobservable Inputs | ||||||||||||||
| Description | Total | (Level 1) | (Level 2) | (Level 3) | ||||||||||||
| Assets: | ||||||||||||||||
| Securities available for sale | $ | 181,434 | $ | 2,047 | $ | 177,062 | $ | 2,325 | ||||||||
| Total | $ | 181,434 | $ | 2,047 | $ | 177,062 | $ | 2,325 | ||||||||
57
West Bancorporation, Inc. and Subsidiaries
Notes to Consolidated Financial Statements
(dollars in thousands, except per share data)
The following table presents changes in securities available for sale with significant unobservable inputs (Level 3) for the year ended December 31, 2008:
| Securities Available | ||||
| for Sale | ||||
| Beginning balance | $ | - | ||
| Transfer into level 3 | 4,100 | |||
| Total gains or losses: | ||||
| Included in earnings | (2,622 | ) | ||
| Included in other comprehensive income | 900 | |||
| Principal payments | (53 | ) | ||
| Ending balance | $ | 2,325 | ||
The table above includes one pooled trust preferred security which was transferred to Level 3 during 2008. Market pricing for this security varies widely from one pricing service to another based on a lack of trading so it was considered to no longer have readily observable market data. The fair value as of December 31, 2008, was determined by discounting the expected cash flows over the life of the security. The discount rate was determined by deriving a discount rate when the markets were considered more active for this type of security. To this estimated discount rate, additions were made for more illiquid markets and increased credit risk.
Certain assets are measured at fair value on a nonrecurring basis; that is, they are subject to fair value adjustments in certain circumstances (for example, when there is evidence of impairment). The following table presents the assets carried on the balance sheet by level with the SFAS No. 157 valuation hierarchy as of December 31, 2008:
| Quoted Prices | ||||||||||||||||
| in Active Markets | Significant Other | Significant | ||||||||||||||
| for Identical Assets | Observable Inputs | Unobservable Inputs | ||||||||||||||
| Description | Total | (Level 1) | (Level 2) | (Level 3) | ||||||||||||
| Assets: | ||||||||||||||||
| Loans | $ | 19,454 | $ | - | $ | - | $ | 19,454 | ||||||||
| Total | $ | 19,454 | $ | - | $ | - | $ | 19,454 | ||||||||
Impaired loans are evaluated and valued at the time the loan is identified as impaired, at the lower of cost or fair value. Fair value is measured based on the value of the collateral securing these loans and is classified at a Level 3 in the fair value hierarchy. Collateral may be real estate and/or business assets including equipment, inventory and/or accounts receivable and is determined based on appraisals by qualified licensed appraisers hired by the Company. Appraised and reported values may be discounted based on management’s historical knowledge, changes in market conditions from the time of valuation, and/or management’s expertise and knowledge of the client and client’s business.
SFAS 107, Disclosures about Fair Value of Financial Instruments, requires disclosure of the fair value of financial assets and financial liabilities, including those financial assets and financial liabilities that are not measured and reported at fair value on a recurring basis or non-recurring basis. The methodologies for estimating the fair value of financial assets and financial liabilities that are measured at fair value on a recurring or non-recurring basis are discussed above. The methodologies for other financial assets and financial liabilities are discussed below:
Cash and due from banks: The carrying amount approximates fair value.
Federal funds sold and other short-term investments: The carrying amount approximates fair value.
58
West Bancorporation, Inc. and Subsidiaries
Notes to Consolidated Financial Statements
(dollars in thousands, except per share data)
Federal Home Loan Bank stock: The fair value of this restricted stock is estimated at its carrying value and redemption price of $100 per share.
Loans held for sale: The fair values of loans held for sale are based on estimated selling prices.
Loans: Fair values of loans are estimated using discounted cash flow analysis based on observable market interest rates currently being offered for loans with similar terms to borrowers with similar credit quality.
Deposits: The carrying amounts for demand and savings deposits, which represent the amounts payable on demand, approximate their fair values. Fair values for fixed-rate and variable-rate certificates of deposit are estimated using discounted cash flow analysis, based on observable market interest rates currently being offered on certificates with similar terms.
Accrued interest receivable and payable: The fair values of both accrued interest receivable and payable approximate their carrying amounts.
Short-term and long-term borrowings: The carrying amounts of federal funds purchased and securities sold under agreements to repurchase and certain other short-term borrowings approximate their fair values. Fair values of long-term borrowings including subordinated notes are estimated using discounted cash flow analysis, based on observable market interest rates currently being offered with similar terms.
Commitments to extend credit and standby letters of credit: The approximate fair values of commitments and standby letters of credit are based on the fees currently charged to enter into similar agreements, taking into account the remaining terms of the agreements and creditworthiness of the counterparties.
The carrying amounts and approximate fair values are as follows as of December 31, 2008 and 2007:
| 2008 | 2007 | |||||||||||||||
| Carrying | Approximate | Carrying | Approximate | |||||||||||||
| Amount | Fair Value | Amount | Fair Value | |||||||||||||
| Financial assets: | ||||||||||||||||
| Cash and due from banks | $ | 23,712 | $ | 23,712 | $ | 49,529 | $ | 49,529 | ||||||||
| Federal funds sold and other short-term investments | 173,257 | 173,257 | 414 | 414 | ||||||||||||
| Securities available for sale | 181,434 | 181,434 | 231,427 | 231,427 | ||||||||||||
| Federal Home Loan Bank stock | 8,174 | 8,174 | 5,951 | 5,951 | ||||||||||||
| Loans held for sale | 1,018 | 1,022 | 1,858 | 1,858 | ||||||||||||
| Loans, net | 1,085,294 | 1,091,071 | 974,630 | 972,011 | ||||||||||||
| Accrued interest receivable | 6,415 | 6,415 | 7,829 | 7,829 | ||||||||||||
| Financial liabilities: | ||||||||||||||||
| Deposits | 1,154,787 | 1,160,620 | 910,925 | 912,702 | ||||||||||||
Federal funds purchased and securities sold under agreements to repurchase | 93,111 | 93,111 | 166,930 | 166,930 | ||||||||||||
| Other short-term borrowings | 245 | 245 | 2,672 | 2,672 | ||||||||||||
| Accrued interest payable | 3,995 | 3,995 | 4,498 | 4,498 | ||||||||||||
| Subordinated notes | 20,619 | 21,026 | 20,619 | 20,122 | ||||||||||||
| Long-term borrowings | 125,000 | 127,053 | 103,000 | 100,424 | ||||||||||||
| Off-balance-sheet financial instruments: | ||||||||||||||||
| Commitments to extend credit | - | - | - | - | ||||||||||||
| Standby letters of credit | - | - | - | - | ||||||||||||
59
West Bancorporation, Inc. and Subsidiaries
Notes to Consolidated Financial Statements
(dollars in thousands, except per share data)
| Note 16. | Operating Segments |
An operating segment is generally defined as a component of a business for which discrete financial information is available and whose operating results are regularly reviewed by the chief operating decision-maker. The Company’s primary business segments are banking and investment advisory services. The banking segment generates revenue through interest and fees on loans, service charges on deposit accounts, interest on investment securities, and fees for trust services. The banking segment includes West Bank, the Holding Company and related elimination entries between the two, as the Holding Company’s operation is similar to West Bank. The investment advisory segment generates revenue by providing investment portfolio management services to individuals, retirement plans, corporations, foundations, endowments, and public entities. The investment advisory segment consists of WB Capital Management Inc. The “Other” column represents the elimination of intercompany balances. Selected financial information on the Company’s segments is presented below for the years ended December 31, 2008, 2007, and 2006.
| 2008 | ||||||||||||||||
| Segments | ||||||||||||||||
| Banking | Investment Advisory | Other | Consolidated | |||||||||||||
| Interest income | $ | 72,532 | $ | - | $ | (1 | ) | $ | 72,531 | |||||||
| Interest expense | 31,431 | 1 | (1 | ) | 31,431 | |||||||||||
| Net interest income | 41,101 | (1 | ) | - | 41,100 | |||||||||||
| Provision for loan losses | 16,600 | - | - | 16,600 | ||||||||||||
| Net interest income after provision for loan losses | 24,501 | (1 | ) | - | 24,500 | |||||||||||
| Noninterest income | 4,301 | 7,596 | (191 | ) | 11,706 | |||||||||||
| Noninterest expense | 20,105 | 7,032 | (191 | ) | 26,946 | |||||||||||
| Income before income taxes | 8,697 | 563 | - | 9,260 | ||||||||||||
| Income taxes | 1,386 | 238 | - | 1,624 | ||||||||||||
| Net income | $ | 7,311 | $ | 325 | $ | - | $ | 7,636 | ||||||||
| Depreciation and amortization | $ | 924 | $ | 703 | $ | - | $ | 1,627 | ||||||||
| Goodwill | $ | 13,376 | $ | 11,554 | $ | - | $ | 24,930 | ||||||||
| Total assets | $ | 1,540,301 | $ | 13,975 | $ | (1,088 | ) | $ | 1,553,188 | |||||||
60
West Bancorporation, Inc. and Subsidiaries
Notes to Consolidated Financial Statements
(dollars in thousands, except per share data)
| 2007 | ||||||||||||||||
| Segments | ||||||||||||||||
| Banking | Investment Advisory | Other | Consolidated | |||||||||||||
| Interest income | $ | 82,027 | $ | - | $ | - | $ | 82,027 | ||||||||
| Interest expense | 43,823 | - | - | 43,823 | ||||||||||||
| Net interest income | 38,204 | - | - | 38,204 | ||||||||||||
| Provision for loan losses | 2,350 | - | - | 2,350 | ||||||||||||
Net interest income after provision for loan losses | 35,854 | - | - | 35,854 | ||||||||||||
| Noninterest income | 8,430 | 8,137 | (202 | ) | 16,365 | |||||||||||
| Noninterest expense | 17,870 | 7,155 | (202 | ) | 24,823 | |||||||||||
| Income before income taxes | 26,414 | 982 | - | 27,396 | ||||||||||||
| Income taxes | 8,062 | 414 | - | 8,476 | ||||||||||||
| Net income | $ | 18,352 | $ | 568 | $ | - | $ | 18,920 | ||||||||
| Depreciation and amortization | $ | 879 | $ | 876 | $ | - | $ | 1,755 | ||||||||
| Goodwill | $ | 13,376 | $ | 11,554 | $ | - | $ | 24,930 | ||||||||
| Total assets | $ | 1,326,508 | $ | 14,782 | $ | (1,322 | ) | $ | 1,339,968 | |||||||
| 2006 | ||||||||||||||||
| Segments | ||||||||||||||||
| Banking | Investment Advisory | Other | Consolidated | |||||||||||||
| Interest income | $ | 79,738 | $ | - | $ | (2 | ) | $ | 79,736 | |||||||
| Interest expense | 40,639 | 32 | (2 | ) | 40,669 | |||||||||||
| Net interest income | 39,099 | (32 | ) | - | 39,067 | |||||||||||
| Provision for loan losses | 1,725 | - | - | 1,725 | ||||||||||||
| Net interest income after provision | ||||||||||||||||
| for loan losses | 37,374 | (32 | ) | - | 37,342 | |||||||||||
| Noninterest income | 8,128 | 8,262 | (222 | ) | 16,168 | |||||||||||
| Noninterest expense | 17,425 | 7,772 | (222 | ) | 24,975 | |||||||||||
| Income before income taxes | 28,077 | 458 | - | 28,535 | ||||||||||||
| Income taxes | 8,935 | 193 | - | 9,128 | ||||||||||||
| Net income | $ | 19,142 | $ | 265 | $ | - | $ | 19,407 | ||||||||
| Depreciation and amortization | $ | 802 | $ | 994 | $ | - | $ | 1,796 | ||||||||
| Goodwill | $ | 13,376 | $ | 11,554 | $ | - | $ | 24,930 | ||||||||
| Total assets | $ | 1,253,618 | $ | 16,395 | $ | (1,477 | ) | $ | 1,268,536 | |||||||
61
West Bancorporation, Inc. and Subsidiaries
Notes to Consolidated Financial Statements
(dollars in thousands, except per share data)
| Note 17. | West Bancorporation, Inc. (Parent Company Only) Condensed Financial Statements |
BALANCE SHEETS
December 31, 2008 and 2007
| 2008 | 2007 | |||||||
| ASSETS | ||||||||
| Cash | $ | 686 | $ | 4,821 | ||||
| Investment in securities available for sale | 183 | 421 | ||||||
| Investment in West Bank | 143,914 | 114,328 | ||||||
| Investment in WB Capital Management Inc. | 12,652 | 13,202 | ||||||
| Investment in West Bancorporation Capital Trust I | 619 | 619 | ||||||
| Intercompany debentures from West Bank | 10,000 | 10,000 | ||||||
| Other assets | 2,688 | 2,758 | ||||||
| Total assets | $ | 170,742 | $ | 146,149 | ||||
| LIABILITIES AND STOCKHOLDERS' EQUITY | ||||||||
| LIABILITIES | ||||||||
| Accrued expenses and other liabilities | $ | 60 | $ | 924 | ||||
| Note payable | - | 3,000 | ||||||
| Subordinated notes | 20,619 | 20,619 | ||||||
| Total liabilities | 20,679 | 24,543 | ||||||
| STOCKHOLDERS' EQUITY | ||||||||
| Preferred stock | 33,548 | - | ||||||
| Common stock | 3,000 | 3,000 | ||||||
| Additional paid-in capital | 34,452 | 32,000 | ||||||
| Retained earnings | 82,793 | 87,084 | ||||||
| Accumulated other comprehensive (loss) | (3,730 | ) | (478 | ) | ||||
| Total stockholders' equity | 150,063 | 121,606 | ||||||
| Total liabilities and stockholders' equity | $ | 170,742 | $ | 146,149 | ||||
62
West Bancorporation, Inc. and Subsidiaries
Notes to Consolidated Financial Statements
(dollars in thousands, except per share data)
STATEMENTS OF INCOME
Years Ended December 31, 2008, 2007, and 2006
| 2008 | 2007 | 2006 | ||||||||||
| Operating income: | ||||||||||||
| Equity in net income of West Bank | $ | 9,084 | $ | 19,286 | $ | 19,797 | ||||||
| Equity in net income of WB Capital Management Inc. | 325 | 568 | 265 | |||||||||
Equity in net income of West Bancorporation Capital Trust I | 44 | 44 | 44 | |||||||||
| Interest and dividend income | 738 | 1,166 | 1,575 | |||||||||
| Securities gains (losses), net | 5 | (12 | ) | (36 | ) | |||||||
| Investment securities impairment losses | (317 | ) | - | - | ||||||||
| 9,879 | 21,052 | 21,645 | ||||||||||
| Operating expenses: | ||||||||||||
| Interest on notes payable | 93 | 389 | 606 | |||||||||
| Interest on subordinated notes | 1,476 | 1,472 | 1,472 | |||||||||
| Salaries and employee benefits | 232 | 204 | 218 | |||||||||
| Occupancy | 216 | 231 | 169 | |||||||||
| Other | 917 | 607 | 425 | |||||||||
| 2,934 | 2,903 | 2,890 | ||||||||||
| Income before income taxes | 6,945 | 18,149 | 18,755 | |||||||||
| Income tax (credits) | (691 | ) | (771 | ) | (652 | ) | ||||||
| Net income | $ | 7,636 | $ | 18,920 | $ | 19,407 | ||||||
63
West Bancorporation, Inc. and Subsidiaries
Notes to Consolidated Financial Statements
(dollars in thousands, except per share data)
STATEMENTS OF CASH FLOWS
Years Ended December 31, 2008, 2007, and 2006
| 2008 | 2007 | 2006 | ||||||||||
| CASH FLOWS FROM OPERATING ACTIVITIES | ||||||||||||
| Net income | $ | 7,636 | $ | 18,920 | $ | 19,407 | ||||||
| Adjustments to reconcile net income to net cash provided by operating activities: | ||||||||||||
| Equity in net income of West Bank | (9,084 | ) | (19,286 | ) | (19,797 | ) | ||||||
| Equity in net income of WB Capital Management Inc. | (325 | ) | (568 | ) | (265 | ) | ||||||
| Equity in net income of West Bancorporation Capital Trust I | (44 | ) | (44 | ) | (44 | ) | ||||||
| Dividends received from West Bank | 10,200 | 11,400 | 11,100 | |||||||||
| Dividends received from West Bancorporation Capital Trust I | 44 | 44 | 44 | |||||||||
| Dividends received from WB Capital Management Inc. | 875 | 1,850 | - | |||||||||
| Securities (gains) losses, net | (5 | ) | 12 | 36 | ||||||||
| Investment securities impairment loss | 317 | - | - | |||||||||
| Amortization | 14 | 14 | 37 | |||||||||
| Deferred income taxes | 114 | (66 | ) | 5 | ||||||||
| Changes in assets and liabilities: | ||||||||||||
| Increase in other assets | (91 | ) | (1,054 | ) | (192 | ) | ||||||
| Increase (decrease) in accrued expenses and other liabilities | (864 | ) | 902 | (23 | ) | |||||||
| Net cash provided by operating activities | 8,787 | 12,124 | 10,308 | |||||||||
| CASH FLOWS FROM INVESTING ACTIVITIES | ||||||||||||
| Proceeds from sales of securities available for sale | 473 | 935 | 4,789 | |||||||||
| Purchases of securities available for sale | (468 | ) | (673 | ) | (712 | ) | ||||||
| Additional capitalization of West Bank | (34,000 | ) | - | - | ||||||||
| Additional capitalization of WB Capital Management Inc. | - | (1,685 | ) | (660 | ) | |||||||
| Repayment of debentures from West Bank | - | 10,000 | - | |||||||||
| Net cash provided by (used in) investing activities | (33,995 | ) | 8,577 | 3,417 | ||||||||
| CASH FLOWS FROM FINANCING ACTIVITIES | ||||||||||||
| Principal payments on long-term borrowing | (3,000 | ) | (6,000 | ) | (1,000 | ) | ||||||
| Purchase of fractional shares resulting from stock dividend | - | - | (5 | ) | ||||||||
| Proceeds from issuance of preferred stock and common stock warrant | 36,000 | - | - | |||||||||
Payment for shares reacquired and retired under common stock repurchase plan | (789 | ) | (974 | ) | - | |||||||
| Dividends paid | (11,138 | ) | (11,224 | ) | (10,956 | ) | ||||||
| Net cash provided by (used in) financing activities | 21,073 | (18,198 | ) | (11,961 | ) | |||||||
| Net increase (decrease) in cash | (4,135 | ) | 2,503 | 1,764 | ||||||||
| CASH | ||||||||||||
| Beginning | 4,821 | 2,318 | 554 | |||||||||
| Ending | $ | 686 | $ | 4,821 | $ | 2,318 | ||||||
64
West Bancorporation, Inc. and Subsidiaries
Notes to Consolidated Financial Statements
(dollars in thousands, except per share data)
| Note 18. | Selected Quarterly Financial Data (unaudited) |
| 2008 | ||||||||||||||||
| Three months ended | March 31 | June 30 | September 30 | December 31 | ||||||||||||
| Interest income | $ | 18,863 | $ | 17,330 | $ | 18,185 | $ | 18,153 | ||||||||
| Interest expense | 8,987 | 7,095 | 7,799 | 7,550 | ||||||||||||
| Net interest income | 9,876 | 10,235 | 10,386 | 10,603 | ||||||||||||
| Provision for loan losses | 5,600 | 1,000 | 7,000 | 3,000 | ||||||||||||
Net interest income after provision for loan losses | 4,276 | 9,235 | 3,386 | 7,603 | ||||||||||||
| Noninterest income | 3,932 | 4,281 | 2,571 | 922 | ||||||||||||
| Noninterest expense | 6,765 | 7,061 | 7,455 | 5,665 | ||||||||||||
| Income (loss) before income taxes | 1,443 | 6,455 | (1,498 | ) | 2,860 | |||||||||||
| Income taxes (benefits) | 69 | 1,941 | (1,138 | ) | 752 | |||||||||||
| Net income (loss) | $ | 1,374 | $ | 4,514 | $ | (360 | ) | $ | 2,108 | |||||||
| Net income (loss) per common share - basic | $ | 0.08 | $ | 0.26 | $ | (0.02 | ) | $ | 0.12 | |||||||
| Net income (loss) per common share - diluted | $ | 0.08 | $ | 0.26 | $ | (0.02 | ) | $ | 0.12 | |||||||
| 2007 | ||||||||||||||||
| Three months ended | March 31 | June 30 | September 30 | December 31 | ||||||||||||
| Interest income | $ | 20,248 | $ | 21,018 | $ | 20,636 | $ | 20,125 | ||||||||
| Interest expense | 10,937 | 11,230 | 10,983 | 10,673 | ||||||||||||
| Net interest income | 9,311 | 9,788 | 9,653 | 9,452 | ||||||||||||
| Provision for loan losses | 300 | 350 | 500 | 1,200 | ||||||||||||
Net interest income after provision for loan losses | 9,011 | 9,438 | 9,153 | 8,252 | ||||||||||||
| Noninterest income | 3,943 | 4,115 | 4,129 | 4,178 | ||||||||||||
| Noninterest expense | 6,527 | 5,988 | 6,216 | 6,092 | ||||||||||||
| Income before income taxes | 6,427 | 7,565 | 7,066 | 6,338 | ||||||||||||
| Income taxes | 1,983 | 2,438 | 2,119 | 1,936 | ||||||||||||
| Net income | $ | 4,444 | $ | 5,127 | $ | 4,947 | $ | 4,402 | ||||||||
| Net income per common share - basic | $ | 0.25 | $ | 0.29 | $ | 0.28 | $ | 0.25 | ||||||||
| Net income per common share - diluted | $ | 0.25 | $ | 0.29 | $ | 0.28 | $ | 0.25 | ||||||||
65
STOCK INFORMATION
West Bancorporation, Inc. common stock is traded on the NASDAQ Global Select Market and quotations are furnished by the NASDAQ System. There were 266 common stockholders of record on February 20, 2009, and an estimated 1,800 additional beneficial holders whose stock was held in street name by brokerage houses.
| Market and Dividend Information | High | Low | Dividends | |||||||||
2008 | ||||||||||||
| 1st quarter | $ | 14.43 | $ | 11.71 | $ | 0.16 | ||||||
| 2nd quarter | 13.48 | 8.63 | 0.16 | |||||||||
| 3rd quarter | 16.21 | 7.30 | 0.16 | |||||||||
| 4th quarter | 13.50 | 8.67 | 0.16 | |||||||||
2007 | ||||||||||||
| 1st quarter | $ | 18.25 | $ | 14.29 | $ | 0.16 | ||||||
| 2nd quarter | 16.36 | 14.17 | 0.16 | |||||||||
| 3rd quarter | 16.19 | 14.68 | 0.16 | |||||||||
| 4th quarter | 15.98 | 11.85 | 0.16 | |||||||||
The prices shown above are the high and low sale prices for the Company’s common stock. The market quotations, reported by NASDAQ, do not include retail markup, markdown, or commissions.
NASDAQ Symbol: WTBA
Transfer Agent/Dividend Paying Agent
Illinois Stock Transfer Company
209 West Jackson Boulevard, Suite 903
Chicago, Illinois 60606-6905
800-757-5755
www.illinoisstocktransfer.com
Form 10-K and Code of Conduct
The Company will provide, when available, a copy of its annual report on Form 10-K as filed with the SEC, without charge to each Shareholder, upon request. Such request should be directed to Alice A. Jensen, Corporate Secretary, West Bancorporation, Inc., 1601 22nd Street, West Des Moines, Iowa 50266 or by calling 515-222-2300. The Company’s Form 10-K will also be available on the SEC's internet website at http://www.sec.gov/edgar/searchedgar/webusers.htm and through a link at the Investor Relations, SEC Filings section of the Company’s website (www.westbankiowa.com).
The Company has adopted a code of conduct that applies to all directors, officers, and employees, including the chairman, president and chief executive officer, the executive vice president and chief financial officer, and the vice president and controller. A copy of the code of conduct is available in the Investor Relations, Corporate Governance section of the Company’s website (www.westbankiowa.com) or is available upon request directed to Alice A. Jensen, Corporate Secretary, West Bancorporation, Inc., 1601 22nd Street, West Des Moines, Iowa 50266 or by calling 515-222-2300.
66
West Bancorporation, Inc.
Annual Meeting of Shareholders
Thursday, April 16, 2009, at 4:00 p.m.
1601 22nd Street, West Des Moines, IA
You can vote in one of two ways: 1) By Mail or 2) By Internet See the reverse side of this sheet for instructions. IF YOU ARE NOT VOTING BY INTERNET, COMPLETE BOTH SIDES OF PROXY CARD, DETACH AND RETURN IN THE ENCLOSED ENVELOPE TO: Illinois Stock Transfer Co. 209 West Jackson Boulevard, Suite 903 Chicago, Illinois 60606 |
| DETACH PROXY CARD HERE | DETACH ATTENDANCE CARD HERE AND MAIL WITH PROXY CARD | ||
This Proxy, when properly executed, will be voted in the manner directed herein by the undersigned shareholder. IF NO DIRECTION IS GIVEN, THIS PROXY WILL BE VOTED (1) FOR THE ELECTION OF THE NOMINEES LISTED IN PROPOSAL 1; (2) FOR THE APPROVAL OF EXECUTIVE COMPENSATION IN PROPOSAL 2; (3) FOR THE RATIFICATION OF THE APPOINTMENT OF THE INDEPENDENT REGISTERED PUBLIC ACCOUNTING FIRM IN PROPOSAL 3; AND (4) IN THE DISCRETION OF THE NAMED PROXIES UPON SUCH OTHER MATTERS AS MAY PROPERLY COME BEFORE THE MEETING. | |||
 | Dated _______________________, 2009 ________________________ ________________________ (PLEASE SIGN HERE) | West Bancorporation, Inc. If you plan to personally attend the 2009 Annual Meeting of Shareholders, please check the box below and list names of attendees on reverse side. Return this stub in the enclosed envelope with your completed proxy card. | |
| Please sign exactly as name appears above. When shares are held by joint tenants, both should sign. When signing as administrator, attorney, executor, guardian or trustee, please give full title as such. If signing as an authorized officer of a corporation, please sign full corporate name and indicate office held. | I plan to attend. o | ||
TO VOTE BY MAIL To vote by mail, complete both sides, sign, and date the proxy card below. Detach the card below and return it in the envelope provided. |
TO VOTE BY INTERNET Your Internet vote is quick, confidential, and your vote is immediately submitted. Just follow these easy steps: 1. Read the accompanying Proxy Statement. 2. Visit our Internet voting site at www.illinoisstocktransfer.com, click on the "Internet Voting" tab and enter your Voter Control Number and the last four digits of your Tax Identification Number that is associated with the account you are voting in the designated fields. Your Voter Control Number is printed on the front of this proxy card. Please note that all votes cast by Internet must be completed and submitted prior to Tuesday, April 14, 2009, at 11:59 p.m. Central Time. Your Internet vote authorizes the named proxies to vote your shares to the same extent as if you marked, signed, dated, and returned the proxy card. This is a “secured” web page site. Your software and/or Internet Provider must be “enabled” to access this site. Please call your software or Internet Provider for further information if needed. |
If You Vote By INTERNET, Please Do Not Return Your Proxy Card By Mail |
WEST BANCORPORATION, INC. WEST DES MOINES, IOWA | PROXY | |
PLEASE LIST NAMES OF PERSONS ATTENDING | PROXY FOR ANNUAL MEETING OF SHAREHOLDERS ON APRIL 16, 2009 The undersigned hereby appoints Thomas E. Stanberry and Jack G. Wahlig, or either of them, the undersigned's attorneys and proxies, with full power of substitution, to vote all shares of Common Stock of West Bancorporation, Inc. which the undersigned is entitled to vote as of the record date, February 20, 2009, as fully as the undersigned could do if personally present, at the Annual Meeting of Shareholders of said corporation to be held in the Conference Center at the headquarters of the Company, located at 1601 22nd Street, West Des Moines, Iowa, on Thursday, April 16, 2009, at 4:00 p.m., Central Time, and at any and all adjournments thereof. | |
THE BOARD OF DIRECTORS RECOMMENDS A VOTE FOR PROPOSALS 1, 2 AND 3. | ||
| FOR | VOTE WITHHELD | FOR | VOTE WITHHELD | |||||
| 1. | Election of Directors: | 01 Frank W. Berlin | ¨ | ¨ | 08 George D. Milligan | ¨ | ¨ | |
02 Thomas A. Carlstrom | ¨ | ¨ | 09 Robert G. Pulver | ¨ | ¨ | |||
03 Joyce A. Chapman | ¨ | ¨ | 10 Thomas E. Stanberry | ¨ | ¨ | |||
04 Orville E. Crowley | ¨ | ¨ | 11 Jack G. Wahlig | ¨ | ¨ | |||
05 Douglas R. Gulling | ¨ | ¨ | 12 Connie Wimer | ¨ | ¨ | |||
06 Kaye R. Lozier | ¨ | ¨ | 13 Brad L. Winterbottom | ¨ | ¨ | |||
07 David R. Milligan | ¨ | ¨ |
| 2. | Approve the 2008 compensation of the Company’s named executive officers. | |
¨ Vote FOR the approval of executive compensation ¨ Vote WITHHELD | ||
| 3. | To ratify the appointment of McGladrey & Pullen, LLP as the Company's independent registered public accounting firm for 2009. | |
¨ Vote FOR McGladrey & Pullen, LLP ¨ Vote WITHHELD | ||
| 4. | In accordance with their discretion, upon all other matters that may properly come before said meeting and any adjournments or postponements thereof. | |
| (Continued and to be signed and dated, on other side) | ||