EXHIBIT 99.2
2011 Shareholders’ Meeting
April 28, 2011
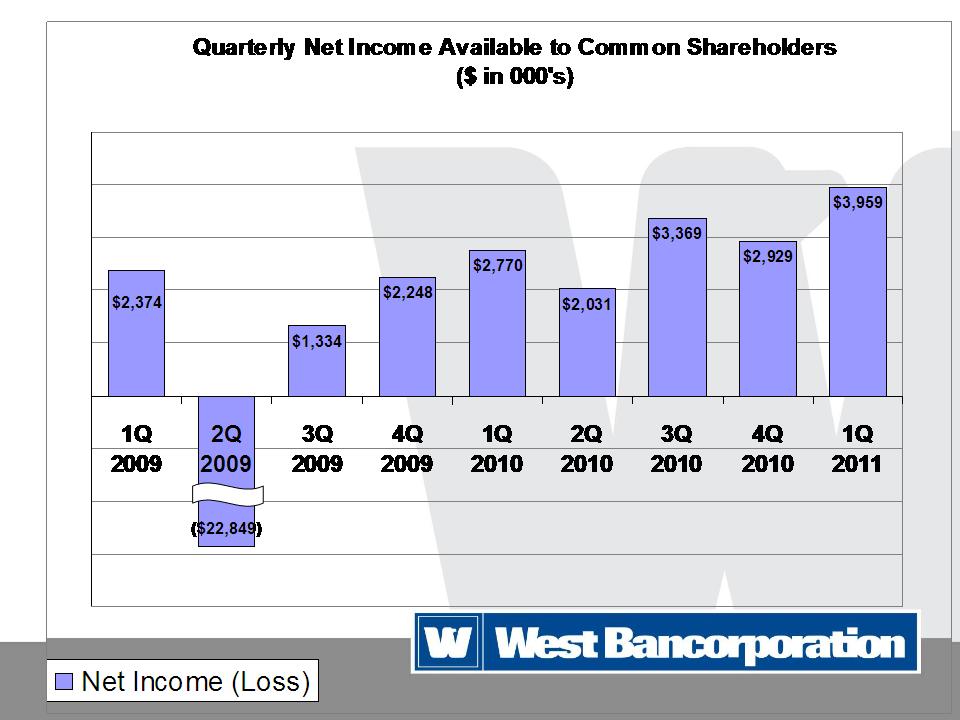
Quarterly Net Income Available to Common Shareholders
($ in 000's)
|
| | | |
| Qtr | Net Income (Loss) |
| 1Q 2009 | $ | 2,374 | |
| 2Q 2009 | $ | (22,849 | ) |
| 3Q 2009 | $ | 1,334 | |
| 4Q 2009 | $ | 2,248 | |
| 1Q 2010 | $ | 2,770 | |
| 2Q 2010 | $ | 2,031 | |
| 3Q 2010 | $ | 3,369 | |
| 4Q 2010 | $ | 2,929 | |
| 1Q 2011 | $ | 3,959 | |
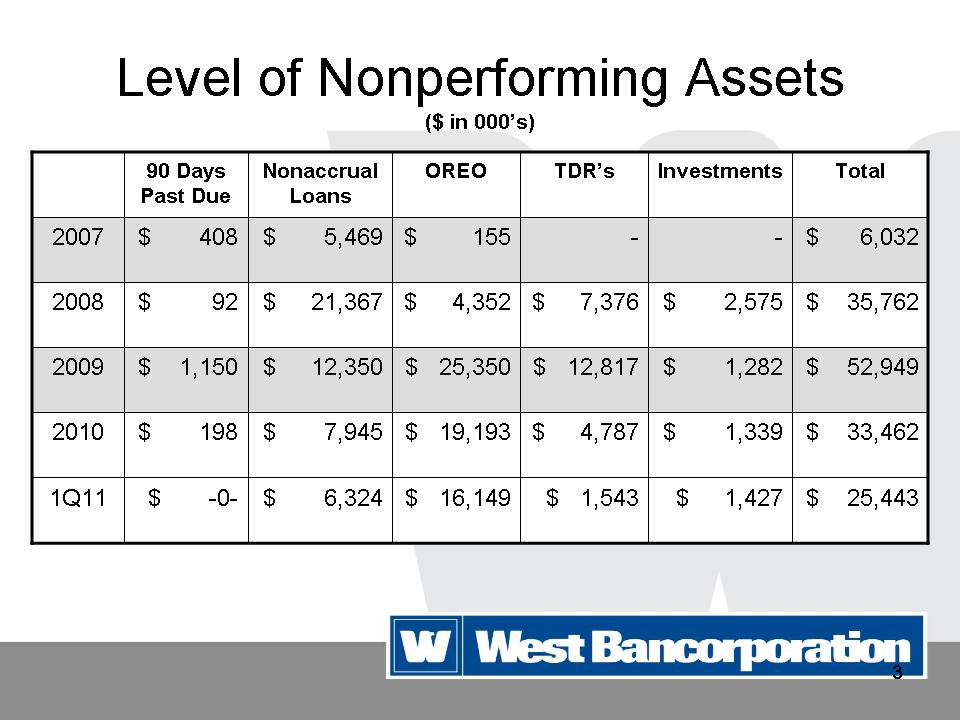
Level of Nonperforming Assets
($ in 000’s)
|
| | | | | | | | | | | | | | | | | | |
| | 90 Days Past Due | Nonaccrual Loans | OREO | TDR's | Investments | Total |
| 2007 | $ | 408 | | $ | 5,469 | | $ | 155 | | $ | — | | $ | — | | $ | 6,032 | |
| 2008 | $ | 92 | | $ | 21,367 | | $ | 4,352 | | $ | 7,376 | | $ | 2,575 | | $ | 35,762 | |
| 2009 | $ | 1,150 | | $ | 12,350 | | $ | 25,350 | | $ | 12,817 | | $ | 1,282 | | $ | 52,949 | |
| 2010 | $ | 198 | | $ | 7,945 | | $ | 19,193 | | $ | 4,787 | | $ | 1,339 | | $ | 33,462 | |
| 1Q11 | $ | — | | $ | 6,324 | | $ | 16,149 | | $ | 1,543 | | $ | 1,427 | | $ | 25,443 | |
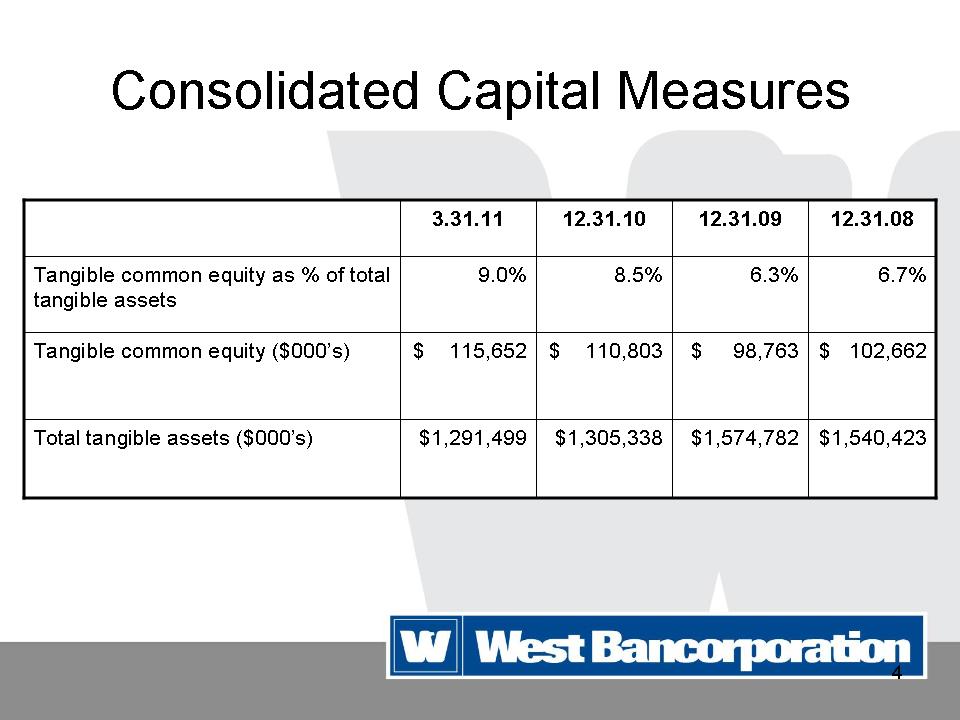
Consolidated Capital Measures
|
| | | | | | | | | | | | |
| | 3.31.11 | 12.31.10 | 12.31.09 | 12.31.08 |
| Tangible common equity as % of total tangible assets | 9.0 | % | 8.5 | % | 6.3 | % | 6.7 | % |
| Tangible common equity ($000’s) | $ | 115,652 | | $ | 110,803 | | $ | 98,763 | | $ | 102,662 | |
| Total tangible assets ($000’s) | $ | 1,291,499 | | $ | 1,305,338 | | $ | 1,574,782 | | $ | 1,540,423 | |
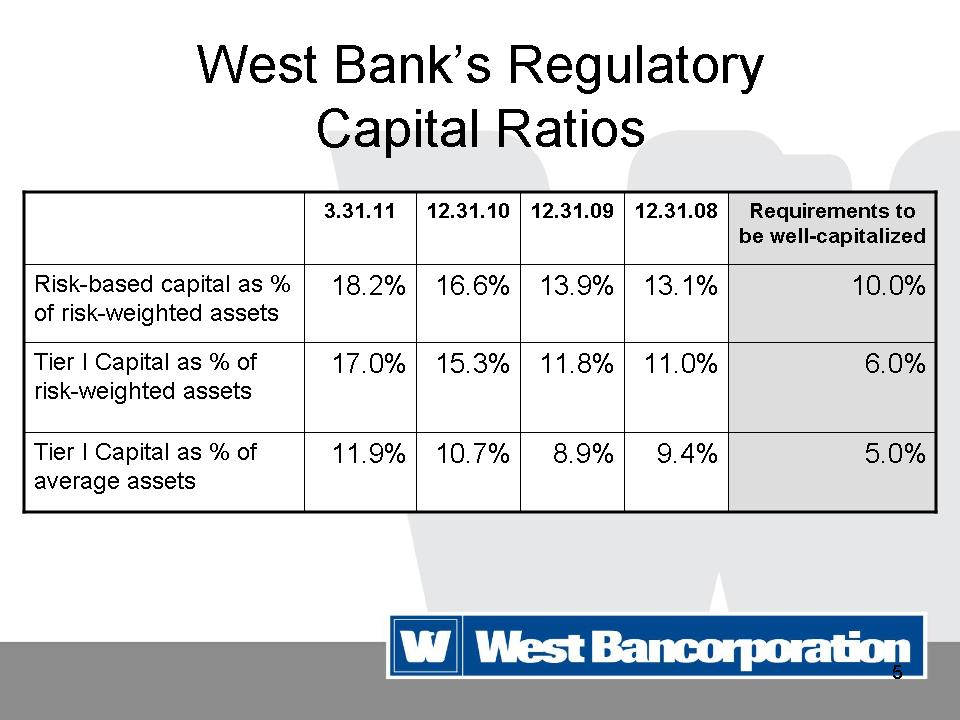
West Bank’s Regulatory
Capital Ratios
|
| | | | | |
| | 3.31.11 | 12.31.10 | 12.31.09 | 12.31.08 | Requirements to be well-capitalized |
| Risk-based capital as % of risk-weighted assets | 18.2% | 16.6% | 13.9% | 13.1% | 10.0% |
| Tier I Capital as % of risk-weighted assets | 17.0% | 15.3% | 11.8% | 11.0% | 6.0% |
| Tier I Capital as % of average assets | 11.9% | 10.7% | 8.9% | 9.4% | 5.0% |
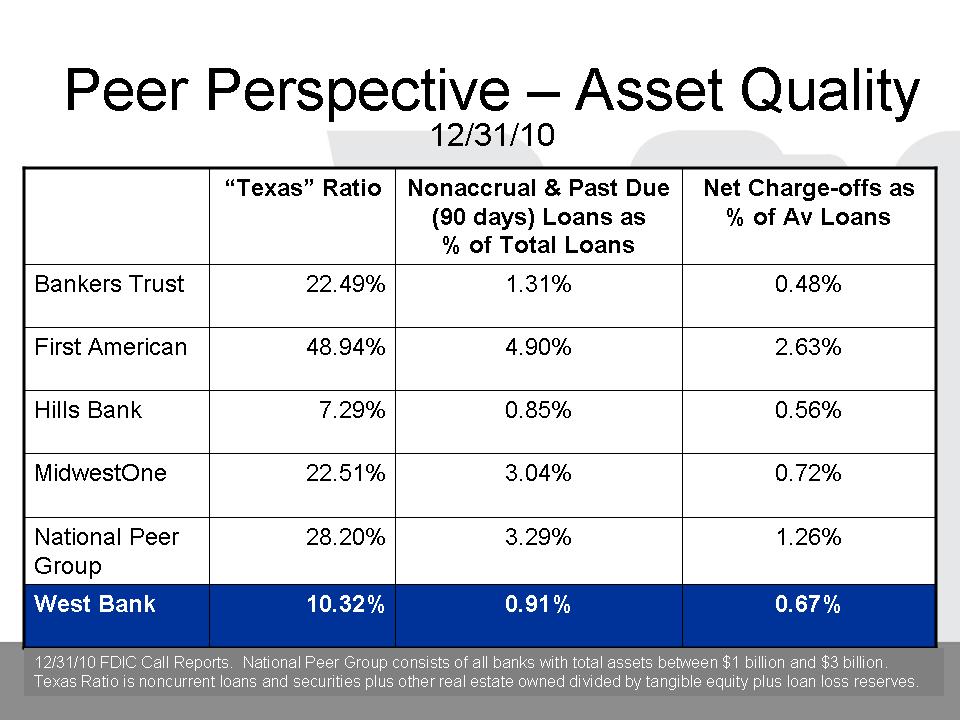
Peer Perspective – Asset Quality
12/31/10
|
| | | |
| | “Texas” Ratio | Nonaccrual & Past Due (90 days) Loans as % of Total Loans | Net Charge-offs as % of Av Loans |
| Bankers Trust | 22.49% | 1.31% | 0.48% |
| First American | 48.94% | 4.90% | 2.63% |
| Hills Bank | 7.29% | 0.85% | 0.56% |
| MidwestOne | 22.51% | 3.04% | 0.72% |
| National Peer Group | 28.20% | 3.29% | 1.26% |
| West Bank | 10.32% | 0.91% | 0.67% |
12/31/10 FDIC Call Reports. National Peer Group consists of all banks with total assets between $1 billion and $3 billion. Texas Ratio is noncurrent loans and securities plus other real estate owned divided by tangible equity plus loan loss reserves.
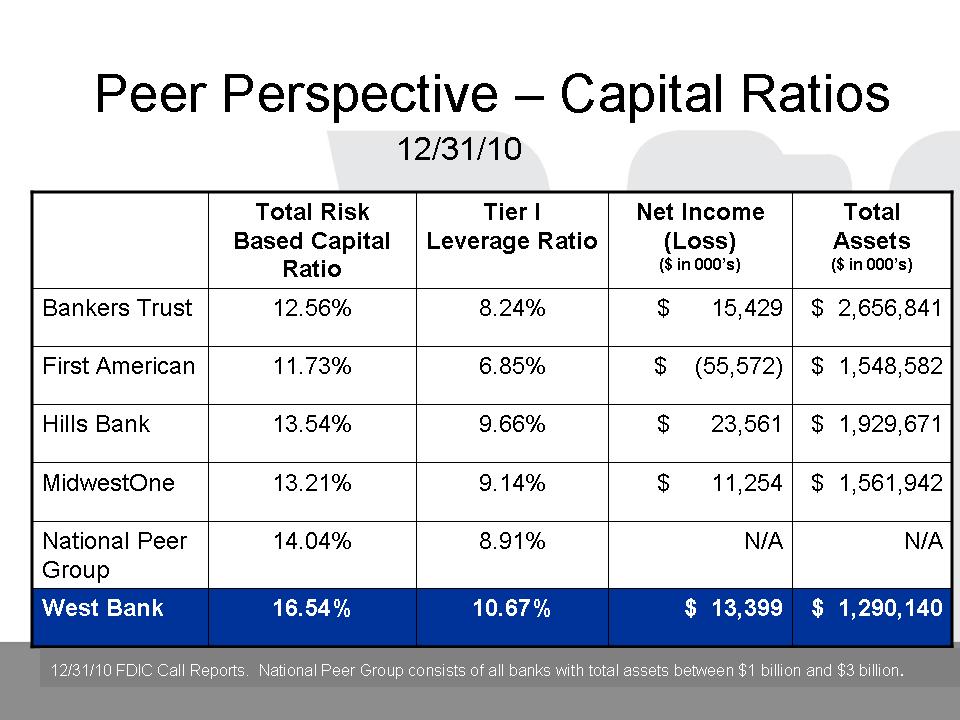
Peer Perspective – Capital Ratios
12/31/10
|
| | | | | | | | |
| | Total Risk Based Capital Ratio | Tier I Leverage Ratio | Net Income (Loss) ($ in 000’s) | Total Assets ($ in 000’s) |
| Bankers Trust | 12.56% | 8.24% | $ | 15,429 | | $ | 2,656,841 | |
| First American | 11.73% | 6.85% | $ | (55,572 | ) | $ | 1,548,582 | |
| Hills Bank | 13.54% | 9.66% | $ | 23,561 | | $ | 1,929,671 | |
| MidwestOne | 13.21% | 9.14% | $ | 11,254 | | $ | 1,561,942 | |
| National Peer Group | 14.04% | 8.91% | N/A | | N/A | |
| West Bank | 16.54% | 10.67% | $ | 13,399 | | $ | 1,290,140 | |
12/31/10 FDIC Call Reports. National Peer Group consists of all banks with total assets between $1 billion and $3 billion.
2011 Shareholders’ Meeting
April 28, 2011