UNITED STATES
SECURITIES AND EXCHANGE COMMISSION
Washington, D.C. 20549
FORM N-CSR
CERTIFIED SHAREHOLDER REPORT OF REGISTERED MANAGEMENT
INVESTMENT COMPANIES
Investment Company Act file number 811-21037
Name of Fund: BlackRock New York Municipal Bond Trust (BQH)
Fund Address: 100 Bellevue Parkway, Wilmington, DE 19809
Name and address of agent for service: John M. Perlowski, Chief Executive Officer, BlackRock New York
Municipal Bond Trust, 55 East 52nd Street, New York, NY 10055
Registrant’s telephone number, including area code: (800) 882-0052, Option 4
Date of fiscal year end: 08/31/2012
Date of reporting period: 08/31/2012
Item 1 – Report to Stockholders
| | |
 | | August 31, 2012 |
Annual Report
BlackRock Maryland Municipal Bond Trust (BZM)
BlackRock MuniHoldings New York Quality Fund, Inc. (MHN)
BlackRock New Jersey Municipal Bond Trust (BLJ)
BlackRock New York Municipal Bond Trust (BQH)
BlackRock New York Municipal Income Quality Trust (BSE)
BlackRock New York Municipal Income Trust II (BFY)
BlackRock Virginia Municipal Bond Trust (BHV)
The Massachusetts Health & Education Tax-Exempt Trust (MHE)
Not FDIC Insured • No Bank Guarantee • May Lose Value
| | | | | | |
| | | | | | | |
| 2 | | ANNUAL REPORT | | AUGUST 31, 2012 | | |
About this time one year ago, financial markets had been upended by sovereign debt turmoil in the United States and Europe as well as growing concerns about the future of the global economy. Since then, asset prices have waxed and waned in broad strokes as investors reacted to developments in Europe’s financial situation, mixed US economic news and global central bank policy action.
After confidence crumbled in the third quarter of 2011, October brought improving economic data and more concerted efforts among European leaders toward stemming the region’s debt crisis, gradually drawing investors back to the markets. Improving sentiment carried over into early 2012 as investors felt some relief from the world’s financial woes. Volatility abated and risk assets (including stocks, commodities and high yield bonds) moved boldly higher through the first two months of 2012 while climbing Treasury yields pressured higher-quality fixed income assets.
Markets reversed course in the spring when Europe’s debt problems boiled over once again. High levels of volatility returned as political instability in Greece threatened the country’s membership in the euro zone. Spain faced severe deficit issues while the nation’s banks clamored for liquidity. Yields on Spanish and Italian government debt rose to levels deemed unsustainable. European leaders conferred and debated vehemently over the need for fiscal integration among the 17 nations comprising the euro currency bloc as a means to resolve the crisis for the long term.
Alongside the drama in Europe, investors were discouraged by gloomy economic reports from various parts of the world. A slowdown in China, a key powerhouse for global growth, became particularly worrisome. In the United States, disappointing jobs reports dealt a crushing blow to sentiment. Risk assets sold off in the second quarter as investors again retreated to safe haven assets.
Despite the continuation of heightened market volatility, most asset classes enjoyed a robust summer rally. Global economic data continued to be mixed, but the spate of downside surprises seen in the second quarter began to recede and, outside of Europe, the risk of recession largely subsided. Central bank policy action has been a major driver of market sentiment in 2012. Investors’ anticipation for economic stimulus drove asset prices higher over the summer as the European Central Bank stepped up its efforts to support the region’s troubled nations and the US Federal Reserve reiterated its readiness to take action if economic conditions warrant.
On the whole, most asset classes advanced during the reporting period. US large cap stocks delivered strong returns for the 12 months ended August 31, 2012, while small cap stocks and high yield bonds also performed well. Despite the risk-asset rally in recent months, higher-quality investments including tax-exempt municipal bonds and US Treasury bonds posted exceptional gains by historical standards and outperformed investment-grade corporate bonds. International and emerging equities, however, lagged other asset classes amid ongoing global uncertainty. Near-zero short term interest rates kept yields on money market securities near their all-time lows.
We know that investors continue to face a world of uncertainty and volatile markets, but we also believe these challenging times present many opportunities. We remain committed to working with you and your financial professional to identify actionable ideas for your portfolio. We encourage you to visit www.blackrock.com/newworld for more information.
Sincerely,

Rob Kapito
President, BlackRock Advisors, LLC

“We know that investors continue to face a world of uncertainty and volatile markets, but we also believe these challenging times present many opportunities”
Rob Kapito
President, BlackRock Advisors, LLC
| | | | | | | | |
| Total Returns as of August 31, 2012 | |
| | | 6-month | | | 12-month | |
US large cap equities
(S&P 500® Index) | | | 4.14 | % | | | 18.00 | % |
US small cap equities
(Russell 2000® Index) | | | 0.89 | | | | 13.40 | |
International equities
(MSCI Europe, Australasia, Far East Index) | | | (4.00 | ) | | | (0.04 | ) |
Emerging market
equities (MSCI Emerging Markets Index) | | | (10.51 | ) | | | (5.80 | ) |
3-month Treasury bill
(BofA Merrill Lynch
3-Month US Treasury
Bill Index) | | | 0.06 | | | | 0.06 | |
US Treasury securities
(BofA Merrill Lynch 10-Year US Treasury Index) | | | 5.25 | | | | 9.14 | |
US investment grade
bonds (Barclays US
Aggregate Bond Index) | | | 2.97 | | | | 5.78 | |
Tax-exempt municipal
bonds (S&P Municipal
Bond Index) | | | 3.24 | | | | 9.37 | |
US high yield bonds
(Barclays US Corporate High Yield 2% Issuer Capped Index) | | | 4.80 | | | | 13.84 | |
| Past performance is no guarantee of future results. Index performance is shown for illustrative purposes only. You cannot invest directly in an index. | |
| | | | | | |
| | | | | | | |
| | THIS PAGE NOT PART OF YOUR FUND REPORT | | | | 3 |
| | | | |
| Municipal Market Overview | | |
| | |
| For the 12-Month Period Ended August 31, 2012 | | |
Municipal bonds delivered exceptional performance during the reporting period, with the S&P Municipal Bond Index gaining 9.37% for the 12 months ended August 31, 2012. In the later part of 2011, heightened volatility in equity markets led to increased demand for municipal bonds as investors flocked to more stable asset classes. The municipal market benefited from an exuberant Treasury market amid global uncertainty in addition to muted new issuance. Supply was constrained while demand from both traditional and non-traditional buyers was strong, pushing long-term municipal bond yields lower and sparking a curve-flattening trend that continued through year end. Ultimately, 2011 was one of the strongest performance years in municipal market history and municipal bonds outperformed most fixed income asset classes for the year.
Market conditions remained favorable even though supply picked up considerably in 2012. As the fiscal situation for municipalities continued to improve, the rate of new issuance came back in line with historical averages. Total new issuance for the first eight months of 2012 was $253 billion as compared to $288 billion for the entire year of 2011. It is important to note that refunding activity has accounted for a large portion of supply in 2012 as issuers refinanced their debt at lower interest rates. Refunding issues are easily absorbed by the market because when seasoned bonds are refinanced, issuers re-enter the market via cheaper and predominantly shorter-maturity financing. Investors, in turn, support these new issues with the proceeds from bond maturities or coupon payments.
Increased supply was met with the continuation of strong demand in 2012 as investors remained starved for yield in a low-rate environment. Investors poured into municipal bond mutual funds, particularly those with long-duration and high-yield investment mandates as they tend to provide higher levels of income. Year-to-date through August 2012, flows into municipal funds have totaled $38.812 billion (according to the Investment Company Institute). Following an extensive period of significant outflows from late 2010 through mid-2011, these robust 2012 inflows are telling of the complete turnaround in confidence. Municipal market supply-and-demand technicals typically strengthen considerably upon the conclusion of tax season as net negative supply takes hold (i.e., more bonds are being called and maturing than being issued) and this theme remained intact for 2012. In the spring, a resurgence of concerns about Europe’s financial crisis and weakening US economic data drove municipal bond yields lower and prices higher. In addition to income and capital preservation, investors were drawn to the asset class for its relatively low volatility. As global sentiment improved over the summer, municipal bonds outperformed the more volatile US Treasury market. Given these positive market factors, the S&P Municipal Bond Index has gained 5.99% year-to-date through August 31, 2012.
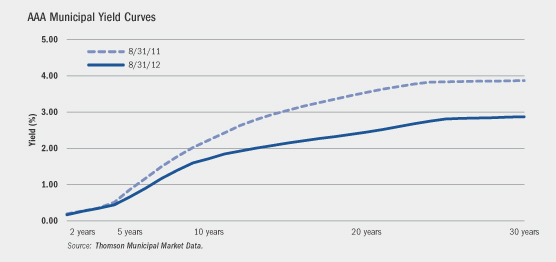
Overall, the municipal yield curve flattened during the period from August 31, 2011 to August 31, 2012. As measured by Thomson Municipal Market Data, yields declined by 100 basis points (“bps”) to 2.89% on AAA-rated 30-year municipal bonds and by 51 bps to 1.74% on 10-year bonds, while yields on 5-year issues fell 20 bps to 0.69%. While the entire municipal curve flattened over the 12-month time period, the spread between 2- and 30-year maturities tightened by 99 bps, and in the 2- to 10-year range, the spread tightened by 50 bps.
The fundamental picture for municipalities continues to improve. Austerity has been the general theme across the country as states set their budgets, although a small number of states continue to rely on a “kick-the-can” approach to close their budget gaps, using aggressive revenue projections and accounting gimmicks. It has been more than a year and a half since the fiscal problems plaguing state and local governments first became highly publicized and the prophecy of widespread defaults across the municipal market has not materialized. Year-to-date through August 2012, total outstanding municipal bonds entering into debt service cash-payment default for the first time had an aggregate par value of $1.16 billion. This amount represents only 0.5% of total issuance for the same period and 0.031% of total municipal bonds outstanding. This compares favorably to data for the full year 2011 when first-time defaults totaled 0.84% of issuance and 0.065% of outstanding. (Data provided by Bank of America Merrill Lynch.) BlackRock maintains the view that municipal bond defaults will remain in the periphery and the overall market is fundamentally sound. We continue to recognize that careful credit research and security selection remain imperative amid uncertainty in this economic environment.
Past performance is no guarantee of future results. Index performance is shown for illustrative purposes only. You cannot invest directly in an index.
| | | | | | |
| | | | | | | |
| 4 | | ANNUAL REPORT | | AUGUST 31, 2012 | | |
| | |
| Trust Summary as of August 31, 2012 | | BlackRock Maryland Municipal Bond Trust |
BlackRock Maryland Municipal Bond Trust’s (BZM) (the “Trust”) investment objective is to provide current income exempt from regular federal income taxes and Maryland personal income taxes. The Trust seeks to achieve its investment objectives by investing primarily in municipal bonds exempt from federal income taxes (except that the interest may be subject to the federal alternative minimum tax) and Maryland personal income taxes. The Trust invests, under normal market conditions, at least 80% of its assets in municipal bonds that are investment grade quality at the time of investment. The Trust may invest directly in such securities or synthetically through the use of derivatives.
No assurance can be given that the Trust’s investment objective will be achieved.
For the 12 months ended August 31, 2012, the Trust returned 29.95% based on market price and 13.08% based on net asset value (“NAV”). For the same period, the closed-end Lipper Other States Municipal Debt Funds category posted an average return of 21.36% based on market price and 14.84% based on NAV. All returns reflect reinvestment of dividends. The Trust’s premium to NAV, which widened during the period, accounts for the difference between performance based on price and performance based on NAV. The following discussion relates to performance based on NAV. During the period, municipal bond prices generally rose as the yield curve flattened (longer-term interest rates fell more than shorter-term rates) and credit spreads tightened. Given these market conditions, the Trust’s exposure to longer-maturity bonds and lower-quality investment grade bonds had a significant positive impact on performance. Exposure to the health sector also boosted returns as these bonds particularly benefited from the decline in interest rates and spread tightening during the period. The Trust’s income component was negatively impacted by the recent high level of refunding activity in the market as issuers were enticed to refinance their outstanding debt at significantly lower interest rates. The Trust’s small position in US Treasury futures as a strategy for hedging interest rate risk was a slight detractor from performance as rates generally declined during the period.
The views expressed reflect the opinions of BlackRock as of the date of this report and are subject to change based on changes in market, economic or other conditions. These views are not intended to be a forecast of future events and are no guarantee of future results.
| | |
Symbol on New York Stock Exchange (“NYSE”) Amex | | BZM |
Initial Offering Date | | April 30, 2002 |
Yield on Closing Market Price as of August 31, 2012 ($18.43)1 | | 4.33% |
Tax Equivalent Yield2 | | 6.66% |
Current Monthly Distribution per Common Share3 | | $0.0665 |
Current Annualized Distribution per Common Share3 | | $0.7980 |
Economic Leverage as of August 31, 20124 | | 36% |
| 1 | | Yield on closing market price is calculated by dividing the current annualized distribution per share by the closing market price. Past performance does not guarantee future results. |
| 2 | | Tax equivalent yield assumes the maximum federal tax rate of 35%. |
| 3 | | The distribution rate is not constant and is subject to change. |
| 4 | | Represents Variable Rate Demand Preferred Shares (“VRDP Shares”) and tender option bond trusts (“TOBs”) as a percentage of total managed assets, which is the total assets of the Trust, including any assets attributable to VRDP Shares and TOBs, minus the sum of accrued liabilities. For a discussion of leveraging techniques utilized by the Trust, please see The Benefits and Risks of Leveraging on page 13. |
The table below summarizes the changes in the Trust’s market price and NAV per share:
| | | | | | | | | | | | | | | | | | | | |
| | | 8/31/12 | | | 8/31/11 | | | Change | | | High | | | Low | |
Market Price | | $ | 18.43 | | | $ | 15.02 | | | | 22.70 | % | | $ | 20.21 | | | $ | 14.61 | |
Net Asset Value | | $ | 15.60 | | | $ | 14.61 | | | | 6.78 | % | | $ | 15.63 | | | $ | 14.55 | |
The following charts show the sector and credit quality allocations of the Trust’s long-term investments:
| | | | | | | | |
| Sector Allocations | | | | | | |
| | | 8/31/12 | | | 8/31/11 | |
Transportation | | | 18 | % | | | 19 | % |
County/City/Special District/School District | | | 18 | | | | 21 | |
Education | | | 17 | | | | 11 | |
Housing | | | 14 | | | | 12 | |
Health | | | 14 | | | | 18 | |
Utilities | | | 11 | | | | 10 | |
State | | | 5 | | | | 5 | |
Tobacco | | | 2 | | | | 3 | |
Corporate | | | 1 | | | | 1 | |
| | | | | | | | |
| Credit Quality Allocations5 | | | | | | |
| | | 8/31/12 | | | 8/31/11 | |
AAA/Aaa | | | 12 | % | | | 14 | % |
AA/Aa | | | 40 | | | | 30 | |
A | | | 27 | | | | 35 | |
BBB/Baa | | | 8 | | | | 8 | |
BB/Ba | | | 1 | | | | 1 | |
Not Rated6 | | | 12 | | | | 12 | |
| 5 | | Using the higher of Standard & Poor’s (“S&P’s”) or Moody’s Investors Service (“Moody’s”) ratings. |
| 6 | | The investment advisor has deemed certain of these non-rated securities to be of investment grade quality. As of August 31, 2012 and August 31, 2011, the market value of these securities was $1,141,310 and $1,031,990, each representing 2%, respectively, of the Trust’s long-term investments. |
| | | | | | |
| | | | | | | |
| | ANNUAL REPORT | | AUGUST 31, 2012 | | 5 |
| | |
| Trust Summary as of August 31, 2012 | | BlackRock MuniHoldings New York Quality Fund, Inc. |
BlackRock MuniHoldings New York Quality Fund, Inc.’s (MHN) (the “Trust”) investment objective is to provide shareholders with current income exempt from federal income tax and New York State and New York City personal income taxes. The Trust seeks to achieve its investment objective by investing, under normal market conditions, at least 80% of its assets in investment grade New York municipal obligations exempt from federal income taxes (except that the interest may be subject to the federal alternative minimum tax) and New York State and New York City personal income taxes (“New York Municipal Bonds”), except at times when, in the judgment of its investment adviser, New York Municipal Bonds of sufficient quality and quantity are unavailable for investment by the Trust. At all times, however, except during temporary defensive periods, the Trust invests at least 65% of its assets in New York Municipal Bonds. The Trust invests, under normal market conditions, at least 80% of its assets in municipal obligations with remaining maturities of one year or more. The Trust may invest directly in such securities or synthetically through the use of derivatives.
No assurance can be given that the Trust’s investment objective will be achieved.
For the 12 months ended August 31, 2012, the Trust returned 21.52% based on market price and 16.15% based on NAV. For the same period, the closed-end Lipper New York Municipal Debt Funds category posted an average return of 19.66% based on market price and 14.48% based on NAV. All returns reflect reinvestment of dividends. The Fund moved from a discount to NAV to a premium by period end, which accounts for the difference between performance based on price and performance based on NAV. The following discussion relates to performance based on NAV. The Trust’s neutral-to-long average duration (greater sensitivity to interest rates) contributed positively to performance as interest rates generally declined over the one-year period. A preference for longer-dated maturities enhanced returns as the municipal yield curve flattened (long-term interest rates fell more than short and intermediate rates). The Trust benefited from a tightening of credit spreads during the period, with particularly strong performance from its allocations to the health and corporate sectors. Narrowing spreads also bode well for the Trust’s holdings of lower-coupon bonds, which tend to offer higher yield and duration relative to their stated maturity. However, the Trust held limited exposure to tobacco, which was the strongest performing sector during the period. The Trust’s small position in US Treasury futures as a strategy for hedging interest rate risk was a slight detractor from performance as rates generally declined during the period.
The views expressed reflect the opinions of BlackRock as of the date of this report and are subject to change based on changes in market, economic or other conditions. These views are not intended to be a forecast of future events and are no guarantee of future results.
| | |
Symbol on NYSE | | MHN |
Initial Offering Date | | September 19, 1997 |
Yield on Closing Market Price as of August 31, 2012 ($15.86)1 | | 6.02% |
Tax Equivalent Yield2 | | 9.26% |
Current Monthly Distribution per Common Share3 | | $0.0795 |
Current Annualized Distribution per Common Share3 | | $0.9540 |
Economic Leverage as of August 31, 20124 | | 40% |
| 1 | | Yield on closing market price is calculated by dividing the current annualized distribution per share by the closing market price. Past performance does not guarantee future results. |
| 2 | | Tax equivalent yield assumes the maximum federal tax rate of 35%. |
| 3 | | The Monthly Distribution per Common Share, declared on October 1, 2012, was decreased to $0.0765 per share. The Yield on Closing Market Price, Current Monthly Distribution per Common Share and Current Annualized Distribution per Common Share do not reflect the new distribution rate. The new distribution rate is not constant and is subject to change in the future. |
| 4 | | Represents VRDP Shares and TOBs as a percentage of total managed assets, which is the total assets of the Trust, including any assets attributable to VRDP Shares and TOBs, minus the sum of accrued liabilities. For a discussion of leveraging techniques utilized by the Trust, please see The Benefits and Risks of Leveraging on page 13. |
The table below summarizes the changes in the Trust’s market price and NAV per share:
| | | | | | | | | | | | | | | | | | | | |
| | | 8/31/12 | | | 8/31/11 | | | Change | | | High | | | Low | |
Market Price | | $ | 15.86 | | | $ | 13.90 | | | | 14.10 | % | | $ | 16.60 | | | $ | 13.73 | |
Net Asset Value | | $ | 15.64 | | | $ | 14.34 | | | | 9.07 | % | | $ | 15.75 | | | $ | 14.34 | |
The following charts show the sector and credit quality allocations of the Trust’s long-term investments:
| | | | | | | | |
| Sector Allocations | | | | | | |
| | | 8/31/12 | | | 8/31/11 | |
Transportation | | | 28 | % | | | 30 | % |
County/City/Special District/School District | | | 28 | | | | 25 | |
Education | | | 11 | | | | 11 | |
State | | | 11 | | | | 11 | |
Utilities | | | 9 | | | | 9 | |
Health | | | 6 | | | | 5 | |
Housing | | | 3 | | | | 3 | |
Corporate | | | 2 | | | | 3 | |
Tobacco | | | 2 | | | | 3 | |
| | | | | | | | |
| Credit Quality Allocations5 | | | | | | |
| | | 8/31/12 | | | 8/31/11 | |
AAA/Aaa | | | 10 | % | | | 10 | % |
AA/Aa | | | 51 | | | | 56 | |
A | | | 25 | | | | 16 | |
BBB/Baa | | | 11 | | | | 13 | |
BB/Ba | | | 2 | | | | 3 | |
Not Rated6 | | | 1 | | | | 2 | |
| 5 | | Using the higher of S&P’s or Moody’s ratings. |
| 6 | | The investment advisor has deemed certain of these non-rated securities to be of investment grade quality. As of August 31, 2012 and August 31, 2011, the market value of these securities was $2,036,337, representing less than 1%, and $4,172,122, representing 1%, respectively, of the Trust’s long-term investments. |
| | | | | | |
| | | | | | | |
| 6 | | ANNUAL REPORT | | AUGUST 31, 2012 | | |
| | |
| Trust Summary as of August 31, 2012 | | BlackRock New Jersey Municipal Bond Trust |
BlackRock New Jersey Municipal Bond Trust’s (BLJ) (the “Trust”) investment objective is to provide current income exempt from regular federal income tax and New Jersey gross income tax. The Trust seeks to achieve its investment objective by investing primarily in municipal bonds exempt from federal income taxes (except that the interest may subject to the federal alternative minimum tax) and New Jersey gross income taxes. Under normal market conditions, the Trust invests at least 80% of its assets in municipal bonds that are investment grade quality at the time of investment. The Trust may invest directly in such securities or synthetically through the use of derivatives.
No assurance can be given that the Trust’s investment objective will be achieved.
For the 12 months ended August 31, 2012, the Trust returned 29.94% based on market price and 21.52% based on NAV. For the same period, the closed-end Lipper New Jersey Municipal Debt Funds category posted an average return of 23.73% based on market price and 17.36% based on NAV. All returns reflect reinvestment of dividends. The Trust’s discount to NAV, which narrowed during the period, accounts for the difference between performance based on price and performance based on NAV. The following discussion relates to performance based on NAV. The Trust’s long duration posture (greater sensitivity to interest rates) contributed positively to performance as the municipal yield curve flattened (i.e., longer-term interest rates fell more than shorter rates) and bond prices moved higher on the long end of the curve. The Trust’s longer-dated holdings in the health, corporate and utilities sectors experienced the strongest price appreciation. The Trust’s small position in US Treasury futures as a strategy for hedging interest rate risk was a slight detractor from performance as rates generally declined during the period.
The views expressed reflect the opinions of BlackRock as of the date of this report and are subject to change based on changes in market, economic or other conditions. These views are not intended to be a forecast of future events and are no guarantee of future results.
| | |
Symbol on NYSE Amex | | BLJ |
Initial Offering Date | | April 30, 2002 |
Yield on Closing Market Price as of August 31, 2012 ($16.66)1 | | 5.26% |
Tax Equivalent Yield2 | | 8.09% |
Current Monthly Distribution per Common Share3 | | $0.0730 |
Current Annualized Distribution per Common Share3 | | $0.8760 |
Economic Leverage as of August 31, 20124 | | 37% |
| 1 | | Yield on closing market price is calculated by dividing the current annualized distribution per share by the closing market price. Past performance does not guarantee future results. |
| 2 | | Tax equivalent yield assumes the maximum federal tax rate of 35%. |
| 3 | | The distribution rate is not constant and is subject to change. |
| 4 | | Represents VRDP Shares and TOBs as a percentage of total managed assets, which is the total assets of the Trust, including any assets attributable to VRDP Shares and TOBs, minus the sum of accrued liabilities. For a discussion of leveraging techniques utilized by the Trust, please see The Benefits and Risks of Leveraging on page 13. |
The table below summarizes the changes in the Trust’s market price and NAV per share:
| | | | | | | | | | | | | | | | | | | | |
| | | 8/31/12 | | | 8/31/11 | | | Change | | | High | | | Low | |
Market Price | | $ | 16.66 | | | $ | 13.60 | | | | 22.50 | % | | $ | 18.65 | | | $ | 13.56 | |
Net Asset Value | | $ | 16.67 | | | $ | 14.55 | | | | 14.57 | % | | $ | 16.72 | | | $ | 14.55 | |
The following charts show the sector and credit quality allocations of the Trust’s long-term investments:
| | | | | | | | |
| Sector Allocations | | | | | | |
| | | 8/31/12 | | | 8/31/11 | |
State | | | 36 | % | | | 20 | % |
Education | | | 18 | | | | 18 | |
Transportation | | | 11 | | | | 23 | |
Health | | | 9 | | | | 12 | |
Housing | | | 8 | | | | 10 | |
Corporate | | | 7 | | | | 9 | |
County/City/Special District/School District | | | 6 | | | | 5 | |
Utilities | | | 5 | | | | 2 | |
Tobacco | | | — | | | | 1 | |
| | | | | | | | |
| Credit Quality Allocations5 | | | | | | |
| | | 8/31/12 | | | 8/31/11 | |
AAA/Aaa | | | 8 | % | | | 8 | % |
AA/Aa | | | 38 | | | | 38 | |
A | | | 36 | | | | 33 | |
BBB/Baa | | | 6 | | | | 8 | |
BB/Ba | | | 5 | | | | 4 | |
B | | | 4 | | | | 4 | |
Not Rated6 | | | 3 | | | | 5 | |
| 5 | | Using the higher of S&P’s or Moody’s ratings. |
| 6 | | The investment advisor has deemed certain of these non-rated securities to be of investment grade quality. As of August 31, 2012 and August 31, 2011, the market value of these securities was $1,025,320 and $987,040, each representing 2%, respectively, of the Trust’s long-term investments. |
| | | | | | |
| | | | | | | |
| | ANNUAL REPORT | | AUGUST 31, 2012 | | 7 |
| | | | |
| Trust Summary as of August 31, 2012 | | BlackRock New York Municipal Bond Trust |
BlackRock New York Municipal Bond Trust’s (BQH) (the “Trust”) investment objective is to provide current income exempt from regular federal income taxes and New York State and New York City personal income taxes. The Trust seeks to achieve its investment objective by investing primarily in municipal bonds exempt from federal income taxes (except that the interest may be subject to the federal alternative minimum tax) and New York State and New York City personal income taxes. Under normal market conditions, the Trust invests at least 80% of its assets in municipal bonds that are investment grade quality at the time of investment. The Trust may invest directly in such securities or synthetically through the use of derivatives.
No assurance can be given that the Trust’s investment objective will be achieved.
For the 12 months ended August 31, 2012, the Trust returned 18.68% based on market price and 17.99% based on NAV. For the same period, the closed-end Lipper New York Municipal Debt Funds category posted an average return of 19.66% based on market price and 14.48% based on NAV. All returns reflect reinvestment of dividends. The Trust moved from a discount to NAV to a premium by period end, which accounts for the difference between performance based on price and performance based on NAV. The following discussion relates to performance based on NAV. The Trust’s neutral-to-long average duration (greater sensitivity to interest rates) contributed positively to performance as interest rates generally declined over the one-year period. A preference for longer-dated maturities enhanced returns as the municipal yield curve flattened (long-term interest rates fell more than short and intermediate rates). The Trust benefited from a tightening of credit spreads during the period, with particularly strong performance from its allocations to the health and corporate sectors. Narrowing spreads also bode well for the Trust’s holdings of lower-coupon bonds, which tend to offer higher yield and duration relative to their stated maturity. However, the Trust held limited exposure to tobacco, which was the strongest performing sector during the period. The Trust’s small position in US Treasury futures as a strategy for hedging interest rate risk was a slight detractor from performance as rates generally declined during the period.
The views expressed reflect the opinions of BlackRock as of the date of this report and are subject to change based on changes in market, economic or other conditions. These views are not intended to be a forecast of future events and are no guarantee of future results.
| | |
Symbol on NYSE | | BQH |
Initial Offering Date | | April 30, 2002 |
Yield on Closing Market Price as of August 31, 2012 ($16.56)1 | | 5.36% |
Tax Equivalent Yield2 | | 8.25% |
Current Monthly Distribution per Common Share3 | | $0.0740 |
Current Annualized Distribution per Common Share3 | | $0.8880 |
Economic Leverage as of August 31, 20124 | | 39% |
| 1 | | Yield on closing market price is calculated by dividing the current annualized distribution per share by the closing market price. Past performance does not guarantee future results. |
| 2 | | Tax equivalent yield assumes the maximum federal tax rate of 35%. |
| 3 | | The Monthly Distribution per Common Share, declared on October 1, 2012, was decreased to $0.0710 per share. The Yield on Closing Market Price, Current Monthly Distribution per Common Share and Current Annualized Distribution per Common Share do not reflect the new distribution rate. The new distribution rate is not constant and is subject to change in the future. |
| 4 | | Represents VRDP Shares and TOBs as a percentage of total managed assets, which is the total assets of the Trust, including any assets attributable to VRDP Shares and TOBs, minus the sum of accrued liabilities. For a discussion of leveraging techniques utilized by the Trust, please see The Benefits and Risks of Leveraging on page 13. |
The table below summarizes the changes in the Trust’s market price and NAV per share:
| | | | | | | | | | | | | | | | | | | | |
| | | 8/31/12 | | | 8/31/11 | | | Change | | | High | | | Low | |
Market Price | | $ | 16.56 | | | $ | 14.83 | | | | 11.67 | % | | $ | 17.07 | | | $ | 14.61 | |
Net Asset Value | | $ | 16.53 | | | $ | 14.89 | | | | 11.01 | % | | $ | 16.67 | | | $ | 14.88 | |
The following charts show the sector and credit quality allocations of the Trust’s long-term investments:
| | | | | | | | |
| Sector Allocations | | | | | | |
| | | 8/31/12 | | | 8/31/11 | |
County/City/Special District/School District | | | 27 | % | | | 20 | % |
Education | | | 17 | | | | 11 | |
Health | | | 12 | | | | 7 | |
Corporate | | | 11 | | | | 9 | |
Transportation | | | 11 | | | | 9 | |
State | | | 9 | | | | 20 | |
Utilities | | | 9 | | | | 6 | |
Housing | | | 4 | | | | 13 | |
Tobacco | | | — | | | | 5 | |
| | | | | | | | |
| Credit Quality Allocations5 | | | | | | |
| | | 8/31/12 | | | 8/31/11 | |
AAA/Aaa | | | 13 | % | | | 11 | % |
AA/Aa | | | 33 | | | | 43 | |
A | | | 37 | | | | 20 | |
BBB/Baa | | | 10 | | | | 16 | |
BB/Ba | | | 1 | | | | 2 | |
B | | | — | | | | 3 | |
Not Rated | | | 6 | | | | 5 | |
| 5 | | Using the higher of S&P’s or Moody’s ratings. |
| | | | | | |
| | | | | | | |
| 8 | | ANNUAL REPORT | | AUGUST 31, 2012 | | |
| | |
| Trust Summary as of August 31, 2012 | | BlackRock New York Municipal Income Quality Trust |
BlackRock New York Municipal Income Quality Trust’s (BSE) (the “Trust”) investment objective is to provide current income exempt from federal income tax, including the alternative minimum tax, and New York State and New York City personal income taxes. The Trust seeks to achieve its investment objective by investing at least 80% of its assets in municipal obligations exempt from federal income taxes (including the alternative minimum tax) and New York State and New York City personal income taxes. Under normal market conditions, the Trust invests primarily in municipal bonds that are investment grade quality at the time of investment. The Trust may invest directly in such securities or synthetically through the use of derivatives.
No assurance can be given that the Trust’s investment objective will be achieved.
For the 12 months ended August 31, 2012, the Trust returned 23.07% based on market price and 15.23% based on NAV. For the same period, the closed-end Lipper New York Municipal Debt Funds category posted an average return of 19.66% based on market price and 14.48% based on NAV. All returns reflect reinvestment of dividends. The Trust moved from a discount to NAV to a premium by period end, which accounts for the difference between performance based on price and performance based on NAV. The following discussion relates to performance based on NAV. The Trust’s neutral-to-long average duration (greater sensitivity to interest rates) contributed positively to performance as interest rates generally declined over the one-year period. A preference for longer-dated maturities enhanced returns as the municipal yield curve flattened (long-term interest rates fell more than short and intermediate rates). The Trust benefited from a tightening of credit spreads during the period, with particularly strong performance from its allocations to the health and corporate sectors. Narrowing spreads also bode well for the Trust’s holdings of lower-coupon bonds, which tend to offer higher yield and duration relative to their stated maturity. However, the Trust held limited exposure to tobacco, which was the strongest performing sector during the period. The Trust’s small position in US Treasury futures as a strategy for hedging interest rate risk was a slight detractor from performance as rates generally declined during the period.
The views expressed reflect the opinions of BlackRock as of the date of this report and are subject to change based on changes in market, economic or other conditions. These views are not intended to be a forecast of future events and are no guarantee of future results.
| | |
Symbol on NYSE | | BSE |
Initial Offering Date | | October 31, 2002 |
Yield on Closing Market Price as of August 31, 2012 ($15.74)1 | | 5.45% |
Tax Equivalent Yield2 | | 8.38% |
Current Monthly Distribution per Common Share3 | | $0.0715 |
Current Annualized Distribution per Common Share3 | | $0.8580 |
Economic Leverage as of August 31, 20124 | | 38% |
| 1 | | Yield on closing market price is calculated by dividing the current annualized distribution per share by the closing market price. Past performance does not guarantee future results. |
| 2 | | Tax equivalent yield assumes the maximum federal tax rate of 35%. |
| 3 | | The distribution rate is not constant and is subject to change. |
| 4 | | Represents VRDP Shares and TOBs as a percentage of total managed assets, which is the total assets of the Trust, including any assets attributable to VRDP Shares and TOBs, minus the sum of accrued liabilities. For a discussion of leveraging techniques utilized by the Trust, please see The Benefits and Risks of Leveraging on page 13. |
The table below summarizes the changes in the Trust’s market price and NAV per share:
| | | | | | | | | | | | | | | | | | | | |
| | | 8/31/12 | | | 8/31/11 | | | Change | | | High | | | Low | |
Market Price | | $ | 15.74 | | | $ | 13.54 | | | | 16.25 | % | | $ | 17.05 | | | $ | 13.49 | |
Net Asset Value | | $ | 15.51 | | | $ | 14.25 | | | | 8.84 | % | | $ | 15.62 | | | $ | 14.25 | |
The following charts show the sector and credit quality allocations of the Trust’s long-term investments:
| | | | | | | | |
| Sector Allocations | | | | | | |
| | | 8/31/12 | | | 8/31/11 | |
County/City/Special District/School District | | | 23 | % | | | 16 | % |
Education | | | 22 | | | | 29 | |
Transportation | | | 20 | | | | 25 | |
Utilities | | | 13 | | | | 10 | |
Health | | | 11 | | | | 11 | |
State | | | 9 | | | | 8 | |
Corporate | | | 2 | | | | 1 | |
| | | | | | | | |
| Credit Quality Allocations5 | | | | | | |
| | | 8/31/12 | | | 8/31/11 | |
AAA/Aaa | | | 12 | % | | | 9 | % |
AA/Aa | | | 42 | | | | 49 | |
A | | | 28 | | | | 19 | |
BBB/Baa | | | 12 | | | | 15 | |
BB/Ba | | | 2 | | | | 2 | |
Not Rated6 | | | 4 | | | | 6 | |
| 5 | | Using the higher of S&P’s or Moody’s ratings. |
| 6 | | The investment advisor has deemed certain of these non-rated securities to be of investment grade quality. As of August 31, 2012 and August 31, 2011, the market value of these securities was $3,250,435, representing 2%, and $8,358,790, representing 6%, respectively, of the Trust’s long-term investments. |
| | | | | | |
| | | | | | | |
| | ANNUAL REPORT | | AUGUST 31, 2012 | | 9 |
| | | | |
| Trust Summary as of August 31, 2012 | | BlackRock New York Municipal Income Trust II |
BlackRock New York Municipal Income Trust II’s (BFY) (the “Trust”) investment objective is to provide current income exempt from regular federal income tax and New York State and New York City personal income taxes. The Trust seeks to achieve its investment objective by investing primarily in municipal bonds exempt from federal income taxes (except that the interest may be subject to the federal alternative minimum tax) and New York State and New York City personal income taxes. Under normal market conditions, the Trust invests at least 80% of its assets in municipal bonds that are investment grade quality at the time of investment. The Trust may invest directly in such securities or synthetically through the use of derivatives.
No assurance can be given that the Trust’s investment objective will be achieved.
For the 12 months ended August 31, 2012, the Trust returned 24.61% based on market price and 17.00% based on NAV. For the same period, the closed-end Lipper New York Municipal Debt Funds category posted an average return of 19.66% based on market price and 14.48% based on NAV. All returns reflect reinvestment of dividends. The Trust moved from a discount to NAV to a premium by period end, which accounts for the difference between performance based on price and performance based on NAV. The following discussion relates to performance based on NAV. The Trust’s neutral-to-long average duration (greater sensitivity to interest rates) contributed positively to performance as interest rates generally declined over the one-year period. A preference for longer-dated maturities enhanced returns as the municipal yield curve flattened (long-term interest rates fell more than short and intermediate rates). The Trust benefited from a tightening of credit spreads during the period, with particularly strong performance from its allocations to the health and corporate sectors. Narrowing spreads also bode well for the Trust’s holdings of lower-coupon bonds, which tend to offer higher yield and duration relative to their stated maturity. However, the Trust held limited exposure to tobacco, which was the strongest performing sector during the period. The Trust’s small position in US Treasury futures as a strategy for hedging interest rate risk was a slight detractor from performance as rates generally declined during the period.
The views expressed reflect the opinions of BlackRock as of the date of this report and are subject to change based on changes in market, economic or other conditions. These views are not intended to be a forecast of future events and are no guarantee of future results.
| | |
Symbol on NYSE Amex | | BFY |
Initial Offering Date | | July 30, 2002 |
Yield on Closing Market Price as of August 31, 2012 ($16.81)1 | | 5.78% |
Tax Equivalent Yield2 | | 8.89% |
Current Monthly Distribution per Common Share3 | | $0.0810 |
Current Annualized Distribution per Common Share3 | | $0.9720 |
Economic Leverage as of August 31, 20124 | | 39% |
| 1 | | Yield on closing market price is calculated by dividing the current annualized distribution per share by the closing market price. Past performance does not guarantee future results. |
| 2 | | Tax equivalent yield assumes the maximum federal tax rate of 35%. |
| 3 | | The Monthly Distribution per Common Share, declared on October 1, 2012, was decreased to $0.0770 per share. The Yield on Closing Market Price, Current Monthly Distribution per Common Share and Current Annualized Distribution per Common Share do not reflect the new distribution rate. The new distribution rate is not constant and is subject to change in the future. |
| 4 | | Represents VRDP Shares and TOBs as a percentage of total managed assets, which is the total assets of the Trust, including any assets attributable to VRDP Shares and TOBs, minus the sum of accrued liabilities. For a discussion of leveraging techniques utilized by the Trust, please see The Benefits and Risks of Leveraging on page 13. |
The table below summarizes the changes in the Trust’s market price and NAV per share:
| | | | | | | | | | | | | | | | | | | | |
| | | 8/31/12 | | | 8/31/11 | | | Change | | | High | | | Low | |
Market Price | | $ | 16.81 | | | $ | 14.38 | | | | 16.90 | % | | $ | 17.51 | | | $ | 14.38 | |
Net Asset Value | | $ | 16.09 | | | $ | 14.66 | | | | 9.75 | % | | $ | 16.18 | | | $ | 14.57 | |
The following charts show the sector and credit quality allocations of the Trust’s long-term investments:
| | | | | | | | |
| Sector Allocations | | | | | | |
| | | 8/31/12 | | | 8/31/11 | |
County/City/Special District/School District | | | 28 | % | | | 21 | % |
Health | | | 14 | | | | 12 | |
Transportation | | | 12 | | | | 13 | |
Education | | | 12 | | | | 16 | |
Utilities | | | 10 | | | | 11 | |
Corporate | | | 10 | | | | 10 | |
State | | | 8 | | | | 6 | |
Housing | | | 6 | | | | 6 | |
Tobacco | | | — | | | | 5 | |
| | | | | | | | |
| Credit Quality Allocations5 | | | | | | |
| | | 8/31/12 | | | 8/31/11 | |
AAA/Aaa | | | 13 | % | | | 20 | % |
AA/Aa | | | 34 | | | | 31 | |
A | | | 33 | | | | 26 | |
BBB/Baa | | | 12 | | | | 12 | |
BB/Ba | | | 2 | | | | 3 | |
B | | | — | | | | 3 | |
Not Rated | | | 6 | 6 | | | 5 | |
| 5 | | Using the higher of S&P’s or Moody’s ratings. |
| 6 | | The investment advisor has deemed certain of these non-rated securities to be of investment grade quality. As of August 31, 2012, the market value of these securities was $316,389, representing less than 1% of the Trust’s long-term investments. |
| | | | | | |
| | | | | | | |
| 10 | | ANNUAL REPORT | | AUGUST 31, 2012 | | |
| | |
| Trust Summary as of August 31, 2012 | | BlackRock Virginia Municipal Bond Trust |
BlackRock Virginia Municipal Bond Trust’s (BHV) (the “Trust”) investment objective is to provide current income exempt from regular federal income tax and Virginia personal income taxes. The Trust seeks to achieve its investment objectives by investing primarily in municipal bonds exempt from federal income taxes (except that the interest may be subject to the federal alternative minimum tax) and Virginia personal income taxes. The Trust invests, under normal market conditions, at least 80% of its assets in municipal bonds that are investment grade quality at the time of investment. The Trust may invest directly in such securities or synthetically through the use of derivatives.
No assurance can be given that the Trust’s investment objective will be achieved.
For the 12 months ended August 31, 2012, the Trust returned 16.23% based on market price and 15.19% based on NAV. For the same period, the closed-end Lipper Other States Municipal Debt Funds category posted an average return of 21.36% based on market price and 14.84% based on NAV. All returns reflect reinvestment of dividends. The Trust’s premium to NAV, which widened during the period, accounts for the difference between performance based on price and performance based on NAV. The following discussion relates to performance based on NAV. During the period, municipal bond prices generally rose as the yield curve flattened (longer-term interest rates fell more than shorter-term rates) and credit spreads tightened. Given these market conditions, the Trust’s exposure to longer-maturity bonds and lower-quality investment grade bonds had a significant positive impact on performance. Exposure to the health sector also boosted returns as these bonds particularly benefited from the decline in interest rates and spread tightening during the period. The Trust’s income component was negatively impacted by the recent high level of refunding activity in the market as issuers were enticed to refinance their outstanding debt at significantly lower interest rates. The Trust’s small position in US Treasury futures as a strategy for hedging interest rate risk was a slight detractor from performance as rates generally declined during the period.
The views expressed reflect the opinions of BlackRock as of the date of this report and are subject to change based on changes in market, economic or other conditions. These views are not intended to be a forecast of future events and are no guarantee of future results.
| | |
Symbol on NYSE Amex | | BHV |
Initial Offering Date | | April 30, 2002 |
Yield on Closing Market Price as of August 31, 2012 ($19.58)1 | | 4.78% |
Tax Equivalent Yield2 | | 7.35% |
Current Monthly Distribution per Common Share3 | | $0.0780 |
Current Annualized Distribution per Common Share3 | | $0.9360 |
Economic Leverage as of August 31, 20124 | | 37% |
| 1 | | Yield on closing market price is calculated by dividing the current annualized distribution per share by the closing market price. Past performance does not guarantee future results. |
| 2 | | Tax equivalent yield assumes the maximum federal tax rate of 35%. |
| 3 | | The distribution rate is not constant and is subject to change. |
| 4 | | Represents VRDP Shares and TOBs as a percentage of total managed assets, which is the total assets of the Trust, including any assets attributable to VRDP Shares and TOBs, minus the sum of accrued liabilities. For a discussion of leveraging techniques utilized by the Trust, please see The Benefits and Risks of Leveraging on page 13. |
The table below summarizes the changes in the Trust’s market price and NAV per share:
| | | | | | | | | | | | | | | | | | | | |
| | | 8/31/12 | | | 8/31/11 | | | Change | | | High | | | Low | |
Market Price | | $ | 19.58 | | | $ | 17.77 | | | | 10.19 | % | | $ | 21.84 | | | $ | 17.77 | |
Net Asset Value | | $ | 16.74 | | | $ | 15.33 | | | | 9.20 | % | | $ | 16.82 | | | $ | 15.27 | |
The following charts show the sector and credit quality allocations of the Trust’s long-term investments:
| | | | | | | | |
| Sector Allocations | | | | | | |
| | | 8/31/12 | | | 8/31/11 | |
Health | | | 20 | % | | | 19 | % |
Education | | | 18 | | | | 15 | |
Transportation | | | 15 | | | | 13 | |
State | | | 13 | | | | 6 | |
Housing | | | 10 | | | | 15 | |
County/City/Special District/School District | | | 9 | | | | 12 | |
Utilities | | | 8 | | | | 9 | |
Corporate | | | 7 | | | | 8 | |
Tobacco | | | — | | | | 3 | |
| | | | | | | | |
| Credit Quality Allocations5 | | | | | | |
| | | 8/31/12 | | | 8/31/11 | |
AAA/Aaa | | | 18 | % | | | 18 | % |
AA/Aa | | | 46 | | | | 34 | |
A | | | 18 | | | | 20 | |
BBB/Baa | | | 8 | | | | 14 | |
Not Rated6 | | | 10 | | | | 14 | |
| 5 | | Using the higher of S&P’s or Moody’s ratings. |
| 6 | | The investment advisor has deemed certain of these non-rated securities to be of investment grade quality. As of August 31, 2012 and August 31, 2011, the market value of these securities was $2,794,845 and $2,649,194, each representing 7%, respectively, of the Trust’s long-term investments. |
| | | | | | |
| | | | | | | |
| | ANNUAL REPORT | | AUGUST 31, 2012 | | 11 |
| | | | |
| Trust Summary as of August 31, 2012 | | The Massachusetts Health & Education Tax-Exempt Trust |
The Massachusetts Health & Education Tax-Exempt Trust’s (MHE) (the “Trust”) investment objective is to provide as high a level of current income exempt from both regular federal income taxes and Massachusetts personal income taxes as is consistent with the preservation of shareholders’ capital. The Trust seeks to achieve its investment objective by investing primarily in tax-exempt obligations (including bonds, notes and capital lease obligations) issued on behalf of Massachusetts not-for-profit health and education institutions (“Massachusetts Health & Education Obligations”). The Trust invests, under normal market conditions, at least 80% of its assets in Massachusetts Health & Education Obligations and at least 80% of its assets in obligations that are rated investment grade at the time of investment. Under normal market conditions, the Trust invests its assets so that at least 80% of the income generated by the Trust is exempt from federal income taxes, including federal alternative minimum tax, and Massachusetts personal income taxes. The Trust invests primarily in long term municipal obligations with maturities of more than ten years. The Trust may invest directly in such securities or synthetically through the use of derivatives.
No assurance can be given that the Trust’s investment objective will be achieved.
For the 12 months ended August 31, 2012, the Trust returned 20.66% based on market price and 17.02% based on NAV. For the same period, the closed-end Lipper Other States Municipal Debt Funds category posted an average return of 21.36% based on market price and 14.84% based on NAV. All returns reflect reinvestment of dividends. The Trust’s premium to NAV, which widened during the period, accounts for the difference between performance based on price and performance based on NAV. The following discussion relates to performance based on NAV. The Trust’s exposure to spread sectors, including education, health and housing bonds enhanced performance, as these bonds provided a higher degree of incremental yield in the low interest rate environment. The Trust’s small position in US Treasury futures as a strategy for hedging interest rate risk was a slight detractor from performance as rates generally declined during the period. The Trust’s small position in US Treasury futures as a strategy for hedging interest rate risk was a slight detractor from performance as rates generally declined during the period.
The views expressed reflect the opinions of BlackRock as of the date of this report and are subject to change based on changes in market, economic or other conditions. These views are not intended to be a forecast of future events and are no guarantee of future results.
| | |
Symbol on NYSE Amex | | MHE |
Initial Offering Date | | July 23, 1993 |
Yield on Closing Market Price as of August 31, 2012 ($14.91)1 | | 5.03% |
Tax Equivalent Yield2 | | 7.74% |
Current Monthly Distribution per Common Share3 | | $0.0625 |
Current Annualized Distribution per Common Share3 | | $0.7500 |
Economic Leverage as of August 31, 20124 | | 38% |
| 1 | | Yield on closing market price is calculated by dividing the current annualized distribution per share by the closing market price. Past performance does not guarantee future results. |
| 2 | | Tax equivalent yield assumes the maximum federal tax rate of 35%. |
| 3 | | The distribution rate is not constant and is subject to change. |
| 4 | | Represents VRDP Shares and TOBs as a percentage of total managed assets, which is the total assets of the Trust, including any assets attributable to VRDP Shares and TOBs, minus the sum of accrued liabilities. For a discussion of leveraging techniques utilized by the Trust, please see The Benefits and Risks of Leveraging on page 13. |
The table below summarizes the changes in the Trust’s market price and NAV per share:
| | | | | | | | | | | | | | | | | | | | |
| | | 8/31/12 | | | 8/31/11 | | | Change | | | High | | | Low | |
Market Price | | $ | 14.91 | | | $ | 13.11 | | | | 13.73 | % | | $ | 16.29 | | | $ | 13.11 | |
Net Asset Value | | $ | 14.35 | | | $ | 13.01 | | | | 10.30 | % | | $ | 14.43 | | | $ | 13.01 | |
The following charts show the sector and credit quality allocations of the Trust’s long-term investments:
| | | | | | | | |
| Sector Allocations | | | | | | |
| | | 8/31/12 | | | 8/31/11 | |
Education | | | 58 | % | | | 50 | % |
Health | | | 20 | | | | 27 | |
State | | | 17 | | | | 11 | |
Housing | | | 5 | | | | 6 | |
Corporate | | | — | | | | 4 | |
Utilities | | | — | | | | 2 | |
| | | | | | | | |
| Credit Quality Allocations5 | | | | | | |
| | | 8/31/12 | | | 8/31/11 | |
AAA/Aaa | | | 7 | % | | | 12 | % |
AA/Aa | | | 51 | | | | 38 | |
A | | | 32 | | | | 33 | |
BBB/Baa | | | 9 | | | | 11 | |
Not Rated6 | | | 1 | | | | 6 | |
| 5 | | Using the higher of S&P’s or Moody’s ratings. |
| 6 | | The investment advisor has deemed certain of these non-rated securities to be of investment grade quality. As of August 31, 2012 and August 31, 2011, the market value of these securities was $755,717, representing 1%, and $855,291, representing 2%, respectively, of the Trust’s long-term investments. |
| | | | | | |
| | | | | | | |
| 12 | | ANNUAL REPORT | | AUGUST 31, 2012 | | |
| | |
| The Benefits and Risks of Leveraging | | |
The Trusts may utilize leverage to seek to enhance the yield and NAV of their common shares (“Common Shares”). However, these objectives cannot be achieved in all interest rate environments.
To obtain leverage, the Trusts issue Variable Rate Demand Preferred Shares (“VRDP Shares”) and previously issued and had outstanding Auction Market Preferred Shares (“AMPS”) (VRDP Shares and AMPS are collectively referred to as “Preferred Shares”). Preferred Shares pay dividends at prevailing short-term interest rates, and the Trusts invest the proceeds in long-term municipal bonds. In general, the concept of leveraging is based on the premise that the financing cost of assets to be obtained from leverage, which will be based on short-term interest rates, will normally be lower than the income earned by each Trust on its longer-term portfolio investments. To the extent that the total assets of each Trust (including the assets obtained from leverage) are invested in higher-yielding portfolio investments, each Trust’s shareholders will benefit from the incremental net income.
The interest earned on securities purchased with the proceeds from leverage is paid to shareholders in the form of dividends, and the value of these portfolio holdings is reflected in the per share NAV. However, in order to benefit shareholders, the yield curve must be positively sloped; that is, short-term interest rates must be lower than long-term interest rates. If the yield curve becomes negatively sloped, meaning short-term interest rates exceed long-term interest rates, income to shareholders will be lower than if the Trusts had not used leverage.
To illustrate these concepts, assume a Trust’s Common Shares capitalization is $100 million and it issues Preferred Shares for an additional $50 million, creating a total value of $150 million available for investment in long-term municipal bonds. If prevailing short-term interest rates are 3% and long-term interest rates are 6%, the yield curve has a strongly positive slope. In this case, the Trust pays dividends on the $50 million of Preferred Shares based on the lower short-term interest rates. At the same time, the securities purchased by the Trust with assets received from Preferred Shares issuance earn income based on long-term interest rates. In this case, the dividends paid to holders of Preferred Shares (“Preferred Shareholders”) are significantly lower than the income earned on the Trust’s long-term investments, and therefore the holders of Common Shares (“Common Shareholders”) are the beneficiaries of the incremental net income.
If short-term interest rates rise, narrowing the differential between short-term and long-term interest rates, the incremental net income pickup will be reduced or eliminated completely. Furthermore, if prevailing short-term interest rates rise above long-term interest rates, the yield curve has a negative slope. In this case, the Trust pays higher short-term interest rates whereas the Trust’s total portfolio earns income based on lower long-term interest rates.
Furthermore, the value of the Trusts’ portfolio investments generally varies inversely with the direction of long-term interest rates, although other factors can influence the value of portfolio investments. In contrast, the redemption value of the Trusts’ Preferred Shares and/or debt securities does not fluctuate in relation to interest rates. As a result, changes in
interest rates can influence the Trusts’ NAVs positively or negatively in addition to the impact on Trust performance from leverage from Preferred Shares discussed above.
The Trusts may also leverage their assets through the use of TOBs, as described in Note 1 of the Notes to Financial Statements. TOB investments generally will provide the Trusts with economic benefits in periods of declining short-term interest rates, but expose the Trusts to risks during periods of rising short-term interest rates similar to those associated with Preferred Shares issued by the Trusts, as described above. Additionally, fluctuations in the market value of municipal bonds deposited into the TOB trust may adversely affect each Trust’s NAV per share.
The use of leverage may enhance opportunities for increased income to the Trusts and Common Shareholders, but as described above, it also creates risks as short- or long-term interest rates fluctuate. Leverage also will generally cause greater changes in the Trusts’ NAVs, market prices and dividend rates than comparable portfolios without leverage. If the income derived from securities purchased with assets received from leverage exceeds the cost of leverage, the Trusts’ net income will be greater than if leverage had not been used. Conversely, if the income from the securities purchased is not sufficient to cover the cost of leverage, each Trust’s net income will be less than if leverage had not been used, and therefore the amount available for distribution to Common Shareholders will be reduced. Each Trust may be required to sell portfolio securities at inopportune times or at distressed values in order to comply with regulatory requirements applicable to the use of leverage or as required by the terms of leverage instruments, which may cause a Trust to incur losses. The use of leverage may limit each Trust’s ability to invest in certain types of securities or use certain types of hedging strategies, such as in the case of certain restrictions imposed by rating agencies that rate the Preferred Shares issued by the Trusts. Each Trust will incur expenses in connection with the use of leverage, all of which are borne by Common Shareholders and may reduce income to the Common Shares.
Under the Investment Company Act of 1940, as amended (the “1940 Act”), the Trusts are permitted to issue senior securities in the form of equity securities (e.g., Preferred Shares) up to 50% of their total managed assets (each Trust’s total assets less the sum of its accrued liabilities). In addition, each Trust with VRDP Shares limits its economic leverage to 45% of its total managed assets. As of August 31, 2012, the Trusts had economic leverage from Preferred Shares and/or TOBs as a percentage of their total managed assets as follows:
| | | | |
| | | Percent of
Economic
Leverage | |
BZM | | | 36 | % |
MHN | | | 40 | % |
BLJ | | | 37 | % |
BQH | | | 39 | % |
BSE | | | 38 | % |
BFY | | | 39 | % |
BHV | | | 37 | % |
MHE | | | 38 | % |
| | | | | | |
| | | | | | | |
| | ANNUAL REPORT | | AUGUST 31, 2012 | | 13 |
| | |
| Derivative Financial Instruments | | |
The Trusts may invest in various derivative financial instruments, including financial futures contracts, as specified in Note 2 of the Notes to Financial Statements, which may constitute forms of economic leverage. Such derivative financial instruments are used to obtain exposure to a market without owning or taking physical custody of securities or to hedge market and interest rate risks. Derivative financial instruments involve risks, including the imperfect correlation between the value of a derivative financial instrument and the underlying asset, possible default of the counterparty to the transaction or illiquidity of the derivative financial instrument. The Trusts’ ability to use a derivative
financial instrument successfully depends on the investment advisor’s ability to predict pertinent market movements accurately, which cannot be assured. The use of derivative financial instruments may result in losses greater than if they had not been used, may require a Trust to sell or purchase portfolio investments at inopportune times or for distressed values, may limit the amount of appreciation a Trust can realize on an investment, may result in lower dividends paid to shareholders or may cause a Trust to hold an investment that it might otherwise sell. The Trusts’ investments in these instruments are discussed in detail in the Notes to Financial Statements.
| | | | | | |
| | | | | | | |
| 14 | | ANNUAL REPORT | | AUGUST 31, 2012 | | |
| | |
| Schedule of Investments August 31, 2012 | | BlackRock Maryland Municipal Bond Trust (BZM) (Percentages shown are based on Net Assets) |
| | | | | | | | |
| Municipal Bonds | | Par
(000) | | | Value | |
| | | | | | | | |
Maryland — 119.6% | | | | | | | | |
Corporate — 0.9% | | | | | |
Maryland EDC, Refunding RB, Potomac Electric Power Co., 6.20%, 9/01/22 | | $ | 250 | | | $ | 303,723 | |
County/City/Special District/School District — 27.9% | |
City of Annapolis Maryland, Tax Allocation Bonds, Park Place Project, Series A, 5.35%, 7/01/34 | | | 483 | | | | 486,478 | |
City of Baltimore Maryland, Special Tax Bonds, SO, Harborview Lot No. 2, 6.50%, 7/01/31 | | | 960 | | | | 992,880 | |
County of Anne Arundel Maryland, RB, Community College Project, 5.25%, 9/01/28 | | | 1,870 | | | | 1,907,400 | |
County of Montgomery Maryland, GO, Consolidated Public Improvement Bonds, Series A, 5.00%, 7/01/26 | | | 500 | | | | 600,560 | |
County of Prince George’s Maryland, SO, National Harbor Project, 5.20%, 7/01/34 | | | 1,500 | | | | 1,533,705 | |
State of Maryland, First Series B, 5.00%, 3/15/22 | | | 250 | | | | 303,002 | |
State of Maryland, GO, State & Local Facilities Loan, Second Series B, 3.00%, 8/01/27 | | | 2,500 | | | | 2,568,200 | |
State of Maryland, GO, Refunding, State & Local Facilities Loan Third, Series C, 5.00%, 11/01/20 | | | 500 | | | | 636,450 | |
| | | | | | | | |
| | | | | | | | 9,028,675 | |
Education — 26.1% | | | | | | | | |
Anne County Arundel, Refunding RB, Maryland Economic Development, Anne Arundel Community College Project: | | | | | | | | |
4.00%, 9/01/27 | | | 510 | | | | 555,620 | |
3.25%, 9/01/28 | | | 360 | | | | 364,489 | |
Maryland Health & Higher Educational Facilities Authority, RB, Board of Child Care, 5.38%, 7/01/32 | | | 2,000 | | | | 2,003,080 | |
Maryland Health & Higher Educational Facilities Authority, Refunding RB: | | | | | | | | |
Loyola University Maryland Issue, Series A, 5.00%, 10/01/39 | | | 900 | | | | 1,027,818 | |
Goucher College, Series A, 5.00%, 7/01/34 | | | 1,000 | | | | 1,128,280 | |
Johns Hopkins University Project, Series A, 5.00%, 7/01/27 | | | 1,000 | | | | 1,230,930 | |
Johns Hopkins University Project, Series A, 4.00%, 7/01/37 | | | 500 | | | | 532,195 | |
Notre Dame Maryland University, 5.00%, 10/01/42 | | | 500 | | | | 533,860 | |
Maryland Industrial Development Financing Authority, RB, Our Lady Of Good Counsel School, Series A, 6.00%, 5/01/35 | | | 1,000 | | | | 1,047,730 | |
| | | | | | | | |
| | | | | | | | 8,424,002 | |
Health — 17.8% | | | | | | | | |
County of Howard Maryland, Refunding RB, Vantage House Facility, Series A, 5.25%, 4/01/33 | | | 500 | | | | 497,795 | |
County of Montgomery Maryland, Refunding RB, 5.00%, 12/01/40 | | | 1,000 | | | | 1,117,610 | |
Gaithersburg Maryland, Refunding RB, Asbury Maryland Obligation, Series B, 6.00%, 1/01/23 | | | 250 | | | | 276,307 | |
| | | | | | | | |
| Municipal Bonds | | Par
(000) | | | Value | |
| | | | | | | | |
Maryland (concluded) | | | | | | | | |
Health (concluded) | | | | | | | | |
Maryland Health & Higher Educational Facilities Authority, RB, Anne Arundel Health System, 5.00%, 7/01/40 | | $ | 1,000 | | | $ | 1,070,950 | |
Maryland Health & Higher Educational Facilities Authority, Refunding RB: | | | | | | | | |
Charlestown Community, 6.25%, 1/01/41 | | | 1,000 | | | | 1,141,310 | |
Doctor’s Community Hospital, 5.75%, 7/01/38 | | | 500 | | | | 540,840 | |
University of Maryland Medical System, 5.13%, 7/01/39 | | | 1,000 | | | | 1,092,240 | |
| | | | | | | | |
| | | | | | | | 5,737,052 | |
Housing — 15.3% | | | | | | | | |
Maryland Community Development Administration, RB: | | | | | | | | |
AMT, 5.10%, 9/01/37 | | | 1,000 | | | | 1,041,970 | |
Housing, Series A, 4.05%, 7/01/42 | | | 1,220 | | | | 1,235,104 | |
Residential, Series A, 5.05%, 9/01/39 | | | 500 | | | | 532,040 | |
Residential, Series B, 4.75%, 9/01/39 | | | 150 | | | | 157,089 | |
Maryland Community Development Administration, Refunding RB, Residential, Series B, 5.25%, 9/01/35 | | | 1,775 | | | | 1,961,091 | |
| | | | | | | | |
| | | | | | | | 4,927,294 | |
Transportation — 14.7% | | | | | | | | |
Maryland EDC, RB: | | | | | | | | |
Term Project, Series B, 5.75%, 6/01/35 | | | 500 | | | | 546,010 | |
Transportation Facilities Project, Series A, 5.75%, 6/01/35 | | | 500 | | | | 545,425 | |
Maryland State Department of Transportation, RB, Series B, 4.00%, 5/15/22 | | | 1,000 | | | | 1,133,900 | |
Maryland State Transportation Authority, RB, Baltimore/Washington International Thurgood Marshall Airport, Series A, AMT, 4.00%, 6/01/29 | | | 1,925 | | | | 2,014,224 | |
Maryland State Transportation Authority, Refunding RB, Baltimore/Washington International Thurgood Marshall Airport Parking Projects, AMT, 5.00%, 3/01/23 | | | 445 | | | | 518,176 | |
| | | | | | | | |
| | | | | | | | 4,757,735 | |
Utilities — 16.9% | | | | | | | | |
City of Baltimore Maryland, Refunding RB, Wastewater Projects, Series A (NPFGC): | | | | | | | | |
5.20%, 7/01/32 | | | 2,250 | | | | 2,257,537 | |
5.13%, 7/01/42 | | | 1,500 | | | | 1,504,905 | |
Maryland EDC, Refunding RB, CNX Marine Terminals, Inc., 5.75%, 9/01/25 | | | 500 | | | | 541,600 | |
Montgomery County, RB, Series A: | | | | | | | | |
5.00%, 4/01/31 | | | 500 | | | | 584,720 | |
5.00%, 4/01/32 | | | 500 | | | | 583,220 | |
| | | | | | | | |
| | | | | | | | 5,471,982 | |
| Total Municipal Bonds in Maryland | | | | | | | 38,650,463 | |
To simplify the listings of portfolio holdings in the Schedules of Investments, the names and descriptions of many of the securities have been abbreviated according to the following list:
| | |
| ACA | | American Capital Access Corp. |
| AGC | | Assured Guaranty Corp. |
| AGM | | Assured Guaranty Municipal Corp. |
| AMBAC | | American Municipal Bond Assurance Corp. |
| AMT | | Alternative Minimum Tax (subject to) |
| BHAC | | Berkshire Hathaway Assurance Corp. |
| BOCES | | Board of Cooperative Educational Services |
| CAB | | Capital Appreciation Bonds |
| | |
| CIFG | | CDC IXIS Financial Guaranty |
| COP | | Certificates of Participation |
| EDA | | Economic Development Authority |
| EDC | | Economic Development Corp. |
| ERB | | Education Revenue Bonds |
| FHA | | Federal Housing Administration |
| GO | | General Obligation Bonds |
| HDA | | Housing Development Authority |
| HFA | | Housing Finance Agency |
| HRB | | Housing Revenue Bonds |
| IDA | | Industrial Development Authority |
| LRB | | Lease Revenue Bonds |
| | |
| M/F | | Multi-Family |
| MRB | | Mortgage Revenue Bonds |
| NPFGC | | National Public Finance Guarantee Corp. |
| PILOT | | Payment in Lieu of Taxes |
| Radian | | Radian Financial Guaranty |
| RB | | Revenue Bonds |
| S/F | | Single-Family |
| SO | | Special Obligation Bonds |
| SONYMA | | State of New York Mortgage Agency |
| Syncora | | Syncora Guarantee |
| VRDN | | Variable Rate Demand Notes |
See Notes to Financial Statements.
| | | | | | |
| | | | | | | |
| | ANNUAL REPORT | | AUGUST 31, 2012 | | 15 |
| | |
| Schedule of Investments (continued) | | BlackRock Maryland Municipal Bond Trust (BZM) (Percentages shown are based on Net Assets) |
| | | | | | | | |
| Municipal Bonds | | Par
(000) | | | Value | |
| | | | | | | | |
District of Columbia — 3.5% | | | | | | | | |
Transportation — 3.5% | | | | | |
Washington Metropolitan Area Transit Authority, RB, Transit, Series A, 5.13%, 7/01/32 | | $ | 1,000 | | | $ | 1,138,320 | |
| | | | | | | | |
Guam — 2.3% | | | | | | | | |
State — 2.3% | | | | | |
Government of Guam Business Privilege Tax Revenue, RB, Series A, 5.13%, 1/01/42 | | | 250 | | | | 277,680 | |
Territory of Guam, Limited Obligation Bonds, RB, Section 30, Series A, 5.63%, 12/01/29 | | | 410 | | | | 460,315 | |
| Total Municipal Bonds in Guam | | | | 737,995 | |
| | | | | | | | |
Multi-State — 6.8% | | | | | | | | |
Housing — 6.8% | | | | | |
Centerline Equity Issuer Trust, 7.20%, 11/15/14 (a)(b) | | | 2,000 | | | | 2,213,680 | |
| | | | | | | | |
Puerto Rico — 8.3% | | | | | | | | |
State — 5.2% | | | | | |
Commonwealth of Puerto Rico, GO, Refunding, Public Improvement, Series A-4 (AGM), 5.25%, 7/01/30 | | | 130 | | | | 142,072 | |
Puerto Rico Public Buildings Authority, Refunding RB, Government Facilities, Series D, 5.38%, 7/01/33 | | | 350 | | | | 350,668 | |
Puerto Rico Sales Tax Financing Corp., RB, First Sub-Series A, 6.38%, 8/01/39 | | | 1,000 | | | | 1,179,930 | |
| | | | | | | | |
| | | | | | | | 1,672,670 | |
Tobacco — 3.1% | | | | | | | | |
Children’s Trust Fund, Refunding RB, Asset-Backed,
5.50%, 5/15/39 | | | 1,000 | | | | 999,930 | |
| Total Municipal Bonds in Puerto Rico | | | | 2,672,600 | |
| Total Municipal Bonds — 140.5% | | | | | | | 45,413,058 | |
|
| |
|
Municipal Bonds Transferred to
Tender Option Bond Trusts (c) | |
Maryland — 13.7% | | | | | | | | |
Health — 3.4% | |
Maryland Health & Higher Educational Facilities Authority, Refunding RB, 5.00%, 11/15/51 | | | 1,000 | | | | 1,109,479 | |
Transportation — 10.3% | | | | | | | | |
Maryland State Transportation Authority, RB, Transportation Facility Project (AGM), 5.00%, 7/01/41 | | | 3,000 | | | | 3,320,460 | |
| Total Municipal Bonds in Maryland | | | | 4,429,939 | |
| | | | | | | | |
Puerto Rico — 1.0% | | | | | | | | |
State — 1.0% | | | | | | | | |
Puerto Rico Sales Tax Financing Corp., Refunding RB,
Series C, 5.25%, 8/01/40 | | | 300 | | | | 333,588 | |
Total Municipal Bonds Transferred to Tender Option Bond Trusts — 14.7% | | | | | | | 4,763,527 | |
Total Long-Term Investments (Cost — $47,481,405) — 155.2% | | | | | | | 50,176,585 | |
| | | | | | | | |
Short-Term Securities | | Shares | | | Value | |
FFI Institutional Tax-Exempt Fund, 0.01% (d)(e) | | | 180,661 | | | $ | 180,661 | |
Total Short-Term Securities (Cost — $180,661) — 0.6% | | | | 180,661 | |
| Total Investments (Cost — $47,662,066) — 155.8% | | | | 50,357,246 | |
| Other Assets Less Liabilities — 1.1% | | | | 364,086 | |
Liability for TOB Trust Certificates, Including Interest
Expense and Fees Payable — (7.4)% | | | | (2,400,885 | ) |
| VRDP Shares, at Redemption Value — (49.5)% | | | | (16,000,000 | ) |
| | | | | | | | |
| Net Assets Applicable to Common Shares — 100.0% | | | $ | 32,320,447 | |
| | | | | | | | |
| | | | | | | | | |
| (a) | | Security represents a beneficial interest in a trust. The collateral deposited into the trust is federally tax-exempt revenue bonds issued by various state or local governments, or their respective agencies or authorities. The security is subject to remarketing prior to its stated maturity. |
| (b) | | Security exempt from registration pursuant to Rule 144A under the Securities Act of 1933, as amended. These securities may be resold in transactions exempt from registration to qualified institutional investors. |
| (c) | | Securities represent bonds transferred to a TOB in exchange for which the Trust acquired residual interest certificates. These securities serve as collateral in a financing transaction. See Note 1 of the Notes to Financial Statements for details of municipal bonds transferred to TOBs. |
| (d) | | Investments in issuers considered to be an affiliate of the Trust during the year ended August 31, 2012, for purposes of Section 2(a)(3) of the 1940 Act, were as follows: |
| | | | | | | | | | | | | | | | |
| Affiliate | | Shares
Held at
August 31,
2011 | | | Net
Activity | | | Shares
Held at
August 31,
2012 | | | Income | |
FFI Institutional Tax-Exempt Fund | | | 3,348,424 | | | | (3,167,763 | ) | | | 180,661 | | | $ | 6 | |
| (e) | | Represents the current yield as of report date. |
| Ÿ | | For Trust compliance purposes, the Trust’s sector classifications refer to any one or more of the sector sub-classifications used by one or more widely recognized market indexes or rating group indexes, and/or as defined by Trust’s management. These definitions may not apply for purposes of this report, which may combine such sector sub- classifications for reporting ease. |
| Ÿ | | Fair Value Measurements—Various inputs are used in determining the fair value of investments. These inputs to valuation techniques are categorized into a disclosure hierarchy consisting of three broad levels for financial statement purposes as follows: |
| Ÿ | | Level 1 — unadjusted price quotations in active markets/exchanges for identical assets and liabilities |
| Ÿ | | Level 2 — other observable inputs (including, but not limited to: quoted prices for similar assets or liabilities in markets that are active, quoted prices for identical or similar assets or liabilities in markets that are not active, inputs other than quoted prices that are observable for the assets or liabilities (such as interest rates, yield curves, volatilities, prepayment speeds, loss severities, credit risks and default rates) or other market-corroborated inputs) |
| Ÿ | | Level 3 — unobservable inputs based on the best information available in the circumstances, to the extent observable inputs are not available (including the Trust’s own assumptions used in determining the fair value of investments) |
Changes in valuation techniques may result in transfers into or out of an assigned level within the disclosure hierarchy. In accordance with the Trust’s policy, transfers between different levels of the fair value disclosure hierarchy are deemed to have occurred as of the beginning of the reporting period. The categorization of a value determined for investments is based on the pricing transparency of the investment and is not necessarily an indication of the risks associated with investing in those securities. For information about the Trust’s policy regarding valuation of investments and other significant accounting policies, please refer to Note 1 of the Notes to Financial Statements.
See Notes to Financial Statements.
| | | | | | |
| | | | | | | |
| 16 | | ANNUAL REPORT | | AUGUST 31, 2012 | | |
| | |
| Schedule of Investments (concluded) | | BlackRock Maryland Municipal Bond Trust (BZM) |
The following table summarizes the Trust’s investments categorized in the disclosure hierarchy as of August 31, 2012:
| | | | | | | | | | | | | | | | |
| | | Level 1 | | | Level 2 | | | Level 3 | | | Total | |
Assets: | | | | | | | | | | | | | | | | |
| Investments: | | | | | | | | | | | | | | | | |
Long-Term Investments1 | | | — | | | $ | 50,176,585 | | | | — | | | $ | 50,176,585 | |
Short-Term Securities | | $ | 180,661 | | | | — | | | | — | | | | 180,661 | |
| | | | | | | | | | | | | | | | |
Total | | $ | 180,661 | | | $ | 50,176,585 | | | | — | | | $ | 50,357,246 | |
| | | | | | | | | | | | | | | | |
| 1 | | See above Schedule of Investments for values in each sector. |
Certain of the Trust’s liabilities are held at carrying amount, which approximates fair value for financial statement purposes. As of August 31, 2012, such liabilities are categorized within the disclosure hierarchy as follows:
| | | | | | | | | | | | | | | | |
| | | Level 1 | | | Level 2 | | | Level 3 | | | Total | |
Liabilities: | | | | | | | | | | | | | | | | |
TOB trust certificates | | | — | | | $ | (2,399,847 | ) | | | — | | | $ | (2,399,847 | ) |
VRDP Shares | | | — | | | | (16,000,000 | ) | | | — | | | | (16,000,000 | ) |
| | | | | | | | | | | | | | | | |
Total | | | — | | | $ | (18,399,847 | ) | | | — | | | $ | (18,399,847 | ) |
| | | | | | | | | | | | | | | | |
There were no transfers between levels during the year ended August 31, 2012.
See Notes to Financial Statements.
| | | | | | |
| | | | | | | |
| | ANNUAL REPORT | | AUGUST 31, 2012 | | 17 |
| | |
| Schedule of Investments August 31, 2012 | | BlackRock MuniHoldings New York Quality Fund, Inc. (MHN) (Percentages shown are based on Net Assets) |
| | | | | | | | |
| Municipal Bonds | | Par
(000) | | | Value | |
| | | | | | | | |
New York — 118.3% | | | | | | | | |
Corporate — 4.0% | | | | | | | | |
New York City Industrial Development Agency, Refunding RB: | | | | | | | | |
Series A, 5.00%, 7/01/28 (a) | | $ | 820 | | | $ | 866,937 | |
Terminal One Group Association Project, AMT, 5.50%, 1/01/24 (b) | | | 1,500 | | | | 1,581,930 | |
New York Liberty Development Corp., RB, Goldman Sachs Headquarters, 5.25%, 10/01/35 | | | 4,500 | | | | 5,230,440 | |
New York State Energy Research & Development Authority, Refunding RB, Brooklyn Union
Gas/Keyspan, Series A, AMT (NPFGC), 4.70%, 2/01/24 | | | 3,340 | | | | 3,527,775 | |
Suffolk County Industrial Development Agency New York, RB, Keyspan, Port Jefferson, AMT, 5.25%, 6/01/27 | | | 4,355 | | | | 4,477,550 | |
Suffolk County Industrial Development Agency New York, Refunding RB, Ogden Martin System Huntington, AMT (AMBAC), 6.25%, 10/01/12 | | | 3,530 | | | | 3,547,014 | |
| | | | | | | | |
| | | | | | | | 19,231,646 | |
County/City/Special District/School District — 30.9% | |
Amherst Development Corp., Refunding RB, University at Buffalo Foundation Faculty-Student Housing Corp., Series A (AGM), 4.63%, 10/01/40 | | | 4,975 | | | | 5,358,672 | |
Buffalo & Erie County Industrial Land Development Corp., Refunding RB, Buffalo State College Foundation Housing Corp., Project, Series A, 5.38%, 10/01/41 | | | 1,000 | | | | 1,145,130 | |
City of New York New York, GO: | | | | | | | | |
Series A-1, 5.00%, 8/01/35 | | | 2,350 | | | | 2,685,627 | |
Sub-Series D-1, 5.00%, 10/01/33 | | | 4,175 | | | | 4,834,483 | |
City of New York New York, GO, Refunding, Series I, 5.00%, 8/01/32 | | | 490 | | | | 575,809 | |
County of Onondaga New York, RB, Syracuse University Project: | | | | | | | | |
5.00%, 12/01/29 | | | 1,135 | | | | 1,339,221 | |
5.00%, 12/01/36 | | | 1,100 | | | | 1,269,785 | |
Erie County Industrial Development Agency, RB, City School District of Buffalo Project, Series A, 5.25%, 5/01/31 | | | 1,000 | | | | 1,168,060 | |
Hudson New York Yards Infrastructure Corp., RB: | | | | | | | | |
(AGC), 5.00%, 2/15/47 | | | 7,370 | | | | 7,831,657 | |
Series A, 5.00%, 2/15/47 | | | 2,850 | | | | 3,016,468 | |
Series A (AGM), 5.00%, 2/15/47 | | | 7,530 | | | | 8,001,679 | |
Series A (NPFGC), 4.50%, 2/15/47 | | | 14,505 | | | | 14,959,297 | |
Series A (NPFGC), 5.00%, 2/15/47 | | | 1,500 | | | | 1,587,615 | |
Series A (NPFGC), 5.00%, 2/15/47 | | | 305 | | | | 324,105 | |
New York City Industrial Development Agency, RB, PILOT: | | | | | | | | |
Queens Baseball Stadium (AGC), 6.38%, 1/01/39 | | | 800 | | | | 941,368 | |
Queens Baseball Stadium (AMBAC), 5.00%, 1/01/31 | | | 3,500 | | | | 3,574,900 | |
Queens Baseball Stadium (AMBAC), 5.00%, 1/01/36 | | | 8,140 | | | | 8,282,124 | |
Yankee Stadium (AGC), 4.89%, 3/01/39 (c) | | | 1,380 | | | | 383,985 | |
Yankee Stadium (NPFGC), 5.00%, 3/01/36 | | | 2,200 | | | | 2,292,136 | |
Yankee Stadium (NPFGC), 5.00%, 3/01/46 | | | 9,500 | | | | 9,798,300 | |
New York City Transitional Finance Authority, RB: | | | | | | | | |
Fiscal 2008, Series S-1, 4.50%, 1/15/38 | | | 1,510 | | | | 1,580,306 | |
Fiscal 2009, Series S-1 (AGC), 5.50%, 7/15/38 | | | 4,000 | | | | 4,562,320 | |
Fiscal 2009, Series S-4 (AGC), 5.50%, 1/15/39 | | | 1,250 | | | | 1,438,588 | |
Future Tax Secured, Series C (NPFGC), 5.00%, 2/01/14 (d) | | | 10,000 | | | | 10,547,700 | |
Future Tax Secured, Series E (NPFGC), 5.25%, 2/01/13 (d) | | | 2,455 | | | | 2,506,923 | |
Future Tax Secured, Series E (NPFGC), 5.25%, 2/01/22 | | | 45 | | | | 45,869 | |
Series B (NPFGC), 5.50%, 2/01/13 | | | 110 | | | | 110,483 | |
Series S-1, 4.00%, 7/15/42 | | | 1,000 | | | | 1,014,650 | |
| | | | | | | | |
| Municipal Bonds | | Par
(000) | | | Value | |
| | | | | | | | |
New York (continued) | | | | | | | | |
County/City/Special District/School District (concluded) | | | | | |
New York City Transitional Finance Authority, RB (concluded): | | | | | | | | |
Series S-2 (AGM), 5.00%, 1/15/37 | | $ | 3,750 | | | $ | 4,034,325 | |
Series S-2 (NPFGC), 4.25%, 1/15/34 | | | 4,830 | | | | 4,977,508 | |
New York City Transitional Finance Authority, Refunding RB, Future Tax Secured Revenue, Series A (NPFGC): | | | | | | | | |
5.00%, 11/15/12 (d) | | | 110 | | | | 111,090 | |
5.00%, 11/15/26 | | | 890 | | | | 897,930 | |
New York Convention Center Development Corp., RB, Hotel Unit Fee Secured (AMBAC): | | | | | | | | |
5.00%, 11/15/30 | | | 2,100 | | | | 2,214,849 | |
5.00%, 11/15/35 | | | 1,150 | | | | 1,204,671 | |
5.00%, 11/15/44 | | | 4,955 | | | | 5,182,880 | |
New York Liberty Development Corp., Refunding RB: | | | | | | | | |
4 World Trade Center Project, 5.00%, 11/15/31 | | | 1,710 | | | | 1,961,011 | |
4 World Trade Center Project, 5.75%, 11/15/51 | | | 2,080 | | | | 2,461,659 | |
7 World Trade Center Project, 5.00%, 9/15/43 | | | 2,780 | | | | 3,040,152 | |
New York State Dormitory Authority, Refunding RB, School Districts Financing Program, Series A (AGM), 5.00%, 10/01/35 | | | 5,000 | | | | 5,508,300 | |
Oneida-Herkimer Solid Waste Management Authority New York, Refunding RB (AGM), 5.50%, 4/01/13 | | | 1,800 | | | | 1,849,824 | |
Sales Tax Asset Receivable Corp., Refunding RB, Series A (AMBAC), 5.00%, 10/15/32 | | | 10,175 | | | | 11,033,261 | |
St. Lawrence County Industrial Development Agency, RB, Clarkson University Project: | | | | | | | | |
6.00%, 9/01/34 | | | 300 | | | | 361,851 | |
5.38%, 9/01/41 | | | 125 | | | | 143,169 | |
Syracuse Industrial Development Agency New York, RB, Carousel Center Project, Series A, AMT (Syncora), 5.00%, 1/01/36 | | | 3,100 | | | | 3,173,687 | |
Tompkins County Industrial Development Agency, RB, Civic Facility Cornell University Project, Series A, 5.00%, 7/01/37 | | | 500 | | | | 568,955 | |
| | | | | | | | |
| | | | | | | | 149,902,382 | |
Education — 15.8% | | | | | | | | |
City of Troy New York, Refunding RB, Rensselaer Polytechnic, Series A, 5.13%, 9/01/40 | | | 4,050 | | | | 4,476,019 | |
Madison County Industrial Development Agency New York, RB, Colgate University Project, Series A (AMBAC), 5.00%, 7/01/30 | | | 4,000 | | | | 4,280,840 | |
New York City Industrial Development Agency, Refunding RB, Nightingale-Bamford School (AMBAC), 5.25%, 1/15/17 | | | 1,200 | | | | 1,218,144 | |
New York City Transitional Finance Authority, RB, Fiscal 2009, Series S-4 (AGC), 5.50%, 1/15/33 | | | 3,000 | | | | 3,509,670 | |
New York City Trust for Cultural Resources, Refunding RB: | | | | | | | | |
American Museum of Natural History, Series A (NPFGC), 5.00%, 7/01/36 | | | 6,300 | | | | 6,717,879 | |
Carnegie Hall, Series A, 4.75%, 12/01/39 | | | 3,150 | | | | 3,423,168 | |
Carnegie Hall, Series A, 5.00%, 12/01/39 | | | 1,850 | | | | 2,042,437 | |
New York State Dormitory Authority, LRB, State University Dormitory Facilities, Series A: | | | | | | | | |
5.00%, 7/01/35 | | | 750 | | | | 851,190 | |
5.00%, 7/01/40 | | | 1,500 | | | | 1,676,895 | |
New York State Dormitory Authority, RB: | | | | | | | | |
Convent Sacred Heart (AGM), 5.75%, 11/01/40 | | | 1,770 | | | | 2,097,397 | |
Fordham University, Series A, 5.00%, 7/01/28 | | | 175 | | | | 202,417 | |
Fordham University, Series A, 5.50%, 7/01/36 | | | 1,375 | | | | 1,599,359 | |
General Purpose, Series A, 4.50%, 3/15/35 | | | 2,000 | | | | 2,186,640 | |
Mount Sinai School of Medicine,
5.13%, 7/01/39 | | | 1,000 | | | | 1,102,430 | |
New School (AGM), 5.50%, 7/01/43 | | | 3,265 | | | | 3,718,443 | |
New York University, Series 1 (AMBAC), 5.50%, 7/01/40 | | | 3,500 | | | | 4,747,505 | |
See Notes to Financial Statements.
| | | | | | |
| | | | | | | |
| 18 | | ANNUAL REPORT | | AUGUST 31, 2012 | | |
| | |
| Schedule of Investments (continued) | | BlackRock MuniHoldings New York Quality Fund, Inc. (MHN) (Percentages shown are based on Net Assets) |
| | | | | | | | |
| Municipal Bonds | | Par
(000) | | | Value | |
| | | | | | | | |
New York (continued) | | | | | | | | |
Education (concluded) | | | | | | | | |
New York State Dormitory Authority, RB (concluded): | | | | | | | | |
New York University, Series B, 5.00%, 7/01/34 | | $ | 400 | | | $ | 452,512 | |
New York University, Series B, 5.00%, 7/01/42 | | | 3,000 | | | | 3,403,590 | |
New York University, Series C, 5.00%, 7/01/38 | | | 2,000 | | | | 2,202,400 | |
Saint John’s University, Series A, 5.00%, 7/01/28 | | | 500 | | | | 587,850 | |
Siena College, 5.13%, 7/01/39 | | | 1,345 | | | | 1,474,187 | |
New York State Dormitory Authority, Refunding RB: | | | | | | | | |
Cornell University, Series A, 5.00%, 7/01/40 | | | 1,000 | | | | 1,135,670 | |
Mount Sinai School of Medicine at NYU (NPFGC), 5.00%, 7/01/35 | | | 5,100 | | | | 5,432,571 | |
New York University, Series A, 5.00%, 7/01/37 | | | 4,180 | | | | 4,795,087 | |
Rockefeller University, Series B, 4.00%, 7/01/38 | | | 3,085 | | | | 3,259,673 | |
Saint John’s University, Series A, 5.00%, 7/01/27 | | | 370 | | | | 437,092 | |
Third General Resolution, State University Educational Facilities, Series A , 5.00%, 5/15/29 | | | 1,000 | | | | 1,182,070 | |
Tompkins County Development Corp., RB, Ithaca College Project (AGM): | | | | | | | | |
5.50%, 7/01/33 | | | 500 | | | | 583,515 | |
5.25%, 7/01/36 | | | 700 | | | | 793,800 | |
Westchester County Industrial Development Agency New York, RB, Purchase College Foundation Housing, Series A (AMBAC), 5.75%, 12/01/31 | | | 7,000 | | | | 7,149,310 | |
| | | | | | | | |
| | | | | | | | 76,739,760 | |
Health — 9.1% | | | | | | | | |
Dutchess County Industrial Development Agency, RB, Vassar Brothers Medical Center (AGC), 5.50%, 4/01/34 | | | 500 | | | | 567,225 | |
Monroe County Industrial Development Corp., Refunding RB, Unity Hospital of Rochester Project (FHA),
5.50%, 8/15/40 | | | 3,925 | | | | 4,526,231 | |
New York City Health & Hospital Corp., Refunding RB, Health System, Series A, 5.00%, 2/15/30 | | | 1,800 | | | | 2,031,192 | |
New York State Dormitory Authority, MRB, Montefiore Hospital (NPFGC), 5.00%, 8/01/33 | | | 1,000 | | | | 1,056,100 | |
New York State Dormitory Authority, RB: | | | | | | | | |
Healthcare, Series A, 5.00%, 3/15/38 | | | 2,250 | | | | 2,576,453 | |
Hudson Valley Hospital (BHAC), 5.00%, 8/15/36 | | | 5,500 | | | | 5,966,015 | |
New York & Presbyterian Hospital (AGM),
5.00%, 8/15/36 | | | 3,895 | | | | 4,023,808 | |
North Shore-Long Island Jewish Health System, Series A, 5.50%, 5/01/37 | | | 1,825 | | | | 2,073,948 | |
North Shore-Long Island Jewish Health System, Series C, 4.25%, 5/01/39 | | | 1,250 | | | | 1,270,775 | |
North Shore-Long Island Jewish Health System, Series D, 4.25%, 5/01/39 | | | 1,625 | | | | 1,648,108 | |
North Shore-Long Island Jewish Health System, Series D, 5.00%, 5/01/39 | | | 480 | | | | 524,990 | |
NYU Hospital Center, Series A,
5.75%, 7/01/31 | | | 2,680 | | | | 3,117,805 | |
NYU Hospital Center, Series A, 6.00%, 7/01/40 | | | 1,800 | | | | 2,112,624 | |
New York State Dormitory Authority, Refunding RB: | | | | | | | | |
New York University Hospitals Center, Series A, 5.00%, 7/01/36 | | | 1,000 | | | | 1,059,270 | |
North Shore-Long Island Jewish Health System, Series A, 5.00%, 5/01/32 | | | 2,000 | | | | 2,238,380 | |
North Shore-Long Island Jewish Health System, Series A, 5.25%, 5/01/34 | | | 7,375 | | | | 8,403,296 | |
St. Luke’s Roosevelt Hospital (FHA), 4.90%, 8/15/31 | | | 1,000 | | | | 1,058,220 | |
| | | | | | | | |
| | | | | | | | 44,254,440 | |
| | | | | | | | |
| Municipal Bonds | | Par
(000) | | | Value | |
| | | | | | | | |
New York (continued) | | | | | | | | |
Housing — 4.3% | | | | | | | | |
New York City Housing Development Corp., RB, AMT: | | | | | | | | |
Series A-1-A, 5.00%, 11/01/30 | | $ | 750 | | | $ | 781,470 | |
Series A-1-A, 5.45%, 11/01/46 | | | 1,335 | | | | 1,380,457 | |
Series C, 5.00%, 11/01/26 | | | 1,250 | | | | 1,303,088 | |
Series C, 5.05%, 11/01/36 | | | 2,000 | | | | 2,070,200 | |
Series H-1, 4.70%, 11/01/40 | | | 1,000 | | | | 1,019,720 | |
Series H-2-A, 5.20%, 11/01/35 | | | 835 | | | | 870,295 | |
Series H-2-A, 5.35%, 5/01/41 | | | 600 | | | | 634,764 | |
New York Mortgage Agency, RB, Series 145, AMT,
5.13%, 10/01/37 | | | 900 | | | | 933,588 | |
New York Mortgage Agency, Refunding RB, AMT: | | | | | | | | |
Series 97, 5.50%, 4/01/31 | | | 595 | | | | 595,666 | |
Series 133, 4.95%, 10/01/21 | | | 685 | | | | 715,777 | |
Series 143, 4.85%, 10/01/27 | | | 1,085 | | | | 1,126,556 | |
Series 143, 4.90%, 10/01/37 | | | 813 | | | | 837,008 | |
Series 143 (NPFGC), 4.85%, 10/01/27 | | | 2,000 | | | | 2,095,480 | |
New York State HFA, RB: | | | | | | | | |
Affordable Housing, Series B, 3.45%, 11/01/32 | | | 245 | | | | 243,758 | |
Affordable Housing, Series B, 3.85%, 11/01/42 | | | 1,750 | | | | 1,755,302 | |
St. Philip’s Housing, Series A, AMT (Fannie Mae), 4.65%, 11/15/38 | | | 1,000 | | | | 1,025,620 | |
Yonkers EDC, Refunding RB, Riverview II (Freddie Mac), 4.50%, 5/01/25 | | | 1,500 | | | | 1,623,420 | |
Yonkers Industrial Development Agency New York, RB, Monastery Manor Associates LP Project, AMT (SONYMA), 5.25%, 4/01/37 | | | 2,000 | | | | 2,066,180 | |
| | | | | | | | |
| | | | | | | | 21,078,349 | |
State — 8.7% | | | | | | | | |
New York State Dormitory Authority, ERB, Series C, 5.00%, 12/15/31 | | | 2,320 | | | | 2,646,888 | |
New York State Dormitory Authority, RB: | | | | | | | | |
Master BOCES Program Lease (AGC),
5.00%, 8/15/28 | | | 250 | | | | 283,693 | |
Mental Health Facilities, Series B,
5.25%, 2/15/14 (d) | | | 1,550 | | | | 1,657,585 | |
Mental Health Services Facilities Improvement, Series B (AGM), 5.00%, 2/15/33 | | | 4,500 | | | | 5,036,895 | |
School Districts Financing Program, Series C (AGM), 5.00%, 10/01/37 | | | 2,500 | | | | 2,707,075 | |
School Districts Financing Program, Series D (NPFGC), 5.00%, 10/01/30 | | | 1,240 | | | | 1,244,352 | |
School Districts Financing Program, Series E (NPFGC), 5.75%, 10/01/30 | | | 6,900 | | | | 6,927,462 | |
New York State Dormitory Authority, Refunding RB: | | | | | | | | |
School Districts Financing Program, Series A (AGM), 5.00%, 10/01/35 | | | 450 | | | | 488,813 | |
Secured Hospital, North General Hospital (Syncora), 5.75%, 2/15/17 | | | 2,000 | | | | 2,037,420 | |
New York State Thruway Authority, RB: | | | | | | | | |
Second General, Series B, 5.00%, 4/01/27 | | | 1,000 | | | | 1,146,690 | |
Series A (AMBAC), 5.00%, 4/01/26 | | | 8,700 | | | | 9,771,318 | |
New York State Thruway Authority, Refunding RB, Series A, 5.00%, 4/01/32 | | | 1,000 | | | | 1,174,580 | |
New York State Urban Development Corp., RB, State Personal Income Tax: | | | | | | | | |
Series A, 3.50%, 3/15/28 | | | 1,660 | | | | 1,741,257 | |
Series C-1 (NPFGC), 5.00%, 3/15/13 (d) | | | 3,000 | | | | 3,078,000 | |
State Facilities, Series A-1 (NPFGC),
5.00%, 3/15/14 (d) | | | 2,000 | | | | 2,145,620 | |
| | | | | | | | |
| | | | | | | | 42,087,648 | |
See Notes to Financial Statements.
| | | | | | |
| | | | | | | |
| | ANNUAL REPORT | | AUGUST 31, 2012 | | 19 |
| | |
| Schedule of Investments (continued) | | BlackRock MuniHoldings New York Quality Fund, Inc. (MHN) (Percentages shown are based on Net Assets) |
| | | | | | | | |
| Municipal Bonds | | Par
(000) | | | Value | |
| | | | | | | | |
New York (continued) | | | | | | | | |
Tobacco — 3.9% | | | | | | | | |
Tobacco Settlement Financing Corp. New York, RB, Asset-Backed, Series A-1 (AMBAC): | | | | | | | | |
5.25%, 6/01/20 | | $ | 5,000 | | | $ | 5,180,600 | |
5.25%, 6/01/21 | | | 13,275 | | | | 13,754,493 | |
| | | | | | | | |
| | | | | | | | 18,935,093 | |
Transportation — 31.8% | | | | | | | | |
Metropolitan Transportation Authority, RB: | | | | | | | | |
Series 2008C, 6.50%, 11/15/28 | | | 6,015 | | | | 7,708,403 | |
Series E, 5.00%, 11/15/42 | | | 995 | | | | 1,112,141 | |
Transportation, Series A, 5.00%, 11/15/27 | | | 1,000 | | | | 1,167,680 | |
Transportation, Series D, 5.25%, 11/15/41 | | | 2,250 | | | | 2,542,342 | |
Metropolitan Transportation Authority, Refunding RB: | | | | | | | | |
Series A (AGM), 5.75%, 11/15/12 (d) | | | 19,000 | | | | 19,196,080 | |
Series B, 5.00%, 11/15/34 | | | 2,500 | | | | 2,823,450 | |
Transportation, Series F (NPFGC),
5.25%, 11/15/12 (d) | | | 6,300 | | | | 6,365,835 | |
New York Liberty Development Corp., RB, 1 World Trade Center Port Authority Construction: | | | | | | | | |
5.00%, 12/15/41 | | | 6,000 | | | | 6,682,980 | |
5.25%, 12/15/43 | | | 11,500 | | | | 13,171,985 | |
New York State Thruway Authority, RB: | | | | | | | | |
General, Series I, 4.13%, 1/01/42 | | | 1,750 | | | | 1,797,040 | |
Series F (AMBAC), 5.00%, 1/01/30 | | | 5,000 | | | | 5,402,100 | |
Series I, 5.00%, 1/01/37 | | | 3,315 | | | | 3,738,823 | |
Series I, 5.00%, 1/01/42 | | | 1,970 | | | | 2,211,798 | |
New York State Thruway Authority, Refunding RB, Series G (AGM): | | | | | | | | |
4.75%, 1/01/29 | | | 1,250 | | | | 1,357,537 | |
4.75%, 1/01/30 | | | 1,030 | | | | 1,118,611 | |
5.00%, 1/01/32 | | | 3,450 | | | | 3,800,865 | |
Niagara Falls Bridge Commission, Refunding RB, Bridge System, Series A (AGC), 4.00%, 10/01/19 | | | 1,600 | | | | 1,773,184 | |
Port Authority of New York & New Jersey, RB: | | | | | | | | |
Consolidated, 124th Series, 5.00%, 8/01/36 | | | 750 | | | | 752,213 | |
Consolidated, 163rd Series, 5.00%, 7/15/35 | | | 2,500 | | | | 2,867,050 | |
Special Project, JFK International Air Terminal, Series 6 (NPFGC), 5.90%, 12/01/17 | | | 4,000 | | | | 4,005,800 | |
Special Project, JFK International Air Terminal, Series 6, AMT (NPFGC), 6.25%, 12/01/15 | | | 7,830 | | | | 8,639,622 | |
Special Project, JFK International Air Terminal, Series 6, AMT (NPFGC), 5.75%, 12/01/22 | | | 26,725 | | | | 26,733,552 | |
Triborough Bridge & Tunnel Authority, RB: | | | | | | | | |
Sub-Series A (NPFGC), 5.25%, 11/15/30 | | | 6,000 | | | | 6,293,580 | |
Subordinate Bonds (AMBAC), 5.00%, 11/15/28 | | | 1,965 | | | | 2,060,637 | |
Triborough Bridge & Tunnel Authority, Refunding RB: | | | | | | | | |
Series B, 5.00%, 11/15/31 | | | 430 | | | | 512,190 | |
Series B, 4.00%, 11/15/32 | | | 850 | | | | 912,611 | |
Series C, 5.00%, 11/15/38 | | | 1,385 | | | | 1,593,733 | |
Series E (NPFGC), 5.25%, 11/15/23 | | | 9,600 | | | | 9,689,760 | |
Series E (NPFGC), 5.00%, 11/15/32 | | | 8,315 | | | | 8,379,608 | |
| | | | | | | | |
| | | | | | | | 154,411,210 | |
Utilities — 9.8% | | | | | | | | |
Long Island Power Authority, RB, Series A: | | | | | | | | |
5.00%, 5/01/36 | | | 2,375 | | | | 2,665,653 | |
(AMBAC), 5.00%, 9/01/29 | | | 3,000 | | | | 3,206,130 | |
Long Island Power Authority, Refunding RB: | | | | | | | | |
General, Series A (AGC), 6.00%, 5/01/33 | | | 1,500 | | | | 1,804,155 | |
General, Series B (AGM), 5.00%, 12/01/35 | | | 3,500 | | | | 3,706,815 | |
Series A (AGC), 5.75%, 4/01/39 | | | 1,000 | | | | 1,195,060 | |
New York City Municipal Water Finance Authority, RB, Series B, 5.00%, 6/15/36 | | | 3,500 | | | | 3,924,340 | |
| | | | | | | | |
| Municipal Bonds | | Par
(000) | | | Value | |
| | | | | | | | |
New York (concluded) | | | | | | | | |
Utilities (concluded) | | | | | | | | |
New York City Municipal Water Finance Authority, Refunding RB: | | | | | | | | |
2nd General Resolution, Fiscal 2011, Series BB, 5.00%, 6/15/31 | | $ | 1,000 | | | $ | 1,158,270 | |
2nd Generation Resolution, Series FF, 5.00%, 6/15/31 | | | 1,500 | | | | 1,737,405 | |
Series A (AGM), 4.25%, 6/15/39 | | | 1,700 | | | | 1,789,420 | |
Series DD, 5.00%, 6/15/32 | | | 5,750 | | | | 6,598,872 | |
Series DD (AGM), 4.50%, 6/15/39 | | | 2,500 | | | | 2,633,875 | |
Series FF, 4.00%, 6/15/45 | | | 1,975 | | | | 2,019,931 | |
Series FF, 5.00%, 6/15/45 | | | 2,100 | | | | 2,400,237 | |
New York State Environmental Facilities Corp., RB, Long Island Water Corp. Project, Series A, AMT (NPFGC), 4.90%, 10/01/34 | | | 6,000 | | | | 6,129,600 | |
New York State Environmental Facilities Corp., Refunding RB, Revolving Funds, New York City Municipal Water, Series B, 5.00%, 6/15/36 | | | 3,200 | | | | 3,699,104 | |
New York State Power Authority, Refunding RB, Series A, 5.00%, 11/15/38 | | | 2,580 | | | | 2,983,280 | |
| | | | | | | | |
| | | | | | | | 47,652,147 | |
| Total Municipal Bonds in New York | | | | | | | 574,292,675 | |
| | | | | | | | |
Guam — 1.3% | | | | | | | | |
Transportation — 1.0% | | | | | | | | |
Guam International Airport Authority, Refunding RB, General, Series C, AMT (NPFGC): | | | | | | | | |
5.25%, 10/01/21 | | | 3,700 | | | | 3,706,475 | |
5.25%, 10/01/22 | | | 1,050 | | | | 1,051,690 | |
| | | | | | | | |
| | | | | | | | 4,758,165 | |
Utilities — 0.3% | | | | | | | | |
Guam Power Authority, Refunding RB, Series A (AGM), 5.00%, 10/01/37 | | | 1,175 | | | | 1,287,718 | |
| Total Municipal Bonds in Guam | | | | | | | 6,045,883 | |
| | | | | | | | |
Puerto Rico — 10.6% | | | | | | | | |
Housing — 0.6% | | | | | | | | |
Puerto Rico Housing Finance Authority, Refunding RB, Subordinate, Capital Fund Modernization, 5.13%, 12/01/27 | | | 2,500 | | | | 2,758,925 | |
State — 6.3% | | | | | | | | |
Commonwealth of Puerto Rico, GO, Refunding (NPFGC): | | | | | | | | |
Public Improvement, Series A, 5.50%, 7/01/20 | | | 1,970 | | | | 2,188,611 | |
Sub-Series C-7, 6.00%, 7/01/27 | | | 2,000 | | | | 2,252,660 | |
Sub-Series C-7, 6.00%, 7/01/28 | | | 4,000 | | | | 4,489,640 | |
Puerto Rico Commonwealth Infrastructure Financing Authority, RB, CAB, Series A (c): | | | | | | | | |
(AMBAC), 6.09%, 7/01/34 | | | 9,300 | | | | 2,511,930 | |
(AMBAC), 6.12%, 7/01/37 | | | 2,200 | | | | 492,118 | |
(NPFGC), 5.78%, 7/01/31 | | | 10,280 | | | | 3,515,143 | |
(NPFGC), 6.05%, 7/01/33 | | | 5,500 | | | | 1,589,170 | |
Puerto Rico Public Buildings Authority, Refunding RB, Government Facilities, Series M-3 (NPFGC), 6.00%, 7/01/28 | | | 2,500 | | | | 2,818,625 | |
Puerto Rico Sales Tax Financing Corp., RB, First Sub-Series A: | | | | | | | | |
5.63%, 8/01/30 | | | 1,000 | | | | 1,067,960 | |
5.75%, 8/01/37 | | | 3,000 | | | | 3,345,060 | |
(AGM), 5.00%, 8/01/40 | | | 1,905 | | | | 2,056,600 | |
See Notes to Financial Statements.
| | | | | | |
| | | | | | | |
| 20 | | ANNUAL REPORT | | AUGUST 31, 2012 | | |
| | |
| Schedule of Investments (continued) | | BlackRock MuniHoldings New York Quality Fund, Inc. (MHN) (Percentages shown are based on Net Assets) |
| | | | | | | | |
| Municipal Bonds | | Par
(000) | | | Value | |
| | | | | | | | |
Puerto Rico (concluded) | | | | | | | | |
State (concluded) | | | | | | | | |
Puerto Rico Sales Tax Financing Corp., Refunding RB: | | | | | | | | |
CAB, Series A (NPFGC), 5.57%, 8/01/41 (c) | | $ | 11,000 | | | $ | 2,244,330 | |
CAB, Series A (NPFGC), 5.59%, 8/01/43 (c) | | | 2,500 | | | | 454,775 | |
Senior Series C, 5.25%, 8/01/40 | | | 1,530 | | | | 1,701,299 | |
| | | | | | | | |
| | | | | | | | 30,727,921 | |
Transportation — 3.1% | | | | | | | | |
Puerto Rico Highway & Transportation Authority, RB, Series Y (AGM), 6.25%, 7/01/21 | | | 5,025 | | | | 6,025,427 | |
Puerto Rico Highway & Transportation Authority, Refunding RB, Series CC (AGM): | | | | | | | | |
4.95%, 7/01/26 | | | 3,710 | | | | 4,030,581 | |
5.50%, 7/01/29 | | | 2,145 | | | | 2,610,294 | |
5.50%, 7/01/31 | | | 1,855 | | | | 2,262,228 | |
| | | | | | | | |
| | | | | | | | 14,928,530 | |
Utilities — 0.6% | | | | | | | | |
Puerto Rico Electric Power Authority, RB: | | | | | | | | |
Series NN, 5.13%, 7/01/13 (d) | | | 940 | | | | 978,117 | |
Series RR (NPFGC), 5.00%, 7/01/24 | | | 1,000 | | | | 1,074,190 | |
Puerto Rico Electric Power Authority, Refunding RB, Series V (NPFGC), 5.25%, 7/01/30 | | | 1,000 | | | | 1,074,640 | |
| | | | | | | | |
| | | | | | | | 3,126,947 | |
| Total Municipal Bonds in Puerto Rico | | | | | | | 51,542,323 | |
| Total Municipal Bonds — 130.2% | | | | | | | 631,880,881 | |
|
| |
| | |
Municipal Bonds Transferred to
Tender Option Bond Trusts (e) | | | | | | |
New York — 32.9% | | | | | | | | |
County/City/Special District/School District — 14.0% | | | | | |
City of New York New York, GO: | | | | | | | | |
Series J, 5.00%, 5/15/23 | | | 6,800 | | | | 7,311,836 | |
Sub-Series C-3 (AGC), 5.75%, 8/15/28 | | | 10,000 | | | | 12,404,000 | |
New York City Transitional Finance Authority, RB, Future Tax Secured, Sub-Series D-1, 5.00%, 11/01/38 | | | 1,650 | | | | 1,889,910 | |
New York Convention Center Development Corp., RB, Hotel Unit Fee Secured (AMBAC), 5.00%, 11/15/35 | | | 18,000 | | | | 18,855,720 | |
New York Liberty Development Corp., Refunding RB: | | | | | | | | |
4 World Trade Center Project, 5.00%, 11/15/44 | | | 2,000 | | | | 2,211,040 | |
7 World Trade Center Project, 4.00%, 9/15/35 | | | 2,010 | | | | 2,077,677 | |
7 World Trade Center Project, 5.00%, 9/15/40 | | | 2,610 | | | | 2,968,249 | |
New York State Dormitory Authority, RB, State University Dormitory Facilities, Series A, 5.25%, 7/01/29 | | | 5,000 | | | | 5,783,800 | |
Sales Tax Asset Receivable Corp., Refunding RB, Series A (AMBAC), 5.00%, 10/15/32 | | | 13,503 | | | | 14,673,843 | |
| | | | | | | | |
| | | | | | | | 68,176,075 | |
Education — 3.0% | | | | | | | | |
New York State Dormitory Authority, LRB, State University Dormitory Facilities, Series A, 5.00%, 7/01/35 | | | 4,448 | | | | 5,115,121 | |
New York State Dormitory Authority, RB, New York University, Series A: | | | | | | | | |
5.00%, 7/01/38 | | | 5,498 | | | | 6,055,032 | |
(AMBAC), 5.00%, 7/01/37 | | | 2,999 | | | | 3,255,251 | |
| | | | | | | | |
| | | | | | | | 14,425,404 | |
| | | | | | | | |
Municipal Bonds Transferred to
Tender Option Bond Trusts (e) | | Par
(000) | | | Value | |
| | | | | | | | |
New York (concluded) | | | | | | | | |
State — 2.5% | | | | | | | | |
New York State Dormitory Authority, ERB, Series B, 5.75%, 3/15/36 | | $ | 5,000 | | | $ | 6,083,400 | |
New York State Dormitory Authority, RB, Mental Health Services Facilities, Series C, AMT (AGM),
5.40%, 2/15/33 | | | 5,458 | | | | 5,926,328 | |
| | | | | | | | |
| | | | | | | | 12,009,728 | |
Transportation — 10.1% | | | | | | | | |
Hudson New York Yards Infrastructure Corp., RB, Series A, 5.75%, 2/15/47 | | | 5,999 | | | | 7,037,523 | |
Metropolitan Transportation Authority, RB, Series A (NPFGC), 5.00%, 11/15/31 | | | 7,002 | | | | 7,885,773 | |
New York State Thruway Authority, Refunding RB (AGM): | | | | | | | | |
Series G, 5.00%, 1/01/32 | | | 12,000 | | | | 13,220,400 | |
Series H, 5.00%, 1/01/37 | | | 8,500 | | | | 9,222,670 | |
Port Authority of New York & New Jersey, RB: | | | | | | | | |
Consolidated, 37th Series, AMT (AGM), 5.13%, 7/15/30 | | | 2,500 | | | | 2,671,625 | |
Consolidated, 169th Series, 5.00%, 10/15/25 | | | 8,005 | | | | 9,322,772 | |
| | | | | | | | |
| | | | | | | | 49,360,763 | |
Utilities — 3.3% | | | | | | | | |
New York City Municipal Water Finance Authority, RB, Fiscal 2009, Series A, 5.75%, 6/15/40 | | | 4,004 | | | | 4,824,858 | |
New York City Municipal Water Finance Authority, Refunding RB: | | | | | | | | |
Second General Resolution, Series HH, 5.00%, 6/15/32 | | | 7,151 | | | | 8,338,783 | |
Series FF-2, 5.50%, 6/15/40 | | | 2,399 | | | | 2,818,398 | |
| | | | | | | | |
| | | | | | | | 15,982,039 | |
Total Municipal Bonds Transferred to
Tender Option Bond Trusts — 32.9% | | | | | | | 159,954,009 | |
Total Long-Term Investments
(Cost — $736,549,232) — 163.1% | | | | | | | 791,834,890 | |
| | | | | | | | |
|
| |
| Short-Term Securities | | Shares | | | | |
BIF New York Municipal Money Fund, 0.00% (f)(g) | | | 9,529,494 | | | | 9,529,494 | |
Total Short-Term Securities (Cost — $9,529,494) — 2.0% | | | | 9,529,494 | |
| Total Investments (Cost — $746,078,726) — 165.1% | | | | 801,364,384 | |
| Other Assets Less Liabilities — 1.1% | | | | 5,205,464 | |
Liability for TOB Trust Certificates, Including Interest
Expense and Fees Payable — (16.0)% | | | | (77,515,566 | ) |
| VRDP Shares, at Liquidation Value — (50.2)% | | | | (243,600,000 | ) |
| | | | | | | | |
| Net Assets Applicable to Common Shares — 100.0% | | | $ | 485,454,282 | |
| | | | | | | | |
| | | | | | | | | |
| (a) | | When-issued security. Unsettled when-issued transactions were as follows: |
| | | | | | | | |
| Counterparty | | Value | | | Unrealized
Appreciation | |
Goldman Sachs Group, Inc. | | $ | 866,937 | | | $ | 14,793 | |
| (b) | | Variable rate security. Rate shown is as of report date. |
| (c) | | Represents a zero-coupon bond. Rate shown reflects the current yield as of report date. |
| (d) | | US government securities, held in escrow, are used to pay interest on this security, as well as to retire the bond in full at the date indicated, typically at a premium to par. |
| (e) | | Securities represent bonds transferred to a TOB in exchange for which the Trust’s acquired residual interest certificates. These securities serve as collateral in a financing transaction. See Note 1 of the Notes to Financial Statements for details of municipal bonds transferred to TOBs. |
See Notes to Financial Statements.
| | | | | | |
| | | | | | | |
| | ANNUAL REPORT | | AUGUST 31, 2012 | | 21 |
| | |
| Schedule of Investments (concluded) | | BlackRock MuniHoldings New York Quality Fund, Inc. (MHN) |
| (f) | | Investments in issuers considered to be an affiliate of the Trust during the year ended August 31, 2012, for purposes of Section 2(a)(3) of the 1940 Act, were as follows: |
| | | | | | | | | | | | | | | | |
| Affiliate | | Shares
Held at
August 31,
2011 | | | Net
Activity | | | Shares
Held at
August 31,
2012 | | | Income | |
BIF New York Municipal Money Fund | | | 12,792,001 | | | | (3,262,507 | ) | | | 9,529,494 | | | $ | 74 | |
| (g) | | Represents the current yield as of report date. |
| Ÿ | | For Trust compliance purposes, the Trust’s sector classifications refer to any one or more of the sector sub-classifications used by one or more widely recognized market indexes or rating group indexes, and/or as defined by Trust’s management. These definitions may not apply for purposes of this report, which may combine such sector sub- classifications for reporting ease. |
| Ÿ | | Fair Value Measurements—Various inputs are used in determining the fair value of investments. These inputs to valuation techniques are categorized into a disclosure hierarchy consisting of three broad levels for financial statement purposes as follows: |
| Ÿ | | Level 1 — unadjusted price quotations in active markets/exchanges for identical assets and liabilities |
| Ÿ | | Level 2 — other observable inputs (including, but not limited to: quoted prices for similar assets or liabilities in markets that are active, quoted prices for identical or similar assets or liabilities in markets that are not active, inputs other than quoted prices that are observable for the assets or liabilities (such as interest rates, yield curves, volatilities, prepayment speeds, loss severities, credit risks and default rates) or other market-corroborated inputs) |
| Ÿ | | Level 3 — unobservable inputs based on the best information available in the circumstances, to the extent observable inputs are not available (including the Trust’s own assumptions used in determining the fair value of investments) |
Changes in valuation techniques may result in transfers into or out of an assigned level within the disclosure hierarchy. In accordance with the Trust’s policy, transfers between different levels of the fair value disclosure hierarchy are deemed to have occurred as of the beginning of the reporting period. The categorization of a value determined for investments is based on the pricing transparency of the investment and is not necessarily an indication of the risks associated with investing in those securities. For information about the Trust’s policy regarding valuation of investments and other significant accounting policies, please refer to Note 1 of the Notes to Financial Statements.
The following table summarizes the Trust’s investments categorized in the disclosure hierarchy as of August 31, 2012:
| | | | | | | | | | | | | | | | |
| | | Level 1 | | | Level 2 | | | Level 3 | | | Total | |
Assets: | | | | | | | | | | | | | | | | |
| Investments: | | | | | | | | | | | | | | | | |
Long-Term Investments1 | | | — | | | $ | 791,834,890 | | | | — | | | $ | 791,834,890 | |
Short-Term Securities | | $ | 9,529,494 | | | | — | | | | — | | | | 9,529,494 | |
| | | | | | | | | | | | | | | | |
Total | | $ | 9,529,494 | | | $ | 791,834,890 | | | | — | | | $ | 801,364,384 | |
| | | | | | | | | | | | | | | | |
| 1 | | See above Schedule of Investments for values in each sector. |
Certain of the Trust’s liabilities are held at carrying amount, which approximates fair value for financial statement purposes. As of August 31, 2012, such liabilities are categorized within the disclosure hierarchy as follows:
| | | | | | | | | | | | | | | | |
| | | Level 1 | | | Level 2 | | | Level 3 | | | Total | |
Liabilities: | | | | | | | | | | | | | | | | |
Bank overdraft | | | — | | | $ | (2,349 | ) | | | — | | | $ | (2,349 | ) |
TOB trust certificates | | | — | | | | (77,476,820 | ) | | | — | | | | (77,476,820 | ) |
VRDP Shares | | | — | | | | (243,600,000 | ) | | | — | | | | (243,600,000 | ) |
| | | | | | | | | | | | | | | | |
Total | | | — | | | $ | (321,079,169 | ) | | | — | | | $ | (321,079,169 | ) |
| | | | | | | | | | | | | | | | |
There were no transfers between levels during the year ended August 31, 2012.
See Notes to Financial Statements.
| | | | | | |
| | | | | | | |
| 22 | | ANNUAL REPORT | | AUGUST 31, 2012 | | |
| | |
| Schedule of Investments August 31, 2012 | | BlackRock New Jersey Municipal Bond Trust (BLJ) (Percentages shown are based on Net Assets) |
| | | | | | | | |
| Municipal Bonds | | Par
(000) | | | Value | |
| | | | | | | | |
New Jersey — 125.4% | | | | | | | | |
Corporate — 10.7% | |
New Jersey EDA, RB, Continental Airlines Inc. Project, AMT, 7.23%, 11/15/30 (a) | | $ | 2,335 | | | $ | 2,343,896 | |
New Jersey EDA, Refunding RB, AMT: | | | | | | | | |
New Jersey American Water Co., Inc. Project,
Series A, 5.70%, 10/01/39 | | | 475 | | | | 530,632 | |
New Jersey American Water Co., Inc. Project,
Series B, 5.60%, 11/01/34 | | | 395 | | | | 448,914 | |
Salem County Pollution Control Financing Authority, Refunding RB, Atlantic City Electric, Series A, 4.88%, 6/01/29 | | | 750 | | | | 831,802 | |
| | | | | | | | |
| | | | | | | | 4,155,244 | |
County/City/Special District/School District — 9.7% | | | | | | | | |
Bergen County Improvement Authority, RB, Fair Lawn Community Center, 5.00%, 9/15/34 (b) | | | 245 | | | | 288,595 | |
City of Margate City New Jersey, GO, Refunding, Improvement: | | | | | | | | |
5.00%, 1/15/27 | | | 230 | | | | 266,593 | |
5.00%, 1/15/28 | | | 110 | | | | 126,970 | |
Essex County Improvement Authority, Refunding RB, Project Consolidation (NPFGC): | | | | | | | | |
5.50%, 10/01/28 | | | 400 | | | | 528,044 | |
5.50%, 10/01/29 | | | 790 | | | | 1,049,957 | |
Hudson County Improvement Authority, RB, Harrison Parking Facility Project, Series C (AGC), 5.38%, 1/01/44 | | | 800 | | | | 896,568 | |
Middlesex County Improvement Authority, RB, Subordinate, Heldrich Center Hotel, Series B, 6.25%, 1/01/37 (c)(d) | | | 560 | | | | 41,888 | |
Union County Improvement Authority, RB, Guaranteed Lease-Family Court Building Project, 5.00%, 5/01/42 | | | 470 | | | | 536,068 | |
| | | | | | | | |
| | | | | | | | 3,734,683 | |
Education — 22.3% | | | | | | | | |
New Jersey EDA, RB: | | | | | | | | |
School Facilities Construction, Series CC-2, 5.00%, 12/15/31 | | | 500 | | | | 566,010 | |
School Facilities Construction, Series S, 5.00%, 9/01/36 | | | 280 | | | | 298,567 | |
New Jersey EDA, Refunding RB, School Facilities,
Series GG, 5.25%, 9/01/27 | | | 1,345 | | | | 1,577,174 | |
New Jersey Educational Facilities Authority, RB, Montclair State University, Series J, 5.25%, 7/01/38 | | | 180 | | | | 198,277 | |
New Jersey Educational Facilities Authority, Refunding RB: | | | | | | | | |
College of New Jersey, Series D (AGM), 5.00%, 7/01/35 | | | 1,010 | | | | 1,107,122 | |
Georgian Court University, Series D,
5.00%, 7/01/33 | | | 150 | | | | 158,891 | |
Kean University, Series A, 5.50%, 9/01/36 | | | 700 | | | | 797,902 | |
New Jersey Institute of Technology, Series H, 5.00%, 7/01/31 | | | 210 | | | | 235,534 | |
Ramapo College, Series B, 5.00%, 7/01/42 | | | 85 | | | | 96,055 | |
University of Medicine & Dentistry, Series B, 7.50%, 12/01/32 | | | 450 | | | | 564,115 | |
New Jersey Higher Education Student Assistance Authority, RB, Student Loan Revenue, Series 1A, AMT, 5.00%, 12/01/22 | | | 915 | | | | 1,030,381 | |
New Jersey Higher Education Student Assistance Authority, Refunding RB: | | | | | | | | |
Series 1, AMT, 5.75%, 12/01/29 | | | 640 | | | | 739,770 | |
Series 1A, 5.00%, 12/01/25 | | | 165 | | | | 181,417 | |
Series 1A, 5.00%, 12/01/26 | | | 125 | | | | 137,185 | |
Series 1A, 5.13%, 12/01/27 | | | 300 | | | | 333,438 | |
Series 1A, 5.25%, 12/01/32 | | | 300 | | | | 332,535 | |
New Jersey Institute of Technology, GO, Series A, 5.00%, 7/01/42 | | | 250 | | | | 284,080 | |
| | | | | | | | |
| | | | | | | | 8,638,453 | |
| | | | | | | | |
| Municipal Bonds | | Par
(000) | | | Value | |
| | | | | | | | |
New Jersey (continued) | | | | | | | | |
Health — 14.7% | | | | | | | | |
New Jersey EDA, RB, First Mortgage, Lions Gate Project, Series A: | | | | | | | | |
5.75%, 1/01/25 | | $ | 150 | | | $ | 151,861 | |
5.88%, 1/01/37 | | | 265 | | | | 266,235 | |
New Jersey EDA, Refunding RB: | | | | | | | | |
First Mortgage Winchester, Series A, 5.80%, 11/01/31 | | | 1,000 | | | | 1,025,320 | |
Seabrook Village, Inc. Facility, 5.25%, 11/15/26 | | | 470 | | | | 480,627 | |
New Jersey Health Care Facilities Financing Authority, RB (AGC): | | | | | | | | |
Meridian Health, Series I, 5.00%, 7/01/38 | | | 245 | | | | 262,226 | |
Virtua Health, 5.50%, 7/01/38 | | | 400 | | | | 444,888 | |
New Jersey Health Care Facilities Financing Authority, Refunding RB: | | | | | | | | |
5.00%, 7/01/26 | | | 305 | | | | 341,423 | |
AHS Hospital Corp., 6.00%, 7/01/41 | | | 610 | | | | 733,720 | |
Kennedy Health System, 5.00%, 7/01/37 | | | 195 | | | | 211,374 | |
South Jersey Hospital, 5.00%, 7/01/46 | | | 500 | | | | 516,665 | |
St. Barnabas Health, Series A, 5.00%, 7/01/29 | | | 500 | | | | 513,475 | |
St. Barnabas Health, Series A, 5.63%, 7/01/32 | | | 180 | | | | 201,433 | |
St. Barnabas Health, Series A, 5.63%, 7/01/37 | | | 505 | | | | 558,798 | |
| | | | | | | | |
| | | | | | | | 5,708,045 | |
Housing — 6.9% | | | | | | | | |
New Jersey State Housing & Mortgage Finance Agency, RB: | | | | | | | | |
M/F, Series A, 4.55%, 11/01/43 | | | 485 | | | | 496,664 | |
S/F Housing, Series CC, 5.00%, 10/01/34 | | | 550 | | | | 592,086 | |
Series A, 4.75%, 11/01/29 | | | 370 | | | | 400,052 | |
Series AA, 6.38%, 10/01/28 | | | 825 | | | | 924,800 | |
Series AA, 6.50%, 10/01/38 | | | 255 | | | | 271,634 | |
| | | | | | | | |
| | | | | | | | 2,685,236 | |
State — 48.8% | | | | | | | | |
Garden State Preservation Trust, RB, CAB, Series B (AGM), 3.35%, 11/01/27 (e) | | | 4,000 | | | | 2,416,720 | |
New Jersey EDA, RB: | | | | | | | | |
Motor Vehicle Surcharge, Series A (NPFGC), 5.25%, 7/01/24 | | | 500 | | | | 608,555 | |
Motor Vehicle Surcharge, Series A (NPFGC), 5.25%, 7/01/25 | | | 500 | | | | 612,490 | |
School Facilities Construction, Series Z (AGC), 5.50%, 12/15/34 | | | 1,000 | | | | 1,147,200 | |
New Jersey EDA, Refunding RB: | | | | | | | | |
(AGM), 5.00%, 6/15/22 | | | 1,000 | | | | 1,161,980 | |
Cigarette Tax, 5.00%, 6/15/28 | | | 255 | | | | 283,996 | |
Cigarette Tax, 5.00%, 6/15/29 | | | 500 | | | | 553,380 | |
Kapkowski Road Landfill Project, 6.50%, 4/01/28 | | | 2,250 | | | | 2,689,650 | |
School Facilities Construction, Series AA, 5.50%, 12/15/29 | | | 500 | | | | 586,290 | |
School Facilities Construction, Series GG, 5.25%, 9/01/26 | | | 1,000 | | | | 1,180,870 | |
New Jersey Health Care Facilities Financing Authority, RB, Hospital Asset Transformation Program, Series A, 5.25%, 10/01/38 | | | 500 | | | | 543,845 | |
New Jersey Transportation Trust Fund Authority, RB, Transportation System: | | | | | | | | |
CAB, Series C (AGM), 4.48%, 12/15/32 (e) | | | 1,250 | | | | 508,763 | |
Series A (AGC), 5.63%, 12/15/28 | | | 200 | | | | 236,232 | |
Series A, 6.00%, 6/15/35 | | | 1,275 | | | | 1,571,845 | |
Series A, 5.88%, 12/15/38 | | | 555 | | | | 645,459 | |
Series A, 6.00%, 12/15/38 | | | 325 | | | | 381,095 | |
Series A, 5.50%, 6/15/41 | | | 500 | | | | 584,135 | |
Series B, 5.00%, 6/15/42 | | | 1,000 | | | | 1,119,820 | |
Series B, 5.25%, 6/15/36 | | | 1,000 | | | | 1,153,440 | |
See Notes to Financial Statements.
| | | | | | |
| | | | | | | |
| | ANNUAL REPORT | | AUGUST 31, 2012 | | 23 |
| | |
| Schedule of Investments (continued) | | BlackRock New Jersey Municipal Bond Trust (BLJ) (Percentages shown are based on Net Assets) |
| | | | | | | | |
| Municipal Bonds | | Par
(000) | | | Value | |
| | | | | | | | |
New Jersey (concluded) | | | | | | | | |
State (concluded) | | | | | | | | |
State of New Jersey, COP, Equipment Lease Purchase, Series A: | | | | | | | | |
5.25%, 6/15/27 | | $ | 600 | | | $ | 680,796 | |
5.25%, 6/15/28 | | | 200 | | | | 226,002 | |
| | | | | | | | |
| | | | | | | | 18,892,563 | |
Transportation — 9.6% | | | | | | | | |
Delaware River Port Authority, RB, Series D, 5.00%, 1/01/40 | | | 250 | | | | 274,738 | |
New Jersey State Turnpike Authority, RB: | | | | | | | | |
Series A, 5.00%, 1/01/35 | | | 195 | | | | 224,819 | |
Series E, 5.25%, 1/01/40 | | | 370 | | | | 415,862 | |
New Jersey State Turnpike Authority, Refunding RB, Series B, 5.00%, 1/01/30 (b) | | | 445 | | | | 522,693 | |
Port Authority of New York & New Jersey, RB, JFK International Air Terminal, 6.00%, 12/01/42 | | | 450 | | | | 521,590 | |
Port Authority of New York & New Jersey, Refunding RB, AMT: | | | | | | | | |
Consolidated, 152nd Series, 5.75%, 11/01/30 | | | 525 | | | | 625,616 | |
Consolidated, 172nd Series, 5.00%, 10/01/34 | | | 1,000 | | | | 1,127,280 | |
| | | | | | | | |
| | | | | | | | 3,712,598 | |
Utilities — 2.7% | | | | | | | | |
Rahway Valley Sewerage Authority, RB, CAB, Series A (NPFGC), 4.51%, 9/01/33 (e) | | | 650 | | | | 254,885 | |
Union County Utilities Authority, Refunding RB, New Jersey Solid Waste System, County Deficiency Agreement, Series A, 5.00%, 6/15/41 | | | 685 | | | | 784,996 | |
| | | | | | | | |
| | | | | | | | 1,039,881 | |
Total Municipal Bonds in New Jersey | | | | 48,566,703 | |
| | | | | | | | |
Multi-State — 5.7% | | | | | | | | |
Housing — 5.7% | | | | | | | | |
Centerline Equity Issuer Trust, 7.20%, 11/15/52 (f)(g) | | | 2,000 | | | | 2,213,680 | |
| | | | | | | | |
Puerto Rico — 5.9% | | | | | | | | |
State — 5.9% | | | | | | | | |
Puerto Rico Sales Tax Financing Corp., RB, First Sub-Series A: | | | | | | | | |
5.75%, 8/01/37 | | | 970 | | | | 1,081,570 | |
6.00%, 8/01/42 | | | 500 | | | | 560,525 | |
Puerto Rico Sales Tax Financing Corp., Refunding RB, First Sub-Series C, 6.00%, 8/01/39 | | | 540 | | | | 615,006 | |
Total Municipal Bonds in Puerto Rico | | | | 2,257,101 | |
Total Municipal Bonds — 137.0% | | | | 53,037,484 | |
|
| |
| |
Municipal Bonds Transferred to
Tender Option Bond Trusts (h) | | | | |
New Jersey — 18.8% | | | | | | | | |
Education — 5.9% | | | | | | | | |
New Jersey EDA, RB, School Facilities Construction, Series Z (AGC), 6.00%, 12/15/34 | | | 1,000 | | | | 1,178,250 | |
Rutgers State University of New Jersey, Refunding RB, Series F, 5.00%, 5/01/39 | | | 990 | | | | 1,101,280 | |
| | | | | | | | |
| | | | | | | | 2,279,530 | |
Transportation — 7.8% | | | | | | | | |
New Jersey Transportation Trust Fund Authority, RB, Transportation System, Series A (AGM), 5.00%, 12/15/32 | | | 600 | | | | 687,150 | |
Port Authority of New York & New Jersey, RB, Consolidated, 169th Series, AMT, 5.00%, 10/15/41 | | | 1,500 | | | | 1,650,240 | |
| | | | | | | | |
Municipal Bonds Transferred to
Tender Option Bond Trusts (h) | | Par
(000) | | | Value | |
| | | | | | | | |
New Jersey (concluded) | | | | | | | | |
Transportation (concluded) | | | | | | | | |
Port Authority of New York & New Jersey, Refunding RB, Consolidated, 152nd Series, AMT, 5.25%, 11/01/35 | | $ | 630 | | | $ | 695,147 | |
| | | | | | | | |
| | | | | | | | 3,032,537 | |
Utilities — 5.1% | | | | | | | | |
Union County Utilities Authority, Refunding RB, Covanta Union, Series A, AMT, 5.25%, 12/01/31 | | | 1,780 | | | | 1,982,546 | |
Total Municipal Bonds in New Jersey | | | | 7,294,613 | |
| | | | | | | | |
Puerto Rico — 1.1% | | | | | | | | |
State — 1.1% | | | | | | | | |
Puerto Rico Sales Tax Financing Corp., Refunding RB, Series C, 5.25%, 8/01/40 | | | 370 | | | | 411,434 | |
Total Municipal Bonds Transferred to
Tender Option Bond Trusts — 19.9% | | | | 7,706,047 | |
Total Long-Term Investments
(Cost — $55,310,740) — 156.9% | | | | 60,743,531 | |
| | | | | | | | |
|
| |
| | |
| Short-Term Securities | | Shares | | | | |
BIF New Jersey Municipal Money Fund, 0.00% (i)(j) | | | 891,865 | | | | 891,865 | |
Total Short-Term Securities (Cost — $891,865) — 2.3% | | | | 891,865 | |
| Total Investments (Cost — $56,202,605) — 159.2% | | | | 61,635,396 | |
| Liabilities in Excess of Other Assets — (0.7)% | | | | (251,433 | ) |
Liability for TOB Trust Certificates, Including Interest
Expense and Fees Payable — (10.2)% | | | | (3,956,461 | ) |
| VRDP Shares, at Liquidation Value — (48.3)% | | | | (18,700,000 | ) |
| | | | | | | | |
| Net Assets Applicable to Common Shares — 100.0% | | | $ | 38,727,502 | |
| | | | | | | | |
| | | | | | | | | |
| (a) | | Variable rate security. Rate shown is as of report date. |
| (b) | | When-issued security. Unsettled when-issued transactions were as follows: |
| | | | | | | | |
| Counterparty | | Value | | | Unrealized
Appreciation | |
| Citigroup, Inc. | | $ | 522,693 | | | $ | 6,746 | |
| Wells Fargo & Co. | | $ | 288,595 | | | $ | 2,599 | |
| (c) | | Issuer filed for bankruptcy and/or is in default of principal and/or interest payments. |
| (d) | | Non-income producing security. |
| (e) | | Represents a zero-coupon bond. Rate shown reflects the current yield as of report date. |
| (f) | | Security represents a beneficial interest in a trust. The collateral deposited into the trust is federally tax-exempt revenue bonds issued by various state or local governments, or their respective agencies or authorities. The security is subject to remarketing prior to its stated maturity. |
| (g) | | Security exempt from registration pursuant to Rule 144A under the Securities Act of 1933, as amended. These securities may be resold in transactions exempt from registration to qualified institutional investors. |
| (h) | | Securities represent bonds transferred to a TOB in exchange for which the Trust’s acquired residual interest certificates. These securities serve as collateral in a financing transaction. See Note 1 of the Notes to Financial Statements for details of municipal bonds transferred to TOBs. |
See Notes to Financial Statements.
| | | | | | |
| | | | | | | |
| 24 | | ANNUAL REPORT | | AUGUST 31, 2012 | | |
| | |
| Schedule of Investments (concluded) | | BlackRock New Jersey Municipal Bond Trust (BLJ) |
| (i) | | Investments in issuers considered to be an affiliate of the Trust during the year ended August 31, 2012, for purposes of Section 2(a)(3) of the 1940 Act, were as follows: |
| | | | | | | | | | | | | | | | |
| Affiliate | | Shares
Held at
August 31,
2011 | | | Net
Activity | | | Shares
Held at
August 31,
2012 | | | Income | |
BIF New Jersey Municipal Money Fund | | | 1,251,808 | | | | (359,943 | ) | | | 891,865 | | | $ | 38 | |
| (j) | | Represents the current yield as of report date. |
| Ÿ | | For Trust compliance purposes, the Trust’s sector classifications refer to any one or more of the sector sub-classifications used by one or more widely recognized market indexes or rating group indexes, and/or as defined by Trust’s management. These definitions may not apply for purposes of this report, which may combine such sector sub- classifications for reporting ease. |
| Ÿ | | Fair Value Measurements—Various inputs are used in determining the fair value of investments. These inputs to valuation techniques are categorized into a disclosure hierarchy consisting of three broad levels for financial statement purposes as follows: |
| Ÿ | | Level 1 — unadjusted price quotations in active markets/exchanges for identical assets and liabilities |
| Ÿ | | Level 2 — other observable inputs (including, but not limited to: quoted prices for similar assets or liabilities in markets that are active, quoted prices for identical or similar assets or liabilities in markets that are not active, inputs other than quoted prices that are observable for the assets or liabilities (such as interest rates, yield curves, volatilities, prepayment speeds, loss severities, credit risks and default rates) or other market-corroborated inputs) |
| Ÿ | | Level 3 — unobservable inputs based on the best information available in the circumstances, to the extent observable inputs are not available (including the Trust’s own assumptions used in determining the fair value of investments) |
Changes in valuation techniques may result in transfers into or out of an assigned level within the disclosure hierarchy. In accordance with the Trust’s policy, transfers between different levels of the fair value disclosure hierarchy are deemed to have occurred as of the beginning of the reporting period. The categorization of a value determined for investments is based on the pricing transparency of the investment and is not necessarily an indication of the risks associated with investing in those securities. For information about the Trust’s policy regarding valuation of investments and other significant accounting policies, please refer to Note 1 of the Notes to Financial Statements.
The following table summarizes the Trust’s investments categorized in the disclosure hierarchy as of August 31, 2012:
| | | | | | | | | | | | | | | | |
| | | Level 1 | | | Level 2 | | | Level 3 | | | Total | |
Assets: | | | | | | | | | | | | | | | | |
| Investments: | | | | | | | | | | | | | | | | |
Long-Term Investments1 | | | — | | | $ | 60,743,531 | | | | — | | | $ | 60,743,531 | |
Short-Term Securities | | $ | 891,865 | | | | — | | | | — | | | | 891,865 | |
| | | | | | | | | | | | | | | | |
Total | | $ | 891,865 | | | $ | 60,743,531 | | | | — | | | $ | 61,635,396 | |
| | | | | | | | | | | | | | | | |
| 1 | | See above Schedule of Investments for values in each sector. |
Certain of the Trust’s liabilities are held at carrying amount, which approximates fair value for financial statement purposes. As of August 31, 2012, such liabilities are categorized within the disclosure hierarchy as follows:
| | | | | | | | | | | | | | | | |
| | | Level 1 | | | Level 2 | | | Level 3 | | | Total | |
Liabilities: | | | | | | | | | | | | | | | | |
TOB trust certificates | | | — | | | $ | (3,954,288 | ) | | | — | | | $ | (3,954,288 | ) |
VRDP Shares | | | — | | | | (18,700,000 | ) | | | — | | | | (18,700,000 | ) |
| | | | | | | | | | | | | | | | |
Total | | | — | | | $ | (22,654,288 | ) | | | — | | | $ | (22,654,288 | ) |
| | | | | | | | | | | | | | | | |
There were no transfers between levels during the year ended August 31, 2012.
See Notes to Financial Statements.
| | | | | | |
| | | | | | | |
| | ANNUAL REPORT | | AUGUST 31, 2012 | | 25 |
| | |
| Schedule of Investments August 31, 2012 | | BlackRock New York Municipal Bond Trust (BQH) (Percentages shown are based on Net Assets) |
| | | | | | | | |
| Municipal Bonds | | Par
(000) | | | Value | |
| | | | | | | | |
New York — 117.2% | | | | | | | | |
Corporate — 17.6% | |
Chautauqua County Industrial Development Agency, RB, NRG Dunkirk Power Project, 5.88%, 4/01/42 | | $ | 750 | | | $ | 842,467 | |
Essex County Industrial Development Agency New York, RB, International Paper Co. Project, Series A, AMT, 6.63%, 9/01/32 | | | 100 | | | | 111,232 | |
Monroe County Industrial Development Corp., Refunding RB, University of Rochester Project, Series A,
5.00%, 7/01/41 | | | 975 | | | | 1,090,762 | |
New York City Industrial Development Agency, RB, American Airlines Inc., JFK International Airport, AMT (a)(b): | | | | | | | | |
7.63%, 8/01/25 | | | 750 | | | | 787,665 | |
7.75%, 8/01/31 | | | 1,000 | | | | 1,050,250 | |
New York City Industrial Development Agency, Refunding RB, Senior, Series A, 5.00%, 7/01/28 (c) | | | 690 | | | | 729,496 | |
New York Liberty Development Corp., RB, Goldman Sachs Headquarters, 5.25%, 10/01/35 | | | 1,100 | | | | 1,278,552 | |
Port Authority of New York & New Jersey, RB, Continental Airlines Inc. and Eastern Air Lines Inc. Project, LaGuardia, AMT, 9.13%, 12/01/15 | | | 1,695 | | | | 1,737,544 | |
Suffolk County Industrial Development Agency New York, RB, KeySpan, Port Jefferson, AMT, 5.25%, 6/01/27 | | | 500 | | | | 514,070 | |
| | | | | | | | |
| | | | | | | | 8,142,038 | |
County/City/Special District/School District — 32.3% | |
Amherst Development Corp., Refunding RB, University at Buffalo Foundation Faculty-Student Housing Corp., Series A (AGM): | | | | | | | | |
4.38%, 10/01/30 | | | 250 | | | | 268,925 | |
4.63%, 10/01/40 | | | 140 | | | | 150,797 | |
City of New York New York, GO: | | | | | | | | |
Series A-1, 4.75%, 8/15/25 | | | 500 | | | | 570,830 | |
Series D, 5.38%, 6/01/32 | | | 15 | | | | 15,061 | |
Sub-Series G-1, 5.00%, 4/01/28 | | | 400 | | | | 478,712 | |
Sub-Series G-1, 6.25%, 12/15/31 | | | 250 | | | | 310,998 | |
Sub-Series I-1, 5.38%, 4/01/36 | | | 450 | | | | 520,092 | |
Hudson New York Yards Infrastructure Corp., RB, Series A: | | | | | | | | |
5.00%, 2/15/47 | | | 750 | | | | 793,807 | |
(AGM), 5.00%, 2/15/47 | | | 750 | | | | 796,980 | |
(NPFGC), 4.50%, 2/15/47 | | | 1,100 | | | | 1,134,452 | |
(NPFGC), 5.00%, 2/15/47 | | | 350 | | | | 370,443 | |
Monroe County Industrial Development Corp., Refunding RB, University of Rochester Project, Series A,
5.00%, 7/01/31 | | | 500 | | | | 580,865 | |
New York City Industrial Development Agency, RB, PILOT: | | | | | | | | |
CAB, Yankee Stadium (AGC), 5.00%, 3/01/41 (d) | | | 5,155 | | | | 1,263,130 | |
CAB, Yankee Stadium (AGC), 5.01%, 3/01/42 (d) | | | 500 | | | | 116,215 | |
CAB, Yankee Stadium (AGC), 5.08%, 3/01/43 (d) | | | 2,000 | | | | 433,440 | |
CAB, Yankee Stadium (AGC), 5.16%, 3/01/45 (d) | | | 950 | | | | 181,631 | |
Queens Baseball Stadium (AGC), 6.38%, 1/01/39 | | | 100 | | | | 117,671 | |
Queens Baseball Stadium (AMBAC),
5.00%, 1/01/39 | | | 500 | | | | 507,940 | |
Yankee Stadium (NPFGC), 5.00%, 3/01/46 | | | 175 | | | | 180,495 | |
New York City Transitional Finance Authority, RB, Series S-1, 4.00%, 7/15/42 | | | 100 | | | | 101,465 | |
New York Convention Center Development Corp., RB, Hotel Unit Fee Secured (AMBAC): | | | | | | | | |
5.00%, 11/15/44 | | | 1,015 | | | | 1,061,680 | |
4.75%, 11/15/45 | | | 500 | | | | 514,030 | |
New York Liberty Development Corp., Refunding RB: | | | | | | | | |
4 World Trade Center Project, Series 2011,
5.00%, 11/15/31 | | | 750 | | | | 860,092 | |
4 World Trade Center Project, Series 2011,
5.75%, 11/15/51 | | | 340 | | | | 402,387 | |
| | | | | | | | |
| Municipal Bonds | | Par
(000) | | | Value | |
| | | | | | | | |
New York (continued) | | | | | | | | |
County/City/Special District/School District (concluded) | |
New York Liberty Development Corp., Refunding RB (concluded): | | | | | | | | |
7 World Trade Center Project, Series 2012, Class 2, 5.00%, 9/15/43 | | $ | 550 | | | $ | 601,469 | |
7 World Trade Center Project, Series 2012, Class 3, 5.00%, 3/15/44 | | | 520 | | | | 559,182 | |
Second Priority, Bank of America Tower at One Bryant Park Project, 5.63%, 7/15/47 | | | 1,350 | | | | 1,513,498 | |
Second Priority, Bank of America Tower at One Bryant Park Project, 6.38%, 7/15/49 | | | 285 | | | | 326,755 | |
New York State Dormitory Authority, RB, State University Dormitory Facilities, Series A, 5.00%, 7/01/39 | | | 150 | | | | 166,838 | |
| | | | | | | | |
| | | | | | | | 14,899,880 | |
Education — 26.9% | |
Albany Industrial Development Agency, RB, New Covenant Charter School Project, Series A (b)(e): | | | | | | | | |
7.00%, 5/01/25 | | | 200 | | | | 44,994 | |
7.00%, 5/01/35 | | | 130 | | | | 29,246 | |
City of Troy New York, Refunding RB, Rensselaer Polytechnic, Series A, 5.13%, 9/01/40 | | | 500 | | | | 552,595 | |
Dutchess County Industrial Development Agency New York, Refunding RB, Bard College Civic Facility,
Series A-2, 4.50%, 8/01/36 | | | 500 | | | | 509,925 | |
Nassau County Industrial Development Agency, Refunding RB, New York Institute of Technology Project, Series A, 4.75%, 3/01/26 | | | 200 | | | | 219,046 | |
New York City Trust for Cultural Resources, RB, Juilliard School, Series A, 5.00%, 1/01/39 | | | 250 | | | | 286,457 | |
New York City Trust for Cultural Resources, Refunding RB, Carnegie Hall, Series A, 4.75%, 12/01/39 | | | 400 | | | | 434,688 | |
New York State Dormitory Authority, RB: | | | | | | | | |
Convent of the Sacred Heart (AGM),
5.75%, 11/01/40 | | | 300 | | | | 355,491 | |
New York University, Series 1 (BHAC),
5.50%, 7/01/31 | | | 245 | | | | 321,580 | |
New York University, Series B, 5.00%, 7/01/42 | | | 1,990 | | | | 2,257,715 | |
Rochester Institute of Technology, Series A,
6.00%, 7/01/33 | | | 325 | | | | 383,282 | |
Teachers College, Series B, 5.00%, 7/01/42 | | | 1,750 | | | | 1,980,737 | |
University of Rochester, Series A, 5.13%, 7/01/39 | | | 215 | | | | 241,335 | |
University of Rochester, Series A,
4.89%, 7/01/39 (f) | | | 175 | | | | 181,701 | |
New York State Dormitory Authority, Refunding RB: | | | | | | | | |
Brooklyn Law School, 5.75%, 7/01/33 | | | 125 | | | | 143,675 | |
Cornell University, Series A, 5.00%, 7/01/40 | | | 150 | | | | 170,351 | |
New York University, Series A, 5.00%, 7/01/37 | | | 445 | | | | 510,482 | |
New York University, Series A, 5.00%, 7/01/42 | | | 1,750 | | | | 1,985,427 | |
Rockefeller University, Series B, 4.00%, 7/01/38 | | | 415 | | | | 438,497 | |
Saint John’s University, Series A, 5.00%, 7/01/27 | | | 105 | | | | 124,040 | |
Skidmore College, Series A, 5.00%, 7/01/28 | | | 250 | | | | 289,587 | |
Teachers College, Series A, 5.50%, 3/01/39 | | | 350 | | | | 394,716 | |
Suffolk County Industrial Development Agency, Refunding RB, New York Institute of Technology Project, 5.00%, 3/01/26 | | | 150 | | | | 155,066 | |
Tompkins County Development Corp., RB, Ithaca College Project (AGM), 5.50%, 7/01/33 | | | 100 | | | | 116,703 | |
Yonkers Industrial Development Agency New York, RB, Sarah Lawrence College Project, Series A,
6.00%, 6/01/41 | | | 250 | | | | 281,983 | |
| | | | | | | | |
| | | | | | | | 12,409,319 | |
See Notes to Financial Statements.
| | | | | | |
| | | | | | | |
| 26 | | ANNUAL REPORT | | AUGUST 31, 2012 | | |
| | |
| Schedule of Investments (continued) | | BlackRock New York Municipal Bond Trust (BQH) (Percentages shown are based on Net Assets) |
| | | | | | | | |
| Municipal Bonds | | Par
(000) | | | Value | |
| | | | | | | | |
New York (continued) | | | | | | | | |
Health — 18.4% | |
Dutchess County Local Development Corp., Refunding RB, Health Quest System Inc., Series A,
5.75%, 7/01/30 | | $ | 350 | | | $ | 410,861 | |
Genesee County Industrial Development Agency New York, Refunding RB, United Memorial Medical Center Project, 5.00%, 12/01/27 | | | 150 | | | | 149,040 | |
Monroe County Industrial Development Corp., Refunding RB, Unity Hospital of Rochester Project (FHA), 5.50%, 8/15/40 | | | 275 | | | | 317,125 | |
New York State Dormitory Authority, RB: | | | | | | | | |
Miriam Osborn Memorial Home,
5.00%, 7/01/29 (c) | | | 290 | | | | 313,838 | |
Miriam Osborn Memorial Home,
5.00%, 7/01/42 (c) | | | 115 | | | | 121,529 | |
New York State Association for Retarded Children Inc., Series B (AMBAC), 6.00%, 7/01/32 | | | 185 | | | | 213,490 | |
New York University Hospital Center, Series A, 5.75%, 7/01/31 | | | 220 | | | | 255,939 | |
New York University Hospital Center, Series B, 5.63%, 7/01/37 | | | 260 | | | | 283,514 | |
North Shore-Long Island Jewish Health System, Series A, 5.50%, 5/01/37 | | | 450 | | | | 511,384 | |
North Shore-Long Island Jewish Health System, Series A, 5.75%, 5/01/37 | | | 500 | | | | 579,555 | |
North Shore-Long Island Jewish Health System, Series C, 4.25%, 5/01/39 | | | 250 | | | | 254,155 | |
North Shore-Long Island Jewish Health System, Series D, 4.25%, 5/01/39 | | | 325 | | | | 329,622 | |
North Shore-Long Island Jewish Health System, Series D, 5.00%, 5/01/39 | | | 120 | | | | 131,248 | |
New York State Dormitory Authority, Refunding RB: | | | | | | | | |
Mount Sinai Hospital, Series A, 5.00%, 7/01/26 | | | 315 | | | | 353,534 | |
North Shore-Long Island Jewish Health System, Series A, 5.00%, 5/01/32 | | | 1,000 | | | | 1,119,190 | |
North Shore-Long Island Jewish Health System, Series E, 5.50%, 5/01/33 | | | 250 | | | | 283,460 | |
Teachers College, Series A, 5.00%, 7/01/31 | | | 325 | | | | 379,382 | |
Saratoga County Industrial Development Agency New York, RB, Saratoga Hospital Project, Series B,
5.25%, 12/01/32 | | | 200 | | | | 211,818 | |
Suffolk County Industrial Development Agency New York, Refunding RB, Jeffersons Ferry Project,
5.00%, 11/01/28 | | | 260 | | | | 265,538 | |
Westchester County Healthcare Corp. New York, Refunding RB, Senior Lien: | | | | | | | | |
Series A, 5.00%, 11/01/30 | | | 1,150 | | | | 1,263,390 | |
Series B, 6.00%, 11/01/30 | | | 200 | | | | 237,270 | |
Westchester County Industrial Development Agency New York, RB, Kendal on Hudson Project, Series A,
6.38%, 1/01/24 | | | 500 | | | | 502,525 | |
| | | | | | | | |
| | | | | | | | 8,487,407 | |
Housing — 1.1% | | | | | | | | |
New York State HFA, RB, Highland Avenue Senior Apartments, Series A, AMT (SONYMA),
5.00%, 2/15/39 | | | 500 | | | | 516,090 | |
State — 3.7% | | | | | | | | |
New York State Dormitory Authority, ERB: | | | | | | | | |
Series B, 5.75%, 3/15/36 | | | 300 | | | | 365,004 | |
Series C, 5.00%, 12/15/31 | | | 250 | | | | 285,225 | |
New York State Dormitory Authority, LRB, Municipal Health Facilities, Sub-Series 2-4, 4.75%, 1/15/30 | | | 350 | | | | 380,712 | |
| | | | | | | | |
| Municipal Bonds | | Par
(000) | | | Value | |
| | | | | | | | |
New York (concluded) | | | | | | | | |
State (concluded) | | | | | | | | |
New York State Dormitory Authority, RB, Mental Health Services Facilities Improvement, Series A (AGM), 5.00%, 2/15/22 | | $ | 335 | | | $ | 388,486 | |
State of New York, GO, Series A, 5.00%, 2/15/39 | | | 250 | | | | 289,228 | |
| | | | | | | | |
| | | | | | | | 1,708,655 | |
Transportation — 12.3% | | | | | | | | |
Metropolitan Transportation Authority, RB: | | | | | | | | |
Series 2008C, 6.50%, 11/15/28 | | | 700 | | | | 897,071 | |
Series A, 5.63%, 11/15/39 | | | 250 | | | | 285,375 | |
Series D, 5.25%, 11/15/41 | | | 1,475 | | | | 1,666,647 | |
Series E, 5.00%, 11/15/42 | | | 245 | | | | 273,844 | |
New York Liberty Development Corp., RB, 1 World Trade Center Port Authority, Consolidated, Series 2011, 5.00%, 12/15/41 | | | 500 | | | | 556,915 | |
New York State Thruway Authority, RB, Series I: | | | | | | | | |
5.00%, 1/01/37 | | | 370 | | | | 417,304 | |
4.13%, 1/01/42 | | | 550 | | | | 564,784 | |
5.00%, 1/01/42 | | | 140 | | | | 157,184 | |
Port Authority of New York & New Jersey, RB, JFK International Air Terminal, 6.00%, 12/01/42 | | | 500 | | | | 579,545 | |
Triborough Bridge & Tunnel Authority, Refunding RB, Series B: | | | | | | | | |
5.00%, 11/15/31 | | | 80 | | | | 95,291 | |
4.00%, 11/15/32 | | | 150 | | | | 161,049 | |
| | | | | | | | |
| | | | | | | | 5,655,009 | |
Utilities — 4.9% | | | | | | | | |
Long Island Power Authority, RB: | | | | | | | | |
Series A (AGM), 5.00%, 5/01/36 | | | 250 | | | | 280,595 | |
Series C (CIFG), 5.25%, 9/01/29 | | | 500 | | | | 614,300 | |
Long Island Power Authority, Refunding RB, Series A, 5.50%, 4/01/24 | | | 250 | | | | 301,150 | |
New York City Municipal Water Finance Authority, Refunding RB, Second General Resolution,
Series EE, 4.00%, 6/15/45 | | | 380 | | | | 388,645 | |
New York State Power Authority, Refunding RB, Series A, 5.00%, 11/15/38 | | | 600 | | | | 693,786 | |
| | | | | | | | |
| | | | | | | | 2,278,476 | |
Total Municipal Bonds in New York | | | | 54,096,874 | |
| | | | | | | | |
Multi-State — 6.0% | | | | | | | | |
Housing — 6.0% | |
Centerline Equity Issuer Trust, 7.20%, 11/15/52 (g)(h) | | | 2,500 | | | | 2,767,100 | |
| | | | | | | | |
Puerto Rico — 8.3% | | | | | | | | |
State — 8.3% | | | | | | | | |
Commonwealth of Puerto Rico, GO, Public Improvement, Series A, 5.13%, 7/01/31 | | | 1,725 | | | | 1,725,000 | |
Puerto Rico Commonwealth Infrastructure Financing Authority, RB, CAB, Series A (AMBAC) (d): | | | | | | | | |
6.12%, 7/01/37 | | | 2,000 | | | | 447,380 | |
6.21%, 7/01/44 | | | 2,000 | | | | 285,120 | |
Puerto Rico Sales Tax Financing Corp., RB,
Sub-Series A, 5.75%, 8/01/37 | | | 1,000 | | | | 1,115,020 | |
Puerto Rico Sales Tax Financing Corp., Refunding RB, CAB, Series A (NPFGC), 5.57%, 8/01/41 (d) | | | 1,400 | | | | 285,642 | |
Total Municipal Bonds in Puerto Rico | | | | 3,858,162 | |
Total Municipal Bonds — 131.5% | | | | 60,722,136 | |
See Notes to Financial Statements.
| | | | | | |
| | | | | | | |
| | ANNUAL REPORT | | AUGUST 31, 2012 | | 27 |
| | |
| Schedule of Investments (continued) | | BlackRock New York Municipal Bond Trust (BQH) (Percentages shown are based on Net Assets) |
| | | | | | | | |
Municipal Bonds Transferred to
Tender Option Bond Trusts (i) | | Par
(000) | | | Value | |
| | | | | | | | |
New York — 25.8% | | | | | | | | |
County/City/Special District/School District — 10.2% | |
New York City Transitional Finance Authority, RB, Future Tax Secured, Sub-Series D-1,
5.00%, 11/01/38 | | $ | 825 | | | $ | 944,955 | |
New York Liberty Development Corp., Refunding RB, 7 World Trade Center Project, Series 2012, Class 1: | | | | | | | | |
4.00%, 9/15/35 | | | 2,490 | | | | 2,573,838 | |
5.00%, 9/15/40 | | | 1,050 | | | | 1,194,123 | |
| | | | | | | | |
| | | | | | | | 4,712,916 | |
State — 1.2% | | | | | | | | |
New York City Transitional Finance Authority, RB,
Fiscal 2009, Series S-3, 5.25%, 1/15/39 | | | 500 | | | | 562,822 | |
Transportation — 4.9% | | | | | | | | |
Hudson New York Yards Infrastructure Corp., RB,
Series A, 5.75%, 2/15/47 | | | 700 | | | | 821,044 | |
New York Liberty Development Corp., RB, 1 World Trade Center Port Authority Construction,
5.25%, 12/15/43 | | | 630 | | | | 721,596 | |
New York State Thruway Authority, Refunding RB, Transportation, Series A, 5.00%, 3/15/31 (c) | | | 600 | | | | 705,810 | |
| | | | | | | | |
| | | | | | | | 2,248,450 | |
Utilities — 9.5% | | | | | | | | |
New York City Municipal Water Finance Authority, RB, Fiscal 2009, Series A, 5.75%, 6/15/40 | | | 405 | | | | 487,907 | |
New York City Municipal Water Finance Authority, Refunding RB, Second General Resolution: | | | | | | | | |
Fiscal 2011, Series HH, 5.00%, 6/15/32 | | | 990 | | | | 1,154,410 | |
Fiscal 2012, Series BB, 5.00%, 6/15/44 | | | 1,500 | | | | 1,705,594 | |
Suffolk County Water Authority, Refunding RB,
3.00%, 6/01/25 | | | 1,006 | | | | 1,037,586 | |
| | | | | | | | |
| | | | | | | | 4,385,497 | |
Total Municipal Bonds in New York | | | | 11,909,685 | |
| | | | | | | | |
Puerto Rico — 1.3% | | | | | | | | |
State — 1.3% | | | | | | | | |
Puerto Rico Sales Tax Financing Corp., Refunding RB, Sales Tax, Series C, 5.25%, 8/01/40 | | | 520 | | | | 578,232 | |
Total Municipal Bonds Transferred to
Tender Option Bond Trusts — 27.1% | | | | | | | 12,487,917 | |
Total Long-Term Investments
(Cost — $67,687,250) — 158.6% | | | | | | | 73,210,053 | |
| | | | | | | | |
|
| |
| | |
| Short-Term Securities | | Shares | | | | |
BIF New York Municipal Money Fund, 0.00% (j)(k) | | | 3,245,381 | | | | 3,245,381 | |
Total Short-Term Securities
(Cost — $3,245,381) — 7.0% | | | | 3,245,381 | |
| Total Investments (Cost — $70,932,631) — 165.6% | | | | 76,455,434 | |
| Liabilities in Excess of Other Assets — (1.8)% | | | | (828,688 | ) |
Liability for TOB Trust Certificates, Including Interest
Expense and Fees Payable — (15.9)% | | | | (7,369,168 | ) |
| VRDP Shares, at Liquidation Value — (47.9)% | | | | (22,100,000 | ) |
| | | | | | | | |
| Net Assets Applicable to Common Shares — 100.0% | | | $ | 46,157,578 | |
| | | | | | | | |
| (a) | | Variable rate security. Rate shown is as of report date. |
| (b) | | Issuer filed for bankruptcy and/or is in default of principal and/or interest payments. |
| (c) | | When-issued security. Unsettled when-issued transactions were as follows: |
| | | | | | | | |
| Counterparty | | Value | | | Unrealized
Appreciation | |
| Bank of America Corp. | | $ | 200,876 | | | $ | 1,306 | |
| Deutsche Bank AG | | $ | 705,810 | | | $ | 8,732 | |
| Goldman Sachs Group, Inc. | | $ | 528,620 | | | $ | 3,437 | |
| Pershing LLC | | $ | 435,367 | | | $ | 916 | |
| (d) | | Represents a zero-coupon bond. Rate shown reflects the current yield as of report date. |
| (e) | | Non-income producing security. |
| (f) | | Represents a step-up bond that pays an initial coupon rate for the first period and then a higher coupon rate for the following periods. Rate shown is as of report date. |
| (g) | | Security represents a beneficial interest in a trust. The collateral deposited into the trust is federally tax-exempt revenue bonds issued by various state or local governments, or their respective agencies or authorities. The security is subject to remarketing prior to its stated maturity. |
| (h) | | Security exempt from registration pursuant to Rule 144A under the Securities Act of 1933, as amended. These securities may be resold in transactions exempt from registration to qualified institutional investors. |
| (i) | | Securities represent bonds transferred to a TOB in exchange for which the Trust acquired residual interest certificates. These securities serve as collateral in a financing transaction. See Note 1 of the Notes to Financial Statements for details of municipal bonds transferred to TOBs. |
| (j) | | Investments in issuers considered to be an affiliate of the Trust during the year ended August 31, 2012, for purposes of Section 2(a)(3) of the 1940 Act, were as follows: |
| | | | | | | | | | | | | | | | |
| Affiliate | | Shares
Held at
August 31,
2011 | | | Net
Activity | | | Shares
Held at
August 31,
2012 | | | Income | |
BIF New York Municipal Money Fund | | | 951,715 | | | | 2,293,666 | | | | 3,245,381 | | | $ | 7 | |
| (k) | | Represents the current yield as of report date. |
| Ÿ | | For Trust compliance purposes, the Trust’s sector classifications refer to any one or more of the sector sub-classifications used by one or more widely recognized market indexes or rating group indexes, and/or as defined by Trust’s management. These definitions may not apply for purposes of this report, which may combine such sector sub- classifications for reporting ease. |
| Ÿ | | Fair Value Measurements—Various inputs are used in determining the fair value of investments. These inputs to valuation techniques are categorized into a disclosure hierarchy consisting of three broad levels for financial statement purposes as follows: |
| Ÿ | | Level 1 — unadjusted price quotations in active markets/exchanges for identical assets and liabilities |
| Ÿ | | Level 2 — other observable inputs (including, but not limited to: quoted prices for similar assets or liabilities in markets that are active, quoted prices for identical or similar assets or liabilities in markets that are not active, inputs other than quoted prices that are observable for the assets or liabilities (such as interest rates, yield curves, volatilities, prepayment speeds, loss severities, credit risks and default rates) or other market-corroborated inputs) |
| Ÿ | | Level 3 — unobservable inputs based on the best information available in the circumstances, to the extent observable inputs are not available (including the Trust’s own assumptions used in determining the fair value of investments) |
Changes in valuation techniques may result in transfers into or out of an assigned level within the disclosure hierarchy. In accordance with the Trust’s policy, transfers between different levels of the fair value disclosure hierarchy are deemed to have occurred as of the beginning of the reporting period. The categorization of a value determined for investments is based on the pricing transparency of the investment and is not necessarily an indication of the risks associated with investing in those securities. For information about the Trust’s policy regarding valuation of investments and other significant accounting policies, please refer to Note 1 of the Notes to Financial Statements.
See Notes to Financial Statements.
| | | | | | |
| | | | | | | |
| 28 | | ANNUAL REPORT | | AUGUST 31, 2012 | | |
| | |
| Schedule of Investments (concluded) | | BlackRock New York Municipal Bond Trust (BQH) |
The following table summarizes the Trust’s investments categorized in the disclosure hierarchy as of August 31, 2012:
| | | | | | | | | | | | | | | | |
| | | Level 1 | | | Level 2 | | | Level 3 | | | Total | |
Assets: | | | | | | | | | | | | | | | | |
| Investments: | | | | | | | | | | | | | | | | |
Long-Term Investments1 | | | — | | | $ | 73,210,053 | | | | — | | | $ | 73,210,053 | |
Short-Term Securities | | $ | 3,245,381 | | | | — | | | | — | | | | 3,245,381 | |
| | | | | | | | | | | | | | | | |
Total | | $ | 3,245,381 | | | $ | 73,210,053 | | | | — | | | $ | 76,455,434 | |
| | | | | | | | | | | | | | | | |
| 1 | | See above Schedule of Investments for values in each sector. |
Certain of the Trust’s assets and liabilities are held at carrying amount, which approximates fair value for financial statement purposes. As of August 31, 2012, such assets and liabilities are categorized within the disclosure hierarchy as follows:
| | | | | | | | | | | | | | | | |
| | | Level 1 | | | Level 2 | | | Level 3 | | | Total | |
Assets: | | | | | | | | | | | | | | | | |
Cash | | $ | 22,875 | | | | — | | | | — | | | $ | 22,875 | |
Liabilities: | | | | | | | | | | | | | | | | |
TOB trust certificates | | | — | | | $ | (7,365,836 | ) | | | — | | | | (7,365,836 | ) |
VRDP Shares | | | — | | | | (22,100,000 | ) | | | — | | | | (22,100,000 | ) |
| | | | | | | | | | | | |
Total | | $ | 22,875 | | | $ | (29,465,836 | ) | | | — | | | $ | (29,442,961 | ) |
| | | | | | | | | | | | |
There were no transfers between levels during the year ended August 31, 2012.
See Notes to Financial Statements.
| | | | | | |
| | | | | | | |
| | ANNUAL REPORT | | AUGUST 31, 2012 | | 29 |
| | |
| Schedule of Investments August 31, 2012 | | BlackRock New York Municipal Income Quality Trust (BSE) (Percentages shown are based on Net Assets) |
| | | | | | | | |
| Municipal Bonds | | Par
(000) | | | Value | |
| | | | | | | | |
New York — 112.1% | | | | | | | | |
Corporate — 2.1% | |
New York City Industrial Development Agency, Refunding RB, Senior Series A, 5.00%, 7/01/28 (a) | | $ | 165 | | | $ | 174,445 | |
New York Liberty Development Corp., RB, Goldman Sachs Headquarters, 5.25%, 10/01/35 | | | 1,660 | | | | 1,929,451 | |
| | | | | | | | |
| | | | | | | | 2,103,896 | |
County/City/Special District/School District — 21.1% | |
City of New York New York, GO: | | | | | | | | |
5.00%, 4/01/28 | | | 1,000 | | | | 1,196,780 | |
Series A-1, 5.00%, 8/01/35 | | | 200 | | | | 228,564 | |
Erie County Industrial Development Agency, RB: | | | | | | | | |
5.25%, 5/01/31 | | | 200 | | | | 233,612 | |
City School District of Buffalo Project, Series A (AGM), 5.75%, 5/01/25 | | | 1,000 | | | | 1,172,980 | |
Hudson New York Yards Infrastructure Corp., RB: | | | | | | | | |
(AGC), 5.00%, 2/15/47 | | | 1,250 | | | | 1,328,300 | |
Series A, 5.00%, 2/15/47 | | | 1,000 | | | | 1,058,410 | |
Series A, 5.75%, 2/15/47 | | | 1,000 | | | | 1,173,020 | |
Series A (AGM), 5.00%, 2/15/47 | | | 750 | | | | 796,980 | |
Series A (NPFGC), 4.50%, 2/15/47 | | | 1,250 | | | | 1,289,150 | |
Monroe County Industrial Development Corp., Refunding RB, Series A, 5.00%, 7/01/31 | | | 500 | | | | 580,865 | |
New York City Industrial Development Agency, RB, PILOT: | | | | | | | | |
CAB, Yankee Stadium (AGC), 4.89%, 3/01/39 (b) | | | 1,000 | | | | 278,250 | |
Queens Baseball Stadium (AGC), 6.38%, 1/01/39 | | | 150 | | | | 176,507 | |
Yankee Stadium (NPFGC), 4.75%, 3/01/46 | | | 800 | | | | 816,640 | |
New York City Transitional Finance Authority, RB,
Series S-2 (AGM), 5.00%, 1/15/37 | | | 850 | | | | 914,447 | |
New York Convention Center Development Corp., RB, Hotel Unit Fee Secured (AMBAC): | | | | | | | | |
5.00%, 11/15/44 | | | 5,175 | | | | 5,412,998 | |
4.75%, 11/15/45 | | | 500 | | | | 514,030 | |
New York Liberty Development Corp., Refunding RB, 4 World Trade Center Project: | | | | | | | | |
5.00%, 11/15/31 | | | 1,000 | | | | 1,146,790 | |
5.75%, 11/15/51 | | | 670 | | | | 792,938 | |
New York State Dormitory Authority, Refunding RB, School Districts Financing Program, Series A (AGM), 5.00%, 10/01/35 | | | 1,000 | | | | 1,101,660 | |
Tompkins County Industrial Development Agency, RB, Civic Facility Cornell University, Series 2008A, 5.00%, 7/01/37 | | | 1,000 | | | | 1,137,910 | |
| | | | | | | | |
| | | | | | | | 21,350,831 | |
Education — 30.1% | |
City of Troy New York, Refunding RB, Rensselaer Polytechnic, Series A, 5.13%, 9/01/40 | | | 1,000 | | | | 1,105,190 | |
Herkimer County Industrial Development Agency New York, RB, College Foundation, Inc. Student Housing Project,
6.25%, 8/01/34 | | | 1,000 | | | | 1,012,090 | |
Madison County Industrial Development Agency New York, RB, Colgate University Project, Series A (AMBAC),
5.00%, 7/01/30 | | | 1,000 | | | | 1,070,210 | |
New York City Industrial Development Agency, RB, Lycee Francais de New York Project, Series A (ACA), 5.38%, 6/01/23 | | | 2,195 | | | | 2,219,408 | |
New York City Transitional Finance Authority, RB, Fiscal 2009, Series S-4 (AGC), 5.50%, 1/15/33 | | | 1,000 | | | | 1,169,890 | |
New York City Trust for Cultural Resources, Refunding RB, Museum of Modern Art, Series 1A, 5.00%, 4/01/31 | | | 700 | | | | 807,870 | |
New York State Dormitory Authority, LRB, State University Dormitory Facilities, Series A, 5.00%, 7/01/40 | | | 600 | | | | 670,758 | |
New York State Dormitory Authority, RB: | | | | | | | | |
Brooklyn Law School, Series B (Syncora), 5.13%, 7/01/13 (c) | | | 4,000 | | | | 4,159,120 | |
| | | | | | | | |
| Municipal Bonds | | Par
(000) | | | Value | |
| | | | | | | | |
New York (continued) | | | | | | | | |
Education (concluded) | |
New York State Dormitory Authority, RB (concluded): | | | | | | | | |
Convent of the Sacred Heart (AGM),
5.75%, 11/01/40 | | $ | 300 | | | $ | 355,491 | |
FIT Student Housing Corp. (NPFGC),
5.13%, 7/01/14 (c) | | | 2,500 | | | | 2,721,325 | |
Fordham University, Series A, 5.00%, 7/01/28 | | | 500 | | | | 578,335 | |
New York University, Series B, 5.00%, 7/01/37 | | | 500 | | | | 573,575 | |
New York University, Series C, 5.00%, 7/01/38 | | | 1,000 | | | | 1,101,200 | |
Saint Joachim & Anne Residence, 5.25%, 7/01/27 | | | 3,000 | | | | 3,001,050 | |
The New School (AGM), 5.50%, 7/01/43 | | | 350 | | | | 398,608 | |
New York State Dormitory Authority, Refunding RB: | | | | | | | | |
Cornell University, Series A, 5.00%, 7/01/40 | | | 250 | | | | 283,918 | |
Mount Sinai School of Medicine at NYU (NPFGC),
5.00%, 7/01/35 | | | 2,400 | | | | 2,556,504 | |
New York University, Series A, 5.00%, 7/01/37 | | | 745 | | | | 854,627 | |
Rochester Institute of Technology, 5.00%, 7/01/40 | | | 550 | | | | 612,045 | |
Rockefeller University, Series B, 4.00%, 7/01/38 | | | 830 | | | | 876,995 | |
Skidmore College, Series A, 5.00%, 7/01/27 | | | 135 | | | | 156,947 | |
Schenectady County Capital Resource Corp, Refunding RB, 5.00%, 7/01/32 | | | 940 | | | | 1,096,416 | |
Tompkins County Development Corp., RB, Ithaca College Project (AGM), 5.50%, 7/01/33 | | | 250 | | | | 291,757 | |
Trust for Cultural Resources, Refunding RB, American Museum of Natural History, Series A (NPFGC),
5.00%, 7/01/44 | | | 2,500 | | | | 2,665,825 | |
| | | | | | | | |
| | | | | | | | 30,339,154 | |
Health — 17.4% | |
Dutchess County Industrial Development Agency, RB, Vassar Brothers Medical Center (AGC), 5.50%, 4/01/30 | | | 500 | | | | 567,600 | |
Monroe County Industrial Development Corp., Refunding RB, Unity Hospital of Rochester Project (FHA), 5.50%, 8/15/40 | | | 325 | | | | 374,784 | |
New York State Dormitory Authority, MRB: | | | | | | | | |
Hospital, Lutheran Medical (NPFGC), 5.00%, 2/01/13 (c) | | | 4,000 | | | | 4,078,040 | |
St. Barnabas, Series A (FHA), 5.00%, 2/01/31 | | | 3,000 | | | | 3,009,240 | |
New York State Dormitory Authority, RB: | | | | | | | | |
Hudson Valley Hospital (BHAC), 5.00%, 8/15/36 | | | 1,250 | | | | 1,355,912 | |
North Shore-Long Island Jewish Health System, Series A, 5.50%, 5/01/37 | | | 350 | | | | 397,744 | |
North Shore-Long Island Jewish Health System, Series C, 4.25%, 5/01/39 | | | 310 | | | | 315,152 | |
North Shore-Long Island Jewish Health System, Series D, 4.25%, 5/01/39 | | | 405 | | | | 410,759 | |
North Shore-Long Island Jewish Health System, Series D, 5.00%, 5/01/39 | | | 160 | | | | 174,997 | |
NYU Hospital Center, Series A, 6.00%, 7/01/40 | | | 250 | | | | 293,420 | |
New York State Dormitory Authority, Refunding RB: | | | | | | | | |
5.00%, 7/01/31 | | | 525 | | | | 612,848 | |
North Shore-Long Island Jewish Health System, Series A, 5.00%, 5/01/32 | | | 750 | | | | 839,393 | |
North Shore-Long Island Jewish Health System, Series A, 5.25%, 5/01/34 | | | 1,840 | | | | 2,096,551 | |
NYU Hospital Center, Series A, 5.00%, 7/01/36 | | | 500 | | | | 529,635 | |
St. Luke’s Roosevelt Hospital (FHA), 4.90%, 8/15/31 | | | 500 | | | | 529,110 | |
Winthrop University Hospital Association, Series A
(AMBAC), 5.25%, 7/01/31 | | | 2,000 | | | | 2,002,060 | |
| | | | | | | | |
| | | | | | | | 17,587,245 | |
State — 9.6% | |
New York State Dormitory Authority, ERB: | | | | | | | | |
Series B, 5.75%, 3/15/36 | | | 600 | | | | 730,008 | |
Series C, 5.00%, 12/15/31 | | | 1,500 | | | | 1,711,350 | |
See Notes to Financial Statements.
| | | | | | |
| | | | | | | |
| 30 | | ANNUAL REPORT | | AUGUST 31, 2012 | | |
| | |
| Schedule of Investments (continued) | | BlackRock New York Municipal Income Quality Trust (BSE) (Percentages shown are based on Net Assets) |
| | | | | | | | |
| Municipal Bonds | | Par
(000) | | | Value | |
| | | | | | | | |
New York (concluded) | | | | | | | | |
State (concluded) | |
New York State Dormitory Authority, RB: | | | | | | | | |
Mental Health Services Facilities Improvement, Series A (AGM), 5.00%, 2/15/22 | | $ | 1,000 | | | $ | 1,159,660 | |
School Districts Financing Program, Series D (NPFGC), 5.00%, 10/01/30 | | | 3,000 | | | | 3,010,530 | |
New York State Dormitory Authority, Refunding RB, Third General Resolution, State University Educational Facilities Issue, 5.00%, 5/15/30 | | | 1,500 | | | | 1,763,355 | |
New York State Urban Development Corp., RB, State Personal Income Tax, Series A, 3.50%, 3/15/28 | | | 1,250 | | | | 1,311,187 | |
| | | | | | | | |
| | | | | | | | 9,686,090 | |
Transportation — 21.2% | |
Metropolitan Transportation Authority, RB: | | | | | | | | |
Series 2008C, 6.50%, 11/15/28 | | | 750 | | | | 961,147 | |
Series A, 5.00%, 11/15/27 | | | 575 | | | | 671,416 | |
Series D, 5.25%, 11/15/41 | | | 1,750 | | | | 1,977,377 | |
Series E, 5.00%, 11/15/42 | | | 105 | | | | 117,362 | |
Metropolitan Transportation Authority, Refunding RB: | | | | | | | | |
Series A (AGM), 5.00%, 11/15/12 (c) | | | 3,000 | | | | 3,023,640 | |
Series B, 5.00%, 11/15/34 | | | 540 | | | | 609,865 | |
New York State Thruway Authority, RB, Series I: | | | | | | | | |
5.00%, 1/01/37 | | | 735 | | | | 828,970 | |
4.13%, 1/01/42 | | | 435 | | | | 446,693 | |
5.00%, 1/01/42 | | | 425 | | | | 477,164 | |
New York State Thruway Authority, Refunding RB, Series H (AGM), 5.00%, 1/01/37 | | | 4,000 | | | | 4,340,080 | |
Triborough Bridge & Tunnel Authority, Refunding RB: | | | | | | | | |
(NPFGC), 5.00%, 11/15/32 | | | 6,400 | | | | 6,449,728 | |
Series B, 5.00%, 11/15/31 | | | 90 | | | | 107,203 | |
Series B, 4.00%, 11/15/32 | | | 180 | | | | 193,259 | |
Series C, 5.00%, 11/15/38 | | | 1,000 | | | | 1,150,710 | |
| | | | | | | | |
| | | | | | | | 21,354,614 | |
Utilities — 10.6% | |
Albany Municipal Water Finance Authority, Refunding RB, Series A, 5.00%, 12/01/33 | | | 1,000 | | | | 1,152,600 | |
Long Island Power Authority, RB: | | | | | | | | |
General, Series A (AGM), 5.00%, 5/01/36 | | | 500 | | | | 561,190 | |
General, Series C (CIFG), 5.25%, 9/01/29 | | | 1,000 | | | | 1,228,600 | |
Long Island Power Authority, Refunding RB (AGC): | | | | | | | | |
General, Series A, 6.00%, 5/01/33 | | | 2,000 | | | | 2,405,540 | |
Series A, 5.75%, 4/01/39 | | | 1,690 | | | | 2,019,651 | |
New York City Municipal Water Finance Authority, Refunding RB: | | | | | | | | |
Series DD, 5.00%, 6/15/32 | | | 1,100 | | | | 1,262,393 | |
Series FF, 4.00%, 6/15/45 | | | 400 | | | | 409,100 | |
Series FF, 5.00%, 6/15/45 | | | 440 | | | | 502,907 | |
New York State Power Authority, Refunding RB, Series A, 5.00%, 11/15/38 | | | 1,000 | | | | 1,156,310 | |
| | | | | | | | |
| | | | | | | | 10,698,291 | |
| Total Municipal Bonds in New York | | | | 113,120,121 | |
| | | | | | | | |
Puerto Rico — 10.0% | | | | | | | | |
State — 4.0% | |
Commonwealth of Puerto Rico, GO, Refunding, Sub-Series C-7 (NPFGC), 6.00%, 7/01/27 | | | 1,000 | | | | 1,126,330 | |
Puerto Rico Public Buildings Authority, Refunding RB, Government Facilities, Series M-3 (NPFGC),
6.00%, 7/01/28 | | | 500 | | | | 563,725 | |
Puerto Rico Sales Tax Financing Corp., RB, First Sub-Series A: | | | | | | | | |
5.75%, 8/01/37 | | | 1,000 | | | | 1,115,020 | |
(AGM), 5.00%, 8/01/40 | | | 500 | | | | 539,790 | |
| | | | | | | | |
| Municipal Bonds | | Par
(000) | | | Value | |
| | | | | | | | |
Puerto Rico (concluded) | | | | | | | | |
State (concluded) | |
Puerto Rico Sales Tax Financing Corp., Refunding RB, CAB, Series A (NPFGC) (b): | | | | | | | | |
5.57%, 8/01/41 | | $ | 1,500 | | | $ | 306,045 | |
5.59%, 8/01/43 | | | 2,000 | | | | 363,820 | |
| | | | | | | | |
| | | | | | | | 4,014,730 | |
Transportation — 3.6% | |
Puerto Rico Highway & Transportation Authority, RB, Series Y (AGM), 6.25%, 7/01/21 | | | 2,000 | | | | 2,398,180 | |
Puerto Rico Highway & Transportation Authority, Refunding RB, Series CC (AGM), 5.50%, 7/01/29 | | | 1,000 | | | | 1,216,920 | |
| | | | | | | | |
| | | | | | | | 3,615,100 | |
Utilities — 2.4% | |
Puerto Rico Electric Power Authority, Refunding RB, Series VV (NPFGC): | | | | | | | | |
5.25%, 7/01/29 | | | 250 | | | | 272,570 | |
5.25%, 7/01/30 | | | 2,000 | | | | 2,149,280 | |
| | | | | | | | |
| | | | | | | | 2,421,850 | |
| Total Municipal Bonds in Puerto Rico | | | | 10,051,680 | |
Total Municipal Bonds — 122.1% | | | | 123,171,801 | |
|
| |
| | |
Municipal Bonds Transferred to
Tender Option Bond Trusts (d) | | | | | | |
New York — 35.9% | | | | | | | | |
County/City/Special District/School District — 15.9% | |
City of New York New York, GO, Sub-Series C-3 (AGC), 5.75%, 8/15/28 | | | 1,000 | | | | 1,240,400 | |
New York City Transitional Finance Authority, RB, Future Tax Secured, Sub-Series D-1, 5.00%, 11/01/38 | | | 2,475 | | | | 2,834,865 | |
New York Liberty Development Corp., Refunding RB,
7 World Trade Center Project: | | | | | | | | |
4.00%, 9/15/35 | | | 3,000 | | | | 3,101,010 | |
5.00%, 9/15/40 | | | 2,085 | | | | 2,371,187 | |
Sales Tax Asset Receivable Corp., Refunding RB, Series A (AMBAC), 5.00%, 10/15/32 | | | 5,997 | | | | 6,502,840 | |
| | | | | | | | |
| | | | | | | | 16,050,302 | |
Education — 5.0% | |
New York State Dormitory Authority, LRB, State University Dormitory Facilities, Series A, 5.00%, 7/01/35 | | | 1,999 | | | | 2,298,931 | |
New York State Dormitory Authority, RB, New York University, Series A (AMBAC), 5.00%, 7/01/37 | | | 2,499 | | | | 2,712,709 | |
| | | | | | | | |
| | | | | | | | 5,011,640 | |
Transportation — 7.0% | |
Hudson New York Yards Infrastructure Corp., RB, Series A, 5.75%, 2/15/47 | | | 1,800 | | | | 2,111,257 | |
New York Liberty Development Corp., RB, 1 World Trade Center Port Authority, 5.25%, 12/15/43 | | | 3,495 | | | | 4,003,138 | |
New York State Thruway Authority, Refunding RB, Transportation, Series A, 5.00%, 3/15/31 (c) | | | 800 | | | | 941,080 | |
| | | | | | | | |
| | | | | | | | 7,055,475 | |
Utilities — 8.0% | |
New York City Municipal Water Finance Authority, RB, Fiscal 2009, Series A, 5.75%, 6/15/40 | | | 495 | | | | 596,331 | |
New York City Municipal Water Finance Authority, Refunding RB: | | | | | | | | |
Second General Resolution, Fiscal 2012, Series BB, 5.00%, 6/15/44 | | | 2,011 | | | | 2,285,496 | |
See Notes to Financial Statements.
| | | | | | |
| | | | | | | |
| | ANNUAL REPORT | | AUGUST 31, 2012 | | 31 |
| | |
| Schedule of Investments (concluded) | | BlackRock New York Municipal Income Quality Trust (BSE) (Percentages shown are based on Net Assets) |
| | | | | | | | |
Municipal Bonds Transferred to
Tender Option Bond Trusts (d) | | Par
(000) | | | Value | |
| | | | | | | | |
New York (concluded) | | | | | | | | |
Utilities (concluded) | |
New York City Municipal Water Finance Authority, Refunding RB (concluded): | | | | | | | | |
Second General Resolution, Series HH, 5.00%, 6/15/32 | | $ | 2,249 | | | $ | 2,622,259 | |
Series FF-2, 5.50%, 6/15/40 | | | 405 | | | | 475,604 | |
Suffolk County Water Authority, Refunding RB, New York Water System, 3.00%, 6/01/25 | | | 2,041 | | | | 2,106,145 | |
| | | | | | | | |
| | | | | | | | 8,085,835 | |
| Total Municipal Bonds in New York | | | | 36,203,252 | |
| | | | | | | | |
Puerto Rico — 1.1% | | | | | | | | |
State — 1.1% | |
Puerto Rico Sales Tax Financing Corp., Refunding RB, Series C, 5.25%, 8/01/40 | | | 1,010 | | | | 1,123,105 | |
Total Municipal Bonds Transferred to Tender Option Bond Trusts — 37.0% | | | | 37,326,357 | |
Total Long-Term Investments (Cost — $148,513,954) — 159.1% | | | | 160,498,158 | |
|
| |
| | |
| Short-Term Securities | | | | | | |
New York — 0.1% | | | | | | | | |
City of New York New York, GO, Refunding, VRDN, Sub-Series H-3 (AGM Insurance, State Street Bank & Co. SBPA), 0.17%, 9/04/12 (e) | | | 50 | | | | 50,000 | |
| | | | | | | | |
| | |
| | |
Shares | | | | |
Money Market Fund — 1.0% | | | | | | | | |
BIF New York Municipal Money Fund, 0.00% (f)(g) | | | 1,020,744 | | | | 1,020,744 | |
Total Short-Term Securities
(Cost — $1,070,744) — 1.1% | | | | 1,070,744 | |
| Total Investments (Cost — $149,584,698) — 160.2% | | | | 161,568,902 | |
| Other Assets Less Liabilities — 0.7% | | | | 727,319 | |
Liability for TOB Trust Certificates, Including Interest
Expense and Fees Payable — (20.7)% | | | | (20,930,990 | ) |
| VRDP Shares, at Liquidation Value — (40.2)% | | | | (40,500,000 | ) |
| | | | | | | | |
| Net Assets Applicable to Common Shares — 100.0% | | | $ | 100,865,231 | |
| | | | | | | | |
| | | | | | | | | |
| (a) | | When-issued security. Unsettled when-issued transactions were as follows: |
| | | | | | | | |
| Counterparty | | Value | | | Unrealized
Appreciation | |
| Goldman Sachs Group, Inc. | | $ | 174,445 | | | $ | 2,977 | |
| (b) | | Represents a zero-coupon bond. Rate shown reflects the current yield as of report date. |
| (c) | | US government securities, held in escrow, are used to pay interest on this security, as well as to retire the bond in full at the date indicated, typically at a premium to par. |
| (d) | | Securities represent bonds transferred to a TOB in exchange for which the Trust’s acquired residual interest certificates. These securities serve as collateral in a financing transaction. See Note 1 of the Notes to Financial Statements for details of municipal bonds transferred to TOBs. |
| (e) | | Variable rate security. Rate shown is as of report date and maturity shown is the date the principal owed can be recovered through demand. |
| (f) | | Investments in issuers considered to be an affiliate of the Trust during the year ended August 31, 2012, for purposes of Section 2(a)(3) of the 1940 Act, were as follows: |
| | | | | | | | | | | | | | | | |
| Affiliate | | Shares
Held at
August 31,
2011 | | | Net
Activity | | | Shares
Held at
August 31,
2012 | | | Income | |
BIF New York Municipal Money Fund | | | 3,251,673 | | | | (2,230,929 | ) | | | 1,020,744 | | | $ | 12 | |
| (g) | | Represents the current yield as of report date. |
| Ÿ | | For Trust compliance purposes, the Trust’s sector classifications refer to any one or more of the sector sub-classifications used by one or more widely recognized market indexes or rating group indexes, and/or as defined by Trust’s management. These definitions may not apply for purposes of this report, which may combine such sector sub- classifications for reporting ease. |
| Ÿ | | Fair Value Measurements—Various inputs are used in determining the fair value of investments. These inputs to valuation techniques are categorized into a disclosure hierarchy consisting of three broad levels for financial statement purposes as follows: |
| Ÿ | | Level 1 — unadjusted price quotations in active markets/exchanges for identical assets and liabilities |
| Ÿ | | Level 2 — other observable inputs (including, but not limited to: quoted prices for similar assets or liabilities in markets that are active, quoted prices for identical or similar assets or liabilities in markets that are not active, inputs other than quoted prices that are observable for the assets or liabilities (such as interest rates, yield curves, volatilities, prepayment speeds, loss severities, credit risks and default rates) or other market-corroborated inputs) |
| Ÿ | | Level 3 — unobservable inputs based on the best information available in the circumstances, to the extent observable inputs are not available (including the Trust’s own assumptions used in determining the fair value of investments) |
Changes in valuation techniques may result in transfers into or out of an assigned level within the disclosure hierarchy. In accordance with the Trust’s policy, transfers between different levels of the fair value disclosure hierarchy are deemed to have occurred as of the beginning of the reporting period. The categorization of a value determined for investments is based on the pricing transparency of the investment and is not necessarily an indication of the risks associated with investing in those securities. For information about the Trust’s policy regarding valuation of investments and other significant accounting policies, please refer to Note 1 of the Notes to Financial Statements.
The following table summarizes the Trust’s investments categorized in the disclosure hierarchy as of August 31, 2012:
| | | | | | | | | | | | | | | | |
| | | Level 1 | | | Level 2 | | | Level 3 | | | Total | |
Assets: | | | | | | | | | | | | | | | | |
| Investments: | | | | | | | | | | | | | | | | |
Long-Term Investments1 | | | — | | | $ | 160,498,158 | | | | — | | | $ | 160,498,158 | |
Short-Term Securities | | $ | 1,020,744 | | | | 50,000 | | | | — | | | | 1,070,744 | |
| | | | | | | | | | | | | | | | |
Total | | $ | 1,020,744 | | | $ | 160,548,158 | | | | — | | | $ | 161,568,902 | |
| | | | | | | | | | | | | | | | |
| 1 | | See above Schedule of Investments for values in each sector. |
Certain of the Trust’s liabilities are held at carrying amount, which approximates fair value for financial statement purposes. As of August 31, 2012, such liabilities are categorized within the disclosure hierarchy as follows:
| | | | | | | | | | | | | | | | |
| | | Level 1 | | | Level 2 | | | Level 3 | | | Total | |
Liabilities: | | | | | | | | | | | | | | | | |
TOB trust certificates | | | — | | | $ | (20,920,361 | ) | | | — | | | $ | (20,920,361 | ) |
VRDP Shares | | | — | | | | (40,500,000 | ) | | | — | | | | (40,500,000 | ) |
| | | | |
Total | | | — | | | $ | (61,420,361 | ) | | | — | | | $ | (61,420,361 | ) |
| | | | |
There were no transfers between levels during the year ended August 31, 2012.
See Notes to Financial Statements.
| | | | | | |
| | | | | | | |
| 32 | | ANNUAL REPORT | | AUGUST 31, 2012 | | |
| | |
| Schedule of Investments August 31, 2012 | | BlackRock New York Municipal Income Trust II (BFY) (Percentages shown are based on Net Assets) |
| | | | | | | | |
| Municipal Bonds | | Par
(000) | | | Value | |
| | | | | | | | |
New York — 133.6% | | | | | | | | |
Corporate — 16.1% | |
Chautauqua County Industrial Development Agency, RB, NRG Dunkirk Power Project, 5.88%, 4/01/42 | | $ | 500 | | | $ | 561,646 | |
Essex County Industrial Development Agency New York, RB, International Paper Co. Project, Series A, AMT, 6.63%, 9/01/32 | | | 200 | | | | 222,464 | |
Essex County Industrial Development Agency New York, Refunding RB, International Paper Co. Project,
Series A, AMT, 5.50%, 10/01/26 | | | 625 | | | | 626,844 | |
Jefferson County Industrial Development Agency New York, Refunding RB, Solid Waste, Series A, AMT,
5.20%, 12/01/20 | | | 750 | | | | 780,315 | |
New York City Industrial Development Agency, RB, American Airlines Inc., JFK International Airport, AMT (a)(b): | | | | | | | | |
7.63%, 8/01/25 | | | 1,600 | | | | 1,680,352 | |
7.75%, 8/01/31 | | | 1,500 | | | | 1,575,375 | |
New York City Industrial Development Agency, Refunding RB, Series A, 5.00%, 7/01/28 (c) | | | 330 | | | | 348,889 | |
New York Liberty Development Corp., RB, Goldman Sachs Headquarters, 5.25%, 10/01/35 | | | 1,780 | | | | 2,068,930 | |
Port Authority of New York & New Jersey, RB, Continental Airlines Inc. and Eastern Air Lines Inc. Project, LaGuardia, AMT, 9.13%, 12/01/15 | | | 2,400 | | | | 2,460,240 | |
Suffolk County Industrial Development Agency
New York, RB, KeySpan, Port Jefferson, AMT,
5.25%, 6/01/27 | | | 2,500 | | | | 2,570,350 | |
| | | | | | | | |
| | | | | | | | 12,895,405 | |
County/City/Special District/School District — 42.0% | |
Amherst Development Corp., Refunding RB, University at Buffalo Foundation Faculty-Student Housing Corp., Series A (AGM): | | | | | | | | |
4.38%, 10/01/30 | | | 500 | | | | 537,850 | |
4.63%, 10/01/40 | | | 275 | | | | 296,208 | |
Buffalo & Erie County Industrial Land Development Corp., Refunding RB, Buffalo State College Foundation Housing Corporation Project, 5.38%, 10/01/41 | | | 280 | | | | 320,636 | |
City of New York New York, GO: | | | | | | | | |
Series A-1, 4.75%, 8/15/25 | | | 500 | | | | 570,830 | |
Sub-Series G-1, 6.25%, 12/15/31 | | | 250 | | | | 310,998 | |
Sub-Series I-1, 5.38%, 4/01/36 | | | 450 | | | | 520,092 | |
City of Syracuse New York, GO, Airport Terminal Security and Access Improvement, Series A, AMT (AGM), 4.75%, 11/01/31 | | | 500 | | | | 542,905 | |
Hudson New York Yards Infrastructure Corp., RB, Series A: | | | | | | | | |
5.00%, 2/15/47 | | | 2,850 | | | | 3,016,468 | |
(AGM), 5.00%, 2/15/47 | | | 850 | | | | 903,244 | |
(AGM), 5.75%, 2/15/47 | | | 1,550 | | | | 1,818,181 | |
(NPFGC), 4.50%, 2/15/47 | | | 1,510 | | | | 1,557,293 | |
Monroe County Industrial Development Corp., Refunding RB, University of Rochester Project, Series A, 5.00%, 7/01/31 | | | 1,000 | | | | 1,161,730 | |
New York City Industrial Development Agency, RB, PILOT: | | | | | | | | |
CAB, Yankee Stadium (AGC),
4.61%, 3/01/35 (d) | | | 500 | | | | 179,195 | |
CAB, Yankee Stadium (AGC),
5.01%, 3/01/42 (d) | | | 1,750 | | | | 406,753 | |
CAB, Yankee Stadium (AGC),
5.16%, 3/01/45 (d) | | | 500 | | | | 95,595 | |
Queens Baseball Stadium (AMBAC),
5.00%, 1/01/39 | | | 500 | | | | 507,940 | |
Queens Baseball Stadium (AGC), 6.38%, 1/01/39 | | | 100 | | | | 117,671 | |
Yankee Stadium (NPFGC), 4.75%, 3/01/46 | | | 2,000 | | | | 2,041,600 | |
| | | | | | | | |
| Municipal Bonds | | Par
(000) | | | Value | |
| | | | | | | | |
New York (continued) | | | | | | | | |
County/City/Special District/School District (concluded) | |
New York City Transitional Finance Authority, RB: | | | | | | | | |
Building Aid Revenue, Series S-1, 4.00%, 7/15/42 | | $ | 1,775 | | | $ | 1,801,004 | |
Building Aid Revenue, Series S-2 (NPFGC), 4.50%, 1/15/31 | | | 2,500 | | | | 2,629,450 | |
Building Aid Revenue, Series S-2 (NPFGC), 4.25%, 1/15/34 | | | 250 | | | | 257,635 | |
Future Tax Secured, Series B, 5.00%, 11/01/12 (e) | | | 1,880 | | | | 1,894,852 | |
Future Tax Secured, Series B, 5.00%, 11/01/27 | | | 3,120 | | | | 3,143,369 | |
Future Tax Secured, Series D, 5.00%, 11/01/38 | | | 825 | | | | 944,955 | |
New York Convention Center Development Corp., RB, Hotel Unit Fee Secured (AMBAC): | | | | | | | | |
5.00%, 11/15/44 | | | 935 | | | | 978,001 | |
4.75%, 11/15/45 | | | 640 | | | | 657,958 | |
New York Liberty Development Corp., Refunding RB: | | | | | | | | |
4 World Trade Center Project, 5.00%, 11/15/31 | | | 1,000 | | | | 1,146,790 | |
4 World Trade Center Project, 5.75%, 11/15/51 | | | 670 | | | | 792,938 | |
7 World Trade Center Project, Class 2, 5.00%, 9/15/43 | | | 1,100 | | | | 1,202,938 | |
7 World Trade Center Project, Class 3, 5.00%, 3/15/44 | | | 690 | | | | 741,991 | |
Second Priority, Bank of America Tower at One Bryant Park Project, 5.63%, 7/15/47 | | | 1,400 | | | | 1,569,554 | |
Second Priority, Bank of America Tower at One Bryant Park Project, 6.38%, 7/15/49 | | | 500 | | | | 573,255 | |
New York State Dormitory Authority, RB, State University Dormitory Facilities, Series A, 5.00%, 7/01/39 | | | 250 | | | | 278,063 | |
St. Lawrence County Industrial Development Agency, RB, Clarkson University Project, 6.00%, 9/01/34 | | | 150 | | | | 180,926 | |
| | | | | | | | |
| | | | | | | | 33,698,868 | |
Education — 19.3% | |
Albany Industrial Development Agency, RB, New Covenant Charter School Project, Series A (b)(f): | | | | | | | | |
7.00%, 5/01/25 | | | 345 | | | | 77,615 | |
7.00%, 5/01/35 | | | 220 | | | | 49,493 | |
City of Troy New York, Refunding RB, Rensselaer Polytechnic, Series A, 5.13%, 9/01/40 | | | 250 | | | | 276,298 | |
Dutchess County Industrial Development Agency New York, Refunding RB, Bard College Civic Facility, Series A-2, 4.50%, 8/01/36 | | | 755 | | | | 769,987 | |
Geneva Industrial Development Agency New York, RB, Hobart & William Smith Project, Series A, 5.38%, 2/01/13 (e) | | | 2,000 | | | | 2,043,000 | |
Herkimer County Industrial Development Agency New York, RB, College Foundation Inc. Student Housing Project, 6.25%, 8/01/34 | | | 385 | | | | 389,655 | |
Nassau County Industrial Development Agency, Refunding RB, New York Institute of Technology Project, Series A, 4.75%, 3/01/26 | | | 350 | | | | 383,330 | |
New York City Industrial Development Agency, RB, Lycee Francais de New York Project, Series A (ACA),
5.38%, 6/01/23 | | | 1,250 | | | | 1,263,900 | |
New York City Trust for Cultural Resources, RB, Juilliard School, Series A, 5.00%, 1/01/39 | | | 500 | | | | 572,915 | |
New York City Trust for Cultural Resources, Refunding RB, Carnegie Hall, Series A, 4.75%, 12/01/39 | | | 700 | | | | 760,704 | |
New York State Dormitory Authority, RB: | | | | | | | | |
Brooklyn Law School, Series B (Syncora), 5.13%, 7/01/13 (e) | | | 2,000 | | | | 2,079,560 | |
Convent of the Sacred Heart (AGM), 5.75%, 11/01/40 | | | 500 | | | | 592,485 | |
Fordham University, Series A, 5.50%, 7/01/36 | | | 150 | | | | 174,476 | |
Rochester Institute of Technology, Series A, 6.00%, 7/01/33 | | | 625 | | | | 737,081 | |
See Notes to Financial Statements.
| | | | | | |
| | | | | | | |
| | ANNUAL REPORT | | AUGUST 31, 2012 | | 33 |
| | |
| Schedule of Investments (continued) | | BlackRock New York Municipal Income Trust II (BFY) (Percentages shown are based on Net Assets) |
| | | | | | | | |
| Municipal Bonds | | Par
(000) | | | Value | |
| | | | | | | | |
New York (continued) | | | | | | | | |
Education (concluded) | |
New York State Dormitory Authority, RB (concluded): | | | | | | | | |
Teachers College, Series B, 5.00%, 7/01/42 | | $ | 500 | | | $ | 565,925 | |
University of Rochester, Series A, 5.13%, 7/01/39 | | | 250 | | | | 280,622 | |
New York State Dormitory Authority, Refunding RB: | | | | | | | | |
Brooklyn Law School, 5.75%, 7/01/33 | | | 250 | | | | 287,350 | |
New York University, Series A, 5.00%, 7/01/37 | | | 600 | | | | 688,290 | |
Rockefeller University, Series B, 4.00%, 7/01/38 | | | 250 | | | | 264,155 | |
Saint John’s University,
Series A, 5.00%, 7/01/27 | | | 325 | | | | 383,932 | |
Skidmore College, Series A, 5.25%, 7/01/29 | | | 200 | | | | 234,514 | |
Skidmore College, Series A, 5.25%, 7/01/31 | | | 300 | | | | 349,242 | |
Teachers College, 5.50%, 3/01/39 | | | 650 | | | | 733,044 | |
Suffolk County Industrial Development Agency, Refunding RB, New York Institute of Technology Project, 5.00%, 3/01/26 | | | 410 | | | | 423,846 | |
Tompkins County Development Corp., RB, Ithaca College Project (AGM), 5.50%, 7/01/33 | | | 450 | | | | 525,163 | |
Yonkers Industrial Development Agency New York, RB, Sarah Lawrence College Project, Series A, 6.00%, 6/01/41 | | | 500 | | | | 563,965 | |
| | | | | | | | |
| | | | | | | | 15,470,547 | |
Health — 22.4% | |
Clarence Industrial Development Agency, RB, Bristol Village Project (Ginnie Mae), 6.00%, 1/20/44 | | | 1,630 | | | | 1,676,699 | |
Dutchess County Local Development Corp., Refunding RB, Health Quest System Inc., Series A, 5.75%, 7/01/40 | | | 300 | | | | 346,995 | |
Genesee County Industrial Development Agency New York, Refunding RB, United Memorial Medical Center Project,
5.00%, 12/01/27 | | | 250 | | | | 248,400 | |
Monroe County Industrial Development Corp., Refunding RB, Unity Hospital Rochester Project (FHA), 5.50%, 8/15/40 | | | 425 | | | | 490,102 | |
New York City Industrial Development Agency, RB, Eger Harbor Project, Series A (Ginnie Mae), 5.88%, 5/20/44 | | | 975 | | | | 1,028,186 | |
New York State Dormitory Authority, MRB, St. Barnabas, Series A (FHA), 5.00%, 2/01/31 | | | 1,000 | | | | 1,003,080 | |
New York State Dormitory Authority, RB: | | | | | | | | |
Healthcare, Series A, 5.00%, 3/15/38 | | | 500 | | | | 572,545 | |
Miriam Osborn Memorial Home,
5.00%, 7/01/29 (c) | | | 130 | | | | 140,686 | |
Miriam Osborn Memorial Home,
5.00%, 7/01/42 (c) | | | 255 | | | | 269,476 | |
New York Hospital Medical Center-Queens (FHA), 4.75%, 2/15/37 | | | 305 | | | | 316,389 | |
New York State Association for Retarded Children, Inc., Series A, 6.00%, 7/01/32 | | | 250 | | | | 295,338 | |
New York University Hospital Center, Series A, 5.75%, 7/01/31 | | | 425 | | | | 494,428 | |
New York University Hospital Center, Series B, 5.63%, 7/01/37 | | | 530 | | | | 577,933 | |
North Shore-Long Island Jewish Health System, Series A, 5.50%, 5/01/37 | | | 750 | | | | 852,307 | |
North Shore-Long Island Jewish Health System, Series C, 4.25%, 5/01/39 | | | 315 | | | | 320,235 | |
North Shore-Long Island Jewish Health System, Series D, 4.25%, 5/01/39 | | | 405 | | | | 410,759 | |
North Shore-Long Island Jewish Health System, Series D, 5.00%, 5/01/39 | | | 160 | | | | 174,997 | |
New York State Dormitory Authority, Refunding RB: | | | | | | | | |
Kateri Residence, 5.00%, 7/01/22 | | | 2,000 | | | | 2,015,720 | |
Mount Sinai Hospital, Series A, 5.00%, 7/01/26 | | | 500 | | | | 561,165 | |
New York University Hospital Center, Series A, 5.00%, 7/01/36 | | | 1,000 | | | | 1,059,270 | |
| | | | | | | | |
| Municipal Bonds | | Par
(000) | | | Value | |
| | | | | | | | |
New York (continued) | | | | | | | | |
Health (concluded) | |
New York State Dormitory Authority, Refunding RB (concluded): | | | | | | | | |
North Shore-Long Island Jewish Health System, Series A, 5.00%, 5/01/32 | | $ | 1,000 | | | $ | 1,119,190 | |
North Shore-Long Island Jewish Health System, Series E, 5.50%, 5/01/33 | | | 500 | | | | 566,920 | |
Teachers College, Series A, 5.00%, 7/01/31 | | | 525 | | | | 612,848 | |
Saratoga County Industrial Development Agency New York, RB, Saratoga Hospital Project, Series B, 5.25%, 12/01/32 | | | 350 | | | | 370,682 | |
Suffolk County Industrial Development Agency New York, Refunding RB, Jeffersons Ferry Project, 5.00%, 11/01/28 | | | 450 | | | | 459,585 | |
Westchester County Healthcare Corp. New York, Refunding RB, Senior Lien: | | | | | | | | |
Remarketing, Series A, 5.00%, 11/01/30 | | | 1,000 | | | | 1,098,600 | |
Series B, 6.00%, 11/01/30 | | | 150 | | | | 177,953 | |
Westchester County Industrial Development Agency New York, RB, Kendal on Hudson Project, Series A, 6.38%, 1/01/24 | | | 750 | | | | 753,788 | |
| | | | | | | | |
| | | | | | | | 18,014,276 | |
Housing — 4.4% | |
New York City Housing Development Corp., RB, Series J-2-A, AMT, 4.75%, 11/01/27 | | | 1,420 | | | | 1,494,181 | |
New York State HFA, RB: | | | | | | | | |
Affordable Housing, Series B, 4.00%, 11/01/47 | | | 980 | | | | 980,999 | |
Highland Avenue Senior Apartments, Series A, AMT (SONYMA), 5.00%, 2/15/39 | | | 1,000 | | | | 1,032,180 | |
| | | | | | | | |
| | | | | | | | 3,507,360 | |
State — 5.7% | |
New York State Dormitory Authority, ERB: | | | | | | | | |
Series B, 5.75%, 3/15/36 | | | 300 | | | | 365,004 | |
Series C, 5.00%, 12/15/31 | | | 500 | | | | 570,450 | |
New York State Dormitory Authority, LRB, Municipal Health Facilities, Sub-Series 2-4, 4.75%, 1/15/30 | | | 800 | | | | 870,200 | |
New York State Urban Development Corp., RB, State Personal Income Tax, Series B, 5.00%, 3/15/35 | | | 2,000 | | | | 2,185,780 | |
State of New York, GO, Series A, 5.00%, 2/15/39 | | | 500 | | | | 578,455 | |
| | | | | | | | |
| | | | | | | | 4,569,889 | |
Transportation — 14.5% | |
Metropolitan Transportation Authority, RB: | | | | | | | | |
Series 2008C, 6.50%, 11/15/28 | | | 750 | | | | 961,147 | |
Series E, 5.00%, 11/15/42 | | | 510 | | | | 570,042 | |
Metropolitan Transportation Authority, Refunding RB, Series A, 5.00%, 11/15/30 | | | 5,000 | | | | 5,041,500 | |
New York Liberty Development Corp., RB, 1 World Trade Center Port Authority Construction: | | | | | | | | |
5.00%, 12/15/41 | | | 500 | | | | 556,915 | |
5.25%, 12/15/43 | | | 500 | | | | 572,695 | |
New York State Thruway Authority, RB, General: | | | | | | | | |
Series I, 4.13%, 1/01/42 | | | 340 | | | | 349,139 | |
Series I, 5.00%, 1/01/37 | | | 735 | | | | 828,970 | |
Series I, 5.00%, 1/01/42 | | | 280 | | | | 314,367 | |
Port Authority of New York & New Jersey, RB: | | | | | | | | |
JFK International Air Terminal, 6.00%, 12/01/42 | | | 1,000 | | | | 1,159,090 | |
Special Project, JFK International Air Terminal, Series 6, AMT (NPFGC), 6.25%, 12/01/13 | | | 1,000 | | | | 1,029,310 | |
Triborough Bridge & Tunnel Authority, Refunding RB, Series B: | | | | | | | | |
5.00%, 11/15/31 | | | 90 | | | | 107,203 | |
4.00%, 11/15/32 | | | 180 | | | | 193,259 | |
| | | | | | | | |
| | | | | | | | 11,683,637 | |
See Notes to Financial Statements.
| | | | | | |
| | | | | | | |
| 34 | | ANNUAL REPORT | | AUGUST 31, 2012 | | |
| | |
| Schedule of Investments (continued) | | BlackRock New York Municipal Income Trust II (BFY) (Percentages shown are based on Net Assets) |
| | | | | | | | |
| Municipal Bonds | | Par
(000) | | | Value | |
| | | | | | | | |
New York (concluded) | | | | | | | | |
Utilities — 9.2% | |
Long Island Power Authority, RB: | | | | | | | | |
CAB (AGM), 3.27%, 6/01/28 (d) | | $ | 3,515 | | | $ | 2,108,930 | |
General, Series A (AGM), 5.00%, 5/01/36 | | | 25 | | | | 28,060 | |
General, Series C (CIFG), 5.25%, 9/01/29 | | | 1,000 | | | | 1,228,600 | |
Long Island Power Authority, Refunding RB, Series A, 5.50%, 4/01/24 | | | 500 | | | | 602,300 | |
New York City Municipal Water Finance Authority, RB, Series B, 5.00%, 6/15/36 | | | 500 | | | | 560,620 | |
New York City Municipal Water Finance Authority, Refunding RB, Second General Resolution, Series EE, 4.00%, 6/15/45 | | | 770 | | | | 787,517 | |
New York State Environmental Facilities Corp., Refunding RB, Revolving Funds, New York City Municipal Water Project: | | | | | | | | |
5.00%, 6/15/36 | | | 350 | | | | 404,589 | |
Series A, 5.00%, 6/15/37 | | | 1,500 | | | | 1,670,925 | |
| | | | | | | | |
| | | | | | | | 7,391,541 | |
| Total Municipal Bonds in New York | | | | | | | 107,231,523 | |
| | | | | | | | |
Multi-State — 5.7% | | | | | | | | |
Housing — 5.7% | |
Centerline Equity Issuer Trust (g)(h): | | | | | | | | |
5.75%, 5/15/15 | | | 500 | | | | 547,070 | |
6.00%, 5/15/15 | | | 1,500 | | | | 1,649,880 | |
6.00%, 5/15/19 | | | 1,000 | | | | 1,183,760 | |
6.30%, 5/15/19 | | | 1,000 | | | | 1,199,850 | |
| Total Municipal Bonds in Multi-State | | | | | | | 4,580,560 | |
| | | | | | | | |
Puerto Rico — 7.6% | | | | | | | | |
Housing — 0.7% | |
Puerto Rico Housing Finance Authority, Refunding RB, Subordinate, Capital Fund Modernization, 5.13%, 12/01/27 | | | 500 | | | | 551,785 | |
State — 5.1% | |
Puerto Rico Sales Tax Financing Corp., RB: | | | | | | | | |
CAB, Series A, 5.39%, 8/01/32 (d) | | | 750 | | | | 260,228 | |
First Sub-Series A, 6.50%, 8/01/44 | | | 1,000 | | | | 1,192,320 | |
Puerto Rico Sales Tax Financing Corp., Refunding RB: | | | | | | | | |
CAB, Series A (AMBAC), 5.88%, 8/01/54 (d) | | | 5,000 | | | | 439,850 | |
CAB, Series A (NPFGC), 5.57%, 8/01/41 (d) | | | 1,500 | | | | 306,045 | |
CAB, Series A (NPFGC), 5.59%, 8/01/43 (d) | | | 4,000 | | | | 727,640 | |
Senior Series C, 5.25%, 8/01/40 | | | 1,015 | | | | 1,128,639 | |
| | | | | | | | |
| | | | | | | | 4,054,722 | |
Transportation — 1.1% | |
Puerto Rico Highway & Transportation Authority, Refunding RB, Series CC (AGM), 5.50%, 7/01/30 | | | 750 | | | | 914,017 | |
Utilities — 0.7% | |
Puerto Rico Electric Power Authority, Refunding RB, Series W (NPFGC), 5.25%, 7/01/29 | | | 500 | | | | 545,140 | |
| Total Municipal Bonds in Puerto Rico | | | | | | | 6,065,664 | |
| Total Municipal Bonds — 146.9% | | | | | | | 117,877,747 | |
| | | | | | | | |
Municipal Bonds Transferred to
Tender Option Bond Trusts (i) | | Par
(000) | | | Value | |
| | | | | | | | |
New York — 17.0% | | | | | | | | |
County/City/Special District/School District — 4.3% | |
New York Convention Center Development Corp., RB, Hotel Unit Fee Secured (AMBAC), 5.00%, 11/15/35 | | $ | 2,250 | | | $ | 2,356,965 | |
New York Liberty Development Corp., Refunding RB, 4 World Trade Center Project, 5.00%, 11/15/44 | | | 1,000 | | | | 1,105,520 | |
| | | | | | | | |
| | | | | | | | 3,462,485 | |
State — 1.8% | |
New York City Transitional Finance Authority, RB, Fiscal 2009, Series S-3, 5.25%, 1/15/39 | | | 1,300 | | | | 1,463,338 | |
Transportation — 4.3% | |
New York Liberty Development Corp., RB, 1 World Trade Center Port Authority Construction,
5.25%, 12/15/43 | | | 1,995 | | | | 2,285,053 | |
Port Authority of New York & New Jersey, RB, Consolidated, 169th Series, AMT, 5.00%, 10/15/26 | | | 1,000 | | | | 1,158,540 | |
| | | | | | | | |
| | | | | | | | 3,443,593 | |
Utilities — 6.6% | |
New York City Municipal Water Finance Authority, RB, Fiscal 2009, Series A, 5.75%, 6/15/40 | | | 240 | | | | 289,130 | |
New York City Municipal Water Finance Authority, Refunding RB: | | | | | | | | |
Second General Resolution, Fiscal 2011,
Series HH, 5.00%, 6/15/32 | | | 1,500 | | | | 1,749,105 | |
Second General Resolution, Fiscal 2012,
Series BB, 5.00%, 6/15/44 | | | 1,005 | | | | 1,142,748 | |
Suffolk County Water Authority, Refunding RB, New York Water System, 3.00%, 6/01/25 | | | 1,996 | | | | 2,059,686 | |
| | | | | | | | |
| | | | | | | | 5,240,669 | |
Total Municipal Bonds Transferred to Tender Option Bond Trusts — 17.0% | | | | | | | 13,610,085 | |
Total Long-Term Investments (Cost — $121,443,682) — 163.9% | | | | 131,487,832 | |
| | | | | | | | |
|
| |
| | |
| Short-Term Securities | | Shares | | | | |
BIF New York Municipal Money Fund, 0.00% (j)(k) | | | 459,702 | | | | 459,702 | |
Total Short-Term Securities (Cost — $459,702) — 0.6% | | | | 459,702 | |
| Total Investments (Cost — $121,903,384) — 164.5% | | | | 131,947,534 | |
| Other Assets Less Liabilities — 0.3% | | | | 275,152 | |
Liability for TOB Trust Certificates, Including Interest
Expense and Fees Payable — (9.5)% | | | | (7,594,960 | ) |
| VRDP Shares, at Liquidation Value — (55.3)% | | | | (44,400,000 | ) |
| | | | | | | | |
| Net Assets Applicable to Common Shares — 100.0% | | | $ | 80,227,726 | |
| | | | | | | | |
| | | | | | | | | |
| (a) | | Variable rate security. Rate shown is as of report date. |
| (b) | | Issuer filed for bankruptcy and/or is in default of principal and/or interest payments. |
| (c) | | When-issued security. Unsettled when-issued transactions were as follows: |
| | | | | | | | |
| Counterparty | | Value | | | Unrealized
Appreciation | |
| Goldman Sachs Group, Inc. | | $ | 348,889 | | | $ | 5,953 | |
| Pershing LLC | | $ | 410,162 | | | $ | 1,204 | |
| (d) | | Represents a zero-coupon bond. Rate shown reflects the current yield as of report date. |
| (e) | | US government securities, held in escrow, are used to pay interest on this security, as well as to retire the bond in full at the date indicated, typically at a premium to par. |
| (f) | | Non-income producing security. |
See Notes to Financial Statements.
| | | | | | |
| | | | | | | |
| | ANNUAL REPORT | | AUGUST 31, 2012 | | 35 |
| | |
| Schedule of Investments (concluded) | | BlackRock New York Municipal Income Trust II (BFY) |
| (g) | | Security represents a beneficial interest in a trust. The collateral deposited into the trust is federally tax-exempt revenue bonds issued by various state or local governments, or their respective agencies or authorities. The security is subject to remarketing prior to its stated maturity. |
| (h) | | Security exempt from registration pursuant to Rule 144A under the Securities Act of 1933, as amended. These securities may be resold in transactions exempt from registration to qualified institutional investors. |
| (i) | | Securities represent bonds transferred to a TOB in exchange for which the Trust acquired residual interest certificates. These securities serve as collateral in a financing transaction. See Note 1 of the Notes to Financial Statements for details of municipal bonds transferred to TOBs. |
| (j) | | Investments in issuers considered to be an affiliate of the Trust during the year ended August 31, 2012, for purposes of Section 2(a)(3) of the 1940 Act, were as follows: |
| | | | | | | | | | | | | | | | |
| Affiliate | | Shares
Held at
August 31,
2011 | | | Net
Activity | | | Shares
Held at
August 31,
2012 | | | Income | |
BIF New York Municipal Money Fund | | | 2,604,133 | | | | (2,144,431 | ) | | | 459,702 | | | $ | 30 | |
| (k) | | Represents the current yield as of report date. |
| Ÿ | | For Trust compliance purposes, the Trust’s sector classifications refer to any one or more of the sector sub-classifications used by one or more widely recognized market indexes or rating group indexes, and/or as defined by Trust’s management. These definitions may not apply for purposes of this report, which may combine such sector sub- classifications for reporting ease. |
| Ÿ | | Fair Value Measurements—Various inputs are used in determining the fair value of investments. These inputs to valuation techniques are categorized into a disclosure hierarchy consisting of three broad levels for financial statement purposes as follows: |
| Ÿ | | Level 1 — unadjusted price quotations in active markets/exchanges for identical assets and liabilities |
| Ÿ | | Level 2 — other observable inputs (including, but not limited to: quoted prices for similar assets or liabilities in markets that are active, quoted prices for identical or similar assets or liabilities in markets that are not active, inputs other than quoted prices that are observable for the assets or liabilities (such as interest rates, yield curves, volatilities, prepayment speeds, loss severities, credit risks and default rates) or other market-corroborated inputs) |
| Ÿ | | Level 3 — unobservable inputs based on the best information available in the circumstances, to the extent observable inputs are not available (including the Trust’s own assumptions used in determining the fair value of investments) |
Changes in valuation techniques may result in transfers into or out of an assigned level within the disclosure hierarchy. In accordance with the Trust’s policy, transfers between different levels of the fair value disclosure hierarchy are deemed to have occurred as of the beginning of the reporting period. The categorization of a value determined for investments is based on the pricing transparency of the investment and is not necessarily an indication of the risks associated with investing in those securities. For information about the Trust’s policy regarding valuation of investments and other significant accounting policies, please refer to Note 1 of the Notes to Financial Statements.
The following table summarizes the Trust’s investments categorized in the disclosure hierarchy as of August 31, 2012:
| | | | | | | | | | | | | | | | |
| | | Level 1 | | | Level 2 | | | Level 3 | | | Total | |
Assets: | | | | | | | | | | | | | | | | |
| Investments: | | | | | | | | | | | | | | | | |
Long-Term Investments1 | | | — | | | $ | 131,487,832 | | | | — | | | $ | 131,487,832 | |
Short-Term
Securities | | $ | 459,702 | | | | — | | | | — | | | | 459,702 | |
| | | | | | | | | | | | | | | | |
Total | | $ | 459,702 | | | $ | 131,487,832 | | | | — | | | $ | 131,947,534 | |
| | | | | | | | | | | | | | | | |
| 1 | | See above Schedule of Investments for values in each sector. |
Certain of the Trust’s assets and liabilities are held at carrying amount, which approximates fair value for financial statement purposes. As of August 31, 2012, such assets and liabilities are categorized within the disclosure hierarchy as follows:
| | | | | | | | | | | | | | | | |
| | | Level 1 | | | Level 2 | | | Level 3 | | | Total | |
Assets: | | | | | | | | | | | | | | | | |
Cash | | $ | 48,801 | | | | — | | | | — | | | $ | 48,801 | |
Liabilities: | | | | | | | | | | | | | | | | |
TOB trust certificates | | | — | | | $ | (7,591,259 | ) | | | — | | | | (7,591,259 | ) |
VRDP Shares. | | | — | | | | (44,400,000 | ) | | | — | | | | (44,400,000 | ) |
| | | | | | | | | | | | |
Total | | $ | 48,801 | | | $ | (51,991,259 | ) | | | — | | | $ | (51,942,458 | ) |
| | | | | | | | | | | | |
| There | | were no transfers between levels during the year ended August 31, 2012. |
See Notes to Financial Statements.
| | | | | | |
| | | | | | | |
| 36 | | ANNUAL REPORT | | AUGUST 31, 2012 | | |
| | |
| Schedule of Investments August 31, 2012 | | BlackRock Virginia Municipal Bond Trust (BHV) (Percentages shown are based on Net Assets) |
| | | | | | | | |
| Municipal Bonds | | Par
(000) | | | Value | |
| | | | | | | | |
Virginia — 108.6% | | | | | | | | |
Corporate — 11.1% | | | | | | | | |
Chesterfield County EDA, RB, Virginia Electric Power Co. Project, Series A, AMT, 5.60%, 11/01/31 | | $ | 500 | | | $ | 526,765 | |
Isle Wight County IDA Virginia, RB, Series A, AMT, 5.70%, 11/01/27 | | | 1,300 | | | | 1,356,537 | |
Louisa IDA, Refunding RB, Virginia Electric & Power Co. Project, Series A, Mandatory Put Bonds, 5.38%, 11/01/35 (a) | | | 1,000 | | | | 1,050,110 | |
| | | | | | | | |
| | | | | | | | 2,933,412 | |
County/City/Special District/School District — 13.5% | |
City of Portsmouth Virginia, GO, Refunding, Series D, 5.00%, 7/15/34 | | | 500 | | | | 574,550 | |
Dulles Town Center Community Development Authority, Special Assessment Bonds, Dulles Town Center Project, 6.25%, 3/01/26 | | | 880 | | | | 880,906 | |
Fairfax County Redevelopment & Housing Authority, RB, Fairfax Redevelopment & Housing, 5.00%, 10/01/39 | | | 1,500 | | | | 1,649,910 | |
Mosaic District Community Development Authority, RB, Special Assessment, Series A, 6.88%, 3/01/36 | | | 250 | | | | 278,840 | |
White Oak Village Shops Community Development Authority, Special Assessment Bonds, 5.30%, 3/01/17 | | | 175 | | | | 187,784 | |
| | | | | | | | |
| | | | | | | | 3,571,990 | |
Education — 15.1% | | | | | | | | |
Montgomery County EDA, Refunding RB, Virginia Tech Foundation, Series A, 5.00%, 6/01/39 | | | 355 | | | | 400,092 | |
Virginia College Building Authority, Refunding RB: | | | | | | | | |
Liberty University Projects, 5.00%, 3/01/41 | | | 1,000 | | | | 1,105,840 | |
Washington & Lee University Project (NPFGC), 5.25%, 1/01/26 | | | 500 | | | | 630,170 | |
Washington & Lee University Project (NPFGC), 5.25%, 1/01/31 | | | 1,000 | | | | 1,299,360 | |
Virginia Small Business Financing Authority, RB, Roanoke College, 5.75%, 4/01/41 | | | 500 | | | | 564,400 | |
| | | | | | | | |
| | | | | | | | 3,999,862 | |
Health — 23.7% | | | | | | | | |
Danville IDA Virginia, Refunding RB, Danville Regional Medical Center (AMBAC), 5.25%, 10/01/28 (b) | | | 1,000 | | | | 1,289,360 | |
Fairfax County EDA, Refunding RB, Goodwin House Inc., 5.00%, 10/01/27 | | | 1,000 | | | | 1,039,960 | |
Henrico County EDA, Refunding RB: | | | | | | | | |
Bon Secours, Series A, 5.60%, 11/15/30 | | | 1,440 | | | | 1,446,854 | |
Residential Care Facilities, United Methodist Homes, 4.25%, 6/01/26 | | | 145 | | | | 143,282 | |
Peninsula Ports Authority, Refunding RB, Virginia Baptist Homes, Series C, 5.40%, 12/01/33 | | | 250 | | | | 187,760 | |
Roanoke EDA, RB, Carilion Clinic Obligation Group, 5.00%, 7/01/30 | | | 795 | | | | 894,860 | |
Roanoke EDA, Refunding RB, Carillion Health System, Series B: | | | | | | | | |
5.00%, 7/01/20 (c) | | | 5 | | | | 6,297 | |
5.00%, 7/01/38 | | | 495 | | | | 541,911 | |
Winchester IDA Virginia, RB, Valley Health System Obligation, Series E, 5.63%, 1/01/44 | | | 650 | | | | 728,215 | |
| | | | | | | | |
| | | | | | | | 6,278,499 | |
Housing — 9.3% | | | | | | | | |
Virginia HDA, RB, Rental Housing: | | | | | | | | |
Series A, 5.25%, 5/01/41 | | | 750 | | | | 825,698 | |
Series B, 5.63%, 6/01/39 | | | 1,000 | | | | 1,106,940 | |
Series D, 4.60%, 9/01/40 | | | 500 | | | | 529,710 | |
| | | | | | | | |
| | | | | | | | 2,462,348 | |
| | | | | | | | |
| Municipal Bonds | | Par
(000) | | | Value | |
| | | | | | | | |
Virginia (concluded) | | | | | | | | |
State — 12.1% | | | | | | | | |
Virginia College Building Authority, RB, Public Higher Education Financing Program, Series A, 5.00%, 9/01/33 | | $ | 1,000 | | | $ | 1,121,910 | |
Virginia Public School Authority, RB, School Financing, 1997 Resolution, Series B: | | | | | | | | |
6.50%, 12/01/35 | | | 360 | | | | 448,060 | |
1997 Resolution, Series B, 5.25%, 8/01/33 | | | 500 | | | | 571,925 | |
1997 Resolution, Series B, 4.00%, 8/01/36 | | | 1,000 | | | | 1,052,330 | |
| | | | | | | | |
| | | | | | | | 3,194,225 | |
Transportation — 10.4% | | | | | | | | |
City of Norfolk Virginia, Refunding RB, Series B (AMBAC), 5.50%, 2/01/31 | | | 465 | | | | 465,525 | |
Richmond Metropolitan Authority Virginia, Refunding RB (NPFGC), 5.25%, 7/15/22 | | | 500 | | | | 583,300 | |
Virginia Port Authority Commonwealth Port Fund, RB, 5.00%, 7/01/36 | | | 500 | | | | 569,330 | |
Virginia Small Business Financing Authority, RB, Senior Lien, Elizabeth River Crossings, Opco LLC Project, AMT, 6.00%, 1/01/37 | | | 1,000 | | | | 1,145,450 | |
| | | | | | | | |
| | | | | | | | 2,763,605 | |
Utilities — 13.4% | | | | | | | | |
City of Portsmouth Virginia, GO, Refunding RB, Public Utilities, Series A, 5.00%, 7/15/41 | | | 900 | | | | 1,047,771 | |
Virginia Resources Authority, Refunding RB: | | | | | | | | |
Virginia Pooled Financing Program, Moral Obligation Bonds, Series A, 5.00%, 11/01/39 | | | 150 | | | | 172,566 | |
Senior, Virginia Pooled Financing Program, Series B, 5.00%, 11/01/33 | | | 2,000 | | | | 2,321,860 | |
| | | | | | | | |
| | | | | | | | 3,542,197 | |
| Total Municipal Bonds in Virginia | | | | | | | 28,746,138 | |
| | | | | | | | |
District of Columbia — 7.4% | | | | | | | | |
Transportation — 7.4% | | | | | | | | |
Metropolitan Washington Airports Authority, Refunding RB: | | | | | | | | |
Series B, 5.00%, 10/01/29 | | | 1,000 | | | | 1,130,840 | |
First Senior Lien, Series A, 5.00%, 10/01/39 | | | 290 | | | | 318,408 | |
First Senior Lien, Series A, 5.25%, 10/01/44 | | | 460 | | | | 509,496 | |
| Total Municipal Bonds in District of Columbia | | | | | | | 1,958,744 | |
| | | | | | | | |
Guam — 1.9% | | | | | | | | |
State — 1.9% | | | | | | | | |
Government of Guam Business Privilege Tax Revenue, RB, Series A, 5.13%, 1/01/42 | | | 250 | | | | 277,680 | |
Territory of Guam, Limited Obligation Bonds, RB, Section 30, Series A, 5.63%, 12/01/29 | | | 200 | | | | 224,544 | |
| Total Municipal Bonds in Guam | | | | | | | 502,224 | |
| | | | | | | | |
Multi-State — 6.3% | | | | | | | | |
Housing — 6.3% | | | | | | | | |
Centerline Equity Issuer Trust, 7.20%, 11/15/14 (d)(e) | | | 1,500 | | | | 1,660,260 | |
| | | | | | | | |
Puerto Rico — 4.0% | | | | | | | | |
State — 4.0% | | | | | | | | |
Puerto Rico Sales Tax Financing Corp., Refunding RB, Series A-1, 5.25%, 8/01/43 | | | 1,000 | | | | 1,067,420 | |
| Total Municipal Bonds — 128.2% | | | | | | | 33,934,786 | |
See Notes to Financial Statements.
| | | | | | |
| | | | | | | |
| | ANNUAL REPORT | | AUGUST 31, 2012 | | 37 |
| | |
| Schedule of Investments (concluded) | | BlackRock Virginia Municipal Bond Trust (BHV) (Percentages shown are based on Net Assets) |
| | | | | | | | |
| | |
Municipal Bonds Transferred to
Tender Option Bond Trusts (f) | | Par
(000) | | | Value | |
| | | | | | | | |
Virginia — 27.1% | | | | | | | | |
Education — 13.0% | |
University of Virginia, Refunding RB, General, 5.00%, 6/01/40 | | $ | 2,999 | | | $ | 3,444,044 | |
Health — 8.5% | | | | | | | | |
Fairfax County IDA Virginia, Refunding RB, Health Care, Series A, 5.50%, 5/15/35 | | | 999 | | | | 1,140,236 | |
Virginia Small Business Financing Authority, Refunding RB, Sentara Healthcare, 5.00%, 11/01/40 | | | 1,000 | | | | 1,103,237 | |
| | | | | | | | |
| | | | | | | | 2,243,473 | |
Transportation — 5.6% | | | | | | | | |
Virginia State Commonwealth Transportation Board, RB, Capital Projects, 5.00%, 5/15/32 | | | 1,259 | | | | 1,481,845 | |
| Total Municipal Bonds in Virginia | | | | | | | 7,169,362 | |
| | | | | | | | |
Puerto Rico — 2.1% | | | | | | | | |
State — 2.1% | | | | | | | | |
Puerto Rico Sales Tax Financing Corp., Refunding RB, Series C, 5.25%, 8/01/40 | | | 500 | | | | 555,980 | |
Total Municipal Bonds Transferred to Tender Option Bond Trusts — 29.2% | | | | | | | 7,725,342 | |
Total Long-Term Investments
(Cost — $37,540,157) — 157.4% | | | | | | | 41,660,128 | |
| | | | | | | | |
|
| |
| | |
| Short-Term Securities | | Shares | | | | |
FFI Institutional Tax-Exempt Fund, 0.01% (g)(h) | | | 65,431 | | | | 65,431 | |
Total Short-Term Securities
(Cost — $65,431) — 0.2% | | | | 65,431 | |
| Total Investments (Cost — $37,605,588) — 157.6% | | | | 41,725,559 | |
| Other Assets Less Liabilities — 1.7% | | | | 449,871 | |
Liability for TOB Trust Certificates, Including Interest
Expense and Fees Payable — (15.5)% | | | | (4,109,193 | ) |
| VRDP Shares, at Liquidation Value — (43.8)% | | | | (11,600,000 | ) |
| | | | | | | | |
| Net Assets Applicable to Common Shares — 100.0% | | | $ | 26,466,237 | |
| | | | | | | | |
| | | | | | | | | |
| (a) | | Variable rate security. Rate shown is as of report date and maturity shown is the date the principal owed can be recovered through demand. |
| (b) | | Security is collateralized by Municipal or US Treasury obligations. |
| (c) | | US government securities, held in escrow, are used to pay interest on this security, as well as to retire the bond in full at the date indicated, typically at a premium to par. |
| (d) | | Security represents a beneficial interest in a trust. The collateral deposited into the trust is federally tax-exempt revenue bonds issued by various state or local governments, or their respective agencies or authorities. The security is subject to remarketing prior to its stated maturity. |
| (e) | | Security exempt from registration pursuant to Rule 144A under the Securities Act of 1933, as amended. These securities may be resold in transactions exempt from registration to qualified institutional investors. |
| (f) | | Securities represent bonds transferred to a TOB in exchange for which the Trust’s acquired residual interest certificates. These securities serve as collateral in a financing transaction. See Note 1 of the Notes to Financial Statements for details of municipal bonds transferred to TOBs. |
| (g) | | Investments in issuers considered to be an affiliate of the Trust during the year ended August 31, 2012, for purposes of Section 2(a)(3) of the 1940 Act, were as follows: |
| | | | | | | | | | | | | | | | |
| Affiliate | | Shares
Held at
August 31,
2011 | | | Net
Activity | | | Shares
Held at
August 31,
2012 | | | Income | |
FFI Institutional Tax-Exempt Fund | | | 115,091 | | | | (49,660 | ) | | | 65,431 | | | $ | 66 | |
| (h) | | Represents the current yield as of report date. |
| Ÿ | | For Trust compliance purposes, the Trust’s sector classifications refer to any one or more of the sector sub-classifications used by one or more widely recognized market indexes or rating group indexes, and/or as defined by Trust management. These definitions may not apply for purposes of this report, which may combine sector sub-classifications for reporting ease. |
| Ÿ | | Fair Value Measurements—Various inputs are used in determining the fair value of investments. These inputs to valuation techniques are categorized into a disclosure hierarchy consisting of three broad levels for financial statement purposes as follows: |
| Ÿ | | Level 1 — unadjusted price quotations in active markets/exchanges for identical assets and liabilities |
| Ÿ | | Level 2 — other observable inputs (including, but not limited to: quoted prices for similar assets or liabilities in markets that are active, quoted prices for identical or similar assets or liabilities in markets that are not active, inputs other than quoted prices that are observable for the assets or liabilities (such as interest rates, yield curves, volatilities, prepayment speeds, loss severities, credit risks and default rates) or other market-corroborated inputs) |
| Ÿ | | Level 3 — unobservable inputs based on the best information available in the circumstances, to the extent observable inputs are not available (including the Trust’s own assumptions used in determining the fair value of investments) |
Changes in valuation techniques may result in transfers into or out of an assigned level within the disclosure hierarchy. In accordance with the Trust’s policy, transfers between different levels of the fair value disclosure hierarchy are deemed to have occurred as of the beginning of the reporting period. The categorization of a value determined for investments is based on the pricing transparency of the investment and is not necessarily an indication of the risks associated with investing in those securities. For information about the Trust’s policy regarding valuation of investments and other significant accounting policies, please refer to Note 1 of the Notes to Financial Statements.
The following table summarizes the Trust’s investments categorized in the disclosure hierarchy as of August 31, 2012:
| | | | | | | | | | | | | | | | |
| | | Level 1 | | | Level 2 | | | Level 3 | | | Total | |
Assets: | | | | | | | | | | | | | | | | |
| Investments: | | | | | | | | | | | | | | | | |
Long-Term Investments1 | | | — | | | $ | 41,660,128 | | | | — | | | $ | 41,660,128 | |
Short-Term Securities | | $ | 65,431 | | | | — | | | | — | | | | 65,431 | |
| | | | | | | | | | | | | | | | |
Total | | $ | 65,431 | | | $ | 41,660,128 | | | | — | | | $ | 41,725,559 | |
| | | | | | | | | | | | | | | | |
| 1 | | See above Schedule of Investments for values in each sector. |
Certain of the Trust’s liabilities are held at carrying amount, which approximates fair value for financial statement purposes. As of August 31, 2012, such liabilities are categorized within the disclosure hierarchy as follows:
| | | | | | | | | | | | | | | | |
| | | Level 1 | | | Level 2 | | | Level 3 | | | Total | |
Liabilities: | | | | | | | | | | | | | | | | |
TOB trust certificates | | | — | | | $ | (4,107,550 | ) | | | — | | | $ | (4,107,550 | ) |
VRDP Shares | | | — | | | | (11,600,000 | ) | | | — | | | | (11,600,000 | ) |
| | | | | | | | | | | | | | | | |
Total | | | — | | | $ | (15,707,550 | ) | | | — | | | $ | (15,707,550 | ) |
| | | | | | | | | | | | | | | | |
There were no transfers between levels during the year ended August 31, 2012.
See Notes to Financial Statements.
| | | | | | |
| | | | | | | |
| 38 | | ANNUAL REPORT | | AUGUST 31, 2012 | | |
| | |
| Schedule of Investments August 31, 2012 | | The Massachusetts Health & Education Tax-Exempt Trust (MHE) (Percentages shown are based on Net Assets) |
| | | | | | | | |
| Municipal Bonds | | Par
(000) | | | Value | |
| | | | | | | | |
Massachusetts — 143.2% | | | | | | | | |
Corporate — 0.3% | | | | | | | | |
Massachusetts Development Finance Agency, RB, Ogden Haverhill Project, Series A, AMT, 6.70%, 12/01/14 | | $ | 95 | | | $ | 95,921 | |
Education — 92.3% | | | | | | | | |
Massachusetts Development Finance Agency, ERB, Middlesex School Project, 5.00%, 9/01/33 | | | 400 | | | | 406,240 | |
Massachusetts Development Finance Agency, RB: | | | | | | | | |
Boston University, Series T-1, (AMBAC), 5.00%, 10/01/39 | | | 1,000 | | | | 1,039,590 | |
College Issue, Series B (Syncora), 5.25%, 7/01/33 | | | 860 | | | | 874,345 | |
College of Pharmacy & Allied Health, Series D (AGC), 5.00%, 7/01/27 | | | 500 | | | | 530,655 | |
Foxborough Regional Charter School, Series A, 7.00%, 7/01/42 | | | 250 | | | | 294,470 | |
Mount Holyoke College, Series B, 5.00%, 7/01/41 | | | 500 | | | | 559,365 | |
Smith College, 5.00%, 7/01/35 | | | 2,000 | | | | 2,185,840 | |
Wellesley College, Series J, 5.00%, 7/01/42 | | | 2,400 | | | | 2,794,920 | |
WGBH Educational Foundation, Series A (AMBAC), 5.75%, 1/01/42 | | | 650 | | | | 852,124 | |
Massachusetts Development Finance Agency, Refunding RB: | | | | | | | | |
Boston University, Series P, 5.45%, 5/15/59 | | | 1,500 | | | | 1,778,295 | |
Clark University (Syncora), 5.13%, 10/01/35 | | | 500 | | | | 525,330 | |
Emerson College, Series A, 5.00%, 1/01/40 | | | 200 | | | | 209,226 | |
Harvard University, Series B-1, 5.00%, 10/15/40 | | | 350 | | | | 409,181 | |
Northeastern University, 5.00%, 10/01/31 (a) | | | 500 | | | | 580,305 | |
Trustees of Deerfield Academy, 5.00%, 10/01/40 | | | 1,675 | | | | 1,937,255 | |
Wheelock College, Series C, 5.25%, 10/01/37 | | | 1,000 | | | | 1,032,330 | |
Williston Northampton School Project (Syncora), 5.00%, 10/01/25 | | | 500 | | | | 521,130 | |
Worcester Polytechnic Institute, (NPFGC), 5.00%, 9/01/27 | | | 1,985 | | | | 2,173,853 | |
Massachusetts Health & Educational Facilities Authority, Wheaton College, Series D, 6.00%, 1/01/18 | | | 755 | | | | 755,717 | |
Massachusetts Health & Educational Facilities Authority, RB: | | | | | | | | |
Northeastern University, Series R, 5.00%, 10/01/33 | | | 225 | | | | 246,179 | |
Tufts University, 5.38%, 8/15/38 | | | 1,000 | | | | 1,213,620 | |
University of Massachusetts, Series C (NPFGC), 5.13%, 10/01/12 (b) | | | 230 | | | | 230,948 | |
Massachusetts Health & Educational Facilities Authority, Refunding RB: | | | | | | | | |
Berklee College of Music, Series A, 5.00%, 10/01/37 | | | 1,000 | | | | 1,077,830 | |
Boston College, Series N, 5.13%, 6/01/37 | | | 1,000 | | | | 1,029,560 | |
Harvard University, Series A, 5.50%, 11/15/36 | | | 100 | | | | 121,329 | |
Harvard University, Series B, 5.00%, 10/01/38 | | | 400 | | | | 467,244 | |
Northeastern University, Series T-1, 5.00%, 10/01/31 | | | 950 | | | | 1,102,579 | |
Northeastern University, Series T-2, 5.00%, 10/01/32 | | | 500 | | | | 576,100 | |
Springfield College, 5.63%, 10/15/40 | | | 500 | | | | 540,245 | |
Tufts University, Series M, 5.50%, 2/15/27 | | | 1,000 | | | | 1,333,980 | |
Wellesley College, 5.00%, 7/01/33 | | | 1,500 | | | | 1,545,195 | |
Massachusetts State College Building Authority, RB, Series A (AMBAC), 5.00%, 5/01/16 (b) | | | 1,000 | | | | 1,163,170 | |
Massachusetts State College Building Authority, Refunding RB, Series B (Syncora), 5.50%, 5/01/39 | | | 825 | | | | 1,132,915 | |
| | | | | | | | |
| | | | | | | | 31,241,065 | |
Health — 31.6% | | | | | | | | |
Massachusetts Development Finance Agency, RB: | | | | | | | | |
First Mortgage, Edgecombe Project, Series A,
6.75%, 7/01/21 | | | 795 | | | | 804,461 | |
Partners Healthcare, Series L, 5.00%, 7/01/36 | | | 1,000 | | | | 1,124,400 | |
| | | | | | | | |
| Municipal Bonds | | Par
(000) | | | Value | |
| | | | | | | | |
Massachusetts (concluded) | | | | | | | | |
Health (concluded) | | | | | | | | |
Massachusetts Development Finance Agency, Refunding RB: | | | | | | | | |
Berkshire Health System, Series G, 5.00%, 10/01/29 | | $ | 335 | | | $ | 371,602 | |
Carleton-Willard Village, 5.63%, 12/01/30 | | | 500 | | | | 545,735 | |
Seven Hills Foundation & Affiliates, (Radian),
5.00%, 9/01/35 | | | 240 | | | | 231,732 | |
Massachusetts Health & Educational Facilities Authority, RB: | | | | | | | | |
Baystate Medical Center, Series F, 5.75%, 7/01/33 | | | 1,000 | | | | 1,001,080 | |
Berkshire Health System, Series F (AGC), 5.00%, 10/01/19 | | | 1,000 | | | | 1,075,050 | |
Cape Cod Healthcare Obligated Group Issue, Series D, (AGC), 5.00%, 11/15/31 | | | 1,000 | | | | 1,088,770 | |
Children’s Hospital, Series M, 5.25%, 12/01/39 | | | 600 | | | | 669,534 | |
Children’s Hospital, Series M, 5.50%, 12/01/39 | | | 500 | | | | 567,280 | |
Lahey Clinic Medical Center, Series D, 5.25%, 8/15/37 | | | 1,000 | | | | 1,062,600 | |
Southcoast Health Obligation, Series D, 5.00%, 7/01/39 | | | 500 | | | | 531,765 | |
Massachusetts Health & Educational Facilities Authority, Refunding RB: | | | | | | | | |
Caregroup, Series E-1, 5.00%, 7/01/28 | | | 500 | | | | 534,610 | |
Winchester Hospital, 5.25%, 7/01/38 | | | 1,000 | | | | 1,077,020 | |
| | | | | | | | |
| | | | | | | | 10,685,639 | |
Housing — 7.7% | | | | | | | | |
Massachusetts HFA, Refunding HRB, Series B, AMT, 5.50%, 6/01/41 | | | 495 | | | | 532,076 | |
Massachusetts HFA, Refunding RB, AMT: | | | | | | | | |
Series C, 5.35%, 12/01/42 | | | 1,000 | | | | 1,071,710 | |
Series F, 5.70%, 6/01/40 | | | 940 | | | | 1,009,259 | |
| | | | | | | | |
| | | | | | | | 2,613,045 | |
State — 11.3% | | | | | | | | |
Massachusetts Bay Transportation Authority, Refunding RB, Senior Series A, 5.25%, 7/01/29 | | | 730 | | | | 966,403 | |
Massachusetts State College Building Authority, RB, Series A, 5.50%, 5/01/39 | | | 2,500 | | | | 2,879,900 | |
| | | | | | | | |
| | | | | | | | 3,846,303 | |
| Total Municipal Bonds in Massachusetts | | | | | | | 48,481,973 | |
| | | | | | | | |
Puerto Rico — 5.0% | | | | | | | | |
State — 5.0% | | | | | | | | |
Puerto Rico Sales Tax Financing Corp., RB,
First Sub-Series A, 5.75%, 8/01/37 | | | 1,000 | | | | 1,115,020 | |
Puerto Rico Sales Tax Financing Corp., Refunding RB, 6.00%, 8/01/39 | | | 510 | | | | 580,839 | |
| | | | | | | | |
| | | | | | | | 1,695,859 | |
| Total Municipal Bonds — 148.2% | | | | | | | 50,177,832 | |
| | | | | | | | |
| | | | | | | | |
|
Municipal Bonds Transferred to Tender Option Bond Trusts (c) | |
Massachusetts — 10.0% | | | | | | | | |
State — 10.0% | | | | | | | | |
Massachusetts School Building Authority, Sales Tax RB: | | | | | | | | |
Senior, Series B, 5.00%, 10/15/41 | | | 1,000 | | | | 1,153,370 | |
Series A (AGM), 5.00%, 8/15/30 | | | 2,010 | | | | 2,219,600 | |
| | | | | | | | |
| | | | | | | | 3,372,970 | |
See Notes to Financial Statements.
| | | | | | |
| | | | | | | |
| | ANNUAL REPORT | | AUGUST 31, 2012 | | 39 |
| | |
| Schedule of Investments (concluded) | | The Massachusetts Health & Education Tax-Exempt Trust (MHE) (Percentages shown are based on Net Assets) |
| | | | | | | | |
Municipal Bonds Transferred to Tender Option Bond Trusts (c) | | Par
(000) | | | Value | |
| | | | | | | | |
Puerto Rico — 1.1% | | | | | | | | |
State — 1.1% | | | | | | | | |
Puerto Rico Sales Tax Financing Corp., Refunding RB, Series C, 5.25%, 8/01/40 | | $ | 340 | | | $ | 378,075 | |
Total Municipal Bonds Transferred to Tender Option Bond Trusts — 11.1% | | | | 3,751,045 | |
Total Long-Term Investments (Cost — $49,522,408) — 159.3% | | | | 53,928,877 | |
|
| |
| | |
| Short-Term Securities | | | | | | |
Massachusetts — 1.5% | | | | | | | | |
Massachusetts Health & Educational Facilities Authority, RB, VRDN, Partners Healthcare System, Series P-2,
0.14%, 7/01/13 (d) | | | 500 | | | | 500,000 | |
| | | | | | | | |
| | |
| | | Shares | | | | |
Money Market Fund — 0.1% | | | | | | | | |
BIF Massachusetts Municipal Money Fund, 0.00% (e)(f) | | | 36,054 | | | | 36,054 | |
Total Short-Term Securities
(Cost — $536,054) — 1.6% | | | | 536,054 | |
| Total Investments (Cost — $50,058,462) — 160.9% | | | | 54,464,931 | |
Liabilities in Excess of Other Assets — (0.3)% | | | | (103,019 | ) |
Liability for TOB Trust Certificates, Including Interest
Expense and Fees Payable — (5.9)% | | | | (2,009,987 | ) |
| VRDP Shares, at Liquidation Value — (54.7)% | | | | (18,500,000 | ) |
| | | | | | | | |
| Net Assets Applicable to Common Shares — 100.0% | | | $ | 33,851,925 | |
| | | | | | | | |
| | | | | | | | | |
| (a) | | When-issued security. Unsettled when-issued transactions were as follows: |
| | | | | | | | |
| Counterparty | | Value | | | Unrealized
Appreciation
| |
| Barclays Plc | | $ | 580,305 | | | $ | 8,575 | |
| (b) | | US government securities, held in escrow, are used to pay interest on this security, as well as to retire the bond in full at the date indicated, typically at a premium to par. |
| (c) | | Securities represent bonds transferred to a TOB in exchange for which the Trust’s acquired residual interest certificates. These securities serve as collateral in a financing transaction. See Note 1 of the Notes to Financial Statements for details of municipal bonds transferred to TOBs. |
| (d) | | Variable rate security. Rate shown is as of report date and maturity shown is the date the principal owed can be recovered through demand. |
| (e) | | Investments in issuers considered to be an affiliate of the Trust during the year ended August 31, 2012, for purposes of Section 2(a)(3) of the 1940 Act, were as follows: |
| | | | | | | | | | | | | | | | |
| Affiliate | | Shares
Held at
August 31,
2011 | | | Net
Activity | | | Shares
Held at
August 31,
2012 | | | Income | |
BIF Massachusetts Municipal Money Fund | | | 818,003 | | | | (781,949 | ) | | | 36,054 | | | $ | 8 | |
| (f) | | Represents the current yield as of report date. |
| Ÿ | | For Trust compliance purposes, the Trust’s sector classifications refer to any one or more of the sector sub-classifications used by one or more widely recognized market indexes or rating group indexes, and/or as defined by Trust management. These definitions may not apply for purposes of this report, which may combine sector sub-classifications for reporting ease. |
| Ÿ | | Fair Value Measurements - Various inputs are used in determining the fair value of investments. These inputs to valuation techniques are categorized into a disclosure hierarchy consisting of three broad levels for financial statement purposes as follows: |
| Ÿ | | Level 1 — unadjusted price quotations in active markets/exchanges for identical assets and liabilities |
| Ÿ | | Level 2 — other observable inputs (including, but not limited to: quoted prices for similar assets or liabilities in markets that are active, quoted prices for identical or similar assets or liabilities in markets that are not active, inputs other than quoted prices that are observable for the assets or liabilities (such as interest rates, yield curves, volatilities, prepayment speeds, loss severities, credit risks and default rates) or other market-corroborated inputs) |
| Ÿ | | Level 3 — unobservable inputs based on the best information available in the circumstances, to the extent observable inputs are not available (including the Trust’s own assumptions used in determining the fair value of investments) |
Changes in valuation techniques may result in transfers into or out of an assigned level within the disclosure hierarchy. In accordance with the Trust’s policy, transfers between different levels of the fair value disclosure hierarchy are deemed to have occurred as of the beginning of the reporting period. The categorization of a value determined for investments is based on the pricing transparency of the investment and is not necessarily an indication of the risks associated with investing in those securities. For information about the Trust’s policy regarding valuation of investments and other significant accounting policies, please refer to Note 1 of the Notes to Financial Statements.
The following table summarizes the Trust’s investments categorized in the disclosure hierarchy as of August 31, 2012:
| | | | | | | | | | | | | | | | |
| | | Level 1 | | | Level 2 | | | Level 3 | | | Total | |
Assets: | | | | | | | | | | | | | | | | |
| Investments: | | | | | | | | | | | | | | | | |
Long-Term
Investments1 | | | — | | | $ | 53,928,877 | | | | — | | | $ | 53,928,877 | |
Short-Term Securities | | $ | 36,054 | | | | 500,000 | | | | — | | | | 536,054 | |
| | | | | | | | | | | | | | | | |
Total | | $ | 36,054 | | | $ | 54,428,877 | | | | — | | | $ | 54,464,931 | |
| | | | | | | | | | | | | | | | |
| 1 | | See above Schedule of Investments for values in each sector. |
Certain of the Trust’s liabilities are held at carrying amount, which approximates fair value for financial statement purposes. As of August 31, 2012, such liabilities are categorized within the disclosure hierarchy as follows:
| | | | | | | | | | | | | | | | |
| | | Level 1 | | | Level 2 | | | Level 3 | | | Total | |
Liabilities: | | | | | | | | | | | | | | | | |
TOB trust certificates | | | — | | | $ | (2,009,595 | ) | | | — | | | $ | (2,009,595 | ) |
VRDP Shares | | | — | | | | (18,500,000 | ) | | | — | | | | (18,500,000 | ) |
| | | | | | | | | | | | | | | | |
Total | | | — | | | $ | (20,509,595 | ) | | | — | | | $ | (20,509,595 | ) |
| | | | | | | | | | | | | | | | |
| There | | were no transfers between levels during the year ended August 31, 2012. |
See Notes to Financial Statements.
| | | | | | |
| | | | | | | |
| 40 | | ANNUAL REPORT | | AUGUST 31, 2012 | | |
| | |
| Statements of Assets and Liabilities | | |
| | | | | | | | | | | | | | | | |
| August 31, 2012 | | BlackRock
Maryland
Municipal Bond Trust
(BZM) | | | BlackRock
MuniHoldings
New York Quality Fund, Inc.
(MHN) | | | BlackRock
New Jersey
Municipal
Bond Trust
(BLJ) | | | BlackRock New York
Municipal Bond Trust
(BQH) | |
| | | | | | | | | | | | | | | | |
| Assets | | | | | | | | | | | | | | | | |
Investments at value — unaffiliated1 | | $ | 50,176,585 | | | $ | 791,834,890 | | | $ | 60,743,531 | | | $ | 73,210,053 | |
Investments at value — affiliated2 | | | 180,661 | | | | 9,529,494 | | | | 891,865 | | | | 3,245,381 | |
Cash | | | — | | | | — | | | | — | | | | 22,875 | |
Interest receivable | | | 528,265 | | | | 8,770,320 | | | | 735,901 | | | | 687,637 | |
Investments sold receivable | | | — | | | | 105,365 | | | | 10,000 | | | | — | |
Deferred offering costs | | | 86,224 | | | | 436,913 | | | | 86,224 | | | | 170,437 | |
TOB trust receivable | | | — | | | | — | | | | — | | | | 440,000 | |
Prepaid expenses | | | 1,135 | | | | 37,300 | | | | 1,295 | | | | 1,545 | |
| | | | |
Total assets | | | 50,972,870 | | | | 810,714,282 | | | | 62,468,816 | | | | 77,777,928 | |
| | | | |
| | | | | | | | | | | | | | | | |
| Accrued Liabilities | | | | | | | | | | | | | | | | |
Bank overdraft | | | — | | | | 2,349 | | | | — | | | | — | |
Investments purchased payable | | | — | | | | 852,144 | | | | 801,942 | | | | 1,844,418 | |
Income dividends payable — Common Shares | | | 137,774 | | | | 2,466,987 | | | | 169,556 | | | | 206,585 | |
Investment advisory fees payable | | | 27,771 | | | | 373,888 | | | | 33,749 | | | | 41,083 | |
Officer’s and Trustees’ fees payable | | | 8,720 | | | | 115,568 | | | | 8,478 | | | | 7,074 | |
Interest expense and fees payable | | | 1,038 | | | | 31,159 | | | | 457 | | | | 2,698 | |
Offering costs payable | | | 40,000 | | | | — | | | | 40,000 | | | | — | |
Other accrued expenses payable | | | 37,273 | | | | 341,085 | | | | 32,844 | | | | 52,656 | |
| | | | |
Total accrued liabilities | | | 252,576 | | | | 4,183,180 | | | | 1,087,026 | | | | 2,154,514 | |
| | | | |
| | | | | | | | | | | | | | | | |
| Other Liabilities | | | | | | | | | | | | | | | | |
TOB trust certificates | | | 2,399,847 | | | | 77,476,820 | | | | 3,954,288 | | | | 7,365,836 | |
VRDP Shares, at liquidation value of $100,000 per share3,4 | | | 16,000,000 | | | | 243,600,000 | | | | 18,700,000 | | | | 22,100,000 | |
| | | | |
Total other liabilities | | | 18,399,847 | | | | 321,076,820 | | | | 22,654,288 | | | | 29,465,836 | |
| | | | |
Total liabilities | | | 18,652,423 | | | | 325,260,000 | | | | 23,741,314 | | | | 31,620,350 | |
| | | | |
Net Assets Applicable to Common Shareholders | | $ | 32,320,447 | | | $ | 485,454,282 | | | $ | 38,727,502 | | | $ | 46,157,578 | |
| | | | |
| | | | | | | | | | | | | | | | |
| Net Assets Applicable to Common Shareholders Consist of | | | | | | | | | | | | | | | | |
Paid-in capital5,6,7 | | $ | 29,363,022 | | | $ | 459,413,538 | | | $ | 32,932,968 | | | $ | 39,626,791 | |
Undistributed net investment income | | | 472,802 | | | | 8,069,904 | | | | 678,200 | | | | 627,501 | |
Undistributed net realized gain (accumulated net realized loss) | | | (210,557 | ) | | | (37,314,818 | ) | | | (316,457 | ) | | | 380,483 | |
Net unrealized appreciation/depreciation | | | 2,695,180 | | | | 55,285,658 | | | | 5,432,791 | | | | 5,522,803 | |
| | | | |
Net Assets Applicable to Common Shareholders | | $ | 32,320,447 | | | $ | 485,454,282 | | | $ | 38,727,502 | | | $ | 46,157,578 | |
| | | | |
Net asset value per Common Share | | $ | 15.60 | | | $ | 15.64 | | | $ | 16.67 | | | $ | 16.53 | |
| | | | |
1 Investments at cost — unaffiliated | | $ | 47,481,405 | | | $ | 736,549,232 | | | $ | 55,310,740 | | | $ | 67,687,250 | |
| | | | |
2 Investments at cost — affiliated | | $ | 180,661 | | | $ | 9,529,494 | | | $ | 891,865 | | | $ | 3,245,381 | |
| | | | |
3 Preferred Shares outstanding: | | | | | | | | | | | | | | | | |
Par value $0.001 per share | | | 160 | | | | — | | | | 187 | | | | 221 | |
| | | | |
Par value $0.10 per share | | | — | | | | 2,436 | | | | — | | | | — | |
| | | | |
4 Preferred Shares authorized | | | unlimited | | | | 14,956 | | | | unlimited | | | | unlimited | |
| | | | |
5 Par value per Common Share | | $ | 0.001 | | | $ | 0.10 | | | $ | 0.001 | | | $ | 0.001 | |
| | | | |
6 Common Shares outstanding | | | 2,071,783 | | | | 31,031,287 | | | | 2,322,685 | | | | 2,791,685 | |
| | | | |
7 Common Shares authorized | | | unlimited | | | | 200 million | | | | unlimited | | | | unlimited | |
| | | | |
| | | | | | |
| See Notes to Financial Statements. | | | | |
| | | | | | | |
| | ANNUAL REPORT | | AUGUST 31, 2012 | | 41 |
| | |
| Statements of Assets and Liabilities (concluded) | | |
| | | | | | | | | | | | | | | | |
| August 31, 2012 | | BlackRock New York
Municipal Income
Quality Trust
(BSE) | | | BlackRock
New York
Municipal
Income Trust II
(BFY) | | | BlackRock
Virginia
Municipal
Bond Trust
(BHV) | | | The
Massachusetts
Health & Education
Tax-Exempt Trust
(MHE) | |
| | | | | | | | | | | | | | | | |
| Assets | | | | | | | | | | | | | | | | |
Investments at value — unaffiliated1 | | $ | 160,548,158 | | | $ | 131,487,832 | | | $ | 41,660,128 | | | $ | 54,428,877 | |
Investments at value — affiliated2 | | | 1,020,744 | | | | 459,702 | | | | 65,431 | | | | 36,054 | |
Cash | | | — | | | | 48,801 | | | | — | | | | — | |
Interest receivable | | | 1,678,359 | | | | 1,340,286 | | | | 556,581 | | | | 634,420 | |
Deferred offering costs | | | 183,207 | | | | 179,227 | | | | 86,224 | | | | 97,641 | |
TOB trust receivable | | | 590,000 | | | | — | | | | — | | | | — | |
Prepaid expenses | | | 3,466 | | | | 2,727 | | | | 895 | | | | 639 | |
| | | | |
Total assets | | | 164,023,934 | | | | 133,518,575 | | | | 42,369,259 | | | | 55,197,631 | |
| | | | |
| | | | | | | | | | | | | | | | |
| Accrued Liabilities | | | | | | | | | | | | | | | | |
Investments purchased payable | | | 1,088,958 | | | | 751,895 | | | | — | | | | 571,730 | |
Income dividends payable — Common Shares | | | 465,071 | | | | 403,833 | | | | 123,347 | | | | 147,419 | |
Investment advisory fees payable | | | 75,192 | | | | 61,400 | | | | 23,227 | | | | 22,949 | |
Officer’s and Trustees’ fees payable | | | 6,131 | | | | 8,663 | | | | 5,666 | | | | 88 | |
Interest expense and fees payable | | | 9,467 | | | | 2,427 | | | | 578 | | | | 392 | |
Offering costs payable | | | — | | | | — | | | | 40,000 | | | | 40,000 | |
Other accrued expenses payable | | | 93,523 | | | | 71,372 | | | | 2,654 | | | | 53,533 | |
| | | | |
Total accrued liabilities | | | 1,738,342 | | | | 1,299,590 | | | | 195,472 | | | | 836,111 | |
| | | | |
| | | | | | | | | | | | | | | | |
| Other Liabilities | | | | | | | | | | | | | | | | |
TOB trust certificates | | | 20,920,361 | | | | 7,591,259 | | | | 4,107,550 | | | | 2,009,595 | |
VRDP Shares, at liquidation value of $100,000 per share3,4 | | | 40,500,000 | | | | 44,400,000 | | | | 11,600,000 | | | | 18,500,000 | |
| | | | |
Total other liabilities | | | 61,420,361 | | | | 51,991,259 | | | | 15,707,550 | | | | 20,509,595 | |
| | | | |
Total liabilities | | | 63,158,703 | | | | 53,290,849 | | | | 15,903,022 | | | | 21,345,706 | |
| | | | |
Net Assets Applicable to Common Shareholders | | $ | 100,865,231 | | | $ | 80,227,726 | | | $ | 26,466,237 | | | $ | 33,851,925 | |
| | | | |
| | | | | | | | | | | | | | | | |
| Net Assets Applicable to Common Shareholders Consist of | | | | | | | | | | | | | | | | |
Paid-in capital5,6,7 | | $ | 92,225,476 | | | $ | 70,656,793 | | | $ | 22,529,781 | | | $ | 29,876,964 | |
Undistributed net investment income | | | 1,360,150 | | | | 1,223,739 | | | | 406,669 | | | | 609,532 | |
Undistributed net realized gain (accumulated net realized loss) | | | (4,704,599 | ) | | | (1,696,956 | ) | | | (590,184 | ) | | | (1,041,040 | ) |
Net unrealized appreciation/depreciation | | | 11,984,204 | | | | 10,044,150 | | | | 4,119,971 | | | | 4,406,469 | |
| | | | |
Net Assets Applicable to Common Shareholders | | $ | 100,865,231 | | | $ | 80,227,726 | | | $ | 26,466,237 | | | $ | 33,851,925 | |
| | | | |
Net asset value per Common Share | | $ | 15.51 | | | $ | 16.09 | | | $ | 16.74 | | | $ | 14.35 | |
| | | | |
1 Investments at cost — unaffiliated | | $ | 148,563,954 | | | $ | 121,443,682 | | | $ | 37,540,157 | | | $ | 50,022,408 | |
| | | | |
2 Investments at cost — affiliated | | $ | 1,020,744 | | | $ | 459,702 | | | $ | 65,431 | | | $ | 36,054 | |
| | | | |
3 Preferred Shares outstanding: | | | | | | | | | | | | | | | | |
Par value $0.001 per share | | | 405 | | | | 444 | | | | 116 | | | | — | |
| | | | |
Par value $0.01 per share | | | — | | | | — | | | | — | | | | 185 | |
| | | | |
4 Preferred Shares authorized | | | unlimited | | | | unlimited | | | | unlimited | | | | unlimited | |
| | | | |
5 Par value per Common Share | | $ | 0.001 | | | $ | 0.001 | | | $ | 0.001 | | | $ | 0.01 | |
| | | | |
6 Common Shares outstanding | | | 6,504,492 | | | | 4,985,597 | | | | 1,581,375 | | | | 2,358,705 | |
| | | | |
7 Common Shares authorized | | | unlimited | | | | unlimited | | | | unlimited | | | | unlimited | |
| | | | |
| | | | | | |
| See Notes to Financial Statements. | | | | |
| | | | | | | |
| 42 | | ANNUAL REPORT | | AUGUST 31, 2012 | | |
| | | | | | | | | | | | | | | | |
| Year Ended August 31, 2012 | | BlackRock
Maryland
Municipal
Bond Trust
(BZM) | | | BlackRock
MuniHoldings
New York Quality Fund, Inc.
(MHN) | | | BlackRock New Jersey
Municipal Bond Trust
(BLJ) | | | BlackRock New York
Municipal Bond Trust
(BQH) | |
| | | | | | | | | | | | | | | | |
| Investment Income | | | | | | | | | | | | | | | | |
Interest | | $ | 2,360,451 | | | $ | 36,312,673 | | | $ | 2,775,922 | | | $ | 3,374,546 | |
Income — affiliated | | | 304 | | | | 4,389 | | | | 315 | | | | 294 | |
| | | | |
Total income | | | 2,360,755 | | | | 36,317,062 | | | | 2,776,237 | | | | 3,374,840 | |
| | | | |
| | | | | | | | | | | | | | | | |
| Expenses | | | | | | | | | | | | | | | | |
Investment advisory | | | 318,748 | | | | 4,316,139 | | | | 377,628 | | | | 450,214 | |
Liquidity fees | | | — | | | | 1,741,505 | | | | — | | | | 176,071 | |
Professional | | | 57,845 | | | | 387,954 | | | | 53,705 | | | | 55,509 | |
Remarketing fees on Preferred Shares | | | 13,382 | | | | 244,268 | | | | 24,299 | | | | 21,609 | |
Accounting services | | | 15,204 | | | | 123,228 | | | | 20,358 | | | | 24,134 | |
Transfer agent | | | 31,286 | | | | 49,565 | | | | 21,277 | | | | 25,015 | |
Officer and Trustees | | | 3,952 | | | | 69,272 | | | | 4,865 | | | | 4,152 | |
Custodian | | | 7,392 | | | | 33,233 | | | | 8,123 | | | | 8,592 | |
Printing | | | 1,527 | | | | 6,511 | | | | 6,714 | | | | 11,423 | |
Registration | | | 889 | | | | 10,571 | | | | 1,003 | | | | 9,163 | |
Miscellaneous | | | 16,365 | | | | 169,935 | | | | 18,737 | | | | 68,276 | |
| | | | |
Total expenses excluding interest expense, fees and amortization of offering costs | | | 466,590 | | | | 7,152,181 | | | | 536,709 | | | | 854,158 | |
Interest expense, fees and amortization of offering costs1 | | | 51,809 | | | | 1,980,835 | | | | 66,565 | | | | 132,925 | |
| | | | |
Total expenses | | | 518,399 | | | | 9,133,016 | | | | 603,274 | | | | 987,083 | |
Less fees waived by Manager | | | (16,834 | ) | | | (378,387 | ) | | | (23,012 | ) | | | (24,087 | ) |
| | | | |
Total expenses after fees waived | | | 501,565 | | | | 8,754,629 | | | | 580,262 | | | | 962,996 | |
| | | | |
Net investment income | | | 1,859,190 | | | | 27,562,433 | | | | 2,195,975 | | | | 2,411,844 | |
| | | | |
| | | | | | | | | | | | | | | | |
| Realized and Unrealized Gain (Loss) | | | | | | | | | | | | | | | | |
Net realized gain (loss) from: | | | | | | | | | | | | | | | | |
Investments | | | 226,576 | | | | 298,558 | | | | 145,816 | | | | 776,786 | |
Financial futures contracts | | | (97,401 | ) | | | (1,389,725 | ) | | | (131,305 | ) | | | (131,098 | ) |
| | | | |
| | | 129,175 | | | | (1,091,167 | ) | | | 14,511 | | | | 645,688 | |
| | | | |
| Net change in unrealized appreciation/depreciation on: | | | | | | | | | | | | | | | | |
Investments | | | 2,023,201 | | | | 43,412,707 | | | | 4,915,294 | | | | 4,217,496 | |
Financial futures contracts | | | (1,787 | ) | | | — | | | | (2,860 | ) | | | — | |
| | | | |
| | | 2,021,414 | | | | 43,412,707 | | | | 4,912,434 | | | | 4,217,496 | |
| | | | |
Total realized and unrealized gain | | | 2,150,589 | | | | 42,321,540 | | | | 4,926,945 | | | | 4,863,184 | |
| | | | |
| | | | | | | | | | | | | | | | |
| Dividends to AMPS Shareholders From | | | | | | | | | | | | | | | | |
Net investment income | | | (32,567 | ) | | | — | | | | (39,347 | ) | | | (6,285 | ) |
| | | | |
Net Increase in Net Assets Applicable to Common Shareholders Resulting from Operations | | $ | 3,977,212 | | | $ | 69,883,973 | | | $ | 7,083,573 | | | $ | 7,268,743 | |
| | | | |
1 Related to TOBs and/or VRDP Shares. | | | | | | | | | | | | | | | | |
| | | | | | |
| See Notes to Financial Statements. | | | | |
| | | | | | | |
| | ANNUAL REPORT | | AUGUST 31, 2012 | | 43 |
| | |
| Statements of Operations (concluded) | | |
| | | | | | | | | | | | | | | | |
| Year Ended August 31, 2012 | | BlackRock New York
Municipal Income
Quality Trust
(BSE) | | | BlackRock
New York
Municipal
Income Trust II
(BFY) | | | BlackRock
Virginia
Municipal
Bond Trust
(BHV) | | | The Massachusetts
Health & Education
Tax-Exempt Trust
(MHE) | |
| | | | | | | | | | | | | | | | |
| Investment Income | | | | | | | | | | | | | | | | |
Interest | | $ | 6,992,394 | | | $ | 6,064,416 | | | $ | 1,939,199 | | | $ | 2,463,956 | |
Income — affiliated | | | 270 | | | | 30 | | | | 254 | | | | 8 | |
| | | | |
Total income | | | 6,992,664 | | | | 6,064,446 | | | | 1,939,453 | | | | 2,463,964 | |
| | | | |
| | | | | | | | | | | | | | | | |
| Expenses | | | | | | | | | | | | | | | | |
Investment advisory | | | 841,131 | | | | 689,857 | | | | 263,722 | | | | 264,399 | |
Liquidity fees | | | 322,661 | | | | 353,732 | | | | — | | | | — | |
Professional | | | 69,243 | | | | 56,917 | | | | 43,654 | | | | 43,313 | |
Remarketing fees on Preferred Shares | | | 39,600 | | | | 43,412 | | | | 13,132 | | | | 28,901 | |
Accounting services | | | 39,658 | | | | 32,256 | | | | 5,099 | | | | 20,375 | |
Transfer agent | | | 39,348 | | | | 28,100 | | | | 14,922 | | | | 27,806 | |
Officer and Trustees | | | 11,691 | | | | 9,029 | | | | 3,129 | | | | 3,997 | |
Custodian | | | 12,119 | | | | 10,859 | | | | 6,211 | | | | 7,059 | |
Printing | | | 4,063 | | | | 3,900 | | | | 6,203 | | | | 5,261 | |
Registration | | | 9,171 | | | | 2,129 | | | | 705 | | | | 1,017 | |
Miscellaneous | | | 74,669 | | | | 74,388 | | | | 17,705 | | | | 31,191 | |
| | | | |
Total expenses excluding interest expense, fees and amortization of offering costs | | | 1,463,354 | | | | 1,304,579 | | | | 374,482 | | | | 433,319 | |
Interest expense, fees and amortization of offering costs1 | | | 304,406 | | | | 249,844 | | | | 53,441 | | | | 55,473 | |
| | | | |
Total expenses | | | 1,767,760 | | | | 1,554,423 | | | | 427,923 | | | | 488,792 | |
Less fees waived by Manager | | | (1,992 | ) | | | (59,887 | ) | | | (13,528 | ) | | | (371 | ) |
| | | | |
Total expenses after fees waived | | | 1,765,768 | | | | 1,494,536 | | | | 414,395 | | | | 488,421 | |
| | | | |
Net investment income | | | 5,226,896 | | | | 4,569,910 | | | | 1,525,058 | | | | 1,975,543 | |
| | | | |
| | | | | | | | | | | | | | | | |
| Realized and Unrealized Gain (Loss) | | | | | | | | | | | | | | | | |
Net realized gain (loss) from: | | | | | | | | | | | | | | | | |
Investments | | | 433,364 | | | | 696,228 | | | | (281,306 | ) | | | 67,368 | |
Financial futures contracts | | | (291,995 | ) | | | (230,864 | ) | | | (99,580 | ) | | | (105,334 | ) |
| | | | |
| | | 141,369 | | | | 465,364 | | | | (380,886 | ) | | | (37,966 | ) |
| | | | |
Net change in unrealized appreciation/depreciation on: | | | | | | | | | | | | | | | | |
Investments | | | 8,377,994 | | | | 7,050,292 | | | | 2,658,644 | | | | 3,229,503 | |
Financial futures contracts | | | — | | | | — | | | | (1,787 | ) | | | (2,860 | ) |
| | | | |
| | | 8,377,994 | | | | 7,050,292 | | | | 2,656,857 | | | | 3,226,643 | |
| | | | |
Total realized and unrealized gain | | | 8,519,363 | | | | 7,515,656 | | | | 2,275,971 | | | | 3,188,677 | |
| | | | |
| | | | | | | | | | | | | | | | |
| Dividends to AMPS Shareholders From | | | | | | | | | | | | | | | | |
Net investment income | | | (10,041 | ) | | | (10,777 | ) | | | (23,764 | ) | | | (35,328 | ) |
| | | | |
Net Increase in Net Assets Applicable to Common Shareholders Resulting from Operations | | $ | 13,736,218 | | | $ | 12,074,789 | | | $ | 3,777,265 | | | $ | 5,128,892 | |
| | | | |
1 Related to TOBs and/or VRDP Shares. | | | | | | | | | | | | | | | | |
| | | | | | |
| See Notes to Financial Statements. | | | | |
| | | | | | | |
| 44 | | ANNUAL REPORT | | AUGUST 31, 2012 | | |
| | |
| Statements of Changes in Net Assets | | |
| | | | | | | | | | | | | | | | |
| | | BlackRock Maryland Municipal
Bond Trust (BZM) | | | BlackRock MuniHoldings New York
Quality Fund, Inc. (MHN) | |
| | | Year Ended August 31, | | | Year Ended August 31, | |
| Increase (Decrease) in Net Assets Applicable to Common Shareholders: | | 2012 | | | 2011 | | | 2012 | | | 2011 | |
| | | | | | | | | | | | | | | | |
| Operations | | | | | | | | | | | | | | | | |
Net investment income | | $ | 1,859,190 | | | $ | 1,996,183 | | | $ | 27,562,433 | | | $ | 30,096,351 | |
Net realized gain (loss) | | | 129,175 | | | | (315,881 | ) | | | (1,091,167 | ) | | | (5,596,532 | ) |
Net change in unrealized appreciation/depreciation | | | 2,021,414 | | | | (901,708 | ) | | | 43,412,707 | | | | (17,120,105 | ) |
| Dividends to AMPS Shareholders from: | | | | | | | | | | | | | | | | |
Net investment income | | | (32,567 | ) | | | (55,571 | ) | | | — | | | | (806,882 | ) |
Net realized gain | | | — | | | | (1,626 | ) | | | — | | | | — | |
| | | | | | | | |
Net increase in net assets applicable to Common Shareholders resulting from operations | | | 3,977,212 | | | | 721,397 | | | | 69,883,973 | | | | 6,572,832 | |
| | | | | | | | |
| | | | | | | | | | | | | | | | |
| Dividends and Distributions to Common Shareholders From | | | | | | | | | | | | |
Net investment income | | | (1,935,977 | ) | | | (1,956,147 | ) | | | (29,541,265 | ) | | | (29,570,570 | ) |
Net realized gain | | | — | | | | (45,287 | ) | | | — | | | | — | |
| | | | | | | | |
Decrease in net assets resulting from dividends and distributions to Common Shareholders | | | (1,935,977 | ) | | | (2,001,434 | ) | | | (29,541,265 | ) | | | (29,570,570 | ) |
| | | | | | | | |
| | | | | | | | | | | | | | | | |
| Capital Share Transactions | | | | | | | | | | | | | | | | |
Reinvestment of common dividends | | | 76,471 | | | | 133,575 | | | | 1,786,582 | | | | 1,469,492 | |
| | | | | | | | |
| | | | | | | | | | | | | | | | |
| Net Assets Applicable to Common Shareholders | | | | | | | | | | | | |
Total increase (decrease) in net assets applicable to Common Shareholders | | | 2,117,706 | | | | (1,146,462 | ) | | | 42,129,290 | | | | (21,528,246 | ) |
Beginning of year | | | 30,202,741 | | | | 31,349,203 | | | | 443,324,992 | | | | 464,853,238 | |
| | | | | | | | | | | | |
End of year | | $ | 32,320,447 | | | $ | 30,202,741 | | | $ | 485,454,282 | | | $ | 443,324,992 | |
| | | | | | | | |
Undistributed net investment income | | $ | 472,802 | | | $ | 581,533 | | | $ | 8,069,904 | | | $ | 9,802,835 | |
| | | | | | | | |
| | | | | | |
| See Notes to Financial Statements. | | | | |
| | | | | | | |
| | ANNUAL REPORT | | AUGUST 31, 2012 | | 45 |
| | |
| Statements of Changes in Net Assets | | |
| | | | | | | | | | | | | | | | |
| | | BlackRock New Jersey
Municipal Bond Trust (BLJ) | | | BlackRock New York
Municipal Bond Trust (BQH) | |
| | | Year Ended August 31, | | | Year Ended August 31, | |
| Increase (Decrease) in Net Assets Applicable to Common Shareholders: | | 2012 | | | 2011 | | | 2012 | | | 2011 | |
| | | | | | | | | | | | | | | | |
| Operations | | | | | | | | | | | | | | | | |
Net investment income | | $ | 2,195,975 | | | $ | 2,320,726 | | | $ | 2,411,844 | | | $ | 2,902,420 | |
Net realized gain (loss) | | | 14,511 | | | | (291,417 | ) | | | 645,688 | | | | (131,149 | ) |
Net change in unrealized appreciation/depreciation | | | 4,912,434 | | | | (1,269,096 | ) | | | 4,217,496 | | | | (2,055,567 | ) |
| Dividends and distributions to AMPS Shareholders from: | | | | | | | | | | | | | | | | |
Net investment income | | | (39,347 | ) | | | (65,738 | ) | | | (6,285 | ) | | | (78,727 | ) |
Net realized gain | | | — | | | | (2,508 | ) | | | — | | | | — | |
| | | | | | | | |
Net increase in net assets applicable to Common Shareholders resulting from operations | | | 7,083,573 | | | | 691,967 | | | | 7,268,743 | | | | 636,977 | |
| | | | | | | | |
| | | | | | | | | | | | | | | | |
| Dividends and Distributions to Common Shareholders From | | | | | | | | | | | | | | | | |
Net investment income | | | (2,163,456 | ) | | | (2,179,085 | ) | | | (2,675,085 | ) | | | (2,749,158 | ) |
Net realized gain | | | — | | | | (71,927 | ) | | | — | | | | — | |
| | | | | | | | |
Decrease in net assets resulting from dividends and distributions to Common Shareholders | | | (2,163,456 | ) | | | (2,251,012 | ) | | | (2,675,085 | ) | | | (2,749,158 | ) |
| | | | | | | | |
| | | | | | | | | | | | | | | | |
| Capital Share Transactions | | | | | | | | | | | | | | | | |
Reinvestment of common dividends | | | 54,801 | | | | 34,562 | | | | 165,299 | | | | 101,725 | |
| | | | | | | | |
| | | | | | | | | | | | | | | | |
| Net Assets Applicable to Common Shareholders | | | | | | | | | | | | | | | | |
Total increase (decrease) in net assets applicable to Common Shareholders | | | 4,974,918 | | | | (1,524,483 | ) | | | 4,758,957 | | | | (2,010,456 | ) |
Beginning of year | | | 33,752,584 | | | | 35,277,067 | | | | 41,398,621 | | | | 43,409,077 | |
| | | | | | | | |
End of year | | $ | 38,727,502 | | | $ | 33,752,584 | | | $ | 46,157,578 | | | $ | 41,398,621 | |
| | | | | | | | |
Undistributed net investment income | | $ | 678,200 | | | $ | 689,178 | | | $ | 627,501 | | | $ | 864,115 | |
| | | | | | | | |
| | | | | | |
| See Notes to Financial Statements. | | | | |
| | | | | | | |
| 46 | | ANNUAL REPORT | | AUGUST 31, 2012 | | |
| | |
| Statements of Changes in Net Assets | | |
| | | | | | | | | | | | | | | | |
| | | BlackRock New York Municipal
Income Quality Trust (BSE) | | | BlackRock New York
Municipal Income Trust II (BFY) | |
| | | Year Ended August 31, | | | Year Ended August 31, | |
| Increase (Decrease) in Net Assets Applicable to Common Shareholders: | | 2012 | | | 2011 | | | 2012 | | | 2011 | |
| | | | | | | | | | | | | | | | |
| Operations | | | | | | | | | | | | | | | | |
Net investment income | | $ | 5,226,896 | | | $ | 5,832,757 | | | $ | 4,569,910 | | | $ | 5,210,348 | |
Net realized gain (loss) | | | 141,369 | | | | (1,493,236 | ) | | | 465,364 | | | | (723,827 | ) |
Net change in unrealized appreciation/depreciation | | | 8,377,994 | | | | (2,872,102 | ) | | | 7,050,292 | | | | (2,654,238 | ) |
Dividends to AMPS Shareholders from net investment income | | | (10,041 | ) | | | (143,341 | ) | | | (10,777 | ) | | | (158,107 | ) |
| | | | | | | | |
Net increase in net assets applicable to Common Shareholders resulting from operations | | | 13,736,218 | | | | 1,324,078 | | | | 12,074,789 | | | | 1,674,176 | |
| | | | | | | | |
| | | | | | | | | | | | | | | | |
| Dividends to Common Shareholders From | | | | | | | | | | | | | | | | |
Net investment income | | | (5,571,369 | ) | | | (5,564,464 | ) | | | (4,948,459 | ) | | | (4,970,362 | ) |
| | | | | | | | |
| | | | | | | | | | | | | | | | |
| Capital Share Transactions | | | | | | | | | | | | | | | | |
Reinvestment of common dividends | | | 289,307 | | | | 34,961 | | | | 284,695 | | | | 240,851 | |
| | | | | | | | |
| | | | | | | | | | | | | | | | |
| Net Assets Applicable to Common Shareholders | | | | | | | | | | | | | | | | |
Total increase (decrease) in net assets applicable to Common Shareholders | | | 8,454,156 | | | | (4,205,425 | ) | | | 7,411,025 | | | | (3,055,335 | ) |
Beginning of year | | | 92,411,075 | | | | 96,616,500 | | | | 72,816,701 | | | | 75,872,036 | |
| | | | | | | | |
End of year | | $ | 100,865,231 | | | $ | 92,411,075 | | | $ | 80,227,726 | | | $ | 72,816,701 | |
| | | | | | | | |
Undistributed net investment income | | $ | 1,360,150 | | | $ | 1,703,993 | | | $ | 1,223,739 | | | $ | 1,541,081 | |
| | | | | | | | |
| | | | | | |
| See Notes to Financial Statements. | | | | |
| | | | | | | |
| | ANNUAL REPORT | | AUGUST 31, 2012 | | 47 |
| | |
| Statements of Changes in Net Assets | | |
| | | | | | | | | | | | | | | | |
| | | BlackRock Virginia
Municipal Bond Trust (BHV) | | | The Massachusetts Health &
Education Tax Exempt Trust (MHE) | |
| | | Year Ended August 31, | | | Year Ended August 31, | |
| Increase (Decrease) in Net Assets Applicable to Common Shareholders: | | 2012 | | | 2011 | | | 2012 | | | 2011 | |
| | | | | | | | | | | | | | | | |
| Operations | | | | | | | | | | | | | | | | |
Net investment income | | $ | 1,525,058 | | | $ | 1,604,189 | | | $ | 1,975,543 | | | $ | 2,107,267 | |
Net realized loss | | | (380,886 | ) | | | (218,047 | ) | | | (37,966 | ) | | | (292,136 | ) |
Net change in unrealized appreciation/depreciation | | | 2,656,857 | | | | (744,179 | ) | | | 3,226,643 | | | | (979,510 | ) |
Dividends and distributions to AMPS Shareholders from: | | | | | | | | | | | | | | | | |
Net investment income | | | (23,764 | ) | | | (39,517 | ) | | | (35,328 | ) | | | (65,696 | ) |
Net realized gain | | | — | | | | (3,012 | ) | | | — | | | | — | |
| | | | | | | | |
Net increase in net assets applicable to Common Shareholders resulting from operations | | | 3,777,265 | | | | 599,434 | | | | 5,128,892 | | | | 769,925 | |
| | | | | | | | |
| | | | | | | | | | | | | | | | |
| Dividends and Distributions to Common Shareholders From | | | | | | | | | | | | | | | | |
Net investment income | | | (1,564,750 | ) | | | (1,577,765 | ) | | | (1,961,643 | ) | | | (1,974,575 | ) |
Net realized gain | | | — | | | | (122,390 | ) | | | — | | | | — | |
| | | | | | | | |
Decrease in net assets resulting from dividends and distributions to Common Shareholders | | | (1,564,750 | ) | | | (1,700,155 | ) | | | (1,961,643 | ) | | | (1,974,575 | ) |
| | | | | | | | |
| | | | | | | | | | | | | | | | |
| Capital Share Transactions | | | | | | | | | | | | | | | | |
Reinvestment of common dividends | | | 98,340 | | | | 115,304 | | | | 73,963 | | | | 76,477 | |
| | | | | | | | |
| | | | | | | | | | | | | | | | |
| Net Assets Applicable to Common Shareholders | | | | | | | | | | | | | | | | |
Total increase (decrease) in net assets applicable to Common Shareholders | | | 2,310,855 | | | | (985,417 | ) | | | 3,241,212 | | | | (1,128,173 | ) |
Beginning of year | | | 24,155,382 | | | | 25,140,799 | | | | 30,610,713 | | | | 31,738,886 | |
| | | | | | | | |
End of year | | $ | 26,466,237 | | | $ | 24,155,382 | | | $ | 33,851,925 | | | $ | 30,610,713 | |
| | | | | | | | |
Undistributed net investment income | | $ | 406,669 | | | $ | 477,043 | | | $ | 609,532 | | | $ | 630,251 | |
| | | | | | | | |
| | | | | | |
| See Notes to Financial Statements. | | | | |
| | | | | | | |
| 48 | | ANNUAL REPORT | | AUGUST 31, 2012 | | |
| | | | | | | | | | | | | | | | |
| Year Ended August 31, 2012 | | BlackRock
Maryland
Municipal
Bond Trust
(BZM) | | | BlackRock
MuniHoldings
New York
Quality Fund, Inc.
(MHN) | | | BlackRock
New Jersey
Municipal
Bond Trust
(BLJ) | | | BlackRock New York Municipal Bond Trust (BQH) | |
| | | | | | | | | | | | | | | | |
| Cash Provided by (Used for) Operating Activities | | | | | | | | | | | | | | | | |
Net increase in net assets resulting from operations, excluding dividends to AMPS Shareholders | | $ | 4,009,779 | | | $ | 69,883,973 | | | $ | 7,122,920 | | | $ | 7,275,028 | |
Adjustments to reconcile net increase in net assets resulting from operations to net cash provided by (used for) operating activities: | | | | | | | | | | | | | | | | |
(Increase) decrease in interest receivable | | | 50,602 | | | | (80,018 | ) | | | (28,483 | ) | | | 68,841 | |
Decrease in income receivable — affiliated | | | 26 | | | | 311 | | | | 24 | | | | 25 | |
Decrease in cash pledged as collateral for financial futures contracts | | | 14,000 | | | | — | | | | 16,560 | | | | — | |
(Increase) decrease in prepaid expenses | | | 8,004 | | | | (23,042 | ) | | | 5,743 | | | | 6,497 | |
Decrease in other assets | | | 6,687 | | | | 78,403 | | | | 6,092 | | | | 6,346 | |
Decrease in variation margin receivable | | | 1,778 | | | | — | | | | 2,845 | | | | — | |
Increase in investment advisory fees payable | | | 3,592 | | | | 56,289 | | | | 6,527 | | | | 8,575 | |
Increase (decrease) in interest expense and fees payable | | | 330 | | | | (21,420 | ) | | | (221 | ) | | | 2,565 | |
Decrease in other accrued expenses payable | | | (33,199 | ) | | | (133,149 | ) | | | (39,902 | ) | | | (19,750 | ) |
Increase (decrease) in Officer’s and Trustees’ fees payable | | | 170 | | | | 31,235 | | | | 234 | | | | (1,223 | ) |
Net realized and unrealized gain on investments | | | (2,249,777 | ) | | | (43,711,265 | ) | | | (5,061,110 | ) | | | (4,994,282 | ) |
Amortization of premium and accretion of discount on investments | | | 58,376 | | | | 733,281 | | | | (61,328 | ) | | | (102,708 | ) |
Amortization of deferred offering costs | | | 626 | | | | 518,126 | | | | 626 | | | | 36,433 | |
Proceeds from sales of long-term investments | | | 14,030,025 | | | | 111,982,026 | | | | 14,163,170 | | | | 32,299,476 | |
Purchases of long-term investments | | | (18,003,386 | ) | | | (120,743,205 | ) | | | (16,946,633 | ) | | | (36,155,661 | ) |
Net proceeds from sales (purchases) of short-term securities | | | 3,167,763 | | | | 3,637,507 | | | | 359,943 | | | | (2,293,666 | ) |
| | | | |
Cash provided by (used for) operating activities | | | 1,065,396 | | | | 22,209,052 | | | | (452,993 | ) | | | (3,863,504 | ) |
| | | | |
| | | | | | | | | | | | | | | | |
| Cash Provided by (Used for) Financing Activities | | | | | | | | | | | | | | | | |
Cash receipts from issuance of VRDP Shares | | | 16,000,000 | | | | — | | | | 18,700,000 | | | | 22,100,000 | |
Cash payments on redemption of AMPS | | | (16,000,000 | ) | | | — | | | | (18,775,000 | ) | | | (22,125,000 | ) |
Cash receipts from TOB trust certificates | | | 899,847 | | | | 37,308,107 | | | | 2,734,505 | | | | 6,655,938 | |
Cash payments for TOB trust certificates | | | — | | | | (31,543,887 | ) | | | — | | | | — | |
Cash dividends paid to Common Shareholders | | | (1,885,024 | ) | | | (27,745,344 | ) | | | (2,120,001 | ) | | | (2,531,229 | ) |
Cash dividends paid to AMPS Shareholders | | | (33,369 | ) | | | — | | | | (39,661 | ) | | | (6,460 | ) |
Cash payments for offering costs | | | (46,850 | ) | | | (303,169 | ) | | | (46,850 | ) | | | (206,870 | ) |
Increase in bank overdraft | | | — | | | | 2,349 | | | | — | | | | — | |
| | | | |
Cash provided by (used for) financing activities | | | (1,065,396 | ) | | | (22,281,944 | ) | | | 452,993 | | | | 3,886,379 | |
| | | | |
| | | | | | | | | | | | | | | | |
| Cash | | | | | | | | | | | | | | | | |
Net increase (decrease) in cash | | | — | | | | (72,892 | ) | | | — | | | | 22,875 | |
Cash at beginning of year | | | — | | | | 72,892 | | | | — | | | | — | |
| | | | |
Cash at end of year | | | — | | | | — | | | | — | | | $ | 22,875 | |
| | | | |
| | | | | | | | | | | | | | | | |
| Cash Flow Information | | | | | | | | | | | | | | | | |
Cash paid during the year for interest and fees | | $ | 50,853 | | | $ | 1,484,128 | | | $ | 66,160 | | | $ | 93,927 | |
| | | | |
| | | | | | | | | | | | | | | | |
| Non-cash Financing Activities | | | | | | | | | | | | | | | | |
Capital shares issued in reinvestment of dividends paid to Common Shareholders | | $ | 76,471 | | | $ | 1,786,582 | | | $ | 54,801 | | | $ | 165,299 | |
| | | | |
A Statement of Cash Flows is presented when a Trust had a significant amount of borrowing during the year, based on the average borrowing outstanding in relation to average total assets.
| | | | | | |
| See Notes to Financial Statements. | | | | |
| | | | | | | |
| | ANNUAL REPORT | | AUGUST 31, 2012 | | 49 |
| | |
| Statements of Cash Flows (concluded) | | |
| | | | | | | | | | | | | | | | |
| Year Ended August 31, 2012 | | BlackRock New York Municipal Income
Quality Trust (BSE) | | | BlackRock New York Municipal Income Trust II (BFY) | | | BlackRock Virginia Municipal Bond Trust (BHV) | | | The
Massachusetts Health & Education Tax-Exempt Trust (MHE) | |
| | | | | | | | | | | | | | | | |
| Cash Provided by (Used for) Operating Activities | | | | | | | | | | | | | | | | |
Net increase in net assets resulting from operations, excluding dividends to AMPS Shareholders | | $ | 13,746,259 | | | $ | 12,085,566 | | | $ | 3,801,029 | | | $ | 5,164,220 | |
Adjustments to reconcile net increase in net assets resulting from operations to net cash provided by (used for) operating activities: | | | | | | | | | | | | | | | | |
(Increase) decrease in interest receivable | | | (131,273 | ) | | | (76,738 | ) | | | 32,556 | | | | (23,240 | ) |
Decrease in income receivable — affiliated | | | 18 | | | | 28 | | | | 16 | | | | — | |
Decrease in cash pledged as collateral for financial futures contracts | | | — | | | | — | | | | 14,000 | | | | 14,960 | |
Decrease in prepaid expenses | | | 22,951 | | | | 15,519 | | | | 8,076 | | | | 10,536 | |
Decrease in other assets | | | 4,515 | | | | 6,982 | | | | 4,042 | | | | — | |
Decrease in variation margin receivable | | | — | | | | — | | | | 1,777 | | | | 2,845 | |
Increase in investment advisory fees payable | | | 8,395 | | | | 11,683 | | | | 3,904 | | | | 1,609 | |
Increase (decrease) in interest expense and fees payable | | | 795 | | | | 2,348 | | | | (683 | ) | | | 248 | |
Decrease in other accrued expenses payable | | | (2,004 | ) | | | (18,008 | ) | | | (48,098 | ) | | | (10,621 | ) |
Increase (decrease) in Officer’s and Trustees’ fees payable | | | (30 | ) | | | (421 | ) | | | 66 | | | | (6 | ) |
Net realized and unrealized gain on investments | | | (8,811,358 | ) | | | (7,746,520 | ) | | | (2,377,338 | ) | | | (3,296,871 | ) |
Amortization of premium and accretion of discount on investments | | | 144,241 | | | | (86,693 | ) | | | 46,633 | | | | 83,844 | |
Amortization of deferred offering costs | | | 63,284 | | | | 68,782 | | | | 626 | | | | 709 | |
Proceeds from sales of long-term investments | | | 35,993,423 | | | | 31,339,547 | | | | 8,983,264 | | | | 8,502,633 | |
Purchases of long-term investments | | | (47,577,762 | ) | | | (40,117,961 | ) | | | (10,987,392 | ) | | | (9,803,524 | ) |
Net proceeds from sales (purchases) of short-term securities | | | 2,230,929 | | | | 2,144,431 | | | | 49,660 | | | | 681,949 | |
| | | | |
Cash provided by (used for) operating activities | | | (4,307,617 | ) | | | (2,371,455 | ) | | | (467,862 | ) | | | 1,329,291 | |
| | | | |
| | | | | | | | | | | | | | | | |
| Cash Provided by (Used for) Financing Activities | | | | | | | | | | | | | | | | |
Cash receipts from issuance of VRDP Shares | | | 40,500,000 | | | | 44,400,000 | | | | 11,600,000 | | | | 18,500,000 | |
Cash payments on redemption of AMPS | | | (40,575,000 | ) | | | (44,475,000 | ) | | | (11,675,000 | ) | | | (18,500,000 | ) |
Cash receipts from TOB trust certificates | | | 19,230,598 | | | | 7,431,319 | | | | 2,087,934 | | | | 670,000 | |
Cash payments for TOB trust certificates | | | (9,308,740 | ) | | | — | | | | — | | | | — | |
Cash dividends paid to Common Shareholders | | | (5,280,696 | ) | | | (4,674,676 | ) | | | (1,473,873 | ) | | | (1,904,999 | ) |
Cash dividends paid to AMPS Shareholders | | | (12,075 | ) | | | (13,378 | ) | | | (24,349 | ) | | | (35,942 | ) |
Cash payments for offering costs | | | (246,491 | ) | | | (248,009 | ) | | | (46,850 | ) | | | (58,350 | ) |
| | | | |
Cash provided by (used for) financing activities | | | 4,307,596 | | | | 2,420,256 | | | | 467,862 | | | | (1,329,291 | ) |
| | | | |
| | | | | | | | | | | | | | | | |
| Cash | | | | | | | | | | | | | | | | |
Net increase (decrease) in cash | | | (21 | ) | | | 48,801 | | | | — | | | | — | |
Cash at beginning of year | | | 21 | | | | — | | | | — | | | | — | |
| | | | |
Cash at end of year | | | — | | | $ | 48,801 | | | | — | | | | — | |
| | | | |
| | | | | | | | | | | | | | | | |
| Cash Flow Information | | | | | | | | | | | | | | | | |
Cash paid during the year for interest and fees | | $ | 240,327 | | | $ | 178,715 | | | $ | 53,498 | | | $ | 54,516 | |
| | | | |
| | | | | | | | | | | | | | | | |
| Non-cash Financing Activities | | | | | | | | | | | | | | | | |
Capital shares issued in reinvestment of dividends paid to Common Shareholders | | $ | 289,307 | | | $ | 284,695 | | | $ | 98,340 | | | $ | 73,963 | |
| | | | |
A Statement of Cash Flows is presented when a Trust had a significant amount of borrowing during the year, based on the average borrowing outstanding in relation to average total assets.
| | | | | | |
| See Notes to Financial Statements. | | | | |
| | | | | | | |
| 50 | | ANNUAL REPORT | | AUGUST 31, 2012 | | |
| | |
| Financial Highlights | | BlackRock Maryland Municipal Bond Trust (BZM) |
| | | | | | | | | | | | | | | | | | | | |
| | | Year Ended August 31, | |
| | | 2012 | | | 2011 | | | 2010 | | | 2009 | | | 2008 | |
| | | | | | | | | | | | | | | | | | | | |
| Per Share Operating Performance | | | | | | | | | | | | | | | | | | | | |
Net asset value, beginning of year | | $ | 14.61 | | | $ | 15.23 | | | $ | 13.81 | | | $ | 14.45 | | | $ | 14.91 | |
| | | | |
Net investment income1 | | | 0.90 | | | | 0.97 | | | | 1.02 | | | | 0.96 | | | | 1.07 | |
Net realized and unrealized gain (loss) | | | 1.05 | | | | (0.59 | ) | | | 1.29 | | | | (0.68 | ) | | | (0.36 | ) |
| Dividends and distributions to AMPS Shareholders from: | | | | | | | | | | | | | | | | | | | | |
Net investment income | | | (0.02 | ) | | | (0.03 | ) | | | (0.03 | ) | | | (0.13 | ) | | | (0.28 | ) |
Net realized gain | | | — | | | | (0.00 | )2 | | | — | | | | (0.00 | )2 | | | (0.01 | ) |
| | | | |
Net increase from investment operations | | | 1.93 | | | | 0.35 | | | | 2.28 | | | | 0.15 | | | | 0.42 | |
| | | | |
| Dividends and distributions to Common Shareholders from: | | | | | | | | | | | | | | | | | | | | |
Net investment income | | | (0.94 | ) | | | (0.95 | ) | | | (0.86 | ) | | | (0.79 | ) | | | (0.87 | ) |
Net realized gain | | | — | | | | (0.02 | ) | | | — | | | | (0.00 | )2 | | | (0.01 | ) |
| | | | |
Total dividends and distributions to Common Shareholders | | | (0.94 | ) | | | (0.97 | ) | | | (0.86 | ) | | | (0.79 | ) | | | (0.88 | ) |
| | | | |
Net asset value, end of year | | $ | 15.60 | | | $ | 14.61 | | | $ | 15.23 | | | $ | 13.81 | | | $ | 14.45 | |
| | | | |
Market price, end of year | | $ | 18.43 | | | $ | 15.02 | | | $ | 15.91 | | | $ | 15.35 | | | $ | 15.75 | |
| | | | |
| | | | | | | | | | | | | | | | | | | | |
| Total Investment Return Applicable to Common Shareholders3 | | | | | | | | | | | | | | | | | | | | |
Based on net asset value | | | 13.08% | | | | 2.45% | | | | 16.80% | | | | 1.52% | | | | 2.60% | |
| | | | |
Based on market price | | | 29.95% | | | | 0.83% | | | | 9.77% | | | | 3.53% | | | | (4.33)% | |
| | | | |
| | | | | | | | | | | | | | | | | | | | |
| Ratio to Average Net Assets Applicable to Common Shareholders | | | | | | | | | | | | | | | | | | | | |
Total expenses4 | | | 1.66% | | | | 1.58% | | | | 1.56% | | | | 1.83% | | | | 1.70% | |
| | | | |
Total expenses after fees waived and before fees paid indirectly4 | | | 1.60% | | | | 1.45% | | | | 1.35% | | | | 1.50% | | | | 1.32% | |
| | | | |
Total expenses after fees waived and paid indirectly4 | | | 1.60% | | | | 1.45% | | | | 1.35% | | | | 1.50% | | | | 1.32% | |
| | | | |
Total expenses after fees waived and paid indirectly and excluding interest expense, fees and amortization of offering costs4,5 | | | 1.44% | 6 | | | 1.41% | | | | 1.31% | | | | 1.39% | | | | 1.28% | |
| | | | |
Net investment income4 | | | 5.94% | | | | 6.73% | | | | 6.95% | | | | 7.62% | | | | 7.19% | |
| | | | |
Dividends to AMPS Shareholders | | | 0.10% | | | | 0.19% | | | | 0.21% | | | | 1.04% | | | | 1.89% | |
| | | | |
Net investment income to Common Shareholders | | | 5.84% | | | | 6.54% | | | | 6.74% | | | | 6.58% | | | | 5.30% | |
| | | | |
| | | | | | | | | | | | | | | | | | | | |
| Supplemental Data | | | | | | | | | | | | | | | | | | | | |
Net assets applicable to Common Shareholders, end of year (000) | | $ | 32,320 | | | $ | 30,203 | | | $ | 31,349 | | | $ | 28,310 | | | $ | 29,488 | |
| | | | |
AMPS Shares outstanding at $25,000 liquidation preference, end of year (000) | | | — | | | $ | 16,000 | | | $ | 16,000 | | | $ | 16,000 | | | $ | 16,000 | |
| | | | |
VRDP Shares outstanding at $100,000 liquidation value, end of year (000) | | $ | 16,000 | | | | — | | | | — | | | | — | | | | — | |
| | | | |
Portfolio turnover | | | 30% | | | | 11% | | | | 13% | | | | 9% | | | | 15% | |
| | | | |
Asset coverage per AMPS at $25,000 liquidation preference, end of year | | | — | | | $ | 72,192 | | | $ | 73,985 | | | $ | 69,235 | | | $ | 71,083 | |
| | | | |
Asset coverage per VRDP Share at $100,000 liquidation value, end of year | | $ | 302,003 | | | | — | | | | — | | | | — | | | | — | |
| | | | |
| 1 | | Based on average Common Shares outstanding. |
| 2 | | Amount is less than $(0.01) per share. |
| 3 | | Total investment returns based on market value, which can be significantly greater or lesser than the net asset value, may result in substantially different returns. Where applicable, total investment returns exclude the effects of any sales charges and include the reinvestment of dividends and distributions. |
| 4 | | Do not reflect the effect of dividends to AMPS Shareholders. |
| 5 | | Interest expense, fees and amortization of offering costs relate to TOBs and/or VRDP Shares. See Note 1 and Note 7 of the Notes to Financial Statements for details of municipal bonds transferred to TOBs and VRDP Shares, respectively. |
| 6 | | For the year ended August 31, 2012, the total expense ratio after fees waived and paid indirectly and excluding interest expense, fees, amortization of offering costs and remarketing fees was 1.40%. |
| | | | | | |
| See Notes to Financial Statements. | | | | |
| | | | | | | |
| | ANNUAL REPORT | | AUGUST 31, 2012 | | 51 |
| | |
| Financial Highlights | | BlackRock MuniHoldings New York Quality Fund, Inc. (MHN) |
| | | | | | | | | | | | | | | | | | | | |
| | | Year Ended August 31, | |
| | | 2012 | | | 2011 | | | 2010 | | | 2009 | | | 2008 | |
| | | | | | | | | | | | | | | | | | | | |
| Per Share Operating Performance | | | | | | | | | | | | | | | | | | | | |
Net asset value, beginning of year | | $ | 14.34 | | | $ | 15.09 | | | $ | 13.74 | | | $ | 13.92 | | | $ | 14.40 | |
| | | | |
Net investment income1 | | | 0.89 | | | | 0.97 | | | | 1.04 | | | | 0.94 | | | | 0.98 | |
Net realized and unrealized gain (loss) | | | 1.36 | | | | (0.73 | ) | | | 1.21 | | | | (0.30 | ) | | | (0.48 | ) |
Dividends to AMPS Shareholders from net investment income | | | — | | | | (0.03 | ) | | | (0.03 | ) | | | (0.14 | ) | | | (0.32 | ) |
| | | | |
Net increase from investment operations | | | 2.25 | | | | 0.21 | | | | 2.22 | | | | 0.50 | | | | 0.18 | |
| | | | |
Dividends to Common Shareholders from net investment income | | | (0.95 | ) | | | (0.96 | ) | | | (0.87 | ) | | | (0.68 | ) | | | (0.66 | ) |
| | | | |
Net asset value, end of year | | $ | 15.64 | | | $ | 14.34 | | | $ | 15.09 | | | $ | 13.74 | | | $ | 13.92 | |
| | | | |
Market price, end of year | | $ | 15.86 | | | $ | 13.90 | | | $ | 15.17 | | | $ | 12.89 | | | $ | 12.12 | |
| | | | |
| | | | | | | | | | | | | | | | | | | | |
| Total Investment Return Applicable to Common Shareholders2 | | | | | | | | | | | | | | | | | | | | |
Based on net asset value | | | 16.15% | | | | 1.85% | | | | 16.87% | | | | 5.19% | | | | 1.74% | |
| | | | |
Based on market price | | | 21.52% | | | | (1.80)% | | | | 25.24% | | | | 13.34% | | | | (5.72)% | |
| | | | |
| | | | | | | | | | | | | | | | | | | | |
| Ratios to Average Net Assets Applicable to Common Shareholders | | | | | | | | | | | | | | | | | | | | |
Total expenses | | | 1.95% | | | | 1.47% | 3 | | | 1.29% | 3 | | | 1.55% | 3 | | | 1.65% | 3 |
| | | | |
Total expenses after fees waived and before fees paid indirectly | | | 1.87% | | | | 1.36% | 3 | | | 1.14% | 3 | | | 1.35% | 3 | | | 1.52% | 3 |
| | | | |
Total expenses after fees waived and paid indirectly | | | 1.87% | | | | 1.36% | 3 | | | 1.14% | 3 | | | 1.35% | 3 | | | 1.52% | 3 |
| | | | |
Total expenses after fees waived and paid indirectly and excluding interest expense, fees and amortization of offering costs4 | | | 1.45% | 5 | | | 1.18% | 3 | | | 1.02% | 3 | | | 1.05% | 3 | | | 1.15% | 3 |
| | | | |
Net investment income | | | 5.89% | | | | 6.98% | 3 | | | 7.24% | 3 | | | 7.45% | 3 | | | 6.90% | 3 |
| | | | |
Dividends to AMPS Shareholders | | | — | | | | 0.19% | | | | 0.23% | | | | 1.09% | | | | 2.24% | |
| | | | |
Net investment income to Common Shareholders | | | 5.89% | | | | 6.79% | | | | 7.01% | | | | 6.36% | | | | 4.66% | |
| | | | |
| | | | | | | | | | | | | | | | | | | | |
| Supplemental Data | | | | | | | | | | | | | | | | | | | | |
Net assets applicable to Common Shareholders, end of year (000) | | $ | 485,454 | | | $ | 443,325 | | | $ | 464,853 | | | $ | 422,983 | | | $ | 428,547 | |
| | | | |
AMPS outstanding at $25,000 liquidation preference, end of year (000) | | | — | | | | — | | | $ | 243,625 | | | $ | 243,625 | | | $ | 252,875 | |
| | | | |
VRDP Shares outstanding at $100,000 liquidation value, end of year (000) | | $ | 243,600 | | | $ | 243,600 | | | | — | | | | — | | | | — | |
| | | | |
Portfolio turnover | | | 14% | | | | 18% | | | | 10% | | | | 18% | | | | 21% | |
| | | | |
Asset coverage per AMPS at $25,000 liquidation preference, end of year | | | — | | | | — | | | $ | 72,703 | | | $ | 68,407 | | | $ | 67,379 | |
| | | | |
Asset coverage per VRDP Share at $100,000 liquidation value, end of year | | $ | 299,283 | | | $ | 281,989 | | | | — | | | | — | | | | — | |
| | | | |
| 1 | | Based on average Common Shares outstanding. |
| 2 | | Total investment returns based on market value, which can be significantly greater or lesser than the net asset value, may result in substantially different returns. Where applicable, total investment returns exclude the effects of any sales charges and include the reinvestment of dividends and distributions. |
| 3 | | Do not reflect the effect of dividends to AMPS Shareholders. |
| 4 | | Interest expense, fees and amortization of offering costs relate to TOBs and/or VRDP Shares. See Note 1 and Note 7 of the Notes to Financial Statements for details of municipal bonds transferred to TOBs and VRDP Shares, respectively. |
| 5 | | For the year ended August 31, 2012, the total expense ratio after fees waived and paid indirectly and excluding interest expense, fees, amortization of offering costs, liquidity and remarketing fees was 1.02%. |
| | | | | | |
| See Notes to Financial Statements. | | | | |
| | | | | | | |
| 52 | | ANNUAL REPORT | | AUGUST 31, 2012 | | |
| | |
| Financial Highlights | | BlackRock New Jersey Municipal Bond Trust (BLJ) |
| | | | | | | | | | | | | | | | | | | | |
| | | Year Ended August 31, | |
| | | 2012 | | | 2011 | | | 2010 | | | 2009 | | | 2008 | |
| | | | | | | | | | | | | | | | | | | | |
| Per Share Operating Performance | | | | | | | | | | | | | | | | | | | | |
Net asset value, beginning of year | | $ | 14.55 | | | $ | 15.23 | | | $ | 13.53 | | | $ | 14.16 | | | $ | 15.38 | |
| | | | |
Net investment income1 | | | 0.95 | | | | 1.00 | | | | 1.05 | | | | 1.05 | | | | 1.14 | |
Net realized and unrealized gain (loss) | | | 2.12 | | | | (0.68 | ) | | | 1.61 | | | | (0.68 | ) | | | (1.11 | ) |
Dividends and distributions to AMPS Shareholders from: | | | | | | | | | | | | | | | | | | | | |
Net investment income | | | (0.02 | ) | | | (0.03 | ) | | | (0.03 | ) | | | (0.14 | ) | | | (0.29 | ) |
Net realized gain | | | — | | | | (0.00 | )2 | | | — | | | | — | | | | (0.00 | )2 |
| | | | |
Net increase (decrease) from investment operations | | | 3.05 | | | | 0.29 | | | | 2.63 | | | | 0.23 | | | | (0.26 | ) |
| | | | |
Dividends and distributions to Common Shareholders from: | | | | | | | | | | | | | | | | | | | | |
Net investment income | | | (0.93 | ) | | | (0.94 | ) | | | (0.93 | ) | | | (0.86 | ) | | | (0.95 | ) |
Net realized gain | | | — | | | | (0.03 | ) | | | — | | | | — | | | | (0.01 | ) |
| | | | |
Total dividends and distributions to Common Shareholders | | | (0.93 | ) | | | (0.97 | ) | | | (0.93 | ) | | | (0.86 | ) | | | (0.96 | ) |
| | | | |
Net asset value, end of year | | $ | 16.67 | | | $ | 14.55 | | | $ | 15.23 | | | $ | 13.53 | | | $ | 14.16 | |
| | | | |
Market price, end of year | | $ | 16.66 | | | $ | 13.60 | | | $ | 15.63 | | | $ | 13.59 | | | $ | 14.76 | |
| | | | |
| | | | | | | | | | | | | | | | | | | | |
| Total Investment Return Applicable to Common Shareholders3 | | | | | | | | | | | | | | | | | | | | |
Based on net asset value | | | 21.52% | | | | 2.46% | | | | 20.04% | | | | 2.50% | | | | (2.12)% | |
| | | | |
Based on market price | | | 29.94% | | | | (6.68)% | | | | 22.65% | | | | (1.23)% | | | | (7.15)% | |
| | | | |
| | | | | | | | | | | | | | | | | | | | |
| Ratio to Average Net Assets Applicable to Common Shareholders | | | | | | | | | | | | | | | | | | | | |
Total expenses4 | | | 1.65% | | | | 1.57% | | | | 1.54% | | | | 1.72% | | | | 1.67% | |
| | | | |
Total expenses after fees waived and before fees paid indirectly4 | | | 1.59% | | | | 1.43% | | | | 1.32% | | | | 1.36% | | | | 1.28% | |
| | | | |
Total expenses after fees waived and paid indirectly4 | | | 1.59% | | | | 1.43% | | | | 1.32% | | | | 1.36% | | | | 1.28% | |
| | | | |
Total expenses after fees waived and paid indirectly and excluding interest expense, fees and amortization of offering costs4,5 | | | 1.41% | 6 | | | 1.41% | | | | 1.31% | | | | 1.34% | | | | 1.26% | |
| | | | |
Net investment income4 | | | 6.01% | | | | 7.08% | | | | 7.32% | | | | 8.55% | | | | 7.64% | |
| | | | |
Dividends to AMPS Shareholders | | | 0.11% | | | | 0.20% | | | | 0.24% | | | | 1.14% | | | | 1.97% | |
| | | | |
Net investment income to Common Shareholders | | | 5.90% | | | | 6.88% | | | | 7.08% | | | | 7.41% | | | | 5.67% | |
| | | | |
| | | | | | | | | | | | | | | | | | | | |
| Supplemental Data | | | | | | | | | | | | | | | | | | | | |
Net assets applicable to Common Shareholders, end of year (000) | | $ | 38,728 | | | $ | 33,753 | | | $ | 35,277 | | | $ | 31,239 | | | $ | 32,584 | |
| | | | |
AMPS outstanding at $25,000 liquidation preference, end of year (000) | | | — | | | $ | 18,775 | | | $ | 18,775 | | | $ | 18,775 | | | $ | 19,200 | |
| | | | |
VRDP Shares outstanding at $100,000 liquidation value, end of year (000) | | $ | 18,700 | | | | — | | | | — | | | | — | | | | — | |
| | | | |
Portfolio turnover | | | 25% | | | | 19% | | | | 18% | | | | 28% | | | | 17% | |
| | | | |
Asset coverage per AMPS at $25,000 liquidation preference, end of year | | | — | | | $ | 69,944 | | | $ | 71,974 | | | $ | 66,600 | | | $ | 67,439 | |
| | | | |
Asset coverage per VRDP Share at $100,000 liquidation value, end of year | | $ | 307,099 | | | | — | | | | — | | | | — | | | | — | |
| | | | |
| 1 | | Based on average Common Shares outstanding. |
| 2 | | Amount is less than $(0.01) per share. |
| 3 | | Total investment returns based on market value, which can be significantly greater or lesser than the net asset value, may result in substantially different returns. Where applicable, total investment returns exclude the effects of any sales charges and include the reinvestment of dividends and distributions. |
| 4 | | Do not reflect the effect of dividends to AMPS Shareholders. |
| 5 | | Interest expense, fees and amortization of offering costs relate to TOBs and/or VRDP Shares. See Note 1 and Note 7 of the Notes to Financial Statements for details of municipal bonds transferred to TOBs and VRDP Shares, respectively. |
| 6 | | For the year ended August 31, 2012, the total expense ratio after fees waived and paid indirectly and excluding interest expense, fees, amortization of offering costs and remarketing fees was 1.34% |
| | | | | | |
| See Notes to Financial Statements. | | | | |
| | | | | | | |
| | ANNUAL REPORT | | AUGUST 31, 2012 | | 53 |
| | |
| Financial Highlights | | BlackRock New York Municipal Bond Trust (BQH) |
| | | | | | | | | | | | | | | | | | | | |
| | | Year Ended August 31, | |
| | | 2012 | | | 2011 | | | 2010 | | | 2009 | | | 2008 | |
| | | | | | | | | | | | | | | | | | | | |
| Per Share Operating Performance | | | | | | | | | | | | | | | | | | | | |
Net asset value, beginning of year | | $ | 14.89 | | | $ | 15.65 | | | $ | 14.56 | | | $ | 14.71 | | | $ | 15.39 | |
| | | | |
Net investment income1 | | | 0.87 | | | | 1.04 | | | | 1.07 | | | | 1.08 | | | | 1.14 | |
Net realized and unrealized gain (loss) | | | 1.73 | | | | (0.78 | ) | | | 1.09 | | | | (0.24 | ) | | | (0.57 | ) |
Dividends and distributions to AMPS Shareholders from: | | | | | | | | | | | | | | | | | | | | |
Net investment income | | | (0.00 | )2 | | | (0.03 | ) | | | (0.03 | ) | | | (0.14 | ) | | | (0.29 | ) |
Net realized gain | | | — | | | | (0.00 | )2 | | | (0.01 | ) | | | (0.00 | )2 | | | (0.01 | ) |
| | | | |
Net increase from investment operations | | | 2.60 | | | | 0.23 | | | | 2.12 | | | | 0.70 | | | | 0.27 | |
| | | | |
Dividends to Common Shareholders from: | | | | | | | | | | | | | | | | | | | | |
Net investment income | | | (0.96 | ) | | | (0.99 | ) | | | (0.94 | ) | | | (0.85 | ) | | | (0.93 | ) |
Net realized gain | | | — | | | | (0.00 | )2 | | | (0.09 | ) | | | (0.00 | )2 | | | (0.02 | ) |
| | | | |
Total dividends and distributions to Common Shareholders | | | (0.96 | ) | | | (0.99 | ) | | | (1.03 | ) | | | (0.85 | ) | | | (0.95 | ) |
| | | | |
Net asset value, end of year | | $ | 16.53 | | | $ | 14.89 | | | $ | 15.65 | | | $ | 14.56 | | | $ | 14.71 | |
| | | | |
Market price, end of year | | $ | 16.56 | | | $ | 14.83 | | | $ | 15.79 | | | $ | 14.32 | | | $ | 14.62 | |
| | | | |
| | | | | | | | | | | | | | | | | | | | |
| Total Investment Return Applicable to Common Shareholders3 | | | | | | | | | | | | | | | | | | | | |
Based on net asset value | | | 17.99% | | | | 1.81% | | | | 15.18% | | | | 5.97% | | | | 1.62% | |
| | | | |
Based on market price | | | 18.68% | | | | 0.50% | | | | 18.15% | | | | 4.87% | | | | (4.76)% | |
| | | | |
| | | | | | | | | | | | | | | | | | | | |
| Ratios to Average Net Assets Applicable to Common Shareholders | | | | | | | | | | | | | | | | | | | | |
Total expenses4 | | | 2.26% | | | | 1.50% | | | | 1.49% | | | | 1.61% | | | | 1.63% | |
| | | | |
Total expenses after fees waived and before fees paid indirectly4 | | | 2.20% | | | | 1.37% | | | | 1.27% | | | | 1.30% | | | | 1.25% | |
| | | | |
Total expenses after fees waived and paid indirectly4 | | | 2.20% | | | | 1.37% | | | | 1.27% | | | | 1.30% | | | | 1.25% | |
| | | | |
Total expenses after fees waived and paid indirectly and excluding interest expense, fees and amortization of offering costs4,5 | | | 1.90% | 6 | | | 1.36% | | | | 1.24% | | | | 1.25% | | | | 1.23% | |
| | | | |
Net investment income4 | | | 5.52% | | | | 7.12% | | | | 7.07% | | | | 8.06% | | | | 7.45% | |
| | | | |
Dividends to AMPS Shareholders | | | 0.02% | | | | 0.19% | | | | 0.19% | | | | 1.01% | | | | 1.90% | |
| | | | |
Net investment income to Common Shareholders | | | 5.50% | | | | 6.93% | | | | 6.88% | | | | 7.05% | | | | 5.55% | |
| | | | |
| | | | | | | | | | | | | | | | | | | | |
| Supplemental Data | | | | | | | | | | | | | | | | | | | | |
Net assets applicable to Common Shareholders, end of year (000) | | $ | 46,158 | | | $ | 41,399 | | | $ | 43,409 | | | $ | 40,204 | | | $ | 40,603 | |
| | | | |
AMPS outstanding at $25,000 liquidation preference, end of year (000) | | | — | | | $ | 22,125 | | | $ | 22,125 | | | $ | 22,125 | | | $ | 22,400 | |
| | | | |
VRDP Shares outstanding at $100,000 liquidation value, end of year (000) | | $ | 22,100 | | | | — | | | | — | | | | — | | | | — | |
| | | | |
Portfolio turnover | | | 45% | | | | 14% | | | | 22% | | | | 30% | | | | 19% | |
| | | | |
Asset coverage per AMPS at $25,000 liquidation preference, end of year | | | — | | | $ | 71,778 | | | $ | 74,052 | | | $ | 70,431 | | | $ | 70,327 | |
| | | | |
Asset coverage per VRDP Share at $100,000 liquidation value, end of year | | $ | 308,858 | | | | — | | | | — | | | | — | | | | — | |
| | | | |
| 1 | | Based on average Common Shares outstanding. |
| 2 | | Amount is less than $(0.01) per share. |
| 3 | | Total investment returns based on market value, which can be significantly greater or lesser than the net asset value, may result in substantially different returns. Where applicable, total investment returns exclude the effects of any sales charges and include the reinvestment of dividends and distributions. |
| 4 | | Do not reflect the effect of dividends to AMPS Shareholders. |
| 5 | | Interest expense, fees and amortization of offering costs relate to TOBs and/or VRDP Shares. See Note 1 and Note 7 of the Notes to Financial Statements for details of municipal bonds transferred to TOBs and VRDP Shares, respectively. |
| 6 | | For the year ended August 31, 2012, the total expense ratio after fees waived and paid indirectly and excluding interest expense, fees, amortization of offering costs, liquidity and remarketing fees was 1.45%. |
| | | | | | |
| See Notes to Financial Statements. | | | | |
| | | | | | | |
| 54 | | ANNUAL REPORT | | AUGUST 31, 2012 | | |
| | |
| Financial Highlights | | BlackRock New York Municipal Income Quality Trust (BSE) |
| | | | | | | | | | | | | | | | | | | | |
| | | Year Ended August 31, | |
| | | 2012 | | | 2011 | | | 2010 | | | 2009 | | | 2008 | |
| | | | | | | | | | | | | | | | | | | | |
| Per Share Operating Performance | | | | | | | | | | | | | | | | | | | | |
Net asset value, beginning of year | | $ | 14.25 | | | $ | 14.90 | | | $ | 13.61 | | | $ | 13.95 | | | $ | 14.58 | |
| | | | |
Net investment income1 | | | 0.81 | | | | 0.90 | | | | 0.91 | | | | 0.88 | | | | 0.96 | |
Net realized and unrealized gain (loss) | | | 1.31 | | | | (0.67 | ) | | | 1.23 | | | | (0.39 | ) | | | (0.60 | ) |
| Dividends and distributions to AMPS Shareholders from: | | | | |
Net investment income | | | (0.00 | )2 | | | (0.02 | ) | | | (0.03 | ) | | | (0.11 | ) | | | (0.25 | ) |
Net realized gain | | | — | | | | — | | | | — | | | | — | | | | (0.01 | ) |
| | | | |
Net increase (decrease) from investment operations | | | 2.12 | | | | 0.21 | | | | 2.11 | | | | 0.38 | | | | 0.10 | |
| | | | |
| Dividends and distributions to Common Shareholders from: | | | | | | | | | | | | | | | | | | | | |
Net investment income | | | (0.86 | ) | | | (0.86 | ) | | | (0.82 | ) | | | (0.72 | ) | | | (0.70 | ) |
Net realized gain | | | — | | | | — | | | | — | | | | — | | | | (0.03 | ) |
| | | | |
Total dividends and distributions to Common Shareholders | | | (0.86 | ) | | | (0.86 | ) | | | (0.82 | ) | | | (0.72 | ) | | | (0.73 | ) |
| | | | |
Net asset value, end of year | | $ | 15.51 | | | $ | 14.25 | | | $ | 14.90 | | | $ | 13.61 | | | $ | 13.95 | |
| | | | |
Market price, end of year | | $ | 15.74 | | | $ | 13.54 | | | $ | 14.91 | | | $ | 13.15 | | | $ | 13.26 | |
| | | | |
| | | | | | | | | | | | | | | | | | | | |
| Total Investment Return Applicable to Common Shareholders3 | | | | | | | | | | | | | | | | | | | | |
Based on net asset value | | | 15.23% | | | | 1.94% | | | | 16.04% | | | | 3.98% | | | | 0.80% | |
| | | | |
Based on market price | | | 23.07% | | | | (3.20)% | | | | 20.18% | | | | 5.70% | | | | (1.07)% | |
| | | | |
| | | | | | | | | | | | | | | | | | | | |
| Ratios to Average Net Assets Applicable to Common Shareholders | | | | | | | | | | | | | | | | | | | | |
Total expenses4 | | | 1.82% | | | | 1.28% | | | | 1.21% | | | | 1.53% | | | | 1.34% | |
| | | | |
Total expenses after fees waived and before paid indirectly4 | | | 1.82% | | | | 1.26% | | | | 1.12% | | | | 1.33% | | | | 1.09% | |
| | | | |
Total expenses after fees waived and paid indirectly4 | | | 1.82% | | | | 1.26% | | | | 1.12% | | | | 1.33% | | | | 1.09% | |
| | | | |
Total expenses after fees waived and paid indirectly and excluding interest expense, fees and amortization of offering costs4,5 | | | 1.50% | 6 | | | 1.17% | | | | 1.03% | | | | 1.05% | | | | 0.99% | |
| | | | |
Net investment income4 | | | 5.38% | | | | 6.50% | | | | 6.45% | | | | 7.16% | | | | 6.59% | |
| | | | |
Dividends to AMPS Shareholders | | | 0.01% | | | | 0.16% | | | | 0.18% | | | | 0.88% | | | | 1.74% | |
| | | | |
Net investment income to Common Shareholders | | | 5.37% | | | | 6.34% | | | | 6.27% | | | | 6.28% | | | | 4.85% | |
| | | | |
| | | | | | | | | | | | | | | | | | | | |
| Supplemental Data | | | | | | | | | | | | | | | | | | | | |
Net assets applicable to Common Shareholders, end of year (000) | | $ | 100,865 | | | $ | 92,411 | | | $ | 96,617 | | | $ | 88,141 | | | $ | 90,331 | |
| | | | |
AMPS outstanding at $25,000 liquidation preference, end of year (000) | | | — | | | $ | 40,575 | | | $ | 40,575 | | | $ | 40,575 | | | $ | 41,675 | |
| | | | |
VRDP Shares outstanding at $100,000 liquidation value, end of period (000) | | $ | 40,500 | | | | — | | | | — | | | | — | | | | — | |
| | | | |
Portfolio turnover | | | 24% | | | | 24% | | | | 8% | | | | 23% | | | | 24% | |
| | | | |
Asset coverage per AMPS at $25,000 liquidation preference, end of year | | | — | | | $ | 81,938 | | | $ | 84,531 | | | $ | 79,309 | | | $ | 79,196 | |
| | | | |
Asset coverage per VRDP Share at $100,000 liquidation value, end of period | | $ | 349,050 | | | | — | | | | — | | | | — | | | | — | |
| | | | |
| 1 | | Based on average Common Shares outstanding. |
| 2 | | Amount is less than $(0.01) per share. |
| 3 | | Total investment returns based on market value, which can be significantly greater or lesser than the net asset value, may result in substantially different returns. Where applicable, total investment returns exclude the effects of any sales charges and include the reinvestment of dividends and distributions. |
| 4 | | Do not reflect the effect of dividends to AMPS Shareholders. |
| 5 | | Interest expense, fees and amortization of offering costs relate to TOBs and/or VRDP Shares. See Note 1 and Note 7 of the Notes to Financial Statements for details of municipal bonds transferred to TOBs and VRDP Shares, respectively. |
| 6 | | For the year ended August 31, 2012, the total expense ratio after fees waived and paid indirectly and excluding interest expense, fees, amortization of offering costs, liquidity and remarketing fees was 1.13%. |
| | | | | | |
| See Notes to Financial Statements. | | | | |
| | | | | | | |
| | ANNUAL REPORT | | AUGUST 31, 2012 | | 55 |
| | |
| Financial Highlights | | BlackRock New York Municipal Income Trust II (BFY) |
| | | | | | | | | | | | | | | | | | | | |
| | | Year Ended August 31, | |
| | | 2012 | | | 2011 | | | 2010 | | | 2009 | | | 2008 | |
| | | | | | | | | | | | | | | | | | | | |
| Per Share Operating Performance | | | | | | | | | | | | | | | | | | | | |
Net asset value, beginning of year | | $ | 14.66 | | | $ | 15.33 | | | $ | 14.03 | | | $ | 14.28 | | | $ | 14.84 | |
| | | | |
Net investment income1 | | | 0.92 | | | | 1.05 | | | | 1.06 | | | | 1.06 | | | | 1.08 | |
Net realized and unrealized gain (loss) | | | 1.50 | | | | (0.69 | ) | | | 1.25 | | | | (0.36 | ) | | | (0.55 | ) |
| Dividends and distributions to AMPS Shareholders from: | | | | | | | | | | | | | | | | | | | | |
Net investment income | | | (0.00 | )2 | | | (0.03 | ) | | | (0.04 | ) | | | (0.15 | ) | | | (0.29 | ) |
Net realized gain | | | — | | | | — | | | | — | | | | — | | | | (0.01 | ) |
| | | | |
Net increase from investment operations | | | 2.42 | | | | 0.33 | | | | 2.27 | | | | 0.55 | | | | 0.23 | |
| | | | |
| Dividends and distributions to Common Shareholders from: | | | | | | | | | | | | | | | | | | | | |
Net investment income | | | (0.99 | ) | | | (1.00 | ) | | | (0.97 | ) | | | (0.80 | ) | | | (0.77 | ) |
Net realized gain | | | — | | | | — | | | | — | | | | — | | | | (0.02 | ) |
| | | | |
Total dividends and distributions to Common Shareholders | | | (0.99 | ) | | | (1.00 | ) | | | (0.97 | ) | | | (0.80 | ) | | | (0.79 | ) |
| | | | |
Net asset value, end of year | | $ | 16.09 | | | $ | 14.66 | | | $ | 15.33 | | | $ | 14.03 | | | $ | 14.28 | |
| | | | |
Market price, end of year | | $ | 16.81 | | | $ | 14.38 | | | $ | 15.48 | | | $ | 14.00 | | | $ | 13.60 | |
| | | | |
| | | | | | | | | | | | | | | | | | | | |
| Total Investment Return Applicable to Common Shareholders3 | | | | | | | | | | | | | | | | | | | | |
Based on net asset value | | | 17.00% | | | | 2.56% | | | | 16.69% | | | | 5.23% | | | | 1.70% | |
| | | | |
Based on market price | | | 24.61% | | | | (0.37)% | | | | 18.09% | | | | 10.26% | | | | 1.08% | |
| | | | |
| | | | | | | | | | | | | | | | | | | | |
| Ratios to Average Net Assets Applicable to Common Shareholders | | | | | | | | | | | | | | | | | | | | |
Total expenses4 | | | 2.03% | | | | 1.27% | | | | 1.21% | | | | 1.33% | | | | 1.30% | |
| | | | |
Total expenses after fees waived and before fees paid indirectly4 | | | 1.95% | | | | 1.18% | | | | 1.13% | | | | 1.16% | | | | 1.13% | |
| | | | |
Total expenses after fees waived and paid indirectly4 | | | 1.95% | | | | 1.18% | | | | 1.13% | | | | 1.16% | | | | 1.13% | |
| | | | |
Total expenses after fees waived and paid indirectly and excluding interest expense, fees and amortization of offering costs4,5 | | | 1.62% | 6 | | | 1.18% | | | | 1.13% | | | | 1.16% | | | | 1.13% | |
| | | | |
Net investment income4 | | | 5.96% | | | | 7.34% | | | | 7.21% | | | | 8.17% | | | | 7.33% | |
| | | | |
Dividends to AMPS Shareholders | | | 0.01% | | | | 0.22% | | | | 0.25% | | | | 1.19% | | | | 1.94% | |
| | | | |
Net investment income to Common Shareholders | | | 5.95% | | | | 7.12% | | | | 6.96% | | | | 6.98% | | | | 5.39% | |
| | | | |
| | | | | | | | | | | | | | | | | | | | |
| Supplemental Data | | | | | | | | | | | | | | | | | | | | |
Net assets applicable to Common Shareholders, end of year (000) | | $ | 80,228 | | | $ | 72,817 | | | $ | 75,872 | | | $ | 69,315 | | | $ | 70,544 | |
| | | | |
AMPS outstanding at $25,000 liquidation preference, end of year (000) | | | — | | | $ | 44,475 | | | $ | 44,475 | | | $ | 44,475 | | | $ | 44,650 | |
| | | | |
VRDP Shares outstanding at $100,000 liquidation value, end of year (000) | | $ | 44,400 | | | | — | | | | — | | | | — | | | | — | |
| | | | |
Portfolio turnover | | | 25% | | | | 20% | | | | 16% | | | | 16% | | | | 12% | |
| | | | |
Asset coverage per AMPS at $25,000 liquidation preference, end of year | | | — | | | $ | 65,931 | | | $ | 67,651 | | | $ | 63,965 | | | $ | 64,508 | |
| | | | |
Asset coverage per VRDP Share at $100,000 liquidation value, end of year | | $ | 280,693 | | | | — | | | | — | | | | — | | | | — | |
| | | | |
| 1 | | Based on average Common Shares outstanding. |
| 2 | | Amount is less than $(0.01) per share. |
| 3 | | Total investment returns based on market value, which can be significantly greater or lesser than the net asset value, may result in substantially different returns. Where applicable, total investment returns exclude the effects of any sales charges and include the reinvestment of dividends and distributions. |
| 4 | | Do not reflect the effect of dividends to AMPS Shareholders. |
| 5 | | Interest expense, fees and amortization of offering costs relate to TOBs and/or VRDP Shares. See Note 1 and Note 7 of the Notes to Financial Statements for details of municipal bonds transferred to TOBs and VRDP Shares, respectively. |
| 6 | | For the year ended August 31, 2012, the total expense ratio after fees waived and paid indirectly and excluding interest expense, fees, amortization of offering costs, liquidity and remarketing fees was 1.11%. |
| | | | | | |
| See Notes to Financial Statements. | | | | |
| | | | | | | |
| 56 | | ANNUAL REPORT | | AUGUST 31, 2012 | | |
| | |
| Financial Highlights | | BlackRock Virginia Municipal Bond Trust (BHV) |
| | | | | | | | | | | | | | | | | | | | |
| | | Year Ended August 31, | |
| | | 2012 | | | 2011 | | | 2010 | | | 2009 | | | 2008 | |
| | | | | | | | | | | | | | | | | | | | |
| Per Share Operating Performance | | | | | | | | | | | | | | | | | |
Net asset value, beginning of year | | $ | 15.33 | | | $ | 16.02 | | | $ | 15.05 | | | $ | 15.03 | | | $ | 15.57 | |
| | | | |
Net investment income1 | | | 0.97 | | | | 1.02 | | | | 1.04 | | | | 1.02 | | | | 1.11 | |
Net realized and unrealized gain (loss) | | | 1.45 | | | | (0.60 | ) | | | 1.19 | | | | 0.20 | | | | (0.45 | ) |
| Dividends and distributions to AMP Shareholders from: | | | | | | | | | | | | | | | | | | | | |
Net investment income | | | (0.02 | ) | | | (0.03 | ) | | | (0.02 | ) | | | (0.10 | ) | | | (0.30 | ) |
Net realized gain | | | — | | | | (0.00 | )2 | | | (0.01 | ) | | | (0.05 | ) | | | — | |
| | | | |
Net increase from investment operations | | | 2.40 | | | | 0.39 | | | | 2.20 | | | | 1.07 | | | | 0.36 | |
| | | | |
| Dividends and distributions to Common Shareholders from: | | | | | | | | | | | | | | | | | | | | |
Net investment income | | | (0.99 | ) | | | (1.00 | ) | | | (0.96 | ) | | | (0.89 | ) | | | (0.90 | ) |
Net realized gain | | | — | | | | (0.08 | ) | | | (0.27 | ) | | | (0.16 | ) | | | — | |
| | | | |
Total dividends and distributions to Common Shareholders | | | (0.99 | ) | | | (1.08 | ) | | | (1.23 | ) | | | (1.05 | ) | | | (0.90 | ) |
| | | | |
Net asset value, end of year | | $ | 16.74 | | | $ | 15.33 | | | $ | 16.02 | | | $ | 15.05 | | | $ | 15.03 | |
| | | | |
Market price, end of year | | $ | 19.58 | | | $ | 17.77 | | | $ | 18.77 | | | $ | 17.50 | | | $ | 19.50 | |
| | | | |
| | | | | | | | | | | | | | | | | | | | |
| Total Investment Return Applicable to Common Shareholders3 | | | | | | | | | | | | | | | | | |
Based on net asset value | | | 15.19% | | | | 1.98% | | | | 14.15% | | | | 6.94% | | | | 1.59% | |
| | | | |
Based on market price | | | 16.23% | | | | 0.89% | | | | 15.02% | | | | (4.16)% | | | | 14.97% | |
| | | | |
| | | | | | | | | | | | | | | | | | | | |
| Ratios to Average Net Assets Applicable to Common Shareholders | | | | | | | | | | | | | | | | | |
Total expenses4 | | | 1.69% | | | | 1.66% | | | | 1.57% | | | | 1.75% | | | | 1.70% | |
| | | | |
Total expenses after fees waived and before fees paid indirectly4 | | | 1.64% | | | | 1.52% | | | | 1.36% | | | | 1.45% | | | | 1.34% | |
| | | | |
Total expenses after fees waived and paid indirectly4 | | | 1.64% | | | | 1.52% | | | | 1.36% | | | | 1.45% | | | | 1.34% | |
| | | | |
Total expenses after fees waived and paid indirectly and excluding interest expense, fees and amortization of offering costs4,5 | | | 1.43% | 6 | | | 1.44% | | | | 1.31% | | | | 1.37% | | | | 1.31% | |
| | | | |
Net investment income4 | | | 6.03% | | | | 6.81% | | | | 6.71% | | | | 7.43% | | | | 7.14% | |
| | | | |
Dividends to AMPS Shareholders | | | 0.09% | | | | 0.17% | | | | 0.16% | | | | 0.72% | | | | 1.90% | |
| | | | |
Net investment income to Common Shareholders | | | 5.94% | | | | 6.64% | | | | 6.55% | | | | 6.71% | | | | 5.24% | |
| | | | |
| | | | | | | | | | | | | | | | | | | | |
| Supplemental Data | | | | | | | | | | | | | | | | | |
Net assets applicable to Common Shareholders, end of year (000) | | $ | 26,466 | | | $ | 24,155 | | | $ | 25,141 | | | $ | 23,483 | | | $ | 23,347 | |
| | | | |
AMPS outstanding at $25,000 liquidation preference, end of year (000) | | | — | | | $ | 11,675 | | | $ | 11,675 | | | $ | 11,675 | | | $ | 12,175 | |
| | | | |
VRDP Shares outstanding at $100,000 liquidation value, end of year (000) | | $ | 11,600 | | | | — | | | | — | | | | — | | | | — | |
| | | | |
Portfolio turnover | | | 23% | | | | 12% | | | | 26% | | | | 32% | | | | 11% | |
| | | | |
Asset coverage per AMPS at $25,000 liquidation preference, end of year | | | — | | | $ | 76,725 | | | $ | 78,836 | | | $ | 75,286 | | | $ | 72,948 | |
| | | | |
Asset coverage per VRDP Share at $100,000 liquidation value, end of year | | $ | 328,157 | | | | — | | | | — | | | | — | | | | — | |
| | | | |
| 1 | | Based on average Common Shares outstanding. |
| 2 | | Amount is less than $(0.01) per share. |
| 3 | | Total investment returns based on market value, which can be significantly greater or lesser than the net asset value, may result in substantially different returns. Where applicable, total investment returns exclude the effects of any sales charges and include the reinvestment of dividends and distributions. |
| 4 | | Do not reflect the effect of dividends to AMPS Shareholders. |
| 5 | | Interest expense, fees and amortization of offering costs relate to TOBs and/or VRDP Shares. See Note 1 and Note 7of the Notes to Financial Statements for details of municipal bonds transferred to TOBs and VRDP Shares, respectively. |
| 6 | | For the year ended August 31, 2012, the total expense ratio after fees waived and paid indirectly and excluding interest expense, fees, amortization of offering costs and remarketing fees was 1.38%. |
| | | | | | |
| See Notes to Financial Statements. | | | | |
| | | | | | | |
| | ANNUAL REPORT | | AUGUST 31, 2012 | | 57 |
| | |
| Financial Highlights | | The Massachusetts Health & Education Tax-Exempt Trust (MHE) |
| | | | | | | | | | | | | | | | | | | | | | | | |
| | | Year Ended August 31, 2012 | | | Period January 1, 2008
to August 31, 2008 | | | Year Ended
December 31, 2007 | |
| | | 2012 | | | 2011 | | | 2010 | | | 2009 | | | |
| | | | | | | | | | | | | | | | | | | | | | | | |
| Per Share Operating Performance | | | | | | | | | | | | | | | | | | | | | | | | |
Net asset value, beginning of period | | $ | 13.01 | | | $ | 13.52 | | | $ | 12.19 | | | $ | 12.55 | | | $ | 13.10 | | | $ | 13.90 | |
| | | | |
Net investment income1 | | | 0.84 | | | | 0.90 | | | | 0.89 | | | | 0.83 | | | | 0.59 | | | | 0.92 | |
Net realized and unrealized gain (loss) | | | 1.34 | | | | (0.54 | ) | | | 1.31 | | | | (0.43 | ) | | | (0.58 | ) | | | (0.82 | ) |
Dividends to AMPS Shareholders from net investment income | | | (0.01 | ) | | | (0.03 | ) | | | (0.03 | ) | | | (0.13 | ) | | | (0.17 | ) | | | (0.31 | ) |
| | | | |
Net increase (decrease) from investment operations | | | 2.17 | | | | 0.33 | | | | 2.17 | | | | 0.27 | | | | (0.16 | ) | | | (0.21 | ) |
| | | | |
| Dividends and distributions to Common Shareholders from: | | | | | | | | | | | | | | | | | | | | | | | | |
Net investment income | | | (0.83 | ) | | | (0.84 | ) | | | (0.84 | ) | | | (0.63 | ) | | | (0.39 | ) | | | (0.59 | ) |
Net realized gain | | | — | | | | — | | | | — | | | | — | | | | — | | | | (0.00 | )2 |
| | | | |
Total dividends and distributions to Common Shareholders | | | (0.83 | ) | | | (0.84 | ) | | | (0.84 | ) | | | (0.63 | ) | | | (0.39 | ) | | | (0.59 | ) |
| | | | |
Net asset value, end of period | | $ | 14.35 | | | $ | 13.01 | | | $ | 13.52 | | | $ | 12.19 | | | $ | 12.55 | | | $ | 13.10 | |
| | | | |
Market price, end of period | | $ | 14.91 | | | $ | 13.11 | | | $ | 13.98 | | | $ | 12.00 | | | $ | 11.22 | | | $ | 11.95 | |
| | | | |
| | | | | | | | | | | | | | | | | | | | | | | | |
| Total Investment Return Applicable to Common Shareholders3 | | | | | | | | | | | | | | | | | | | | | | | | |
Based on net asset value | | | 17.02% | | | | 2.78% | | | | 18.40% | | | | 3.29% | | | | (1.01 | )%4 | | | (1.23)% | |
| | | | |
Based on market price | | | 20.66% | | | | 0.16% | | | | 24.37% | | | | 13.73% | | | | (2.99 | )%4 | | | (4.40)% | |
| | | | |
| | | | | | | | | | | | | | | | | | | | | | | | |
| Ratios to Average Net Assets Applicable to Common Shareholders | | | | | | | | | | | | | | | | | | | | | | | | |
Total expenses5 | | | 1.50% | | | | 1.39% | | | | 1.39% | | | | 1.54% | | | | 1.77% | 6 | | | 1.47% | |
| | | | |
Total expenses after fees waived and before fees paid indirectly5 | | | 1.50% | | | | 1.39% | | | | 1.38% | | | | 1.54% | | | | 1.77% | 6 | | | 1.47% | |
| | | | |
Total expenses after fees waived and paid indirectly5 | | | 1.50% | | | | 1.39% | | | | 1.38% | | | | 1.54% | | | | 1.77% | 6 | | | 1.47% | |
| | | | |
Total expenses after fees waived and paid indirectly and excluding interest expense, fees and amortization of offering costs5,7 | | | 1.33% | 8 | | | 1.36% | | | | 1.35% | | | | 1.45% | | | | 1.73% | 6 | | | 1.47% | |
| | | | |
Net investment income5 | | | 6.07% | | | | 7.15% | | | | 6.95% | | | | 7.50% | | | | 6.82% | 6 | | | 6.78% | |
| | | | |
Dividends to AMPS Shareholders | | | 0.11% | | | | 0.22% | | | | 0.24% | | | | 1.22% | | | | 2.03% | 6 | | | 2.27% | |
| | | | |
Net investment income to Common Shareholders | | | 5.96% | | | | 6.93% | | | | 6.71% | | | | 6.28% | | | | 4.79% | 6 | | | 4.51% | |
| | | | |
| | | | | | | | | | | | | | | | | | | | | | | | |
| Supplemental Data | | | | | | | | | | | | | | | | | | | | | | | | |
Net assets applicable to Common Shareholders, end of period (000) | | $ | 33,852 | | | $ | 30,611 | | | $ | 31,739 | | | $ | 28,575 | | | $ | 29,416 | | | $ | 30,717 | |
| | | | |
AMPS outstanding at $50,000 liquidation preference, end of period (000) | | | — | | | $ | 18,500 | | | $ | 18,500 | | | $ | 18,500 | | | $ | 18,500 | | | $ | 20,000 | |
| | | | |
VRDP Shares outstanding at $100,000 liquidation value, end of period (000) | | $ | 18,500 | | | | — | | | | — | | | | — | | | | — | | | | — | |
| | | | |
Portfolio turnover | | | 17% | | | | 10% | | | | 12% | | | | 12% | | | | 5% | | | | 18% | |
| | | | |
Asset coverage per AMPS at $50,000 liquidation preference, end of period | | | — | | | $ | 132,732 | | | $ | 135,785 | | | $ | 127,234 | | | $ | 129,523 | | | $ | 126,835 | |
| | | | |
Asset coverage per VRDP Share at $100,000 liquidation value, end of period | | $ | 282,983 | | | | — | | | | — | | | | — | | | | — | | | | — | |
| | | | |
| 1 | | Based on average Common Shares outstanding. |
| 2 | | Amount is less than $(0.01) per share. |
| 3 | | Total investment returns based on market value, which can be significantly greater or lesser than the net asset value, may result in substantially different returns. Where applicable, total investment returns exclude the effects of any sales charges and include the reinvestment of dividends and distributions. |
| 4 | | Aggregate total investment return. |
| 5 | | Do not reflect the effect of dividends to AMPS Shareholders. |
| 7 | | Interest expense, fees and amortization of offering costs relate to TOBs and/or VRDP Shares. See Note 1 and Note 7 of the Notes to Financial Statements for details of municipal bonds transferred to TOBs and VRDP Shares, respectively. |
| 8 | | For the year ended August 31, 2012, the total expense ratio after fees waived and paid indirectly and excluding interest expense, fees, amortization of offering costs and remarketing fees was 1.24%. |
| | | | | | |
| See Notes to Financial Statements. | | | | |
| | | | | | | |
| 58 | | ANNUAL REPORT | | AUGUST 31, 2012 | | |
| | |
| Notes to Financial Statements |
1. Organization and Significant Accounting Policies:
BlackRock Maryland Municipal Bond Trust (“BZM”), BlackRock New Jersey Municipal Bond Trust (“BLJ”), BlackRock New York Municipal Bond Trust (“BQH”), BlackRock New York Municipal Income Quality Trust (“BSE”), BlackRock Virginia Municipal Bond Trust (“BHV”) (collectively the “Bond Trusts”), BlackRock MuniHoldings New York Quality Fund, Inc. (“MHN”), BlackRock New York Municipal Income Trust II (“BFY”) and The Massachusetts Health & Education Tax-Exempt Trust (“MHE”) (all, collectively the “Trusts”) are registered under the 1940 Act, as non-diversified, closed-end management investment companies. The Trusts are organized as Delaware statutory trusts except MHN and MHE, which are organized as a Maryland corporation and a Massachusetts business trust, respectively. The Trusts’ financial statements are prepared in conformity with accounting principles generally accepted in the United States of America (“US GAAP”), which may require management to make estimates and assumptions that affect the reported amounts of assets and liabilities in the financial statements and the reported amounts of increases and decreases in net assets from operations during the reporting period. Actual results could differ from those estimates. The Board of Trustees and the Board of Directors of the Trusts are referred to throughout this report as the “Board of Trustees” or the “Board” and the directors/trustees thereof are collectively referred to throughout this report as “Trustees”. The Trusts determine and make available for publication the NAV of their Common Shares on a daily basis.
The following is a summary of significant accounting policies followed by the Trusts:
Valuation: US GAAP defines fair value as the price the Trusts would receive to sell an asset or pay to transfer a liability in an orderly transaction between market participants at the measurement date. The Trusts fair value their financial instruments at market value using independent dealers or pricing services under policies approved by each Trust’s Board. The BlackRock Global Valuation Methodologies Committee (the “Global Valuation Committee”) is the committee formed by management to develop global pricing policies and procedures and to provide oversight of the pricing function for the Trusts for all financial instruments.
Municipal investments (including commitments to purchase such investments on a “when-issued” basis) are valued on the basis of prices provided by dealers or pricing services. In determining the value of a particular investment, pricing services may use certain information with respect to transactions in such investments, quotations from dealers, pricing matrixes, market transactions in comparable investments and information with respect to various relationships between investments. Financial futures contracts traded on exchanges are valued at their last sale price. Investments in open-end registered investment companies are valued at NAV each business day. Short-term securities with remaining maturities of 60 days or less may be valued at amortized cost, which approximates fair value.
In the event that application of these methods of valuation results in a price for an investment that is deemed not to be representative of the market value of such investment, or if a price is not available, the investment will be valued by the Global Valuation Committee, or its delegate, in accordance with a policy approved by the Board as reflecting fair value (“Fair Value
Assets”). When determining the price for Fair Value Assets, the Global Valuation Committee, or its delegate, seeks to determine the price that each Trust might reasonably expect to receive from the current sale of that asset in an arm’s-length transaction. Fair value determinations shall be based upon all available factors that the investment advisor and/or sub-advisor deems relevant consistent with the principles of fair value measurement, which include the market approach, income approach and/or cost approach, as appropriate. A market approach generally consists of using comparable market transactions. The income approach generally is used to discount future cash flows to present value and adjusted for liquidity as appropriate. These factors include but are not limited to (i) attributes specific to the investment or asset; (ii) the principal market for the investment or asset; (iii) the customary participants in the principal market for the investment or asset; (iv) data assumptions by market participants for the investment or asset, if reasonably available; (v) quoted prices for similar investments or assets in active markets; and (vi) other factors, such as future cash flows, interest rates, yield curves, volatilities, prepayment speeds, loss severities, credit risks, recovery rates, liquidation amounts and/or default rates. Due to the inherent uncertainty of valuations of such investments, the fair values may differ from the values that would have been used had an active market existed. The Global Valuation Committee, or its delegate, employs various methods for calibrating valuation approaches for investments where an active market does not exist, including regular due diligence of the Trusts’ pricing vendors, a regular review of key inputs and assumptions, transactional back-testing or disposition analysis to compare unrealized gains and losses to realized gains and losses, reviews of missing or stale prices and large movements in market values and reviews of any market related activity. The pricing of all Fair Value Assets is subsequently reported to the Board or a committee thereof on a quarterly basis.
Zero-Coupon Bonds: The Trusts may invest in zero-coupon bonds, which are normally issued at a significant discount from face value and do not provide for periodic interest payments. Zero-coupon bonds may experience greater volatility in market value than similar maturity debt obligations which provide for regular interest payments.
Forward Commitments and When-Issued Delayed Delivery Securities: The Trusts may purchase securities on a when-issued basis and may purchase or sell securities on a forward commitment basis. Settlement of such transactions normally occurs within a month or more after the purchase or sale commitment is made. The Trusts may purchase securities under such conditions with the intention of actually acquiring them, but may enter into a separate agreement to sell the securities before the settlement date. Since the value of securities purchased may fluctuate prior to settlement, the Trusts may be required to pay more at settlement than the security is worth. In addition, the Trusts are not entitled to any of the interest earned prior to settlement. When purchasing a security on a delayed delivery basis, the Trusts assume the rights and risks of ownership of the security, including the risk of price and yield fluctuations. In the event of default by the counterparty, the Trusts’ maximum amount of loss is the unrealized appreciation of unsettled when-issued transactions, which is shown in the Schedules of Investments.
Municipal Bonds Transferred to TOBs: The Trusts leverage their assets through the use of TOBs. A TOB is established by a third party sponsor
| | | | | | |
| | | | | | | |
| | ANNUAL REPORT | | AUGUST 31, 2012 | | 59 |
| | |
| Notes to Financial Statements (continued) |
forming a special purpose entity, into which a fund, or an agent on behalf of a fund, transfers municipal bonds. Other funds managed by the investment advisor may also contribute municipal bonds to a TOB into which a Trust has contributed bonds. A TOB typically issues two classes of beneficial interests: short-term floating rate certificates, which are sold to third party investors, and residual certificates (“TOB Residuals”), which are generally issued to the participating funds that made the transfer. The TOB Residuals held by a Trust include the right of a Trust (1) to cause the holders of a proportional share of the short-term floating rate certificates to tender their certificates at par, including during instances of a rise in short-term interest rates, and (2) to transfer, within seven days, a corresponding share of the municipal bonds from the TOB to a Trust. The TOB may also be terminated without the consent of a Trust upon the occurrence of certain events as defined in the TOB agreements. Such termination events may include the bankruptcy or default of the municipal bond, a substantial downgrade in credit quality of the municipal bond, the inability of the TOB to obtain quarterly or annual renewal of the liquidity support agreement, a substantial decline in market value of the municipal bond or the inability to remarket the short-term floating rate certificates to third party investors. During the year ended August 31, 2012, no TOBs in which the Trusts participated were terminated without the consent of the Trusts.
The cash received by the TOB from the sale of the short-term floating rate certificates, less transaction expenses, is paid to a Trust in exchange for TOB trust certificates. The Trusts typically invest the cash in additional municipal bonds. Each Trust’s transfer of the municipal bonds to a TOB is accounted for as a secured borrowing; therefore, the municipal bonds deposited into a TOB are presented in the Trusts’ Schedules of Investments and the TOB trust certificates are shown in other liabilities in the Statements of Assets and Liabilities. The carrying amount of the Trusts’ payable to the holder of the short-term floating rate certificates as reported in the Statements of Assets and Liabilities as TOB trust certificates approximates its fair value.
Interest income, including amortization and accretion of premiums and discounts, from the underlying municipal bonds is recorded by the Trusts on an accrual basis. Interest expense incurred on the secured borrowing and other expenses related to remarketing, administration and trustee services to a TOB are shown as interest expense, fees and amortization of offering costs in the Statements of Operations. The short-term floating rate certificates have interest rates that generally reset weekly and their holders have the option to tender certificates to the TOB for redemption at par at each reset date. At August 31, 2012, the aggregate value of the underlying municipal bonds transferred to TOBs, the related liability for TOB trust certificates and the range of interest rates on the liability for TOB trust certificates were as follows:
| | | | | | | | | | | | |
| | | Underlying Municipal Bonds Transferred to TOBs | | | Liability
for TOB Trust Certificates | | | Range of Interest Rates | |
BZM | | $ | 4,763,527 | | | $ | 2,399,847 | | | | 0.17% - 0.24% | |
MHN | | $ | 159,954,009 | | | $ | 77,476,820 | | | | 0.18% - 0.32% | |
BLJ | | $ | 7,706,047 | | | $ | 3,954,288 | | | | 0.15% - 0.32% | |
BQH | | $ | 12,487,917 | | | $ | 7,365,836 | | | | 0.16% - 0.24% | |
BSE | | $ | 37,326,357 | | | $ | 20,920,361 | | | | 0.16% - 0.24% | |
BFY | | $ | 13,610,085 | | | $ | 7,591,259 | | | | 0.16% - 0.24% | |
BHV | | $ | 7,725,342 | | | $ | 4,107,550 | | | | 0.17% - 0.19% | |
MHE | | $ | 3,751,045 | | | $ | 2,009,595 | | | | 0.16% - 0.19% | |
For the year ended August 31, 2012, the Trusts’ average TOB trust certificates outstanding and the daily weighted average interest rate, including fees, were as follows:
| | | | | | | | |
| | | Average TOB Trust Certificates Outstanding | | | Daily Weighted Average Interest Rate | |
BZM | | $ | 1,779,872 | | | | 0.73 | % |
MHN | | $ | 73,829,152 | | | | 0.82 | % |
BLJ | | $ | 2,854,520 | | | | 0.75 | % |
BQH | | $ | 3,539,138 | | | | 0.77 | % |
BSE | | $ | 15,231,681 | | | | 0.75 | % |
BFY | | $ | 4,520,084 | | | | 0.92 | % |
BHV | | $ | 3,639,474 | | | | 0.69 | % |
MHE | | $ | 1,857,053 | | | | 0.56 | % |
Should short-term interest rates rise, the Trusts’ investments in TOBs may adversely affect the Trusts’ net investment income and dividends to Common Shareholders. Also, fluctuations in the market value of municipal bonds deposited into the TOB may adversely affect the Trusts’ NAV per share.
Segregation and Collateralization: In cases in which the 1940 Act and the interpretive positions of the Securities and Exchange Commission (“SEC”) require that the Trusts either deliver collateral or segregate assets in connection with certain investments (e.g., financial futures contracts), the Trusts will, consistent with SEC rules and/or certain interpretive letters issued by the SEC, segregate collateral or designate on their books and records cash or liquid securities having a market value at least equal to the amount that would otherwise be required to be physically segregated. Furthermore, based on requirements and agreements with certain exchanges and third party broker-dealers, each party to such transactions has requirements to deliver/deposit securities as collateral for certain investments.
Investment Transactions and Investment Income: For financial reporting purposes, investment transactions are recorded on the dates the transactions are entered into (the trade dates). Realized gains and losses on investment transactions are determined on the identified cost basis. Interest income, including amortization and accretion of premiums and discounts on debt securities, is recognized on the accrual basis.
Dividends and Distributions: Dividends from net investment income are declared and paid monthly. Distributions of capital gains, if any, are recorded on the ex-dividend dates. The character and timing of dividends and distributions are determined in accordance with federal income tax regulations, which may differ from US GAAP. Dividends and distributions to Preferred Shareholders are accrued and determined as described in Note 7.
Income Taxes: It is each Trust’s policy to comply with the requirements of the Internal Revenue Code of 1986, as amended, applicable to regulated investment companies and to distribute substantially all of its taxable income to its shareholders. Therefore, no federal income tax provision is required.
Each Trust files US federal and various state and local tax returns. No income tax returns are currently under examination. The statute of limitations on the Trusts’ US federal tax returns remains open for each of the
| | | | | | |
| | | | | | | |
| 60 | | ANNUAL REPORT | | AUGUST 31, 2012 | | |
| | |
| Notes to Financial Statements (continued) |
four years ended August 31, 2012. The statutes of limitations on the Each Trust’s state and local tax returns may remain open for an additional year depending upon the jurisdiction. Management does not believe there are any uncertain tax positions that require recognition of a tax liability.
Recent Accounting Standard: In December 2011, the Financial Accounting Standards Board issued guidance that will expand current disclosure requirements on the offsetting of certain assets and liabilities. The new disclosures will be required for investments and derivative financial instruments subject to master netting or similar agreements, which are eligible for offset in the Statements of Assets and Liabilities and will require an entity to disclose both gross and net information about such investments and transactions in the financial statements. The guidance is effective for financial statements with fiscal years beginning on or after January 1, 2013, and interim periods within those fiscal years. Management is evaluating the impact of this guidance on the Trusts’ financial statement disclosures.
Deferred Compensation and BlackRock Closed-End Share Equivalent Investment Plan: Under the deferred compensation plan approved by each Trust’s Board, independent Trustees (“Independent Trustees”) may defer a portion of their annual complex-wide compensation. Deferred amounts earn an approximate return as though equivalent dollar amounts had been invested in common shares of certain other BlackRock Closed-End Funds selected by the Independent Trustees. This has approximately the same economic effect for the Independent Trustees as if the Independent Trustees had invested the deferred amounts directly in certain other BlackRock Closed-End Funds.
The deferred compensation plan is not funded and obligations there-under represent general unsecured claims against the general assets of each Trust. Prior to March 31, 2012, each Trust elected to invest in common shares of certain other BlackRock Closed-End Funds selected by the Independent Trustees in order to match its deferred compensation obligations and dividends and distributions received from the BlackRock Closed-End Fund investments through March 31, 2012 are included in income — affiliated in the Statements of Operations.
Offering Costs: The Trusts incurred costs in connection with their issuance of VRDP Shares, which were recorded as a deferred charge and will be amortized over the 30-year life of the VRDP Shares with the exception of upfront fees paid to the liquidity providers which were amortized over the term of the initial liquidity agreement. Amortization of these costs is included in interest expense, fees and amortization of offering costs in the Statements of Operations.
Other: Expenses directly related to a Trust are charged to that Trust. Other operating expenses shared by several funds are pro rated among those funds on the basis of relative net assets or other appropriate methods.
The Trusts have an arrangement with the custodians whereby fees may be reduced by credits earned on uninvested cash balances, which, if applicable, are shown as fees paid indirectly in the Statements of Operations. The custodians impose fees on overdrawn cash balances, which can be offset by accumulated credits earned or may result in additional custody charges.
2. Derivative Financial Instruments:
The Trusts engage in various portfolio investment strategies using derivative contracts both to increase the returns of the Trusts and/or to economically hedge, or protect, their exposure to certain risks such as interest rate risk. These contracts may be transacted on an exchange.
Losses may arise if the value of the contract decreases due to an unfavorable change in the market rates or values of the underlying instrument or if the counterparty does not perform under the contract. Counterparty risk related to exchange-traded financial futures contracts is deemed to be minimal due to the protection against defaults provided by the exchange on which these contracts trade.
Financial Futures Contracts: The Trusts purchase or sell financial futures contracts and options on financial futures contracts to gain exposure to, or economically hedge against, changes in interest rates (interest rate risk). Financial futures contracts are agreements between the Trusts and the counterparty to buy or sell a specific quantity of an underlying instrument at a specified price and at a specified date. Depending on the terms of the particular contract, financial futures contracts are settled either through physical delivery of the underlying instrument on the settlement date or by payment of a cash settlement amount on the settlement date. Pursuant to the contract, the Trusts agree to receive from or pay to the broker an amount of cash equal to the daily fluctuation in value of the contract. Such receipts or payments are known as variation margin and are recorded by the Trusts as unrealized appreciation or depreciation. When the contract is closed, the Trusts record a realized gain or loss equal to the difference between the value of the contract at the time it was opened and the value at the time it was closed. The use of financial futures contracts involves the risk of an imperfect correlation in the movements in the price of financial futures contracts, interest rates and the underlying assets.
| | | | | | | | | | | | | | | | | | | | | | | | | | | | | | | | |
Derivative Financial Instruments Categorized by Risk Exposure: | | | | | | | | | | | | | | | | |
The Effect of Derivative Financial Instruments in the Statements of Operations Year Ended August 31, 2012 | |
| | | Net Realized Gain (Loss) From | |
| | | BZM | | | MHN | | | BLJ | | | BQH | | | BSE | | | BFY | | | BHV | | | MHE | |
| Interest rate contracts: | | | | | | | | | | | | | | | | | | | | | | | | | | | | | | | | |
Financial future contracts | | $ | (97,401 | ) | | $ | (1,389,725 | ) | | $ | (131,305 | ) | | $ | (131,098 | ) | | $ | (291,995 | ) | | $ | (230,864 | ) | | $ | (99,580 | ) | | $ | (105,334 | ) |
| | | | | | |
| | | | | | | |
| | ANNUAL REPORT | | AUGUST 31, 2012 | | 61 |
| | |
| Notes to Financial Statements (continued) |
| | | | | | | | | | | | | | | | |
| | | Net Change in Unrealized Appreciation/
Depreciation on | |
| | | BZM | | | BLJ | | | BHV | | | MHE | |
| Interest rate contracts: | | | | | | | | | | | | | | | | |
Financial future contracts . | | $ | (1,787 | ) | | $ | (2,860 | ) | | $ | (1,787 | ) | | $ | (2,860 | ) |
| | | | | | | | | | | | | | | | |
For the year ended August 31, 2012, the average quarterly balances of outstanding derivative financial instruments were as follows:
| | | | | | | | | | | | | | | | | | | | | | | | | | | | | | | | |
| | | | | | | | | | | | | | | | | | | | | | | | | | | | | | | | |
| | | BZM | | | MHN | | | BLJ | | | BQH | | | BSE | | | BFY | | | BHV | | | MHE | |
| Financial future contracts: | | | | | | | | | | | | | | | | | | | | | | | | | | | | | | | | |
Average number of contracts sold | | | 3 | | | | 35 | | | | 7 | | | | 3 | | | | 7 | | | | 6 | | | | 2 | | | | 3 | |
Average notional value of contracts sold | | $ | 334,844 | | | $ | 4,620,844 | | | $ | 861,910 | | | $ | 435,297 | | | $ | 971,047 | | | $ | 770,141 | | | $ | 301,359 | | | $ | 360,980 | |
3. Investment Advisory Agreement and Other Transactions with Affiliates:
The PNC Financial Services Group, Inc. (“PNC”) is the largest stockholder and an affiliate, for 1940 Act purposes, of BlackRock, Inc. (“BlackRock”).
Each Trust entered into an Investment Advisory Agreement with BlackRock Advisors, LLC (the “Manager”), the Trusts’ investment advisor, an indirect, wholly owned subsidiary of BlackRock, to provide investment advisory and administration services. The Manager is responsible for the management of each Trust’s portfolio and provides the necessary personnel, facilities, equipment and certain other services necessary to the operations of each Trust. For such services, each Trust pays the Manager a monthly fee based on a percentage of each Trust’s average weekly net assets except for MHN and MHE, which are based on average daily net assets at the following annual rates:
| | | | |
BZM | | | 0.65 | % |
MHN | | | 0.55 | % |
BLJ | | | 0.65 | % |
BQH | | | 0.65 | % |
BSE | | | 0.55 | % |
BFY | | | 0.55 | % |
BHV | | | 0.65 | % |
MHE | | | 0.50 | % |
Average weekly net assets and average daily net assets are the average weekly or the average daily value of each Trust’s total assets minus the sum of its accrued liabilities.
The Manager voluntarily agreed to waive a portion of the investment advisory fees with respect to the Bond Trusts, excluding BSE, at an annual rate as a percentage of the average weekly net assets of 0.05% through April 2012. With respect to BFY, the waiver, as a percentage of its weekly net assets is 0.05% through July 2012. With respect to MHN, the Manager voluntarily agreed to waive its investment advisory fee on the proceeds of the Preferred Shares and TOBs that exceed 35% of total assets minus the sum of its accrued liabilities. For the year ended August 31, 2012, the Manager waived the following amounts, which are included in fees waived by Manager in the Statements of Operations.
| | | | |
BZM | | $ | 16,075 | |
MHN | | $ | 362,168 | |
BLJ | | $ | 21,360 | |
BQH | | $ | 22,432 | |
BFY | | $ | 58,434 | |
BHV | | $ | 13,262 | |
The Manager voluntarily agreed to waive its investment advisory fees by the amount of investment advisory fees each Trust pay to the Manager indirectly through its investment in affiliated money market funds. However, the Manager does not waive its investment advisory fees by the amount of investment advisory fees paid in connection with each Trust’s investment in other affiliated investment companies, if any. These amounts are included in fees waived by Manager in the Statements of Operations. For the year ended August 31, 2012, the amounts waived were as follows:
| | | | |
BZM | | $ | 759 | |
MHN | | $ | 16,219 | |
BLJ | | $ | 1,652 | |
BQH | | $ | 1,655 | |
BSE | | $ | 1,992 | |
BFY | | $ | 1,453 | |
BHV | | $ | 266 | |
MHE | | $ | 371 | |
The Manager entered into sub-advisory agreements with BlackRock Investment Management LLC (“BIM”) for MHN and MHE and BlackRock Financial Management, Inc. (“BFM”) for all other Trusts. BIM and BFM are affiliates of the Manager. The Manager pays BIM and BFM, for services they provide, a monthly fee that is a percentage of the investment advisory fees paid by each Trust to the Manager.
Certain officers and/or Trustees of the Trusts are officers and/or Trustees of BlackRock or its affiliates. The Trusts reimburse the Manager for a portion of the compensation paid to the Trusts’ Chief Compliance Officer.
4. Investments:
Purchases and sales of investments, excluding short-term securities, for the year ended August 31, 2012 were as follows:
| | | | | | | | |
| | | Purchases | | | Sales | |
BZM | | $ | 18,003,386 | | | $ | 14,030,025 | |
MHN | | $ | 121,063,082 | | | $ | 111,315,525 | |
BLJ | | $ | 17,748,575 | | | $ | 14,163,170 | |
BQH | | $ | 37,471,049 | | | $ | 30,763,031 | |
BSE | | $ | 46,544,127 | | | $ | 35,745,194 | |
BFY | | $ | 39,811,796 | | | $ | 30,815,910 | |
BHV | | $ | 10,987,392 | | | $ | 8,977,264 | |
MHE | | $ | 10,375,254 | | | $ | 8,502,633 | |
| | | | | | |
| | | | | | | |
| 62 | | ANNUAL REPORT | | AUGUST 31, 2012 | | |
| | |
| Notes to Financial Statements (continued) |
5. Income Tax Information:
US GAAP requires that certain components of net assets be adjusted to reflect permanent differences between financial and tax reporting. These reclassifications have no effect on net assets or net asset values per share. The following permanent differences as of August 31, 2012 attributable to amortization methods on fixed income securities, non-deductible expenses, income recognized from pass-through entities, distributions received from a regulated investment company, the reclassification of distributions and securities in default were reclassified to the following accounts:
| | | | | | | | | | | | | | | | | | | | | | | | | | | | | | | | |
| | | BZM | | | MHN | | | BLJ | | | BQH | | | BSE | | | BFY | | | BHV | | | MHE | |
Paid in capital | | $ | (626 | ) | | $ | (518,127 | ) | | $ | (626 | ) | | $ | (36,433 | ) | | $ | (63,284 | ) | | $ | (68,781 | ) | | $ | (626 | ) | | $ | (709 | ) |
Undistributed net investment income | | $ | 623 | | | $ | 245,901 | | | $ | (4,150 | ) | | $ | 32,912 | | | $ | 10,671 | | | $ | 71,984 | | | $ | (6,918 | ) | | $ | 709 | |
Undistributed net realized gain (accumulated net realized loss) | | $ | 3 | | | $ | 272,226 | | | $ | 4,776 | | | $ | 3,521 | | | $ | 52,613 | | | $ | (3,203 | ) | | $ | 7,544 | | | | — | |
| | | | | | | | | | | | | | | | | | | | | | | | | | | | | | | | |
The tax character of distributions paid during the fiscal years ended August 31, 2012 and August 31, 2011 was as follows:
| | | | | | | | | | | | | | | | | | | | | | | | | | | | | | | | | | | | |
| | | | | | | | | | | | | | | | | | | | | | | | | | | | | | | | | | | | |
| | | | | | BZM | | | MHN | | | BLJ | | | BQH | | | BSE | | | BFY | | | BHV | | | MHE | |
Tax-exempt income | | | 8/31/12 | | | $ | 2,006,765 | | | $ | 30,398,681 | | | $ | 2,244,465 | | | $ | 2,750,782 | | | $ | 5,708,613 | | | $ | 5,098,689 | | | $ | 1,616,224 | | | $ | 2,041,164 | |
| | | 8/31/11 | | | | 2,011,240 | | | | 30,488,849 | | | | 2,235,997 | | | | 2,812,563 | | | | 5,707,805 | | | | 5,128,469 | | | | 1,605,854 | | | | 2,040,271 | |
Ordinary income | | | 8/31/12 | | | | — | | | | — | | | | 3,008 | | | | — | | | | — | | | | — | | | | — | | | | — | |
| | | 8/31/11 | | | | 478 | | | | 112,639 | | | | 8,828 | | | | 15,322 | | | | — | | | | — | | | | 11,428 | | | | — | |
Long-term capital gains | | | 8/31/12 | | | | — | | | | — | | | | — | | | | — | | | | — | | | | — | | | | — | | | | — | |
| | | 8/31/11 | | | | 46,913 | | | | — | | | | 74,433 | | | | — | | | | — | | | | — | | | | 125,402 | | | | — | |
| | | | | | | | |
Total distributions | | | 8/31/12 | | | $ | 2,006,765 | | | $ | 30,398,681 | | | $ | 2,247,473 | | | $ | 2,750,782 | | | $ | 5,708,613 | | | $ | 5,098,689 | | | $ | 1,616,224 | | | $ | 2,041,164 | |
| | | | | | | | |
| | | 8/31/11 | | | $ | 2,058,631 | | | $ | 30,601,488 | | | $ | 2,319,258 | | | $ | 2,827,885 | | | $ | 5,707,805 | | | $ | 5,128,469 | | | $ | 1,742,684 | | | $ | 2,040,271 | |
| | | | | | | | |
As of August 31, 2012, the tax components of accumulated net earnings were as follows:
| | | | | | | | | | | | | | | | | | | | | | | | | | | | | | | | |
| | | BZM | | | MHN | | | BLJ | | | BQH | | | BSE | | | BFY | | | BHV | | | MHE | |
Undistributed tax-exempt income | | $ | 372,398 | | | $ | 6,487,614 | | | $ | 547,786 | | | $ | 490,463 | | | $ | 1,161,199 | | | $ | 1,038,415 | | | $ | 326,957 | | | $ | 613,447 | |
Undistributed ordinary income | | | 23 | | | | 17,014 | | | | 1,164 | | | | 263,392 | | | | 953 | | | | 5,366 | | | | 11,332 | | | | 71 | |
Undistributed long-term capital gains | | | — | | | | — | | | | — | | | | 320,223 | | | | — | | | | — | | | | — | | | | — | |
Capital loss carryforwards | | | (174,325 | ) | | | (32,511,394 | ) | | | (161,191 | ) | | | — | | | | (4,084,496 | ) | | | (1,441,194 | ) | | | (598,893 | ) | | | (1,004,159 | ) |
Net unrealized gains1 | | | 2,759,329 | | | | 54,082,713 | | | | 5,406,775 | | | | 5,456,709 | | | | 11,562,099 | | | | 9,968,346 | | | | 4,197,060 | | | | 4,421,460 | |
Qualified late-year losses2 | | | — | | | | (2,035,203 | ) | | | — | | | | — | | | | — | | | | — | | | | — | | | | (55,858 | ) |
| | | | |
Total | | $ | 2,957,425 | | | $ | 26,040,744 | | | $ | 5,794,534 | | | $ | 6,530,787 | | | $ | 8,639,755 | | | $ | 9,570,933 | | | $ | 3,936,456 | | | $ | 3,974,961 | |
| | | | |
| 1 | | The difference between book-basis and tax-basis net unrealized gains was attributable primarily to the tax deferral of losses on wash sales and straddles, amortization and accretion methods of premiums and discounts on fixed income securities, the treatment of residual interests in tender option bond trusts, the accrual of income on securities in default, the timing and recognition of partnership income and the deferral of compensation to directors and trustees. |
| 2 | | The Trusts have elected to defer certain qualified late-year losses and recognize such losses in the year ending August 31, 2013. |
As of August 31, 2012, the Trusts had capital loss carryforwards available to offset future realized capital gains through the indicated expiration:
| | | | | | | | | | | | | | | | | | | | | | | | | | | | |
| Expires August 31, | | BZM | | | MHN | | | BLJ | | | BSE | | | BFY | | | BHV | | | MHE | |
2013 | | | — | | | $ | 15,054,033 | | | | — | | | | — | | | | — | | | | — | | | | — | |
2014 | | | — | | | | 1,097,743 | | | | — | | | | — | | | | — | | | | — | | | | — | |
2015 | | | — | | | | 2,782,666 | | | | — | | | | — | | | $ | 70,160 | | | | — | | | $ | 35,869 | |
2016 | | | — | | | | 710,089 | | | | — | | | | — | | | | 383,137 | | | | — | | | | 285,683 | |
2017 | | | — | | | | 4,069,997 | | | | — | | | $ | 1,583,452 | | | | 254,346 | | | | — | | | | 375,230 | |
2018 | | | — | | | | 3,861,956 | | | | — | | | | 1,544,362 | | | | 357,549 | | | | — | | | | 32,672 | |
2019 | | $ | 57,495 | | | | 673,531 | | | | — | | | | — | | | | 255,001 | | | $ | 51,866 | | | | 74 | |
No expiration date3 | | | 116,830 | | | | 4,261,379 | | | $ | 161,191 | | | | 956,682 | | | | 121,001 | | | | 547,027 | | | | 274,631 | |
| | | | |
Total | | $ | 174,325 | | | $ | 32,511,394 | | | $ | 161,191 | | | $ | 4,084,496 | | | $ | 1,441,194 | | | $ | 598,893 | | | $ | 1,004,159 | |
| | | | |
| 3 | | Must be utilized prior to losses subject to expiration. |
As of August 31, 2012, gross unrealized appreciation and gross unrealized depreciation based on cost for federal income tax purposes were as follows:
| | | | | | | | | | | | | | | | | | | | | | | | | | | | | | | | |
| | | BZM | | | MHN | | | BLJ | | | BQH | | | BSE | | | BFY | | | BHV | | | MHE | |
Tax cost | | $ | 45,188,300 | | | $ | 669,382,547 | | | $ | 52,265,256 | | | $ | 63,623,476 | | | $ | 129,079,340 | | | $ | 114,377,691 | | | $ | 33,414,611 | | | $ | 48,042,204 | |
| | | | |
Gross unrealized appreciation | | $ | 2,783,995 | | | $ | 57,834,021 | | | $ | 5,954,524 | | | $ | 6,115,534 | | | $ | 12,000,645 | | | $ | 10,637,569 | | | $ | 4,262,523 | | | $ | 4,426,685 | |
Gross unrealized depreciation | | | (14,896 | ) | | | (3,329,004 | ) | | | (538,672 | ) | | | (649,412 | ) | | | (431,444 | ) | | | (658,985 | ) | | | (59,125 | ) | | | (13,553 | ) |
| | | | |
Net unrealized appreciation (depreciation) | | $ | 2,769,099 | | | $ | 54,505,017 | | | $ | 5,415,852 | | | $ | 5,466,122 | | | $ | 11,569,201 | | | $ | 9,978,584 | | | $ | 4,203,398 | | | $ | 4,413,132 | |
| | | | |
| | | | | | |
| | | | | | | |
| | ANNUAL REPORT | | AUGUST 31, 2012 | | 63 |
| | |
| Notes to Financial Statements (continued) |
6. Concentration, Market and Credit Risk
Each Trust invests a substantial amount of their assets in issuers located in a single state or limited number of states. Please see the Schedules of Investments for concentrations in specific states.
Many municipalities insure repayment of their bonds, which may reduce the potential for loss due to credit risk. The market value of these bonds may fluctuate for other reasons, including market perception of the value of such insurance, and there is no guarantee that the insurer will meet its obligation.
In the normal course of business, the Trusts invest in securities and enter into transactions where risks exist due to fluctuations in the market (market risk) or failure of the issuer of a security to meet all its obligations (issuer credit risk). The value of securities held by the Trusts may decline in response to certain events, including those directly involving the issuers whose securities are owned by the Trusts; conditions affecting the general economy; overall market changes; local, regional or global political, social or economic instability; and currency and interest rate and price fluctuations. Similar to issuer credit risk, the Trusts may be exposed to counterparty credit risk, or the risk that an entity with which the Trusts have unsettled or open transactions may fail to or be unable to perform on its commitments. The Trusts manage counterparty credit risk by entering into transactions only with counterparties that they believe have the financial resources to honor their obligations and by monitoring the financial stability of those counterparties. Financial assets, which potentially expose the Trusts to market, issuer and counterparty credit risks, consist principally of financial instruments and receivables due from counterparties. The extent of the Trusts’ exposure to market, issuer and counterparty credit risks with respect to these financial assets is generally approximated by their value recorded in the Statements of Assets and Liabilities, less any collateral held by the Trusts.
As of August 31, 2012, MHN invested a significant portion of its assets in securities in the transportation and county/city/special district/school district sectors. BLJ invested a significant portion of its assets in securities in the state sector. BQH and BFY invested a significant portion of its assets in securities in the county/city/special district/school district sector. BSE invested a significant portion of its assets in securities in the county/city/special district/school district, education and transportation sectors. BHV invested a significant portion of its assets in securities in the health sector. MHE invested a significant portion of its assets in securities in the education and health sectors. Changes in economic conditions affecting the county/city/special district/school district, education, health, state and transportation sectors would have a greater impact on the Trusts and could affect the value, income and/or liquidity of positions in such securities.
7. Capital Share Transactions:
Each Trust, except for MHN, is authorized to issue unlimted number of shares (200 million shares for MHN), all of which were initially classified as Common Shares. The par value for the Trusts’ Common and Preferred Shares, except for MHN and MHE, is $0.001 per share ($0.10 for MHN and $0.01 for MHE). The Board is authorized, however, to reclassify any unissued Common Shares to Preferred Shares without approval of Common Shareholders.
Common Shares
For the years shown, shares issued and outstanding increased by the following amounts as a result of dividend reinvestment:
| | | | | | | | |
| | | Year Ended August 31, 2012 | | | Year Ended August 31, 2011 | |
BZM | | | 4,792 | | | | 9,032 | |
MHN | | | 117,478 | | | | 103,507 | |
BLJ | | | 3,421 | | | | 2,281 | |
BQH | | | 10,545 | | | | 6,756 | |
BSE | | | 19,103 | | | | 2,348 | |
BFY | | | 18,300 | | | | 16,761 | |
BHV | | | 5,351 | | | | 6,753 | |
MHE | | | 5,309 | | | | 5,980 | |
Preferred Shares
The Trusts’ Preferred Shares rank prior to the Trusts’ Common Shares as to the payment of dividends by the Trusts and distribution of assets upon dissolution or liquidation of the Trusts. The 1940 Act prohibits the declaration of any dividend on the Trusts’ Common Shares or the repurchase of the Trusts’ Common Shares if the Trusts fail to maintain the asset coverage of at least 200% of the liquidation preference of the outstanding Preferred Shares. In addition, pursuant to the Preferred Shares’ governing instrument, the Trusts are restricted from declaring and paying dividends on classes of shares ranking junior to or on parity with the Preferred Shares or repurchasing such shares if the Trusts fail to declare and pay dividends on the Preferred Shares, redeem any Preferred Shares required to be redeemed under the Preferred Shares governing instrument or comply with the basic maintenance amount requirement of the rating agencies then rating the Preferred Shares.
The holders of Preferred Shares have voting rights equal to the holders of Common Shares (one vote per share) and will vote together with holders of Common Shares (one vote per share) as a single class. However, the holders of Preferred Shares, voting as a separate class, are also entitled to elect two Directors for each Trust. In addition, the 1940 Act requires that along with approval by shareholders that might otherwise be required, the approval of the holders of a majority of any outstanding Preferred Shares, voting separately as a class would be required to (a) adopt any plan of reorganization that would adversely affect the Preferred Shares, (b) change a Trust’s sub-classification as a closed-end investment company or change its fundamental investment restrictions, or (c) change its business so as to cease to be an investment company.
VRDP Shares
The Trusts have issued Series W-7 VRDP Shares, $100,000 liquidation value per share, in a privately negotiated offering. The VRDP Shares were offered to qualified institutional buyers as defined pursuant to Rule 144A under the Securities Act of 1933, as amended, (the “Securities Act”) and include a liquidity feature, pursuant to a liquidity agreement, that allows the holders of VRDP Shares to have their shares purchased by the liquidity providers in the event of a failed remarketing. The Trusts are required to redeem the VRDP Shares owned by the liquidity providers after six months of continuous, unsuccessful remarketing. Upon the occurrence of the first unsuccessful remarketing, the Trusts are required to segregate liquid assets to fund the redemption. The VRDP Shares are subject to certain restrictions on transfer.
| | | | | | |
| | | | | | | |
| 64 | | ANNUAL REPORT | | AUGUST 31, 2012 | | |
| | |
| Notes to Financial Statements (continued) |
The VRDP Shares as of the year ended August 31, 2012 were as follows:
| | | | | | | | | | | | | | | | |
| | | Issue
Date | | | Shares
Issued | | | Aggregate
Principal | | | Maturity
Date | |
BZM | | | 6/14/12 | | | | 160 | | | $ | 16,000,000 | | | | 7/01/42 | |
MHN | | | 6/30/11 | | | | 2,436 | | | $ | 243,600,000 | | | | 7/01/41 | |
BLJ | | | 6/14/12 | | | | 187 | | | $ | 18,700,000 | | | | 7/01/42 | |
BQH | | | 9/15/11 | | | | 221 | | | $ | 22,100,000 | | | | 10/01/41 | |
BSE | | | 9/15/11 | | | | 405 | | | $ | 40,500,000 | | | | 10/01/41 | |
BFY | | | 9/15/11 | | | | 444 | | | $ | 44,400,000 | | | | 10/01/41 | |
BHV | | | 6/14/12 | | | | 116 | | | $ | 11,600,000 | | | | 7/01/42 | |
MHE | | | 6/14/12 | | | | 185 | | | $ | 18,500,000 | | | | 7/01/42 | |
The Trusts entered into a fee agreement with the liquidity providers that may require a per annum liquidity fee to be paid to the liquidity providers. These fees, if applicable, are shown as liquidity fees in the Statements of Operations.
The fee agreement between each of BQH, BSE, MHN and BFY and its respective liquidity provider was for a 364-day term and was scheduled to expire on June 27, 2012 for MHN and September 12, 2012 for BQH, BSE and BFY. MHN renewed its fee agreement for an additional 364 days, which is scheduled to expire on June 26, 2013 unless renewed or terminated in advance. Each of BQH, BSE and BFY renewed its respective fee agreement for an approximately six-month term, which is scheduled to expire on March 15, 2013 unless renewed or terminated in advance. The fee agreement between each of BZM, BLJ, BHV and MHE and its respective liquidity provider is for an approximately 3-year term and is scheduled to expire on July 9, 2015 unless renewed or terminated in advance.
In the event the fee agreement is not renewed or is terminated in advance, and the Trusts do not enter into a fee agreement with alternate liquidity providers, the VRDP Shares will be subject to mandatory purchase by the liquidity providers prior to the termination of the fee agreement. The Trusts are required to redeem any VRDP Shares purchased by the liquidity providers six months after the purchase date. Immediately after the purchase of any VRDP Shares by the liquidity providers, the Trusts are required to begin to segregate liquid assets with the Trust’s custodian to fund the redemption. There is no assurance the Trusts will replace such redeemed VRDP Shares with any other preferred shares or other form of leverage.
Each Trust is required to redeem its VRDP Shares on the maturity date, unless earlier redeemed or repurchased. Six months prior to the maturity date, each Trust is required to begin to segregate liquid assets with the Trust’s custodian to fund the redemption. In addition, the Trusts are required to redeem certain of its outstanding VRDP Shares if it fails to maintain certain asset coverage, basic maintenance amount or leverage requirements.
Subject to certain conditions, the VRDP Shares may be redeemed, in whole or in part, at any time at the option of the Trusts. The redemption price per VRDP Share is equal to the liquidation value per share plus any outstanding unpaid dividends. In the event of an optional redemption of the VRDP Shares prior to the initial termination date of the fee agreement, the Trusts must pay the respective liquidity provider fees on such redeemed VRDP Shares for the remaining term of the fee agreement up to the initial termination date.
Dividends on the VRDP Shares are payable monthly at a variable rate set weekly by the remarketing agent. Such dividend rates are generally based upon a spread over a base rate and cannot exceed a maximum rate. In the event of a failed remarketing, the dividend rate of the VRDP Shares will be reset to a maximum rate. The maximum rate is determined based on, among other things, the long-term preferred share rating assigned to the VRDP Shares and the length of time that the VRDP Shares fail to be remarketed. At the date of issuance, the VRDP Shares were assigned a long-term rating of Aaa from Moody’s for MHN, BQH, BSE and BFY and Aa2 for BZM, BLJ, BHV and MHE and AAA from Fitch for all Trusts. In May 2012, Moody’s completed a review of its methodology for rating securities issued by registered closed-end funds. As of August 31, 2012, the VRDP Shares were assigned a long-term rating of Aa2 for BZM, MHN, BLJ, BQH, BSE, BFY and BHV and Aa3 for MHE from Moody’s under its new ratings methodology. The VRDP Shares continue to be assigned a long-term rating of AAA from Fitch.
The short-term ratings on the VRDP Shares are directly related to the short-term ratings of the liquidity providers for such VRDP Shares. Changes in the credit quality of the liquidity providers could cause a change in the short-term credit ratings of the VRDP Shares as rated by Moody’s, Fitch and/or S&P. A change in the short-term credit rating of the liquidity providers or the VRDP Shares may adversely affect the dividend rate paid on such shares, although the dividend rate paid on the VRDP Shares is not directly related based upon either short-term rating. The liquidity providers may be terminated prior to the scheduled termination date if the liquidity providers fail to maintain short-term debt ratings in one of the two highest rating categories.
For financial reporting purposes, the VRDP Shares are considered debt of the issuer; therefore, the liquidation value, which approximates fair value, of the VRDP Shares is recorded as a liability in the Statements of Assets and Liabilities. Unpaid dividends are included in interest expense and fees payable in the Statements of Assets and Liabilities, and the dividends accrued and paid on the VRDP Shares are included as a component of interest expense, fees and amortization of offering costs in the Statements of Operations. The VRDP Shares are treated as equity for tax purposes. Dividends paid to holders of the VRDP Shares are generally classified as tax-exempt income for tax-reporting purposes.
Upon issuance of the VRDP Shares on June 14, 2012, BZM, BLJ, BHV and MHE announced a special rate period for an approximately three-year term ending June 24, 2015 with respect to their VRDP Shares. The liquidity and fee agreements remain in effect for the duration of the special rate period; however, the VRDP Shares will not be remarketed or subject to optional or mandatory tender events during such time. During the special rate period, BZM, BLJ, BHV and MHE are required to maintain the same asset coverage, basic maintenance amount and leverage requirements for the VRDP Shares. During the three-year term of the special rate period, BZM, BLJ, BHV and MHE will not pay any liquidity and remarketing fees and instead will pay dividends monthly based on the sum of SIFMA Municipal Swap Index and a percentage per annum based on the long-term ratings assigned to the VRDP Shares.
If BZM, BLJ, BHV and MHE redeems the VRDP Shares on a date that is one year or more before the end of the special rate period and the VRDP
| | | | | | |
| | | | | | | |
| | ANNUAL REPORT | | AUGUST 31, 2012 | | 65 |
| | |
| Notes to Financial Statements (continued) |
Shares are rated above A1/A by Moody’s and Fitch respectively, then such redemption is subject to a redemption premium payable to the holder of the VRDP Shares based on the time remaining in the special rate period, subject to certain exceptions for redemptions that are required to maintain minimum asset coverage requirements. After June 24, 2015, the holder of the VRDP Shares and BZM, BLJ, BHV and MHE may mutually agree to extend the special rate period. If the special rate period is not extended, the VRDP Shares will revert back to remarketable securities and will be remarketed and available for purchase by qualified institutional investors. No short-term ratings were assigned by Moody’s, Fitch and/or S&P at issuance but will be assigned upon termination of the special rate period when the VRDP Shares revert to remarketable securities.
The Trusts may incur remarketing fees of 0.10% on the aggregate principal amount of all the VRDP Shares, which, if any, are included in remarketing fees on Preferred Shares in the Statements of Operations. All of the remarketable VRDP Shares that were tendered for remarketing during the year ended August 31, 2012 were successfully remarketed.
The annualized dividend rates for the VRDP Shares for the year ended August 31, 2012 were as follows:
| | | | |
| | | Rate | |
BZM | | | 1.11 | % |
MHN | | | 0.35 | % |
BLJ | | | 1.11 | % |
BQH | | | 0.33 | % |
BSE | | | 0.33 | % |
BFY | | | 0.33 | % |
BHV | | | 1.11 | % |
MHE | | | 1.11 | % |
VRDP Shares issued and outstanding for MHN remained constant for the year ended August 31, 2012.
AMPS
The AMPS were redeemable at the option of each Trust, in whole or in part, on any dividend payment date at their liquidation preference per share plus any accumulated and unpaid dividends whether or not declared. The AMPS were also subject to mandatory redemption at their liquidation preference plus any accumulated and unpaid dividends, whether or not declared, if certain requirements relating to the composition of the assets and liabilities of a Trust, as set forth in each Trust’s Articles of Supplementary/Statement of Preferences and/or Certificate of Designation (the “Governing Instrument”) were not satisfied.
Dividends on seven-day AMPS were cumulative at a rate, which was reset every seven days, based on the results of an auction. If the AMPS failed to clear the auction on an auction date, each Trust was required to pay the maximum applicable rate on the AMPS to holders of such shares for successive dividend periods until such time as the shares were successfully auctioned. The maximum applicable rate on all series of AMPS was the higher of 110% of the AA commercial paper rate or 110% of 90% of the Kenny S&P 30-day High Grade Index rate divided by 1.00 minus the
marginal tax rate. The low, high and average dividend rates on the AMPS for each Trust for the year ended August 31, 2012 were as follows:
| | | | | | | | | | | | | | | | |
| | | Series | | | Low | | | High | | | Average | |
BZM | | | R7 | | | | 0.11 | % | | | 0.40 | % | | | 0.24 | % |
BLJ | | | M7 | | | | 0.11 | % | | | 0.40 | % | | | 0.24 | % |
BQH | | | T7 | | | | 0.21 | % | | | 0.27 | % | | | 0.25 | % |
BSE | | | R7 | | | | 0.23 | % | | | 0.27 | % | | | 0.25 | % |
BFY | | | W7 | | | | 0.24 | % | | | 0.27 | % | | | 0.26 | % |
BHV | | | R7 | | | | 0.11 | % | | | 0.40 | % | | | 0.24 | % |
MHE | | | A | | | | 0.11 | % | | | 0.38 | % | | | 0.24 | % |
| | | | B | | | | 0.11 | % | | | 0.38 | % | | | 0.24 | % |
From February 13, 2008 to the redemption dates listed below, the AMPS of the Trusts failed to clear any of their auctions. As a result, the AMPS dividend rates were reset to the maximum applicable rate, which ranged from 0.11% to 0.40% for the year ended August 31, 2012. A failed auction was not an event of default for the Trusts but it had a negative impact on the liquidity of AMPS. A failed auction occurs when there are more sellers of a trust’s AMPS than buyers.
During the year ended August 31, 2012, BZM, BLJ, BQH, BSE, BFY, BHV and MHE announced the following redemptions of AMPS at a price of $25,000 ($50,000 for MHE) per share plus any accrued and unpaid dividends through the redemption date:
| | | | | | | | | | | | | | | | |
| | | Series | | | Redemption Date | | | Shares Redeemed | | | Aggregate Principal | |
BZM | | | R7 | | | | 7/06/12 | | | | 640 | | | $ | 16,000,000 | |
BLJ | | | M7 | | | | 7/10/12 | | | | 751 | | | $ | 18,775,000 | |
BQH | | | T7 | | | | 10/12/11 | | | | 885 | | | $ | 22,125,000 | |
BSE | | | R7 | | | | 10/07/11 | | | | 1,623 | | | $ | 40,575,000 | |
BFY | | | W7 | | | | 10/06/11 | | | | 1,779 | | | $ | 44,475,000 | |
BHV | | | R7 | | | | 7/06/12 | | | | 467 | | | $ | 11,675,000 | |
MHE | | | A7 | | | | 6/21/12 | | | | 185 | | | $ | 9,250,000 | |
| | | | B7 | | | | 6/20/12 | | | | 185 | | | $ | 9,250,000 | |
During the year ended August 31, 2011, MHN announced the following redemptions of AMPS at a price of $25,000 per share plus any accrued and unpaid dividends through the redemption date:
| | | | | | | | | | | | | | | | |
| | | Series | | | Redemption Date | | | Shares Redeemed | | | Aggregate Principal | |
MHN | | | A | | | | 7/21/11 | | | | 1,479 | | | $ | 36,975,000 | |
| | | B | | | | 7/22/11 | | | | 1,479 | | | $ | 36,975,000 | |
| | | C | | | | 7/19/11 | | | | 2,366 | | | $ | 59,150,000 | |
| | | D | | | | 7/18/11 | | | | 2,864 | | | $ | 71,600,000 | |
| | | | E | | | | 7/20/11 | | | | 1,557 | | | $ | 38,925,000 | |
The Trusts financed the AMPS redemptions with proceeds received from the issuance of VRDP Shares as follows:
| | | | |
BZM | | $ | 16,000,000 | |
MHN | | $ | 243,600,000 | |
BLJ | | $ | 18,700,000 | |
BQH | | $ | 22,100,000 | |
BSE | | $ | 40,500,000 | |
BFY | | $ | 44,400,000 | |
BHV | | $ | 11,600,000 | |
MHE | | $ | 18,500,000 | |
| | | | | | |
| | | | | | | |
| 66 | | ANNUAL REPORT | | AUGUST 31, 2012 | | |
| | |
| Notes to Financial Statements (concluded) |
AMPS issued and outstanding remained constant during the year ended August 31, 2011 for BZM, BLJ, BQH, BSE, BFY, BHV and MHE.
8. Subsequent Events:
Management’s evaluation of the impact of all subsequent events on the Trusts’ financial statements was completed through the date the financial statements were issued and the following items were noted:
Each Trust paid a net investment income dividend on October 1, 2012 to Common Shareholders of record on September 14, 2012 as follows:
| | | | |
Common
Dividend
Per Share | |
BZM | | $ | 0.0665 | |
MHN | | $ | 0.0795 | |
BLJ | | $ | 0.0730 | |
BQH | | $ | 0.0740 | |
BSE | | $ | 0.0715 | |
BFY | | $ | 0.0810 | |
BHV | | $ | 0.0780 | |
MHE | | $ | 0.0625 | |
Additionally, the Trusts declared a net investment income dividend in the following amounts per share on October 1, 2012 payable to Common Shareholders of record on October 15, 2012:
| | | | |
Common Dividend
Per Share | |
BZM | | $ | 0.0665 | |
MHN | | $ | 0.0765 | |
BLJ | | $ | 0.0730 | |
BQH | | $ | 0.0710 | |
BSE | | $ | 0.0715 | |
BFY | | $ | 0.0770 | |
BHV | | $ | 0.0780 | |
MHE | | $ | 0.0625 | |
The dividends declared on VRDP Shares for the period September 1, 2012 to September 30, 2012 were as follows:
| | | | |
| | | Dividends Declared | |
BZM | | $ | 13,145 | |
MHN | | $ | 65,226 | |
BLJ | | $ | 15,364 | |
BQH | | $ | 5,302 | |
BSE | | $ | 9,716 | |
BFY | | $ | 10,651 | |
BHV | | $ | 9,530 | |
MHE | | $ | 15,199 | |
| | | | | | |
| | | | | | | |
| | ANNUAL REPORT | | AUGUST 31, 2012 | | 67 |
| | |
| Report of Independent Registered Public Accounting Firm |
To the Shareholders and Boards of Directors of
BlackRock MuniHoldings New York Quality Fund, Inc.
and to the Shareholders and Board of Trustees of:
BlackRock Maryland Municipal Bond Trust
BlackRock New Jersey Municipal Bond Trust
BlackRock New York Municipal Bond Trust
BlackRock New York Municipal Income Quality Trust
BlackRock New York Municipal Income Trust II
BlackRock Virginia Municipal Bond Trust and
The Massachusetts Health & Education Tax-Exempt Trust
(collectively, the “Trusts”):
We have audited the accompanying statements of assets and liabilities of BlackRock MuniHoldings New York Quality Fund, Inc., BlackRock Maryland Municipal Bond Trust, BlackRock New Jersey Municipal Bond Trust, BlackRock New York Municipal Bond Trust, BlackRock New York Municipal Income Quality Trust, BlackRock New York Municipal Income Trust II, BlackRock Virginia Municipal Bond Trust, and The Massachusetts Health & Education Tax-Exempt Trust, including the related schedules of investments as of August 31, 2012, and the related statements of operations and cash flows for the year then ended, the statements of changes in net assets for each of the two years in the period then ended, and the financial highlights for each of the periods presented. These financial statements and financial highlights are the responsibility of the Trusts’ management. Our responsibility is to express an opinion on these financial statements and financial highlights based on our audits.
We conducted our audits in accordance with the standards of the Public Company Accounting Oversight Board (United States). Those standards require that we plan and perform the audit to obtain reasonable assurance about whether the financial statements and financial highlights are free of material misstatement. The Trusts are not required to have, nor
were we engaged to perform an audit of their internal control over financial reporting. Our audits included consideration of internal control over financial reporting as a basis for designing audit procedures that are appropriate in the circumstances, but not for the purpose of expressing an opinion on the effectiveness of the Trusts’ internal control over financial reporting. Accordingly, we express no such opinion. An audit also includes examining, on a test basis, evidence supporting the amounts and disclosures in the financial statements, assessing the accounting principles used and significant estimates made by management, as well as evaluating the overall financial statement presentation. Our procedures included confirmation of the securities owned as of August 31, 2012, by correspondence with the custodians and brokers; where replies were not received from brokers, we performed other auditing procedures. We believe that our audits provide a reasonable basis for our opinion.
In our opinion, such financial statements and financial highlights referred to above present fairly, in all material respects, the financial positions of BlackRock MuniHoldings New York Quality Fund, Inc., BlackRock Maryland Municipal Bond Trust, BlackRock New Jersey Municipal Bond Trust, BlackRock New York Municipal Bond Trust, BlackRock New York Municipal Income Quality Trust, BlackRock New York Municipal Income Trust II, BlackRock Virginia Municipal Bond Trust, and The Massachusetts Health & Education Tax-Exempt Trust as of August 31, 2012, the results of their operations and cash flows for the year then ended, the changes in their net assets for each of the two years in the period then ended, and the financial highlights for each of the periods presented, in conformity with accounting principles generally accepted in the United States of America.
Deloitte & Touche LLP
Boston, Massachusetts
October 25, 2012
| | |
| Important Tax Information (Unaudited) | | |
All of the distributions paid by the Trusts during the fiscal year ended July 31, 2012 qualify as tax-exempt interest dividends for federal income tax purposes except for the following:
| | | | | | | | |
| BLJ | | Payable Date | | | Ordinary Income1 | |
Common Shareholders | | | 12/30/11 | | | $ | 0.001207 | |
| Preferred Shareholders: | | | | | | | | |
AMPS Series M-7 | | | 12/06/11 | | | $ | 0.110000 | |
| | 1 | | Additionally, all ordinary income distributions are comprised of interest related dividends for non-US residents and are eligible for exemption from US withholding tax for nonresident aliens and foreign corporations. |
| | | | | | |
| | | | |
| | | | | | | |
| 68 | | ANNUAL REPORT | | AUGUST 31, 2012 | | |
| | |
| Disclosure of Investment Advisory Agreements and Sub-Advisory Agreements |
The Board of Directors or Trustees, as applicable (each, a “Board,” collectively, the “Boards,” and the members of which are referred to as “Board Members”) of BlackRock Maryland Municipal Bond Trust (“BZM”), BlackRock MuniHoldings New York Quality Fund, Inc. (“MHN”), BlackRock New Jersey Municipal Bond Trust (“BLJ”), BlackRock New York Municipal Bond Trust (“BQH”), BlackRock New York Municipal Income Quality Trust (“BSE”), BlackRock New York Municipal Income Trust II (“BFY”), BlackRock Virginia Municipal Bond Trust (“BHV”), and The Massachusetts Health & Education Tax-Exempt Trust (MHE and together with BZM, MHN, BLJ, BQH, BSE, BFY and BHV, each a “Fund,” and, collectively, the “Funds”) met on April 26, 2012 and May 22-23, 2012 to consider the approval of each Fund’s investment advisory agreement (each, an “Advisory Agreement”) with BlackRock Advisors, LLC (the “Manager”), each Fund’s investment advisor. The Board of each Fund also considered the approval of the sub-advisory agreement (each, a “Sub-Advisory Agreement”) among the Manager, BlackRock Financial Management, Inc. or BlackRock Investment Management, LLC, as applicable (the “Sub-Advisor”), and its Fund. The Manager and the Sub-Advisor are referred to herein as “BlackRock.” The Advisory Agreements and the Sub-Advisory Agreements are referred to herein as the “Agreements.”
Activities and Composition of the Board
Each Board consists of eleven individuals, nine of whom are not “interested persons” of such Fund as defined in the Investment Company Act of 1940 (the “1940 Act”) (the “Independent Board Members”). The Board Members are responsible for the oversight of the operations of the Funds and perform the various duties imposed on the directors of investment companies by the 1940 Act. The Independent Board Members have retained independent legal counsel to assist them in connection with their duties. The Chairman of the Board is an Independent Board Member. Each Board has established six standing committees: an Audit Committee, a Governance and Nominating Committee, a Compliance Committee, a Performance Oversight Committee, an Executive Committee, and a Leverage Committee, each of which is chaired by an Independent Board Member and composed of Independent Board Members (except for the Executive Committee and the Leverage Committee, each of which also has one interested Board Member).
The Agreements
Pursuant to the 1940 Act, the Boards are required to consider the continuation of the Agreements on an annual basis. The Boards have four quarterly meetings per year, each extending over two days, and a fifth meeting to consider specific information surrounding the consideration of renewing the Agreements. In connection with this process, the Boards assessed, among other things, the nature, scope and quality of the services provided to the Funds by BlackRock, its personnel and its affiliates, including investment management, administrative and shareholder services, oversight of fund accounting and custody, marketing services, risk oversight, compliance and assistance in meeting applicable legal and regulatory requirements.
The Boards, acting directly and through their respective committees, considered at each of their meetings, and from time to time as appropriate, factors that are relevant to their annual consideration of the renewal of the Agreements, including the services and support provided
by BlackRock to the Funds and their shareholders. Among the matters the Boards considered were: (a) investment performance for one-, three- and five-year periods, as applicable, against peer funds, and applicable benchmarks, if any, as well as senior management’s and portfolio managers’ analysis of the reasons for any over performance or underperformance against their peers and/or benchmark, as applicable; (b) fees, including advisory, administration, if applicable, and other amounts paid to BlackRock and its affiliates by the Funds for services such as call center and fund accounting; (c) Fund operating expenses and how BlackRock allocates expenses to the Funds; (d) the resources devoted to, risk oversight of, and compliance reports relating to, implementation of the Funds’ investment objectives, policies and restrictions; (e) the Funds’ compliance with their Code of Ethics and other compliance policies and procedures; (f) the nature, cost and character of non-investment management services provided by BlackRock and its affiliates; (g) BlackRock’s and other service providers’ internal controls and risk and compliance oversight mechanisms; (h) BlackRock’s implementation of the proxy voting policies approved by the Boards; (i) execution quality of portfolio transactions; (j) BlackRock’s implementation of the Funds’ valuation and liquidity procedures; (k) an analysis of management fees ratios for products with similar investment objectives across the open-end fund, closed-end fund and institutional account product channels, as applicable; (l) BlackRock’s compensation methodology for its investment professionals and the incentives it creates; and (m) periodic updates on BlackRock’s business.
The Boards have engaged in an ongoing strategic review with BlackRock of opportunities to consolidate funds and of BlackRock’s commitment to investment performance. In addition, the Boards requested, to the extent reasonably possible, an analysis of the risk and return relative to selected funds in peer groups. BlackRock provides information to the Boards in response to specific questions. These questions covered issues such as profitability, including the impact of BlackRock’s upfront costs in sponsoring closed-end funds and the relative profitability of closed-end and open end funds, investment performance and management fee levels. The Boards considered the importance of: (i) managing fixed income assets with a view toward preservation of capital; (ii) portfolio managers’ investments in the funds they manage; (iii) BlackRock’s controls surrounding the coding of quantitative investment models; and (iv) BlackRock’s oversight of relationships with third party service providers.
The Boards considered BlackRock’s efforts during the past year with regard to refinancing outstanding AMPS, as well as ongoing time and resources devoted to other forms of preferred shares and alternative leverage. As of the date of this report, the Funds have redeemed 100% of their outstanding AMPS.
Board Considerations in Approving the Agreements
The Approval Process: Prior to the April 26, 2012 meeting, the Boards requested and received materials specifically relating to the Agreements. The Boards are engaged in a process with its independent legal counsel and BlackRock to review periodically the nature and scope of the information provided to better assist their deliberations. The materials provided in connection with the April meeting included (a) information
| | | | | | |
| | | | | | | |
| | ANNUAL REPORT | | AUGUST 31, 2012 | | 69 |
| | | | |
| Disclosure of Investment Advisory Agreements and Sub-Advisory Agreements (continued) |
independently compiled and prepared by Lipper, Inc. (“Lipper”) on Fund fees and expenses and the investment performance of the Funds as compared with a peer group of funds as determined by Lipper and a customized peer group selected by BlackRock (collectively, “Peers”); (b) information on the profitability of the Agreements to BlackRock and a discussion of fall-out benefits to BlackRock and its affiliates; (c) a general analysis provided by BlackRock concerning investment management fees (a combination of the advisory fee and the administration fee, if any) charged to other clients, such as institutional clients and open-end funds, under similar investment mandates, as applicable; (d) the existence, impact and sharing of potential economies of scale; (e) a summary of aggregate amounts paid by each Fund to BlackRock and (f) if applicable, a comparison of management fees to similar BlackRock closed-end funds, as classified by Lipper.
At an in-person meeting held on April 26, 2012, the Boards reviewed materials relating to their consideration of the Agreements. As a result of the discussions that occurred during the April 26, 2012 meeting, and as a culmination of the Boards’ year-long deliberative process, the Boards presented BlackRock with questions and requests for additional information. BlackRock responded to these requests with additional written information in advance of the May 22-23, 2012 Board meeting.
At an in-person meeting held on May 22-23, 2012, each Board, including all the Independent Board Members, unanimously approved the continuation of the Advisory Agreement between the Manager and its Fund, and the Sub-Advisory Agreement among the Manager, the Sub-Advisor, and its Fund, each for a one-year term ending June 30, 2013. In approving the continuation of the Agreements, the Boards considered: (a) the nature, extent and quality of the services provided by BlackRock; (b) the investment performance of the Funds and BlackRock; (c) the advisory fee and the cost of the services and profits to be realized by BlackRock and its affiliates from their relationship with the Funds; (d) economies of scale; (e) fall-out benefits to BlackRock as a result of its relationship with the Funds; and (f) other factors deemed relevant by the Board Members.
The Boards also considered other matters they deemed important to the approval process, such as payments made to BlackRock or its affiliates relating to securities lending, services related to the valuation and pricing of Fund portfolio holdings, direct and indirect benefits to BlackRock and its affiliates from their relationship with the Funds and advice from independent legal counsel with respect to the review process and materials submitted for the Boards’ review. The Boards noted the willingness of BlackRock personnel to engage in open, candid discussions with the Boards. The Boards did not identify any particular information as controlling, and each Board Member may have attributed different weights to the various items considered.
A. Nature, Extent and Quality of the Services Provided by BlackRock: The Boards, including the Independent Board Members, reviewed the nature, extent and quality of services provided by BlackRock, including the investment advisory services and the resulting performance of the Funds. Throughout the year, the Boards compared Fund performance to the
performance of a comparable group of closed-end funds and/or the performance of a relevant benchmark, if any. The Boards met with BlackRock’s senior management personnel responsible for investment operations, including the senior investment officers. Each Board also reviewed the materials provided by its Fund’s portfolio management team discussing Fund performance and the Fund’s investment objective, strategies and outlook.
The Boards considered, among other factors, the number, education and experience of BlackRock’s investment personnel generally and their Funds’ portfolio management teams, investments by portfolio managers in the funds they manage, BlackRock’s portfolio trading capabilities, BlackRock’s use of technology, BlackRock’s commitment to compliance, BlackRock’s credit analysis capabilities, BlackRock’s risk analysis and oversight capabilities and BlackRock’s approach to training and retaining portfolio managers and other research, advisory and management personnel. The Boards engaged in a review of BlackRock’s compensation structure with respect to their Funds’ portfolio management teams and BlackRock’s ability to attract and retain high-quality talent and create performance incentives.
In addition to advisory services, the Boards considered the quality of the administrative and non-investment advisory services provided to the Funds. BlackRock and its affiliates provide the Funds with certain services (in addition to any such services provided to the Funds by third parties) and officers and other personnel as are necessary for the operations of the Funds. In particular, BlackRock and its affiliates provide the Funds with the following administrative services including, among others: (i) preparing disclosure documents, such as the prospectus and the statement of additional information in connection with the initial public offering and periodic shareholder reports; (ii) preparing communications with analysts to support secondary market trading of the Funds; (iii) assisting with daily accounting and pricing; (iv) preparing periodic filings with regulators and stock exchanges; (v) overseeing and coordinating the activities of other service providers; (vi) organizing Board meetings and preparing the materials for such Board meetings; (vii) providing legal and compliance support; and (viii) performing other administrative functions necessary for the operation of the Funds, such as tax reporting, fulfilling regulatory filing requirements and call center services. The Boards reviewed the structure and duties of BlackRock’s fund administration, accounting, legal and compliance departments and considered BlackRock’s policies and procedures for assuring compliance with applicable laws and regulations.
B. The Investment Performance of the Funds and BlackRock: The Boards, including the Independent Board Members, also reviewed and considered the performance history of their Funds. In preparation for the April 26, 2012 meeting, the Boards worked with its independent legal counsel, BlackRock and Lipper to develop a template for, and was provided with reports independently prepared by Lipper, which included a comprehensive analysis of each Fund’s performance. The Boards also reviewed a narrative and statistical analysis of the Lipper data that was prepared by BlackRock, which analyzed various factors that affect Lipper’s rankings. In
| | | | | | |
| | | | |
| | | | | | | |
| 70 | | ANNUAL REPORT | | AUGUST 31, 2012 | | |
| | |
| Disclosure of Investment Advisory Agreements and Sub-Advisory Agreements (continued) |
connection with their review, each Board received and reviewed information regarding the investment performance, based on net asset value (NAV), of its Fund as compared to funds in that Fund’s applicable Lipper category, and a customized peer group selected by BlackRock. The Boards were provided with a description of the methodology used by Lipper to select peer funds and periodically meets with Lipper representatives to review their methodology. Each Board and its Performance Oversight Committee regularly review, and meet with Fund management to discuss, the performance of its Fund throughout the year.
The Board of each of BZM, MHN, BLJ, BFY, BHV and MHE noted that, in general, its respective Fund performed better than its Peers in that the Fund’s performance was at or above the median of its Customized Lipper Peer Group Composite in each of the one-, three- and five-year periods reported. Based on its discussions with BlackRock and the Board’s review of its respective Fund’s investment performance compared to its Lipper Peer Group, the methodology used by Lipper to select peer funds, and other relevant information provided by BlackRock, the Board of each of BZM, MHN, BLJ, BFY, BHV and MHE noted that its respective Fund’s investment performance as compared to its Customized Lipper Peer Group Composite provided a more meaningful comparison of the Fund’s relative performance. The composite performance metric is a measurement blend of total return and yield.
The Board of BQH noted that BQH performed below the median of its Customized Lipper Peer Group Composite in the one- and three-year periods reported, but that BQH performed at or above the median of its Customized Lipper Peer Group Composite in the five-year period reported. Based on its discussions with BlackRock and the Board’s review of BQH’s investment performance compared to its Lipper Peer Group, the methodology used by Lipper to select peer funds, and other relevant information provided by BlackRock, BQH’s Board noted that BQH’s investment performance as compared to its Customized Lipper Peer Group Composite provided a more meaningful comparison of BQH’s relative performance. The composite performance metric is a measurement blend of total return and yield. The Board of BQH and BlackRock reviewed and discussed the reasons for BQH’s underperformance during the one- and three-year periods compared with its Peers. BQH’s Board was informed that, among other things, BQH’s underperformance for the one- and three-year periods mainly stems from a below market total return. Older higher coupon securities, while helping to provide a competitive distribution yield, were negatively impacted by their shorter effective maturities. This limited BQH’s upside appreciation and resulted in reduced total return when compared to the Customized Lipper Peer Group Composite. BQH’s Board and BlackRock discussed BlackRock’s strategy for improving BQH’s performance and BlackRock’s commitment to providing the resources necessary to assist BQH’s portfolio managers and to improve BQH’s performance.
The Board of BSE noted that, in general, BSE performed better than its Peers in that BSE’s performance was at or above the median of its Customized Lipper Peer Group Composite in two of the one-, three- and five-year periods reported. Based on its discussions with BlackRock and the Board’s review of BSE’s investment performance compared to its Lipper Peer Group, the methodology used by Lipper to select peer funds, and other relevant information provided by BlackRock, BSE’s Board noted
that BSE’s investment performance as compared to its Customized Lipper Peer Group Composite provided a more meaningful comparison of BSE’s relative performance. The composite performance metric is a measurement blend of total return and yield.
C. Consideration of the Advisory/Management Fees and the Cost of the Services and Profits to be Realized by BlackRock and its Affiliates from their Relationship with the Funds: Each Board, including the Independent Board Members, reviewed its Fund’s contractual management fee rate compared with the other funds in its Lipper category. It also compared the Fund’s total expense ratio, as well as actual management fee rate, to those of other funds in its Lipper category. The Boards considered the services provided and the fees charged by BlackRock to other types of clients with similar investment mandates, including separately managed institutional accounts.
The Boards received and reviewed statements relating to BlackRock’s financial condition and profitability with respect to the services it provided the Funds. The Boards were also provided with a profitability analysis that detailed the revenues earned and the expenses incurred by BlackRock for services provided to the Funds. The Boards reviewed BlackRock’s profitability with respect to the Funds and other funds the Boards currently oversee for the year ended December 31, 2011 compared to available aggregate profitability data provided for the years ended December 31, 2010, and December 31, 2009. The Boards reviewed BlackRock’s profitability with respect to other fund complexes managed by the Manager and/or its affiliates. The Boards reviewed BlackRock’s assumptions and methodology of allocating expenses in the profitability analysis, noting the inherent limitations in allocating costs among various advisory products. The Boards recognized that profitability may be affected by numerous factors including, among other things, fee waivers and expense reimbursements by the Manager, the types of funds managed, expense allocations and business mix, and the difficulty of comparing profitability as a result of those factors.
The Boards noted that, in general, individual fund or product line profitability of other advisors is not publicly available. The Boards considered BlackRock’s overall operating margin, in general, compared to the operating margin for leading investment management firms whose operations include advising closed-end funds, among other product types. In addition, the Boards considered, among other things, certain third party data comparing BlackRock’s operating margin with that of other publicly-traded asset management firms. The Boards considered the differences between BlackRock and these other firms, including the contribution of technology at BlackRock, BlackRock’s expense management, and the relative product mix.
In addition, the Boards considered the cost of the services provided to the Funds by BlackRock, and BlackRock’s and its affiliates’ profits relating to the management of the Funds and the other funds advised by BlackRock and its affiliates. As part of its analysis, the Boards reviewed BlackRock’s methodology in allocating its costs to the management of the Funds. The Boards also considered whether BlackRock has the financial resources necessary to attract and retain high quality investment management personnel to perform its obligations under the Agreements and to con-
| | | | | | |
| | | | | | | |
| | ANNUAL REPORT | | AUGUST 31, 2012 | | 71 |
| | | | |
| Disclosure of Investment Advisory Agreements and Sub-Advisory Agreements (concluded) |
tinue to provide the high quality of services that is expected by the Boards.
The Board of each of BZM, BLJ and BHV noted that its respective Fund’s contractual management fee ratio (a combination of the advisory fee and the administration fee, if any) was above the median contractual management fee ratio paid by the Fund’s Peers, in each case before taking into account any expense reimbursements or fee waivers. The Board of each of BZM, BLJ and BHV also noted, however, that its respective Fund’s actual management fee ratio, after giving effect to any expense reimbursements or fee waivers by BlackRock, was reasonable relative to the median actual management fee ratio paid by the Fund’s Peers, after giving effect to any expense reimbursements or fee waivers.
The Board of each of MHN, BSE, BFY and MHE noted that its respective Fund’s contractual management fee ratio (a combination of the advisory fee and the administration fee, if any) was lower than or equal to the median contractual management fee ratio paid by the Fund’s Peers, in each case before taking into account any expense reimbursements or fee waivers.
The Board of BQH noted that BQH’s contractual management fee ratio (a combination of the advisory fee and the administration fee, if any) was above the median contractual management fee ratio paid by BQH’s Peers, in each case before taking into account any expense reimbursements or fee waivers. BQH’s Board also noted, however, that BQH’s contractual management fee ratio was reasonable relative to the median contractual management fee ratio paid by BQH’s peers.
D. Economies of Scale: Each Board, including the Independent Board Members, considered the extent to which economies of scale might be realized as the assets of its Fund increase. Each Board also considered the extent to which its Fund benefits from such economies and whether there should be changes in the advisory fee rate or structure in order to enable the Fund to participate in these economies of scale, for example through the use of breakpoints in the advisory fee based upon the asset level of the Fund.
Based on the Boards’ review and consideration of the issue, the Boards concluded that most closed-end funds do not have fund level breakpoints because closed-end funds generally do not experience substantial growth after the initial public offering. They are typically priced at scale at a fund’s inception. The Boards noted that only one closed-end fund in the Fund Complex has breakpoints in its advisory fee structure.
E. Other Factors Deemed Relevant by the Board Members: The Boards, including the Independent Board Members, also took into account other ancillary or “fall-out” benefits that BlackRock or its affiliates may derive from their respective relationships with the Funds, both tangible and
intangible, such as BlackRock’s ability to leverage its investment professionals who manage other portfolios and risk management personnel, an increase in BlackRock’s profile in the investment advisory community, and the engagement of BlackRock’s affiliates as service providers to the Funds, including securities lending and cash management services. The Boards also considered BlackRock’s overall operations and its efforts to expand the scale of, and improve the quality of, its operations. The Boards also noted that BlackRock may use and benefit from third party research obtained by soft dollars generated by certain registered fund transactions to assist in managing all or a number of its other client accounts. The Boards further noted that they had considered the investment by BlackRock’s funds in exchange traded funds (i.e., ETFs) without any offset against the management fees payable by the funds to BlackRock.
In connection with its consideration of the Agreements, the Boards also received information regarding BlackRock’s brokerage and soft dollar practices. The Boards received reports from BlackRock which included information on brokerage commissions and trade execution practices throughout the year.
The Boards noted the competitive nature of the closed-end fund marketplace, and that shareholders are able to sell their Fund shares in the secondary market if they believe that the Fund’s fees and expenses are too high or if they are dissatisfied with the performance of the Fund.
Conclusion
Each Board, including all the Independent Board Members, unanimously approved the continuation of the Advisory Agreement between the Manager and its Fund for a one-year term ending June 30, 2013, and the Sub-Advisory Agreement among the Manager, the Sub-Advisor, and its Fund for a one-year term ending June 30, 2013. Based upon its evaluation of all of the aforementioned factors in their totality, the Boards, including the Independent Board Members, were satisfied that the terms of the Agreements were fair and reasonable and in the best interest of the Funds and their shareholders. In arriving at their decision to approve the Agreements, the Boards did not identify any single factor or group of factors as all-important or controlling, but considered all factors together, and different Board Members may have attributed different weights to the various factors considered. The Independent Board Members were also assisted by the advice of independent legal counsel in making these determinations. The contractual fee arrangements for the Funds reflect the results of several years of review by the Board Members and predecessor Board Members, and discussions between such Board Members (and predecessor Board Members) and BlackRock. As a result, the Board Members’ conclusions may be based in part on their consideration of these arrangements in prior years.
| | | | | | |
| | | | | | | |
| 72 | | ANNUAL REPORT | | AUGUST 31, 2012 | | |
| | |
| Automatic Dividend Reinvestment Plans |
Pursuant to each Trust’s Dividend Reinvestment Plan (the “Reinvestment Plan”), Common Shareholders are automatically enrolled to have all distributions of dividends and capital gains reinvested by Computershare Shareowner Services for MHN and MHE and Computershare Trust Company, N.A. for BZM, BLJ, BQH, BSE, BFY and BHV (individually, the “Reinvestment Plan Agent” or together, the “Reinvestment Plan Agents”) in the respective Trust’s shares pursuant to the Reinvestment Plan. Shareholders who do not participate in the Reinvestment Plan will receive all distributions in cash paid by check and mailed directly to the shareholders of record (or if the shares are held in street name or other nominee name, then to the nominee) by the Reinvestment Plan Agent, which serves as agent for the shareholders in administering the Reinvestment Plan.
After the Trusts declare a dividend or determine to make a capital gain distribution, the Reinvestment Plan Agents will acquire shares for the participants’ accounts, depending upon the following circumstances, either (i) through receipt of unissued but authorized shares from the Trusts (“newly issued shares”) or (ii) by purchase of outstanding shares on the open market or on the Trust’s primary exchange (“open-market purchases”). If, on the dividend payment date, the net asset value per share (“NAV”) is equal to or less than the market price per share plus estimated brokerage commissions (such condition often referred to as a “market premium”), the Reinvestment Plan Agent will invest the dividend amount in newly issued shares acquired on behalf of the participants. The number of newly issued shares to be credited to each participant’s account will be determined by dividing the dollar amount of the dividend by the NAV on the date the shares are issued. However, if the NAV is less than 95% of the market price on the dividend payment date, the dollar amount of the dividend will be divided by 95% of the market price on the dividend payment date. If, on the dividend payment date, the NAV is greater than the market price per share plus estimated brokerage commissions (such condition often referred to as a “market discount”), the Reinvestment Plan Agent will invest the dividend amount in shares acquired on behalf of the participants in open-market purchases. If the Reinvestment Plan Agent is unable to invest the full dividend amount in open-market purchases, or if the market discount shifts to a market premium during the purchase period, the Reinvestment Plan Agent will invest any un-invested portion in newly issued shares. Investments in newly issued shares made in this manner would be made pursuant to the same process described above and the date of issue for such newly issued shares will substitute for the dividend payment date.
Participation in the Reinvestment Plan is completely voluntary and may be terminated or resumed at any time without penalty by notice if received and processed by the Reinvestment Plan Agent prior to the dividend record date. Additionally, the Reinvestment Plan Agent seeks to process notices received after the record date but prior to the payable date and such notices often will become effective by the payable date. Where late notices are not processed by the applicable payable date, such termination or resumption will be effective with respect to any subsequently declared dividend or other distribution.
The Reinvestment Plan Agent’s fees for the handling of the reinvestment of dividends and distributions will be paid by each Trust. However, each participant will pay a pro rata share of brokerage commissions incurred with respect to the Reinvestment Plan Agent’s open market purchases in connection with the reinvestment of dividends and distributions. The automatic reinvestment of dividends and distributions will not relieve participants of any federal income tax that may be payable on such dividends or distributions.
Each Trust reserves the right to amend or terminate the Reinvestment Plan. There is no direct service charge to participants in the Reinvestment Plan. However, each Trust reserves the right to amend the Reinvestment Plan to include a service charge payable by the participants. Participants in BZM, BLJ, BQH, BSE, BFY and BHV that request a sale of shares are subject to a $2.50 sales fee and a $0.15 per share fee. Per share fees include any applicable brokerage commissions the Reinvestment Plan Agent is required to pay. Participants in MHN and MHE that request a sale of shares are subject to a $0.02 per share sold brokerage commission. All correspondence concerning the Reinvestment Plan should be directed to Computershare Shareowner Services LLC, P.O. Box 358035, Pittsburgh, PA 15252-8035, Telephone: (866) 216-0242 for shareholders of MHN and MHE. For shareholders of BZM, BLJ, BQH, BSE, BFY and BHV, contact Computershare Trust Company, N.A. through the internet at www.computershare.com/investor, or in writing to Computershare, P.O. Box 43078, Providence, RI 02940-3078, Telephone: (800) 699-1236. Overnight correspondence should be directed to the Reinvestment Plan Agent at 250 Royall Street, Canton, MA 02021.
| | | | | | |
| | | | | | | |
| | ANNUAL REPORT | | AUGUST 31, 2012 | | 73 |
| | | | | | | | | | |
Name, Address and Year of Birth | | Position(s) Held with Trusts | | Length of Time
Served as
a Trustee2 | | Principal Occupation(s) During Past Five Years | | Number of BlackRock-
Advised Registered
Investment Companies
(“RICs”) Consisting of investment Portfolios
(“Portfolios”) Overseen | | Public Directorships |
| Independent Trustees1 | | | | | | | | | | |
Richard E. Cavanagh 55 East 52nd Street New York, NY 10055 1946 | | Chairman of the Board and Trustee | | Since 2007 | | Trustee, Aircraft Finance Trust from 1999 to 2009; Director, The Guardian Life Insurance Company of America since 1998; Director, Arch Chemical (chemical and allied products) from 1999 to 2011; Trustee, Educational Testing Service from 1997 to 2009 and Chairman thereof from 2005 to 2009; Senior Advisor, The Fremont Group since 2008 and Director thereof since 1996; Adjunct Lecturer, Harvard University since 2007; President and Chief Executive Officer, The Conference Board, Inc. (global business research organization) from 1995 to 2007. | | 98 RICs consisting of 94 Portfolios | | None |
Karen P. Robards 55 East 52nd Street New York, NY 10055 1950 | | Vice Chairperson of the Board, Chairperson of the Audit Committee and Trustee | | Since 2007 | | Partner of Robards & Company, LLC (financial advisory firm) since 1987; Co-founder and Director of the Cooke Center for Learning and Development (a not-for-profit organization) since 1987; Director of Care Investment Trust, Inc. (health care real estate investment trust) from 2007 to 2010; Investment Banker at Morgan Stanley from 1976 to 1987. | | 98 RICs consisting of 94 Portfolios | | AtriCure, Inc. (medical devices) |
Michael J. Castellano 55 East 52nd Street New York, NY 10055 1946 | | Trustee and Member of the Audit Committee | | Since 2011 | | Managing Director and Chief Financial Officer of Lazard Group LLC from 2001 to 2011; Chief Financial Officer of Lazard Ltd from 2004 to 2011; Director, Support Our Aging Religious (non-profit) since 2009; Director, National Advisory Board of Church Management at Villanova University since 2010. | | 98 RICs consisting of 94 Portfolios | | None |
Frank J. Fabozzi 55 East 52nd Street New York, NY 10055 1948 | | Trustee and Member of the Audit Committee | | Since 2007 | | Editor of and Consultant for The Journal of Portfolio Management since 1986; Professor of Finance, EDHEC Business School since 2011; Professor in the Practice of Finance and Becton Fellow, Yale University School of Management from 2006 to 2011; Adjunct Professor of Finance and Becton Fellow, Yale University from 1994 to 2006. | | 98 RICs consisting of 94 Portfolios | | None |
Kathleen F. Feldstein 55 East 52nd Street New York, NY 10055 1941 | | Trustee | | Since 2007 | | President of Economics Studies, Inc. (private economic consulting firm) since 1987; Chair, Board of Trustees, McLean Hospital from 2000 to 2008 and Trustee Emeritus thereof since 2008; Member of the Board of Partners Community Healthcare, Inc. from 2005 to 2009; Member of the Corporation of Partners HealthCare since 1995; Trustee, Museum of Fine Arts, Boston since 1992; Member of the Visiting Committee to the Harvard University Art Museum since 2003; Director, Catholic Charities of Boston since 2009. | | 98 RICs consisting of 94 Portfolios | | The McClatchy Company (publishing); Bell South (telecommunications); Knight Ridder (publishing) |
James T. Flynn 55 East 52nd Street New York, NY 10055 1939 | | Trustee and Member of the Audit Committee | | Since 2007 | | Chief Financial Officer of JPMorgan & Co., Inc. from 1990 to 1995. | | 98 RICs consisting of 94 Portfolios | | None |
Jerrold B. Harris 55 East 52nd Street New York, NY 10055 1942 | | Trustee | | Since 2007 | | Trustee, Ursinus College since 2000; Director, Troemner LLC (scientific equipment) since 2000; Director of Delta Waterfowl Foundation since 2001; President and Chief Executive Officer, VWR Scientific Products Corporation from 1990 to 1999. | | 98 RICs consisting of 94 Portfolios | | BlackRock Kelso Capital Corp. (business development company) |
R. Glenn Hubbard 55 East 52nd Street New York, NY 10055 1958 | | Trustee | | Since 2007 | | Dean, Columbia Business School since 2004; Columbia faculty member since 1988; Co-Director, Columbia Business School’s Entrepreneurship Program from 1997 to 2004; Chairman, U.S. Council of Economic Advisers under the President of the United States from 2001 to 2003; Chairman, Economic Policy Committee of the OECD from 2001 to 2003. | | 98 RICs consisting of 94 Portfolios | | ADP (data and information services); KKR Financial Corporation (finance); Metropolitan Life Insurance Company (insurance) |
| | | | | | |
| | | | | | | |
| 74 | | ANNUAL REPORT | | AUGUST 31, 2012 | | |
| | |
| Officers and Trustees (continued) | | |
| | | | | | | | | | |
Name, Address and Year of Birth | | Position(s) Held with Trusts | | Length of Time
Served as
a Trustee2 | | Principal Occupation(s) During Past Five Years | | Number of BlackRock-
Advised Registered
Investment Companies
(“RICs”) Consisting of investment Portfolios
(“Portfolios”) Overseen | | Public Directorships |
| Independent Trustees1 (concluded) | | | | | | | | |
W. Carl Kester 55 East 52nd Street New York, NY 10055 1951 | | Trustee and Member of the Audit Committee | | Since 2007 | | George Fisher Baker Jr. Professor of Business Administration, Harvard Business School; Deputy Dean for Academic Affairs from 2006 to 2010; Chairman of the Finance Department, Harvard Business School from 2005 to 2006; Senior Associate Dean and Chairman of the MBA Program of Harvard Business School from 1999 to 2005; Member of the faculty of Harvard Business School since 1981. | | 98 RICs consisting of 94 Portfolios | | None |
| | 1 Trustees serve until their resignation, removal or death, or until December 31 of the year in which they turn 72. The maximum age limitation may be waived as to any Trustee by action of a majority of the Trustees upon finding good cause thereof. In 2011, the Board of Trustees unanimously approved extending the mandatory retirement age for James T. Flynn by one additional year, which the Board believes would be in the best interest of shareholders. |
| | 2 Date shown is the earliest date a person has served for the Trusts covered by this annual report. Following the combination of Merrill Lynch Investment Managers, L.P. (“MLIM”) and BlackRock, Inc. (“BlackRock”) in September 2006, the various legacy MLIM and legacy BlackRock fund boards were realigned and consolidated into three new fund boards in 2007. As a result, although the chart shows certain Trustees as joining the Trusts’ board in 2007, each Trustee first became a member of the board of other legacy MLIM or legacy BlackRock Funds as follows: Richard E. Cavanagh, 1994; Frank J. Fabozzi, 1988; Kathleen F. Feldstein, 2005; James T. Flynn, 1996; Jerrold B. Harris, 1999; R. Glenn Hubbard, 2004; W. Carl Kester, 1995; and Karen P. Robards, 1998. |
| Interested Trustees3 | | |
Paul L. Audet 55 East 52nd Street New York, NY 10055 1953 | | Trustee | | Since 2011 | | Senior Managing Director of BlackRock and Head of U.S. Mutual Funds since 2011; Chair of the U.S. Mutual Funds Committee reporting to the Global Executive Committee since 2011; Head of BlackRock’s Real Estate business from 2008 to 2011; Member of BlackRock’s Global Operating and Corporate Risk Management Committees and of the BlackRock Alternative Investors Executive Committee and Investment Committee for the Private Equity Fund of Funds business since 2008; Head of BlackRock’s Global Cash Management business from 2005 to 2010; Acting Chief Financial Officer of BlackRock from 2007 to 2008; Chief Financial Officer of BlackRock from 1998 to 2005. | | 160 RICs consisting of 278 Portfolios | | None |
Henry Gabbay 55 East 52nd Street New York, NY 10055 1947 | | Trustee | | Since 2007 | | Consultant, BlackRock from 2007 to 2008; Managing Director, BlackRock from 1989 to 2007; Chief Administrative Officer, BlackRock Advisors, LLC from 1998 to 2007; President of BlackRock Funds and BlackRock Bond Allocation Target Shares from 2005 to 2007; Treasurer of certain closed-end funds in the BlackRock fund complex from 1989 to 2006. | | 160 RICs consisting of 278 Portfolios. | | None |
| | 3 Mr. Audet is an “interested person,” as defined in the 1940 Act, of the Trusts based on his position with BlackRock and its affiliates. Mr. Gabbay is an “interested person” of the Trusts based on his former positions with BlackRock and its affiliates as well as his ownership of BlackRock and The PNC Financial Services Group, Inc. securities. Mr. Audet and Mr. Gabbay are also Directors of the BlackRock registered open-end funds. Trustees serve until their resignation, removal or death, or until December 31 of the year in which they turn 72. The maximam age limitation may be waived as to any Trustee by action of a majority of the Trustees upon finding good cause thereof. |
| | | | | | |
| | | | | | | |
| | ANNUAL REPORT | | AUGUST 31, 2012 | | 75 |
| | |
| Officers and Trustees (continued) | | |
| | | | | | |
Name, Address
and Year of Birth | | Position(s)
Held with
Trusts | | Length of
Time Served | | Principal Occupation(s) During Past Five Years |
| Officers1 | | | | | | |
John M. Perlowski
55 East 52nd Street
New York, NY 10055
1964 | | President and Chief Executive Officer | | Since
2011 | | Managing Director of BlackRock since 2009; Global Head of BlackRock Fund Administration since 2009; Managing Director and Chief Operating Officer of the Global Product Group at Goldman Sachs Asset Management, L.P. from 2003 to 2009; Treasurer of Goldman Sachs Mutual Funds from 2003 to 2009 and Senior Vice President thereof from 2007 to 2009; Director of Goldman Sachs Offshore Funds from 2002 to 2009; Director of Family Resource Network (charitable foundation) since 2009. |
Anne Ackerley
55 East 52nd Street
New York, NY 10055
1962 | | Vice
President | | Since 20072 | | Managing Director of BlackRock since 2000; Chief Marketing Officer of BlackRock since 2012; President and Chief Executive Officer of the BlackRock-advised funds from 2009 to 2011; Vice President of the BlackRock-advised funds from 2007 to 2009; Chief Operating Officer of BlackRock’s Global Client Group since 2009 to 2012; Chief Operating Officer of BlackRock’s U.S. Retail Group from 2006 to 2009; Head of BlackRock’s Mutual Fund Group from 2000 to 2006. |
Brendan Kyne
55 East 52nd Street
New York, NY 10055
1977 | | Vice
President | | Since
2009 | | Managing Director of BlackRock since 2010; Director of BlackRock from 2008 to 2009; Head of Product Development and Management for BlackRock’s U.S. Retail Group since 2009 and Co-head thereof from 2007 to 2009; Vice President of BlackRock from 2005 to 2008. |
Robert W. Crothers 55 East 52nd Street New York, NY 10055 1981 | | Vice
President | | Since
2012 | | Director of BlackRock since 2011; Vice President of BlackRock from 2008 to 2010; Associate of BlackRock from 2006 to 2007. |
Neal Andrews
55 East 52nd Street
New York, NY 10055
1966 | | Chief
Financial
Officer | | Since
2007 | | Managing Director of BlackRock since 2006; Senior Vice President and Line of Business Head of Fund Accounting and Administration at PNC Global Investment Servicing (U.S.) Inc. from 1992 to 2006. |
Jay Fife 55 East 52nd Street New York, NY 10055 1970 | | Treasurer | | Since
2007 | | Managing Director of BlackRock since 2007; Director of BlackRock in 2006; Assistant Treasurer of the MLIM and Fund Asset Management, L.P. advised funds from 2005 to 2006; Director of MLIM Fund Services Group from 2001 to 2006. |
Brian Kindelan
55 East 52nd Street
New York, NY 10055
1959 | | Chief Compliance Officer and Anti-Money Laundering Officer | | Since
2007 | | Chief Compliance Officer of the BlackRock-advised funds since 2007; Managing Director and Senior Counsel of BlackRock since 2005. |
Janey Ahn
55 East 52nd Street
New York, NY 10055
1975 | | Secretary | | Since
2012 | | Director of BlackRock since 2009; Vice President of BlackRock from 2008 to 2009; Assistant Secretary of the Funds from 2008 to 2012; Associate at Willkie Farr & Gallagher LLP from 2006 to 2008. |
| | 1 Officers of the Trusts serve at the pleasure of the Board. |
| | | 2 Ms. Ackerley was President and Chief Executive Officer from 2009 to 2011. |
Effective May 22, 2012, Robert W. Crothers became Vice President of the Trusts.
Effective May 22, 2012, Ira P. Shapiro resigned as Secretary of the Trusts and Janey Ahn became Secretary of the Trusts.
| | | | | | |
| | | | | | | |
| 76 | | ANNUAL REPORT | | AUGUST 31, 2012 | | |
Officers and Trustees (concluded)
| | | | | | | | |
Investment Advisor
BlackRock Advisors, LLC Wilmington, DE 19809 Sub-Advisors
BlackRock Financial
Management, Inc.1
New York, NY 10055 BlackRock Investment
Management LLC2 Princeton, NJ 08540 | | Custodians
State Street Bank and
Trust Company3
Boston, MA 02110 The Bank of
New York Mellon4
New York, NY 10286 Transfer Agent Common Shares Computershare Trust
Company, N.A.
Canton, MA 02021 | | VRDP Tender and Paying Agent
The Bank of New York Mellon
New York, NY 10289 VRDP Liquidity Providers
Bank of America, N.A.4
New York, NY 10036 Citibank, N.A.5 New York, NY 10179 Morgan Stanley Bank, N.A.6 New York, NY 10036 VRDP Remarketing Agents Merrill Lynch, Pierce,
Fenner & Smith Incorporated4 New York, NY 10036 Citigroup Global Markets, Inc.5 New York, NY 10179 Morgan Stanley & Co. LLC6 New York, NY 10036 | | Accounting Agent
State Street Bank
and Trust Company
Boston, MA 02110 Independent Registered Public Accounting Firm Deloitte & Touche LLP
Boston, MA 02116 | | Legal Counsel
Skadden, Arps, Slate, Meagher & Flom LLP
New York, NY 10036 Address of the Trusts
100 Bellevue Parkway Wilmington, DE 19809 |
1 For all Trusts except MHN and MHE. 2 For MHN and MHE. 3 For all Trusts except MHN. 4 For MHN. 5 For BZM, BLJ, BHV and MHE. 6 For BQH, BSE and BFY. | | | | | | |
| | | | | | |
| | | | | | | |
| | ANNUAL REPORT | | AUGUST 31, 2012 | | 77 |
The Annual Meeting of Shareholders was held on July 27, 2012 for shareholders of record on May 31, 2012 to elect trustee nominees for each Trust. There were no broker non-votes with regard to any of the Trusts.
Approved the Class II Trustees as follows:
| | | | | | | | | | | | | | | | | | | | | | | | | | | | | | | | | | | | |
| | | Frank J. Fabozzi¹ | | | James T. Flynn | | | Karen P. Robards | |
| | | Votes For | | | Votes
Withheld | | | Abstain | | | Votes For | | | Votes
Withheld | | | Abstain | | | Votes For | | | Votes
Withheld | | | Abstain | |
BZM | | | 509 | | | | 116 | | | | 0 | | | | 2,003,791 | | | | 14,309 | | | | 0 | | | | 2,003,945 | | | | 14,155 | | | | 0 | |
BLJ | | | 550 | | | | 173 | | | | 0 | | | | 2,056,185 | | | | 157,629 | | | | 0 | | | | 2,081,009 | | | | 132,805 | | | | 0 | |
BSE | | | 405 | | | | 0 | | | | 0 | | | | 5,799,207 | | | | 371,785 | | | | 0 | | | | 5,811,303 | | | | 359,689 | | | | 0 | |
BQH | | | 221 | | | | 0 | | | | 0 | | | | 2,573,937 | | | | 99,145 | | | | 0 | | | | 2,573,937 | | | | 99,145 | | | | 0 | |
BFY | | | 444 | | | | 0 | | | | 0 | | | | 4,271,798 | | | | 417,856 | | | | 0 | | | | 4,515,743 | | | | 173,911 | | | | 0 | |
BHV | | | 251 | | | | 188 | | | | 0 | | | | 1,484,699 | | | | 38,846 | | | | 0 | | | | 1,484,699 | | | | 38,846 | | | | 0 | |
For the Trusts listed above, Trustees whose term of office continued after the Annual Meeting of Shareholders because they were not up for election are Paul L. Audet, Michael J. Castellano, Richard E. Cavanagh, Kathleen F. Feldstein, Henry Gabbay, Jerrold B. Harris, R. Glen Hubbard and W. Carl Kester.
| ¹ | | Voted on by holders of Preferred Shares only. |
Approved the Trustees as follows:
| | | | | | | | | | | | | | | | | | | | | | | | | | | | | | | | | | | | |
| | | Paul L. Audet | | | Michael J. Castellano | | | Richard E. Cavanagh | |
| | | Votes For | | | Votes
Withheld | | | Abstain | | | Votes For | | | Votes
Withheld | | | Abstain | | | Votes For | | | Votes
Withheld | | | Abstain | |
MHN | | | 27,617,499 | | | | 1,014,322 | | | | 0 | | | | 27,617,796 | | | | 1,014,025 | | | | 0 | | | | 27,619,049 | | | | 1,012,772 | | | | 0 | |
MHE | | | 2,180,929 | | | | 28,608 | | | | 0 | | | | 2,180,929 | | | | 28,608 | | | | 0 | | | | 2,181,319 | | | | 28,218 | | | | 0 | |
| | | | | | | | | | | | | | | | | | | | | | | | | | | | | | | | | | | | |
| | | Frank J. Fabozzi2 | | | Kathleen F. Feldstein | | | James T. Flynn | |
| | | Votes For | | | Votes
Withheld | | | Abstain | | | Votes For | | | Votes
Withheld | | | Abstain | | | Votes For | | | Votes
Withheld | | | Abstain | |
MHN | | | 2,436 | | | | 0 | | | | 0 | | | | 27,309,447 | | | | 1,322,374 | | | | 0 | | | | 27,314,443 | | | | 1,317,378 | | | | 0 | |
MHE | | | 358 | | | | 0 | | | | 0 | | | | 2,180,929 | | | | 28,608 | | | | 0 | | | | 2,180,929 | | | | 28,608 | | | | 0 | |
| | | | | | | | | | | | | | | | | | | | | | | | | | | | | | | | | | | | |
| | | Henry Gabbay | | | Jerrold B. Harris | | | R. Glenn Hubbard | |
| | | Votes For | | | Votes
Withheld | | | Abstain | | | Votes For | | | Votes
Withheld | | | Abstain | | | Votes For | | | Votes
Withheld | | | Abstain | |
MHN | | | 27,617,098 | | | | 1,014,723 | | | | 0 | | | | 27,319,710 | | | | 1,312,111 | | | | 0 | | | | 27,595,896 | | | | 1,035,925 | | | | 0 | |
MHE | | | 2,180,929 | | | | 28,608 | | | | 0 | | | | 2,180,929 | | | | 28,608 | | | | 0 | | | | 2,180,929 | | | | 28,608 | | | | 0 | |
| | | | | | | | | | | | | | | | | | | | | | | | | | | | | | | | | | | | |
| | | | | | | | | | | | | | | | | | | | | | | | |
| | | W. Carl Kester¹ | | | Karen P. Robards | |
| | | Votes For | | | Votes
Withheld | | | Abstain | | | Votes For | | | Votes
Withheld | | | Abstain | |
MHN | | | 2,436 | | | | 0 | | | | 0 | | | | 27,611,487 | | | | 1,020,334 | | | | 0 | |
MHE | | | 358 | | | | 0 | | | | 0 | | | | 2,180,929 | | | | 28,608 | | | | 0 | |
| 2 | | Voted on by holders of Preferred Shares only. |
| | | | | | |
| | | | | | | |
| 78 | | ANNUAL REPORT | | AUGUST 31, 2012 | | |
| | | | |
| Additional Information (continued) | | |
Certain Trusts are listed for trading on the NYSE and have filed with the NYSE their annual chief executive officer certification regarding compliance with the NYSE’s listing standards. The Trusts filed with the SEC the
certification of their chief executive officer and chief financial officer required by section 302 of the Sarbanes-Oxley Act.
Each Trust’s dividend policy is to distribute all or a portion of its net investment income to its shareholders on a monthly basis. In order to provide shareholders with a more stable level of dividend distributions, the Trusts may at times pay out less than the entire amount of net investment income earned in any particular month and may at times in any particular month pay out such accumulated but undistributed income in addition to net investment income earned in that month. As a result,
the dividends paid by the Trusts for any particular month may be more or less than the amount of net investment income earned by the Trusts during such month. The Trusts’ current accumulated but undistributed net investment income, if any, is disclosed in the Statements of Assets and Liabilities, which comprises part of the financial information included in this report.
On July 29, 2010, the Manager announced that a derivative complaint had been filed by shareholders of BSE and BQH on July 27, 2010 in the Supreme Court of the State of New York, New York County. The complaint named the Manager, BlackRock, Inc. and certain of the trustees, officers and portfolio managers of BSE and BQH as defendants. The complaint alleged, among other things, that the parties named in the complaint breached fiduciary duties owed to BSE and BQH and their Common Shareholders by redeeming auction-market preferred shares, auction rate preferred securities, auction preferred shares and auction rate securities (collectively, “AMPS”) at their liquidation preference. The complaint sought unspecified damages for losses purportedly suffered by BSE and BQH as a result of the prior redemptions and injunctive relief preventing BSE and BQH from redeeming AMPS at their liquidation preference in the future. On March 15, 2012, the Supreme Court of the State of New York, New York County entered an order consolidating the above-referenced derivative complaint with another derivative complaint, containing almost identical allegations, already pending in that court. The court on March 15, 2012, also granted plaintiffs permission to file an amended complaint. On April 16, 2012, the plaintiffs filed a Consolidated Shareholder Derivative Complaint containing allegations substantially similar to those in the original complaint. Defendants moved to dismiss the Consolidated Shareholder Derivative Complaint on July 20, 2012. Plaintiffs on September 14, 2012 moved to hold the defendants’ motion to dismiss in abeyance and allow plaintiffs limited discovery of the Demand Review Committee of the Board of Directors, including depositions of its members and documents upon which they relied. The Manager, BlackRock, Inc. and the other parties named in the complaint believe that the claims asserted in the complaint are without merit and intend to vigorously defend themselves in the litigation.
On November 10, 2011, the Board of MHE approved the removal of MHE’s non-fundamental investment policy requiring that counterparties with respect to interest rate swap, cap or floor transactions (“Interest Rate Transactions”) be rated in the highest rating category of at least one NRSRO (e.g., AAA/Aaa). As a result of this investment policy change,
MHE may enter into Interest Rate Transactions with any counterparties approved by the Manager. Such counterparties may entail a greater degree of credit risk or risk of nonperformance than counterparties rated in the highest rating category of a NRSRO (e.g., AAA/Aaa). The Manager will seek to minimize MHE’s exposure to counterparty risk by entering into Interest Rate Transactions with counterparties the Manager believes to be creditworthy at the time they enter into such transactions. To the extent MHE engages in Interest Rate Transactions, shareholders of MHE will be dependent on the analytical ability of the Manager to evaluate the credit quality of counter-parties to such transactions. In the event of the insolvency of a counter-party, MHE may not be able to recover its assets, in full or at all, during the insolvency process. In addition, counterparties to investments may have no obligation to make markets in such investments and may have the ability to apply essentially discretionary margin and credit requirements. The foregoing investment policy amendment will not alter MHE’s investment objective.
The Trusts do not make available copies of their Statements of Additional Information because the Trusts’ shares are not continuously offered, which means that the Statement of Additional Information of each Trust has not been updated after completion of the respective Trust’s offerings and the information contained in each Trust’s Statement of Additional Information may have become outdated.
During the period, there were no material changes in the Trusts’ investment objectives or policies or to the Trusts’ charters or by-laws that would delay or prevent a change of control of the Trusts that were not approved by the shareholders or in the principal risk factors associated with investment in the Trusts. There have been no changes in the persons who are primarily responsible for the day-to-day management of the Trusts’ portfolios.
Quarterly performance, semi-annual and annual reports and other information regarding the Trusts may be found on BlackRock’s website, which can be accessed at http://www.blackrock.com. This reference to
| | | | | | |
| | | | | | | |
| | ANNUAL REPORT | | AUGUST 31, 2012 | | 79 |
| | |
| Additional Information (concluded) | | |
|
| General Information (concluded) |
BlackRock’s website is intended to allow investors public access to information regarding the Trusts and does not, and is not intended to, incorporate BlackRock’s website into this report.
Electronic Delivery
Electronic copies of most financial reports are available on the Trusts’ web-sites or shareholders can sign up for e-mail notifications of quarterly statements, annual and semi-annual reports by enrolling in the Trusts’ electronic delivery program.
Shareholders Who Hold Accounts with Investment Advisors, Banks or Brokerages:
Please contact your financial advisor to enroll. Please note that not all investment advisors, banks or brokerages may offer this service.
Householding
The Trusts will mail only one copy of shareholder documents, including annual and semi-annual reports and proxy statements, to shareholders with multiple accounts at the same address. This practice is commonly called “householding” and is intended to reduce expenses and eliminate duplicate mailings of shareholder documents. Mailings of your shareholder documents may be householded indefinitely unless you instruct us otherwise. If you do not want the mailing of these documents to be combined with those for other members of your household, please call the Trusts at (800) 441-7762.
Availability of Quarterly Schedule of Investments
The Trusts file their complete schedule of portfolio holdings with the SEC for the first and third quarters of each fiscal year on Form N-Q. The Trusts’ Forms N-Q are available on the SEC’s website at http://www.sec.gov and
may also be reviewed and copied at the SEC’s Public Reference Room in Washington, DC. Information on how to access documents on the SEC’s website without charge may be obtained by calling (800) SEC-0330. The Trusts’ Forms N-Q may also be obtained upon request and without charge by calling (800) 441-7762.
Availability of Proxy Voting Policies and Procedures
A description of the policies and procedures that the Trusts use to determine how to vote proxies relating to portfolio securities is available (1) without charge, upon request, by calling (800) 441-7762; (2) at http://www.blackrock.com; and (3) on the SEC’s website at http://www.sec.gov.
Availability of Proxy Voting Record
Information about how the Trusts voted proxies relating to securities held in the Trusts’ portfolios during the most recent 12-month period ended June 30 is available upon request and without charge (1) at http://www.blackrock.com or by calling (800) 441-7762 and (2) on the SEC’s website at http://www.sec.gov.
Availability of Trust Updates
BlackRock will update performance and certain other data for the Trusts on a monthly basis on its website in the “Closed-end Funds” section of http://www.blackrock.com. Investors and others are advised to periodically check the website for updated performance information and the release of other material information about the Trusts. This reference to BlackRock’s website is intended to allow investors public access to information regarding the Trusts and does not, and is not intended to, incorporate BlackRock’s website into this report.
|
| BlackRock Privacy Principles |
BlackRock is committed to maintaining the privacy of its current and former fund investors and individual clients (collectively, “Clients”) and to safeguarding their non-public personal information. The following information is provided to help you understand what personal information BlackRock collects, how we protect that information and why in certain cases we share such information with select parties.
If you are located in a jurisdiction where specific laws, rules or regulations require BlackRock to provide you with additional or different privacy-related rights beyond what is set forth below, then BlackRock will comply with those specific laws, rules or regulations.
BlackRock obtains or verifies personal non-public information from and about you from different sources, including the following: (i) information we receive from you or, if applicable, your financial intermediary, on applications, forms or other documents; (ii) information about your transactions with us, our affiliates, or others; (iii) information we receive from a consumer reporting agency; and (iv) from visits to our websites.
BlackRock does not sell or disclose to non-affiliated third parties any non-public personal information about its Clients, except as permitted by law or as is necessary to respond to regulatory requests or to service Client accounts. These non-affiliated third parties are required to protect the confidentiality and security of this information and to use it only for its intended purpose.
We may share information with our affiliates to service your account or to provide you with information about other BlackRock products or services that may be of interest to you. In addition, BlackRock restricts access to non-public personal information about its Clients to those BlackRock employees with a legitimate business need for the information. BlackRock maintains physical, electronic and procedural safeguards that are designed to protect the non-public personal information of its Clients, including procedures relating to the proper storage and disposal of such information.
| | | | | | |
| | | | | | | |
| 80 | | ANNUAL REPORT | | AUGUST 31, 2012 | | |
This report is transmitted to shareholders only. It is not a prospectus. Past performance results shown in this report should not be considered a representation of future performance. The Trusts have leveraged their Common Shares, which creates risks for Common Shareholders, including the likelihood of greater volatility of net asset value and market price of the Common Shares and the risk that fluctuations in the short-term dividend rates of the Preferred Shares may reduce the Common Shares’ yield. Statements and other information herein are as dated and are subject to change.

| | |
| #CEF-STMUNI-8-8/12-AR | |  |
| Item 2 – | Code of Ethics – The registrant (or the “Fund”) has adopted a code of ethics, as of the end of the period covered by this report, applicable to the registrant’s principal executive officer, principal financial officer, principal accounting officer or controller, or persons performing similar functions. During the period covered by this report, there have been no amendments to or waivers granted under the code of ethics. A copy of the code of ethics is available without charge at www.blackrock.com. |
| Item 3 – | Audit Committee Financial Expert – The registrant’s board of directors (the “board of directors”), has determined that (i) the registrant has the following audit committee financial experts serving on its audit committee and (ii) each audit committee financial expert is independent: |
Frank J. Fabozzi
James T. Flynn
W. Carl Kester
Karen P. Robards
The registrant’s board of directors has determined that W. Carl Kester and Karen P. Robards qualify as financial experts pursuant to Item 3(c)(4) of Form N-CSR.
Prof. Kester has a thorough understanding of generally accepted accounting principles, financial statements and internal control over financial reporting as well as audit committee functions. Prof. Kester has been involved in providing valuation and other financial consulting services to corporate clients since 1978. Prof. Kester’s financial consulting services present a breadth and level of complexity of accounting issues that are generally comparable to the breadth and complexity of issues that can reasonably be expected to be raised by the registrant’s financial statements.
Ms. Robards has a thorough understanding of generally accepted accounting principles, financial statements and internal control over financial reporting as well as audit committee functions. Ms. Robards has been President of Robards & Company, a financial advisory firm, since 1987. Ms. Robards was formerly an investment banker for more than 10 years where she was responsible for evaluating and assessing the performance of companies based on their financial results. Ms. Robards has over 30 years of experience analyzing financial statements. She also is a member of the audit committee of one publicly held company and a non-profit organization.
Under applicable securities laws, a person determined to be an audit committee financial expert will not be deemed an “expert” for any purpose, including without limitation for the purposes of Section 11 of the Securities Act of 1933, as a result of being designated or identified as an audit committee financial expert. The designation or identification as an audit committee financial expert does not impose on such person any duties, obligations, or liabilities greater than the duties, obligations, and liabilities imposed on such person as a member of the audit committee and board of directors in the absence of such designation or identification. The designation or identification of a person as an audit committee financial expert does not affect the duties, obligations, or liability of any other member of the audit committee or board of directors.
2
| Item 4 – | Principal Accountant Fees and Services |
The following table presents fees billed by Deloitte & Touche LLP (“D&T”) in each of the last two fiscal years for the services rendered to the Fund:
| | | | | | | | | | | | | | | | |
| | | (a) Audit Fees | | (b) Audit-Related Fees1 | | (c) Tax Fees2 | | (d) All Other Fees3 |
| Entity Name | | Current
Fiscal Year
End | | Previous
Fiscal Year
End | | Current
Fiscal Year
End | | Previous
Fiscal Year
End | | Current
Fiscal Year
End | | Previous
Fiscal Year
End | | Current
Fiscal Year
End | | Previous
Fiscal Year
End |
BlackRock New York Municipal Bond Trust | | $29,200 | | $29,200 | | $0 | | $5,800 | | $7,800 | | $7,300 | | $0 | | $0 |
The following table presents fees billed by D&T that were required to be approved by the registrant’s audit committee (the “Committee”) for services that relate directly to the operations or financial reporting of the Fund and that are rendered on behalf of BlackRock Advisors, LLC (“Investment Adviser” or “BlackRock”) and entities controlling, controlled by, or under common control with BlackRock (not including any sub-adviser whose role is primarily portfolio management and is subcontracted with or overseen by another investment adviser) that provide ongoing services to the Fund (“Fund Service Providers”):
| | | | |
| | | Current Fiscal Year End | | Previous Fiscal Year End |
(b) Audit-Related Fees1 | | $0 | | $0 |
(c) Tax Fees2 | | $0 | | $0 |
(d) All Other Fees3 | | $2,970,000 | | $3,030,000 |
1 The nature of the services includes assurance and related services reasonably related to the performance of the audit of financial statements not included in Audit Fees.
2 The nature of the services includes tax compliance, tax advice and tax planning.
3 Aggregate fees borne by BlackRock in connection with the review of compliance procedures and attestation thereto performed by D&T with respect to all of the registered closed-end funds and some of the registered open-end funds advised by BlackRock.
(e)(1) Audit Committee Pre-Approval Policies and Procedures:
The Committee has adopted policies and procedures with regard to the pre-approval of services. Audit, audit-related and tax compliance services provided to the registrant on an annual basis require specific pre-approval by the Committee. The Committee also must approve other non-audit services provided to the registrant and those non-audit services provided to the Investment Adviser and Fund Service Providers that relate directly to the operations and the financial reporting of the registrant. Certain of these non-audit services that the Committee believes are a) consistent with the SEC’s auditor independence rules and b) routine and recurring services that will not impair the independence of the independent accountants may be approved by the Committee without consideration on a specific case-by-case basis (“general pre-approval”). The term of any general pre-approval is 12 months from the date of the pre-approval, unless the Committee provides for a different period. Tax or other non-audit services provided to the registrant which have a direct impact on the operations or financial reporting of the registrant will only be deemed pre-approved provided that any individual project does not exceed $10,000 attributable to the registrant or $50,000 per project. For this purpose, multiple projects will be aggregated to determine if they exceed the previously mentioned cost levels.
Any proposed services exceeding the pre-approved cost levels will require specific pre-approval by the Committee, as will any other services not subject to general pre-approval (e.g.,
3
unanticipated but permissible services). The Committee is informed of each service approved subject to general pre-approval at the next regularly scheduled in-person board meeting. At this meeting, an analysis of such services is presented to the Committee for ratification. The Committee may delegate to the Committee Chairman the authority to approve the provision of and fees for any specific engagement of permitted non-audit services, including services exceeding pre-approved cost levels.
(e)(2) None of the services described in each of Items 4(b) through (d) were approved by the Committee pursuant to the de minimis exception in paragraph (c)(7)(i)(C) of Rule 2-01 of Regulation S-X.
(f) Not Applicable
(g) The aggregate non-audit fees paid to the accountant for services rendered by the accountant to the registrant, the Investment Adviser and the Fund Service Providers were:
| | | | |
Entity Name | | Current Fiscal Year
End | | Previous Fiscal Year
End |
BlackRock New York Municipal Bond Trust | | $7,800 | | $13,100 |
Additionally, SSAE 16 Review (Formerly, SAS No. 70) fees for the current and previous fiscal years of $2,970,000 and $3,030,000, respectively, were billed by D&T to the Investment Adviser.
(h) The Committee has considered and determined that the provision of non-audit services that were rendered to the Investment Adviser, and the Fund Service Providers that were not pre-approved pursuant to paragraph (c)(7)(ii) of Rule 2-01 of Regulation S-X is compatible with maintaining the principal accountant’s independence.
| Item 5 – | Audit Committee of Listed Registrants |
| | (a) | The following individuals are members of the registrant’s separately-designated standing audit committee established in accordance with Section 3(a)(58)(A) of the Securities Exchange Act of 1934 (15 U.S.C. 78c(a)(58)(A)): |
Michael Castellano
Frank J. Fabozzi
James T. Flynn
W. Carl Kester
Karen P. Robards
(a) The registrant’s Schedule of Investments is included as part of the Report to Stockholders filed under Item 1 of this form.
(b) Not Applicable due to no such divestments during the semi-annual period covered since the previous Form N-CSR filing.
4
| Item 7 – | Disclosure of Proxy Voting Policies and Procedures for Closed-End Management Investment Companies – The board of directors has delegated the voting of proxies for the Fund’s portfolio securities to the Investment Adviser pursuant to the Investment Adviser’s proxy voting guidelines. Under these guidelines, the Investment Adviser will vote proxies related to Fund securities in the best interests of the Fund and its stockholders. From time to time, a vote may present a conflict between the interests of the Fund’s stockholders, on the one hand, and those of the Investment Adviser, or any affiliated person of the Fund or the Investment Adviser, on the other. In such event, provided that the Investment Adviser’s Equity Investment Policy Oversight Committee, or a sub-committee thereof (the “Oversight Committee”) is aware of the real or potential conflict or material non-routine matter and if the Oversight Committee does not reasonably believe it is able to follow its general voting guidelines (or if the particular proxy matter is not addressed in the guidelines) and vote impartially, the Oversight Committee may retain an independent fiduciary to advise the Oversight Committee on how to vote or to cast votes on behalf of the Investment Adviser’s clients. If the Investment Adviser determines not to retain an independent fiduciary, or does not desire to follow the advice of such independent fiduciary, the Oversight Committee shall determine how to vote the proxy after consulting with the Investment Adviser’s Portfolio Management Group and/or the Investment Adviser’s Legal and Compliance Department and concluding that the vote cast is in its client’s best interest notwithstanding the conflict. A copy of the Fund’s Proxy Voting Policy and Procedures are attached as Exhibit 99.PROXYPOL. Information on how the Fund voted proxies relating to portfolio securities during the most recent 12-month period ended June 30 is available without charge, (i) at www.blackrock.com and (ii) on the SEC’s website at http://www.sec.gov. |
| Item 8 – | Portfolio Managers of Closed-End Management Investment Companies – as of August 31, 2012. |
| | (a)(1) | The registrant is managed by a team of investment professionals comprised of Timothy Browse, Director at BlackRock, Theodore R. Jaeckel, Jr., CFA, Managing Director at BlackRock, and Walter O’Connor, Managing Director at BlackRock. Each of the foregoing professionals is a member of BlackRock’s municipal tax-exempt management group and is jointly responsible for the day-to-day management of the registrant’s portfolio, which includes setting the registrant’s overall investment strategy, overseeing the management of the registrant and/or selection of its investments. Messrs. Browse, Jaeckel and O’Connor have been members of the registrant’s portfolio management team since 2006. |
| | |
| Portfolio Manager | | Biography |
| Timothy Browse | | Director of BlackRock since 2008; Vice President of BlackRock from 2006 to 2007; Vice President of Merrill Lynch Investment Managers, L.P. (“MLIM”) from 2004 to 2006. |
| Theodore R. Jaeckel, Jr. | | Managing Director at BlackRock since 2006; Managing Director of MLIM from 2005 to 2006; Director of MLIM from 1997 to 2005. |
| Walter O’Connor | | Managing Director of BlackRock since 2006; Managing Director of MLIM from 2003 to 2006; Director of MLIM from 1998 to 2003. |
5
| | (a)(2) | As of August 31, 2012: |
| | | | | | | | | | | | |
| | | (ii) Number of Other Accounts Managed and Assets by Account Type | | (iii) Number of Other Accounts and Assets for Which Advisory Fee is Performance-Based |
(i) Name of Portfolio Manager | | Other Registered Investment Companies | | Other Pooled Investment Vehicles | | Other Accounts | | Other Registered Investment Companies | | Other
Pooled Investment Vehicles | | Other Accounts |
Timothy Browse | | 12 | | 0 | | 0 | | 0 | | 0 | | 0 |
| | | $3.76 Billion | | $0 | | $0 | | $0 | | $0 | | $0 |
Theodore R. Jaeckel, Jr. | | 63 | | 0 | | 0 | | 0 | | 0 | | 0 |
| | | $26.38 Billion | | $0 | | $0 | | $0 | | $0 | | $0 |
Walter O’Connor | | 63 | | 0 | | 0 | | 0 | | 0 | | 0 |
| | | $26.38 Billion | | 0 | | 0 | | 0 | | 0 | | 0 |
| | (iv) | Potential Material Conflicts of Interest |
BlackRock has built a professional working environment, firm-wide compliance culture and compliance procedures and systems designed to protect against potential incentives that may favor one account over another. BlackRock has adopted policies and procedures that address the allocation of investment opportunities, execution of portfolio transactions, personal trading by employees and other potential conflicts of interest that are designed to ensure that all client accounts are treated equitably over time. Nevertheless, BlackRock furnishes investment management and advisory services to numerous clients in addition to the Fund, and BlackRock may, consistent with applicable law, make investment recommendations to other clients or accounts (including accounts which are hedge funds or have performance or higher fees paid to BlackRock, or in which portfolio managers have a personal interest in the receipt of such fees), which may be the same as or different from those made to the Fund. In addition, BlackRock, its affiliates and significant shareholders and any officer, director, shareholder or employee may or may not have an interest in the securities whose purchase and sale BlackRock recommends to the Fund. BlackRock, or any of its affiliates or significant shareholders, or any officer, director, shareholder, employee or any member of their families may take different actions than those recommended to the Fund by BlackRock with respect to the same securities. Moreover, BlackRock may refrain from rendering any advice or services concerning securities of companies of which any of BlackRock’s (or its affiliates’ or significant shareholders’) officers, directors or employees are directors or officers, or companies as to which BlackRock or any of its affiliates or significant shareholders or the officers, directors and employees of any of them has any substantial economic interest or possesses material non-public information. Certain portfolio managers also may manage accounts whose investment strategies may at times be opposed to the strategy utilized for a fund. It should also be noted that a portfolio manager may be managing hedge fund and/or long only accounts, or may be part of a team managing hedge fund and/or long only accounts, subject to incentive fees. Such portfolio managers may therefore be entitled to receive a portion of any incentive fees earned on such accounts. Currently, the portfolio managers of this fund are not entitled to receive a portion of incentive fees of other accounts.
As a fiduciary, BlackRock owes a duty of loyalty to its clients and must treat each client fairly. When BlackRock purchases or sells securities for more than one account, the trades must be allocated in a manner consistent with its fiduciary duties. BlackRock attempts to allocate investments in a fair and equitable manner among client accounts, with no account receiving preferential treatment. To this end, BlackRock has adopted policies that are intended to ensure reasonable efficiency in client transactions and provide BlackRock with sufficient flexibility to allocate investments in a manner that is consistent with the particular investment discipline and client base, as appropriate.
6
| | (a)(3) | As of August 31, 2012: |
Portfolio Manager Compensation Overview
BlackRock’s financial arrangements with its portfolio managers, its competitive compensation and its career path emphasis at all levels reflect the value senior management places on key resources. Compensation may include a variety of components and may vary from year to year based on a number of factors. The principal components of compensation include a base salary, a performance-based discretionary bonus, participation in various benefits programs and one or more of the incentive compensation programs established by BlackRock.
Base compensation. Generally, portfolio managers receive base compensation based on their position with the firm.
Discretionary Incentive Compensation.
Discretionary incentive compensation is a function of several components: the performance of BlackRock, Inc., the performance of the portfolio manager’s group within BlackRock, the investment performance, including risk-adjusted returns, of the firm’s assets under management or supervision by that portfolio manager relative to predetermined benchmarks, and the individual’s performance and contribution to the overall performance of these portfolios and BlackRock. In most cases, these benchmarks are the same as the benchmark or benchmarks against which the performance of the Funds or other accounts managed by the portfolio managers are measured. Among other things, BlackRock’s Chief Investment Officers make a subjective determination with respect to each portfolio manager’s compensation based on the performance of the Fund and other accounts managed by each portfolio manager relative to the various benchmarks. Performance of fixed income funds is measured on a pre-tax and/or after-tax basis over various time periods including 1-, 3- and 5- year periods, as applicable. With respect to these portfolio managers, such benchmarks for the Fund and other accounts are:
| | |
| Portfolio Manager | | Benchmark |
| Timothy Browse | | A combination of market-based indices (e.g., Barclays Capital Muni Bond Index, Standard & Poor’s Municipal Bond Index), certain customized indices and certain fund industry peer groups. |
Theodore Jaeckel Walter O’Connor | | A combination of market-based indices (e.g., Barclays Capital Muni Bond Index, Standard & Poor’s Municipal Bond Index, Barclays Capital Taxable Municipal Build America Bonds Index), certain customized indices and certain fund industry peer groups. |
Distribution of Discretionary Incentive Compensation
Discretionary incentive compensation is distributed to portfolio managers in a combination of cash and BlackRock, Inc. restricted stock units which vest ratably over a number of years. For some portfolio managers, discretionary incentive compensation is also distributed in deferred cash awards that notionally track the returns of select BlackRock investment products they manage and that vest ratably over a number of years. The BlackRock, Inc. restricted stock units, upon vesting, will be settled in BlackRock, Inc. common stock. Typically, the cash portion of the discretionary incentive compensation, when combined with base salary, represents more than 60% of total compensation for the portfolio managers. Paying a portion of discretionary incentive compensation
7
in BlackRock stock puts compensation earned by a portfolio manager for a given year “at risk” based on BlackRock’s ability to sustain and improve its performance over future periods. Providing a portion of discretionary incentive compensation in deferred cash awards that notionally track the BlackRock investment products they manage provides direct alignment with investment product results.
Long-Term Incentive Plan Awards — From time to time long-term incentive equity awards are granted to certain key employees to aid in retention, align their interests with long-term shareholder interests and motivate performance. Equity awards are generally granted in the form of BlackRock, Inc. restricted stock units that, once vested, settle in BlackRock, Inc. common stock. Messrs. Jaeckel and O’Connor have each received long-term incentive awards.
Deferred Compensation Program — A portion of the compensation paid to eligible BlackRock employees may be voluntarily deferred at their election for defined periods of time into an account that tracks the performance of certain of the firm’s investment products. All of the eligible portfolio managers have participated in the deferred compensation program.
Other compensation benefits.
In addition to base compensation and discretionary incentive compensation, portfolio managers may be eligible to receive or participate in one or more of the following incentive savings plans. BlackRock, Inc. has created a variety of incentive savings plans in which BlackRock, Inc. employees are eligible to participate, including a 401(k) plan, the BlackRock Retirement Savings Plan (RSP), and the BlackRock Employee Stock Purchase Plan (ESPP). The employer contribution components of the RSP include a company match equal to 50% of the first 8% of eligible pay contributed to the plan capped at $5,000 per year, and a company retirement contribution equal to 3-5% of eligible compensation up to the IRS limit ($250,000 for 2012). The RSP offers a range of investment options, including registered investment companies and collective investment funds managed by the firm. BlackRock, Inc. contributions follow the investment direction set by participants for their own contributions or, absent participant investment direction, are invested into an index target date fund that corresponds to, or is closest to, the year in which the participant attains age 65. The ESPP allows for investment in BlackRock, Inc. common stock at a 5% discount on the fair market value of the stock on the purchase date. Annual participation in the ESPP is limited to the purchase of 1,000 shares of common stock or a dollar value of $25,000 based on its fair market value on the purchase date. Messrs. Browse, Jaeckel, and O’Connor are each eligible to participate in these plans.
(a)(4) Beneficial Ownership of Securities – As of August 31, 2012.
| | |
| Portfolio Manager | | Dollar Range of Equity Securities of the Fund Beneficially Owned |
Timothy Browse | | None |
Theodore R. Jaeckel, Jr. | | None |
Walter O’Connor | | None |
(b) Not Applicable
8
| Item 9 – | Purchases of Equity Securities by Closed-End Management Investment Company and Affiliated Purchasers – Not Applicable due to no such purchases during the period covered by this report. |
| Item 10 – | Submission of Matters to a Vote of Security Holders – There have been no material changes to these procedures. |
| Item 11 – | Controls and Procedures |
(a) – The registrant’s principal executive and principal financial officers, or persons performing similar functions, have concluded that the registrant’s disclosure controls and procedures (as defined in Rule 30a-3(c) under the Investment Company Act of 1940, as amended (the “1940 Act”)) are effective as of a date within 90 days of the filing of this report based on the evaluation of these controls and procedures required by Rule 30a-3(b) under the 1940 Act and Rule 13a-15(b) under the Securities Exchange Act of 1934, as amended.
(b) – There were no changes in the registrant’s internal control over financial reporting (as defined in Rule 30a-3(d) under the 1940 Act) that occurred during the second fiscal quarter of the period covered by this report that have materially affected, or are reasonably likely to materially affect, the registrant’s internal control over financial reporting.
| Item 12 – | Exhibits attached hereto |
(a)(1) – Code of Ethics – See Item 2
(a)(2) – Certifications – Attached hereto
(a)(3) – Not Applicable
(b) – Certifications – Attached hereto
9
Pursuant to the requirements of the Securities Exchange Act of 1934 and the Investment Company Act of 1940, the registrant has duly caused this report to be signed on its behalf by the undersigned, thereunto duly authorized.
| | | | | | |
| | BlackRock New York Municipal Bond Trust |
| | | |
| | By: | | /s/ John M. Perlowski | | |
| | | | John M. Perlowski | | |
| | | | Chief Executive Officer (principal executive officer) of BlackRock New York Municipal Bond Trust | | |
| |
| | Date: November 5, 2012 |
Pursuant to the requirements of the Securities Exchange Act of 1934 and the Investment Company Act of 1940, this report has been signed below by the following persons on behalf of the registrant and in the capacities and on the dates indicated.
| | | | | | |
| | By: | | /s/ John M. Perlowski | | |
| | | | John M. Perlowski | | |
| | | | Chief Executive Officer (principal executive officer) of BlackRock New York Municipal Bond Trust | | |
| | |
| | Date: November 5, 2012 | | |
| | | | | | | | |
| | By: | | /s/ Neal J. Andrews | | | | |
| | | | Neal J. Andrews | | | | |
| | | | Chief Financial Officer (principal financial officer) of BlackRock New York Municipal Bond Trust | | | | |
| | | |
| | Date: November 5, 2012 | | | | |
10