SECURITIES AND EXCHANGE COMMISSION
UNDER THE SECURITIES ACT OF 1933
(980) 365-7100
c/o C T Corporation System
28 Liberty Street
New York, NY 10005
(800) 448-5350
Carlton Fields
1025 Thomas Jefferson St., N.W.
Suite 400 West
Washington, DC 20007-5208
Large accelerated filer filer ☐ | Accelerated filer filer ☐ |
Non-accelerated filer ☒ | Smaller reporting company filer ☐ |
Emerging growth company filer ☐ |
6 | |
7 | |
11 | |
12 | |
15 | |
19 | |
20 | |
20 | |
20 | |
20 | |
21 | |
21 | |
21 | |
23 | |
23 | |
24 | |
24 | |
24 | |
25 | |
25 | |
25 | |
25 | |
25 | |
26 | |
26 | |
27 | |
27 | |
28 | |
28 | |
28 | |
33 | |
33 | |
35 | |
36 | |
37 | |
37 | |
37 | |
41 | |
41 | |
43 | |
43 | |
43 | |
46 | |
47 | |
47 | |
48 | |
48 | |
48 | |
48 |
68 | |
69 | |
69 | |
69 | |
69 | |
71 | |
73 | |
74 | |
74 | |
74 | |
75 | |
84 | |
100 | |
100 | |
100 | |
100 | |
100 | |
101 | |
102 | |
102 | |
102 | |
103 | |
103 | |
103 | |
104 | |
110 | |
110 | |
110 | |
113 | |
113 | |
114 | |
117 | |
A-1 | |
B-1 | |
C-1 | |
D-1 | |
E-1 | |
F-1 |
Contract | Individual single premium deferred index-linked separate account annuity contract. |
Purchase Payment | The minimum Purchase Payment: $25,000. Prior approval required for a Purchase Payment of less than $25,000 or $1,000,000 or more. |
Owner and Annuitant Issue Ages | 0-85 |
Contract Periods | The Contract has two periods: •The Accumulation Period, the period prior to the Annuity Date; and •The Annuity Period, which begins on the Annuity Date and during which Annuity Payments are provided. |
Account Value | The total of the Fixed Account Value, the value of the Shield Option(s), and the Holding Account value under the Contract during the Accumulation Period. |
Shield Option | Each Shield Option has an associated Term, Index, Shield Rate and Rate Crediting Type. |
Term | The Term may be 1, 2, 3, or 6 years in length. |
Index | The current Indices are as follows: •S&P 500® Index (Price Return Index); •Russell 2000® Index (Price Return Index); •MSCI EAFE Index (Price Return Index); and •Nasdaq-100 Index® (Price Return Index). |
Shield Rate | We currently offer different levels of protection: Shield 10 — A Shield Rate where negative Index Performance of up to 10% of your Investment Amount is absorbed by us at the Term End Date, which would leave you to absorb any remaining negative Index Performance of up to 90% of your Investment Amount. Shield 15 — A Shield Rate where negative Index Performance of up to 15% of your Investment Amount is absorbed by us at the Term End Date, which would leave you to absorb any remaining negative Index Performance of up to 85% of your Investment Amount. Shield 25 — A Shield Rate where negative Index Performance of up to 25% of your Investment Amount is absorbed by us at the Term End Date, which would leave you to absorb any remaining negative Index Performance of up to 75% of your Investment Amount. |
Rate Crediting Type | A Shield Option can only have one associated Rate Crediting Type: Cap Rate, Step Rate, or Step Rate Edge. |
Performance Lock | For any Shield Option, once during each Term you may elect to lock the Interim Value. Once an Interim Value is locked it is irrevocable for the remainder of that Term. The Performance Lock Value will be used as value of the Shield Option for the remainder of the Term. You can exercise Performance Lock by providing Notice of election on a particular Business Day to lock the Interim Value on that day. (See “PERFORMANCE LOCK.”) |
Interim Value | The Interim Value is designed to represent the fair value of the Shield Option on each Business Day between the Term Start Date and Term End Date, taking into account the potential gain or loss of the applicable Index at the end of the Term. The Interim Value reflects the change in fair value due to economic factors of the investment instruments (including derivatives) supporting the Shield Options. The Interim Value is the amount that is available for annuitization, death benefits, withdrawals, Surrenders, and Performance Lock. For each Shield Option, we assign the value of Interim Value on any Business Day other than the Term Start Date and Term End Date. The Interim Value may be less than the Investment Amount at the time the Interim Value is calculated even when the current Index Value is higher than it was on the Term Start Date. See “Interim Value Calculation.” |
Transfers | During the Accumulation Period you may only make transfers to or from the Fixed Account, to or from the Shield Option(s), and from the Holding Account. If you have not exercised Performance Lock, you may make transfers only during the Transfer Period following the Term End Date. The effective date of such transfer is the first day of the Fixed Account Term and/or the Term(s) in which the transfer is made. If you have exercised Performance Lock, you may transfer on any Contract Anniversary prior to the end of the Term and on the Term End Date. You may only transfer the entire amount of your Performance Lock Value on a Contract Anniversary that is not a Term End Date. On the Term End Date, you have the Transfer Period to transfer all or a portion of your Performance Lock Value. Partial transfers of a Shield Option (with or without Performance Lock) are not permitted, except during the Transfer Period. See “TRANSFERS.” |
Fixed Account | See Appendix D. |
Access to Your Money | You may withdraw some or all of your money at any time prior to the Annuity Date. For any withdrawal taken on a Term End Date, a Performance Rate Adjustment, as of the date of the withdrawal, will apply. For any withdrawal taken between the Term Start Date and the Term End Date, we use an Interim Value calculation, which will reduce the Investment Amount for that Shield Option by the percentage reduction in the Interim Value of that Shield Option. If you have exercised Performance Lock, a withdrawal will reduce your Performance Lock Value by the dollar amount of the withdrawal. The Performance Rate Adjustment and reduction (either proportionate or dollar for dollar) may be substantial. In addition, a withdrawal taken in excess of the Free Withdrawal Amount may be subject to a Withdrawal Charge. |
Withdrawal Charge | A percentage charge applied to withdrawals in excess of the Free Withdrawal Amount.The Free Withdrawal Amount is 0% in the first Contract Year, and 10% of Account Value in each subsequent Contract Year to the extent that amount has not already been withdrawn that Contract Year.The Withdrawal Charge is calculated at the time of each withdrawal in accordance with the following: |
Number of Complete Contract Years since Issue Date | Withdrawal Charge percentage | |||
0 | 7% | |||
1 | 7% | |||
2 | 6% | |||
3 | 5% | |||
4 | 4% | |||
5 | 3% | |||
6 or more | 0% | |||
See “WITHDRAWAL PROVISIONS — When No Withdrawal Charge Applies” for a list of Withdrawal Charge waivers. | ||||
Systematic Withdrawal Program | You may elect the Systematic Withdrawal Program to provide automated processing of amounts withdrawn from your Contract, subject to program terms. We do not assess a charge for the program and you may terminate your participation in the program at any time. Withdrawals under the Systematic Withdrawal Program are subject to the same Withdrawal Charge provisions and risks as any other withdrawals under the Contract. Moreover, since withdrawal amounts from a Shield Option will reduce the Investment Amount for that Shield Option by the percentage reduction in the Interim Value of that Shield Option, a withdrawal when Interim Value is less than the Investment Amount will cause a greater percentage reduction in the Investment Amount that remains in your Shield Option relative to the percentage reduction for the same withdrawal amount when Interim Value is greater than the Investment Amount. If you exercise Performance Lock on any Shield Option, the Performance Lock Value for that Shield Option will be reduced by the dollar amount of any subsequent withdrawals. Since withdrawals under the Systematic Withdrawal Program are automatic, you will have no control over the timing of those withdrawals. See “WITHDRAWAL PROVISIONS – Systematic Withdrawal Program” for availability and other restrictions. |
Death Benefit | For Owners age 81 or older at the Issue Date of the Contract, the standard death benefit is the Account Value. For Owners age 80 or younger at the Issue Date of the Contract, the standard death benefit (known as the Return of Premium death benefit) is the greater of the Account Value or your Purchase Payment (reduced proportionally by the percentage reduction in Account Value of the Shield Option(s), the Fixed Account, and the Holding Account for each partial withdrawal (including any applicable Withdrawal Charge)). The Death Benefit Amount is determined as of the end of the Business Day on which we receive Notice of due proof of death and an acceptable election for the payment method. |
Annuity Options | You can choose an Annuity Option. After Annuity Payments begin, you cannot change the Annuity Option. You can choose one of the following Annuity Options on a fixed payment basis or any other Annuity Option acceptable to us: (i) Life Annuity with 10 Years of Annuity Payments Guaranteed; and (ii)Joint and Last Survivor Annuity with 10 Years of Annuity Payments Guaranteed. The Annuity Options may be limited due to the requirements of the Code. |
Charges and Expenses | You will bear the following charges and expenses: (i)Withdrawal Charges; and (ii)Premium Tax and other taxes. |
Your Right to Cancel | You may cancel the Contract within 10 days after receiving it by mailing or delivering the Contract to either us or the financial representative who sold it. This is known as a “Free Look.” You will receive (i) whatever your Contract is worth, plus (ii) the sum of all fees, taxes and charges deducted from the Purchase Payment during the Free Look period, as of the effective date of the Free Look, on the Business Day we receive your Contract and we will not deduct a Withdrawal Charge. The amount you receive may be more or less than your Purchase Payment depending on the Shield Options you allocated your Purchase Payment to during the Free Look period. |
SHIELD OPTIONS | |
TERM | INDEX |
SHIELD 25 (up to 25% downside protection) | |
1 Year | S&P 500® Index Russell 2000® Index MSCI EAFE Index Nasdaq-100 Index® |
6 Year | S&P 500® Index Russell 2000® Index MSCI EAFE Index Nasdaq-100 Index® |
SHIELD 15 (up to 15% downside protection) | |
1 Year | S&P 500® Index S&P 500® Index Step Rate S&P 500® Index Step Rate Edge Russell 2000® Index Russell 2000® Index Step Rate Russell 2000® Index Step Rate Edge MSCI EAFE Index MSCI EAFE Index Step Rate MSCI EAFE Index Step Rate Edge Nasdaq-100 Index® Nasdaq-100 Index® Step Rate Nasdaq-100 Index® Step Rate Edge |
2 Year | S&P 500® Index Step Rate S&P 500® Index Step Rate Edge Russell 2000® Index Step Rate Russell 2000® Index Step Rate Edge MSCI EAFE Index Step Rate MSCI EAFE Index Step Rate Edge Nasdaq-100 Index® Step Rate Nasdaq-100 Index® Step Rate Edge |
3 Year | S&P 500® Index Russell 2000® Index MSCI EAFE Index Nasdaq-100 Index® |
6 Year | S&P 500® Index Russell 2000® Index MSCI EAFE Index Nasdaq-100 Index® |
SHIELD 10 (up to 10% downside protection) | |
SHIELD OPTIONS | |
TERM | INDEX |
1 Year | S&P 500® Index S&P 500® Index Step Rate S&P 500® Index Step Rate Edge Russell 2000® Index Russell 2000® Index Step Rate Russell 2000® Index Step Rate Edge MSCI EAFE Index MSCI EAFE Index Step Rate MSCI EAFE Index Step Rate Edge Nasdaq-100 Index® Nasdaq-100 Index® Step Rate Nasdaq-100 Index® Step Rate Edge |
2 Year | S&P 500® Index Step Rate S&P 500® Index Step Rate Edge Russell 2000® Index Step Rate Russell 2000® Index Step Rate Edge MSCI EAFE Index Step Rate MSCI EAFE Index Step Rate Edge Nasdaq-100 Index® Step Rate Nasdaq-100 Index® Step Rate Edge |
3 Year | S&P 500® Index Russell 2000® Index MSCI EAFE Index Nasdaq-100 Index® |
6 Year | S&P 500® Index Russell 2000® Index MSCI EAFE Index Nasdaq-100 Index® |
Shield Rate | Downside Protection |
Shield 10 | up to 10% |
Shield 15 | up to 15% |
Shield 25 | up to 25% |
Minimum Guaranteed Cap Rates | |||
Shield Rate | 1-Year Term | 3-Year Term | 6-Year Term |
Shield 10 | 5% | 15% | 30% |
Shield 15 | 4.5% | 13.5% | 27% |
Shield 25 | 3.5% | N/A | 21% |
Minimum Guaranteed Step Rates | ||
Shield Rate | 1-Year Term | 2-Year Term |
Shield 10 | 5% | 10% |
Shield 15 | 4.5% | 9% |
Minimum Guaranteed Edge Rates | ||
Shield Rate | 1-Year Term | 2-Year Term |
Shield 10 | 5% | 10% |
Shield 15 | 4.5% | 9% |
Shield Option type: | If Index Performance is: | Performance Rate will equal: |
Shield Options with a Cap Rate | less than or equal to zero | the lesser of: zero or the Index Performance increased by the Shield Rate (For example: a -15% Index Performance with Shield 10 will result in a -5% Performance Rate. The Performance Rate can never be greater than zero if the Index Performance is negative.) |
greater than zero and less than the Cap Rate | the Index Performance | |
greater than zero and equals or exceeds the Cap Rate | the Cap Rate | |
Shield Options with a Step Rate | less than zero | the lesser of: zero or the Index Performance increased by the Shield Rate (For example: a -15% Index Performance with Shield 10 will result in a -5% Performance Rate. The Performance Rate can never be greater than zero if the Index Performance is negative.) |
equal to or greater than zero | the Step Rate | |
Shield Options with Step Rate Edge | less than zero and exceeds the Shield Rate | Index Performance increased by the Shield Rate (For example: a -15% Index Performance with Shield 10 will result in a -5% Performance Rate.) |
less than zero but does not exceed the Shield Rate | the Edge Rate | |
zero or positive | the Edge Rate |
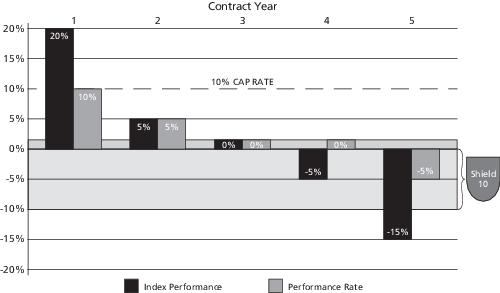
Contract Year | 1 | 2 | 3 | 4 | 5 |
Term Start Date | |||||
Investment Amount(1) | $50,000 | $55,000 | $57,750 | $57,750 | $57,750 |
Index Value | 1,000 | 1,200 | 1,260 | 1,260 | 1,197 |
Term End Date | |||||
Index Value | 1,200 | 1,260 | 1,260 | 1,197 | 1,017 |
Index Performance(2) | 20% | 5% | 0% | -5% | -15% |
Cap Rate | 10% | 10% | 10% | 10% | 10% |
Shield Rate | 10% | 10% | 10% | 10% | 10% |
Performance Rate (one year)(3) | 10% | 5% | 0% | 0% | -5% |
Performance Rate Adjustment(4) | $5,000 | $2,750 | $0 | $0 | -$2,888 |
Investment Amount(5) | $55,000 | $57,750 | $57,750 | $57,750 | $54,862 |
÷ 1,000 [Index Value at Term Start Date] = 20%
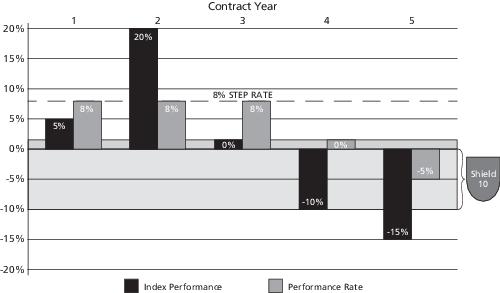
Contract Year | 1 | 2 | 3 | 4 | 5 |
Term Start Date | |||||
Investment Amount(1) | $50,000 | $54,000 | $58,320 | $62,986 | $62,986 |
Index Value | 1,000 | 1,050 | 1,260 | 1,260 | 1,134 |
Term End Date | |||||
Index Value | 1,050 | 1,260 | 1,260 | 1,134 | 964 |
Index Performance(2) | 5% | 20% | 0% | -10% | -15% |
Step Rate | 8% | 8% | 8% | 8% | 8% |
Shield Rate | 10% | 10% | 10% | 10% | 10% |
Performance Rate (one year)(3) | 8% | 8% | 8% | 0% | -5% |
Performance Rate Adjustment(4) | $4,000 | $4,320 | $4,666 | $0 | -$3,149 |
Investment Amount(5) | $54,000 | $58,320 | $62,986 | $62,986 | $59,837 |
÷ 1,000 [Index Value at Term Start Date]) = 5%
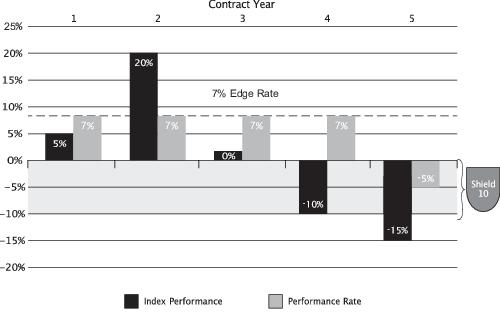
Contract Year | 1 | 2 | 3 | 4 | 5 |
Term Start Date | |||||
Investment Amount(1) | $50,000 | $53,500 | $57,245 | $61,252 | $65,540 |
Index Value | 1,000 | 1,050 | 1,260 | 1,260 | 1,134 |
Term End Date | |||||
Index Value | 1,050 | 1,260 | 1,260 | 1,134 | 964 |
Index Performance(2) | 5% | 20% | 0% | -10% | -15% |
Edge Rate | 7% | 7% | 7% | 7% | 7% |
Shield Rate | 10% | 10% | 10% | 10% | 10% |
Performance Rate (one year)(3) | 7% | 7% | 7% | 7% | -5% |
Performance Rate Adjustment(4) | $3,500 | $3,745 | $4,007 | $4,288 | -$3,277 |
Investment Amount(5) | $53,500 | $57,245 | $61,252 | $65,540 | $62,263 |
÷ 1,000 [Index Value at Term Start Date]) = 5%
Purchase Payment: $200,000.00
Allocated to:
Step Rate Edge | Step Rate | Cap Rate | Cap Rate | |
Term (in months) | 12 | 24 | 36 | 72 |
Months elapsed since Term Start Date | 0 | 0 | 0 | 0 |
Investment Amount | $50,000 | $50,000 | $50,000 | $50,000 |
Shield Rate | 10% | 15% | 10% | 25% |
Shield Option Rate | 8.25% | 18% | 130% | 200% |
Months until Term End Date | 12 | 24 | 36 | 72 |
Market Value Rate on Term Start Date | 2.00% | 4.00% | 6.00% | 8.00% |
Starting Index Value | 1,000 | |||
Total Account Value | $200,000 | |||
Step Rate Edge | Step Rate | Cap Rate | Cap Rate | |
Months elapsed since Term Start Date | 6 | |||
Months until Term End Date | 6 | 18 | 30 | 66 |
Index Value | 1200 | |||
Index Performance on calculation date(1) | 20% | |||
Market Value Rate on calculation date | 3.00% | 5.00% | 7.00% | 9.00% |
Market value of the Fixed Income Asset Proxy | $48,823.16 | $46,519.03 | $42,116.56 | $34,758.31 |
Market value of the Derivative Asset Proxy | $3,848.51 | $6,526.00 | $16,069.42 | $21,946.25 |
Interim Value of each Shield Option(2) | $52,671.67 | $53,045.03 | $58,185.98 | $56,704.57 |
Total Account Value | $220,607.25 | |||
Step Rate Edge | Step Rate | Cap Rate | Cap Rate | |
Months elapsed since Term Start Date | 6 | |||
Months until Term End Date | 6 | 18 | 30 | 66 |
Index Value | 700 | |||
Index Performance on calculation date(1) | -30% | |||
Market Value Rate on calculation date | 3.00% | 5.00% | 7.00% | 9.00% |
Market value of the Fixed Income Asset Proxy | $48,823.16 | $46,519.03 | $42,116.56 | $34,758.31 |
Market value of the Derivative Asset Proxy | -$8,899.83 | -$5,554.28 | -$5,794.44 | $2,103.07 |
Interim Value of each Shield Option(2) | $39,923.32 | $40,964.75 | $36,322.12 | $36,861.38 |
Total Account Value | $154,071.57 | |||
÷ 1000 [Index Value at Term Start Date] = 20%
÷ 1000 [Index Value at Term Start Date] = -30%
Number of Complete Contract Years since Issue Date | Withdrawal Charge percentage |
0 | 7% |
1 | 7% |
2 | 6% |
3 | 5% |
4 | 4% |
5 | 3% |
6 or more | 0% |
Term Start Date | |
Investment Amount | $50,000 |
Shield Rate | Shield 10 |
Cap Rate | 10% |
Index Value | 500 |
Interim Value Calculation Halfway Through Term | |
Index Value | 600 |
Index Performance(1) | 20% |
Time Remaining in Shield Option (in months) | 6 |
Market Value Rate on calculation date | 3% |
Market value of Fixed Income Asset Proxy | $49,452.40 |
Market value of Derivative Asset Proxy | $4,062.37 |
Interim Value of Shield Option(2) | $53,514.77 |
Withdrawal Amount taken | $20,000 |
Investment Amount at Term Start Date adjusted for any withdrawals(3) | $31,313.57 |
Net Proceeds from withdrawal paid to Contract Owner(4) | $20,000 |
Term End Date | |
Index Value | 560 |
Index Performance(5) | 12% |
Performance Rate(6) | 10% |
Performance Rate Adjustment(7) | $3,131.36 |
Investment Amount(8) | $34,444.93 |
÷ 500 [Index Value at Term Start Date]) = 20%
= $53,514.77
x (1-$20,000 [gross withdrawal amount halfway through the Term] ÷ $53,514.77 [Interim Value on date of withdrawal])
= $31,313.57
÷ 500 [Index Value at Term Start Date] = 12%
+ $3,131.36 [Performance Rate Adjustment at Term End Date] = $34,444.93
Term Start Date | |
Investment Amount | $50,000 |
Shield Rate | Shield 10 |
Cap Rate | 10% |
Index Value | 500 |
Interim Value Calculation Halfway Through Term | |
Index Value | 400 |
Index Performance(1) | –20% |
Time Remaining in Shield Option (in months) | 6 |
Market Value Rate on calculation date | 3% |
Market value of Fixed Income Asset Proxy | $49,452.40 |
Market value of Derivative Asset Proxy | –$4,661.31 |
Interim Value of Shield Option(2) | $44,791.09 |
Withdrawal Amount taken | $20,000 |
Investment Amount adjusted for any withdrawals(3) | $27,674.13 |
Free Withdrawal Amount(4) | $5,000 |
Withdrawal Charge Amount(5) | $1,050 |
Net Proceeds from Withdrawal paid to Contract Owner(6) | $18,950 |
Term End Date | |
Index Value | 450 |
Index Performance(7) | –10% |
Performance Rate(8) | 0% |
Performance Rate Adjustment(9) | $0 |
Investment Amount(10) | $27,674.13 |
÷ 500 [Index Value at Term Start Date]) = –20%
= $44,791.09
x (1-$20,000 [gross withdrawal amount halfway through the Term]) ÷ $44,791.09 [Interim Value on date of withdrawal]
= $27,674.13
÷ 500 [Index Value at Term Start Date] = –10%
+ $0 [Performance Rate Adjustment at Term End Date] = $27,674.13
Contract Year | 1 |
Term Start Date | |
Investment Amount | $50,000 |
Index Value | 1,000 |
Term End Date | |
Index Value | 1,200 |
Index Performance(1) | 20% |
Cap Rate | 10% |
Shield Rate | Shield 10 |
Performance Rate (one year)(2) | 10% |
Performance Rate Adjustment(3) | $5,000 |
Investment Amount(4) | $55,000 |
÷ 1,000 [Index Value at Term Start Date]) = 20%
Contract Year | 2 | |
1-Year Term / Shield 10 / S&P 500® Index with a Cap Rate of 10% | 1-Year Term / Shield 10 / Russell 2000® Index with a Cap Rate of 12% | |
Investment Amount at Term Start Date (second term)(1) | $27,500 | $27,500 |
Term Start Date | |
Investment Amount | $100,000 |
Shield Rate | Shield 10 |
Cap Rate | 10% |
Index Value | 1,000 |
Interim Value Calculation Halfway Through Term | |
Index Value | 1,200 |
Index Performance(1) | 20% |
Time Remaining in Shield Option (in months) | 6 |
Market Value Rate on calculation date | 3% |
Market value of Fixed Income Asset Proxy | $98,904.80 |
Market value of Derivative Asset Proxy | $8,124.74 |
Interim Value of Shield Option(2) | $107,029.53 |
Performance Lock Value(3) | $107,029.53 |
÷ 1,000 [Index Value at Term Start Date] = 20%
= $107,029.53
Term Start Date | |
Investment Amount | $100,000 |
Shield Rate | Shield 10 |
Cap Rate | 10% |
Index Value | 1,000 |
Interim Value Calculation Halfway Through Term | |
Index Value | 1,200 |
Index Performance(1) | 20% |
Time Remaining in Shield Option (in months) | 6 |
Market Value Rate on calculation date | 3% |
Market value of Fixed Income Asset Proxy | $98,904.80 |
Market value of Derivative Asset Proxy | $8,124.74 |
Time Remaining in Shield Option (in months) | 6 |
Interim Value of Shield Option on day you exercise Performance Lock(2) | $107,029.53 |
Gross Withdrawal Amount | $50,000 |
Free Withdrawal Amount(3) | $10,000 |
Withdrawal Charge Amount(4) | $2,800 |
Net Proceeds from Withdrawal paid to Contract Owner(5) | $47,200 |
Performance Lock Value after Withdrawal(6) | $57,029.53 |
÷ 1,000 [Index Value at Term Start Date] = 20%
= $107,029.53
= $57,029.53 [Performance Lock Value after Withdrawal]
If you… | Your “Applicable Age” is… |
Were born on or before June 30, 1949 | 70½ |
Were born on or after July 1, 1949 (and attain age 72 prior to January 1, 2023) | 72 |
Attain age 72 on or after January 1, 2023 (and attain age 73 on or before December 31, 2032) | 73* |
Attain age 74 on or after January 1, 2033 | 75* |
Plan Type | Elective Contribution | Catch-up Contribution |
IRA | $7,000 | $1,000 |
SIMPLE IRA | $16,000 | $3,500 |
401(k) | $23,000 | $7,500 |
SEP/401(a) | (Employer contributions only) | |
403(b) [TSA] | $23,000 | $7,500 |
457(b) | $23,000 | $7,500 |
Applications when purchasing the Contract, including initial Purchase Payment | P.O. Box 4365 Clinton, IA 52733-4365 Fax: (877) 245-2964 Or through your financial representative |
Death Claims | P.O. Box 4330 Clinton, IA 52733-4330 Fax: (877) 245-8163 |
Annuity Payments |
•Requests to receive regular Annuity Payments | P.O. Box 4365 Clinton, IA 52733-4365 Telephone: (800) 882-1292 Fax: (877) 246-8424 |
•Death Claims for Contracts receiving Annuity Payments | P.O. Box 4364 Clinton, IA 52733-4364 Telephone: (800) 882-1292 Fax: (877) 245-8163 |
•General requests and elections for Contracts receiving Annuity Payments | P.O. Box 4363 Clinton, IA 52733-4363 Telephone: (800) 882-1292 Fax: (877) 246-8424 |
All other requests and elections and general inquiries (except requests for a transaction or other notification related to the Performance Lock must be submitted in writing, by telephone or by fax) | P.O. Box 4301 Clinton, IA 52733-4301 Telephone: (888) 243-1932 Fax: (877) 246-8424 |
FOR SECURITIES ACT LIABILITIES
Name | Position with Brighthouse Life Insurance Company of NY |
David A. Rosenbaum | Director, Chairman of the Board, President and Chief Executive Officer (Principal Executive Officer) (March 24, 2022 - present) |
Kristine H. Toscano | Vice President and Chief Financial Officer (Principal Financial Officer and Principal Accounting Officer) (September 2021 - present) |
Michael J. Inserra | Director (October 12, 2021 - present) |
Edward C. Kosnik | Director (June 6, 2023 - present) |
Mayer Naiman | Director (October 26, 2017 - present) |
Douglas A. Rayvid | Director (September 12, 2019 - present) |
Robert A. Semke | Director (September 21, 2023 - present) |
Kevin D. White | Director (December 8, 2023 - present) |
2023 Director Compensation Table | ||
Name | Fees Earned or Paid in Cash (1) | Total |
David W. Chamberlin (2) | — | — |
Jeffrey P. Halperin (3) | — | — |
Michael J. Inserra | $30,000 | $30,000 |
Edward C. Kosnik | — | — |
Mayer Naiman | — | — |
Richard C. Pearson (4) | $30,000 | $30,000 |
Douglas A. Rayvid (5) | $35,000 | $35,000 |
David A. Rosenbaum | — | — |
2023 Director Compensation Table | ||
Name | Fees Earned or Paid in Cash (1) | Total |
Robert A. Semke (6) | $15,000 | $15,000 |
Kevin D. White | — | — |
Three Months Ended March 31, (unaudited) | Years Ended December 31, | |||||||
2024 | 2023 | 2023 | 2022 | |||||
INCOME | ||||||||
Premiums and annuity considerations | $28 | $190 | $(3,649 ) | $935 | ||||
Considerations for supplementary contracts | 2 | 2 | 12 | 7 | ||||
Net investment income | 23 | (9 ) | (6 ) | 33 | ||||
Reserves adjustments on reinsurance ceded | 232 | (76 ) | 4,039 | (291 ) | ||||
Other income (loss) | (222 ) | (125 ) | (319 ) | 799 | ||||
Total income | 63 | (18 ) | 77 | 1,483 | ||||
BENEFITS AND EXPENSES | ||||||||
Benefit payments | 64 | 92 | 399 | 222 | ||||
Changes to reserves, deposit funds and other policy liabilities | (28 ) | (34 ) | (732 ) | 253 | ||||
Insurance expenses and taxes (other than Federal income and capital gains taxes) | 34 | 32 | 133 | 142 | ||||
Net transfers to (from) Separate Accounts | 8 | 100 | 270 | 617 | ||||
Total benefits and expenses before dividends to policyholders | 78 | 190 | 70 | 1,234 | ||||
Gain (loss) from operations before dividends to policyholders and Federal income tax | (15 ) | (208 ) | 7 | 249 | ||||
Federal income tax expense (benefit) (excluding income tax on capital gains and losses) | — | (1 ) | 2 | 93 | ||||
Gain (loss) from operations | (15 ) | (207 ) | 5 | 156 | ||||
Net realized capital gains (losses), net of Federal income tax and interest maintenance reserve transfer | 1 | 93 | 534 | (308 ) | ||||
NET INCOME (LOSS) | (14 ) | (114 ) | 539 | (152 ) | ||||
CHANGES IN CAPITAL AND SURPLUS | ||||||||
Change in general account net unrealized capital gains (losses) | 26 | 81 | (154 ) | (56 ) | ||||
Change in net deferred income tax | 6 | 25 | (139 ) | 117 | ||||
Change in nonadmitted assets | (7 ) | (11 ) | 115 | (116 ) | ||||
Change in asset valuation reserve | (3 ) | 2 | — | (10 ) | ||||
Change in surplus as a result of reinsurance | (13 ) | (4 ) | 135 | (16 ) | ||||
Change in surplus adjustment paid in | — | 100 | 100 | 100 | ||||
Other - net | (1 ) | — | — | (1 ) | ||||
NET CHANGE IN CAPITAL AND SURPLUS | (6 ) | 79 | 596 | (134 ) | ||||
CAPITAL AND SURPLUS AT BEGINNING OF YEAR | 819 | 223 | 223 | 357 | ||||
CAPITAL AND SURPLUS AT END OF YEAR | $813 | $302 | $819 | $223 | ||||
December 31, 2023 | |||
Notional Amount | Estimated Fair Value (1) | 100 Basis Point Increase in the Yield Curve | |
(In millions) | |||
Financial assets with interest rate risk | |||
Fixed maturity securities | $4,948 | $(261 ) | |
Mortgage loans | $1,084 | (51 ) | |
Increase (decrease) in estimated fair value of assets | (312 ) | ||
Derivative instruments with interest rate risk | |||
Interest rate contracts | $800 | $1 | 10 |
Equity contracts | $874 | $117 | 9 |
Foreign currency contracts | $173 | $12 | (1 ) |
Increase (decrease) in estimated fair value of derivative instruments | 18 | ||
Net change | $(294 ) | ||
Independent Auditor’s Report |
Financial Statements at December 31, 2023 and 2022 and for the Years Ended December 31, 2023, 2022 and 2021: |
Statements of Admitted Assets, Liabilities and Capital and Surplus |
Statements of Operations and Changes in Capital and Surplus |
Statements of Cash Flows |
Notes to the Financial Statements |
Note 1 — Business, Basis of Presentation and Summary of Significant Accounting Policies |
Note 2 — Fair Value Information |
Note 3 — Investments |
Note 4 — Related Party Information |
Note 5 — Premium and Annuity Considerations Deferred and Uncollected |
Note 6 — Reinsurance and Other Insurance Transactions |
Note 7 — Reserves for Life Contracts and Deposit-Type Contracts |
Note 8 — Analysis of Actuarial Reserves and Deposit Liabilities by Withdrawal Characteristics |
Note 9 — Separate Accounts |
Note 10 — Federal Income Tax |
Note 11 — Borrowed Money |
Note 12 — Capital and Surplus |
Note 13 — Other Commitments and Contingencies |
Note 14 — Retained Assets |
Note 15 — Subsequent Events |
Financial Statement Schedules at December 31, 2023 and 2022 and for the Years Ended December 31, 2023, 2022 and 2021: |
Schedule I — Statutory Selected Financial Data |
Schedule II — Supplemental Investment Risks Interrogatories |
Schedule III — Statutory Summary Investment Schedule |
Schedule IV — Reinsurance contracts with risk-limiting features |
Brighthouse Life Insurance Company of NY:
March 25, 2024
December 31, 2023 and 2022
2023 | 2022 | |
ADMITTED ASSETS | ||
Bonds | $1,796 | $1,722 |
Preferred stocks | 3 | 3 |
Mortgage loans | 228 | 242 |
Cash, cash equivalents and short-term investments | 242 | 317 |
Derivative assets | 137 | 369 |
Other invested assets | 51 | 124 |
Total invested assets | 2,457 | 2,777 |
Investment income due and accrued | 15 | 15 |
Premiums and annuity considerations deferred and uncollected | 2 | 2 |
Reinsurance recoverable | 778 | 75 |
Net deferred tax asset | 33 | 16 |
Other assets | 10 | 8 |
Total assets excluding Separate Accounts | 3,295 | 2,893 |
Separate Account assets | 8,852 | 7,997 |
Total Admitted Assets | $12,147 | $10,890 |
LIABILITIES AND CAPITAL AND SURPLUS | ||
Liabilities | ||
Reserves for life insurance and annuities | $931 | $1,681 |
Liability for deposit-type contracts | 14 | 14 |
Other policy liabilities | 634 | 96 |
Borrowed money (including interest thereon) | — | 126 |
Asset valuation reserve | 45 | 45 |
Derivative liabilities | 10 | 136 |
Payable for collateral under securities loaned and other transactions | 44 | 194 |
Net transfers to (from) Separate Accounts due and accrued | 141 | (32 ) |
Funds held under reinsurance treaties | 418 | 429 |
Other liabilities | 239 | 347 |
Total liabilities excluding Separate Accounts | 2,476 | 3,036 |
Separate Account liabilities | 8,852 | 7,631 |
Total Liabilities | 11,328 | 10,667 |
Capital and Surplus | ||
Capital stock (par value $10 per share, 200,000 shares authorized, issued and outstanding) | 2 | 2 |
Paid-in surplus | 670 | 570 |
Special surplus fund reserve | 9 | — |
Unassigned surplus (deficit) | 138 | (349 ) |
Total Capital and Surplus | 819 | 223 |
Total Liabilities and Capital and Surplus | $12,147 | $10,890 |
For the Years Ended December 31, 2023, 2022, and 2021
2023 | 2022 | 2021 | |
INCOME | |||
Premiums and annuity considerations | $(3,649 ) | $935 | $965 |
Considerations for supplementary contracts and dividend accumulations | 12 | 7 | 8 |
Net investment income | (6 ) | 33 | 73 |
Reserve adjustments on reinsurance ceded | 4,039 | (291 ) | (351 ) |
Other income (loss) | (319 ) | 799 | (108 ) |
Total income | 77 | 1,483 | 587 |
BENEFITS AND EXPENSES | |||
Benefit payments | 399 | 222 | 202 |
Changes to reserves, deposit funds and other policy liabilities | (732 ) | 253 | (45 ) |
Insurance expenses and taxes (other than Federal income and capital gains taxes) | 133 | 142 | 150 |
Net transfers to (from) Separate Accounts | 270 | 617 | 612 |
Total benefits and expenses before Federal income tax | 70 | 1,234 | 919 |
Gain (loss) from operations before Federal income tax | 7 | 249 | (332 ) |
Federal income tax expense (benefit) (excluding income tax on capital gains and losses) | 2 | 93 | 28 |
Gain (loss) from operations | 5 | 156 | (360 ) |
Net realized capital gains (losses), net of Federal income tax and interest maintenance reserve transfer | 534 | (308 ) | 308 |
NET INCOME (LOSS) | 539 | (152 ) | (52 ) |
CHANGES IN CAPITAL AND SURPLUS | |||
Change in General Account net unrealized capital gains (losses) | (154 ) | (56 ) | 50 |
Change in net deferred income tax | (139 ) | 117 | 40 |
Change in nonadmitted assets | 115 | (116 ) | (27 ) |
Change in asset valuation reserve | — | (10 ) | (9 ) |
Change in surplus as a result of reinsurance | 135 | (16 ) | (16 ) |
Change in surplus adjustment paid in | 100 | 100 | — |
Other – net | — | (1 ) | (2 ) |
NET CHANGE IN CAPITAL AND SURPLUS | 596 | (134 ) | (16 ) |
CAPITAL AND SURPLUS AT BEGINNING OF YEAR | 223 | 357 | 373 |
CAPITAL AND SURPLUS AT END OF YEAR | $819 | $223 | $357 |
(In millions)
2023 | 2022 | 2021 | |
CASH FROM OPERATIONS | |||
Premiums and annuity considerations, net of reinsurance, received | $(3,126 ) | $906 | $979 |
Net investment income received | (8 ) | 57 | 50 |
Other income (loss) received | (129 ) | 193 | 146 |
Total receipts | (3,263 ) | 1,156 | 1,175 |
Benefits paid (other than dividends) | (3,654 ) | 530 | 534 |
Insurance expenses and taxes paid (other than Federal income and capital gains taxes) | 361 | 158 | 166 |
Net transfers to (from) Separate Accounts | 267 | 755 | 705 |
Federal income tax paid (recovered) (net of tax on capital gains and losses) | 95 | 33 | (5 ) |
Total payments | (2,931 ) | 1,476 | 1,400 |
Net cash provided by (used in) operations | (332 ) | (320 ) | (225 ) |
CASH FROM INVESTMENTS | |||
Proceeds from invested assets sold, matured or repaid | 607 | 493 | 788 |
Cost of invested assets acquired | (267 ) | (802 ) | (399 ) |
Net cash provided by (used in) investments | 340 | (309 ) | 389 |
CASH FROM FINANCING AND OTHER SOURCES | |||
Net change in surplus adjustment | — | 100 | — |
Borrowed Money | (125 ) | 125 | — |
Net change in deposit-type contracts | — | (1 ) | (2 ) |
Other-net | 42 | 303 | 37 |
Net cash provided by (used in) financing and other sources | (83 ) | 527 | 35 |
NET CHANGE IN CASH, CASH EQUIVALENTS AND SHORT-TERM INVESTMENTS: | (75 ) | (102 ) | 199 |
CASH, CASH EQUIVALENTS AND SHORT-TERM INVESTMENTS: | |||
BEGINNING OF YEAR | 317 | 419 | 220 |
END OF YEAR | $242 | $317 | $419 |
SUPPLEMENTAL DISCLOSURES OF CASH FLOW INFORMATION FOR NON-CASH TRANSACTIONS: | |||
Bonds, asset in kind transfer in | $100 | $— | $— |
Transfer of assets from mortgages to other invested assets | $— | $6 | $— |
Prior period adjustment-valuation system conversion | $— | $— | $2 |
For the Years Ended December 31, | ||||
SSAP Number(1) | 2023 | 2022 | 2021 | |
Net income (loss), NY SAP | $539 | $(152 ) | $(52 ) | |
State prescribed practices: | ||||
Deferred annuities using continuous CARVM | 51 | — | — | — |
Variable annuities in excess of NY Reg 213 standard scenario over VM 21 stochastic reserves | 51 | 4 | (143 ) | 143 |
NYSDFS Circular Letter No. 11 (2010) impact on deferred premiums | 61 | (2 ) | — | — |
NYSDFS Seventh Amendment to Regulation No. 172 impact on admitted unearned reinsurance premium | 61 | 10 | — | — |
State permitted practices: NONE | — | — | — | |
Net income, NAIC SAP | $551 | $ (295 ) | $91 | |
December 31, | ||||
SSAP Number | 2023 | 2022 | 2021 | |
Statutory capital and surplus, NY SAP | $819 | $223 | $357 | |
State prescribed practices: | ||||
Deferred annuities using continuous CARVM | 51 | 1 | — | 1 |
Variable annuities in excess of NY Reg 213 standard scenario over VM 21 stochastic reserves | 51 | 3 | — | 143 |
NYSDFS Circular Letter No. 11 (2010) impact on deferred premiums | 61 | (2 ) | — | — |
NYSDFS Seventh Amendment to Regulation No. 172 impact on admitted unearned reinsurance premium | 61 | 9 | (1 ) | (1 ) |
State permitted practices: NONE | — | — | — | |
Statutory capital and surplus, NAIC SAP | $830 | $222 | $500 | |
2023 | |||||
Aggregate Fair Value | Admitted Value | Level 1 | Level 2 | Level 3 | |
Assets | |||||
Bonds | $1,645 | $1,796 | $116 | $1,528 | $1 |
Preferred stocks | 3 | 3 | — | — | 3 |
Mortgage loans | 210 | 228 | — | — | 210 |
Cash, cash equivalents and short-term investments | 242 | 242 | 242 | — | — |
Derivative assets (1) | 140 | 137 | — | 140 | — |
Other invested assets | 15 | 19 | — | 15 | — |
Investment income due and accrued | 15 | 15 | — | 15 | — |
Separate Account assets | 8,429 | 8,808 | 148 | 7,375 | 906 |
Total assets | $10,699 | $11,248 | $506 | $9,073 | $1,120 |
Liabilities | |||||
Investment contracts included in: | |||||
Liability for deposit-type contracts | $14 | $14 | $— | $— | $14 |
Derivative liabilities (1) | 10 | 10 | — | 10 | — |
Borrowed Money (including interest thereon) | — | — | — | — | — |
Payable for collateral received | 44 | 44 | — | 44 | — |
Separate Account liabilities | 2 | 2 | — | 2 | — |
Total liabilities | $70 | $70 | $— | $56 | $14 |
2022 | |||||
Aggregate Fair Value | Admitted Value | Level 1 | Level 2 | Level 3 | |
Assets | |||||
Bonds | $1,520 | $1,722 | $114 | $1,403 | $3 |
Preferred stocks | 3 | 3 | — | — | 3 |
Mortgage loans | 222 | 242 | — | — | 222 |
Cash, cash equivalents and short-term investments | 317 | 317 | 317 | — | — |
Derivative assets (1) | 373 | 369 | — | 373 | — |
Other invested assets | 15 | 20 | — | 15 | — |
Investment income due and accrued | 15 | 15 | — | 15 | — |
Separate Account assets | 7,492 | 7,971 | 258 | 6,341 | 893 |
Total assets | $9,957 | $10,659 | $689 | $8,147 | $1,121 |
Liabilities | |||||
Investment contracts included in: | |||||
Liability for deposit-type contracts | $14 | $14 | $— | $— | $14 |
Derivative liabilities (1) | 136 | 136 | — | 136 | — |
Borrowed Money (including interest thereon) | 126 | 126 | — | 126 | — |
Payable for collateral received | 194 | 194 | — | 194 | — |
Separate Account liabilities | — | — | — | — | — |
Total liabilities | $470 | $470 | $— | $456 | $14 |
2023 | ||||
Fair Value Measurements at Reporting Date Using | ||||
Level 1 | Level 2 | Level 3 | Total | |
Assets | ||||
Derivative assets (1) | ||||
Interest rate | $— | $1 | $— | $1 |
Foreign currency exchange rate | — | 3 | — | 3 |
Equity market | — | 126 | — | 126 |
Total Derivative assets | — | 130 | — | 130 |
Separate Account assets (2) | — | 4,126 | — | 4,126 |
Total assets | $— | $4,256 | $— | $4,256 |
Liabilities | ||||
Derivative liabilities (1) | ||||
Interest rate | $— | $— | $— | $— |
Foreign currency exchange rate | — | — | — | — |
Equity market | — | 10 | — | 10 |
Total liabilities | $— | $10 | $— | $10 |
2022 | ||||
Fair Value Measurements at Reporting Date Using | ||||
Level 1 | Level 2 | Level 3 | Total | |
Assets | ||||
Derivative assets (1) | ||||
Interest rate | $— | $12 | $— | $12 |
Foreign currency exchange rate | — | 4 | — | 4 |
Equity market | — | 343 | — | 343 |
Total Derivative assets | — | 359 | — | 359 |
Separate Account assets (2) | — | 3,922 | — | 3,922 |
Total assets | $— | $4,281 | $— | $4,281 |
Liabilities | ||||
Derivative liabilities (1) | ||||
Interest rate | $— | $— | $— | $— |
Foreign currency exchange rate | — | — | — | — |
Equity market | — | 136 | — | 136 |
Total liabilities | $— | $136 | $— | $136 |
2023 | 2022 | |||||||
Book/ Adjusted | Gross Unrealized | Estimated | Book/ Adjusted | Gross Unrealized | Estimated | |||
Carrying Value | Gains | Losses | Fair Value | Carrying Value | Gains | Losses | Fair Value | |
Bonds | ||||||||
U.S. corporate | $942 | $5 | $100 | $847 | $914 | $1 | $130 | $785 |
RMBS | 195 | 3 | 10 | 188 | 148 | 2 | 10 | 140 |
Foreign corporate | 189 | 1 | 14 | 176 | 188 | — | 19 | 169 |
U.S. government and agency | 176 | — | 10 | 166 | 174 | — | 12 | 162 |
CMBS | 158 | — | 16 | 142 | 168 | — | 18 | 150 |
State and political subdivision | 90 | 2 | 9 | 83 | 83 | 1 | 12 | 72 |
ABS | 40 | — | 2 | 38 | 41 | — | 4 | 37 |
Foreign government | 6 | — | 1 | 5 | 6 | — | 1 | 5 |
Total bonds | $1,796 | $11 | $162 | $1,645 | $1,722 | $4 | $206 | $1,520 |
Preferred Stocks | ||||||||
Preferred | $3 | $— | $— | $3 | $3 | $— | $— | $3 |
Book/Adjusted Carrying Value | Estimated Fair Value | |
Due in one year or less | $28 | $27 |
Due after one year through five years | 406 | 394 |
Due after five years through ten years | 254 | 239 |
Due after ten years | 715 | 617 |
Subtotal | 1,403 | 1,277 |
Loan-backed securities | 393 | 368 |
Total | $1,796 | $1,645 |
2023 | 2022 | |||||||
Less than 12 Months | Equal to or Greater than 12 Months | Less than 12 Months | Equal to or Greater than 12 Months | |||||
Estimated Fair Value | Gross Unrealized Losses | Estimated Fair Value | Gross Unrealized Losses | Estimated Fair Value | Gross Unrealized Losses | Estimated Fair Value | Gross Unrealized Losses | |
U.S. corporate | $16 | $1 | $724 | $99 | $704 | $105 | $63 | $25 |
RMBS | 33 | 1 | 77 | 9 | 95 | 7 | 15 | 3 |
Foreign corporate | 1 | — | 146 | 14 | 153 | 18 | 4 | 1 |
U.S. government and agency | 31 | 1 | 121 | 9 | 149 | 12 | — | — |
CMBS | — | — | 140 | 16 | 132 | 14 | 18 | 4 |
State and political subdivision | 1 | — | 53 | 9 | 50 | 11 | 2 | 1 |
ABS | 3 | — | 32 | 2 | 29 | 3 | 8 | 1 |
Foreign government | — | — | 5 | 1 | 5 | 1 | — | — |
Total bonds | $85 | $3 | $1,298 | $159 | $1,317 | $171 | $110 | $35 |
Total number of bonds in an unrealized loss position | 29 | 549 | 538 | 90 | ||||
CUSIP | Book/Adjusted Carrying Value Amortized Cost Before Current Period OTTI | Present Value of Projected Cash Flows | Recognized OTTI | Amortized Cost after OTTI | Estimated Fair Value at Time of OTTI | Date of Financial Statement Where Reported |
12648WAE2 | $2,543,559 | $1,939,162 | $604,397 | $1,939,162 | $1,623,877 | 9/30/2023 |
23332UEL4 | $119,098 | $118,692 | 405 | $118,692 | $104,473 | 9/30/2023 |
Total | $604,802 |
2023 | 2022 | |||
Amount | Percent | Amount | Percent | |
Commercial | $182 | 80 % | $194 | 80 % |
Agricultural | 46 | 20 | 49 | 20 |
Total mortgage loans | $228 | 100 % | $243 | 100 % |
State | Percent of Total Mortgage Loans |
California | 21 % |
Florida | 14 |
New York | 12 |
Illinois | 10 |
Washington | 9 |
Colorado | 7 |
Total | 73 % |
2023 | |||||
Recorded Investment | |||||
Debt Service Coverage Ratios | |||||
˃ 1.20x | 1.00x - 1.20x | ˂ 1.00x | Total | % of Total | |
Loan-to-value ratios: | |||||
Less than 65% | $84 | $12 | $— | $96 | 52 % |
65% to 75% | 43 | — | 9 | 52 | 29 |
76% to 80% | 29 | — | — | 29 | 16 |
Greater than 80% | 2 | — | 3 | 5 | 3 |
Total | $158 | $12 | $12 | $182 | 100 % |
2022 | |||||
Recorded Investment | |||||
Debt Service Coverage Ratios | |||||
˃ 1.20x | 1.00x - 1.20x | ˂ 1.00x | Total | % of Total | |
Loan-to-value ratios: | |||||
Less than 65% | $136 | $— | $— | $136 | 70 % |
65% to 75% | 42 | — | 12 | 54 | 28 |
76% to 80% | — | — | — | — | — |
Greater than 80% | — | 1 | 3 | 4 | 2 |
Total | $178 | $1 | $15 | $194 | 100 % |
2023 | 2022 | |||||
Total Pledged & Restricted Assets | % of Total Assets | % of Total Admitted Assets | Total Pledged & Restricted Assets | % of Total Assets | % of Total Admitted Assets | |
State deposits | $1 | 0.0 % | 0.0 % | $1 | 0.0 % | 0.0 % |
Derivatives collateral(1) | 1 | 0.0 | 0.0 | 282 | 2.5 | 2.6 |
Total | $2 | 0.0 % | 0.0 % | $283 | 2.5 % | 2.6 % |
2023 | 2022 | ||||||
Primary Underlying Risk Exposure | Instrument Type | Notional Amount | Book/ Adjusted Carrying Value | Estimated Fair Value | Notional Amount | Book/ Adjusted Carrying Value | Estimated Fair Value |
Foreign currency exchange rate | Foreign currency swaps | $93 | $10 | $13 | $100 | $14 | $18 |
Interest rate | Interest rate caps | 800 | 1 | 1 | 800 | 12 | 12 |
Equity market | Equity index options | 874 | 116 | 116 | 2,761 | 182 | 182 |
Total rate of return swaps | — | — | — | 2,392 | 25 | 25 | |
Total | $1,767 | $127 | $130 | $6,053 | $233 | $237 | |
Asset | Liability | |||
2023 | 2022 | 2023 | 2022 | |
Foreign currency swaps | $52 | $55 | $— | $— |
Securities(1) | ||
2023 | 2022 | |
Initial Margin: | ||
OTC-bilateral | $— | $225 |
Variation Margin: | ||
OTC-bilateral | 1 | 57 |
Total OTC | $1 | $282 |
Cash(1) | Securities(2) | Total | ||||
2023 | 2022 | 2023 | 2022 | 2023 | 2022 | |
Initial Margin: | ||||||
OTC-bilateral | $— | $— | $1 | $151 | $1 | $151 |
Variation Margin: | ||||||
OTC-bilateral | 44 | 194 | 2 | 6 | 46 | 200 |
Total OTC | $44 | $194 | $3 | $157 | $47 | $351 |
Fiscal Year | Net Undiscounted Future Settled Premium Payments (Receipts) |
2024 | $11 |
2025 | 20 |
2026 | 23 |
2027 | 14 |
Thereafter | 32 |
Total | $100 |
2023 | 2022 | |
Net undiscounted future premium payments (receipts) | $100 | $92 |
Estimated fair value of derivative net assets (liabilities), including discounted future premiums | $26 | $164 |
Estimated fair value of derivative net assets (liabilities), excluding discounted future premiums | $116 | $247 |
2023 | 2022 | 2021 | |
Bonds | $69 | $65 | $69 |
Mortgage loans | 9 | 10 | 12 |
Cash and cash equivalents | 22 | 5 | — |
Derivatives | (89 ) | (37 ) | (4 ) |
Other invested assets | 4 | 1 | 1 |
Gross investment income | 15 | 44 | 78 |
Less: investment expenses | 21 | 12 | 6 |
Net investment income, before IMR amortization | (6 ) | 32 | 72 |
IMR amortization | — | 1 | 1 |
Net investment income | $(6 ) | $33 | $73 |
2023 | 2022 | 2021 | |
Bonds | $(3 ) | $(2 ) | $1 |
Derivatives | 534 | (309 ) | 308 |
Other | — | (1 ) | — |
Net realized capital gains (losses), before Federal income tax | 531 | (312 ) | 309 |
Less: Federal income tax expense (benefit) | (1 ) | (2 ) | — |
Net realized capital gains (losses), before IMR transfer | 532 | (310 ) | 309 |
IMR transfer, net of Federal income tax expense (benefit) of less than $1 million, $1 million and less than $(1) million, respectively | (2 ) | (2 ) | 1 |
Net realized capital gains (losses), net of Federal income tax and IMR transfer | $534 | $(308 ) | $308 |
2023 | 2022 | 2021 | |
Proceeds from sales and disposals | $90 | $418 | $141 |
Gross realized capital gains on sales | $— | $7 | $2 |
Gross realized capital losses on sales | $(2 ) | (9 ) | $(1 ) |
OTTI losses - bonds | $(1 ) | $— | $— |
2023 | 2022 | 2021 | |
Number of CUSIPs | 2 | 9 | 22 |
Aggregate Amount of Investment Income(1) | $— | $1 | $2 |
1 Gross | $15 |
2 Nonadmitted | — |
3 Admitted | $15 |
2023 | 2022 | 2021 | |
Premiums and annuity considerations | $(4,640 ) | $(172 ) | $(251 ) |
Reserve adjustments on reinsurance ceded | $4,039 | $(291 ) | $(351 ) |
Benefit payments | $(471 ) | $(337 ) | $(489 ) |
Changes to reserves, deposit funds and other policy liabilities | $(1,131 ) | $(366 ) | $29 |
2023 | 2022 | |
Reserves for life insurance, annuities and deposit-type contracts | $(2,133 ) | $(1,002 ) |
2023 | 2022 | |
Balance at beginning of year | $138 | $144 |
Capitalization of deferred gain on reinsurance | 160 | — |
Amortization of deferred gains on reinsurance | (15 ) | (6 ) |
Balance at end of year | $283 | $138 |
2023 | 2022 | 2021 | |
Reserves for life insurance, annuities and deposit-type contracts | $638 | $933 | $567 |
Premiums and annuity considerations | $83 | $126 | $206 |
Reserve adjustments on reinsurance ceded | $332 | $291 | $351 |
Benefit payments | $339 | $301 | $449 |
2023 | 2022 | 2021 | |
Reserves for life insurance, annuities and deposit-type contracts | $1,425 | $— | $— |
Premiums and annuity considerations | $4,511 | $— | $— |
Reserve adjustments on reinsurance ceded | $(4,371 ) | $— | $— |
Benefit payments | $100 | $— | $— |
2023 | 2022 | |||
Type | Gross | Net of Loading | Gross | Net of Loading |
Ordinary renewal | $2 | $2 | $2 | $2 |
2023 | 2022 | 2021 | |
Premiums and annuity considerations | $(4,636 ) | $(180 ) | $(265 ) |
Reserve adjustments on reinsurance ceded | $4,039 | $(291 ) | $(351 ) |
Benefit payments | $(482 ) | $(359 ) | $(491 ) |
Changes to reserves, deposit funds and other policy liabilities | $(1,100 ) | $(350 ) | $29 |
2023 | 2022 | |
Reserves for life insurance, annuities and deposit-type contracts | $(3,035 ) | $(1,920 ) |
Funds held under reinsurance treaties | $(418 ) | $(429 ) |
2023 | 2022 | |
Balance at beginning of year | $420 | $436 |
Capitalization of deferred gain on reinsurance | 160 | — |
Amortization of deferred gains on reinsurance | (26 ) | (16 ) |
Balance at end of year | $554 | $420 |
Ordinary | |||
Item | Total | Life Insurance | Individual Annuities |
Reg 213 Stocastic Excess over Standard | $667 | $— | $667 |
Miscellaneous Annuity Reserves | (210 ) | — | (210 ) |
Reinsurance ceded | (883 ) | — | (883 ) |
Total | $(426 ) | $— | $(426 ) |
Individual Annuities: | 2023 | ||||
General Account | Separate Account with Guarantees | Separate Account Nonguaranteed | Total | Percent of Total | |
Subject to discretionary withdrawal: | |||||
With market value adjustment | $339 | $— | $— | $339 | 3.4 % |
At book value less current surrender charge of 5% or more(1) | 153 | 2,702 | — | 2,855 | 28.3 % |
At fair value | — | — | 4,087 | 4,087 | 40.4 |
Total with market value adjustment or at fair value | 492 | 2,702 | 4,087 | 7,281 | 72.1 |
At book value without adjustment | 421 | 2,199 | — | 2,620 | 26.0 |
Not subject to discretionary withdrawal: | 193 | — | 3 | 196 | 1.9 |
Total (gross) | 1,106 | 4,901 | 4,090 | 10,097 | 100.0 % |
Reinsurance ceded | (318 ) | — | — | (318 ) | |
Total (net) | $788 | $4,901 | $4,090 | $9,779 | |
Individual Annuities: | 2022 | ||||
General Account | Separate Account with Guarantees | Separate Account Nonguaranteed | Total | Percent of Total | |
Subject to discretionary withdrawal: | |||||
With market value adjustment | $396 | $— | $— | $396 | 4.5 % |
At book value less current surrender charge of 5% or more | 183 | 2,279 | — | 2,462 | 28.1 |
At fair value | — | — | 3,884 | 3,884 | 44.4 |
Total with market value adjustment or at fair value | 579 | 2,279 | 3,884 | 6,742 | 77.0 |
At book value without adjustment | 438 | 1,399 | — | 1,837 | 21.0 |
Not subject to discretionary withdrawal: | 172 | — | 3 | 175 | 2.0 |
Total (gross) | 1,189 | 3,678 | 3,887 | 8,754 | 100.0 % |
Individual Annuities: | 2022 | ||||
General Account | Separate Account with Guarantees | Separate Account Nonguaranteed | Total | Percent of Total | |
Reinsurance ceded | (71 ) | — | — | (71 ) | |
Total (net) | $1,118 | $3,678 | $3,887 | $8,683 | |
Deposit-Type Contracts: | 2023 | ||||
General Account | Separate Account with Guarantees | Separate Account Nonguaranteed | Total | Percent of Total | |
Subject to discretionary withdrawal: | |||||
With market value adjustment | $— | $— | $— | $— | — % |
At book value less current surrender charge of 5% or more | — | — | — | — | — |
At fair value | — | — | — | — | — |
Total with market value adjustment or at fair value | — | — | — | — | — |
At book value without adjustment | 5 | — | — | 5 | 26.5 |
Not subject to discretionary withdrawal: | 14 | — | 1 | 15 | 73.5 |
Total (gross) | 19 | — | 1 | 20 | 100.0 % |
Reinsurance ceded | (5 ) | — | — | (5 ) | |
Total (net) | $14 | $— | $1 | $15 | |
Individual Annuities: | 2022 | ||||
General Account | Separate Account with Guarantees | Separate Account Nonguaranteed | Total | Percent of Total | |
Subject to discretionary withdrawal: | |||||
With market value adjustment | $— | $— | $— | $— | — % |
At book value less current surrender charge of 5% or more | — | — | — | — | — |
At fair value | — | — | — | — | — |
Total with market value adjustment or at fair value | — | — | — | — | — |
At book value without adjustment | 17 | — | — | 17 | 83.6 |
Not subject to discretionary withdrawal: | 3 | — | 1 | 4 | 16.4 |
Total (gross) | 20 | — | 1 | 21 | 100.0 % |
Reinsurance ceded | (6 ) | — | — | (6 ) | |
Total (net) | $14 | $— | $1 | $15 | |
2023 | 2022 | |
General Account: | ||
Annuities (excluding supplementary contracts with life contingencies) | $743 | $1,073 |
Supplementary contracts with life contingencies | 45 | 45 |
Deposit-type contracts | 14 | 14 |
Subtotal | 802 | 1,132 |
Separate Account: | ||
Annuities (excluding supplementary contracts) | 8,988 | 7,562 |
Supplementary contracts with life contingencies | 3 | 3 |
Other deposit-type contracts | 1 | 1 |
Total | $9,794 | $8,698 |
2023 | ||||||
General Account | Separate Account - Nonguaranteed | |||||
Account Value | Cash Value | Reserve | Account Value | Cash Value | Reserve | |
Subject to discretionary withdrawal: | ||||||
Term policies with cash value | $— | $— | $— | $— | $— | $— |
Universal life | 4 | 4 | 4 | — | — | — |
Universal life with secondary guarantees | — | — | 6 | — | — | — |
Indexed universal life | 3 | 3 | 5 | — | — | — |
Indexed universal life with secondary guarantees | — | — | — | — | — | — |
Indexed life | — | — | — | — | — | — |
Other permanent cash value life | — | 1 | 2 | — | — | — |
Variable life | — | — | — | — | — | — |
Variable universal life | — | — | — | — | — | — |
Miscellaneous reserves | — | — | — | — | — | — |
Not subject to discretionary withdrawal: | ||||||
Term policies without cash value | XXX | XXX | 1,064 | XXX | XXX | — |
Accidental death benefits | XXX | XXX | — | XXX | XXX | — |
Disability - active lives | XXX | XXX | 9 | XXX | XXX | — |
Disability - disabled lives | XXX | XXX | 6 | XXX | XXX | — |
Miscellaneous reserves | XXX | XXX | 1 | XXX | XXX | — |
Total (gross: direct + assumed) | 7 | 8 | 1,097 | — | — | — |
Reinsurance ceded | 4 | 4 | 965 | — | — | — |
Total (Net) | $3 | $4 | $132 | $— | $— | $— |
2022 | ||||||
General Account | Separate Account - Nonguaranteed | |||||
Account Value | Cash Value | Reserve | Account Value | Cash Value | Reserve | |
Subject to discretionary withdrawal: | ||||||
Term policies with cash value | $— | $— | $— | $— | $— | $— |
Universal life | 4 | 4 | 4 | — | — | — |
Universal life with secondary guarantees | 1 | 1 | 5 | — | — | — |
Indexed universal life | — | — | — | — | — | — |
Indexed universal life with secondary guarantees | — | — | — | — | — | — |
Indexed life | — | — | — | — | — | — |
Other permanent cash value life | — | — | 2 | — | — | — |
Variable life | — | — | — | — | — | — |
Variable universal life | — | — | — | — | — | — |
Miscellaneous reserves | — | — | — | — | — | — |
Not subject to discretionary withdrawal: | ||||||
Term policies without cash value | XXX | XXX | 1,079 | XXX | XXX | — |
Accidental death benefits | XXX | XXX | — | XXX | XXX | — |
Disability - active lives | XXX | XXX | 9 | XXX | XXX | — |
Disability - disabled lives | XXX | XXX | 5 | XXX | XXX | — |
Miscellaneous reserves | XXX | XXX | 1 | XXX | XXX | — |
Total (gross: direct + assumed) | 5 | 5 | 1,105 | — | — | — |
Reinsurance ceded | 4 | 4 | 979 | — | — | — |
Total (Net) | $1 | $1 | $126 | $— | $— | $— |
2023 | 2022 | |
General Account: | ||
Life insurance | $116 | $111 |
Accidental death benefits | — | — |
Active lives | 9 | 9 |
Disability - disabled lives | 6 | 5 |
Miscellaneous reserves | 1 | 1 |
Subtotal | 132 | 126 |
Separate Account: | ||
Life insurance | — | — |
Accident and health contracts | — | — |
Miscellaneous reserves | — | — |
Total | $132 | $126 |
Nonindexed Guarantee Less than/Equal to 4% | |||
2023 | 2022 | 2021 | |
Premiums, considerations or deposits | $815 | $917 | $939 |
Reserves at December 31 | |||
For accounts with assets at: | |||
Fair value | $— | $— | $— |
Amortized cost | 4,901 | 3,678 | 3,361 |
Total reserves | $4,901 | $3,678 | $3,361 |
By withdrawal characteristics: | |||
With market value adjustment | $— | $— | $— |
At book value without market value adjustment and with current surrender charge of 5% or more | 2,702 | 2,279 | 2,512 |
At fair value | — | — | — |
At book value without market value adjustment and with current surrender charge less than 5% | 2,199 | 1,399 | 849 |
Subtotal | 4,901 | 3,678 | 3,361 |
Not subject to discretionary withdrawal | — | — | — |
Total reserves | $4,901 | $3,678 | $3,361 |
Nonguaranteed Separate Accounts | |||
2023 | 2022 | 2021 | |
Premiums, considerations or deposits | $78 | $116 | $194 |
Reserves at December 31 | |||
For accounts with assets at: | |||
Fair value | $4,090 | $3,887 | $5,137 |
Amortized cost | — | — | — |
Total reserves | $4,090 | $3,887 | $5,137 |
By withdrawal characteristics: | |||
With market value adjustment | $— | $— | $— |
At book value without market value adjustment and with current surrender charge of 5% or more | — | — | — |
At fair value | 4,087 | 3,884 | 5,134 |
At book value without market value adjustment and with current surrender charge less than 5% | — | — | — |
Subtotal | 4,087 | 3,884 | 5,134 |
Not subject to discretionary withdrawal | 3 | 3 | 3 |
Total reserves | $4,090 | $3,887 | $5,137 |
2023 | 2022 | 2021 | |
Transfers to Separate Accounts | $893 | $1,033 | $1,133 |
Transfers from Separate Accounts | 623 | 416 | 521 |
Net transfers to Separate Accounts | 270 | 617 | 612 |
Reconciling difference | — | — | — |
Transfers as reported in the statements of operations of the General Account | $270 | $617 | $612 |
2023 | 2022 | |||||
Ordinary | Capital | Total | Ordinary | Capital | Total | |
Gross DTA | $203 | $6 | $209 | $298 | $4 | 302 |
Less: Statutory valuation allowance adjustments | — | — | — | 1 | — | 1 |
Adjusted gross DTA | 203 | 6 | 209 | 297 | 4 | 301 |
Less: DTA nonadmitted | 97 | 6 | 103 | 214 | 4 | 218 |
Subtotal net admitted DTA | 106 | — | 106 | 83 | — | 83 |
Less: DTL | 73 | — | 73 | 67 | — | 67 |
Net admitted DTA/(Net DTL) | $33 | $— | $33 | $16 | $— | $16 |
Change | |||
Ordinary | Capital | Total | |
Gross DTA | $(95 ) | $2 | $(93 ) |
Statutory valuation allowance adjustments | (1 ) | — | (1 ) |
Adjusted gross DTA | (94 ) | 2 | (92 ) |
DTA nonadmitted | (117 ) | 2 | (115 ) |
Subtotal net admitted DTA | 23 | — | 23 |
DTL | 6 | — | 6 |
Net admitted DTA/(Net DTL) | $17 | $— | $17 |
2023 | 2022 | |||||
Ordinary | Capital | Total | Ordinary | Capital | Total | |
Federal income taxes paid in prior years recoverable through loss carrybacks | $— | $— | $— | $— | $— | $— |
Adjusted gross DTA expected to be realized (excluding the amount of DTA from above) after application of the threshold limitation (the lesser of 1 and 2 below) | 33 | — | 33 | 16 | — | 16 |
1. Adjusted gross DTA expected to be realized following the balance sheet date | 33 | — | 33 | 16 | — | 16 |
2. Adjusted gross DTA allowed per limitation threshold | XXX | XXX | 118 | XXX | XXX | 31 |
Adjusted gross DTA (excluding the amount of DTA from above) offset by gross DTL | 73 | — | 73 | 67 | — | 67 |
DTA admitted as the result of application of SSAP 101 total | $106 | $— | $106 | $83 | $— | $83 |
Change | |||
Ordinary | Capital | Total | |
Federal income taxes paid in prior years recoverable through loss carrybacks | $— | $— | $— |
Adjusted gross DTA expected to be realized (excluding the amount of DTA from above) after application of the threshold limitation (the lesser of 1 and 2 below) | 17 | — | 17 |
1. Adjusted gross DTA expected to be realized following the balance sheet date | 17 | — | 17 |
2. Adjusted gross DTA allowed per limitation threshold | XXX | XXX | 87 |
Adjusted gross DTA (excluding the amount of DTA from above) offset by gross DTL | 6 | — | 6 |
DTA admitted as the result of application of SSAP 101 total | $23 | $— | $23 |
December 31, 2023 | December 31, 2022 | |
RBC percentage used to determine recovery period and threshold limitation amount | 3999 % | 615 % |
Amount of total adjusted capital used to determine recovery period and threshold limitation | $831 | $252 |
2023 | 2022 | 2021 | |
1. Current Income Tax | |||
(a) Federal | $2 | $93 | $28 |
(b) Foreign | — | — | — |
(c) Subtotal (1a + 1b) | 2 | 93 | 28 |
(d) Federal income tax on net capital gains | (1 ) | (2 ) | — |
(e) Utilization of capital loss carry-forwards | — | — | — |
(f) Other | — | — | — |
(g) Federal and foreign income taxes incurred (1c +1d +1e + 1f) | $1 | $91 | $28 |
2023 | 2022 | Change | |
2. Deferred Tax Assets | |||
(a) Ordinary: | |||
(1) Discounting of unpaid losses | $— | $— | $— |
(2) Unearned premium reserve | — | — | — |
(3) Policyholder reserves | 11 | 112 | (101 ) |
(4) Investments | 53 | 79 | (26 ) |
(5) Deferred acquisition costs | 4 | 9 | (5 ) |
(6) Policyholder dividends accrual | — | — | — |
(7) Fixed assets | — | — | — |
(8) Compensation and benefits accrual | — | — | — |
(9) Pension accrual | — | — | — |
(10) Receivables - nonadmitted | — | — | — |
(11) Net operating loss carryforward | 99 | 61 | 38 |
(12) Tax credit carryforwards | 8 | 8 | — |
(13) Other | 28 | 29 | (1 ) |
(99) Subtotal (sum of 2a1 through 2a13) | 203 | 298 | (95 ) |
(b) Statutory valuation allowance adjustment | — | 1 | (1 ) |
(c) Nonadmitted | 97 | 14 | (117 ) |
(d) Admitted ordinary deferred tax assets (2a99 -2b -2c) | 106 | 83 | 23 |
(e) Capital: | |||
(1) Investments | 6 | 4 | 2 |
(2) Net capital loss carry-forward | — | — | — |
(3) Real estate | — | — | — |
(4) Other | — | — | — |
(99) Subtotal (2e1+2e2+2e3+2e4) | 6 | 4 | 2 |
(f) Statutory valuation allowance adjustment | |||
(g) Nonadmitted | 6 | 4 | 2 |
(h) Admitted capital DTA (2e99-2f-2g) | — | — | — |
(i) Admitted deferred tax assets (2d+2h) | $106 | $83 | $23 |
3. Deferred Tax Liabilities | |||
(a) Ordinary: | |||
(1) Investments | $63 | $50 | $13 |
(2) Fixed assets | — | — | — |
(3) Deferred and uncollected premiums | 1 | 1 | — |
(4) Policyholder reserves | 9 | 16 | (7 ) |
(5) Other | — | — | — |
(99) Subtotal (3a1+3a2+3a3+3a4+3a5) | 73 | 67 | 6 |
(b) Capital: | |||
(1) Investments | — | — | — |
(2) Real estate | — | — | — |
(3) Other | — | — | — |
(99) Subtotal (3b1+3b2+3b3) | — | — | — |
(c) Deferred tax liabilities (3a99+3b99) | 73 | 67 | 6 |
4. Net deferred tax assets/liabilities (2i -3c) | $33 | $16 | 17 |
Change in nonadmitted deferred tax assets | (115 ) | ||
Tax effect of unrealized gains (losses) | (41 ) | ||
Change in net deferred tax assets | $(139 ) |
2022 | 2021 | Change | |
2. Deferred Tax Assets | |||
(a) Ordinary: | |||
(1) Discounting of unpaid losses | $— | $— | $— |
(2) Unearned premium reserve | — | — | — |
(3) Policyholder reserves | 112 | 56 | 56 |
(4) Investments | 79 | — | 79 |
(5) Deferred acquisition costs | 9 | 10 | (1 ) |
(6) Policyholder dividends accrual | — | — | — |
(7) Fixed assets | — | — | — |
(8) Compensation and benefits accrual | — | — | — |
(9) Pension accrual | — | — | — |
(10) Receivables -nonadmitted | — | — | — |
(11) Net operating loss carryforward | 61 | 61 | — |
(12) Tax credit carryforwards | 8 | 6 | 2 |
(13) Other | 29 | 36 | (7 ) |
(99) Subtotal (sum of 2a1 through 2a13) | 298 | 169 | 129 |
(b) Statutory valuation allowance adjustment | 1 | 1 | — |
(c) Nonadmitted | 214 | 102 | 112 |
(d) Admitted ordinary deferred tax assets (2a99 -2b -2c) | 83 | 66 | 17 |
(e) Capital: | |||
(1) Investments | 4 | — | 4 |
(2) Net capital loss carry-forward | — | — | — |
(3) Real estate | — | — | — |
(4) Other | — | — | — |
(99) Subtotal (2e1+2e2+2e3+2e4) | 4 | — | 4 |
(f) Statutory valuation allowance adjustment | — | — | — |
(g) Nonadmitted | 4 | — | 4 |
(h) Admitted capital deferred tax assets (2e99-2f-2g) | — | — | — |
(i) Admitted deferred tax assets (2d+2h) | $83 | $66 | $17 |
3. Deferred Tax Liabilities | |||
(a) Ordinary: | |||
(1) Investments | $50 | $65 | $(15 ) |
(2) Fixed assets | — | — | — |
(3) Deferred and uncollected premiums | 1 | 1 | — |
(4) Policyholder reserves | 16 | — | 16 |
(5) Other | — | — | — |
(99) Subtotal (3a1+3a2+3a3+3a4+3a5) | 67 | 66 | 1 |
(b) Capital: | |||
(1) Investments | — | — | — |
(2) Real estate | — | — | — |
(3) Other | — | — | — |
(99) Subtotal (3b1+3b2+3b3) | — | — | — |
(c) Deferred tax liabilities (3a99+3b99) | 67 | 66 | 1 |
4. Net deferred tax assets/liabilities (2i -3c) | $16 | $— | $16 |
Change in nonadmitted deferred tax assets | 116 | ||
Tax effect of unrealized gains (losses) | (15 ) | ||
Change in net deferred tax assets | $117 |
Year of expiration | Net Operating Loss Carryforwards |
Indefinite | $474 |
Year of Expiration | Tax Credit Carryforwards |
2027-2031 | $6 |
2032-2033 | 2 |
$8 |
2023 | 2022 | 2021 | |
Net gain (loss) from operations after dividends to policyholders and before Federal income tax @ 21% | $2 | $52 | $(70 ) |
Net realized capital gains (losses) @ 21% | 112 | (66 ) | 65 |
Tax effect of: | |||
Separate Account dividend received deduction | (1 ) | (1 ) | (2 ) |
Valuation allowance | (1 ) | — | 1 |
Other | (1 ) | — | 1 |
Uncertain tax positions | — | (1 ) | — |
Tax credits | (1 ) | (1 ) | (1 ) |
Change in nonadmitted assets | — | — | — |
Tax exempt income | — | — | — |
Prior years adjustments and accruals | — | (5 ) | (3 ) |
Interest maintenance reserve | 1 | (2 ) | (1 ) |
Reinsurance Ceding Commission | 29 | (2 ) | (2 ) |
Prior period adjustment in surplus | — | — | — |
Total statutory income taxes (benefit) | $140 | $(26 ) | $(12 ) |
Federal and foreign income taxes incurred including tax on realized capital gains | $1 | $91 | $28 |
Change in net DTA | 139 | (117 ) | (40 ) |
Prior years adjustments in surplus | — | — | — |
Total statutory income taxes (benefit) | $140 | $(26 ) | $(12 ) |
2023 | 2022 | |
Balance at beginning of year | $— | $1 |
Net change for tax positions of current year | — | — |
Net change for tax positions of prior years | — | — |
Settlements with tax authorities | — | — |
Lapses of statutes of limitations | — | (1 ) |
Balance at end of year | $— | $— |
Debt Type | Classification | Issue Year | Maturity Year | Carrying Value | Interest Rate | Interest Paid | Effective Interest Rate |
Affiliated Note | Short-Term | 2022 | 2023 | $125 | 5.450% | $2 | 5.450% |
2023 | 2022 | 2021 | |
Unrealized capital gains (losses) | $13 | $167 | $223 |
Nonadmitted asset values | $(104 ) | $(219 ) | $(103 ) |
Provision for reinsurance | $— | $— | $— |
Asset valuation reserve | $(46 ) | $(46 ) | $(36 ) |
(1) | (2) | (3) | (4) | (5) |
Nature and circumstances of guarantee and key attributes, including date and duration of agreement | Liability recognition of guarantee. (Include amount recognized at inception. If no initial recognition, document exception allowed under SSAP 5R.) | Ultimate financial statement impact if action under the guarantee is required. | Maximum potential amount of future payments (undiscounted) the guarantor could be required to make under the guarantee. If unable to develop an estimate, this should be specifically noted. | Current status of payment or performance risk of guarantee. Also provide additional discussion as warranted. |
The Company is obligated to indemnify the proprietary mutual fund, offered by the Separate Accounts, and the fund’s directors and officers as provided in certain Participation Agreements. | Intercompany and related party guarantees that are considered “unlimited” and as such are excluded from recognition. | Expense | Since this obligation is not subject to limitations, the Company does not believe that it is possible to determine the maximum potential amount that could become due under these guarantees in the future. | The Company has made no payments on the guarantee since inception. |
The Company has provided certain indemnities, guarantees and/or commitments to affiliates and third parties in the ordinary course of its business. In the context of acquisitions, dispositions, investments and other transactions, the Company has provided indemnities and guarantees that are triggered by, among other things, breaches of representations, warranties or covenants provided by the Company. | No liability has been established as the indemnification is for future events for which neither a probability of occurrence nor a reasonable estimate can be established at this time. | Expense | Since this obligation is not subject to limitations, the Company does not believe that it is possible to determine the maximum potential amount that could become due under these guarantees in the future. | The Company has made no payments on the guarantee since inception. |
The Company indemnifies its directors and officers as provided in its charters and by-laws. | No liability has been established as the indemnification is for future events for which neither a probability of occurrence nor a reasonable estimate can be established at this time. | Expense | Since this obligation is not subject to limitations, the Company does not believe that it is possible to determine the maximum potential amount that could become due under these guarantees in the future. | The Company has made no payments on the guarantee since inception. |
The Company indemnifies its agents for liabilities incurred as a result of their representation of the Company’s interests. | No liability has been established as the indemnification is for future events for which neither a probability of occurrence nor a reasonable estimate can be established at this time. | Expense | Since this obligation is not subject to limitations, the Company does not believe that it is possible to determine the maximum potential amount that could become due under these guarantees in the future. | The Company has made no payments on the guarantee since inception. |
Total | $ — | $ — |
In Force | ||||
2023 | 2022 | |||
Number | Balance | Number | Balance | |
Up to and including 12 Months | — | $— | — | $— |
13 to 24 Months | — | — | — | — |
25 to 36 Months | — | — | — | — |
37 to 48 Months | — | — | — | — |
49 to 60 Months | — | — | — | — |
Over 60 Months | 42 | 5 | 47 | 6 |
Total | 42 | $5 | 47 | $6 |
Individual | ||
Number | Balance/ Amount | |
Beginning of year | 47 | $6 |
Accounts issued/added | — | — |
Investment earnings credited | N/A | — |
Fees and other charges assessed* | N/A | — |
Transferred to state unclaimed property funds | — | — |
Closed/withdrawn | 5 | 1 |
End of year | 42 | $5 |
As of and for the Year Ended December 31, 2023 | |
Investment Income Earned | |
U.S. government bonds | $4,686,509 |
Other bonds (unaffiliated) | 64,133,188 |
Bonds of affiliates | — |
Preferred stocks (unaffiliated) | — |
Preferred stocks of affiliates | — |
Common stocks (unaffiliated) | — |
Common stocks of affiliates | — |
Mortgage loans | 8,922,729 |
Real estate | — |
Contract loans | 9,239 |
Cash and cash equivalents | 21,653,395 |
Derivative instruments | (89,011,308 ) |
Other invested assets | 4,133,631 |
Aggregate write-ins for investment income | 853 |
Gross investment income | $14,528,236 |
Real Estate Owned - Book Value Less Encumbrances | $— |
Mortgage Loans - Book Value | |
Agricultural mortgages | $46,216,034 |
Residential mortgages | — |
Commercial mortgages | 182,012,977 |
Total mortgage loans | $228,229,011 |
Mortgage Loans by Standing - Book Value | |
Good standing | $228,229,011 |
Good standing with restructured terms | $— |
Interest overdue more than three months, not in foreclosure | $— |
Foreclosure in process | $— |
Other Long Term Invested Assets - Statement Value | $36,174,700 |
Bonds and Stocks of Parents, Subsidiaries and Affiliates - Book Value: | |
Bonds | $— |
Preferred Stocks | $— |
Common Stocks | $— |
Bonds by Class and Maturity: | |
Bonds by Maturity - Statement Value | |
Due within one year or less | $59,057,338 |
Over 1 year through 5 years | 638,951,169 |
Over 5 years through 10 years | 348,240,819 |
Over 10 years through 20 years | 324,586,182 |
Over 20 years | 429,208,090 |
No maturity date | — |
Total by Maturity | $1,800,043,598 |
As of and for the Year Ended December 31, 2023 | |
Bond by Class - Statement Value | |
Class 1 | $1,249,308,482 |
Class 2 | 517,566,289 |
Class 3 | 18,654,140 |
Class 4 | 11,489,756 |
Class 5 | 3,024,931 |
Class 6 | — |
Total by Class | $1,800,043,598 |
Total Bonds Publicly Traded | $1,260,648,371 |
Total Bonds Privately Placed | $539,395,227 |
Preferred Stocks - Book/Adjusted Carrying Value | $3,276,084 |
Common Stocks - Fair Value | $— |
Short Term Investments - Book/Adjusted Carrying Value | $— |
Options, Caps and Floors Owned - Book/Adjusted Carrying Value | $126,171,957 |
Options, Caps and Floors Written and In-force - Book/Adjusted Carrying Value | $(10,081,000 ) |
Collar, Swap and Forward Agreements Open - Book/Adjusted Carrying Value | $10,802,613 |
Futures Contracts Open - Book/Adjusted Carrying Value | $— |
Cash on Deposit | $237,515,240 |
Life Insurance In-Force (000’s) | |
Industrial | $— |
Ordinary | $535,208 |
Credit Life | $— |
Group Life | $— |
Amount of Accidental Death Insurance In-Force Under Ordinary Policies (000’s) | $50 |
Life Insurance Policies with Disability Provisions In-Force (000’s) | |
Industrial | $— |
Ordinary | $4,284,173 |
Credit Life | $— |
Group Life | $— |
As of and for the Year Ended December 31, 2023 | |
Ordinary - Not Involving Life Contingencies | |
Amount on Deposit | $14,101,457 |
Income Payable | $2,728,069 |
Ordinary - Involving Life Contingencies | |
Income Payable | $8,952,648 |
Group - Not Involving Life Contingencies | |
Amount on Deposit | $— |
Income Payable | $— |
Group - Involving Life Contingencies | |
Income Payable | $— |
Annuities: | |
Ordinary | |
Immediate - Amount of Income Payable | $12,101,587 |
Deferred - Fully Paid Account Balance | $594,382,003 |
Deferred - Not Fully Paid Account Balance | $9,391,205,660 |
Group | |
Amount of Income Payable | $— |
Fully Paid Account Balance | $— |
Not Fully Paid Account Balance | $— |
Accident and Health Insurance - Premiums In-Force: | |
Ordinary | $— |
Group | $— |
Credit | $— |
Deposit Funds and Dividend Accumulations: | |
Deposit Funds - Account Balance | $— |
Dividend Accumulations - Account Balance | $— |
As of and for the Year Ended December 31, 2023 | |
Claim Payments For The Year Ended December 31, 2023 (000’s): | |
Group Accident and Health | |
2023 | $— |
2022 | $— |
2021 | $— |
2020 | $— |
2019 | $— |
Prior | $— |
Other Accident & Health | |
2023 | $— |
2022 | $— |
2021 | $— |
2020 | $— |
2019 | $— |
Prior | $— |
Other Coverages that use developmental methods to calculate claim reserves | |
2023 | $— |
2022 | $— |
2021 | $— |
2020 | $— |
2019 | $— |
Prior | $— |
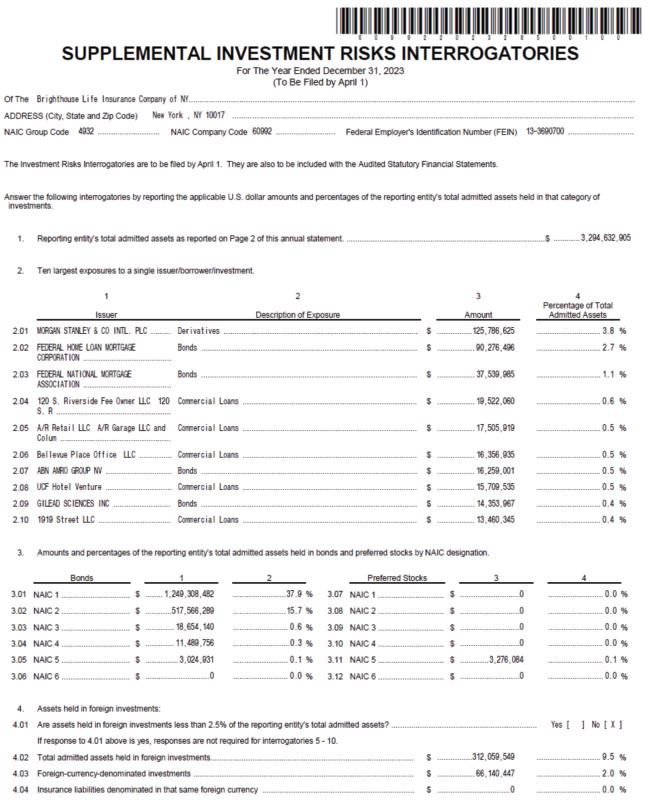
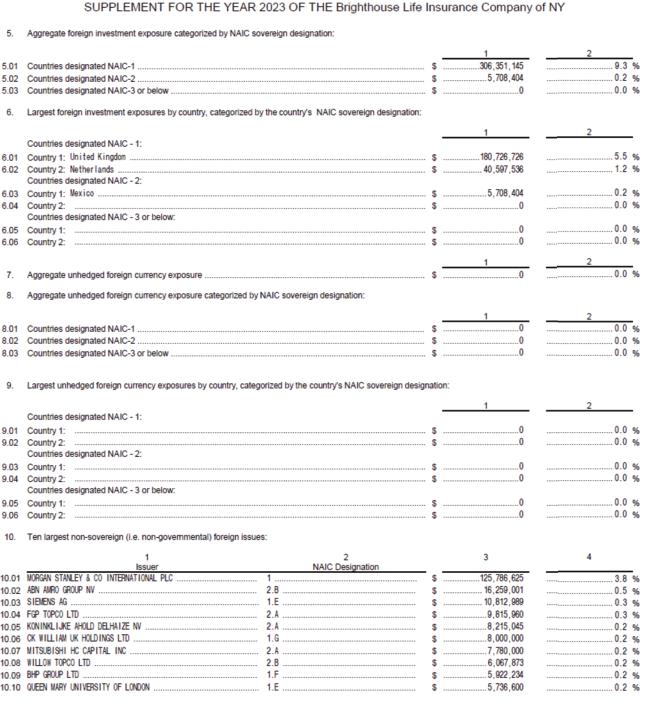

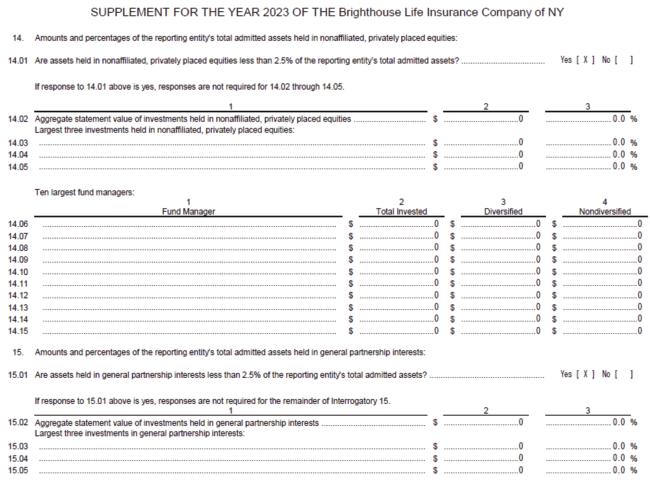
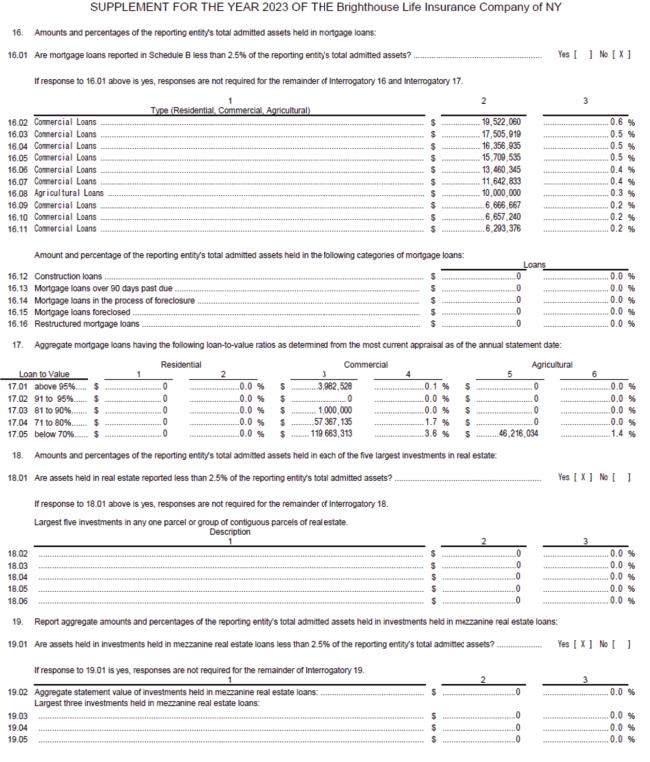
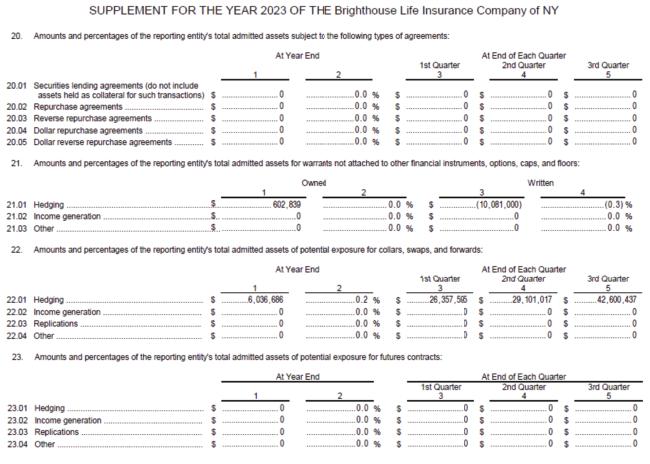
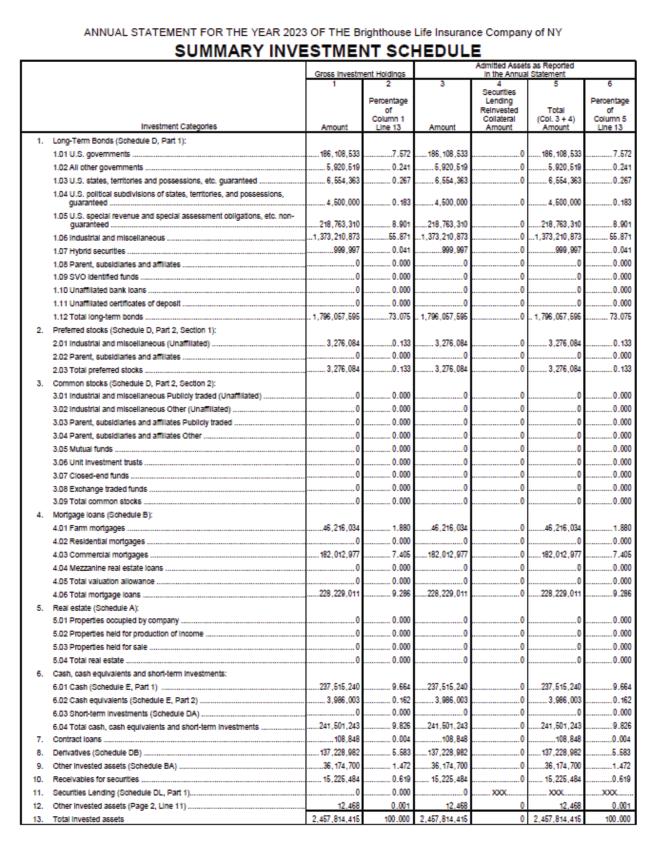
Brighthouse Life Insurance Company of NY
(An Indirect Subsidiary of Brighthouse Financial, Inc.)
For the periods ended March 31, 2024 and 2023 (unaudited) and December 31, 2023
Index to Statutory Basis Financial Statements
Interim Condensed Financial Statements at March 31, 2024 and December 31, 2023 and for the Three Months Ended March 31, 2024 and 2023: |
Interim Condensed Statutory Statements of Admitted Assets, Liabilities and Capital and Surplus |
Interim Condensed Statutory Statements of Operations and Changes in Capital and Surplus |
Interim Condensed Statutory Statements of Cash Flow |
Notes to the Interim Condensed Statutory Financial Statements |
Note 1 — Summary of Significant Accounting Policies |
Note 2 — Fair Value Information |
Note 3 — Investments |
Note 4 — Related Party Information |
Note 5 — Reinsurance and Other Insurance Transactions |
Note 6 — Subsequent Events |
181
BRIGHTHOUSE LIFE INSURANCE COMPANY OF NY
Interim Condensed Statutory Statements of Admitted Assets, Liabilities and Capital and Surplus
March 31, 2024 (Unaudited) and December 31, 2023
(In millions, except share data)
| March 31, 2024 | December 31, 2023 | |||||||
ADMITTED ASSETS | ||||||||
Bonds | $ | 1,893 | $ | 1,796 | ||||
Preferred stocks | 3 | 3 | ||||||
Mortgage loans | 194 | 228 | ||||||
Cash, cash equivalents and short-term investments | 210 | 242 | ||||||
Derivative assets | 176 | 137 | ||||||
Other invested assets | 53 | 51 | ||||||
|
|
|
| |||||
Total invested assets | 2,529 | 2,457 | ||||||
Investment income due and accrued | 17 | 15 | ||||||
Premiums and annuity considerations deferred and uncollected | 2 | 2 | ||||||
Reinsurance recoverable | 574 | 778 | ||||||
Federal income tax recoverables | 1 | — | ||||||
Net deferred tax asset | 25 | 33 | ||||||
Other assets | 11 | 10 | ||||||
|
|
|
| |||||
Total assets excluding Separate Accounts | 3,159 | 3,295 | ||||||
Separate Account assets | 9,272 | 8,852 | ||||||
|
|
|
| |||||
Total Admitted Assets | $ | 12,431 | $ | 12,147 | ||||
|
|
|
| |||||
LIABILITIES AND CAPITAL AND SURPLUS | ||||||||
Liabilities | ||||||||
Reserves for life insurance and annuities | $ | 899 | $ | 931 | ||||
Liability for deposit-type contracts | 14 | 14 | ||||||
Other policy liabilities | 342 | 634 | ||||||
Asset valuation reserve | 48 | 45 | ||||||
Derivative liabilities | 8 | 10 | ||||||
Payable for collateral under securities loaned and other transactions | 84 | 44 | ||||||
Net transfers to (from) Separate Accounts due and accrued | 244 | 141 | ||||||
Funds held under reinsurance treaties | 416 | 418 | ||||||
Other liabilities | 292 | 239 | ||||||
|
|
|
| |||||
Total liabilities excluding Separate Accounts | 2,347 | 2,476 | ||||||
Separate Account liabilities | 9,271 | 8,852 | ||||||
|
|
|
| |||||
Total Liabilities | 11,618 | 11,328 | ||||||
|
|
|
| |||||
Capital and Surplus | ||||||||
Capital stock (par value $10 per share, 200,000 shares authorized, issued and outstanding) | 2 | 2 | ||||||
Paid-in surplus | 670 | 670 | ||||||
Special surplus fund reserve | 9 | 9 | ||||||
Unassigned surplus (deficit) | 132 | 138 | ||||||
|
|
|
| |||||
Total Capital and Surplus | 813 | 819 | ||||||
|
|
|
| |||||
Total Liabilities and Capital and Surplus | $ | 12,431 | $ | 12,147 | ||||
|
|
|
| |||||
See accompanying unaudited notes to interim condensed statutory financial statements
182
BRIGHTHOUSE LIFE INSURANCE COMPANY OF NY
Interim Condensed Statutory Statements of Operations and Changes in Capital and Surplus
For the Three Months Ended March 31, 2024 and 2023 (Unaudited)
(In millions)
| Three Months Ended March 31, | ||||||||
| 2024 | 2023 | |||||||
INCOME | ||||||||
Premiums and annuity considerations | $ | 28 | $ | 190 | ||||
Considerations for supplementary contracts and dividend accumulations | 2 | 2 | ||||||
Net investment income | 23 | (9 | ) | |||||
Reserve adjustments on reinsurance ceded | 232 | (76 | ) | |||||
Other income (loss) | (222 | ) | (125 | ) | ||||
|
|
|
| |||||
Total income | 63 | (18 | ) | |||||
|
|
|
| |||||
BENEFITS AND EXPENSES | ||||||||
Benefit payments | 64 | 92 | ||||||
Changes to reserves, deposit funds and other policy liabilities | (28 | ) | (34 | ) | ||||
Insurance expenses and taxes (other than Federal income and capital gains taxes) | 34 | 32 | ||||||
Net transfers to (from) Separate Accounts | 8 | 100 | ||||||
|
|
|
| |||||
Total benefits and expenses before Federal income tax | 78 | 190 | ||||||
|
|
|
| |||||
Gain (loss) from operations before Federal income tax | (15 | ) | (208 | ) | ||||
Federal income tax expense (benefit) (excluding income tax on capital gains and losses) | — | (1 | ) | |||||
|
|
|
| |||||
Gain (loss) from operations | (15 | ) | (207 | ) | ||||
Net realized capital gains (losses), net of Federal income tax and interest maintenance reserve transfer | 1 | 93 | ||||||
|
|
|
| |||||
NET INCOME (LOSS) | (14 | ) | (114 | ) | ||||
CHANGES IN CAPITAL AND SURPLUS | ||||||||
Change in General Account net unrealized capital gains (losses) | 26 | 81 | ||||||
Change in net deferred income tax | 6 | 25 | ||||||
Change in nonadmitted assets | (7 | ) | (11 | ) | ||||
Change in asset valuation reserve | (3 | ) | 2 | |||||
Change in surplus as a result of reinsurance | (13 | ) | (4 | ) | ||||
Change in surplus adjustment paid in | — | 100 | ||||||
Other–net | (1 | ) | — | |||||
|
|
|
| |||||
NET CHANGE IN CAPITAL AND SURPLUS | (6 | ) | 79 | |||||
CAPITAL AND SURPLUS AT BEGINNING OF YEAR | 819 | 223 | ||||||
|
|
|
| |||||
CAPITAL AND SURPLUS AT END OF YEAR | $ | 813 | $ | 302 | ||||
|
|
|
| |||||
See accompanying unaudited notes to interim condensed statutory financial statements
183
BRIGHTHOUSE LIFE INSURANCE COMPANY OF NY
Interim Condensed Statutory Statements of Cash Flow
For the Three Months Ended March 31, 2024 and 2023 (Unaudited)
(In millions)
| Three Months Ended March 31, | ||||||||
| 2024 | 2023 | |||||||
CASH FROM OPERATIONS | ||||||||
Premiums and annuity considerations, net of reinsurance, received | $ | (1,720 | ) | $ | 205 | |||
Net investment income received | 21 | (11 | ) | |||||
Other income (loss) received | 3,922 | 31 | ||||||
|
|
|
| |||||
Total receipts | 2,223 | 225 | ||||||
|
|
|
| |||||
Benefits paid (other than dividends) | 2,350 | 175 | ||||||
Insurance expenses and taxes paid (other than Federal income and capital gains taxes) | (165 | ) | 37 | |||||
Net transfers to (from) Separate Accounts | 183 | — | ||||||
Total payments | 2,368 | 212 | ||||||
|
|
|
| |||||
Net cash provided by (used in) operations | (145 | ) | 13 | |||||
|
|
|
| |||||
CASH FROM INVESTMENTS | ||||||||
Proceeds from invested assets sold, matured or repaid | 85 | 157 | ||||||
Cost of invested assets acquired | (23 | ) | (14 | ) | ||||
|
|
|
| |||||
Net cash provided by (used in) investments | 62 | 143 | ||||||
|
|
|
| |||||
CASH FROM FINANCING AND OTHER SOURCES | ||||||||
Borrowed money | — | (50 | ) | |||||
Net change in deposit-type contracts | — | (1 | ) | |||||
Other-net | 52 | (31 | ) | |||||
|
|
|
| |||||
Net cash provided by (used in) financing and other sources | 52 | (82 | ) | |||||
|
|
|
| |||||
NET CHANGE IN CASH, CASH EQUIVALENTS AND SHORT-TERM INVESTMENTS: | (32 | ) | 74 | |||||
CASH, CASH EQUIVALENTS AND SHORT-TERM INVESTMENTS: | ||||||||
BEGINNING OF YEAR | 242 | 317 | ||||||
|
|
|
| |||||
END OF YEAR | $ | 210 | $ | 391 | ||||
|
|
|
| |||||
SUPPLEMENTAL DISCLOSURES OF CASH FLOW INFORMATION FOR NON-CASH TRANSACTIONS: | ||||||||
Reinsurance settlement to premiums ceded, asset in kind transfer out | $ | (2,546 | ) | $ | — | |||
Modified coinsurance, asset in kind transfer in | $ | 2,468 | $ | — | ||||
Commissions, asset kind transfer in | $ | 119 | $ | — | ||||
Bonds, asset in kind transfer in | $ | 96 | $ | 100 | ||||
Surrender benefits, asset in kind transfer in | $ | 51 | $ | — | ||||
Death benefits, asset in kind transfer in | $ | 6 | $ | — | ||||
See accompanying unaudited notes to interim condensed statutory financial statements
184
BRIGHTHOUSE LIFE INSURANCE COMPANY OF NY
Notes to the Interim Condensed Statutory Financial Statements
For the Three Months Ended March 31, 2024 and 2023 (Unaudited) and December 31, 2023
Note 1 - Summary of Significant Accounting Policies
Business
Brighthouse Life Insurance Company of NY (the “Company”) is a wholly-owned subsidiary of Brighthouse Life Insurance Company (“Brighthouse Insurance”), which is an indirect subsidiary of Brighthouse Financial, Inc. (“Brighthouse”) a Delaware corporation. The Company is domiciled in the State of New York (“New York”) and is only licensed to transact insurance business therein, and is subject to regulation by New York. The Company markets or administers traditional life and universal life insurance; as well as variable, fixed, index-linked, and income annuity products to individuals.
Since the Company is a member of a controlled group of affiliated companies, its results may not be indicative of those of a stand-alone entity.
Basis of Presentation
The accompanying interim condensed financial statements have been prepared on the basis of accounting practices prescribed or permitted by the New York Department of Financial Services (the “Department” or “NYDFS”). The Department requires that insurance companies domiciled in New York prepare their statutory financial statements in accordance with the National Association of Insurance Commissioners’ (“NAIC”) Accounting Practices and Procedures Manual (“NAIC SAP”) as modified by the Department. NAIC SAP adjusted for these differences is referred to in these interim condensed statutory financial statements as New York Statutory Accounting Principles (“NY SAP”).
For variable and certain index-linked annuities, under NAIC SAP, reserves are determined based on the requirements of the NAIC Valuation Manual Section 21 (“VM-21”). Under NY SAP, reserves are equal to the greater of the amount determined under VM-21 and the amount determined under New York Regulation 213 (“Reg 213”).
For deferred annuities, under NAIC SAP, reserves are determined under the NAIC model standard valuation law (referred to as curtate Commissioners’ Annuity Reserve Valuation Method (“CARVM”)). Under NY SAP, deferred annuity reserves are computed as described by the New York valuation law (referred to as continuous CARVM).
Under NYDFS Circular Letter No. 11 (2010), ceded reserves are reduced by the deferred premium asset proportional to the amount ceded. Under NAIC SAP, there is no such specific requirement.
185
BRIGHTHOUSE LIFE INSURANCE COMPANY OF NY
Notes to the Interim Condensed Statutory Financial Statements
For the Three Months Ended March 31, 2024 and 2023 (Unaudited) and December 31, 2023 (continued)
A reconciliation of the Company’s net income (loss) for the three months ended March 31 and capital and surplus at March 31 between NY SAP and NAIC SAP is shown below (in millions):
| For the Three Months Ended March 31, | ||||||||||||
| SSAP Number (1) | 2024 | 2023 | ||||||||||
Net income (loss), NY SAP | $ | (14 | ) | $ | (114 | ) | ||||||
State prescribed practices: | ||||||||||||
Deferred annuities using continuous CARVM | 51 | — | — | |||||||||
Variable annuities in excess of NY Reg 213 standard scenario over VM 21 stochastic reserves | 51 | — | — | |||||||||
NYSDFS Circular Letter No. 11 (2010) impact on deferred premiums | 61 | — | — | |||||||||
NYSDFS Seventh Amendment to Regulation No. 172 impact on admitted unearned reinsurance premium | 61 | — | — | |||||||||
State permitted practices: NONE | — | — | ||||||||||
|
|
|
| |||||||||
Net income, NAIC SAP | $ | (14 | ) | $ | (114 | ) | ||||||
|
|
|
| |||||||||
| March 31, | ||||||||||||
| SSAP Number | 2024 | 2023 | ||||||||||
Statutory capital and surplus, NY SAP | $ | 813 | $ | 302 | ||||||||
State prescribed practices: | ||||||||||||
Deferred annuities using continuous CARVM | 51 | 1 | — | |||||||||
Variable annuities in excess of NY Reg 213 standard scenario over VM 21 stochastic reserves | 51 | 3 | — | |||||||||
NYSDFS Circular Letter No. 11 (2010) impact on deferred premiums | 61 | (2 | ) | — | ||||||||
NYSDFS Seventh Amendment to Regulation No. 172 impact on admitted unearned reinsurance premium | 61 | 9 | (1 | ) | ||||||||
State permitted practices: NONE | — | — | ||||||||||
|
|
|
| |||||||||
Statutory capital and surplus, NAIC SAP | $ | 824 | $ | 301 | ||||||||
|
|
|
| |||||||||
(1) Statement of Statutory Accounting Principles (“SSAP”) | ||||||||||||
The Company’s risk-based capital (“RBC”) would not have triggered a regulatory event without the use of the state prescribed practices referenced in the table above.
NY SAP comprises a basis of accounting which differs from generally accepted accounting principles (“GAAP”). The more significant differences are as follows:
| • | Policy acquisition costs are charged to expense as incurred under NY SAP; whereas under GAAP, certain policy acquisition costs are deferred and amortized over the estimated lives of the contracts in a manner that approximates a straight-line basis over the expected life of the related contracts; |
| • | Insurance reserves are determined using prescribed factors for mortality, lapses and interest without consideration of company experience, or using a principles based reserve method equal to the higher of reserves using prescribed factors and reserves that consider a wide range of future economic conditions, as well as, company experience. Under GAAP, reserves are determined based upon best estimates as of the date the policy is issued, or the account value plus a reserve for additional benefits, that is either based on current assumptions or measured at fair value with an adjustment for non-performance risk; |
| • | Certain assets designated as “nonadmitted assets” are excluded from the Statutory Statements of Admitted Assets, Liabilities and Capital and Surplus by direct charges to unassigned surplus (deficit), including a portion of deferred income tax assets (“DTA”) and negative Interest Maintenance Reserve (“IMR”) balances; |
186
BRIGHTHOUSE LIFE INSURANCE COMPANY OF NY
Notes to the Interim Condensed Statutory Financial Statements
For the Three Months Ended March 31, 2024 and 2023 (Unaudited) and December 31, 2023 (continued)
| • | Contracts that have any mortality and morbidity risk, regardless of significance, and contracts with life contingent annuity purchase rate guarantees are classified as insurance contracts and amounts received under these contracts are reported as revenue for NY SAP; whereas under GAAP, for contracts that do not subject the Company to significant risks arising from mortality or morbidity, amounts received are reported as increases to policyholder account balances; |
| • | Certain reinsurance agreements are accounted for as reinsurance under both NY SAP and GAAP if certain risk transfer provisions are met. The risk transfer provisions in GAAP differ from the risk transfer provisions under NY SAP. Under GAAP, the reinsurer must assume significant insurance risk and have a reasonable possibility of realizing a significant loss from the transaction. NY SAP requires the reinsurer to assume all of certain risks deemed to be significant, regardless of the significance of loss potential. Assets and liabilities as a result of reinsurance transactions are netted under NY SAP but are reported gross under GAAP. Ceding commissions received in conjunction with reinsurance transactions are reported as revenue under NY SAP but are reported as a reduction of commission expense under GAAP; |
| • | A liability is established when the reserves ceded to an unauthorized reinsurer exceed the eligible collateral supporting the reserves. Changes to these amounts are credited or charged directly to unassigned surplus (deficit). Under GAAP, no such liability is required; |
| • | Investments in bonds and preferred stocks are generally carried at amortized cost under NY SAP. Under GAAP, investments in bonds and preferred stocks have one of three classifications. Those classified as held-to-maturity are carried at amortized cost, those classified as available-for-sale are carried at estimated fair value with adjustments for changes in estimated fair value recorded as a component of equity and those classified as trading are carried at estimated fair value with adjustments for changes in estimated fair value recorded through earnings; |
| • | Investments in mortgage loans that are impaired are reported at the estimated fair value of the underlying collateral less estimated costs to obtain and sell such collateral. If the estimated fair value of the impaired loan subsequently increases, the mortgage loan’s carrying value may not be adjusted to reflect this increase in value. Under GAAP, impaired mortgage loans may also be assessed using observable market price or discounted cash flow (“DCF”) methodologies using the loan’s original effective interest rate. If the value of the impaired mortgage loan subsequently increases, under GAAP, the mortgage loan’s carrying value may be adjusted to reflect this increase, through a decrease in a specific valuation allowance; |
| • | The Company establishes a general valuation allowance when the amount of the loan loss contingency is greater than the mortgage component of the asset valuation reserve (“AVR”). The amount recorded is the excess of the loss contingency amount over the mortgage component of the AVR, with an offset to net unrealized capital gains and (losses). Under GAAP, the required allowance for credit losses is recorded as a reduction to net carrying value with an offset to realized gains and losses; |
| • | An AVR liability is established, based upon a formula prescribed by the NAIC, to offset potential credit-related investment losses on all invested assets. Changes in the AVR are charged or credited directly to unassigned surplus (deficit). Under GAAP, no such reserve is required; |
| • | An IMR is established to capture realized gains and losses, net of income tax, on the sale of fixed income investments, principally bonds and mortgage loans, resulting from changes in the general level of interest rates, and is amortized into net investment income over the remaining years to expected maturity of the assets sold; whereas under GAAP, available-for-sale bonds and mortgage loan gains and losses on disposal are reported in earnings in the period that the assets are sold; |
| • | Most derivatives that do not meet the criteria for hedge accounting are carried at estimated fair value with changes in their estimated fair value reported in changes in capital and surplus. Under GAAP, if a derivative does not qualify for hedge accounting, changes in the estimated fair value of the derivative are generally reported in net derivative gains (losses), a component of net income. An embedded derivative that is not clearly and closely related to the economic characteristics of the host contract and that meets certain other criteria is bifurcated from the host contract and accounted for separately at estimated fair value; |
| • | Deferred income tax is calculated based on temporary differences between NY SAP and tax-basis reporting, subject to certain asset admission limitations for DTA, rather than the difference between GAAP and tax-basis reporting, without such asset admission limitations; |
187
BRIGHTHOUSE LIFE INSURANCE COMPANY OF NY
Notes to the Interim Condensed Statutory Financial Statements
For the Three Months Ended March 31, 2024 and 2023 (Unaudited) and December 31, 2023 (continued)
| • | Certain items, including modifications to required policy reserves resulting from changes in reserve methodologies, are recorded directly to unassigned surplus (deficit) rather than being reflected in income under GAAP; |
| • | For loss contingencies, when no amount within management’s estimate of the range is a better estimate than any other amount, the midpoint of the range is accrued; whereas under GAAP, the minimum amount in the range is accrued. In addition, the timing of recognition of certain costs related to loss contingencies may be different; |
| • | Gains on certain economic transactions with related parties, defined as arm’s-length transactions, resulting in the transfer of risks and rewards of ownership and considered permanent, are recognized under NY SAP rather than deferred until the assets are sold to third parties as required under GAAP; |
| • | Separate Account assets, liabilities, income and expenses are reflected using a summarized presentation in the financial statements under NY SAP; under GAAP only separate accounts where all of the investment risk is borne by the policyholder quantify for summarized presentation. |
Accounting Changes and Correction of Errors
The Company had no accounting changes or correction of errors for the three months ended March 31, 2024.
GAAP Equity and Income
GAAP consolidated net income (loss) attributable to the Company was $25 million and $39 million for the three months ended March 31, 2024 and 2023, respectively. GAAP consolidated stockholder’s equity was $665 million and $654 million at March 31, 2024 and December 31, 2023, respectively.
Use of Estimates
The preparation of financial statements requires that management make estimates and assumptions that affect the reported amounts of assets and liabilities at the dates of the financial statements. Management is also required to disclose contingent assets and liabilities at the dates of the financial statements and the reported amounts of revenues and expenses during the reporting periods. Actual results may differ from those estimates.
Investments
Income from investments, including amortization of premium, accretion of discount and similar items, is recorded within net investment income, unless otherwise stated herein. Other-than-temporary impairments (“OTTI”) are recorded as realized capital losses, the cost basis of the investment is reduced and the revised cost basis is not adjusted for subsequent recoveries in value.
Bonds are generally stated at amortized cost, unless they have a NAIC designation of 6, in which case they are stated at the lower of amortized cost or estimated fair value. Unrealized capital losses on bonds having a NAIC designation of 6 are charged directly to unassigned surplus (deficit). Interest and prepayment fees are recorded when earned. Amortization of premium or accretion of discount is calculated using the effective yield method taking into consideration specified interest and principal provisions over the life of the bonds or estimated timing and amount of prepayments of underlying loans for commercial mortgage-backed securities (“CMBS”), residential mortgage-backed securities (“RMBS”) and asset-backed securities (“ABS”) (collectively “loan-backed securities”). Actual prepayment experience is periodically reviewed and effective yields are recalculated when differences arise between the prepayments originally anticipated and the actual prepayments received and currently anticipated. Prepayment assumptions for single class and multi-class mortgage-backed securities and ABS are estimated using inputs obtained from third party specialists, and are based on management’s knowledge of the current market. For credit-sensitive mortgage-backed securities and ABS and certain prepayment-sensitive securities, the effective yield is recalculated on a prospective basis. For all other mortgage-backed securities and ABS, the effective yield is recalculated on a retrospective basis.
For loan-backed securities, the NAIC relies on the second lowest NAIC Credit Rating Provider (“CRP”) rating to determine the initial NAIC designation. The second lowest CRP rating is used to determine the carrying value of the security, which is based on the NAIC’s estimate of expected losses, using an NAIC published formula. The carrying value of the security
188
BRIGHTHOUSE LIFE INSURANCE COMPANY OF NY
Notes to the Interim Condensed Statutory Financial Statements
For the Three Months Ended March 31, 2024 and 2023 (Unaudited) and December 31, 2023 (continued)
determines its final NAIC designation. This methodology does not apply to NAIC 1 and NAIC 6 securities which are rated at the second lowest CRP designation. Loan-backed and structured securities are stated at either amortized cost or the lower of amortized cost or fair market value.
The Company periodically evaluates bonds for impairment. The assessment of whether impairments have occurred is based on management’s case-by-case evaluation of the underlying reasons for the decline in estimated fair value, as well as an analysis of the gross unrealized losses by severity and/or age as described in Note 3 “Evaluating Temporarily Impaired Bonds for OTTI”. Management considers a wide range of factors about the security issuer and uses its best judgment in evaluating the cause of the decline in the estimated fair value of the security and in assessing the prospects for near-term recovery. Inherent in management’s evaluation of the security are assumptions and estimates about the operations of the issuer and its future earnings potential. Considerations used in the impairment evaluation process include, but are not limited to: (i) the length of time and the extent to which the estimated fair value has been below amortized cost; (ii) the potential for impairments when the issuer is experiencing significant financial difficulties; (iii) the potential for impairments in an entire industry sector or sub-sector; (iv) the potential for impairments in certain economically depressed geographic locations; (v) the potential for impairments where the issuer, series of issuers or industry has suffered a catastrophic type of loss or has exhausted natural resources; (vi) both the Company’s intent to sell a security before the recovery of its estimated fair value and its intent and ability to hold the security for a period of time sufficient to allow for the recovery of its value to an amount equal to or greater than amortized cost; (vii) unfavorable changes in forecasted cash flows on mortgage-backed securities and ABS; (viii) the potential for impairments due to weakening foreign currencies on foreign currency denominated bonds that are near maturity; and (ix) other subjective factors, including concentrations and information obtained from regulators and rating agencies.
The Company recognizes an OTTI loss in earnings for a loan-backed security in an unrealized loss position when it is anticipated that the amortized cost basis will not be recovered. In such situations, the OTTI loss recognized in earnings is the entire difference between the security’s amortized cost and its estimated fair value only when either: (i) the Company intends to sell the security or (ii) the Company does not have the intent and ability to retain the security for the time sufficient to recover the amortized cost basis. Non-interest related OTTI losses are recorded through the AVR and interest related losses through the IMR. If neither of the two conditions exists, and the Company has the intent and ability to hold the security but does not expect to recover the entire amortized cost, the difference between the amortized cost basis of the security and the present value of projected future cash flows expected to be collected is recognized as an OTTI loss.
The determination of estimated fair values for securities and other investments is described in Note 2.
Mortgage loans are stated at unpaid principal balance, adjusted for any unamortized premium, discount or deferred fees, and are net of valuation allowances. Interest income and prepayment fees are recorded when earned. Interest income is accrued on the principal amount of the loan based on the loan’s contractual interest rate. Amortization of premium and accretion of discount are recorded using the effective yield method. Gains and losses from sales of loans are recorded in net realized capital gains (losses).
Mortgage loans are considered to be impaired when it is probable that, based upon current information and events, the Company will be unable to collect all amounts due under the loan agreement. Valuation allowances are established both on a loan specific basis and, in certain circumstances described below, for pools of loans. Valuation allowances are determined separately for each of the loan portfolio segments: commercial and agricultural. In conjunction with the valuation allowance process, management identifies mortgage loans to be placed on a nonaccrual status at which time the Company recognizes income on the cash method.
Specific valuation allowances are established using the same methodology for both portfolio segments and a common evaluation framework is used for establishing general valuation allowances for the loan portfolio segments; however, a separate general valuation allowance is calculated and maintained for each loan portfolio segment that is based on inputs that are unique to each loan portfolio segment. The Company records specific valuation allowances for impaired mortgage loans when it is probable that based upon current information and events, the Company will be unable to collect all amounts due under the contractual terms of the loan agreement. Based on the facts and circumstances of the individual mortgage loans being impaired, loan specific valuation allowances are established for the excess carrying value of the mortgage loan over the estimated fair value of the loan’s underlying collateral (as determined by acceptable appraisal methodologies) less estimated costs to obtain and sell such collateral. Changes in these loan specific valuation allowances are reported within net realized capital gains (losses). General valuation allowances are established for loan
189
BRIGHTHOUSE LIFE INSURANCE COMPANY OF NY
Notes to the Interim Condensed Statutory Financial Statements
For the Three Months Ended March 31, 2024 and 2023 (Unaudited) and December 31, 2023 (continued)
losses when a loss contingency exists for pools of loans with similar characteristics, such as mortgage loans based on similar property types or loans with similar loan-to-value or similar debt service coverage ratio factors. A loss contingency exists when, based on experience, it is probable that a credit event has occurred and the amount of credit loss can be reasonably estimated. These evaluations are based upon several loan portfolio segment specific factors, including the Company’s experience with loan losses, defaults and loss severity, and loss expectations for loans with similar risk characteristics. The Company typically uses ten years or more of historical experience in these evaluations. These evaluations are revised as conditions change and new information becomes available. The general valuation allowance is established when the amount of the loan loss contingency is greater than the mortgage component of the AVR, and the amount recorded is the excess of the loss contingency amount over the mortgage component of the AVR. If the mortgage component of the AVR is greater than the loss contingency amount, no general valuation allowance is recorded. Changes in the general valuation allowance are included in change in General Account net unrealized capital gains (losses) which are credited or charged directly to unassigned surplus (deficit).
All commercial loans are monitored on an ongoing basis which may include an analysis of the property’s financial statements and rent rolls, lease rollover analysis, property inspections, market analysis, estimated valuations of the underlying collateral, loan-to-value ratios, debt service coverage ratios and tenant creditworthiness. The monitoring process for commercial loans focuses on higher risk loans, which include those that are classified as restructured, delinquent or in foreclosure, as well as loans with higher loan-to-value and lower debt service coverage ratios. The monitoring process for agricultural loans is generally similar to the commercial loan monitoring process, with a focus on higher risk loans, including reviews of the agricultural loan portfolio on a geographic and sector basis. Higher risk commercial and agricultural loans are reviewed individually on an ongoing basis for potential credit loss and specific valuation allowances are established using the methodology described above for all loan portfolio segments. Quarterly, the remaining loans are reviewed on a pool basis, by aggregating groups of loans that have similar risk characteristics for potential credit loss. General valuation allowances are established as described above using inputs that are unique to each segment of the loan portfolio.
For commercial loans, the primary credit quality indicator is the debt service coverage ratio, which compares a property’s net operating income to amounts needed to service the principal and interest due under the loan. Generally, the lower the debt service coverage ratio, the higher the risk of experiencing a credit loss. The Company also reviews the loan-to-value ratio of its commercial loan portfolio. Loan-to-value ratios compare the unpaid principal balance of the loan to the estimated fair value of the underlying collateral. Generally, the higher the loan-to-value ratio, the higher the risk of experiencing a credit loss. The debt service coverage ratio and the values utilized in calculating the ratio are updated annually on a rolling basis, with a portion of the loan portfolio updated each quarter. In addition, the loan-to-value ratio is routinely updated for all but the lowest risk loans as part of the Company’s ongoing review of its commercial mortgage loan portfolio.
For agricultural loans, the Company’s primary credit quality indicator is the loan-to-value ratio. The values utilized in calculating this ratio are developed in connection with the ongoing review of the agricultural loan portfolio and are routinely updated. Additionally, the Company focuses the monitoring process on higher risk loans, including reviews on a geographic and property-type basis.
The Company may grant concessions related to a particular borrower’s financial difficulties which are classified as troubled debt restructurings. Generally, the types of concessions include: reduction of the contractual interest rate, extension of the maturity date at an interest rate lower than current market interest rates and/or a reduction of accrued interest. The amount, timing and extent of the concession granted is considered in determining any impairment or changes in the specific valuation allowance recorded in connection with the troubled debt restructuring. Through the recurring portfolio monitoring process, a specific valuation allowance may have been recorded prior to the period when the mortgage loan is modified in a troubled debt restructuring. Accordingly, the carrying value (after specific valuation allowance) before and after modification through a troubled debt restructuring may not change significantly, or may increase if the expected recovery is higher than the pre-modification recovery assessment.
Cash equivalents, which are short-term, highly liquid securities and other investments with original maturities of three months or less at date of purchase, are stated at amortized cost, except for securities which have a NAIC designation of 6, in which case they are stated at the lower of amortized cost or estimated fair value.
Other invested assets consist of investments in surplus notes, an investment in the equity tranche of a collateralized loan obligation and a real estate joint venture.
Investments in surplus notes are carried at amortized cost.
190
BRIGHTHOUSE LIFE INSURANCE COMPANY OF NY
Notes to the Interim Condensed Statutory Financial Statements
For the Three Months Ended March 31, 2024 and 2023 (Unaudited) and December 31, 2023 (continued)
The investment in the equity tranche of the collateralized loan obligation is accounted for under the equity method.
Real estate joint ventures are carried at the underlying audited GAAP equity, with the Company’s share of undistributed earnings and losses included in change in General Account net unrealized capital gains (losses) which is credited or charged directly to unassigned surplus (deficit). Dividends or distributions received are recognized to the extent they are not in excess of undistributed accumulated earnings. Dividends and distributions in excess of undistributed accumulated earnings are recorded as a reduction to the carrying value of the investment. The Company also periodically evaluates the joint ventures’ unrealized losses for recoverability. In addition to the joint ventures performing regular evaluations for the impairment of underlying investments, the Company routinely evaluates these investments for impairment. The Company considers financial and other information provided by such entities, other known information and inherent risks in the underlying investments, as well as future capital commitments, in determining whether an impairment has occurred.
Derivatives
The Company may be exposed to various risks relating to its ongoing business operations, including interest rate risk, foreign currency exchange rate risk, credit risk and equity market risk. The Company uses a variety of strategies to manage these risks, including the use of derivatives.
Derivatives are financial instruments whose values are derived from interest rates, foreign currency exchange rates, credit spreads or other financial indices. Derivatives may be exchange-traded or contracted in the over-the-counter (“OTC”) market. All of the Company’s derivatives are bilateral contracts between two counterparties. The Company uses options, swaps, and caps to manage risks that may include interest rate risk, foreign currency exchange rate risk, credit risk and equity market risk. Derivative hedges are designed to reduce risk on an economic basis while considering their impact on accounting results and statutory capital.
NY SAP restricts the Company’s use of derivatives to: (i) hedging activities intended to offset changes in the estimated fair value of assets held, obligations and anticipated transactions; (ii) income generation transactions to generate additional income or return on covering assets; and (iii) replication synthetic asset transactions to reproduce the investment characteristics of otherwise permissible investments. The Company is prohibited from using derivatives for speculation. OTC derivatives are carried on the Company’s Statutory Statements of Admitted Assets, Liabilities and Capital and Surplus either as derivative assets or derivative liabilities.
The Company does not offset the values recognized for derivatives executed with the same counterparty under the same master netting agreement. This policy applies to the recognition of derivative assets and derivative liabilities in the Statutory Statements of Admitted Assets, Liabilities and Capital and Surplus.
To qualify for hedge accounting under SSAP No. 86, Derivatives (“SSAP 86”), at the inception of the hedging relationship, the Company formally documents its risk management objective and strategy for undertaking the hedging transaction, as well as its designation of the hedge as either: (i) a hedge of the estimated fair value of a recognized asset or liability (“fair value hedge”); or (ii) a hedge of the variability of cash flows to be received or paid related to a forecasted transaction or a recognized asset or liability (“cash flow hedge”). In its hedge documentation, the Company sets forth how the hedging instrument is expected to hedge the designated risks related to the hedged item and sets forth the method that will be used to retrospectively and prospectively assess the hedging instrument’s effectiveness. A derivative designated as a hedging instrument must be assessed as being highly effective in offsetting the designated risk of the hedged item. Hedge effectiveness is formally assessed at inception and at least quarterly throughout the life of the designated hedging relationship.
The Company may hold cash flow and fair value derivatives that hedge various assets and liabilities including bonds, mortgage loans, and liability portfolios; the derivatives that hedge those assets and liabilities are valued in a manner consistent with the underlying hedged item, if the derivatives meet the criteria for highly effective hedges. Bonds that have an NAIC designation of 1 through 5 are carried at amortized cost; therefore, the derivatives hedging such bonds are also carried at amortized cost. Bonds that have an NAIC designation of 6 are carried at the lower of amortized cost or estimated fair value; therefore, the derivatives hedging such bonds are also carried at the lower of amortized cost or estimated fair value. Mortgage loans are carried at amortized cost; therefore, the derivatives hedging mortgage loans are also carried at amortized cost. Any hedged liabilities of the Company are carried at amortized cost; therefore, the derivatives hedging liabilities are also carried at amortized cost. Effective foreign currency swaps have a foreign currency adjustment reported in capital and surplus pursuant to SSAP 86 by using the same procedures as used to translate the hedged item.
191
BRIGHTHOUSE LIFE INSURANCE COMPANY OF NY
Notes to the Interim Condensed Statutory Financial Statements
For the Three Months Ended March 31, 2024 and 2023 (Unaudited) and December 31, 2023 (continued)
The Company discontinues hedge accounting prospectively when: (i) it is determined that the derivative is no longer highly effective in offsetting changes in the estimated fair value or cash flows of a hedged item; (ii) the derivative expires or is sold, terminated or exercised; (iii) it is no longer probable that the hedged forecasted transaction will occur; or (iv) the Company removes the designation of the hedge.
When hedge accounting is discontinued because it is determined that the derivative is not highly effective in offsetting changes in the estimated fair value or cash flows of a hedged item, the derivative is carried at its estimated fair value with changes in estimated fair value reported in change in General Account net unrealized capital gains (losses).
Upon termination of a derivative that qualified for hedge accounting, the gain or loss is reflected as an adjustment to the basis of the hedged item and is recognized in income consistent with the hedged item. If the hedged item is sold, the gain or loss on the derivative is realized but is subject to the IMR.
To the extent the Company does not designate a derivative for hedge accounting, the derivative is carried at estimated fair value with changes in estimated fair value reported in change in General Account net unrealized capital gains (losses).
Insurance Reserves and Annuity and Other Fund Reserves
Reserves for permanent plans of individual life insurance, universal life plans and certain term plans are computed principally on the Net Level Premium Method, the Commissioners’ Reserve Valuation Method, or using the principle based requirements of Reg 213, as appropriate. Reserves for other life insurance policies are computed on the Net Level Premium Method or the Commissioners’ Reserve Valuation Method, as appropriate. Reserves for group and individual annuity contracts are computed on CARVM or using the principle based requirements of Reg 213, as appropriate. The reserves are based on mortality, morbidity and interest rate assumptions prescribed by New York Insurance Law. Such reserves are sufficient to provide for contractual surrender values.
Periodically, to reflect changes in circumstances or regulatory requirements, the Company may change the assumptions, methodologies or procedures used to calculate reserves. Primarily, the changes in methodologies and procedures, or changes in “valuation basis,” are recorded as direct adjustments to unassigned surplus (deficit) cumulatively in the accounting year applied, whereas generally, changes in reserves, including certain actuarial assumptions, are reflected in net income.
Reserves for deposit-type contracts, which do not subject the reporting entity to any risks arising from policyholder mortality or morbidity, are equal to deposits received and interest credited to the benefit of contract holders, less fees and other charges assessed and surrenders or withdrawals that represent a return to the contract holders.
Asset Valuation Reserve and Interest Maintenance Reserve
The Company has established an AVR and IMR for the General Account and Separate Account investments, where required. An AVR is established for potential credit-related losses on applicable General Account and Separate Account invested assets. Changes to the AVR are reported as direct additions to or deductions from unassigned surplus (deficit). An IMR is established for interest-related realized capital gains (losses) resulting from changes in the general level of interest rates for the General Account, and any Separate Accounts, not carried at estimated fair value. Transfers to the IMR are deducted from realized capital gains and losses and are net of related Federal income tax. IMR amortization, as calculated under the Grouped Method as specified by NY SAP, is included in net investment income. Net realized capital gains (losses) are presented net of Federal income tax expense or benefit and IMR transfer. The IMR can be either an asset or a liability, with the asset subject to certain recognition limits as prescribed by NY SAP.
Income
In general, premiums are recognized as income when due from policyholders under the terms of the insurance contract. Investment income is recognized as income when earned. The earnings on certain investments are dependent upon market conditions, which could result in prepayments and changes in amounts to be earned due to changing interest rates or equity markets. Other income (loss) primarily includes management fees relating to Separate Account contracts.
Benefits and Expenses
Expenses, including policy acquisition costs and Federal income tax, are charged to operations as incurred. Amounts received as payment for and amounts representing return of policyholder balances relating to deposit-type contracts are not reported as income or benefits but are recorded directly to the liability for deposit-type contracts.
192
BRIGHTHOUSE LIFE INSURANCE COMPANY OF NY
Notes to the Interim Condensed Statutory Financial Statements
For the Three Months Ended March 31, 2024 and 2023 (Unaudited) and December 31, 2023 (continued)
Foreign Currency Translation
The Company holds investments denominated in foreign currencies, which are carried at the foreign exchange spot rate at the end of the year. Any increases or decreases in the carrying amount of the Company’s investments denominated in foreign currencies due to changes in exchange rates between years are recorded as a change in General Account net unrealized capital gains (losses) which are credited or charged directly to unassigned surplus (deficit).
Separate Account Operations
Separate Accounts are established in conformity with insurance laws and are generally not chargeable with liabilities that arise from any other business of the Company. Separate Account assets are subject to General Account claims only to the extent that the value of such assets exceeds the Separate Account liabilities. Investments (generally stated at estimated fair value) and liabilities of the Separate Accounts are reported separately as assets and liabilities. Investment income and realized and unrealized capital gains (losses) on the investments accrue directly to contract holders and accordingly, are not reflected in the Company’s Statutory Statements of Operations and Changes in Capital and Surplus and Cash Flow.
Certain other Separate Accounts guarantee levels of returns or benefits. These Separate Accounts could therefore contain assets in excess of reserves as described in SSAP No. 56, Separate Accounts. The surplus generated by the Separate Accounts that contain guaranteed levels of return or benefit is recognized as net income on the Company’s Annual Statutory Statements of Operations and Changes in Capital and Surplus. For the three months ended March 31, 2024 and 2023, there was no seed money invested in the various Separate Accounts.
Income Tax
The future tax consequences of temporary differences between statutory financial reporting and tax basis of assets and liabilities are measured at the financial reporting dates and are recorded as DTA and liabilities, subject to certain limitations. Changes in DTA and deferred income tax liabilities (“DTL”), including changes attributable to changes in tax rates and changes in tax status, if any, are recognized as a separate component of gains and losses in unassigned surplus (deficit).
DTA are limited to: (i) an amount expected to be realized within the applicable period that is no greater than the applicable percentage of statutory capital and surplus as required to be shown on the statutory balance sheet for the current reporting period’s statement, adjusted to exclude any net DTA plus; (ii) the amount of remaining gross DTA that can be offset against existing gross DTL. Any remaining DTA are nonadmitted.
The realization of DTA depends upon the existence of sufficient taxable income within the carryback or carryforward periods under the tax law in the applicable tax jurisdiction. Valuation allowances are established when management determines, based on available information, that it is more likely than not that DTA will not be realized. Significant judgment is required in determining whether valuation allowances should be established, as well as the amount of such allowances. When making such determination, the Company considers many factors, including:
| • | the nature, frequency, and amount of cumulative financial reporting income and losses in recent years; |
| • | the jurisdiction in which the DTA was generated; |
| • | the length of time that carryforwards can be utilized in the various taxing jurisdictions; |
| • | future taxable income exclusive of reversing temporary differences and carryforwards; |
| • | future reversals of existing taxable temporary differences; |
| • | taxable income in prior carryback years; and |
| • | tax planning strategies. |
The Company may be required to change its provision for income taxes in certain circumstances. Examples of such circumstances include when estimates used in determining valuation allowances on DTA significantly change or when receipt of new information indicates the need for an adjustment in valuation allowances. Additionally, future events, such
193
BRIGHTHOUSE LIFE INSURANCE COMPANY OF NY
Notes to the Interim Condensed Statutory Financial Statements
For the Three Months Ended March 31, 2024 and 2023 (Unaudited) and December 31, 2023 (continued)
as changes in tax laws, tax regulations, or interpretations of such laws or regulations, could have an impact on the provision for income taxes and the effective tax rate. Any such changes could significantly affect the amounts reported in the financial statements in the year these changes occur.
The Company determines whether it is more likely than not that a tax position will be sustained upon examination by the appropriate taxing authorities before any part of the benefit can be recorded in the financial statements. A tax position is measured at the largest amount of benefit that is greater than 50% likely of being realized upon settlement. Unrecognized tax benefits due to tax uncertainties that do not meet the threshold are included within other liabilities and are charged to earnings in the period that such determination is made.
The Company classifies interest and penalties as a component of income tax expense.
See Notes 1 and 10 of the annual December 31, 2023 audited statutory financial statements for further information on the Company’s income taxes.
Related Party Transactions
A transaction between related parties involving the exchange of assets or liabilities is classified as either an economic transaction or a non-economic transaction. An economic transaction is defined as an arm’s-length transaction which results in the transfer of risks and rewards of ownership and represents a consummated act thereof, i.e., “permanence.” Non-economic transactions between the Company and a related party insurance entity are recorded at the lower of existing book values or estimated fair values at the date of the transaction. Non-economic transactions between the Company and related parties that are not insurance entities are recorded at the estimated fair value at the date of the transaction; however, to the extent that the transaction results in a gain, an offsetting unrealized capital loss and liability is recorded to defer any impact on surplus. Economic transactions between the Company and other related parties are recorded at estimated fair value at the date of the transaction. To the extent that the related parties are affiliates under control of the Company, the Company defers the effects of such transactions that result in gains or increases in surplus by recording an offsetting unrealized capital loss and liability. A transaction involving services between related parties is recorded at the amount charged and is generally subject to regulatory approval.
Note 2 - Fair Value Information
Considerable judgment is often required in interpreting market data to develop estimates of fair value, and the use of different assumptions or valuation methodologies may have a material effect on the estimated fair value amounts.
Estimated Fair Value of All Financial Instruments
Information related to the aggregate fair value of financial instruments is shown below at (in millions):
| March 31, | ||||||||||||||||||||
| 2024 | ||||||||||||||||||||
| Aggregate Fair Value | Admitted Value | Level 1 | Level 2 | Level 3 | ||||||||||||||||
Assets | ||||||||||||||||||||
Bonds | $ | 1,721 | $ | 1,893 | $ | 115 | $ | 1,604 | $ | 1 | ||||||||||
Preferred stocks | 3 | 3 | — | — | 3 | |||||||||||||||
Mortgage loans | 176 | 194 | — | — | 176 | |||||||||||||||
Cash, cash equivalents and short-term investments | 210 | 210 | 210 | — | — | |||||||||||||||
Derivative assets (1) | 178 | 176 | — | 178 | — | |||||||||||||||
Other invested assets | 15 | 21 | — | 15 | — | |||||||||||||||
Investment income due and accrued | 17 | 17 | — | 17 | — | |||||||||||||||
Separate Account assets | 8,815 | 9,227 | 310 | 7,611 | 895 | |||||||||||||||
|
|
|
|
|
|
|
|
|
| |||||||||||
Total assets | $ | 11,135 | $ | 11,741 | $ | 635 | $ | 9,425 | $ | 1,075 | ||||||||||
|
|
|
|
|
|
|
|
|
| |||||||||||
194
BRIGHTHOUSE LIFE INSURANCE COMPANY OF NY
Notes to the Interim Condensed Statutory Financial Statements
For the Three Months Ended March 31, 2024 and 2023 (Unaudited) and December 31, 2023 (continued)
| March 31, | ||||||||||||||||||||
| 2024 | ||||||||||||||||||||
| Aggregate Fair Value | Admitted Value | Level 1 | Level 2 | Level 3 | ||||||||||||||||
Liabilities | ||||||||||||||||||||
Investment contracts included in: | ||||||||||||||||||||
Liability for deposit-type contracts | $ | 14 | $ | 14 | $ | — | $ | — | $ | 14 | ||||||||||
Derivative liabilities (1) | 8 | 8 | — | 8 | — | |||||||||||||||
Payable for collateral received | 84 | 84 | — | 84 | — | |||||||||||||||
Separate Account liabilities | 1 | 1 | — | 1 | — | |||||||||||||||
|
|
|
|
|
|
|
|
|
| |||||||||||
Total liabilities | $ | 107 | $ | 107 | $ | — | $ | 93 | $ | 14 | ||||||||||
|
|
|
|
|
|
|
|
|
| |||||||||||
195
BRIGHTHOUSE LIFE INSURANCE COMPANY OF NY
Notes to the Interim Condensed Statutory Financial Statements
For the Three Months Ended March 31, 2024 and 2023 (Unaudited) and December 31, 2023 (continued)
| December 31, | ||||||||||||||||||||
| 2023 | ||||||||||||||||||||
| Aggregate Fair Value | Admitted Value | Level 1 | Level 2 | Level 3 | ||||||||||||||||
Assets | ||||||||||||||||||||
Bonds | $ | 1,645 | $ | 1,796 | $ | 116 | $ | 1,528 | $ | 1 | ||||||||||
Preferred stocks | 3 | 3 | — | — | 3 | |||||||||||||||
Mortgage loans | 210 | 228 | — | — | 210 | |||||||||||||||
Cash, cash equivalents and short-term investments | 242 | 242 | 242 | — | — | |||||||||||||||
Derivative assets (1) | 140 | 137 | — | 140 | — | |||||||||||||||
Other invested assets | 15 | 19 | — | 15 | — | |||||||||||||||
Investment income due and accrued | 15 | 15 | — | 15 | — | |||||||||||||||
Separate Account assets | 8,429 | 8,808 | 148 | 7,375 | 906 | |||||||||||||||
|
|
|
|
|
|
|
|
|
| |||||||||||
Total assets | $ | 10,699 | $ | 11,248 | $ | 506 | $ | 9,073 | $ | 1,120 | ||||||||||
|
|
|
|
|
|
|
|
|
| |||||||||||
Liabilities | ||||||||||||||||||||
Investment contracts included in: | ||||||||||||||||||||
Liability for deposit-type contracts | $ | 14 | $ | 14 | $ | — | $ | — | $ | 14 | ||||||||||
Derivative liabilities (1) | 10 | 10 | — | 10 | — | |||||||||||||||
Payable for collateral received | 44 | 44 | — | 44 | — | |||||||||||||||
Separate Account liabilities | 2 | 2 | — | 2 | — | |||||||||||||||
|
|
|
|
|
|
|
|
|
| |||||||||||
Total liabilities | $ | 70 | $ | 70 | $ | — | $ | 56 | $ | 14 | ||||||||||
|
|
|
|
|
|
|
|
|
| |||||||||||
| (1) | Classification of derivatives is based on each derivative’s positive (asset) or negative (liability) book/adjusted carrying value, which equals the net admitted assets and liabilities. |
When developing estimated fair values, the Company considers three broad valuation techniques: (i) the market approach, (ii) the income approach, and (iii) the cost approach. The Company determines the most appropriate valuation technique to use, given what is being measured and the availability of sufficient inputs, giving priority to observable inputs. The Company categorizes its assets and liabilities measured at estimated fair value into a three-level hierarchy, based on the significant input with the lowest level in its valuation. The input levels are as follows:
Level 1 - | Unadjusted quoted prices in active markets for identical assets or liabilities. The Company defines active markets based on average trading volume for equity securities. The size of the bid/ask spread is used as an indicator of market activity for fixed maturity securities. | |
Level 2 - | Quoted prices in markets that are not active or inputs that are observable either directly or indirectly. These inputs can include quoted prices for similar assets or liabilities other than quoted prices in Level 1, quoted prices in markets that are not active, or other significant inputs that are observable or can be derived principally from or corroborated by observable market data for substantially the full term of the assets or liabilities. | |
Level 3 - | Unobservable inputs that are supported by little or no market activity and are significant to the determination of estimated fair value of the assets or liabilities. Unobservable inputs reflect the reporting entity’s own assumptions about the assumptions that market participants would use in pricing the asset or liability. | |
Determination of Estimated Fair Value
The Company defines estimated fair value as the price that would be received to sell an asset or paid to transfer a liability (an exit price) in the principal or most advantageous market for the asset or liability in an orderly transaction between market participants on the measurement date. In most cases, the exit price and the transaction (or entry) price will be the same at initial recognition.
In general, the estimated fair value of investments classified within Level 1 are based on quoted prices in active markets that are readily and regularly obtainable. These investments are the most liquid of the Company’s securities holdings and valuation of these securities does not involve management’s judgment. Investments classified within Level 3
196
BRIGHTHOUSE LIFE INSURANCE COMPANY OF NY
Notes to the Interim Condensed Statutory Financial Statements
For the Three Months Ended March 31, 2024 and 2023 (Unaudited) and December 31, 2023 (continued)
use many of the same valuation techniques and inputs as described in the Level 2 discussions. However, if key inputs are unobservable, or if the investments are less liquid and there is very limited trading activity, the investments are generally classified as Level 3. The use of independent non-binding broker quotations to value investments generally indicates there is a lack of liquidity or the general lack of transparency in the process to develop the valuation estimates generally causing such investments to be classified in Level 3.
Bonds, Preferred Stock, Cash, Cash Equivalents and Short-term Investments
For Level 1 assets, the estimated fair value is determined using quoted prices in active markets that are readily and regularly obtainable. Additionally, as the estimated fair value for cash approximates carrying value, due to the nature of cash, it is classified as Level 1.
For Level 2 assets, estimated fair values are determined using an income approach. The estimated fair value is determined using third-party commercial pricing services, with the primary inputs being quoted prices in markets that are not active, benchmark yields, spreads off benchmark yields, new issuances, issuer ratings, trades of identical or comparable securities, and duration for Level 2 assets. Privately-placed securities are valued using additional key inputs: market yield curves, call provisions, observable prices and spreads for similar public or private securities that incorporate the credit quality and industry sector of the issuer, and delta spread adjustments to reflect specific credit-related issues.
The estimated fair value for preferred stock is determined using third-party commercial pricing services, with the primary input being quoted prices in markets that are not active. Generally, these investments are classified in Level 2 or Level 3. Preferred stock valued using significant observable inputs are classified in Level 2 and those valued using significant unobservable inputs are classified in Level 3.
For Level 3 assets, estimated fair values are determined using a market approach. The estimated fair value is determined using matrix pricing or consensus pricing, with the primary inputs being quoted and offered prices.
Mortgage Loans
For mortgage loans, estimated fair value is primarily determined by estimating expected future cash flows and discounting them using current interest rates for similar mortgage loans with similar credit risk, or is determined from pricing for similar mortgage loans. The estimated fair values for impaired mortgage loans are principally obtained by estimating the fair value of the underlying collateral using market standard appraisal and valuation methods. Mortgage loans valued using significant unobservable inputs are classified in Level 3.
Derivatives
For OTC-bilateral derivatives classified as Level 2 assets or liabilities, estimated fair values are determined using the income approach. Valuations of non-option-based derivatives utilize present value techniques, whereas valuations of option-based derivatives utilize option pricing models which are based on market standard valuation methodologies and a variety of observable inputs.
The significant inputs to the pricing models for most OTC-bilateral derivatives are inputs that are observable in the market or can be derived principally from, or corroborated by, observable market data.
Most inputs for OTC-bilateral derivatives are mid-market inputs but, in certain cases, liquidity adjustments are made when they are deemed more representative of exit value. Market liquidity, as well as the use of different methodologies, assumptions and inputs, may have a material effect on the estimated fair values of the Company’s derivatives and could materially affect the net change in capital and surplus.
The credit risk of both the counterparty and the Company are considered in determining the estimated fair value for all OTC-bilateral derivatives, and any potential credit adjustment is based on the net exposure by counterparty after taking into account the effects of netting agreements and collateral arrangements. The Company values its OTC-bilateral derivatives using standard swap curves which may include a spread to the risk-free rate, depending upon specific collateral arrangements. This credit spread is appropriate for those parties that execute trades at pricing levels consistent with similar collateral arrangements. As the Company and its significant derivative counterparties generally execute trades at such pricing levels and hold sufficient collateral, additional credit risk adjustments are not currently required in the valuation process. The Company’s ability to consistently execute at such pricing levels is in part due to the netting agreements and collateral arrangements that are in place with all of its significant derivative counterparties. An evaluation of the requirement to make additional credit risk adjustments is performed by the Company each reporting period.
197
BRIGHTHOUSE LIFE INSURANCE COMPANY OF NY
Notes to the Interim Condensed Statutory Financial Statements
For the Three Months Ended March 31, 2024 and 2023 (Unaudited) and December 31, 2023 (continued)
Other Invested Assets
The estimated fair value of other invested assets is determined using the methodologies as described in the above sections titled “Bonds, Preferred Stock, Cash, Cash Equivalents and Short-term Investments”, based on the nature of the investment. Excluded from the disclosure are those invested assets that are not considered to be financial instruments subject to this disclosure including investments accounted for under the equity method.
Investment Income Due and Accrued
Due to the short-term nature of investment income due and accrued, the Company believes there is minimal risk of material changes in interest rates or the credit of the issuer such that estimated fair value approximates carrying value. These amounts are generally classified in Level 2.
Separate Accounts
For Level 1 assets, the estimated fair value is determined using quoted prices in active markets that are readily and regularly obtainable. Additionally, as the estimated fair value for cash equivalents carrying value, due to the nature of cash, it is classified as Level 1.
For Separate Account assets classified as Level 2 assets, estimated fair values are determined using either a market or income approach. The estimated fair value is determined using third-party commercial pricing services, with the primary input being quoted securitization market price determined principally by independent pricing services using observable inputs or quoted prices or reported net asset value (“NAV”) provided by the fund managers.
For Level 3 assets, estimated fair values are determined using a market approach. The estimated fair value is determined using matrix pricing or consensus pricing, with the primary inputs being quoted and offered prices.
Investment Contracts Included in Reserves for Life and Health Insurance and Annuities and Liability for Deposit-Type Contracts
The fair value of investment contracts included in reserves for life and health insurance and annuities and in the liability for deposit-type contracts is estimated by discounting best estimate future cash flows based on assumptions that market participants would use in pricing such liabilities, with consideration of the Company’s non-performance risk (own-credit risk) not reflected in the fair value calculation. The assumptions used in estimating these fair values are based in part on unobservable inputs classified in Level 3.
Borrowed Money
The estimated fair value for borrowed money (including interest thereon) approximates carrying value due to the short-term maturities of these instruments. The amounts are classified in Level 2.
198
BRIGHTHOUSE LIFE INSURANCE COMPANY OF NY
Notes to the Interim Condensed Statutory Financial Statements
For the Three Months Ended March 31, 2024 and 2023 (Unaudited) and December 31, 2023 (continued)
Payable for Collateral Received
The estimated fair value of amounts payable for collateral received approximates carrying value as these obligations are short-term in nature. These amounts are generally classified in Level 2.
Assets and Liabilities Measured and Reported at Estimated Fair Value at Reporting Date
Hierarchy Table
The following tables provide information about financial assets and liabilities measured and reported at estimated fair value at (in millions):
| March 31, | ||||||||||||||||||||||
| 2024 | ||||||||||||||||||||||
| Fair Value Measurements at Reporting Date Using | ||||||||||||||||||||||
| Level 1 | Level 2 | Level 3 | Total | |||||||||||||||||||
Assets | ||||||||||||||||||||||
Derivative assets (1) | ||||||||||||||||||||||
Interest rate | $ | — | $ | 1 | $ | — | $ | 1 | ||||||||||||||
Foreign currency exchange rate | — | 3 | — | 3 | ||||||||||||||||||
Equity market | — | 165 | — | 165 | ||||||||||||||||||
|
|
|
|
|
|
|
| |||||||||||||||
Total Derivative assets | — | 169 | — | 169 | ||||||||||||||||||
Separate Account assets (2) | — | 4,227 | — | 4,227 | ||||||||||||||||||
|
|
|
|
|
|
|
| |||||||||||||||
Total assets | $ | — | $ | 4,396 | $ | — | $ | 4,396 | ||||||||||||||
|
|
|
|
|
|
|
| |||||||||||||||
Liabilities | ||||||||||||||||||||||
Derivative liabilities (1) | ||||||||||||||||||||||
Equity market | $ | — | $ | 8 | $ | — | $ | 8 | ||||||||||||||
|
|
|
|
|
|
|
| |||||||||||||||
Total liabilities | $ | — | $ | 8 | $ | — | $ | 8 | ||||||||||||||
|
|
|
|
|
|
|
| |||||||||||||||
199
BRIGHTHOUSE LIFE INSURANCE COMPANY OF NY
Notes to the Interim Condensed Statutory Financial Statements
For the Three Months Ended March 31, 2024 and 2023 (Unaudited) and December 31, 2023 (continued)
The following tables provide information about financial assets and liabilities measured and reported at estimated fair value at (in millions):
| December 31, | ||||||||||||||||
| 2023 | ||||||||||||||||
| Fair Value Measurements at Reporting Date Using | ||||||||||||||||
| Level 1 | Level 2 | Level 3 | Total | |||||||||||||
Assets | ||||||||||||||||
Derivative assets (1) | ||||||||||||||||
Interest rate | $ | — | $ | 1 | $ | — | $ | 1 | ||||||||
Foreign currency exchange rate | — | 3 | — | 3 | ||||||||||||
Equity market | — | 126 | — | 126 | ||||||||||||
|
|
|
|
|
|
|
| |||||||||
Total Derivative assets | — | 130 | — | 130 | ||||||||||||
Separate Account assets (2) | — | 4,126 | — | 4,126 | ||||||||||||
|
|
|
|
|
|
|
| |||||||||
Total assets | $ | — | $ | 4,256 | $ | — | $ | 4,256 | ||||||||
|
|
|
|
|
|
|
| |||||||||
Liabilities | ||||||||||||||||
Derivative liabilities (1) | ||||||||||||||||
Equity market | $ | — | $ | 10 | $ | — | $ | 10 | ||||||||
|
|
|
|
|
|
|
| |||||||||
Total liabilities | $ | — | $ | 10 | $ | — | $ | 10 | ||||||||
|
|
|
|
|
|
|
| |||||||||
| (1) | Derivative assets and derivative liabilities presented in the table above represent only those derivatives that are carried at estimated fair value. Accordingly, the amounts above exclude highly effective derivatives carried at amortized cost. |
| (2) | Separate Account assets are subject to General Account claims only to the extent that the value of such assets exceeds the Separate Account liabilities or for those assets that are not legally insulated. Investments (stated generally at estimated fair value) and liabilities of the Separate Accounts are reported separately as assets and liabilities. Separate Account assets as presented in the table above may differ from the amounts presented in the Statutory Statements of Admitted Assets, Liabilities and Capital and Surplus because certain of these investments are not measured at estimated fair value (such as institutional separate accounts carried at book value). |
See “Determination of Estimated Fair Value” above for a description of the valuation technique(s) and the inputs used in the fair value measurement for assets and liabilities measured and reported at fair value.
Transfers between Levels
Transfers between levels are assumed to occur at the beginning of the annual period. During the periods ended March 31, 2024 and 2023, there were no transfers between levels.
200
BRIGHTHOUSE LIFE INSURANCE COMPANY OF NY
Notes to the Interim Condensed Statutory Financial Statements
For the Three Months Ended March 31, 2024 and 2023 (Unaudited) and December 31, 2023 (continued)
Note 3 - Investments
Bonds and Preferred Stocks by Sector
The following table presents the book/adjusted carrying value, gross unrealized gains and losses and estimated fair value of bonds and preferred stocks owned at (in millions):
| March 31, | December 31, | |||||||||||||||||||||||||||||||
| 2024 | 2023 | |||||||||||||||||||||||||||||||
| Book/ Adjusted | Gross Unrealized | Estimated | Book/ Adjusted | Gross Unrealized | Estimated | |||||||||||||||||||||||||||
| Carrying Value | Gains | Losses | Fair Value | Carrying Value | Gains | Losses | Fair Value | |||||||||||||||||||||||||
Bonds | ||||||||||||||||||||||||||||||||
U.S. corporate | $ | 1,017 | $ | 3 | $ | 114 | $ | 906 | $ | 942 | $ | 5 | $ | 100 | $ | 847 | ||||||||||||||||
RMBS | 191 | 2 | 12 | 181 | 195 | 3 | 10 | 188 | ||||||||||||||||||||||||
Foreign corporate | 217 | 2 | 15 | 204 | 189 | 1 | 14 | 176 | ||||||||||||||||||||||||
U.S. government and agency | 176 | — | 13 | 163 | 176 | — | 10 | 166 | ||||||||||||||||||||||||
CMBS | 158 | — | 15 | 143 | 158 | — | 16 | 142 | ||||||||||||||||||||||||
State and political subdivision | 89 | 2 | 9 | 82 | 90 | 2 | 9 | 83 | ||||||||||||||||||||||||
ABS | 39 | — | 2 | 37 | 40 | — | 2 | 38 | ||||||||||||||||||||||||
Foreign government | 6 | — | 1 | 5 | 6 | — | 1 | 5 | ||||||||||||||||||||||||
|
|
|
|
|
|
|
|
|
|
|
|
|
|
|
| |||||||||||||||||
Total bonds | $ | 1,893 | $ | 9 | $ | 181 | $ | 1,721 | $ | 1,796 | $ | 11 | $ | 162 | $ | 1,645 | ||||||||||||||||
|
|
|
|
|
|
|
|
|
|
|
|
|
|
|
| |||||||||||||||||
Preferred Stocks | ||||||||||||||||||||||||||||||||
Preferred | $ | 3 | $ | — | $ | — | $ | 3 | $ | 3 | $ | — | $ | — | $ | 3 | ||||||||||||||||
|
|
|
|
|
|
|
|
|
|
|
|
|
|
|
| |||||||||||||||||
The Company did not hold any non-income producing bonds at March 31, 2024 and December 31, 2023.
Maturities of Bonds
The book/adjusted carrying value and estimated fair value of bonds, by contractual maturity, were as follows at March 31, 2024 (in millions):
| Book/Adjusted Carrying Value | Estimated Fair Value | |||||||||
Due in one year or less | $ | 63 | $ | 62 | ||||||
Due after one year through five years | 403 | 389 | ||||||||
Due after five years through ten years | 326 | 310 | ||||||||
Due after ten years | 713 | 599 | ||||||||
|
|
|
| |||||||
Subtotal | 1,505 | 1,360 | ||||||||
Loan-backed securities | 388 | 361 | ||||||||
|
|
|
| |||||||
Total | $ | 1,893 | $ | 1,721 | ||||||
|
|
|
| |||||||
Actual maturities may differ from contractual maturities due to the exercise of call or prepayment options. Bonds not due at a single maturity date have been presented in the year of final contractual maturity. Loan-backed securities are shown separately, as they are not due at a single maturity.
Cash equivalents and short-term investments have original contractual maturities of one year or less.
201
BRIGHTHOUSE LIFE INSURANCE COMPANY OF NY
Notes to the Interim Condensed Statutory Financial Statements
For the Three Months Ended March 31, 2024 and 2023 (Unaudited) and December 31, 2023 (continued)
Continuous Gross Unrealized Losses for Bonds - By Sector
The following table presents the estimated fair value and gross unrealized losses of bonds in an unrealized loss position, aggregated by sector and by length of time that the securities have been in a continuous gross unrealized loss position at (dollars in millions):
| March 31, | December 31, | |||||||||||||||||||||||||||||||
| 2024 | 2023 | |||||||||||||||||||||||||||||||
| Less than 12 Months | Equal to or Greater than 12 Months | Less than 12 Months | Equal to or Greater than 12 Months | |||||||||||||||||||||||||||||
| Estimated Fair Value | Gross Unrealized Losses | Estimated Fair Value | Gross Unrealized Losses | Estimated Fair Value | Gross Unrealized Losses | Estimated Fair Value | Gross Unrealized Losses | |||||||||||||||||||||||||
U.S. corporate | $ | 61 | $ | 2 | $ | 708 | $ | 112 | $ | 16 | $ | 1 | $ | 724 | $ | 99 | ||||||||||||||||
RMBS | 37 | 1 | 85 | 11 | 33 | 1 | 77 | 9 | ||||||||||||||||||||||||
Foreign corporate | 6 | — | 145 | 15 | 1 | — | 146 | 14 | ||||||||||||||||||||||||
U.S. government and agency | 42 | 3 | 120 | 10 | 31 | 1 | 121 | 9 | ||||||||||||||||||||||||
CMBS | — | — | 140 | 15 | — | — | 140 | 16 | ||||||||||||||||||||||||
State and political subdivision | 1 | — | 53 | 9 | 1 | — | 53 | 9 | ||||||||||||||||||||||||
ABS | 3 | — | 31 | 2 | 3 | — | 32 | 2 | ||||||||||||||||||||||||
Foreign government | — | — | 5 | 1 | — | — | 5 | 1 | ||||||||||||||||||||||||
|
|
|
|
|
|
|
|
|
|
|
|
|
|
|
| |||||||||||||||||
Total bonds | $ | 150 | $ | 6 | $ | 1,287 | $ | 175 | $ | 85 | $ | 3 | $ | 1,298 | $ | 159 | ||||||||||||||||
|
|
|
|
|
|
|
|
|
|
|
|
|
|
|
| |||||||||||||||||
Total number of bonds in an unrealized loss position | 57 | 553 | 29 | 549 | ||||||||||||||||||||||||||||
Loan-backed Security Holdings - OTTI Losses
The Company did not impair any loan-backed securities to estimated fair value during the three months ended March 31, 2024 and 2023 because of either (i) an intent to sell the security or (ii) the inability or lack of intent to retain the security for a period of time sufficient to recover the amortized cost.
Evaluating Temporarily Impaired Bonds for OTTI
As more fully described in Note 1, the Company performs a regular evaluation, on a security-by-security basis, of its securities holdings in accordance with its OTTI policy in order to evaluate whether such investments are other than temporarily impaired. These securities were included in the Company’s OTTI review process. With respect to loan-backed securities in the bond portfolio, the Company performs scenario analyses. The scenarios attempt to project future delinquencies and principal losses. Based upon the Company’s current evaluation of its securities in an unrealized loss position in accordance with its impairment policy, and the Company’s current intentions and assessments (as applicable to the type of security) about holding, selling and any requirements to sell these securities, the Company concluded that these securities were not other than temporarily impaired. Future impairments will depend primarily on economic fundamentals, issuer performance (including changes in estimated present value of projected future cash flows to be collected) and changes in credit ratings, collateral valuations, interest rates and credit spreads. If economic fundamentals deteriorate or if there are adverse changes in the above factors, additional impairments may be incurred in upcoming periods.
202
BRIGHTHOUSE LIFE INSURANCE COMPANY OF NY
Notes to the Interim Condensed Statutory Financial Statements
For the Three Months Ended March 31, 2024 and 2023 (Unaudited) and December 31, 2023 (continued)
Gross unrealized losses on bonds increased $19 million during the three months ended March 31, 2024 to $181 million from $162 million at December 31, 2023. The increase in gross unrealized losses for the three months ended March 31, 2024 was primarily attributable to increasing longer-term interest rates.
NAIC Designation of 5GI
As of March 31, 2024, the Company held three securities with a NAIC designation of 5GI with both a book/adjusted carrying value and an estimated fair value of $4 million. As of December 31, 2023, the Company held three securities with a NAIC designation of 5GI with both a book/adjusted carrying value and an estimated fair value of $4 million.
Mortgage Loans
Mortgage Loans by Portfolio Segment
Mortgage loans are summarized as follows at (dollars in millions):
| March 31, | December 31, | |||||||||||||||
| 2024 | 2023 | |||||||||||||||
| Amount | Percent | Amount | Percent | |||||||||||||
Commercial | $ | 149 | 77 | % | $ | 182 | 80 | % | ||||||||
Agricultural | 45 | 23 | 46 | 20 | ||||||||||||
|
|
|
|
|
|
|
| |||||||||
Total mortgage loans | $ | 194 | 100 | % | $ | 228 | 100 | % | ||||||||
|
|
|
|
|
|
|
| |||||||||
At March 31, 2024 and December 31, 2023, the Company had mortgage loan participations of $182 million and $215 million, respectively.
Valuation Allowance by Portfolio Segment
At both March 31, 2024 and December 31, 2023, there were no valuation allowances on mortgage loans.
Geographic Diversification, Loan Origination and Interest Rate Changes
Mortgage loans are collateralized by real estate primarily located in the United States and are diversified by geographic region. States where the associated real estate was located that were 5% or more of the Company’s total mortgage loans at March 31, 2024 were as follows:
State | Percent of Total Mortgage Loans | |||
California | 19 | % | ||
Florida | 16 | |||
New York | 14 | |||
Washington | 10 | |||
Colorado | 8 | |||
Alabama | 5 | |||
|
| |||
Total | 72 | % | ||
|
| |||
Generally, the Company, as the lender, only loans up to 75% of the purchase price of the underlying real estate. From time to time, the Company may originate loans in excess of 75% of the purchase price of the underlying real estate, if underwriting risk is sufficiently within the Company’s standards. The Company did not originate mortgage loans during the period ended March 31, 2024 and the year ended December 31, 2023.
The Company did not fund mortgage loans during the period ended March 31, 2024 and the year ended December 31, 2023.
203
BRIGHTHOUSE LIFE INSURANCE COMPANY OF NY
Notes to the Interim Condensed Statutory Financial Statements
For the Three Months Ended March 31, 2024 and 2023 (Unaudited) and December 31, 2023 (continued)
The Company did not reduce interest rates on mortgage loans during the period ended March 31, 2024 and the year ended December 31, 2023.
Credit Quality of Commercial Mortgage Loans
Information about the credit quality of commercial mortgage loans is presented below at (dollars in millions):
| March 31, | |||||||||||||||||||||||||
| 2024 | |||||||||||||||||||||||||
| Recorded Investment | |||||||||||||||||||||||||
| Debt Service Coverage Ratios | % of Total | ||||||||||||||||||||||||
| > 1.20x | 1.00x - 1.20x | < 1.00x | Total | ||||||||||||||||||||||
Loan-to-value ratios: | |||||||||||||||||||||||||
Less than 65% | $ | 82 | $ | — | $ | — | $ | 82 | 55 | % | |||||||||||||||
65% to 75% | 24 | — | 9 | 33 | 22 | ||||||||||||||||||||
76% to 80% | 29 | — | — | 29 | 20 | ||||||||||||||||||||
Greater than 80% | 1 | 1 | 3 | 5 | 3 | ||||||||||||||||||||
|
|
|
|
|
|
|
|
|
| ||||||||||||||||
Total | $ | 136 | $ | 1 | $ | 12 | $ | 149 | 100 | % | |||||||||||||||
|
|
|
|
|
|
|
|
|
| ||||||||||||||||
| December 31, | |||||||||||||||||||||||||
| 2023 | |||||||||||||||||||||||||
| Recorded Investment | |||||||||||||||||||||||||
| Debt Service Coverage Ratios | % of Total | ||||||||||||||||||||||||
| > 1.20x | 1.00x - 1.20x | < 1.00x | Total | ||||||||||||||||||||||
Loan-to-value ratios: | |||||||||||||||||||||||||
Less than 65% | $ | 84 | $ | 12 | $ | — | $ | 96 | 52 | % | |||||||||||||||
65% to 75% | 43 | — | 9 | 52 | 29 | ||||||||||||||||||||
76% to 80% | 29 | — | — | 29 | 16 | ||||||||||||||||||||
Greater than 80% | 2 | — | 3 | 5 | 3 | ||||||||||||||||||||
|
|
|
|
|
|
|
|
|
| ||||||||||||||||
Total | $ | 158 | $ | 12 | $ | 12 | $ | 182 | 100 | % | |||||||||||||||
|
|
|
|
|
|
|
|
|
| ||||||||||||||||
Credit Quality of Agricultural Mortgage Loans
At both March 31, 2024 and December 31, 2023, all agricultural mortgage loans had a loan to value ratio of less than 65%.
Age Analysis and Nonaccrual Status of Mortgage Loans
The Company has a high quality, well performing, mortgage loan portfolio, with all mortgage loans classified as current at both March 31, 2024 and December 31, 2023. The Company defines delinquent mortgage loans, consistent with industry practice, when mortgage loans are past due as follows: commercial mortgage loans—60 days and agricultural mortgage loans - 90 days. The Company had no mortgage loans past due and no mortgage loans in nonaccrual status at either March 31, 2024 or December 31, 2023.
Impaired Mortgage Loans
The Company had no impaired mortgage loans at either March 31, 2024 or December 31, 2023.
Mortgage Loans Modified in a Troubled Debt Restructuring
The Company had no mortgage loans modified in a troubled debt restructuring during the period ended March 31, 2024 and the year ended December 31, 2023.
204
BRIGHTHOUSE LIFE INSURANCE COMPANY OF NY
Notes to the Interim Condensed Statutory Financial Statements
For the Three Months Ended March 31, 2024 and 2023 (Unaudited) and December 31, 2023 (continued)
Concentrations of Credit Risk
Investments in any counterparty that were greater than 10% of surplus included U.S. government and agency securities with a book/adjusted carrying value of $176 million and $180 million at March 31, 2024 and December 31, 2023, respectively.
Restricted Assets
The table below provides a summary of restricted assets at book/adjusted carrying value at (dollars in millions):
| March 31, | December 31, | |||||||||||||||||||||||
| 2024 | 2023 | |||||||||||||||||||||||
| Total Pledged & Restricted Assets | % of Total Assets | % of Total Admitted Assets | Total Pledged & Restricted Assets | % of Total Assets | % of Total Admitted Assets | |||||||||||||||||||
State deposits | $ | 1 | 0.0 | % | 0.0 | % | $ | 1 | 0.0 | % | 0.0 | % | ||||||||||||
Derivatives collateral(1) | — | 0.0 | 0.0 | 1 | 0.0 | 0.0 | ||||||||||||||||||
|
|
|
|
|
|
|
|
|
|
|
| |||||||||||||
Total | $ | 1 | 0.0 | % | 0.0 | % | $ | 2 | 0.0 | % | 0.0 | % | ||||||||||||
|
|
|
|
|
|
|
|
|
|
|
| |||||||||||||
| (1) | As of December 31, 2023, pledged & restricted assets for derivatives collateral included General Account assets of $1 million, all of which supported Separate Account activities. |
Derivatives
Types of Derivatives
The table below provides a summary of the notional amount, book/adjusted carrying value, estimated fair value and primary underlying risk exposure by type of derivative held at (in millions):
| March 31, | December 31, | |||||||||||||||||||||||||
| 2024 | 2023 | |||||||||||||||||||||||||
Primary Underlying | Instrument Type | Notional Amount | Book/ Adjusted Carrying Value | Estimated Fair Value | Notional Amount | Book/ Adjusted Carrying Value | Estimated Fair Value | |||||||||||||||||||
Foreign currency exchange rate | Foreign currency swaps | $ | 90 | $ | 11 | $ | 13 | $ | 93 | $ | 10 | $ | 13 | |||||||||||||
Interest rate | Interest rate caps | 800 | 1 | 1 | 800 | 1 | 1 | |||||||||||||||||||
Equity market | Equity index options | 969 | 156 | 156 | 874 | 116 | 116 | |||||||||||||||||||
|
|
|
|
|
|
|
|
|
|
|
| |||||||||||||||
Total | $ | 1,859 | $ | 168 | $ | 170 | $ | 1,767 | $ | 127 | $ | 130 | ||||||||||||||
|
|
|
|
|
|
|
|
|
|
|
| |||||||||||||||
Foreign Currency Exchange Rate Derivatives
The Company uses foreign currency exchange rate derivatives, including foreign currency swaps to reduce the risk from fluctuations in foreign currency exchange rates associated with its assets denominated in foreign currencies.
In a foreign currency swap transaction, the Company agrees with another party to exchange, at specified intervals, the difference between one currency and another at a fixed exchange rate, generally set at inception, calculated by reference to an agreed upon notional amount. The notional amount of each currency is exchanged at the inception and termination of the currency swap by each party.
Equity Market Derivatives
The Company uses equity derivatives to reduce its exposure to equity market risk, including equity index options and total rate of return swaps.
205
BRIGHTHOUSE LIFE INSURANCE COMPANY OF NY
Notes to the Interim Condensed Statutory Financial Statements
For the Three Months Ended March 31, 2024 and 2023 (Unaudited) and December 31, 2023 (continued)
Equity index options are used by the Company to hedge index-linked annuity products against adverse changes in equity markets. In an equity index option transaction, the Company enters into contracts to buy or sell the equity index within a limited time at a contracted price. The contracts will be net settled in cash, based on differentials in the indices at the time of exercise and the strike price. Certain of these contracts may also contain settlement provisions linked to interest rates. In certain instances, the Company may enter into a combination of transactions to hedge adverse changes in equity indices within a pre-determined range through the purchase and sale of options.
Total rate of return swaps are swaps whereby the Company agrees with another party to exchange, at specified intervals, the difference between the economic risk and reward of an asset or a market index and a floating rate, most commonly Fed Funds, calculated by reference to an agreed notional amount. No cash is exchanged at the outset of the contract. Cash is paid and received over the life of the contract based on the terms of the swap. These transactions are entered into pursuant to master agreements that provide for a single net payment to be made by the counterparty at each due date. Total rate of return swaps are used by the Company to hedge index-linked annuity products against adverse changes in equity markets.
Interest Rate Derivatives
The Company uses interest rate derivatives to reduce its exposure to changes in interest rates, including interest rate caps.
Interest rate caps are purchased by the Company primarily to protect against interest rate exposure arising from duration mismatches between assets and liabilities. At the outset of the contract, the Company pays a premium for the right to receive the cash payments equal to the excess of the market rate over the strike price multiplied by the notional amount, if the observed reference interest rate is above the strike level of the cap on the applicable reset date. In certain instances, the Company may lock in the economic impact of existing purchased caps by entering into offsetting written caps.
Hedging
Cash Flow Hedges
The Company designates and accounts for foreign currency swaps to hedge the foreign currency cash flow exposure of foreign currency denominated assets as cash flow hedges when they have met the effectiveness requirements of SSAP 86.
All components of each derivative’s gain or loss were included in the assessment of hedge effectiveness.
For the periods ended March 31, 2024 and 2023 there were no gains (losses) related to cash flow derivatives designated as cash flow hedges that no longer qualify for hedge accounting or for which the Company removed the hedge designation.
In certain instances, the Company may discontinue cash flow hedge accounting because it is no longer probable that the forecasted transaction will occur by the end of the originally specified time period or within two months of the anticipated date. For the periods ended March 31, 2024 and 2023 there were no gains (losses) related to such discontinued cash flow hedges.
There were no hedged forecasted transactions for the periods ended March 31, 2024 and 2023.
Non-qualifying Derivatives
The Company enters into the following derivatives that do not qualify for hedge accounting under SSAP 86: (i) interest rate caps to economically hedge its exposure to interest rates; (ii) foreign currency swaps to economically hedge its exposure to adverse movements in exchange rates; and (iii) equity index options and total rate of return swaps to hedge index-linked annuity products against adverse changes in equity markets.
Derivatives for Other than Hedging Purposes
The Company held no derivatives for other than hedging purposes during the periods ended March 31, 2024 and December 31, 2023.
206
BRIGHTHOUSE LIFE INSURANCE COMPANY OF NY
Notes to the Interim Condensed Statutory Financial Statements
For the Three Months Ended March 31, 2024 and 2023 (Unaudited) and December 31, 2023 (continued)
Off-Balance Sheet Risk and Credit Risk
The table below summarizes the notional amount of the Company’s financial instruments (derivatives that are designated as effective hedging instruments) with off-balance sheet credit risk at (in millions):
| Asset | Liability | |||||||||||||||||||
| March 31, 2024 | December 31, 2023 | March 31, 2024 | December 31, 2023 | |||||||||||||||||
Foreign currency swaps | $ | 50 | $ | 52 | $ | — | $ | — | ||||||||||||
The Company may be exposed to credit-related losses in the event of nonperformance by its counterparties to derivatives. Generally, the current credit exposure of the Company’s derivatives is limited to the net positive estimated fair value of derivatives at the reporting date after taking into consideration the existence of master netting or similar agreements and any collateral received pursuant to such agreements.
The Company manages its credit risk related to derivatives by entering into transactions with creditworthy counterparties and establishing and monitoring exposure limits. The Company’s OTC derivative transactions are governed by ISDA Master Agreements which provide for legally enforceable set-off and close-out netting of exposures to specific counterparties in the event of early termination of a transaction, which includes, but is not limited to, events of default and bankruptcy. In the event of an early termination, the Company is permitted to set-off receivables from the counterparty against payables to the same counterparty arising out of all included transactions. All of the Company’s ISDA Master Agreements also include Credit Support Annex provisions which may require both the pledging and accepting of collateral in connection with its OTC derivatives.
Off-balance sheet credit exposure is the excess of positive estimated fair value over positive book/adjusted carrying value for the Company’s highly effective hedges at the reporting date. All collateral received from counterparties to mitigate credit-related losses is deemed worthless for the purpose of calculating the Company’s off-balance sheet credit exposure. The off-balance sheet credit exposure of the Company’s swaps was $3 million and $3 million at March 31, 2024 and December 31, 2023, respectively.
The Company enters into various collateral arrangements, which may require both the pledging and accepting of collateral in connection with its derivatives. The table below summarizes the collateral pledged in connection with its OTC derivatives at (in millions):
| Securities(1) | ||||||||||
| March 31, | December 31, | |||||||||
| 2024 | 2023 | |||||||||
Initial Margin: | ||||||||||
OTC-bilateral | $ | — | $ | — | ||||||
Variation Margin: | ||||||||||
OTC-bilateral | — | 1 | ||||||||
|
|
|
| |||||||
Total OTC | $ | — | $ | 1 | ||||||
|
|
|
| |||||||
| (1) | Securities pledged as collateral are reported in bonds. Subject to certain constraints, the counterparties are permitted by contract to sell or repledge this collateral. |
207
BRIGHTHOUSE LIFE INSURANCE COMPANY OF NY
Notes to the Interim Condensed Statutory Financial Statements
For the Three Months Ended March 31, 2024 and 2023 (Unaudited) and December 31, 2023 (continued)
The table below summarizes the collateral received by the Company in connection with its OTC derivatives at (in millions):
| Cash(1) | Securities(2) | Total | ||||||||||||||||||||||||||||
| March 31, | December 31, | March 31, | December 31, | March 31, | December 31, | |||||||||||||||||||||||||
| 2024 | 2023 | 2024 | 2023 | 2024 | 2023 | |||||||||||||||||||||||||
Initial Margin: | ||||||||||||||||||||||||||||||
OTC-bilateral | $ | — | $ | — | $ | — | $ | 1 | $ | — | $ | 1 | ||||||||||||||||||
Variation Margin: | ||||||||||||||||||||||||||||||
OTC-bilateral | 84 | 44 | 5 | 2 | 89 | 46 | ||||||||||||||||||||||||
|
|
|
|
|
|
|
|
|
|
|
| |||||||||||||||||||
| $ | 84 | $ | 44 | $ | 5 | $ | 3 | $ | 89 | $ | 47 | |||||||||||||||||||
|
|
|
|
|
|
|
|
|
|
|
| |||||||||||||||||||
| (1) | Cash collateral received is reported in cash, cash equivalents and short-term investments and the obligation to return the collateral is reported in aggregate write-ins for liabilities as cash collateral received on derivatives. |
| (2) | Securities collateral received is held in separate custodial accounts and is not reflected in the interim condensed financial statements. |
The Company’s collateral arrangements for its OTC derivatives generally require the counterparty in a net liability position, after considering the effect of netting agreements, to pledge collateral when the amount owed by that party reaches a minimum transfer amount. In addition, the Company’s netting agreements for derivatives contain provisions that require both the Company and the counterparty to maintain a specific investment grade credit rating from each of Moody’s Investors Service (“Moody’s”) and Standard and Poor’s Ratings Service (“S&P”). If a party’s credit ratings were to fall below that specific investment grade credit rating, that party would be in violation of these provisions, and the other party to the derivatives could terminate the transactions and demand immediate settlement and payment based on such party’s reasonable valuation of the derivatives.
Certain of the Company’s derivative contracts require premiums to be paid at a series of specified future dates over the life of the contract or at maturity. The discounted value of these future settled premiums is accounted for separately from the estimated fair value of each derivative.
The table below summarizes the net amount of undiscounted future settled premium payments (receipts), by year, as of March 31, 2024 (in millions):
Fiscal Year | Net Undiscounted Future Settled Premium Payments (Receipts) | ||||
2024 | $ | 9 | |||
2025 | 20 | ||||
2026 | 23 | ||||
2027 | 14 | ||||
Thereafter | 32 | ||||
|
| ||||
Total | $ | 98 | |||
|
| ||||
The following table summarizes the estimated fair value of the Company’s derivatives with future settled premiums and the estimated fair value impact thereof at (in millions):
| March 31, | December 31, | |||||||||
| 2024 | 2023 | |||||||||
Net undiscounted future premium payments (receipts) | $ | 98 | $ | 100 | ||||||
Estimated fair value of derivative net assets (liabilities), including discounted future premiums | $ | 58 | $ | 26 | ||||||
Estimated fair value of derivative net assets (liabilities), excluding discounted future premiums | $ | 145 | $ | 116 | ||||||
208
BRIGHTHOUSE LIFE INSURANCE COMPANY OF NY
Notes to the Interim Condensed Statutory Financial Statements
For the Three Months Ended March 31, 2024 and 2023 (Unaudited) and December 31, 2023 (continued)
Net Investment Income
The components of net investment income for the periods ended March 31, were as follows (in millions):
| 2024 | 2023 | |||||||
Bonds | $ | 18 | $ | 16 | ||||
Mortgage loans | 2 | 2 | ||||||
Cash and cash equivalents | 4 | 4 | ||||||
Derivatives | — | (27 | ) | |||||
Other invested assets | 1 | 1 | ||||||
|
|
|
| |||||
Gross investment income | 25 | (4 | ) | |||||
Less: investment expenses | 2 | 5 | ||||||
|
|
|
| |||||
Net investment income, before IMR amortization | 23 | (9 | ) | |||||
IMR amortization | — | — | ||||||
|
|
|
| |||||
Net investment income | $ | 23 | $ | (9 | ) | |||
|
|
|
| |||||
Net Realized Capital Gains (Losses), Net of Federal Income Tax and Interest Maintenance Reserve Transfer
Net realized capital gains (losses) on investments and derivatives for the periods ended March 31, were as follows (in millions):
| 2024 | 2023 | |||||||
Bonds | $ | (1 | ) | $ | — | |||
Derivatives | 1 | 93 | ||||||
Other | — | — | ||||||
|
|
|
| |||||
Net realized capital gains (losses), before Federal income tax | — | 93 | ||||||
Less: Federal income tax expense (benefit) | — | — | ||||||
|
|
|
| |||||
Net realized capital gains (losses), before IMR transfer | — | 93 | ||||||
IMR transfer, net of Federal income tax expense (benefit) of less than $1 million and less than $1 million, respectively | (1 | ) | — | |||||
|
|
|
| |||||
Net realized capital gains (losses), net of Federal income tax and IMR transfer | $ | 1 | $ | 93 | ||||
|
|
|
| |||||
Proceeds from Sales and Disposals and Realized Capital Gains (Losses) on Bonds
Proceeds from sales or disposals of bonds and the related gross realized capital gains (losses) on bonds determined on a specific identification basis were as follows for the periods ended March 31, (in millions):
| 2024 | 2023 | |||||||
Proceeds from sales and disposals | $ | 12 | $ | 28 | ||||
Gross realized capital gains on sales | $ | — | $ | — | ||||
Gross realized capital losses on sales | $ | — | $ | — | ||||
209
BRIGHTHOUSE LIFE INSURANCE COMPANY OF NY
Notes to the Interim Condensed Statutory Financial Statements
For the Three Months Ended March 31, 2024 and 2023 (Unaudited) and December 31, 2023 (continued)
Prepayment Penalty and Acceleration Fees
The Company had securities sold, redeemed or otherwise disposed of as a result of a callable feature. The number of securities sold, disposed or otherwise redeemed and the aggregate amount of investment income generated as a result of a prepayment penalty and/or acceleration fee were as follows for the three months ended March 31, (in millions, except number of securities):
| 2024 | 2023 | |||||||
Number of CUSIPs | — | 2 | ||||||
Aggregate Amount of Investment Income(1) | $ | — | $ | — | ||||
| (1) | Aggregate Amount of Investment Income for the period ended March 31, 2023 was less than $1 million. |
Interest Income Due and Accrued
The gross, nonadmitted amounts for interest income due and accrued as of March 31, 2024 were as follows (in millions):
Interest Income Due and Accrued:
1 Gross | $ | 17 | |||
2 Nonadmitted | — | ||||
|
| ||||
3 Admitted | $ | 17 | |||
|
|
As of March 31, 2024, the Company had aggregate deferred interest of $0.
As of March 31, 2024, the Company had cumulative amounts of paid-in-kind (“PIK”) interest included in the current principal balance of $3 million.
Note 4 - Related Party Information
Service Agreements
The Company is a party to service agreements with its affiliates, including, but not limited to, Brighthouse Services, LLC, that provide for a broad range of services to be rendered and facilities and equipment to be provided. Services, facilities and equipment are requested by the recipient as deemed necessary for its operations. These agreements involve cost allocation arrangements, under which the recipient pays the provider for all expenses, direct and indirect, reasonably and equitably determined to be attributable to the services, facilities and equipment provided. There are also a number of other service arrangements with affiliates pursuant to which the provider, at the request of the recipient, renders specified services for a stated fee. Income and expenses under these agreements are reflected in other income (loss) and insurance expenses and taxes (other than Federal income and capital gains taxes), respectively, on the Statutory Statements of Operations and Changes in Capital and Surplus.
Marketing, Selling and Distribution Agreements
The Company has entered into marketing and selling agreements with several affiliates (“Distributors”), in which the Distributors agree to sell, on the Company’s behalf, insurance products through authorized retailers. The Company agrees to compensate the Distributors for the sale and servicing of such insurance products in accordance with the terms of the agreements.
Reinsurance Agreements
The Company has reinsurance agreements with its parent, Brighthouse Insurance.
210
BRIGHTHOUSE LIFE INSURANCE COMPANY OF NY
Notes to the Interim Condensed Statutory Financial Statements
For the Three Months Ended March 31, 2024 and 2023 (Unaudited) and December 31, 2023 (continued)
Information regarding the significant effects of ceded related party reinsurance included in the Statutory Statements of Operations and Changes in Capital and Surplus are as follows for the three months ended March 31, (in millions):
| 2024 | 2023 | |||||||
Premiums and annuity considerations | $ | (235 | ) | $ | (38 | ) | ||
Reserve adjustments on reinsurance ceded | $ | 232 | $ | (76 | ) | |||
Benefit payments | $ | (225 | ) | $ | (92 | ) | ||
Changes to reserves, deposit funds and other policy liabilities | $ | (34 | ) | $ | (5 | ) | ||
Information regarding the significant effects of ceded related party reinsurance included in the Statutory Statements of Admitted Assets, Liabilities and Capital and Surplus are as follows (in millions):
| March 31, 2024 | December 31, 2023 | |||||||
Reserves for life insurance, annuities and deposit-type contracts | $ | (2,166 | ) | $ | (2,133 | ) | ||
Information regarding the significant effects of ceded related party deferred gains on reinsurance, net of income tax, which are recognized as an adjustment to surplus are as follows (in millions):
| March 31, 2024 | December 31, 2023 | |||||||
Balance at beginning of year | $ | 283 | $ | 138 | ||||
Capitalization of deferred gain on reinsurance | — | 160 | ||||||
Amortization of deferred gains on reinsurance | (11 | ) | (15 | ) | ||||
|
|
|
| |||||
Balance at end of year | $ | 272 | $ | 283 | ||||
|
|
|
| |||||
The Company has reinsurance agreements with Brighthouse Insurance to cede 100% of certain variable annuities and 100% of the living and death benefit guarantees issued in connection with variable annuities. Financial impacts recorded by the Company as a result of this agreement are as follows for the three months ended March 31, (in millions):
| 2024 | 2023 | |||||||
Reserves for life insurance, annuities and deposit-type contracts | $ | 579 | $ | 938 | ||||
Premiums and annuity considerations | $ | 11 | $ | 27 | ||||
Reserve adjustments on reinsurance ceded | $ | 105 | $ | 76 | ||||
Benefit payments | $ | 95 | $ | 85 | ||||
On October 1, 2023, the Company entered into a reinsurance agreement with Brighthouse Insurance to cede 90% of certain index-linked annuity policies. Financial impacts recorded by the Company as a result of this agreement are as follows for the three months ended March 31, (in millions):
| 2024 | 2023 | |||||||
Reserves for life insurance, annuities and deposit-type contracts | $ | 1,518 | $ | — | ||||
Premiums and annuity considerations | $ | 214 | $ | — | ||||
Reserve adjustments on reinsurance ceded | $ | (337 | ) | $ | — | |||
Benefit payments | $ | 121 | $ | — | ||||
See Note 4 of the annual December 31, 2023 audited statutory financial statements herein for additional information on the novation and settlement of this reinsurance agreement, which resulted in cash and non-cash transfers of assets and liabilities in the period ended March 31, 2024.
211
BRIGHTHOUSE LIFE INSURANCE COMPANY OF NY
Notes to the Interim Condensed Statutory Financial Statements
For the Three Months Ended March 31, 2024 and 2023 (Unaudited) and December 31, 2023 (continued)
Other
The Company has entered into a Limited Liability Company Agreement (the “Agreement”) with Brighthouse Investment Advisers, LLC (“Brighthouse Advisers”) and several other affiliates that are also members of Brighthouse Advisers. Among other things, the Agreement sets forth provisions for the allocation of income and losses to the members of Brighthouse Advisers, including the Company.
The Company has receivables and payables with affiliates for services necessary to conduct its business. Amounts admitted are expected to be settled within 90 days. Receivables from affiliates, included in other assets, totaled $3 million both at March 31, 2024 and December 31, 2023. Payables to affiliates, included in other liabilities, totaled $171 million and $117 million at March 31, 2024 and December 31, 2023, respectively.
Note 5 - Reinsurance and Other Insurance Transactions
The Company enters into reinsurance agreements primarily as a purchaser of reinsurance for its various insurance products. The Company participates in reinsurance activities in order to limit losses, minimize exposure to significant risks and provide additional capacity for future growth.
For its individual life insurance products, the Company has historically reinsured the mortality risk primarily on an excess of retention basis or on a quota share basis. The Company currently retains up to $100,000 per life and reinsures 100% of amounts in excess of the amount the Company retains. In addition to reinsuring mortality risk as described above, the Company reinsures other risks, as well as specific coverages. Placement of reinsurance is done primarily on an automatic basis and also on a facultative basis for risks with specified characteristics. The Company evaluates its reinsurance programs routinely and may increase or decrease its retention at any time.
For annuities, the Company currently reinsures to Brighthouse Insurance 100% of certain variable annuity risks or 100% of the living and death benefit guarantees issued in connection with variable annuities. Under the benefit guarantee reinsurance agreements, the Company pays a reinsurance premium generally based on fees associated with the guarantees collected from policyholders, and receives reimbursement for benefits paid or accrued in excess of account values, subject to certain limitations. In addition, the Company currently reinsures to Brighthouse Insurance 90% of certain index-linked annuity policies.
The Company has exposure to catastrophes, which could contribute to significant fluctuations in the Company’s results of operations. The Company uses excess of retention and quota share reinsurance agreements to provide greater diversification of risk and minimize exposure to larger risks.
The Company reinsures its business through a diversified group of highly rated reinsurers. The Company analyzes recent trends in arbitration and litigation outcomes in disputes, if any, and monitors ratings and the financial strength of its reinsurers. In addition, the reinsurance recoverable balance due from each reinsurer and the recoverability of such balance is evaluated as part of this overall monitoring process. The Company generally secures large reinsurance recoverable balances with various forms of collateral, including secured trusts, funds withheld accounts and irrevocable letters of credit. No single unrelated reinsurer has a material obligation to the Company nor is the Company’s business substantially dependent upon any reinsurance agreement. The Company is contingently liable with respect to ceded reinsurance should any reinsurer be unable to meet its obligations under these agreements.
The financial statements include the impact of reinsurance. Information regarding the significant effects of related and unrelated ceded reinsurance included in the Statutory Statements of Operations and Changes in Capital and Surplus was as follows for the three months ended March 31, (in millions):
| 2024 | 2023 | |||||||
Premiums and annuity considerations | $ | (235 | ) | $ | (39 | ) | ||
Reserve adjustments on reinsurance ceded | $ | 232 | $ | (76 | ) | |||
Benefit payments | $ | (234 | ) | $ | (96 | ) | ||
Changes to reserves, deposit funds and other policy liabilities | $ | (24 | ) | $ | 1 | |||
212
BRIGHTHOUSE LIFE INSURANCE COMPANY OF NY
Notes to the Interim Condensed Statutory Financial Statements
For the Three Months Ended March 31, 2024 and 2023 (Unaudited) and December 31, 2023 (continued)
The financial statements include the impact of reinsurance. Information regarding the significant effects of related and unrelated ceded reinsurance included in the Statutory Statements of Admitted Assets, Liabilities and Capital and Surplus was as follows (in millions):
| March 31, 2024 | December 31, 2023 | |||||||
Reserves for life insurance, annuities and deposit-type contracts | $ | (3,063 | ) | $ | (3,035 | ) | ||
Funds held under reinsurance treaties | $ | (416 | ) | $ | (418 | ) | ||
The Company has ceded reinsurance to related and unrelated companies that are unauthorized, or not accredited to write reinsurance agreements in the domiciliary state of the Company. The unauthorized reinsurance liability is calculated to record a liability for reserve credits taken that are not fully collateralized by each unauthorized reinsurance company. The unauthorized companies provide collateral to the Company to support the ceded liabilities. The collateral provided includes but is not limited to letters of credit (“LOCs”) and trust agreements. The unauthorized liability balance for the Company was less than $1 million at both March 31, 2024 and December 31, 2023. LOCs that are provided for reinsurance agreements with unrelated companies totaled less than $1 million at both March 31, 2024 and December 31, 2023. Assets held in trust for reinsurance agreements with Brighthouse Insurance totaled $2,469 million and $2,458 million at March 31, 2024 and December, 31 2023, respectively.
The Company has entered into reinsurance agreements to cede in-force business to reinsurers. These agreements may result in deferred gains on reinsurance, net of income tax, which are recorded in unassigned surplus (deficit). The change in deferred gains on reinsurance is recognized as an adjustment to surplus and is reflected in change in surplus as a result of reinsurance. The rollforward of deferred gains on reinsurance agreements is as follows at (in millions):
| March 31, 2024 | December 31, 2023 | |||||||
Balance at beginning of year | $ | 554 | $ | 420 | ||||
Capitalization of deferred gain on reinsurance | — | 160 | ||||||
Amortization of deferred gains on reinsurance | (13 | ) | (26 | ) | ||||
|
|
|
| |||||
Balance at end of year | $ | 541 | $ | 554 | ||||
|
|
|
| |||||
Note 6 - Subsequent Events
The Company has evaluated events subsequent to March 31, 2024 through June 10, 2024, which is the date these financial statements were available to be issued, and has determined there are no material subsequent events requiring adjustment to or disclosure in the financial statements.
213
Investment Amount at Term Start Date | $100,000 |
Term | 1-Year |
Initial Index | S&P 500® Index |
Index Value on Term Start Date for S&P 500® Index | 1,400 |
Cap Rate | 10% |
Shield Rate | 10% |
Index substitution | |
Number of days since Term Start Date | 183 |
Index Value for S&P 500® Index | 1,330 |
Index Performance for S&P 500® Index(1) | –5% |
Substituted Index | Russell 2000® Index |
Index Value for Russell 2000® Index on substitution date | 1,250 |
Index Value for Russell 2000® Index | 1,375 |
Index Performance for S&P 500® Index(1) | –5% |
Index Performance for Russell 2000® Index(2) | 10% |
Total Index Performance for the Term(3) | 4.5% |
Cap Rate | 10% |
Shield Rate | 10% |
Performance Rate(4) | 4.5% |
Performance Rate Adjustment(5) | $4,500 |
Investment Amount at Term End Date(6) | $104,500 |
÷ 1400 [Index Value at Term Start Date]) = –5%
÷ 1250 [Index Value at date of substitution]) = 10%
x (1375 [substituted Index at Term End Date] ÷ 1250 [substituted Index at substitution date]) –1 = 4.5%
Date | Amount | ||
A | Purchase Payment | Issue Date | $100,000 |
B | Account Value | First Contract Anniversary | $90,000 |
C | Death Benefit | First Contract Anniversary | $100,000 (= greater of A and B) |
D | Withdrawal | One Day after the First Contract Anniversary | $9,000 |
E | Percentage Reduction in Account Value | One Day after the First Contract Anniversary | 10% (= D/B) |
F | Account Value after Withdrawal | One Day after the First Contract Anniversary | $81,000 (= B-D) |
G | Purchase Payment Reduced for Withdrawal | One Day after the First Contract Anniversary | $90,000 (= A-(A × E)) |
H | Death Benefit | One Day after the First Contract Anniversary | $90,000 (= greater of F and G) |
Number
(Registrant)
Donald A. Leintz
Vice President
Signature | Title | Date |
/s/ David A. Rosenbaum David A. Rosenbaum | Chairman of the Board, President, Chief Executive Officer and a Director | June 10, 2024 |
/s/ Kendall K. Alley Kendall K. Alley | Director | June 10, 2024 |
/s/ Edward C. Kosnik Edward C. Kosnik | Director | June 10, 2024 |
/s/ Mayer Naiman Mayer Naiman | Director | June 10, 2024 |
/s/ Douglas A. Rayvid Douglas A. Rayvid | Director | June 10, 2024 |
/s/ Robert A. Semke Robert A. Semke | Director | June 10, 2024 |
/s/ Kevin White Kevin White | Director | June 10, 2024 |
/s/ Kristine Toscano Kristine Toscano | Vice President and Chief Financial Officer | June 10, 2024 |
/s/ Gianna H. Figaro-Sterling Gianna H. Figaro-Sterling | Vice President and Controller | June 10, 2024 |