0001167831lbk:InterestRateMemberlbk:DepositsFromCustomersMemberlbk:TheGroupMemberifrs-full:CashFlowHedgesMember2020-01-012020-12-310001167831lbk:PriorToOffsettingOfBalancesWithinSameTaxingJurisdictionMemberlbk:TheBankMember2019-12-310001167831lbk:RetailUKMotorFinanceMemberlbk:TheGroupMemberlbk:ExpectedCreditLossesInRespectOfDrawnExposuresMemberlbk:RMS16Member2020-12-310001167831lbk:CommercialMemberlbk:CMS1518Memberlbk:TheGroupMemberlbk:GrossUndrawnExposuresMember2020-12-310001167831lbk:PurchasedOrOriginatedCreditimpairedMemberlbk:TheGroupMemberlbk:RMSMemberlbk:ExpectedCreditLossesInRespectOfDrawnExposuresMemberlbk:OtherMember2019-12-310001167831lbk:Stage2Memberlbk:RMS14Memberlbk:GrossDrawnExposuresMemberlbk:TheBankMemberlbk:RetailMortgagesMember2020-12-310001167831lbk:CommercialMemberlbk:TheBankMemberlbk:GrossUndrawnExposuresMemberlbk:Stage1Member2020-12-310001167831lbk:RMS79Memberlbk:RetailLoansAndOverdraftsMemberlbk:GrossUndrawnExposuresMemberlbk:TheBankMemberlbk:Stage1Member2019-12-310001167831lbk:UndiscountedFutureCashFlowBasisMemberlbk:OutflowsMemberifrs-full:LaterThanOneYearAndNotLaterThanFiveYearsMemberlbk:TheBankMember2020-12-31
Lloyds Bank plc
2020 Annual Report on Form 20-F
As filed with the Securities and Exchange Commission on 11 March 2021
UNITED STATES
SECURITIES AND EXCHANGE COMMISSION
Washington, D.C. 20549
FORM 20-F
☐ REGISTRATION STATEMENT PURSUANT TO SECTION 12(b) OR 12(g) OF THE SECURITIES EXCHANGE ACT OF 1934
OR
☒ ANNUAL REPORT PURSUANT TO SECTION 13 OR 15(d) OF THE SECURITIES EXCHANGE ACT OF 1934
For the fiscal year ended 31 December 2020 OR
☐ TRANSITION REPORT PURSUANT TO SECTION 13 OR 15(d) OF THE SECURITIES EXCHANGE ACT OF 1934
OR
☐ SHELL COMPANY REPORT PURSUANT TO SECTION 13 OR 15(d) OF THE SECURITIES EXCHANGE ACT OF 1934
Commission file number 001-35079
LLOYDS BANK plc
(Exact name of Registrant as Specified in Its Charter)
England
(Jurisdiction of Incorporation or Organization)
25 Gresham Street
London EC2V 7HN
United Kingdom
(Address of Principal Executive Offices)
Kate Cheetham, Company Secretary
Tel +44 (0) 20 7356 2104, Fax +44 (0) 20 7356 1808
25 Gresham Street
London EC2V 7HN
United Kingdom
(Name, telephone, e-mail and/or facsimile number and address of Company contact person)
Securities registered or to be registered pursuant to Section 12(b) of the Act:
| | | | | | | | |
| Title of each class | Trading symbol | Name of each exchange on which registered |
| $1,250,000,000 3.5% Senior Notes due 2025 | LYG25 | The New York Stock Exchange |
| $1,500,000,000 2.25% Senior Notes due 2022 | LYG22 | The New York Stock Exchange |
| $1,250,000,000 3.3% Senior Notes due 2021 | LYG21A | The New York Stock Exchange |
| $1,000,000,000 Floating Rate Senior Notes due 2021 | LYG21B | The New York Stock Exchange |
Securities registered or to be registered pursuant to Section 12(g) of the Act:
None
Securities for which there is a reporting obligation pursuant to Section 15(d) of the Act:
None
The number of outstanding shares of each of Lloyds Bank plc’s classes of capital or common stock as of 31 December 2020 was:
| | | | | |
| Ordinary shares, nominal value 1 pound each | 1,574,285,752 |
| Preference shares, nominal value 1 pound each | 100 | |
| Preference shares, nominal value 25 pence each | NaN |
| Preference shares, nominal value 25 cents each | NaN |
| Preference shares, nominal value 25 euro cents each | NaN |
| Preference shares, nominal value 25 yen each | NaN |
Indicate by check mark if the registrant is a well-known seasoned issuer, as defined in Rule 405 of the Securities Act.
Yes ☐ No ☒
If this report is an annual or transition report, indicate by check mark if the registrant is not required to file reports pursuant to Section 13 or 15(d) of the Securities Exchange Act of 1934.
Yes ☐ No ☒
Indicate by check mark whether the registrant: (1) has filed all reports required to be filed by Section 13 or 15(d) of the Securities Exchange Act of 1934 during the preceding 12 months (or for such shorter period that the registrant was required to file such reports) and (2) has been subject to such filing requirements for the past 90 days.
Yes ☒ No ☐
Indicate by check mark whether the registrant has submitted electronically every Interactive Data File required to be submitted and posted pursuant to Rule 405 of Regulation S-T during the preceding 12 months (or for such shorter period that the registrant was required to submit and post such files).
Yes ☒ No ☐
Indicate by check mark whether the registrant is a large accelerated filer, an accelerated filer, a non-accelerated filer, or an emerging growth company. See the definitions of “large accelerated filer,” “accelerated filer,” and “emerging growth company” in Rule 12b-2 of the Exchange Act. (Check one):
Large accelerated filer ☐ Accelerated filer ☐ Non-Accelerated filer ☒ Emerging Growth Company ☐
If an emerging growth company that prepares its financial statements in accordance with U.S. GAAP, indicate by check mark if the registrant has elected not to use the extended transition period for complying with any new or revised financial accounting standards† provided pursuant to Section 13(a) of the Exchange Act. ☐
Indicate by check mark whether the registrant has filed a report on and attestation to its management's assessment of the effectiveness of its internal control over financial reporting under Section 404(b) of the Sarbanes-Oxley Act (15 U.S.C. 7262(b)) by the registered public accounting firm that prepared or issued its audit report. ☐
Indicate by check mark which basis of accounting the registrant has used to prepare the financial statements included in this filing:
U.S. GAAP ☐ International Financial Reporting Standards as issued by the International Accounting Standards Board ☒ Other ☐
If ‘Other’ has been checked in response to the previous question, indicate by check mark which financial statement item the registrant has elected to follow:
Item 17 ☐ Item 18 ☐
If this is an annual report, indicate by check mark whether the registrant is a shell company (as defined in Rule 12b-2 of the Exchange Act).
Yes☐ No ☒
† The term “new or revised financial accounting standard” refers to any update issued by the Financial Accounting Standards Board to its Accounting Standards Codification after April 5, 2012.
As a wholly-owned subsidiary of Lloyds Banking Group plc, a public company with limited liability incorporated in the United Kingdom and which has its registered office in Scotland, Lloyds Bank plc meets the conditions set forth in General Instructions I(1)(a) and I(1)(b) of Form 10-K, as applied to reports on Form 20-F and is therefore filing its Form 20-F with a reduced disclosure format.
FORM 20-F CROSS REFERENCE SHEET
| | | | | | | | | | | |
| Form 20-F item number | Page and caption references in this document* |
| 1 | | Identity of Directors, Senior Management and Advisers | Not applicable |
| 2 | | Offer Statistics and Expected Timetable | Not applicable |
| 3 | | Key Information | |
| A. | Selected financial data | Omitted |
| B. | Capitalization and indebtedness | Not applicable |
| C. | Reason for the offer and use of proceeds | Not applicable |
| D. | Risk factors | |
| 4 | | Information on the Company | |
| A. | History and development of the company | Omitted |
| B. | Business overview | |
| C. | Organizational structure | |
| D. | Property, plant and equipment | |
| 4A | | Unresolved staff comments | Not applicable |
| 5 | | Operating and Financial Review and Prospects | |
| A. | Operating results | |
| B. | Liquidity and capital resources | Omitted |
| C. | Research and development, patents and licenses, etc. | Not applicable |
| D. | Trend information | Omitted |
| E. | Off-balance sheet arrangements | Omitted |
| F. | Tabular disclosure of contractual obligations | Omitted |
| G. | Safe harbor | |
| 6 | | Directors, Senior Management and Employees | |
| A. | Directors and senior management | Omitted |
| B. | Compensation | Omitted |
| C. | Board practices | |
| D. | Employees | Omitted |
| E. | Share ownership | Omitted |
| 7 | | Major Shareholders and Related Party Transactions | |
| A. | Major shareholders | Omitted |
| B. | Related party transactions | Omitted |
| C. | Interests of experts and counsel | Not applicable |
| 8 | | Financial Information | |
| A. | Consolidated statements and other financial information | |
| B. | Significant changes | Not applicable |
| 9 | | The Offer and Listing | |
| A. | Offer and listing details | |
| B. | Plan of distribution | Not applicable |
| C. | Markets | |
| D. | Selling shareholders | Not applicable |
| E. | Dilution | Not applicable |
| F. | Expenses of the issue | Not applicable |
| 10 | | Additional Information | |
| A. | Share capital | Not applicable |
| B. | Memorandum and Articles of Association | |
| C. | Material contracts | Not applicable |
| D. | Exchange controls | |
| E. | Taxation | |
| F. | Dividends and paying assets | Not applicable |
| G. | Statement by experts | Not applicable |
| H. | Documents on display | |
| I. | Subsidiary information | |
| 11 | | Quantitative and Qualitative Disclosure about Market Risk | |
FORM 20-F CROSS REFERENCE SHEET
| | | | | | | | | | | |
| 12 | | Description of Securities Other than Equity Securities | |
| A. | Debt Securities | Not applicable |
| B. | Warrants and Rights | Not applicable |
| C. | Other Securities | Not applicable |
| D. | American Depositary Shares | Not applicable |
| 13 | | Defaults, Dividends Arrearages and Delinquencies | Not applicable |
| 14 | | Material Modifications to the Rights of Security Holders and Use of Proceeds | Not applicable |
| 15 | | Controls and Procedures | |
| A. | Disclosure controls and procedures | |
| B. | Management’s annual report on internal control over financial reporting | |
| C. | Attestation report of the registered public accounting firm | Not applicable |
| D. | Changes in internal control over financial reporting | |
| 16A | | Audit Committee Financial Expert | Omitted |
| 16B | | Code of Ethics | Omitted |
| 16C | | Principal Accountant Fees and Services | |
| 16D | | Exemptions from the Listing Standards for Audit Committees | Not applicable |
| 16E | | Purchases of Equity Securities by the Issuer and Affiliated Purchasers | Not applicable |
| 16F | | Change in Registrant’s Certifying Accountant | |
| 16G | | Corporate Governance | |
| 17 | | Financial Statements | See Item 8 |
| 18 | | Financial Statements | See Item 8 |
| 19 | | Exhibits | Exhibit Index |
*Certain items are indicated as omitted as Lloyds Bank plc is a wholly owned subsidiary of Lloyds Banking Group plc, which is a reporting company under the Securities Exchange Act of 1934, and meets the conditions set forth in General Instruction I(1)(a) and (b) of Form 10-K, as applied to annual reports on Form 20-F, and is therefore filing this Form 20-F with a reduced disclosure format.
PRESENTATION OF INFORMATION
In this annual report, references to the ‘Bank’ are to Lloyds Bank plc; references to ‘Lloyds Bank Group’ or the ‘Group’ are to Lloyds Bank plc and its subsidiary and associated undertakings; and references to the ‘consolidated financial statements’ or ‘financial statements’ are to Lloyds Bank consolidated financial statements included in this annual report. References to ‘Lloyds Banking Group’ and ‘Parent Group’ are to Lloyds Banking Group plc, the parent company of Lloyds Bank plc, and its subsidiaries and associated undertakings. References to LBCM are to Lloyds Bank Corporate Markets plc, a fellow subsidiary of Lloyds Banking Group, and its subsidiaries. References to the ‘Financial Conduct Authority’ or ‘FCA’ and to the ‘Prudential Regulation Authority’ or ‘PRA’ are to the United Kingdom (the UK) Financial Conduct Authority and the UK Prudential Regulation Authority. References to the ‘Financial Services Authority’ or ‘FSA’ are to their predecessor organisation, the UK Financial Services Authority.
The consolidated financial statements have been prepared in accordance with International Financial Reporting Standards (IFRS) as issued by the International Accounting Standards Board (IASB). Certain disclosures required by IFRS have been included in sections highlighted as ‘Audited’ within the Operating and financial review and prospects section of this Annual Report on Form 20-F on pages 13 to 76. Disclosures marked as audited indicate that they are within the scope of the audit of the financial statements taken as a whole; these disclosures are not subject to a separate opinion.
Lloyds Bank Group publishes its consolidated financial statements expressed in British pounds (‘pounds sterling’, ‘sterling’ or ‘£’), the lawful currency of the UK. In this annual report, references to ‘pence’ and ‘p’ are to one-hundredth of one pound sterling; references to ‘US dollars’, ‘US$’ or ‘$’ are to the lawful currency of the United States (the US); references to ‘cent’ or ‘c’ are to one-hundredth of one US dollar; references to ‘euro’ or ‘€’ are to the lawful currency of the member states of the European Union (EU) that have adopted a single currency in accordance with the Treaty establishing the European Communities, as amended by the Treaty of European Union; references to ‘euro cent’ are to one-hundredth of one euro; and references to ‘Japanese yen’, ‘Japanese ¥’ or ‘¥’ are to the lawful currency of Japan. Solely for the convenience of the reader, this annual report contains translations of certain pounds sterling amounts into US dollars at specified rates. These translations should not be construed as representations by Lloyds Bank Group that the pounds sterling amounts actually represent such US dollar amounts or could be converted into US dollars at the rate indicated or at any other rate. Unless otherwise stated, the translations of pounds sterling into US dollars have been made at the noon buying rate in New York City for cable transfers in pounds sterling as certified for customs purposes by the Federal Reserve Bank of New York (the Noon Buying Rate) in effect on 31 December 2020. The Noon Buying Rate on 31 December 2020 differs from certain of the actual rates used in the preparation of the consolidated financial statements, which are expressed in pounds sterling, and therefore US dollar amounts appearing in this annual report may differ significantly from actual US dollar amounts which were translated into pounds sterling in the preparation of the consolidated financial statements in accordance with IFRS.
The information included in the consolidated financial statements presented in this Form 20-F for the two comparative years differs from the information provided in Lloyds Bank Group’s UK results for the year ended 31 December 2020. As reported in the Bank’s 2018 Form 20-F, an adjusting post balance sheet event that occurred between the signing of the Bank’s 2018 UK Annual Report and Accounts and its 2018 Form 20-F resulted in the charge recognised in respect of PPI complaints in the 2018 Form 20-F being £649 million greater than that recorded in the 2018 UK Annual Report and Accounts. Consequently, the charge recognised by the Lloyds Bank Group in its UK basis results for 2019 was £649 million greater than on a US basis. The Lloyds Bank Group has reported the same net assets on a US basis and on a UK basis since 30 June 2019.
The Lloyds Bank Group is a leading provider of financial services to individual and business customers in the UK. At 31 December 2020, Lloyds Bank Group had 60,672 employees (on a full-time equivalent basis) and its total assets were £599,939 million. The Lloyds Bank Group reported a profit before tax for the 12 months to 31 December 2020 of £1,329 million, and its capital ratios at that date were 23.5 per cent for total capital, 19.8 per cent for tier 1 capital and 15.5 per cent for common equity tier 1 capital.
Set out below is the Lloyds Bank Group’s summarised income statement for each of the last two years:
| | | | | | | | |
| 2020 | 2019 |
| £m | £m |
| Net interest income | 10,770 | | 12,220 | |
| Other income | 3,815 | | 4,388 | |
| Total income | 14,585 | | 16,608 | |
| Total operating expenses | (9,196) | | (11,123) | |
| Impairment | (4,060) | | (1,362) | |
| Profit before tax | 1,329 | | 4,123 | |
The Lloyds Bank Group’s main business activities are retail and commercial banking and it operates primarily in the UK. Services are offered through a number of well recognised brands including Lloyds Bank, Halifax and Bank of Scotland, and through a range of distribution channels including the largest branch network and digital bank in the UK.
At 31 December 2020, the Lloyds Bank Group’s two primary operating divisions, which are also reporting segments, were Retail and Commercial Banking. Retail provides current accounts, savings, mortgages, credit cards, motor finance and unsecured loans to personal and business banking customers. Commercial Banking provides lending, transactional banking, working capital management, risk management and debt capital markets services to commercial customers.
Profit before tax is analysed on pages 15 and 16 and the table below shows the results of the Lloyds Bank Group’s segments in the last two fiscal years.
| | | | | | | | |
| 2020 | 20191 |
| £m | £m |
| Retail | 1,856 | | 2,204 | |
| Commercial Banking | 20 | | 1,430 | |
| Other | (547) | | 489 | |
| Profit before tax | 1,329 | | 4,123 | |
1Segmental analysis restated, as explained on page F-31.
Lloyds Bank plc was incorporated as a public limited company and registered in England under the UK Companies Act on 20 April 1865 with the registered number 2065. Lloyds Bank plc’s registered office and its principal executive offices in the UK are located at 25 Gresham Street, London EC2V 7HN, United Kingdom, telephone number + 44 (0) 20 7626 1500. Lloyds Bank maintains a website at www.lloydsbank.com.
STRATEGY OF LLOYDS BANK GROUP
The Lloyds Bank Group is a leading provider of financial services to individual and business customers in the UK. The Lloyds Bank Group’s main business activities are retail and commercial banking. Services are provided through a number of well recognised brands including Lloyds Bank, Halifax and Bank of Scotland and through a range of distribution channels, including the largest branch network and digital bank in the UK. The Lloyds Bank Group strategy is directly aligned to the strategy of its parent, Lloyds Banking Group plc.
Today's environment continues to evolve and provide new challenges. The macroeconomic environment remains uncertain, whilst Lloyds Banking Group is witnessing increasing societal expectations, an accelerated shift to digital and new technology capabilities in the context of the pandemic driving a step change in ways of working.
Throughout 2020 the management team, in conjunction with the Board, have worked on developing an evolution of Lloyds Banking Group's strategy to address these issues. The Group has made significant progress in recent years, leveraging its unique strengths and assets, including its purpose driven and customer focused business model, low risk approach to business, market leading efficiency and leading multi-channel propositions, including the largest digital bank and branch network in the UK. This has created the platform for Strategic Review 2021, the next stage of the Group's journey.
Strategic Review 2021 is focused on Helping Britain Recover and building the UK’s preferred financial partner for personal customers and the best bank for business. Strategic Review 2021 will deliver co-ordinated growth opportunities in the Group’s two core customer segments, supported by enhanced capabilities in four areas:
•Preferred financial partner for personal customers, through leveraging the Group’s unique competitive advantages to significantly deepen customer relationships
•Best bank for business, through building a leading digital SME proposition, with a disciplined and strengthened business for Corporate and Institutional clients
•Further develop and leverage the Group’s core capabilities, including delivering a modernised technology architecture, building integrated payment solutions, creating a data driven organisation and implementing reimagined ways of working
Clear execution outcomes for the coming year are outlined for all these areas and underpinned by long-term strategic vision. Strategic Review 2021 will thus enable the Group to deliver revenue generation and diversification whilst unlocking further efficiency gains, within the Group’s low risk and capital efficient business. Lloyds Banking Group's purpose, unique business model and ambitious strategy will allow the Group to Help Britain Recover and deliver long-term sustainable returns for its shareholders.
BUSINESS AND ACTIVITIES OF LLOYDS BANK GROUP
The Lloyds Bank Group’s activities are organised into two financial reporting segments: Retail and Commercial Banking. During 2020, the Group migrated certain customer relationships from the SME business within Commercial Banking to Business Banking within Retail; the Group has also revised its approach to internal funding charges, including the adoption of the Sterling Overnight Index Average (SONIA) interest rate benchmark in place of LIBOR. Comparatives have been restated accordingly.
Further information on the Lloyds Bank Group’s segments is set out in note 4 to the financial statements.
MATERIAL CONTRACTS
The Bank and its subsidiaries are party to various contracts in the ordinary course of business.
ENVIRONMENTAL MATTERS
Lloyds Banking Group sets the environmental goals and measures the environmental achievements of the Lloyds Banking Group as a whole. Accordingly, the disclosures below are for Lloyds Banking Group as a whole and not specific to the Group.
Helping Britain transition to a sustainable low carbon economy
This section contains certain disclosures in alignment with the recommendations of the Task Force on Climate-related Financial Disclosures (TCFD).
The Group’s unique position within the UK economy means that the successful transition to a more sustainable, low carbon economy is of strategic importance. The Group supports the aims of the 2015 Paris Agreement, the UK Government’s Net Zero target and Ten Point Plan for a Green Industrial Revolution and the recommendations of the TCFD.
The economic recovery required post COVID-19 provides a critical opportunity to drive clean growth and ensure that the UK’s decarbonisation requirements sit at the heart of the UK’s policy framework. In 2020, the Group joined over 200 businesses, investors, and business organisations in calling on the Government to deliver a clean, inclusive, and resilient recovery plan. The Group has produced a separate document outlining its belief that prioritising a green recovery is critical and the priority areas that the Group thought should feature within any economic stimulus plan.
Lloyds Banking Group Strategy
Lloyds Banking Group’s goal and approach
As a signal of commitment, the Group set an ambitious goal in 2020: working with customers, Government, and the market to help reduce the emissions that the Group finances by more than 50 per cent by 2030, on the path to net zero by 2050 or sooner, which will support the UK Government's ambition and the 2015 Paris Agreement. During the course of 2020, the Group has calculated an initial estimate of its 2018 financed emissions baseline and has developed its first emission intensity reduction ambition for the power sector, the decarbonisation of which is critical to the UK achieving its climate targets. The Group will continue to develop additional sector specific ambitions throughout 2021.
In addition, the Insurance and Wealth division (excluding Wealth Private Banking) has published a target to reach net zero across the full portfolio of investments by 2050, halving the investments’ carbon footprint by 2030.
In order to meet its overall 2030 and 2050 goals, the Group will continue to:
•Identify new ways to support customers and clients with the management of opportunities and risks associated with climate change, and the transition to a low carbon economy.
•Identify, manage, and disclose material sustainability and climate-related risks across the Group and their impacts on the Group and its financial planning processes, in line with the TCFD framework. This includes working with industry bodies, specialist consultancies and leading academics to develop a robust climate risk measurement capability.
•Use the scale and reach of the Group to help drive progress towards a sustainable and resilient UK economy through engagement with customers, communities, industry, Government, shareholders, and suppliers.
•Embed sustainability into the way the Group does business and manages its own operations in a more sustainable way. To support this the Group has updated the operational climate pledges, setting a new net zero goal for 2030.
The Group participates in several industry initiatives and has signed up to key principles that drive action on climate change and sustainability.
The Lloyds Banking Group Ambitions
The Group set seven leadership ambitions to support the UK’s transition to a sustainable future. In 2020, the Group has focused on enhancing its green finance products and services to achieve its ambitions. Examples of this include the following:
| | | | | |
| Lloyds Banking Group Ambition | How the Group are delivering against the ambitions |
Business Become a leading UK commercial bank for sustainable growth, supporting clients to transition to sustainable business models and operations, and to pursue new clean growth opportunities | •Since 2018 the Group has supported renewable energy projects that power the equivalent of 10.1 million homes, significantly exceeding the Helping Britain Prosper Plan 2020 target. •The Group launched several new green finance products, tools, and services: a Lloyds Bank and Bank of Scotland Green Buildings Tool; a Sustainability Fixed Term Deposit and 95 Day Notice Account; and the Group also structured and co-ordinated the first Sterling Overnight Index Average (SONIA) Sustainability Linked Loan for Affinity Water |
| |
| |
Homes Be a leading UK provider of customer support for energy efficient, sustainable homes | •The Group launched the Green Living and Eco Home Hub for Halifax and Lloyds customers •To support Halifax customers with the cost of green home improvements, the Group has also introduced a Green Living Reward under the UK Department for Business, Energy, and Industrial Strategy (BEIS) Green Home Finance Innovation Fund |
| |
| |
Vehicles Be a leading UK provider of low emission/green vehicle fleets | •In 2020, the Group more than doubled the number of electric vehicles financed through its Motor Finance and Leasing subsidiaries, Lex Autolease and Blackhorse |
| |
| |
Pensions and investments Be a leading UK pension provider that offers customers and colleagues sustainable investment choices, and challenges the companies the Group invest in to behave more sustainably and responsibly | •Scottish Widows has launched a Responsible Investment Framework in March 2020 and supporting Stewardship Policy. •The Scottish Widows Exclusions Policy focuses on companies that have failed to meet Scottish Widows environmental, social and governance standards, namely manufacturers of controversial weapons, UN Global Compact violators and those deriving more than 10 per cent of their revenue from thermal coal and tar sands extraction. Scottish Widows is currently divesting an initial £440 million from these companies, starting with those investments where Scottish Widows has direct control and is working to expand the application of this policy into external pooled funds that underpin the multi-asset funds as well. Early success of engagement activity with one of the partner asset managers has led the investment manager to introduce an exclusions policy for all its Europe-domiciled passive funds totalling over £20 billion, leading to an additional divestment of approximately £280 million within customer pension portfolios. •Through shareholder investments, Scottish Widows provides direct loans for renewable energy, including for offshore wind and solar energy. •Scottish Widows is also investing £2 billion of Pension and Retirement Portfolio Pension Funds capital into a new fund, the ACS Climate Transition World Equity Fund, co-created with BlackRock that looks to increase investment in companies that are well prepared for the low carbon transition and to reduce exposure to those that are less so |
| |
| |
Insurance Be a leading UK insurer in improving the resilience of customers’ lives against extreme weather exacerbated by climate change | •The Group continues to partner with RedArc to operate a trauma helpline that aids customers needing extra help after a traumatic claim such as a fire or flood •The Group is also investing in ways to minimise the impact of flooding on customers. For example, the Group continues to provide a Rapid Response Vehicle to quickly assess claims and release funds to customers in the worst affected areas |
| |
| |
Green bonds Be a leading UK bank in the green/sustainable bonds market | •Since the launch of this ambition in 2016, the Group has maintained the role as a leader for UK corporate clients between 2016 and 2020, raising around £2.9 billion. |
| |
| |
Lloyds Banking Group’s own footprint Be a leading UK bank in reducing Lloyds Banking Group’s own carbon footprint and challenging our suppliers to ensure Lloyds Banking Group’s own consumption of resources, goods and services is sustainable | •The Group continues to improve the sustainability of its own operations and has recently updated the Group’s operational climate pledges. •This year, the Group has calculated and disclosed the emissions associated with increased homeworking as a result of COVID-19 and sponsored a white paper in this area. •The Group has continued to reduce the energy and carbon intensity of its properties and has supported low carbon travel •Lloyds Banking Group’s overall location-based carbon emissions were 159,487 tonnes CO2e; a 24 per cent decrease since 2019 and 72 per cent since its 2009 baseline (legacy scope). |
| |
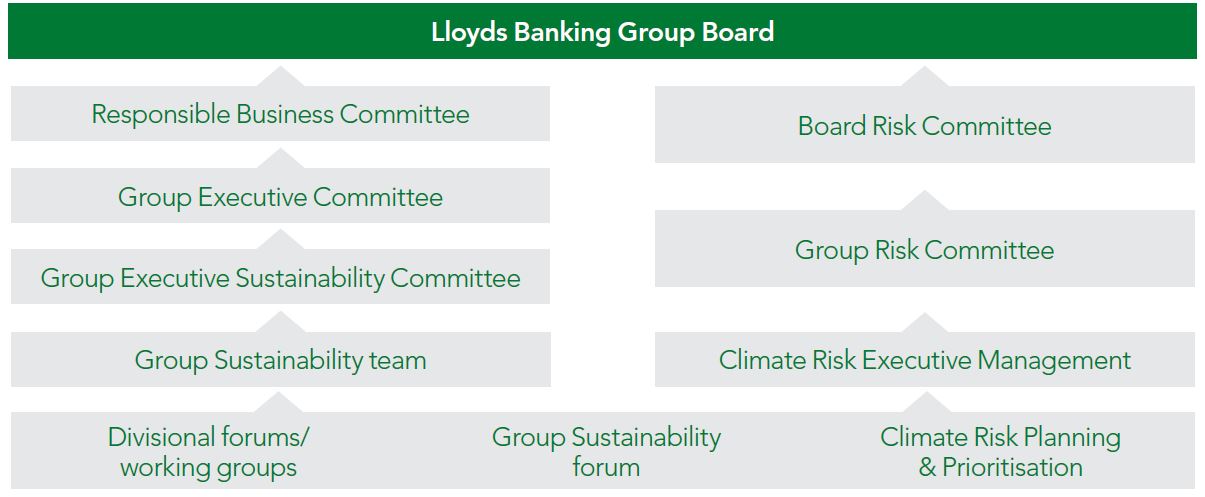
Governance
Lloyds Banking Group’s governance structure provides clear oversight and ownership of the Group’s sustainability strategy and management of climate-related risks. Governance for climate-related risks is embedded into the Group’s existing governance structure and is complementary to governance of the sustainability strategy.
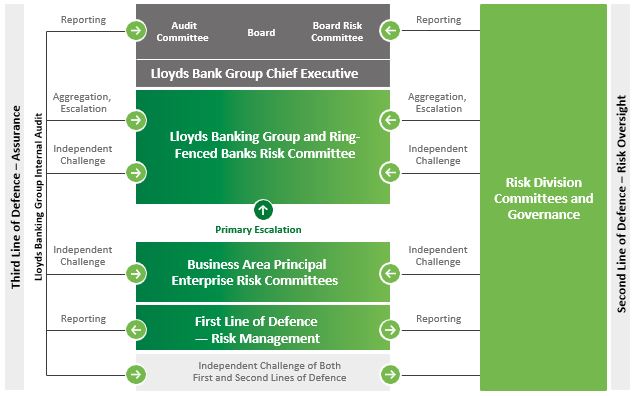
Risk management
The Group has adopted a comprehensive approach to embedding climate-related risks into its Enterprise Risk Management Framework through:
•Creation of a new principal risk for climate risk, in order to drive dedicated focus and a consistent approach, whilst enhancing Board-level insight.
•Integration of climate risk into the Group’s existing principal risks, to ensure comprehensive consideration across all aspects of its business activity.
Climate Risk is included as both a principal and emerging risk this year given it is such a new and fast-moving area. The Group continues to ensure its approach for climate risk management has suitable Board- level visibility. The Board has approved a Risk Appetite Statement for climate risk, as well as an interim metric to ensure the Group continues to progress activities at pace, supported by Board-level risk reporting.
As the understanding and importance of climate risk progresses, climate scenario analysis is becoming an essential capability and risk management tool. Scenario analysis assists the identification, measurement, and ongoing assessment of climate risks over the longer-term, and the potential threats to the Group’s strategic objectives. In 2020, the Group has developed its climate scenario analysis framework and will see outputs from this in 2021.
To further accelerate progress, the Group has engaged with third-party consultants to support the development of its climate risk management framework and high priority sector analysis, thereby extending its modelling and assessment capabilities for quantifying climate risk.
Climate risk and sustainability has been a key consideration in the credit assessment process in recent years, and in 2020 the Group has deepened the integration of sustainability into its credit risk processes and appetite statements. Lloyds Banking Group continues to refine the Group’s external sector statements, which help articulate appropriate areas of climate-related risk appetite and the Group’s approach to the risk assessment of its customers.
As part of the Group's credit risk policy, the Group has mandatory requirements to consider environmental risks in key risk management activities. In Commercial Banking, Relationship Managers must continue to ensure that sustainability risk is considered for all new and renewal facilities, and specifically commented on where credit limits exceed £500,000. The Group has also developed and is piloting a tool in Commercial Banking to help qualitatively assess clients’ physical and transition risks.
In Retail, the Group considers exposure to physical risks, such as flooding, in mortgages origination criteria and the Group has also introduced sustainability related criteria into its motor finance businesses. Within Insurance, an assessment of climate-related risks to General Insurance (GI) liabilities is integrated into the internal model governance process. The Group further developed its weather modelling capabilities in 2020 through completion of a research partnership between the Group's GI Weather Modelling Team and the University of Reading on extreme wind and flood risk in the UK.
Sectors with increased climate risk
The Group has identified those sectors where it has lending to customers that may likely contribute a higher share of Lloyds Banking Group’s financed emissions (see Table 1). Not all customers in these sectors have high emissions or are exposed to significant transition risks.
The Group continues to enhance and refine this work at both counterparty and sector level, considering both risks and opportunities as it looks to support customers' responses to climate change.
| | | | | | | | | | | | | | | | | | | | |
Table 1. Lending1 to customers in sectors at increased risk from the impacts of climate change |
Commercial Banking Sector4 | Lending to Commercial Banking customers (£m)2 | | Percentage of total Group loans and advances to customers3 |
| Dec 2020 | Dec 2019 | | Dec 2020 | Dec 2019 |
| Energy Use in Buildings | Real Estate (including Housing Associations) | 25,426 | | 27,124 | | | 5.04% | 5.44% |
| Agriculture | Agriculture, Forestry & Fishing5 | 7,464 | | 7,219 | | | 1.48% | 1.45% |
| Transport | Passenger Transport | 1,135 | | 1,120 | | | 0.22% | 0.22% |
| Industrial Transport | 1,374 | | 1,674 | | | 0.27% | 0.34% |
Automotives6 | 1,485 | | 1,272 | | | 0.29% | 0.26% |
| Energy Use in Industry | Housebuilders | 870 | | 1,168 | | | 0.17% | 0.23% |
Construction7 | 1,210 | | 1,179 | | | 0.24% | 0.24% |
| Cement, Construction Materials, Chemicals & Steel Manufacture | 317 | | 391 | | | 0.06% | 0.08% |
| General Manufacturing | 1,301 | | 1,285 | | | 0.26% | 0.26% |
| Food Manufacturing and Wholesalers | 1,312 | | 1,844 | | | 0.26% | 0.37% |
| Energy Supply | Oil & Gas8 | 1,099 | | 1,393 | | | 0.22% | 0.28% |
| Utilities | 1,638 | | 1,779 | | | 0.32% | 0.36% |
| Coal Mining | 8 | | 21 | | | 0.002% | 0.004% |
| Total | 44,639 | | 47,469 | | | 8.85% | 9.53% |
| | | | | | |
| | Loans and advances to
customers (£m) | | Percentage of total Group loans and advances to customers3 |
Retail Division areas9 | Dec 2020 | Dec 2019 | | Dec 2020 | Dec 2019 |
| UK Mortgages | 294,806 | | 289,198 | | | 58.42% | 58.04% |
| UK Motor Finance | 15,201 | | 15,976 | | | 3.01% | 3.21% |
| Total | 310,007 | | 305,174 | | | 61.44% | 61.25% |
1Commercial Banking and Retail divisions only. Excludes Insurance and Wealth division.
2Commercial Banking division only, excludes Commercial Finance. Drawn lending is gross of significant risk transfers. Excludes Business Banking lending, which sits within Retail division. 2019 restated on a consistent basis with 2020.
3Percentages calculated using total Group loans and advances to customers, before allowance for impairment losses (£504,603 million at 31 December 2020 and £498,247 million at 31 December 2019).
4Commercial lending classified using ONS SIC codes at legal entity level.
5Agriculture lending includes Agricultural Mortgage Corporation (AMC) based on loans and advances to customers £4,186 million (2019: £3,998 million).
6Includes Automotive manufacture, retail and wholesale trade, rentals and parts but excludes finance captives and securitisations.
7Construction excludes 41100 Development of building projects (included within Real Estate) and 41202 Construction of domestic buildings (reported separately as Housebuilders).
8Excludes Commodity Traders.
9Based on loans and advances to customers within Retail Division.
Metrics and targets
Financed emissions
Lloyds Banking Group believes it is appropriate to provide more financial information on its financed emissions, although the Group also recognises this is a rapidly developing area, with evolving and sometimes limiting data availability, data completeness and calculation methodologies. The Group expects these to continue to improve in 2021 and beyond, helping it to refine the Group's approaches, estimates and understanding of the climate risk within its portfolios. However, in order to enhance disclosure, whilst recognising these limitations, the Group details in Table 2 an initial estimated view of the 2018 financed emissions baseline across the Group’s own lending activity (excluding Insurance and Wealth).
This will serve as an initial basis for the Group’s goal of helping to reduce the emissions that the Group finances by more than 50 per cent by 2030 and to help it better support customers in their transition plans to a low-carbon economy (see Table 2). The Group selected 2018 as there is more comprehensive company emissions reporting and UK Government Office of National Statistics (ONS) emissions data available at that time.
The Group has used the emerging industry standard for calculating financed emissions developed by the Partnership for Carbon Accounting Financials (PCAF). The baseline is an estimate, as client or asset level emissions data is currently not available in all cases and where appropriate, the Group has used internal and external data and proxies to fill these data gaps. Given this is a new discipline that will continue to develop and evolve, it is expected that its baseline will change in the future (perhaps materially), which may require restatement. The Group expects methodologies for calculating financed emissions to mature, with data availability and quality also improving from clients and Government sources.
The initial estimated view of the 2018 financed emissions baseline covers approximately 70 per cent of the Group’s balance sheet (excluding Insurance and Wealth)1 comprised of:
•Motor vehicle loans (Lex and Black Horse) – at individual vehicle level, vehicle emission intensity and contracted (or estimated) miles driven per annum
•Mortgages (Retail UK Mortgages) – from Energy Performance Certificates (EPCs) where available with estimates used for properties without EPC ratings
•Business loans (Commercial Banking only) – on client-level emissions data and asset-based estimates using ONS UK sector emissions
•Cash balances – with no associated emissions
For the remaining balance sheet, 26 per cent currently have no method for calculating emissions and 4 per cent do not have data readily available to enable emissions to be calculated.2
As currently recommended by PCAF, the baseline only includes Scope 1 and 2 emissions of clients and does not include undrawn lending commitments, off balance sheet contingents or areas where there is no methodology.
Insurance and Wealth financed emissions
The financed emissions for the Insurance and Wealth division are not included in the Group’s total financed emissions or the Group’s target to reduce financed emissions by 50 per cent by 2030. Due to the different nature of banking and investment activity, the Insurance and Wealth division will be further developing its approach to reporting appropriate climate metrics and targets during 2021.
| | | | | | | | |
Table 2. Initial estimated view of the 2018 financed emissions baseline for the Group’s own lending (excluding the Insurance and Wealth division) |
| Asset Class | Estimated MtCO2e (Scope 1 & 2 emissions) | Equivalent share of UK total emissions by sector/asset class6 |
Motor vehicle loans3 | 3.2 | c.4% |
Mortgages4 | 6.3 | c.6% |
Business loans5 | 15.9 | c.6% |
| Total | 25.41,2 | c.5.6% |
Notes to table:
1Includes Nil emissions for cash balances,which accounted for 8 per cent of the Group's balance sheet.
2Examples of areas where there is no current method for calculating emissions include: government securities, derivatives, personal loans, credit cards and reverse repos. Areas where data was not readily available, but coverage may be expanded in the future include: business banking, non-UK mortgages, loans and advances to banks and some assets at fair value through profit and loss.
3Covers 95 per cent of motor vehicle loans and operating lease assets. Excludes assets that do not have a motor , specialist vehicles and vehicles where mileage is difficult to estimate. Currently does not apply a loan-to-value ratio for emissions.
4Covers 97 per cent of mortgages. Excludes non-UK mortgages. Uses EPC emissions estimates for 45% of properties and average emission intensity profiles of EPC C to G properties to calculate emissions for the balance of properties where EPCs are not available. Property index value as at end 2018 is used for current property value in PCAF emission attribution calculations.
5Includes 99 per cent of Commercial Banking business loans, based on drawn lending. The PCAF sector-based approach has been used for the majority of the business loans baseline, using Office of National Statistics (ONS) UK emissions. The business loans method has been applied to project finance (excluding Power project finance) and commercial real estate assets, which will be refined in the future as better data becomes available.
6Total UK emissions in 2018 were: 88 MtCO2e from cars and vans; c.100 MtCO2e from homes, including emissions from both electricity and heating; and 263 MtCO2e from business (excluding emissions from electricity used in residential property). Source: Department for Business, Energy and Industrial Strategy - 2018 UK Greenhouse Gas Emissions, Final Figures.
Power sector ambition
In Commercial Banking, the Group has been working to develop a power sector ambition as power sector decarbonisation is critical for the UK to achieve its Net Zero goal.
The Group has determined that its power generation portfolio, comprising Commercial Banking large corporate and project finance portfolio facilities, generated financed emissions of 0.7MtCO2e in 2018, with an emission intensity of 141gCO2e/kWh on a drawn basis, covering both UK and EU exposures. This is lower than the UK average grid emissions intensity of 283 gCO2e/kWh in 2018, due to market leading support for UK offshore and renewable energy.
Having assessed the Commercial Banking large corporate and project finance power generation portfolio against decarbonisation plans and its commitment to Help Britain Prosper, the Group is now setting an ambition to reduce the portfolio’s emission intensity to less than 75gCO2e/kWh by 20301 This is in line with the UK’s net zero ambition but takes into account the combination of UK and European clients in its portfolio.
Achieving the Group’s ambition will be dependent on the UK and European countries putting in place the policy frameworks to meet decarbonisation goals and major utilities achieving their decarbonisation objectives. The Group will work with the Government and its clients to help support this transition.
1The Group has followed the PCAF recommendation to only account for drawn lending exposure in our financed emission disclosure. It is important to highlight that the undrawn portion of the power generation portfolio could result in fluctuations to the emission and power intensity baseline.
Green finance
In 2020, the Group provided over £2.3 billion of green finance in Commercial Banking, through its Clean Growth Finance Initiative, Commercial Real Estate Green Lending Initiative, Renewable Energy Financing and Green Bond facilitation. This increased the Group’s total green finance to over £7.3 billion since 2016. In addition, the Group has supported clients with over £1.8 billion of Sustainability Linked Loans since 2017.
New climate pledges for Lloyds Banking Group’s own operations
In 2019 the Group announced achievement of its 2030 carbon emission reduction goal for its own operations, 11 years early, having reduced carbon emissions by 63 per cent between 2009 and 2019, and exceeding its 60 per cent reduction target. The Group is now able to announce three new operational climate pledges which accelerate the Group’s plan to tackle climate change and apply across its operations.
•The Group expects to achieve net zero carbon operations by 2030. The Group plans to reduce its direct emissions (known as Scope 1 and 2 emissions) by at least 75 per cent (compared to 2018/9 levels)
•The Group expects to reduce its total energy consumption by 50 per cent by 2030 (compared to 2018/9). Whilst the Group already procures zero carbon electricity, it remains crucial that the Group reduces the amount of power it consumes to support the UK in meeting an increasing demand for renewable energy
•The Group expects to maintain travel carbon emissions below 50 per cent of pre COVID-19 (2018/9) levels, embedding for the long-term the reduced levels of commuting and business travel seen during the pandemic and supporting colleagues to switch to low carbon transport.
Achieving these goals will not be easy, and the Group will need to invest in its buildings over the next decade, supporting the UK to make a green recovery. The Group will continue to deploy energy efficient technology including LED lighting and improved building controls. The Group will remove all use of natural gas from its estate, replacing its gas boilers with zero carbon heating technologies and creating more sustainable branches in communities across the UK. Many of the technologies that the Group will need to use are still new and it will need to work closely with its partners and supply chain to innovate.
Scope 1,2 and 3 Greenhouse gas emissions
The Group has reported greenhouse gas emissions and environmental performance since 2009, and since 2013 this has been reported in line with the requirements of the Companies Act 2006 and its applicable regulations. The Group’s total emissions, in tonnes of CO2 equivalent, are reported in the table below. Deloitte LLP has provided limited level ISAE 3000 (Revised) assurance over selected non-financial indicators as noted by ☑ . Deloitte's full, independent assurance statement is available online in the 2020 ESG Report at https://www.lloydsbankinggroup.com/who-we-are/responsible-business/downloads.html
Methodology
The Group follows the principles of the Greenhouse Gas (GHG) Protocol Corporate Accounting and Reporting Standard to calculate Scope 1, 2 and 3 emissions from its worldwide operations. The reporting period is 1 October 2019 to 30 September 2020. Emissions are reported based on the operational control approach.
Reported Scope 1 emissions are those generated from gas and oil used in buildings, emissions from fuels used in UK company owned vehicles used for business travel and fugitive emissions from the use of air conditioning and chiller/refrigerant plant. Reported Scope 2 emissions are generated from the use of electricity and are calculated using both the location and market-based methodologies. Reported Scope 3 emissions relate to business travel and commuting undertaken by colleagues, waste and the extraction and distribution of each of the Group’s energy sources – electricity, gas, and oil. This year, in light of the coronavirus pandemic’s impacts on Group operations, the Group has included the emissions of colleagues working from home before and during the pandemic in the Group’s Scope 3 totals.
Intensity ratio
| | | | | | | | | | | |
| Legacy Scope | Oct19-
Sep20 | Oct18-
Sep19 | Oct17-
Sep18 |
GHG emissions (CO2e) per £m of underlying income (Location Based)1 | 10.4 | 11.5 | 13 |
GHG emissions (CO2e) per £m of underlying income (Market Based)1 | 4.7 | 5.6 | 6.2 |
| | | | | | | | | | | |
| Expanded Scope | Oct19-
Sep20 | Oct18-
Sep19 | Oct17- Sep181 |
GHG emissions (CO2e) per £m of underlying income (Market Based) - expanded scope2 | 13.6 | 15.8 | 17.3 |
GHG emissions (CO2e) per £m of underlying income (Location Based) - expanded scope2 | 7.9 | 9.9 | 10.6 |
1Intensities have been restated for 2017-2018 and 2018-2019 to reflect changes to emissions data only, replacing estimated data with actuals; underlying income figures for those years have not changed.
2Scope 3 emissions have been expanded to include additional elements within the Group’s own operations including emissions from waste, colleague commuting and additional elements of business travel, (including taxis, tube, well to tank emissions of business travel and hotels). We have disclosed these figures parallel to legacy scope numbers to allow fairer comparison to numbers previously disclosed and to demonstrate performance versus our previous targets. Additionally, October 19-September 20 scope 3 figures include an allowance for emissions from homeworkers not previously accounted for, owing to the significant increase in materiality year to year due to the impacts of coronavirus. Previous years have not been restated.
This year, the Group’s overall location-based carbon emissions were 159,487 tCO2e; a 24 per cent decrease since 2019 and 72 per cent against its 2009 baseline (legacy scope). Significant reductions were achieved between October and March of this reporting year. These are attributable to the Group’s programme of environmental action since 2010, which has delivered a reduction in gas and electricity consumption through extensive energy management, alongside decarbonisation of the UK electricity grid from October to March 2020. Further reductions have been caused by the impact of coronavirus on the Group’s operations and reported emissions. A large proportion of the Lloyds Banking Group colleagues worked from home in 2020 in line with travel restrictions and advice, which has led to a considerable reduction in both scope 1 and 3 business travel numbers reported. Group building energy, gas, and electricity, also reduced in part due to the impacts of this operational shift, though impacts are not as significant.
The Group scope 2 market-based emissions figure is zero tCO2e, as it has procured renewable energy certificates equal to its total electricity consumption in each of the markets in which the Group operates since January 2019.
Omissions
Emissions associated with joint ventures and investments are not included in this disclosure as they fall outside the scope of the Lloyds Banking Group operational boundary. The Group does not have any emissions associated with imported heat, steam or imported cooling and is not aware of any other material sources of omissions from its reporting.
Carbon Emissions (tonnes CO2e)
| | | | | | | | | | | |
| Legacy Scope | Oct19-
Sep20 | Oct18- Sep191 | Oct17- Sep181 |
Total CO2e (market-based) ☑ | 71,704 | 101,856 | 116,100 |
Total CO2e (location-based) ☑ | 159,487 | 208,495 | 243,028 |
| Total Scope 1 & 2 (location-based) ☑ | 126,890 | 155,270 | 178,378 |
–Of Which UK Scope 1 & 2 (location-based) | 126,209 | 152,893 | 176,676 |
| Total Scope 1 & 2 (market-based) ☑ | 39,107 | 48,631 | 51,450 |
–Of Which UK Scope 1 & 2 (market-based) | 38,806 | 47,946 | 49,213 |
| Total Scope 1☑ | 39,107 | 48,246 | 49,505 |
| Total Scope 2 (market-based) ☑ | — | 385 | 1,945 |
| Total Scope 2 (location-based) ☑ | 32,597 | 53,225 | 64,650 |
| | | |
| Expanded scope | Oct19-
Sep20 | Oct18- Sep191 | Oct17- Sep181 |
Total CO2e (market-based) ☑ | 120,308 | 180,153 | 197,623 |
Total CO2e (location-based) ☑ | 208,092 | 286,792 | 324,551 |
| Total Scope 3 ☑ | 81,202 | 131,522 | 146,173 |
| | | |
| Global Energy Use (kWhs) | Oct19-
Sep20 | Oct18- Sep191 | Oct17- Sep181 |
| Total Global Energy Use ☑ | 524,024,822 | 591,341,929 | 623,467,500 |
–Of Which UK Energy Use | 518,717,523 | 585,136,101 | 617,185,723 |
| Total Building Energy | 503,709,548 | 551,778,914 | 577,606,213 |
| Total Company Owned Vehicle Energy | 14,436,436 | 29,987,906 | 34,889,251 |
Total Grey Fleet Vehicle Energy2 | 5,878,838 | 9,575,109 | 10,972,036 |
1Restated 2018/2017 emissions data to improve the accuracy of reporting, using actual data to replace estimates.
2Grey fleet refers to colleague and hired road vehicles being used for a business purpose. Emissions in tonnes CO2e in line with the GHG Protocol Corporate Standard (2004). We are reporting to the revised Scope 2 guidance, disclosing a market-based figure in addition to the location-based figure.
The measure and report Scope 1, 2, 3 emissions is provided in the Lloyds Banking Group Reporting Criteria statement available online at www.lloydsbankinggroup.com/who-we-are/responsible-business.html
Scope 1 emissions include mobile and stationary combustion of fuel and operation of facilities.
Scope 2 emissions have been calculated in accordance with GHG Protocol guidelines, in both location and market based methodologies.
Scope 3 emissions reported are disclosed in line with our legacy target, per the expanded to include additional elements within the Group’s own operations including emissions from waste, colleague commuting and additional elements of business travel (including taxis, tube, well to tank emissions of business travel and hotels). We have also disclosed legacy scope numbers to allow fairer comparison to numbers previously disclosed and to demonstrate performance versus our previous targets.
☑ Indicator is subject to Limited ISAE3000 (revised) assurance by Deloitte LLP for the 2020 Annual Responsible Business Reporting. Deloitte’s 2020 assurance statement and the 2020 Reporting Criteria are available online at www.lloydsbankinggroup.com/who-we-are/responsible-business.html
Energy Efficiency
Whilst coronavirus has significantly impacted Lloyds Banking Group's energy performance year on year, the Group did see a 4 per cent year to year energy consumption reduction achieved in a 6-month period prior to the impacts of coronavirus, largely due to the Group’s energy reduction initiatives. These initiatives include an energy optimisation programme; an energy intervention scheme that includes remote and on-site optimisation and strategic alterations of building management systems and controls systems to match the run hours of plant to core operating hours and ensure temperature settings are aligned with Group comfort guidelines. In 2020, 89 deep-dives, 88 on-site optimisations, 13 remote optimisations and 550 bank holiday programming were completed, which resulted in a 105 GWh saving. Additionally, Lloyds Banking Group saw a 14 per cent year to year energy reduction in our company owned vehicles energy usage in the 6-month period prior to April 2020, due to our ongoing focus on reducing business travel.
Looking forward
In 2021, Lloyds Banking Group will continue to develop additional sector-based ambitions to support its goal to help reduce the emissions it finances by more than 50 per cent by 2030. The Group will continue to enhance its methodologies and framework for reporting climate risks and opportunities, taking into account relevant industry guidelines and regulatory reporting requirements. This will further advance the Group disclosures and respond to the evolving needs of both its shareholders and other stakeholders.
PROPERTIES
At 31 December 2020, Lloyds Bank Group occupied 1,724 properties in the UK. Of these, 367 were held as freeholds and 1,357 as leasehold. The majority of these properties are retail branches, widely distributed throughout England, Scotland, Wales and Northern Ireland. Other buildings include the Lloyds Bank’s head office in the City of London with other customer service and support centres located to suit business needs but clustered largely in eight core geographic conurbations – London, Edinburgh, Glasgow, Midlands (Birmingham), Northwest (Chester and Manchester), West Yorkshire (Halifax and Leeds), South (Brighton and Andover) and Southwest (Bristol and Cardiff).
In addition, there are 103 properties which are either sub-let or vacant. There are also a number of Automated Teller Machine (ATM) units situated throughout the UK, the majority of which are held as leasehold. The Group also has business operations elsewhere in the world, primarily holding property on a leasehold basis.
LEGAL ACTIONS AND REGULATORY MATTERS
During the ordinary course of business the Lloyds Bank Group is subject to threatened or actual legal proceedings and regulatory reviews and investigations both in the UK and overseas. Set out below is a summary of the more significant matters.
PROVISIONS FOR FINANCIAL COMMITMENTS AND GUARANTEES
Provisions are recognised for expected credit losses on undrawn loan commitments and financial guarantees.
PAYMENT PROTECTION INSURANCE (EXCLUDING MBNA)
The Group has made provisions for PPI costs totalling £21,906 million; of which £85 million was recognised in the final quarter of the year ended 31 December 2020. Of the approximately six million enquiries received pre-deadline, more than 99 per cent have now been processed. The £85 million charge in the fourth quarter was driven by the impact of coronavirus delaying operational activities during 2020, the final stages of work to ensure operational completeness ahead of an orderly programme close and final validation of information requests and complaints with third parties that resulted in a limited number of additional complaints to be handled. A small part of the costs incurred during the year also reflect the costs associated with litigation activity to date.
At 31 December 2020, a provision of £198 million remained unutilised relating to complaints and associated administration costs excluding amounts relating to MBNA. Total cash payments were £1,459 million during the year ended 31 December 2020.
PAYMENT PROTECTION INSURANCE (MBNA)
As announced in December 2016, the Group's exposure continues to remain capped at £240 million under the terms of the MBNA sale and purchase agreement. No additional charge has been made by MBNA to its PPI provision in the year ended 31 December 2020; total cash payments in the year were £241 million and the remaining provision at 31 December 2020 was £61 million (31 December 2019: £302 million).
OTHER PROVISIONS FOR LEGAL ACTIONS AND REGULATORY MATTERS
In the course of its business, the Group is engaged in discussions with the PRA, FCA and other UK and overseas regulators and other governmental authorities on a range of matters. The Group also receives complaints in connection with its past conduct and claims brought by or on behalf of current and former employees, customers, investors and other third parties and is subject to legal proceedings and other legal actions. Where significant, provisions are held against the costs expected to be incurred in relation to these matters and matters arising from related internal reviews. During the year ended 31 December 2020 the Group charged a further £329 million in respect of legal actions and other regulatory matters, and the unutilised balance at 31 December 2020 was £261 million (31 December 2019: £395 million). The most significant items are as follows.
HBOS Reading – review
The Group completed its compensation assessment for those within the Customer Review in 2019 with more than £109 million of compensation paid, in addition to £15 million for ex-gratia payments and £6 million for the reimbursement of legal fees. The Group is applying the recommendations from Sir Ross Cranston’s review, issued in December 2019, including a reassessment of direct and consequential losses by an independent panel, an extension of debt relief and a wider definition of de facto directors. Further details of the panel were announced on 3 April 2020 and the panel's full scope and methodology was published on 7 July 2020. The panel’s stated objective is to consider cases via a non-legalistic and fair process, and to make their decisions in a generous, fair and common-sense manner. Details of an appeal process for the further assessments of debt relief and de facto director status have also been announced. The Group continues to make progress on its assessment of claims for further debt relief and de facto director status, completing preliminary assessments for 98 per cent of claims on both debt relief and de facto directors. As part of these activities the Group has recorded charges in relation to compensation payments and associated costs (projected to the fourth quarter of 2021) in 2020 in applying the recommendations, in respect of debt relief and de facto director status. During 2021, decisions from the independent panel re-review on direct and consequential losses will start to be issued, which is likely to result in further charges but it is not possible to estimate the potential impact at this stage. The Group is committed to implementing Sir Ross' recommendations in full.
The Dame Linda Dobbs review, which is considering the Group’s handling of HBOS Reading between January 2009 and January 2017, is now expected to complete towards the end of 2021. The cost of undertaking the review is included in the revised provision.
The 2020 charge of £159 million, and lifetime cost of £435 million, includes both compensation payments and operational costs.
Arrears handling related activities
The Group has provided an additional £35 million in the year ended 31 December 2020 for arrears handling related activities, bringing the total provided to date to £1,016 million; the unutilised balance at 31 December 2020 was £62 million.
INTERCHANGE FEES
With respect to multi-lateral interchange fees (MIFs), the Lloyds Banking Group is not involved in the ongoing litigation which involves card schemes such as Visa and Mastercard (as described below). However, the Group is a member/licensee of Visa and Mastercard and other card schemes. The litigation in question is as follows:
–litigation brought by retailers against both Visa and Mastercard continues in the English Courts (and includes a judgment of the Supreme Court in June 2020 upholding the Court of Appeal's finding in 2018 that historic interchange arrangements of Mastercard and Visa infringed competition law); and
–litigation brought on behalf of UK consumers in the English Courts against Mastercard, which the Supreme Court has now confirmed can proceed.
Any impact on the Group of the litigation against Visa and Mastercard remains uncertain at this time, such that it is not practicable for the Group to provide an estimate of any potential financial effect. Insofar as Visa is required to pay damages to retailers for interchange fees set prior to June 2016, contractual arrangements to allocate liability have been agreed between various UK banks (including the Lloyds Banking Group) and Visa Inc, as part of Visa Inc’s acquisition of Visa Europe in 2016. These arrangements cap the maximum amount of liability to which the Lloyds Banking Group may be subject and this cap is set at the cash consideration received by the Lloyds Banking Group for the sale of its stake in Visa Europe to Visa Inc in 2016. In 2016, the Group received Visa preference stock as part of the consideration for the sale of its shares in Visa Europe. In 2020, some of these Visa preference shares were converted into Visa Inc Class A common stock (in accordance with the provisions of the Visa Europe sale documentation) and they were subsequently sold by the Group. The sale had no impact on this contingent liability.
LIBOR AND OTHER TRADING RATES
Certain Lloyds Banking Group companies, together with other panel banks, have been named as defendants in private lawsuits, including purported class action suits, in the US in connection with their roles as panel banks contributing to the setting of US Dollar, Japanese Yen and Sterling London Interbank Offered Rate and the Australian BBSW reference rate. Certain of the plaintiffs' claims have been dismissed by the US Federal Court for the Southern District of New York (subject to appeals).
Certain Lloyds Banking Group companies are also named as defendants in (i) UK based claims; and (ii) two Dutch class actions, raising LIBOR manipulation allegations. A number of the claims against the Lloyds Banking Group in relation to the alleged mis-sale of interest rate hedging products also include allegations of LIBOR manipulation.
Furthermore, the Swiss Competition Commission concluded its investigation against Lloyds Bank plc in June 2019. However, the Lloyds Banking Group continues to respond to litigation arising out of the investigations into submissions made by panel members to the bodies that set LIBOR and various other interbank offered rates.
It is currently not possible to predict the scope and ultimate outcome on the Lloyds Banking Group of the various outstanding regulatory investigations not encompassed by the settlements, any private lawsuits or any related challenges to the interpretation or validity of any of the Lloyds Banking Group's contractual arrangements, including their timing and scale. As such, it is not practicable to provide an estimate of any potential financial effect.
TAX AUTHORITIES
The Lloyds Banking Group has an open matter in relation to a claim for group relief of losses incurred in its former Irish banking subsidiary, which ceased trading on 31 December 2010. In 2013, HMRC informed the Lloyds Banking Group that its interpretation of the UK rules means that the group relief is not available. In 2020, HMRC concluded their enquiry into the matter and issued a closure notice. The Lloyds Banking Group's interpretation of the UK rules has not changed and hence it has appealed to the First Tier Tax Tribunal, with a hearing expected in early 2022. If the final determination of the matter by the judicial process is that HMRC’s position is correct, management estimate that this would result in an increase in current tax liabilities of approximately £700 million (including interest) and a reduction in deferred tax assets of approximately £270 million. The Lloyds Banking Group, having taken appropriate advice, does not consider that this is a case where additional tax will ultimately fall due.
There are a number of other open matters on which the Group is in discussions with HMRC (including the tax treatment of certain costs arising from the divestment of TSB Banking Group plc), none of which is expected to have a material impact on the financial position of the Group.
CONTINGENT LIABILITIES RELATING TO OTHER LEGAL ACTIONS AND REGULATORY MATTERS
In addition, during the ordinary course of business the Group is subject to other complaints and threatened or actual legal proceedings (including class or group action claims) brought by or on behalf of current or former employees, customers, investors or other third parties, as well as legal and regulatory reviews, challenges, investigations and enforcement actions, both in the UK and overseas. All material such matters are periodically reassessed, with the assistance of external professional advisers where appropriate, to determine the likelihood of the Group incurring a liability. In those instances where it is concluded that it is more likely than not that a payment will be made, a provision is established to management's best estimate of the amount required at the relevant balance sheet date. In some cases it will not be possible to form a view, for example because the facts are unclear or because further time is needed properly to assess the merits of the case, and no provisions are held in relation to such matters. In these circumstances, specific disclosure in relation to a contingent liability will be made where material. However the Group does not currently expect the final outcome of any such case to have a material adverse effect on its financial position, operations or cash flows.
OPERATING AND FINANCIAL REVIEW AND PROSPECTS
The results discussed below are not necessarily indicative of Lloyds Bank Group’s results in future periods. The following information contains certain forward looking statements. For a discussion of certain cautionary statements relating to forward looking statements, see Forward looking statements.
The following discussion is based on and should be read in conjunction with the consolidated financial statements and the related notes thereto included elsewhere in this annual report. For a discussion of the accounting policies used in the preparation of the consolidated financial statements, see Accounting policies in note 2 to the financial statements.
TABLE OF CONTENTS
OPERATING AND FINANCIAL REVIEW AND PROSPECTS
CRITICAL ACCOUNTING POLICIES
The preparation of financial statements requires management to make estimates and assumptions that affect amounts reported therein. Due to the inherent uncertainty involved in making estimates, actual results reported in future periods may be based upon amounts which differ from those estimates.
The accounting policies that are deemed critical to the Lloyds Bank Group’s results and financial position, based upon materiality and significant judgements and estimates, are set out in note 3 to the financial statements.
FUTURE ACCOUNTING DEVELOPMENTS
Future developments in relation to the Lloyds Bank Group’s IFRS reporting are discussed in note 47 to the financial statements.
OPERATING AND FINANCIAL REVIEW AND PROSPECTS
RESULTS OF OPERATIONS – 2020 AND 2019
SUMMARY
| | | | | | | | |
| 2020 | 2019 |
| £m | £m |
| Net interest income | 10,770 | | 12,220 | |
| Other income | 3,815 | | 4,388 | |
| Total income | 14,585 | | 16,608 | |
| Total operating expenses | (9,196) | | (11,123) | |
| Impairment | (4,060) | | (1,362) | |
| Profit before tax | 1,329 | | 4,123 | |
| Tax credit (expense) | 137 | | (1,287) | |
| Profit for the year | 1,466 | | 2,836 | |
| | |
| Profit attributable to ordinary shareholders | 1,023 | | 2,515 | |
| Profit attributable to other equity holders | 417 | | 281 | |
| Profit attributable to equity holders | 1,440 | | 2,796 | |
| Profit attributable to non-controlling interests | 26 | | 40 | |
| Profit for the year | 1,466 | | 2,836 | |
INCOME STATEMENT COMMENTARY
During the year ended 31 December 2020, the Lloyds Bank Group recorded a profit before tax of £1,329 million, a reduction of £2,794 million, or 68 per cent, compared with £4,123 million in 2019; the decrease reflected, in particular, the Group's revised economic outlook for the UK following the outbreak of the coronavirus pandemic.The Lloyds Bank Group profit before tax for the year ended 31 December 2020 included a profit before tax of £1,856 million from its Retail division, a 16 per cent decrease compared to 2019, as lower income and a higher impairment charge have more than offset reduced provisions for conduct risk; and a profit before tax of £20 million from its Commercial Banking division.
Total income decreased by £2,023 million, or 12 per cent, to £14,585 million in 2020 compared with £16,608 million in 2019, reflecting reductions in both net interest income and other income.
Net interest income was £10,770 million in 2020, a decrease of £1,450 million, or 12 per cent compared to £12,220 million in 2019. Average interest earning banking assets increased by £19,263 million, or 3 per cent, to £573,514 in 2020 compared to £554,251 million in 2019 as a result of increased placings with central banks and growth in reverse repurchase agreement balances. Average customer lending was stable; the impact of increased balances due from SMEs under the UK Government-backed coronavirus support schemes and growth in the open mortgage book was offset by lower balances in the closed mortgage book and credit cards, as well as the continued optimisation of the Corporate and Institutional book within Commercial Banking. The net interest margin decreased, reflecting the lower rate environment, actions taken during the year to support customers and a change in asset mix, largely as a result of reduced levels of customer demand during the coronavirus pandemic.
Other income was £573 million, or 13 per cent, lower at £3,815 million in 2020 compared to £4,388 million in 2019.
Fee and commission income was £439 million, or 19 per cent, lower at £1,924 million compared to £2,363 million in 2019 as a result of decreases across most categories of fees reflecting reductions in business and transaction volumes as a result of the coronavirus pandemic as well as the impact of the transfer of business into the Lloyds Banking Group’s wealth management joint venture in 2019. Fee and commission expense decreased by £118 million, or 11 per cent, to £909 million compared with £1,027 million in 2019; interchange fees were lower as a result of reduced customer usage of ATMs during the pandemic and there were reductions in card and other fees payable. Net trading income was £390 million higher at £750 million in 2020 compared with £360 million in 2019, reflecting the change in fair value of interest rate derivatives and foreign exchange contracts in the banking book not mitigated through hedge accounting. Other operating income was £642 million, or 24 per cent, lower at £2,050 million in 2020 compared to £2,692 million in 2019, reflecting a lower level of operating lease rental income, following a reduction in the Lex vehicle fleet size, increased losses on liability management exercises and a lower level of cost recharges to other Lloyds Banking Group entities.
Operating expenses decreased by £1,927 million, or 17 per cent to £9,196 million in 2020 compared with £11,123 million in 2019 reflecting a decrease of £1,776 million in charges for redress payments to customers in respect of PPI and other conduct related matters . Excluding these charges from both years, operating expenses were £151 million, or 2 per cent, lower at £8,782 million in 2020 compared to £8,933 million in 2019. Staff costs were £370 million, or 9 per cent, lower at £3,615 million in 2020 compared with £3,985 million in 2019. This reflects a reduction in staff numbers, significantly lower accruals in respect of staff bonuses and reduced levels of agency staff only partly offset by higher redundancy costs. Premises and equipment costs were £21 million lower at £425 million in 2020 compared with £446 million in 2019 reflecting increased gains on the disposal of tangible fixed assets, only partly offset by the cost of making the Group's premises COVID-secure. Other expenses were £168 million, or 9 per cent, higher at £2,068 million in 2020 compared with £1,900 million in 2019 mainly reflecting increased investment spend and cost recharges from Lloyds Banking Group plc. Depreciation and amortisation costs were £68 million, or 3 per cent, higher at £2,670 million in 2020 compared to £2,602 million in 2019 due to increased levels of software capitalisation.
The Group incurred a regulatory provisions charge in operating expenses of £414 million in 2020 compared to £2,190 million in 2019. Of this amount £85 million related to payment protection insurance; this charge was driven by the impact of coronavirus delaying operational activities during 2020, the final stages of work to ensure operational completeness and final validation of information requests and complaints with third parties that resulted in a limited number of additional complaints to be handled. Of the approximately six million enquiries received pre-deadline, more than 99 per cent have now been processed. A small part of the costs incurred during the year also reflect the costs associated with litigation activity to date. The unutilised provision, excluding MBNA, at 31 December 2020 was £198 million The charge in relation to other conduct issues was £329 million in 2020, compared to £395 million in 2019. During the year additional charges, both redress and operational costs of £159 million, have been taken in relation to HBOS Reading, as well as further costs in relation to arrears handling, packaged bank account complaints and various settlements in relation to historic claims. A number of programmes are now close to conclusion. Others, such as HBOS Reading, including the conclusion of the recommendations from the Cranston Review, are still ongoing and further costs are likely to be incurred.
OPERATING AND FINANCIAL REVIEW AND PROSPECTS
Impairment losses increased by £2,698 million to £4,060 million in 2020 compared with £1,362 million in 2019. Impairment losses in respect of loans and advances to customers were £2,458 million higher due primarily to an increase in expected credit loss (ECL) allowances taken to reflect the deterioration in the UK economic outlook as a consequence of the coronavirus pandemic and further charges taken on existing distressed clients whose recovery strategies were affected more immediately. Aside from these distressed cases, observed credit performance has remained stable, in part as a result of the continued effectiveness of government support schemes and payment holidays extended by the Group. Additional funding has been made available to businesses impacted by lockdown restrictions which has prevented a more material increase in business failures and unemployment.
Whilst these measures have resulted in the flow of assets into arrears, default and write-off remaining at low levels, significant ECL provisions have been built up in anticipation that these support schemes will unwind with a consequent increase in unemployment and insolvencies. The Group's total ECL allowance has therefore increased from £3,380 million to £6,132 million in the year, with the majority of the increase in provisions for up to date assets in Stage 1 and Stage 2. A central overlay of £400 million has been included in recognition of the significant uncertainty that remains as to the efficacy of the vaccine, the vaccination programme, potential virus mutation, further lockdowns and economic performance post lockdown restrictions and Government support, recognising that the full range of these risks is not captured in the Group's method of generating alternative scenarios around its base case. The scale of the current uncertainty overlay approximately equates to a c.1 percentage point increase in unemployment allied with a 5 per cent lower HPI in 2021, or a c.10 percentage point higher weighting of the severe downside scenario.
The Group’s closing ECL allowance continues to reflect a probability-weighted view of future economic scenarios with a 30 per cent weighting applied to base case, upside and downside scenarios and a 10 per cent weighting to the severe downside. All scenarios have deteriorated since the start of the year, following the changes made to the base case. They also reflect a widening of the range of potential outcomes, following changes to the generation of scenarios around the base case. Overall the Group’s loan portfolio continues to be well-positioned, reflecting a prudent through-the-cycle approach to credit risk and high levels of security. The Retail portfolio is heavily weighted toward high quality mortgage lending where low loan-to-value ratios provide security against potential risks. The prime consumer finance portfolio also benefits from high quality growth in past periods in the context of the Group’s prudent risk appetite. The commercial portfolio reflects a diverse client base with relatively limited exposure to the most vulnerable sectors so far affected by the coronavirus outbreak. Within Commercial Banking, the Group’s management of concentration risk includes single name and country limits as well as controls over the overall exposure to certain higher risk and vulnerable sectors or asset classes.
In 2020, the Lloyds Bank Group recorded a tax credit of £137 million compared to a tax expense of £1,287 million in 2019. The tax credit in 2020 arose primarily as a result of a credit of £435 million on remeasurement of the Group’s deferred tax balances following the UK Government’s decision to maintain the corporation tax rate at 19 per cent, which was substantively enacted on 17 March 2020.
The Lloyds Bank Group’s post-tax return on average total assets reduced to 0.24 per cent compared to 0.48 per cent in the year ended 31 December 2019.
OPERATING AND FINANCIAL REVIEW AND PROSPECTS
BALANCE SHEET AND CAPITAL COMMENTARY
| | | | | | | | | | | |
| 2020 | | 2019 |
| £m | | £m |
| Assets | | | |
| Cash and balances at central banks | 49,888 | | | 38,880 | |
| Financial assets at fair value through profit or loss | 1,674 | | | 2,284 | |
| Derivative financial instruments | 8,341 | | | 8,494 | |
| Loans and advances to banks | 5,950 | | | 4,852 | |
| Loans and advances to customers | 480,141 | | | 474,470 | |
| Debt securities | 5,137 | | | 5,325 | |
| Due from fellow Lloyds Banking Group undertakings | 738 | | | 1,854 | |
| Financial assets at amortised cost | 491,966 | | | 486,501 | |
| Financial assets at fair value through other comprehensive income | 27,260 | | | 24,617 | |
| Other assets | 20,810 | | | 20,592 | |
| Total assets | 599,939 | | | 581,368 | |
| | | |
| Liabilities | | | |
| Deposits from banks | 24,997 | | | 23,593 | |
| Customer deposits | 434,569 | | | 396,839 | |
| Due to fellow Lloyds Banking Group undertakings | 6,875 | | | 4,893 | |
| Financial liabilities at fair value through profit or loss | 6,831 | | | 7,702 | |
| Derivative financial instruments | 8,228 | | | 9,831 | |
| Debt securities in issue | 59,293 | | | 76,431 | |
| Subordinated liabilities | 9,242 | | | 12,586 | |
| Other liabilities | 8,786 | | | 10,594 | |
| Total liabilities | 558,821 | | | 542,469 | |
| Shareholders’ equity | 35,105 | | | 33,973 | |
| Other equity instruments | 5,935 | | | 4,865 | |
| Non-controlling interests | 78 | | | 61 | |
| Total equity | 41,118 | | | 38,899 | |
| Total equity and liabilities | 599,939 | | | 581,368 | |
Total assets were £18,571 million, or 3 per cent, higher at £599,939 million at 31 December 2020 compared to £581,368 million at 31 December 2019. Cash and balances at central banks were £11,008 million, or 28 per cent, higher at £49,888 million compared to £38,880 million at 31 December 2019, reflecting increased liquidity holdings following the inflow of customer deposits. Loans and advances to customers increased in the year by £5,671 million to £480,141 million, compared to £474,470 million at 31 December 2019, due to an increase in reverse repurchase agreements, held for liquidity purposes, growth in lending to SMEs and in the open mortgage book which was in part offset by lower levels of other commercial lending, lower credit card balances and unsecured loans and the continued reduction in the Group's closed mortgage book.
Total liabilities were £16,352 million, or 3 per cent, higher at £558,821 million compared to £542,469 million at 31 December 2019. Customer deposits were £37,730 million, or 10 per cent, higher at £434,569 million at 31 December 2020 compared to £396,839 million at 31 December 2019. There has been significant growth in retail current account and savings balances, reflecting reduced consumer spending during the coronavirus pandemic, and in commercial current accounts, as businesses have built up funds to cope with the pandemic, which has only partly been offset by lower levels of other commercial deposits. Debt securities in issue were £17,138 million lower at £59,293 million at 31 December 2020 compared to £76,431 million at 31 December 2019 as the availability of Government support and liquidity measures and increased levels of customer deposits have reduced the need for new funding issuance.
Total equity has increased by £2,219 million, or 6 per cent, from £38,899 million at 31 December 2019 to £41,118 million at 31 December 2020 as a result of retained profits and the issuance of £1,070 million of other equity instruments.
Lloyds Bank Group’s common equity tier 1 capital ratio increased to 15.5 per cent from 14.3 per cent at 31 December 2019 largely reflecting profits for the year, with the impact of the impairment charge partially mitigated through the increase in IFRS 9 transitional relief for capital. The introduction of the revised capital treatment of intangible software assets also resulted in a significant reduction in intangible assets deducted from capital. In addition, risk-weighted assets reduced and excess expected losses reduced to nil as they absorbed part of the increase in IFRS 9 expected credit losses. The resultant increases in capital were offset in part by pension contributions made during the year, an increase in deferred tax assets deducted from capital and the accrual for foreseeable dividends.
The tier 1 capital ratio increased to 19.8 per cent from 18.3 per cent at 31 December 2019, primarily reflecting the increase in common equity tier 1 capital and new AT1 issuances, offset in part by the annual reduction in the transitional limit applied to grandfathered AT1 capital.
The total capital ratio increased to 23.5 per cent from 22.1 per cent at 31 December 2019, which largely reflected the increase in tier 1 capital.
Risk-weighted assets reduced by £1,078 million, or 1 per cent, to £170,862 million at 31 December 2020, compared to £171,940 million at 31 December 2019. Increases reflecting the impact of credit migrations, model calibrations and updates, the full implementation of the new securitisation framework and the introduction of the revised capital treatment of intangible software assets were more than offset by reductions in lending balances outside Government-backed schemes, optimisation activity undertaken in Commercial Banking and the impact of the revised SME supporting factor. In addition operational risk-weighted assets have reduced.
OPERATING AND FINANCIAL REVIEW AND PROSPECTS
The PRA is consulting on a proposal to reverse the revised capital treatment of intangible software assets (which currently follows EU capital regulations), thereby reinstating the original requirement to deduct in full. Excluding the impact of the revised capital treatment Lloyds Bank Group's common equity tier 1 capital ratio would be 15.0 per cent.
RESULTS OF OPERATIONS – 2018
The Lloyds Bank Group’s results for the year ended 31 December 2018, and a discussion of the results for the year ended 31 December 2019 compared to those for the year ended 31 December 2018, were included on pages 13 to 15 of the 2019 Annual Report on Form 20-F, filed on 23 March 2020.
OPERATING AND FINANCIAL REVIEW AND PROSPECTS
AVERAGE BALANCE SHEET AND INTEREST INCOME AND EXPENSE – CONTINUING OPERATIONS
| | | | | | | | | | | | | | | | | | | | | | | | | | | | | | | | | | | |
| 2020 | | 2019 | | 2018 |
| Average
balance | Interest
income | Yield | | Average
balance | Interest
income | Yield | | Average
balance | Interest
income | Yield |
| £m | £m | % | | £m | £m | % | | £m | £m | % |
Assets1 | | | | | | | | | | | |
| Financial assets at amortised cost: | | | | | | | | | | | |
| Loans and advances to banks | 57,610 | | 114 | | 0.20 | | | 47,490 | | 269 | | 0.57 | | | 60,692 | | 462 | | 0.76 | |
| Loans and advances to customers | 483,906 | | 13,358 | | 2.76 | | | 475,385 | | 15,281 | | 3.21 | | | 466,560 | | 15,049 | | 3.23 | |
| Debt securities | 5,046 | | 92 | | 1.82 | | | 5,223 | | 118 | | 2.26 | | | 4,111 | | 66 | | 1.61 | |
| Financial assets at fair value through other comprehensive income | 26,952 | | 302 | | 1.12 | | | 26,153 | | 430 | | 1.64 | | | 32,206 | | 639 | | 1.98 | |
| Total interest-earning assets of banking book | 573,514 | | 13,866 | | 2.42 | | | 554,251 | | 16,098 | | 2.90 | | | 563,569 | | 16,216 | | 2.88 | |
| Total interest-earning financial assets at fair value through profit or loss | 2,319 | | 26 | | 1.12 | | | 8,354 | | 73 | | 0.87 | | | 34,759 | | 434 | | 1.25 | |
| Total interest-earning assets | 575,833 | | 13,892 | | 2.41 | | | 562,605 | | 16,171 | | 2.87 | | | 598,328 | | 16,650 | | 2.78 | |
| Allowance for impairment losses on financial assets held at amortised cost | (5,332) | | | | | (3,354) | | | | | (2,994) | | | |
| Non-interest earning assets | 34,375 | | | | | 30,671 | | | | | 38,986 | | | |
| Total average assets and interest income | 604,876 | | 13,892 | | 2.30 | | | 589,922 | | 16,171 | | 2.74 | | | 634,320 | | 16,650 | | 2.62 | |
1.The line items below are included on the face of the Group's balance sheet.
| | | | | | | | | | | | | | | | | | | | | | | | | | | | | | | | | | | |
| 2020 | | 2019 | | 2018 |
| Average
interest
earning
assets | Net
interest
income | Net
interest
margin | | Average
interest
earning
assets | Net
interest
income | Net
interest
margin | | Average
interest
earning
assets | Net
interest
income | Net
interest
margin |
| £m | £m | % | | £m | £m | % | | £m | £m | % |
| Average interest-earning assets and net interest income: | | | | | | | | | | | |
| Banking business | 573,514 | | 10,770 | | 1.88 | | | 554,251 | | 12,220 | | 2.20 | | | 563,569 | | 12,754 | | 2.26 | |
| Trading securities and other financial assets at fair value through profit or loss | 2,319 | | (80) | | (3.45) | | | 8,354 | | (77) | | (0.92) | | | 34,759 | | (63) | | (0.18) | |
| 575,833 | | 10,690 | | 1.86 | | | 562,605 | | 12,143 | | 2.16 | | | 598,328 | | 12,691 | | 2.12 | |
OPERATING AND FINANCIAL REVIEW AND PROSPECTS
| | | | | | | | | | | | | | | | | | | | | | | | | | | | | | | | | | | |
| 2020 | | 2019 | | 2018 |
| Average
balance | Interest
expense | Cost | | Average
balance | Interest
expense | Cost | | Average
balance | Interest
expense | Cost |
| £m | £m | % | | £m | £m | % | | £m | £m | % |
Liabilities and shareholders’ funds1 | | | | | | | | | | | |
| Deposits by banks | 6,866 | | 82 | | 1.19 | | | 6,262 | | 87 | | 1.39 | | | 5,973 | | 81 | | 1.36 | |
| Customer deposits | 316,071 | | 1,270 | | 0.40 | | | 315,717 | | 2,054 | | 0.65 | | | 331,006 | | 1,997 | | 0.60 | |
| Liabilities to banks and customers under sale and repurchase agreements | 32,189 | | 117 | | 0.36 | | | 27,935 | | 301 | | 1.08 | | | 28,163 | | 245 | | 0.87 | |
Debt securities in issue2 | 67,239 | | 761 | | 1.13 | | | 67,096 | | 476 | | 0.71 | | | 67,233 | | 66 | | 0.10 | |
| Lease liabilities | 1,656 | | 39 | | 2.36 | | | 1,617 | | 39 | | 2.41 | | | 41 | | 1 | | 2.44 | |
| Subordinated liabilities | 11,510 | | 827 | | 7.19 | | | 9,315 | | 921 | | 9.89 | | | 10,531 | | 1,072 | | 10.18 | |
| Total interest-bearing liabilities of banking book | 435,531 | | 3,096 | | 0.71 | | | 427,942 | | 3,878 | | 0.91 | | | 442,947 | | 3,462 | | 0.78 | |
| Total interest-bearing financial liabilities at fair value through profit or loss | 7,824 | | 106 | | 1.35 | | | 10,053 | | 150 | | 1.49 | | | 38,133 | | 497 | | 1.30 | |
| Total interest-bearing liabilities | 443,355 | | 3,202 | | 0.72 | | | 437,995 | | 4,028 | | 0.92 | | | 481,080 | | 3,959 | | 0.82 | |
| Interest-free liabilities | | | | | | | | | | | |
| Non-interest bearing customer accounts | 95,629 | | | | | 74,130 | | | | | 72,428 | | | |
| Other interest-free liabilities | 24,867 | | | | | 37,147 | | | | | 35,883 | | | |
| Non-controlling interests, other equity instruments and shareholders’ funds | 41,025 | | | | | 40,650 | | | | | 44,929 | | | |
| Total average liabilities and interest expense | 604,876 | | 3,202 | | 0.53 | | | 589,922 | | 4,028 | | 0.68 | | | 634,320 | | 3,959 | | 0.62 | |
1The line items below are included on the face of the Group’s balance sheet except for liabilities to banks and customers under sale and repurchase agreements, which are disclosed in note 42; and lease liabilities which are disclosed in note 27.
2The impact of the Group’s hedging arrangements is included on this line; excluding this impact the weighted average effective interest rate in respect of debt securities in issue would be 2.42 per cent (2019: 2.25 per cent; 2018: 2.74 per cent).
Average balances are based on daily averages for the principal areas of the Group’s banking activities with monthly or less frequent averages used elsewhere. Management believes that the interest rate trends are substantially the same as they would be if all balances were averaged on the same basis.
The Group’s operations are predominantly UK-based and as a result an analysis between UK and non-UK activities is not provided.
OPERATING AND FINANCIAL REVIEW AND PROSPECTS
CHANGES IN NET INTEREST INCOME – VOLUME AND RATE ANALYSIS – CONTINUING OPERATIONS
The following table allocates changes in net interest income between volume, rate and their combined impact for 2020 compared with 2019 and for 2019 compared with 2018.
| | | | | | | | | | | | | | | | | | | | | | | | | | | | | |
| 2020 compared with 2019
increase/(decrease) | | 2019 compared with 2018
increase/(decrease) |
| Total change | Change in
volume | Change in
rates | Change in
rates and
volume | | Total change | Change in
volume | Change in
rates | Change in
rates and
volume |
| £m | £m | £m | £m | | £m | £m | £m | £m |
| Interest income | | | | | | | | | |
| At amortised cost: | | | | | | | | | |
| Loans and advances to banks | (155) | | 57 | | (175) | | (37) | | | (193) | | (100) | | (119) | | 26 | |
| Loans and advances to customers | (1,923) | | 274 | | (2,158) | | (39) | | | 232 | | 285 | | (52) | | (1) | |
| Debt securities | (26) | | (4) | | (23) | | 1 | | | 52 | | 18 | | 27 | | 7 | |
| Financial assets at fair value through other comprehensive income | (128) | | 13 | | (137) | | (4) | | | (209) | | (121) | | (109) | | 21 | |
| Total banking book interest income | (2,232) | | 340 | | (2,493) | | (79) | | | (118) | | 82 | | (253) | | 53 | |
| Total interest income on financial assets at fair value through profit or loss | (47) | | (53) | | 21 | | (15) | | | (361) | | (330) | | (130) | | 99 | |
| Total interest income | (2,279) | | 287 | | (2,472) | | (94) | | | (479) | | (248) | | (383) | | 152 | |
| Interest expense | | | | | |
| | | |
| Deposits by banks | (5) | | 8 | | (12) | | (1) | | | 6 | | 4 | | 2 | | — | |
| Customer deposits | (784) | | 2 | | (785) | | (1) | | | 57 | | (92) | | 156 | | (7) | |
| Liabilities to banks and customers under sale and repurchase agreements | (184) | | 45 | | (199) | | (30) | | | 56 | | (2) | | 58 | | — | |
| Debt securities in issue | 285 | | 1 | | 283 | | 1 | | | 410 | | — | | 411 | | (1) | |
| Lease liabilities | — | | 1 | | (1) | | — | | | 38 | | 38 | | — | | — | |
| Subordinated liabilities | (94) | | 217 | | (252) | | (59) | | | (151) | | (124) | | (31) | | 4 | |
| Total banking book interest expense | (782) | | 274 | | (966) | | (90) | | | 416 | | (176) | | 596 | | (4) | |
| Total interest expense on financial liabilities at fair value through profit or loss | (44) | | (33) | | (14) | | 3 | | | (347) | | (366) | | 72 | | (53) | |
| Total interest expense | (826) | | 241 | | (980) | | (87) | | | 69 | | (542) | | 668 | | (57) | |
OPERATING AND FINANCIAL REVIEW AND PROSPECTS
RISK OVERVIEW
EFFECTIVE RISK MANAGEMENT AND CONTROL
Our approach to risk
Lloyds Bank Group adopts the Lloyds Banking Group enterprise risk management framework supplemented by additional management and control activities to address the Lloyds Bank Group's specific requirements.
The Group seeks to protect our customers, colleagues, the Group, investors and society, while enabling sustainable growth. This is achieved through informed risk decision-making and robust risk management, supported by a consistent risk-focused culture.
A prudent approach to risk is fundamental to our business model and drives our participation choices.
The risk management section from pages 24 to 74 provides an in-depth picture of how risk is managed within the Group, including the approach to stress testing, risk governance, committee structure, risk appetite and detailed analysis of the principal risk categories, the framework by which risks are identified, managed, mitigated and monitored.
Our enterprise risk management framework
Risks are identified, managed, mitigated and monitored using Lloyds Banking Group's comprehensive enterprise risk management framework. This is the foundation for the delivery of effective risk control.
The Group's risk appetite, principles, policies, procedures, controls and reporting are regularly reviewed and updated when needed to ensure they remain fully in line with regulation, law, corporate governance and industry good practice.
The Board is responsible for approving the Group's risk appetite statement at least annually. Board-level metrics are cascaded into more detailed business appetite metrics and limits. Regular close monitoring and comprehensive reporting to all levels of management and the Board ensures appetite limits are maintained and subject to stress analysis at a risk type and portfolio level, as appropriate.
Governance is maintained through delegation of authority from the Board down to individuals. Senior executives are supported by a committee based structure which is designed to ensure open challenge and enable effective decision making. More information on our Risk committees can be found on pages 28 to 29.
Simplified approach to managing risks
Over the course of the year, there has been a strong focus on simplifying and enhancing the enterprise risk management framework. A One Risk and Control Self-Assessment (One RCSA) approach to managing risks across Lloyds Banking Group has been adopted, which supports the proactive identification of risks to customers and the Group’s business objectives, as well as enabling a strong control framework. More information on One RCSA is available on page 26.
Risk culture and the customer
A transparent risk culture resonates across the organisation and is supported by the Board and its tone from the top.
Risk management requires all colleagues to play their part, with individuals taking responsibility for their actions.
Within our approach there is a strong focus on building and sustaining long-term
relationships with customers through the economic cycle.
Senior Management articulate the core risk values to which the Group aspires, based on the Group's conservative business model, prudent approach to risk management and the Board's guidance.
As a Group, we are open, honest and transparent with colleagues working in collaboration with business areas to:
•support effective risk management and provide constructive challenge
•share lessons learned and understand root causes when things go wrong
•consider horizon risks and opportunities
Connectivity of risks and our strategic risk management framework
The unprecedented events of this year have demonstrated how individual risks in aggregate can place significant pressure on the Group's strategy, business model and performance. It is essential that we not only manage our individual risks, but understand how emerging and strategic risks are connected, and how they impact either existing principal risks or create new risks. By doing so we can ensure we continue to respond dynamically and protect our customers and support our colleagues and stakeholders.
Connectivity of risks is very much at the forefront of the Group’s thinking and additional work is being launched in 2021 to further embed this into our risk management framework.
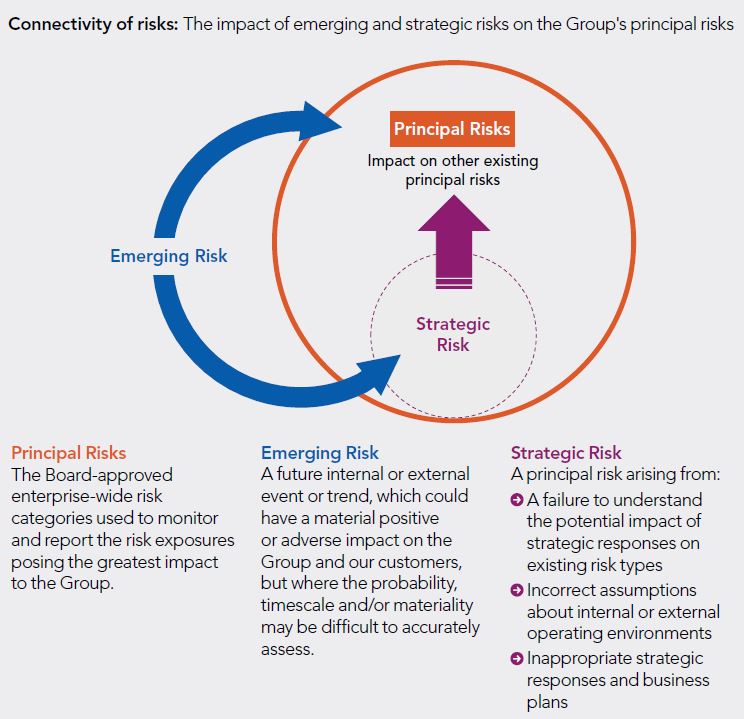
OPERATING AND FINANCIAL REVIEW AND PROSPECTS
LLOYDS BANK GROUP’S PRINCIPAL RISKS
2020 has been a year of significant uncertainty, including the spread of COVID-19 and its impact on global and domestic economies and the UK's exit from the European Union.
COVID-19 has had a significant impact on all risk types in 2020. Understanding and managing its impacts dynamically has been a major area of focus. The Group has responded quickly to the challenges faced, putting in place risk mitigation strategies and refining its investment and strategic plans.
All of the Group's principal risks, which are outlined on this page, are reported regularly to the Board.
The risk management section from pages 24 to 30 provides a more in-depth picture of how risk is managed within the Group.
Key focus areas in 2020
Climate - New
The Group recognises the evolving pace of Climate Risk and has adopted a comprehensive approach to embedding this risk within its enterprise risk management framework. This includes the creation of a new principal risk as well as its integration into our existing principal risks. Work has also continued to develop scenario modelling and other analytical tools and to increase the level of external disclosure to further align to the Task Force on Climate-related Financial Disclosures (TCFD) recommendations.
Market
The Group’s structural hedge, nominal balance £181 billion (2019: £173 billion), provides protection against margin compression caused by falling interest rates. In addition, customer deposits have seen significant growth in 2020 which creates near term interest rate exposure. Customer behaviour and hedging of these balances are reviewed regularly.
The Group’s defined benefit pension schemes have seen an improvement in IAS19 accounting surplus to £1.6 billion (2019: £0.5 billion), as a result of Deficit Reduction Contributions and greater than expected asset returns partially offset by the impact of the Retail Price Index (RPI) reform announced by the Chancellor of the Exchequer in November 2020.
Credit
A range of measures have been deployed to help support customers, including around 1.3 million payment holidays, c.£12 billion of additional government support scheme lending through the Bounce Back Loan (BBLS) and Coronavirus Business Interruption Loan (CBILS) schemes, together with liquidity facilities for larger clients.
This support together with the wide array of public policy interventions, such as the job retention scheme, has limited the increase in unemployment, and helped to suppress credit defaults and business failures.
The Group has responded dynamically to mitigate and address credit risk, with specific focus on higher risk segments, sectors and
counterparties, as well as undertaking extensive preparation to support the expected increase in customers who may experience financial difficulty.
The 2020 full year impairment charge of £4,060 million (2019: £1,362 million) reflects the deteriorating economic outlook, with reserves built in anticipation of an increase in losses during 2021 as unemployment increases and more business failures are seen.
Funding and liquidity
The Group maintained its strong funding and liquidity position throughout 2020. Customer deposits increased significantly as spending reduced and customers deposited government lending scheme balances. During the year, the Group repaid all outstanding amounts of its Term Funding Scheme (TFS) and Funding for Lending Scheme (FLS) drawings and drew £13.7 billion from the Term Funding Scheme with additional incentives for SMEs (TFSME).
Capital
The CET1 ratio increased to 15.51 per cent (14.41 per cent excluding IFRS 9 transitional relief) from 14.3 per cent at 31 December 2019, largely reflecting profits for the year, with the adverse impact of the impairment charge partially mitigated through the increase in IFRS9 transitional relief. The capital position benefited from the introduction of the revised capital treatment of intangible software assets and lower RWAs and excess expected losses. The resultant increases in capital were offset in part by the accrual for foreseeable dividends and other movements.
Lloyds Bank Group’s capital requirements have reduced in 2020 due to lower Pillar 2A requirements and the reduction in the UK countercyclical capital buffer rate in response to the impact of COVID-19. The Group therefore has significant headroom to absorb further potential losses and to continue to support households and businesses as they recover from the COVID-19 pandemic.
Change/execution
The Change/execution risk profile has remained stable in the year. The Group’s change portfolio was reprioritised at pace to support critical and COVID-19 related activities. Enhanced, targeted control monitoring was implemented to ensure safe delivery of change during the year.
Conduct
The Group has adapted quickly to the impacts of the pandemic, providing significant support to impacted customers. Comprehensive preparations have been undertaken to help identify and further support those customers in financial difficulty.
Data
The Group continues to improve its capabilities in the management of data risk, with an improvement seen in the regular half yearly capability assessment. Areas of improvement include delivery of a new data risk and control library, embedding data by
design and ethics principles into the data science lifecycle, increasing capabilities and data culture.
Governance
Governance risk has remained stable, despite the need for accelerated decision-making and a significant increase in the amount of remote working, together with a number changes to GEC and Board members throughout the year. Ensuring appropriate and efficient governance remains a key priority.
People
2020 has seen increased colleague workloads and significant changes to ways of working, with up to 50,000 colleagues working from home. Improved colleague sentiment demonstrates that the extensive support measures deployed by the Group, with a continued focus on colleague wellbeing and resilience, are helping to mitigate these risks.
Operational resilience
Business continuity plans have proved resilient, with particular attention applied to heightened risks in the supply chain.
Operational
Despite anticipated heightened operational risks in cyber, fraud and technology, the volume of operational loss events has remained broadly consistent in 2020 compared to 2019.
Model
Model risk has increased due to the nature and uncertainty of the economic outlook. The effect of government led customer support initiatives have weakened established relationships between model inputs and outputs, reducing the ability to forecast using models alone. While underlying model drivers are expected to remain valid in the longer term, year-end impairment reporting contains a greater element of governed judgement to reflect current conditions.
Regulatory and legal
Regulatory risk has been impacted by a small number of instances of non-compliance and implementation of regulatory change, requiring forbearance from regulators. Forbearance requirements have been due to the re-prioritisation of resource to support the provision of essential services to customers and to respond to new regulatory requirements, such as payment holidays. Legal risk has been impacted by the UK’s exit from the EU, in particular continued uncertainty of the future UK legal and regulatory financial services framework.
Strategic
Strategic risk is a significant source of risk for the Group, influencing the Group’s strategy, business model, performance and risk profile. The development of our strategic risk framework is a key priority for the Group.
1Includes a 0.5 per cent benefit following the implementation of the revised capital treatment of intangible software assets which the PRA is proposing to reverse.
OPERATING AND FINANCIAL REVIEW AND PROSPECTS
All narrative and quantitative tables are unaudited unless otherwise stated. The audited information is required to comply with the requirements of relevant International Financial Reporting Standards.
Risk management is at the heart of Helping Britain Recover and building the UK's preferred financial partner.
Our mission is to protect our customers, shareholders, colleagues and the Group, while enabling sustainable growth in targeted segments. This is achieved through informed risk decisions and robust risk management, supported by a consistent risk-focused culture.
The risk overview (pages 22 to 23) provides a summary of risk management within the Group and the key focus areas for 2020, including the significant impact that COVID-19 has had on all principal risks faced by the Group. The risk overview also highlights the importance of the connectivity of principal, emerging and strategic risks.
This full risk management section provides a more in-depth picture of how risk is managed within the Group, detailing the Group’s approach to stress testing, risk governance, committee structure, appetite for risk and a full analysis of the principal risk categories (pages 30 to 74), the framework by which risks are identified, managed, mitigated and monitored.
Each principal risk category is described and managed using the following standard headings: definition, exposures, measurement, mitigation and monitoring.
LLOYDS BANK GROUP’S APPROACH TO RISK
The Group operates a prudent approach to risk with rigorous management controls to support sustainable business growth and minimise losses. Through a strong and independent risk function (Risk division), a robust control framework is maintained to identify and escalate current and emerging risks, support sustainable growth within the Group's risk appetite, and to drive and inform good risk reward decision-making.
To meet ring-fencing requirements, core UK retail financial services and ancillary retail activities are ring-fenced from other activities of Lloyds Banking Group. Lloyds Bank Group has adopted the enterprise risk management framework (ERMF) of the Parent Group. Lloyds Bank Group has supplemented the Parent Group enterprise risk management framework with additional risk management related to ring fencing requirements as required. The Parent Group’s Governance framework, which is tailored to meet the entity specific needs of Lloyds Bank Group, is adopted by Lloyds Bank Group to ensure effective corporate governance within Lloyds Bank Group.
The Group’s ERMF is structured to align with the industry-accepted internal control framework standards.
The ERMF applies to every area of the business and covers all types of risk. It is reviewed, updated and approved by the Board at least annually to reflect any changes in the nature of the Group's business and external regulations, law, corporate governance and industry best practice. The ERMF provides the Group with an effective mechanism for developing and embedding risk policies and risk management strategies which are aligned with the risks faced by its businesses. It also seeks to facilitate effective communication on these matters across the Group.
Role of the Lloyds Bank Group Board and senior management
Key responsibilities of the Board and senior management include:
•approval of the ERMF and Board risk appetite
•approval of Group-wide risk principles and policies
•the cascade of delegated authority (for example to Board sub- committees and the Group Chief Executive)
•effective oversight of risk management consistent with risk appetite
Risk appetite
Risk appetite is defined within the Group as ‘the amount and type of risk that the Group is prepared to seek, accept or tolerate’ in delivering its strategy.
Group strategy and risk appetite are developed in tandem. Business planning aims to optimise value within the Group's risk appetite parameters and deliver on its promise to Help Britain Prosper.
The Group’s risk appetite statement details the risk parameters within which the Group operates. The statement forms part of the Group's control framework and is embedded into its policies, authorities and limits, to guide decision-making and risk management. The Board is responsible for approving the Group’s risk appetite statement at least annually. Group Board-level metrics are cascaded into more detailed business appetite metrics and limits.
Group risk appetite includes the following areas:
Climate: the Group takes action to identify, manage and mitigate its climate risk and support the Group and its customers in transitioning to a low carbon economy
Market: the Group has robust controls in place to manage its inherent market risk and does not engage in any proprietary trading, reflecting the customer focused nature of the Group’s activities
Credit: the Group has a conservative and well balanced credit portfolio through the economic cycle, generating an appropriate return on equity, in line with the Group’s target return on equity in aggregate
Funding and liquidity: the Group maintains a prudent liquidity profile and a balance sheet structure that limits its reliance on potentially volatile sources of funding
Capital: the Group maintains capital levels commensurate with a prudent level of solvency to achieve financial resilience and market confidence
Change/execution: the Group has limited appetite for negative impacts on customers, colleagues, or the Group as a result of change activity
Conduct: the Group delivers fair outcomes for its customers
Data: the Group has zero appetite for material regulatory breaches and material legal incidents
People: the Group leads responsibly and proficiently, manages people resource effectively, supports and develops colleague talent, and meets legal and regulatory obligations related to its people
OPERATING AND FINANCIAL REVIEW AND PROSPECTS
Operational resilience: the Group has a limited appetite for disruption to services to customers and stakeholders from significant unexpected events
Operational: the Group has robust controls in place to manage operational losses, reputational events and regulatory breaches. It identifies and assesses emerging risks and acts to mitigate these
Model: material models are performing in line with expectations
Regulatory and legal: the Group interprets and complies with all relevant regulation and all applicable laws (including codes of conduct which could have legal implications) and/or legal obligations
Governance frameworks
The Group’s approach to risk is founded on a robust control framework and a strong risk management culture which are the foundation for the delivery of effective risk management and guide the way all employees approach their work, behave and make decisions.
Governance is maintained through delegation of authority from the Board to individuals through the management hierarchy. Senior executives are supported where required by a committee based structure which is designed to ensure open challenge and support effective decision-making.
The Group’s risk appetite, principles, policies, procedures, controls and reporting are regularly reviewed and updated where needed to ensure they remain fully in-line with regulation, law, corporate governance and industry good practice.
The interaction of the executive and non-executive governance structures relies upon a culture of transparency and openness that is encouraged by both the Board and senior management.
Board-level engagement, coupled with the direct involvement of senior management in Group-wide risk issues at Group Executive Committee level, ensures that escalated issues are promptly addressed and remediation plans are initiated where required.
Line managers are directly accountable for identifying and managing risks in their individual businesses, ensuring that business decisions strike an appropriate balance between risk and reward and are consistent with the Group’s risk appetite.
Clear responsibilities and accountabilities for risk are defined across the Group through a three lines of defence model which ensures effective independent oversight and assurance in respect of key decisions.
The risk committee governance framework is outlined on page 27.
Three lines of defence model
The ERMF is implemented through a ‘three lines of defence’ model which defines clear responsibilities and accountabilities and ensures effective independent oversight and assurance activities take place covering key decisions.
Business lines (first line) have primary responsibility for risk decisions, identifying, measuring, monitoring and controlling risks within their areas of accountability. They are required to establish effective governance and control frameworks for their business to be compliant with Lloyds Banking Group policy requirements, to maintain appropriate risk management skills, mechanisms and toolkits, and to act within Group risk appetite parameters set and approved by the Board.
Risk division (second line) is a centralised function, headed by the Chief Risk Officer, providing oversight and independent constructive challenge to the effectiveness of risk decisions taken by business management, providing proactive advice and guidance, reviewing, challenging and reporting on the risk profile of the Group and ensuring that mitigating actions are appropriate.
It also has a key role in promoting the implementation of a strategic approach to risk management reflecting the risk appetite and ERMF agreed by the Board that encompasses:
•overseeing embedding of effective risk management processes
•transparent, focused risk monitoring and reporting
•provision of expert and high quality advice and guidance to the Board, executives and management on strategic issues and horizon scanning, including pending regulatory changes
•a constructive dialogue with the first line through provision of advice, development of common methodologies, understanding, education, training, and development of new risk management tools
The primary role of Internal Audit (third line) is to help the Board and executive management protect the assets, reputation and sustainability of the Group. The internal audit function is led by the Group Chief Internal Auditor. The internal audit function provides independent assurance to the Audit Committee and the Board through performing reviews and engaging with committees and executive management, providing opinion, challenge and informal advice on risk and the state of the control environment. The internal audit function is a single independent internal audit function, reporting to the Board Audit Committee of Lloyds Banking Group and the Board Audit Committees of the key subsidiaries.
Risk and control cycle from identification to reporting
To allow senior management to make informed risk decisions, the business follows a continuous risk management approach which includes producing appropriate, accurate and focused risk reporting. The risk and control cycle sets out how this should be approached, with the appropriate controls and processes in place. This cycle, from identification to reporting, ensures consistency and is intended to manage and mitigate the risks impacting the Group.
The process for risk identification, measurement and control is integrated into the overall framework for risk governance. Risk identification processes are forward-looking to ensure emerging risks are identified. Risks are captured and measured using robust and consistent quantification methodologies. The measurement of risks includes the application of stress testing and scenario analysis, and considers whether relevant controls are in place before risks are incurred.
Identified risks are reported on a monthly basis or as frequently as necessary to the appropriate committee. The extent of the risk is compared to the overall risk appetite as well as specific limits or triggers. When thresholds are breached, committee minutes are clear on the actions and time frames required to resolve the breach and bring risk within tolerances. There is a clear process for escalation of risks and risk events.
OPERATING AND FINANCIAL REVIEW AND PROSPECTS
All key controls are recorded and assessed on a regular basis, in response to triggers or minimum annually. Control assessments consider both the adequacy of the design and operating effectiveness. Where a control is not effective, the root cause is established and action plans implemented to improve control design or performance. Control Effectiveness against all residual risks is reported and monitored via the monthly Consolidated Risk Report (CRR). The CRR is reviewed and independently challenged by the Risk Division and provided to the Risk Division Executive Committee and Group Risk Committee. On an annual basis, a point in time assessment is made for control effectiveness against each risk category and across sub-groups. The CRR data is the primary source used for this point in time assessment and a year on year comparison on control effectiveness is reported to the Board.
One Risk and Control Self-Assessment (One RCSA) is part of the Group’s Risk and Control Strategy to deliver a stronger risk culture and simplified risk and control environment. The three lines of defence have worked together to identify improvements to the Group’s approach to risk management. Following pilot activity, this new approach (One RCSA) is being adopted across the Group through a phased implemented plan. All aspects of the 2020 Plan for implementation of One RCSA have been delivered. The 2021 plans capture the remaining highest risks to customers and the business, and the Board will continue to review progress with embedding the cultural change and improving the risk and control environment.
Risk culture
Based on the Group’s prudent business model, prudent approach to risk management, and guided by the Board, the senior management articulates the core risk values to which the Group aspires, and sets the tone at the top. Senior Management establishes a strong focus on building and sustaining long-term relationships with customers, through the economic cycle. Lloyds Banking Group’s Code of Responsibility reinforces colleagues’ accountability for the risks they take and their responsibility to prioritise their customers’ needs.
Risk resources and capabilities
Appropriate mechanisms are in place to avoid over-reliance on key personnel or system/technical expertise within the Group. Adequate resources are in place to serve customers both under normal working conditions and in times of stress, and monitoring procedures are in place to ensure that the level of available resource can be increased if required. Colleagues undertake appropriate training to ensure they have the skills and knowledge necessary to enable them to deliver fair outcomes for customers.
There is ongoing investment in risk systems and models alongside the Group’s investment in customer and product systems and processes. This drives improvements in risk data quality, aggregation and reporting leading to effective and efficient risk decisions.
Financial reporting risk management systems and internal controls
The Group maintains risk management systems and internal controls relating to the financial reporting process which are designed to:
•ensure that accounting policies are appropriately and consistently applied, transactions are recorded accurately, and undertaken in accordance with delegated authorities, that assets are safeguarded and liabilities are properly stated
•enable the calculation, preparation and reporting of financial, prudential regulatory and tax outcomes in accordance with applicable International Financial Reporting Standards, statutory and regulatory requirements
•enable certifications by the Senior Accounting Officer relating to maintenance of appropriate tax accounting and in accordance with the 2009 Finance Act
•ensure that disclosures are made on a timely basis in accordance with statutory and regulatory requirements (for example UK Finance Code for Financial Reporting Disclosure and the US Sarbanes Oxley Act)
•ensure ongoing monitoring to assess the impact of emerging regulation and legislation on financial, prudential regulatory and tax reporting
•ensure an accurate view of the Group’s performance to allow the Board and senior management to appropriately manage the affairs and strategy of the business as a whole
Risk decision-making and reporting
Risk analysis and reporting enables better understanding of risks and returns, supporting the identification of opportunities as well as better management of risks.
An aggregate view of the Group’s overall risk profile, key risks and management actions, and performance against risk appetite is reported to and discussed monthly at the Group Risk Committee with regular reporting to the Board Risk Committee and the Board.
Rigorous stress testing exercises are carried out to assess the impact of a range of adverse scenarios with different probabilities and severities to inform strategic planning.
The Chief Risk Officer regularly informs the Board Risk Committee of the aggregate risk profile and has direct access to the Chair and members of Board Risk Committee.
OPERATING AND FINANCIAL REVIEW AND PROSPECTS
RISK GOVERNANCE
The risk governance structure below is integral to effective risk management across Lloyds Banking Group, including Lloyds Bank Group. Risk division is appropriately represented on key committees to ensure that risk management is discussed in these meetings. This structure outlines the flow and escalation of risk information and reporting from business areas and Risk division to Group Executive Committee and Board. Conversely, strategic direction and guidance is cascaded down from the Board and Group Executive Committee.
Company Secretariat supports senior and Board-level committees, and supports the Chairs in agenda planning. This gives a further line of escalation outside the three lines of defence.
Risk governance structure
Lloyds Bank Group Chief Executive Committees
•Lloyds Banking Group Executive Committee (GEC)
•Lloyds Banking Group and Ring-Fenced Banks Risk Committees (GRC)
•Lloyds Banking Group and Ring-Fenced Banks Asset and Liability Committees (GALCO)
•Lloyds Banking Group and Ring-Fenced Banks Customer First Committees
•Lloyds Banking Group and Ring-Fenced Banks Cost Management Committees
•Lloyds Banking Group and Ring-Fenced Banks Conduct Review Committees
•Lloyds Banking Group and Ring-Fenced Banks People Committees
•Lloyds Banking Group and Ring-Fenced Banks Sustainability Committees
•Lloyds Banking Group and Ring-Fenced Banks Conduct Investigations Committee
Risk Division Committees and Governance
•Lloyds Banking Group Market Risk Committee
•Lloyds Banking Group Fraud and Financial Crime Prevention Committee
•Lloyds Banking Group Financial Risk Committee
•Lloyds Banking Group Capital Risk Committee
•Lloyds Banking Group Model Governance Committee
•Ring-Fence Compliance Committee
OPERATING AND FINANCIAL REVIEW AND PROSPECTS
Board, Executive and Risk Committees
The Group’s risk governance structure strengthens risk evaluation and management, while also positioning the Group to manage the changing regulatory environment in an efficient and effective manner.
Assisted by the Lloyds Banking Group Board Risk and Audit Committees, the Board approves Lloyds Bank Group’s overall governance, risk and control frameworks and risk appetite. Refer to the Corporate Governance section on pages 77 to 82, for further information on Board committees.
The divisional and functional risk committees review and recommend divisional and functional risk appetite and monitor local risk profile and adherence to appetite.
Executive and Risk Committees
Lloyds Bank Group Chief Executive is supported by the following:
| | | | | |
| Committees | Risk focus |
| Lloyds Banking Group Executive Committee (GEC) | Assists the Group Chief Executive in exercising their authority in relation to material matters having strategic, cross-business area or Group-wide implications. |
| Lloyds Banking Group and Ring-Fenced Banks Risk Committees (GRC) | Responsible for the development, implementation and effectiveness of the Group’s enterprise risk management framework, the clear articulation of the Group’s risk appetite and monitoring and reviewing of the Group’s aggregate risk exposures and concentrations of risk. |
| Lloyds Banking Group and Ring-Fenced Banks Asset and Liability Committees (GALCO) | Responsible for the strategic direction of the Group’s assets and liabilities and the profit and loss implications of balance sheet management actions. The committee reviews and determines the appropriate allocation of capital, funding and liquidity, and market risk resources and makes appropriate trade-offs between risk and reward. |
| Lloyds Banking Group and Ring-Fenced Banks Customer First Committees | Provides a Group-wide perspective of customer experience and the governing body of customer plans and targets including governing targets and plans, oversight of customer outcomes and experience, and learning through best practice externally and leveraging Group memberships and partnerships. |
| Lloyds Banking Group and Ring-Fenced Banks Cost Management Committees | Leads and shapes the Group’s approach to cost management, ensuring appropriate governance and process over Group-wide cost management activities and effective control of the Group’s cost base. |
| Lloyds Banking Group and Ring-Fenced Banks Conduct Review Committees | Provides senior management oversight, challenge and accountability in connection with the Group’s engagement with conduct review matters as agreed with the Group Chief Executive. |
| Lloyds Banking Group and Ring-Fenced Banks People Committees | Supporting Lloyds Banking Group's People & Property Director in exercising their responsibilities in relation to the Group’s people and colleague policies, overseeing the development of and monitoring adherence to the remuneration policy, oversees compliance with Senior Manager and Certification Regime (SM&CR) and other regulatory requirements, monitors colleague engagement surveys, progress of the Group towards its culture targets and oversees the implementation of action plans. |
| Lloyds Banking Group and Ring-Fenced Banks Sustainability Committees | Recommends and implements the strategy and plans for delivering the Group’s aspiration to be viewed as a trusted responsible business as part of the purpose of Helping Britain Prosper, reporting to the GEC, GRC, Responsible Business Committee where appropriate on material sustainability related risk and opportunities across the Group; and recommending to the GEC and Responsible Business Committee the Group's Responsible Business Report and Helping Britain Prosper Plan. |
| Lloyds Banking Group and Ring-Fenced Banks Conduct Investigations Committee | Responsible for providing recommendations regarding performance adjustment, including the individual risk-adjustment process and risk-adjusted performance assessment, and making final decisions on behalf of the Group on the appropriate course of action relating to conduct breaches, under the formal scope of the SM&CR. |
In addition, the Strategic Review 2021 Forum provides strategic deep dives across priority areas to support the Group Chief Executive and accountable executives in monitoring strategic progress and challenges in focus areas. The Lloyds Banking Group Risk Committee is supported through escalation and ongoing reporting by business area risk committees, cross-divisional committees addressing specific matters of Group-wide significance and the following second line of defence Risk committees which ensure effective oversight of risk management: |
| Lloyds Banking Group Market Risk Committee | Responsible for monitoring, oversight and challenge of market risk exposures across the Group. Reviews and proposes changes to the market risk management framework, and reviews the adequacy of data quality needed for managing market risks. It is also responsible for escalating issues of Group level significance to GEC level (usually via GALCO) relating to the management of the Group's market risks. |
| Lloyds Banking Group Fraud and Financial Crime Prevention Committee | Brings together accountable stakeholders and subject matter experts to ensure that the development and application of fraud and financial crime risk management complies with the Group's Strategic Aims, Group Corporate Responsibility, Group Risk Appetite and Group Fraud and Financial Crime (AML, Anti-bribery and Sanctions) policies. It provides direction and appropriate focus on priorities to enhance the Group's fraud and financial crime risk management capabilities in line with business and customer objectives while aligning to the Group's target operating model. |
OPERATING AND FINANCIAL REVIEW AND PROSPECTS
| | | | | |
| Committees | Risk focus |
| Lloyds Banking Group Financial Risk Committee | Responsible for overseeing, reviewing, challenging and recommending to GEC / Board Risk Committee / Board for Lloyds Banking Group and Ring-Fenced Bank (i) Annual Internal Stress Tests, (ii) All Prudential Regulation Authority (PRA) / European Banking Authority (EBA) and any other regulatory stress tests, (iii) Annual Liquidity Stress Tests, (iv) Reverse Stress Tests, (v) Individual Liquidity Adequacy Assessment (ILAA), (vi) Internal Capital Adequacy Assessment Process (ICAAP), (vii) Pillar 3, (viii) Recovery / Resolution Plans, and (ix) relevant ad hoc Stress Tests or other analysis as and when required by the Committee. |
| Lloyds Banking Group Capital Risk Committee | Responsible for providing oversight of all relevant capital matters within the Lloyds Banking Group, Ring-Fenced Bank and material subsidiaries, including latest capital position and plans, capital risk appetite proposals, Pillar 2 developments (including stress testing), Recovery and Resolution matters and the impact of regulatory reforms and developments specific to capital. |
| Lloyds Banking Group Model Governance Committee | Responsible for supporting the Model Risk and Validation Director in fulfilling their responsibilities, from a Group-wide perspective, under the Lloyds Banking Group Model Governance Policy through provision of debate, challenge and support of decisions. The committee will be held as required to facilitate approval of models, model changes and model related items as required by Model Policy, including items related to the governance framework as a whole and its application. |
| Ring-Fence Compliance Committee | This Committee is designed to provide executive sponsorship and strategic direction to ongoing Perimeter Compliance, the closure and remediation of breaches, monitoring and reporting of new breaches and associated governance and delivery enhancements to the Ring-Fencing Compliance Risk Framework. |
CAPITAL STRESS TESTING
Stress testing is recognised as a key risk management tool by the Boards, senior management, the businesses and the Risk and Finance functions of all parts of the Group and its legal entities. It is fully embedded in the planning process of the Group and its legal entities as a key activity in medium-term planning, and senior management is actively involved in stress testing activities via a strict governance process.
Scenario stress testing is used for:
Risk Identification:
•Understand key vulnerabilities of the Group and its key legal entities under adverse economic conditions
Risk Appetite:
•Assess the results of the stress test against the risk appetite of all parts of the Group to ensure the Group and its legal entities are managed within their risk parameters
•Inform the setting of risk appetite by assessing the underlying risks under stress conditions
Strategic and Capital Planning:
•Allow senior management and the Boards of the Group and its applicable legal entities to adjust strategies if the plan does not meet risk appetite in a stressed scenario
•Support the Internal Capital Adequacy Assessment Process (ICAAP) by demonstrating capital adequacy, and meet the requirements of regulatory stress tests that are used to inform the setting of the Prudential Regulation Authority (PRA) and management buffers (see capital risk on pages 56 to 61) of the Group and its separately regulated legal entities
Risk Mitigation:
•Drive the development of potential actions and contingency plans to mitigate the impact of adverse scenarios. Stress testing also links directly to the recovery planning process of the Group and its legal entities
On at least an annual basis, the Group conducts macroeconomic stress tests of the operating plan, which are supplemented with higher-level refreshes if necessary. The exercise aims to highlight the key vulnerabilities of the Group’s and its legal entities’ business plans to adverse changes in the economic environment, and to ensure that there are adequate financial resources in the event of a downturn.
Reverse stress testing
Reverse stress testing is used to explore the vulnerabilities of the Group’s and its key legal entities’ strategies and plans to extreme adverse events that would cause the businesses to fail. Where this identifies plausible scenarios with an unacceptably high risk, the Group or its entities will adopt measures to prevent or mitigate that and reflect these in strategic plans.
Other stress testing activity
The Group’s stress testing programme also involves undertaking assessments of liquidity scenarios, market risk sensitivities and scenarios, and business specific scenarios (see the principal risk categories on page 23 for further information on risk-specific stress testing). If required, ad hoc stress testing exercises are also undertaken to assess emerging risks, as well as in response to regulatory requests. This wide ranging programme provides a comprehensive view of the potential impacts arising from the risks to which the Group is exposed and reflects the nature, scale and complexity of the Group. Lloyds Banking Group will undertake the Bank of England’s Climate Biennial Exploratory Stress test in 2021 and will leverage the experience gained through that exercise to further embed climate risk into stress testing activities.
Methodology
The stress tests at all levels must comply with all regulatory requirements, achieved through the comprehensive construction of macroeconomic scenarios and a rigorous divisional, functional, risk and executive review and challenge process, supported by analysis and insight into impacts on customers and business drivers.
The engagement of all required business, Risk and Finance teams is built into the preparation process, so that the appropriate analysis of each risk category’s impact upon the business plans is understood and documented. The methodologies and modelling approach used for stress
OPERATING AND FINANCIAL REVIEW AND PROSPECTS
testing ensure that a clear link is shown between the macroeconomic scenarios, the business drivers for each area and the resultant stress testing outputs. All material assumptions used in modelling are documented and justified, with a clearly communicated review and sign-off process. Modelling is supported by expert judgement and is subject to Lloyds Banking Group Model Governance Policy.
Governance
Clear accountabilities and responsibilities for stress testing are assigned to senior management and the Risk and Finance functions throughout the Group and its key legal entities. This is formalised through Lloyds Banking Group Business Planning and Stress Testing Policy and Procedure, which are reviewed at least annually.
The Group Financial Risk Committee (GFRC), chaired by the Chief Risk Officer and attended by the Chief Financial Officer and other senior Risk and Finance colleagues, is the committee that has primary responsibility for overseeing the development and execution of the Group’s stress tests.
The review and challenge of the Group’s detailed stress forecasts, the key assumptions behind these, and the methodology used to translate the economic assumptions into stressed outputs conclude with the appropriate Finance and Risk Directors’ sign-off. The outputs are then presented to GFRC and Board Risk Committee for review and challenge, before being approved by the Board.
FULL ANALYSIS OF RISK CATEGORIES
The Group’s risk framework covers all types of risk which affect the Group and could impact on the achievement of its strategic objectives. A detailed description of each category is provided on pages 31 to 74.
Risk categories recognised by the Group are periodically reviewed to ensure that they reflect the Group risk profile in light of internal and external factors, such as the Group strategy and the regulatory environment in which it operates. The only change to the risk categories during 2020 has been the addition of Climate risk.
| | | | | | | | | | | |
| Principal risk categories | Secondary risk categories | | |
| Climate risk | – Climate | | |
| | | |
| Market risk | – Trading book | – Pensions | |
| – Banking book | | |
| Credit risk | – Retail credit | – Commercial credit | |
| | | |
| Funding and liquidity risk | – Funding and liquidity | | |
| | | |
| Capital risk | – Capital | | |
| | | |
| Change/execution risk | – Change/execution | | |
| | | |
| Conduct risk | – Conduct | | |
| | | |
| Data risk | – Data | | |
| | | |
| Governance risk | – Governance | | |
| | | |
| People risk | – People | | |
| | | |
| Operational resilience risk | – Operational resilience | | |
| | | |
| Operational risk | – Business process | – Financial reporting | – Physical security/health and safety |
| – Cyber and information security | – Fraud | – Sourcing |
| – External service provision | – Internal service provision | |
| – Financial crime | – IT systems | |
| Model risk | – Model | | |
| | | |
| Regulatory and legal risk | – Regulatory compliance | – Legal | |
| | | |
| Strategic risk | – Strategic | | |
| | | |
Lloyds Bank Group considers both reputational and financial impact in the course of managing all its risks and therefore does not classify reputational impact as a separate risk category.
OPERATING AND FINANCIAL REVIEW AND PROSPECTS
CLIMATE RISK
DEFINITION
Climate risk is defined as the risk that the Group experiences losses and/or reputational damage as a result of climate change, either directly or through its customers. These losses may be realised from physical events, the required adaptation in transitioning to a low carbon economy, or as a consequence of the responses to managing these changes.
EXPOSURES
Climate risk can arise from:
•Physical risks - changes in climate or weather patterns which are acute, event driven (e.g. flood), or chronic, longer term shifts (e.g. rising sea levels)
•Transition risks - associated with the move towards a low carbon economy, e.g. changes to policy, legislation and regulation, technology and changes to customer preferences. Failure to manage these changes and adapt to climate change could then result in legal risks
Climate risk manifests through, and has potential to impact, the Group’s existing principal financial and non-financial risks. The Group has undertaken an analysis of how its principal risks are impacted by climate change.
MEASUREMENT
The Group is continuing to develop its modelling and assessment capabilities for quantifying climate risk, including building a greater understanding through climate scenario analysis.
In 2020, the Group has approved a Risk Appetite Statement for climate risk, as well as an interim metric to ensure the Group continues to progress activities at pace, and also included commentary on climate-related risks as part of the Group's annual ICAAP, using expert judgement to assess the financial impacts under a number of different climate scenarios.
The Group has also developed and is piloting a tool in Commercial Banking to qualitatively assess the physical and transition risks relating to the Group's clients.
MITIGATION
Lloyds Banking Group has twelve external sector statements that help articulate appropriate areas of climate related risk appetite and the Group's approach to the risk assessment of its customers. Lloyds Banking Group is continuing to refine and enhance these statements.
As part of Lloyds Banking Group’s credit risk policy, we have mandatory requirements to consider environmental risks in key risk management activities. In Commercial Banking, Relationship Managers must ensure that sustainability risk is considered for all new and renewal facilities, and specifically commented on where credit limits exceed £500,000.
Other initiatives to further embed climate risk factors into the risk management activities across the Group include development of a risk mitigation strategy for vehicle finance and home loans in Retail.
The Group is continuing to develop its climate risk management framework to ensure all activities consider the appropriate climate-related risks and opportunities and the Group’s processes will continue to evolve as it embeds its approach.
MONITORING
Governance for climate-related risk is embedded into the Group’s existing governance structure and is complementary to governance of the Group’s sustainability strategy.
Climate risk is monitored in the Group’s risk reporting and more detailed updates are provided regularly to the Lloyds Banking Group and Ring-Fenced Banks Board Risk Committees regarding the Group’s climate risk management activities and key developments.
OPERATING AND FINANCIAL REVIEW AND PROSPECTS
MARKET RISK
DEFINITION
Market risk is defined as the risk that the Group's capital or earnings profile is affected by adverse market rates or prices, in particular interest rates and credit spreads in the Banking business, interest rates, and credit spreads in the Group’s Defined Benefit Pension Schemes.
MEASUREMENT
The Lloyds Bank Group risk appetite is calibrated primarily to five multi-risk Lloyds Banking Group economic scenarios, and is supplemented with sensitivity-based measures. The scenarios assess the impact of unlikely, but plausible, adverse stresses on income with the worst case for banking activities, defined benefit pensions, insurance and trading portfolios reported against independently, and across Lloyds Bank Group as a whole.
The Lloyds Bank Group risk appetite is cascaded first to the Group Asset and Liability Committee (GALCO), chaired by the Chief Financial Officer, where risk appetite is approved and monitored by risk type, and then to the Group Market Risk Committee (GMRC) where risk appetite is sub-allocated by division. These metrics are reviewed regularly by senior management to inform effective decision-making.
MITIGATION
GALCO is responsible for approving and monitoring group market risks, management techniques, market risk measures, behavioural assumptions, and the market risk policy. Various mitigation activities are assessed and undertaken across Lloyds Bank Group to manage portfolios and seek to ensure they remain within approved limits. The mitigation actions will vary dependent on exposure but will, in general, look to reduce risk in a cost effective manner by offsetting balance sheet exposures and externalising to the financial markets dependent on market liquidity. The market risk policy is owned by Group Corporate Treasury (GCT) and refreshed annually. The policy is underpinned by supplementary market risk procedures, which define specific market risk management and oversight requirements.
MONITORING
GALCO and GMRC regularly review high level market risk exposure as part of the wider risk management framework. They also make recommendations to the Board concerning overall market risk appetite and Lloyds Banking Group's Market Risk Policy. Exposures at lower levels of delegation are monitored at various intervals according to their volatility, from daily in the case of trading portfolios to monthly or quarterly in the case of less volatile portfolios. Levels of exposures compared to approved limits and triggers are monitored by Risk and appropriate escalation procedures are in place.
How market risks arise and are managed across Lloyds Bank Group’s activities is considered in more detail below.
BANKING ACTIVITIES
Exposures
The Lloyds Bank Group’s banking activities expose it to the risk of adverse movements in market rates or prices, predominantly interest rates, credit spreads, exchange rates and equity prices. The volatility of market rates or prices can be affected by both the transparency of prices and the amount of liquidity in the market for the relevant asset, liability or instrument.
Interest rate risk
Yield curve risk in Lloyds Bank Group’s divisional portfolios, and in Lloyds Bank Group’s capital and funding activities arises from the different repricing characteristics of Lloyds Bank Group’s non-trading assets, liabilities and off-balance sheet positions.
Basis risk arises from the potential changes in spreads between indices, for example where the bank lends with reference to a central bank rate but funds with reference to LIBOR, and the spread between these two rates widens or tightens.
Optionality risk arises predominantly from embedded optionality within assets, liabilities or off-balance sheet items where either Lloyds Bank Group or the customer can affect the size or timing of cash flows. One example of this is mortgage prepayment risk where the customer owns an option allowing them to prepay when it is economical to do so. This can result in customer balances amortising more quickly or slowly than anticipated due to customers’ response to changes in economic conditions.
Foreign exchange risk
Economic foreign exchange exposure arises from Lloyds Bank Group’s investment in its overseas operations (net investment exposures are disclosed in note 45 on page F-141). In addition, Lloyds Bank Group incurs foreign exchange risk through non-functional currency flows from services provided by customer-facing divisions, Lloyds Bank Group’s debt and capital management programmes and is exposed to volatility in its CET1 ratio, due to the impact of changes in foreign exchange rates on the retranslation of non-sterling- denominated RWAs.
Equity risk
Equity risk arises primarily from exposure to the Lloyds Banking Group share price through deferred shares and deferred options granted to employees as part of their benefits package.
Credit spread risk
Credit spread risk arises largely from (i) the liquid asset portfolio held in the management of Lloyds Bank Group's liquidity, comprising of government, supranational and other eligible assets; (ii) the Credit Valuation Adjustment (CVA) and Debt Valuation Adjustment (DVA) sensitivity to credit spreads; (iii) a number of the Lloyds Bank Group’s structured medium-term notes where Lloyds Bank Group has elected to fair value the notes through the profit and loss account; and (iv) banking book assets in Commercial Banking held at fair value under IFRS 9.
Measurement
Interest rate risk exposure is monitored monthly using, primarily:
Market value sensitivity: this methodology considers all repricing mismatches (behaviourally adjusted where appropriate) in the current balance sheet and calculates the change in market value that would result from an instantaneous 25, 100 and 200 basis points parallel rise or fall in the yield curve. GBP interest rates are modelled with a floor at zero per cent, with negative rate floors modelled for non-GBP currencies where appropriate (product-specific floors apply). The market value sensitivities are calculated on a static balance sheet using principal cash flows excluding interest, commercial margins and other spread components and are therefore discounted at the risk free rate.
Interest income sensitivity: this measures the 12 month impact on future net interest income arising from various economic scenarios. These include instantaneous 25, 100 and 200 basis point parallel shifts in all yield curves and the five Lloyds Banking Group economic scenarios. GBP interest rates are modelled with a floor at zero per cent, with negative rate floors modelled for non-GBP currencies where appropriate (product-specific floors apply). These scenarios are reviewed every year and are designed to replicate severe but plausible economic events, capturing risks that would not be evident through the use of parallel shocks alone such as basis risk and steepening or flattening of the yield curve.
OPERATING AND FINANCIAL REVIEW AND PROSPECTS
Additional negative rate scenarios are also used, where floors are removed or lowered, to ensure that this risk is monitored; however these are not measured against the limit framework for the purposes of Risk Appetite.
Unlike the market value sensitivities, the interest income sensitivities incorporate additional behavioural assumptions as to how and when individual products would reprice in response to changing rates. In addition a dynamic balance sheet is used which includes the run-off of current assets and liabilities and the addition of planned new business.
Reported sensitivities are not necessarily predictive of future performance as they do not capture additional management actions that would likely be taken in response to an immediate, large, movement in interest rates. These actions could reduce the net interest income sensitivity, help mitigate any adverse impacts or they may result in changes to total income that are not captured in the net interest income.
Structural hedge: the structural hedging programme managing interest rate risk in the banking book relies on assumptions made around customer behaviour. A number of metrics are in place to monitor the risks within the portfolio.
Lloyds Banking Group has an integrated Asset and Liability Management (ALM) system which supports non-traded asset and liability management of Lloyds Bank Group. This provides a single consolidated tool to measure and manage interest rate repricing profiles (including behavioural assumptions), perform stress testing and produce forecast outputs. Lloyds Bank Group is aware that any assumptions based model is open to challenge. A full behavioural review is performed annually, or in response to changing market conditions, to ensure the assumptions remain appropriate and the model itself is subject to annual re-validation, as required under the Lloyds Banking Group Model Governance Policy. The key behavioural assumptions are:
•embedded optionality within products
•the duration of balances that are contractually repayable on demand, such as current accounts and overdrafts, together with net free reserves of Lloyds Bank Group
•the re-pricing behaviour of managed rate liabilities, such as variable rate savings
The table below shows, split by material currency, Lloyds Bank Group’s market value sensitivities to an instantaneous parallel up and down 25 and 100 basis points change to all interest rates.
| | | | | | | | | | | | | | | | | | | | | | | | | | | | | |
| Lloyds Bank Group Banking activities: market value sensitivity (audited) |
| 2020 | | 2019 |
| Up
25bps
£m | Down
25bps
£m | Up
100bps
£m | Down
100bps
£m | | Up
25bps
£m | Down
25bps
£m | Up
100bps
£m | Down
100bps
£m |
| Sterling | 66.3 | | 7.3 | | 265.3 | | 10.4 | | | 15.5 | | (15.8) | | 60.7 | | (51.8) | |
| US Dollar | (2.2) | | 3.7 | | (8.6) | | 7.9 | | | (2.1) | | 2.2 | | (7.9) | | 9.1 | |
| Euro | (6.3) | | (5.0) | | (24.1) | | (9.0) | | | (7.0) | | 2.2 | | (26.5) | | 11.1 | |
| Other | 0.0 | | 0.0 | | (0.2) | | 0.0 | | | (0.1) | | 0.1 | | (0.3) | | 0.3 | |
| Total | 57.8 | | 6.0 | | 232.4 | | 9.3 | | | 6.3 | | (11.3) | | 26.0 | | (31.3) | |
This is a risk based disclosure and the amounts shown would be amortised in the income statement over the duration of the portfolio.
The market value sensitivity is driven by temporary customer flow positions not yet hedged plus other positions occasionally held, within limits, in order to minimise overall funding and hedging costs. The sensitivity, to up 100bps, increased in 2020 due to customer balance sheet changes and the associated hedging, in particular growth in fixed rate mortgages. The level of risk remains low relative to the size of the total balance sheet.
The table below shows supplementary value sensitivity to a steepening and flattening (c.100 basis points around the 3 year point) in the yield curve. This ensures there are no unintended consequences to managing risk to parallel shifts in rates.
| | | | | | | | | | | | | | | | | |
| Lloyds Bank Group Banking activities: market value sensitivity to a steepening and flattening of the yield curve (audited) |
| 2020 | | 2019 |
| Steepener
£m | Flattener
£m | | Steepener
£m | Flattener
£m |
| Sterling | (53.2) | | 14.3 | | | 40.7 | | (41.6) | |
| US Dollar | (6.4) | | 7.5 | | | (9.6) | | 10.3 | |
| Euro | (16.4) | | (3.9) | | | (15.6) | | 9.9 | |
| Other | (0.1 | ) | 0.5 | | | (0.0) | | (0.0) | |
| Total | (76.1) | | 18.4 | | | 15.5 | | (21.4) | |
The table below shows the banking book net interest income sensitivity to an instantaneous parallel up and down 25 and 100 basis points change to all interest rates.
| | | | | | | | | | | | | | | | | | | | | | | | | | | | | |
| Lloyds Bank Group Banking activities: net interest income sensitivity (audited) |
| 2020 | | 2019 |
| Up
25bps
£m | Down
25bps
£m | Up
100bps
£m | Down
100bps
£m | | Up
25bps
£m | Down
25bps
£m | Up
100bps
£m | Down
100bps
£m |
| Client facing activity and associated hedges | 254.6 | | (142.5) | | 1,030.2 | | (148.0) | | | 92.8 | | (133.8) | | 375.4 | | (658.8) | |
Income sensitivity is measured on a rolling 12 month basis.
Net interest income sensitivity, to up 100bps, has increased year-on-year in part due to the growth in customer deposits and account management activity during 2020. This would result in widening margins in a rates up scenario, increasing net interest income.
OPERATING AND FINANCIAL REVIEW AND PROSPECTS
The decrease in risk sensitivity year-on-year, to down 100bps, is driven by a reduction in modelled margin compression risk following the fall in interest rates in 2020. This is due to Lloyds Bank Group’s assumptions for modelling GBP interest rates with a floor of zero per cent (product-specific floors apply) which limits the down-shock applied.
Basis risk, foreign exchange, equity, and credit spread risks are measured primarily through scenario analysis by assessing the impact on profit before tax over a 12 month horizon arising from a change in market rates, and reported within the Board risk appetite on a monthly basis. Supplementary measures such as sensitivity and exposure limits are applied where they provide greater insight into risk positions. Frequency of reporting supplementary measures varies from daily to quarterly appropriate to each risk type.
Mitigation
Lloyds Bank Group’s policy is to optimise reward whilst managing its market risk exposures within the risk appetite defined by the Board. Lloyds Banking Group Market Risk Policy and procedures outlines the hedging process, and the centralisation of risk from divisions into GCT, e.g. via the transfer pricing framework. GCT is responsible for managing the centralised risk and does this through natural offsets of matching assets and liabilities, and appropriate hedging activity of the residual exposures, subject to the authorisation and mandate of GALCO within the Board risk appetite. The hedges are externalised to the market by derivative desks within GCT and the Commercial Bank. Lloyds Bank Group mitigates income statement volatility through hedge accounting. This reduces the accounting volatility arising from Lloyds Bank Group’s economic hedging activities and any hedge accounting ineffectiveness is continuously monitored.
The largest residual risk exposure arises from balances that are deemed to be insensitive to changes in market rates (including current accounts, a portion of variable rate deposits and investable equity), and is managed through Lloyds Bank Group’s structural hedge. Consistent with Lloyds Bank Group’s strategy to deliver stable returns, GALCO seeks to minimise large reinvestment risk, and to smooth earnings over a range of investment tenors. The structural hedge consists of longer-term fixed rate assets or interest rate swaps and the amount and duration of the hedging activity is reviewed regularly by GALCO.
Whilst the bank faces margin compression in low rate environments, its exposure to pipeline and prepayment risk are not considered material and are hedged in line with expected customer behaviour. These are appropriately monitored and controlled through divisional Asset and Liability Committees (ALCOs).
Economic foreign exchange exposures arising from non-functional currency flows are identified by divisions and transferred and managed centrally. Lloyds Banking Group also has a policy of forward hedging its forecasted currency profit and loss to year end.
Monitoring
The appropriate limits and triggers are monitored by senior executive committees within the banking divisions. Banking assets, liabilities and associated hedging are actively monitored and if necessary rebalanced to be within agreed tolerances.
DEFINED BENEFIT PENSION SCHEMES
Exposures
Lloyds Bank Group’s defined benefit pension schemes are exposed to significant risks from their assets and liabilities. The liability discount rate exposes Lloyds Bank Group to interest rate risk and credit spread risk, which are partially offset by fixed interest assets (such as gilts and corporate bonds) and swaps. Equity and alternative asset risk arises from direct asset holdings. Scheme membership exposes Lloyds Bank Group to longevity risk.
For further information on defined benefit pension scheme assets and liabilities please refer to note 28 on page F-69.
Measurement
Management of the schemes’ assets is the responsibility of the Trustees of the schemes who are responsible for setting the investment strategy and for agreeing funding requirements with Lloyds Bank Group. Lloyds Bank Group will be liable for meeting any funding deficit that may arise. As part of the triennial valuation process, Lloyds Bank Group will agree with the Trustees a funding strategy to eliminate the deficit over an appropriate period.
Longevity risk is measured using both 1-in-20 year stresses (risk appetite) and 1-in-200 year stresses (regulatory capital).
Mitigation
Lloyds Bank Group takes an active involvement in agreeing mitigation strategies with the schemes’ Trustees. An interest rate and inflation hedging programme is in place to reduce liability risk. The schemes have also reduced equity allocation and invested the proceeds in credit assets. The Trustees have put in place a longevity swap to mitigate longevity risk. The merits of longevity risk transfer and hedging solutions are reviewed regularly.
Monitoring
In addition to the wider risk management framework, governance of the schemes includes two specialist pensions committees.
The surplus, or deficit, in the schemes is tracked monthly along with various single factor and scenario stresses which consider the assets and liabilities holistically. Key metrics are monitored monthly including Lloyds Bank Group’s capital resources of the scheme, the performance against risk appetite triggers, and the performance of the hedged asset and liability matching positions.
TRADING PORTFOLIOS
Exposures
Lloyds Bank Group’s trading activity is small relative to its peers and does not engage in any proprietary trading activities. Lloyds Bank Group’s trading activity is undertaken solely to meet the financial requirements of commercial and retail customers for foreign exchange and interest rate products. These activities support customer flow and market making activities.
All trading activities are performed within the Commercial Banking division. While the trading positions taken are generally small, any extreme moves in the main risk factors and other related risk factors could cause significant losses in the trading book depending on the positions at the time.
Trading market risk measures are applied to all of Lloyds Bank Group’s regulatory trading books and they include daily VaR, sensitivity based measures, and stress testing calculations.
Measurement
Lloyds Bank Group internally uses VaR as the primary risk measure for all trading book positions.
The risk of loss measured by the VaR model is the minimum expected loss in earnings given the 95 per cent confidence.
OPERATING AND FINANCIAL REVIEW AND PROSPECTS
The market risk for the trading book continues to be low with respect to the size of Lloyds Bank Group and in comparison to peers. This reflects the fact that Lloyds Bank Group’s trading operations are customer-centric and focused on hedging and recycling client risks.
Although it is an important market standard measure of risk, VaR has limitations. One of them is the use of a limited historical data sample which influences the output by the implicit assumption that future market behaviour will not differ greatly from the historically observed period. Another known limitation is the use of defined holding periods which assumes that the risk can be liquidated or hedged within that holding period. Also calculating the VaR at the chosen confidence interval does not give enough information about potential losses which may occur if this level is exceeded. Lloyds Bank Group fully recognises these limitations and supplements the use of VaR with a variety of other measurements which reflect the nature of the business activity. These include detailed sensitivity analysis, position reporting and a stress testing programme.
Trading book VaR (1-day 99 per cent) is compared daily against both hypothetical and actual profit and loss at underlying legal entity level (HBOS and Lloyds Bank).
Mitigation
The level of exposure is controlled by establishing and communicating the approved risk limits and controls through policies and procedures that define the responsibility and authority for risk taking. Market risk limits are clearly and consistently communicated to the business. Any new or emerging risks are brought within risk reporting and defined limits.
Monitoring
Trading risk appetite is monitored daily with 1-day 95 per cent VaR and stress testing limits. These limits are complemented with position level action triggers and profit and loss referrals. Risk and position limits are set and managed at both desk and overall trading book levels. They are reviewed at least annually and can be changed as required within the overall Lloyds Bank Group risk appetite framework.
OPERATING AND FINANCIAL REVIEW AND PROSPECTS
CREDIT RISK
DEFINITION
Credit risk is defined as the risk that parties with whom the Group has contracted fail to meet their financial obligations (both on and off- balance sheet).
EXPOSURES
The principal sources of credit risk within the Group arise from loans and advances, contingent liabilities, commitments, debt securities and derivatives to customers, financial institutions and sovereigns. The credit risk exposures of the Group are set out in note 45 on page F-115.
In terms of loans and advances, (for example mortgages, term loans and overdrafts) and contingent liabilities (for example credit instruments such as guarantees and documentary letters of credit), credit risk arises both from amounts advanced and commitments to extend credit to a customer or bank. With respect to commitments to extend credit, the Group is also potentially exposed to an additional loss up to an amount equal to the total unutilised commitments. However, the likely amount of loss may be less than the total unutilised commitments, as most retail and certain commercial lending commitments may be cancelled based on regular assessment of the prevailing creditworthiness of customers. Most commercial term commitments are also contingent upon customers maintaining specific credit standards.
Credit risk also arises from debt securities and derivatives. Credit risk exposure for derivatives is limited to the current cost of replacing contracts with a positive value to the Group. Such amounts are reflected in note 45 on page F-115.
Additionally, credit risk arises from leasing arrangements where the Group is the lessor. Note 2(J) on page F-19 provides details on the Group’s approach to the treatment of leases.
The investments held in the Group’s defined benefit pension schemes also expose the Group to credit risk. Note 28 on page F-69 provides further information on the defined benefit pension schemes’ assets and liabilities.
Loans and advances, contingent liabilities, commitments, debt securities and derivatives also expose the Group to refinance risk. Refinance risk is the possibility that an outstanding exposure cannot be repaid at its contractual maturity date. If the Group does not wish to refinance the exposure then there is refinance risk if the obligor is unable to repay by securing alternative finance. This may occur for a number of reasons which may include: the borrower is in financial difficulty, because the terms required to refinance are outside acceptable appetite at the time or the customer is unable to refinance externally due to a lack of market liquidity. Refinance risk exposures are managed in accordance with the Group’s existing credit risk policies, processes and controls, and are not considered to be material given the Group’s prudent and through the cycle credit risk appetite. Where heightened refinance risk exists exposures are minimised through intensive account management and, where appropriate, are classed as impaired and/or forborne.
MEASUREMENT
The process for credit risk identification, measurement, and control is integrated into the Board-approved framework for credit risk appetite and governance.
Credit risk is measured from different perspectives using a range of appropriate modelling and scoring techniques at a number of levels of granularity, including total balance sheet, individual portfolio, pertinent concentrations and individual customer - for both new business and existing lending.Key metrics, such as total exposure, expected credit loss (ECL), risk-weighted assets, new business quality, concentration risk and portfolio performance, are reported monthly to Risk Committees and Forums.
Measures such as ECL, risk-weighted assets, observed credit performance, predicted credit quality (usually from predictive credit scoring models), collateral cover and quality, and other credit drivers (such as cash flow, affordability, leverage and indebtedness) have been incorporated into the Group's credit risk management practices to enable effective risk measurement across the Group.
In addition, stress testing and scenario analysis are used to estimate impairment losses and capital demand forecasts for both regulatory and internal purposes and to assist in the formulation of credit risk appetite.
As part of the ‘three lines of defence’ model, Risk division is the second line of defence providing oversight and independent challenge to key risk decisions taken by business management. Risk division also tests the effectiveness of credit risk management and internal credit risk controls. This includes ensuring that the control and monitoring of higher risk and vulnerable portfolios and sectors is appropriate and confirming that appropriate loss allowances for impairment are in place. Output from these reviews helps to inform credit risk appetite and credit policy.
As the third line of defence, Group Internal Audit undertakes regular risk-based reviews to assess the effectiveness of Credit risk management and controls.
MITIGATION
The Group uses a range of approaches to mitigate Credit risk.
Prudent, through the cycle credit principles, risk policies and appetite statements: the independent Risk division sets out the credit principles, credit risk policies and credit risk appetite statements. These are subject to regular review and governance, with any changes subject to an approval process. Risk teams monitor credit performance trends and the outlook. Risk teams also test the adequacy of and adherence to credit risk policies and processes throughout the Group. This includes tracking portfolio performance against an agreed set of credit risk appetite tolerances.
Robust models and controls: see model risk on page 72.
Limitations on concentration risk: there are portfolio controls on certain industries, sectors and products to reflect risk appetite as well as individual, customer and bank limit risk tolerances. Credit policies and appetite statements are aligned to the Group’s risk appetite and restrict exposure to higher risk countries and potentially vulnerable sectors and asset classes. Note 46 on page F-117 provides an analysis of loans and advances to customers by industry (for commercial customers) and product (for retail customers). Exposures are monitored to prevent both an excessive concentration of risk and single name concentrations. These concentration risk controls are not necessarily in the form of a maximum limit on exposure, but may instead require new business in concentrated sectors to fulfil additional minimum policy and/or guideline requirements. The Group’s largest credit limits are regularly monitored by the Board Risk Committee and reported in accordance with regulatory requirements.
Defined country risk management framework: the Board sets a broad maximum country risk appetite. Risk based appetite for all countries is set within the independent Risk division, taking into account economic, financial, political and social factors as well as the approved business and strategic plans of the Group.
OPERATING AND FINANCIAL REVIEW AND PROSPECTS
Specialist expertise: credit quality is managed and controlled by a number of specialist units within the business and Risk division, which provide for example: intensive management and control; security perfection; maintenance of customer and facility records; expertise in documentation for lending and associated products; sector-specific expertise; and legal services applicable to the particular market segments and product ranges offered by the Group.
Stress testing: the Group’s credit portfolios are subject to regular stress testing. In addition to the Group led, PRA and other regulatory stress tests, exercises focused on individual divisions and portfolios are also performed. For further information on stress testing process, methodology and governance see page 29.
Frequent and robust Credit risk assurance: assurance of credit risk is undertaken by an independent function operating within the Risk division which are part of the Group’s second line of defence. Their primary objective is to provide reasonable and independent assurance and confidence that credit risk is being effectively managed and to ensure that appropriate controls are in place and being adhered to. Group Internal Audit also provides assurance to the Audit Committee on the effectiveness of credit risk management controls across the Group’s activities.
Collateral
The principal types of acceptable collateral include:
•residential and commercial properties
•charges over business assets such as premises, inventory and accounts receivable
•financial instruments such as debt securities vehicles
•cash
•guarantees received from third-parties
The Group maintains appetite parameters on the acceptability of specific classes of collateral.
For non-mortgage retail lending to small businesses, collateral may include second charges over residential property and the assignment of life cover.
Collateral held as security for financial assets other than loans and advances is determined by the nature of the underlying exposure. Debt securities, including treasury and other bills, are generally unsecured, with the exception of asset-backed securities and similar instruments such as covered bonds, which are secured by portfolios of financial assets. Collateral is generally not held against loans and advances to financial institutions. However, securities are held as part of reverse repurchase or securities borrowing transactions or where a collateral agreement has been entered into under a master netting agreement. Derivative transactions with financial counterparties are typically collateralised under a Credit Support Annex (CSA) in conjunction with the International Swaps and Derivatives Association (ISDA) Master Agreement. Derivative transactions with non-financial customers are not usually supported by a CSA.
The requirement for collateral and the type to be taken at origination will be based upon the nature of the transaction and the credit quality, size and structure of the borrower. For non-retail exposures if required, the Group will often seek that any collateral include a first charge over land and buildings owned and occupied by the business, a debenture over the assets of a company or limited liability partnership, personal guarantees, limited in amount, from the directors of a company or limited liability partnership and key man insurance. The Group maintains policies setting out which types of collateral valuation are acceptable, maximum loan to value (LTV) ratios and other criteria that are to be considered when reviewing an application. The fundamental business proposition must evidence the ability of the business to generate funds from normal business sources to repay a customer or counterparty’s financial commitment, rather than reliance on the disposal of any security provided.
The extent to which collateral values are actively managed will depend on the credit quality and other circumstances of the obligor and type of underlying transaction. Although lending decisions are primarily based on expected cash flows, any collateral provided may impact the pricing and other terms of a loan or facility granted. This will have a financial impact on the amount of net interest income recognised and on internal loss given default estimates that contribute to the determination of asset quality and returns.
The Group requires collateral to be realistically valued by an appropriately qualified source, independent of both the credit decision process and the customer, at the time of borrowing. In certain circumstances, for Retail residential mortgages this may include the use of automated valuation models based on market data, subject to accuracy criteria and LTV limits. Where third-parties are used for collateral valuations, they are subject to regular monitoring and review. Collateral values are subject to review, which will vary according to the type of lending, collateral involved and account performance. Such reviews are undertaken to confirm that the value recorded remains appropriate and whether revaluation is required, considering for example, account performance, market conditions and any information available that may indicate that the value of the collateral has materially declined. In such instances, the Group may seek additional collateral and/or other amendments to the terms of the facility. The Group adjusts estimated market values to take account of the costs of realisation and any discount associated with the realisation of the collateral when estimating credit losses.
The Group considers risk concentrations by collateral providers and collateral type with a view to ensuring that any potential undue concentrations of risk are identified and suitably managed by changes to strategy, policy and/or business plans.
The Group seeks to avoid correlation or wrong-way risk where possible. Under the Group’s repurchase (repo) policy, the issuer of the collateral and the repo counterparty should be neither the same nor connected. The same rule applies for derivatives. Risk division has the necessary discretion to extend this rule to other cases where there is significant correlation. Countries with a rating equivalent to AA- or better may be considered to have no adverse correlation between the counterparty domiciled in that country and the country of risk (issuer of securities).
Refer to note 45 on page F-140 for further information on collateral.
Additional mitigation for Retail customers
The Group uses a variety of lending criteria when assessing applications for mortgages and unsecured lending. The general approval process uses credit acceptance scorecards and involves a review of an applicant’s previous credit history using internal data and information held by Credit Reference Agencies (CRA).
The Group also assesses the affordability and sustainability of lending for each borrower. For secured lending this includes use of an appropriate stressed interest rate scenario. Affordability assessments for all lending are compliant with relevant regulatory and conduct guidelines. The Group takes reasonable steps to validate information used in the assessment of a customer’s income and expenditure.
OPERATING AND FINANCIAL REVIEW AND PROSPECTS
In addition, the Group has in place quantitative limits such as maximum limits for individual customer products, the level of borrowing to income and the ratio of borrowing to collateral. Some of these limits relate to internal approval levels and others are policy limits above which the Group will typically reject borrowing applications. The Group also applies certain criteria that are applicable to specific products for example applications for buy-to-let mortgages.
For UK mortgages, the Group’s policy permits owner occupier applications with a maximum loan to value (LTV) of 95 per cent. This can increase to 100 per cent for specific products where additional security is provided by a supporter of the applicant and held on deposit by the Group. Applications with an LTV above 90 per cent are subject to enhanced underwriting criteria, including higher scorecard cut-offs and loan size restrictions.
Buy-to-let mortgages within Retail are limited to a maximum loan size of £1,000,000 and 75 per cent LTV. Buy-to-let applications must pass a minimum rental cover ratio of 125 per cent under stressed interest rates, after applicable tax liabilities. Portfolio landlords (customers with four or more mortgaged buy-to-let properties) are subject to additional controls including evaluation of overall portfolio resilience.
The Group’s policy is to reject any application for a lending product where a customer is registered as bankrupt or insolvent, or has a recent County Court Judgment or financial default registered at a CRA used by the Group above de minimis thresholds. In addition, the Group typically rejects applicants where total unsecured debt, debt-to-income ratios, or other indicators of financial difficulty exceed policy limits.
Where credit acceptance scorecards are used, new models, model changes and monitoring of model effectiveness are independently reviewed and approved in accordance with the governance framework set by the Group Model Governance Committee.
Additional mitigation for Commercial customers
Individual credit assessment and independent sanction of customer and bank limits: with the exception of small exposures to SME customers where certain relationship managers have limited delegated sanctioning authority, credit risk in commercial customer portfolios is subject to sanction by the independent Risk division, which considers the strengths and weaknesses of individual transactions, the balance of risk and reward, and how credit risk aligns to the Group and Divisional risk appetite. Exposure to individual counterparties, groups of counterparties or customer risk segments is controlled through a tiered hierarchy of delegated sanctioning authorities and risk based recommended maximum limit parameters. Approval requirements for each decision are based on a number of factors including, but not limited to, the transaction amount, the customer’s aggregate facilities, any risk mitigation in place, credit policy, risk appetite, credit risk ratings and the nature and term of the risk. The Group’s credit risk appetite criteria for counterparty and customer loan Underwriting is generally the same as that for loans intended to be held to maturity. All hard loan/bond Underwriting must be sanctioned by Risk division. A pre-approved credit matrix may be used for ‘best efforts’ underwriting.
Counterparty credit limits: limits are set against all types of exposure in a counterparty name, in accordance with an agreed methodology for each exposure type. This includes credit risk exposure on individual derivatives and securities financing transactions, which incorporates potential future exposures from market movements against agreed confidence intervals. Aggregate facility levels by counterparty are set and limit breaches are subject to escalation procedures.
Daily settlement limits: settlement risk arises in any situation where a payment in cash, securities or equities is made in the expectation of a corresponding receipt in cash, securities or equities. Daily settlement limits are established for each relevant counterparty to cover the aggregate of all settlement risk arising from the Group’s market transactions on any single day. Where possible, the Group uses Continuous Linked Settlement in order to reduce foreign exchange (FX) settlement risk.
Master netting agreements
It is credit policy that a Group approved master netting agreement must be used for all derivative and traded product transactions and must be in place prior to trading, with separate documentation required for each Group entity providing facilities. This requirement extends to trades with clients and the counterparties used for the Bank’s own hedging activities, which may also include clearing trades with Central Counterparties (CCPs).
Any exceptions must be approved by the appropriate credit sanctioner. Master netting agreements do not generally result in an offset of balance sheet assets and liabilities for accounting purposes, as transactions are usually settled on a gross basis. However, within relevant jurisdictions and for appropriate counterparty types, master nettings agreements do reduce the credit risk to the extent that, if an event of default occurs, all trades with the counterparty may be terminated and settled on a net basis. The Group’s overall exposure to credit risk on derivative instruments subject to master netting agreements can change substantially within a short period, since this is the net position of all trades under the master netting agreement.
Other credit risk transfers
The Group also undertakes asset sales, credit derivative based transactions, securitisations (including Significant Risk Transfer transactions), purchases of credit default swaps and purchase of credit insurance as a means of mitigating or reducing credit risk and/or risk concentration, taking into account the nature of assets and the prevailing market conditions.
MONITORING
In conjunction with Risk division, businesses identify and define portfolios of credit and related risk exposures and the key behaviours and characteristics by which those portfolios are managed and monitored. This entails the production and analysis of regular portfolio monitoring reports for review by senior management. Risk division in turn produces an aggregated view of credit risk across the Group, including reports on material credit exposures, concentrations, concerns and other management information, which is presented to the divisional risk committees and forums, Group Risk Committee and the Board Risk Committee.
Models
The performance of all models used in credit risk is monitored in line with the Group’s model governance framework - see model risk on page 72.
Intensive care of customers in financial difficulty
The Group operates a number of solutions to assist borrowers who are experiencing financial stress. The material elements of these solutions through which the Group has granted a concession, whether temporarily or permanently, are set out below.
Forbearance
The Group’s aim in offering forbearance and other assistance to customers in financial distress is to benefit both the customer and the Group by supporting its customers and acting in their best interests by, where possible, bringing customer facilities back into a sustainable position.
OPERATING AND FINANCIAL REVIEW AND PROSPECTS
The Group offers a range of tools and assistance to support customers who are encountering financial difficulties. Cases are managed on an individual basis, with the circumstances of each customer considered separately and the action taken judged as being appropriate and sustainable for both the customer and the Group.
Forbearance measures consist of concessions towards a debtor that is experiencing or about to experience difficulties in meeting its financial commitments. This can include modification of the previous terms and conditions of a contract or a total or partial refinancing of a troubled debt contract, either of which would not have been required had the debtor not been experiencing financial difficulties.
The provision and review of such assistance is controlled through the application of an appropriate policy framework and associated controls. Regular review of the assistance offered to customers is undertaken to confirm that it remains appropriate, alongside monitoring of customers’ performance and the level of payments received.
The Group classifies accounts as forborne at the time a customer in financial difficulty is granted a concession. However, where customers have been temporarily impacted by COVID-19, the Group has looked to follow regulator principles and guidance on the granting of concessions resulting from the impact of the pandemic.
Balances in default or classified as Stage 3 are always considered to be non-performing. Balances are non-performing, but not in default or Stage 3, if they are greater than 90 days past due (compared with 180 days past due for Stage 3 mortgages) or if they are within their 12 month non-performing forbearance cure period.
Non-performing exposures can be reclassified as Performing Forborne after a minimum 12 month cure period, providing there are no past due amounts or concerns regarding the full repayment of the exposure. A minimum of a further 24 months must pass from the date the forborne exposure was reclassified as Performing Forborne before the account can exit forbearance. If conditions to exit forbearance are not met at the end of this probation period, the exposure shall continue to be identified as forborne until all the conditions are met.
The Group’s treatment of loan renegotiations is included in the impairment policy in note 2((H) on page F-18.
Customers receiving support from UK Government sponsored programmes
To assist customers in financial distress, the Group participates in UK Government sponsored programmes for households, including the Income Support for Mortgage Interest programme, under which the Government pays the Group all or part of the interest on the mortgage on behalf of the customer. This is provided as a government loan which the customer must repay.
Support for customers during the COVID-19 pandemic
Working closely with the UK Government and regulators, the Group has continued to support its retail, small business and commercial customers through a comprehensive and unprecedented range of flexible measures to help alleviate temporary financial pressure on customers during the crisis.
For retail customers, the Group has provided payment holidays of up to three months across a range of products including mortgages, personal loans, credit cards and motor finance, with extensions available of up to six months in total, should customers request them.
The Group has also supported its retail customers with access to a £500 interest free overdraft facility and access to fixed term savings accounts without charge.
Similarly, the Group is providing significant support for its small business and commercial customers and has provided loans to businesses under the different government schemes, including Bounce Back Loan Scheme (BBLS), Coronavirus Business Interruption Loan Scheme (CBILS) and Coronavirus Large Business Interruption Loan Scheme (CLBILS). The Group has also supported its customers through repayment holidays and its own COVID-19 fund which includes fee-free lending for new overdrafts or overdraft limit increases as well as new or increased invoice discounting and finance facilities. The Group is also offering SME customers a mentoring service to help navigate a path beyond the pandemic.
LLOYDS BANK GROUP CREDIT RISK PORTFOLIO IN 2020
Overview
•The Group has continued to actively support its customers during the crisis through a range of flexible options and payment holidays across major products, as well as lending through the various UK Government support schemes
•With c.85 per cent of the Group's lending secured, with robust LTVs, and a prudent approach to credit risk appetite and risk management, the credit portfolios were well positioned entering the crisis. Considering the external environment, flows of accounts into arrears and defaults remain low
•However, the Group recognises and has provisioned on the basis that payment holidays granted and other Government support measures mean that the true underlying risk is not reflected and there is an expectation of increased arrears and defaults as these various arrangements, designed to alleviate short-term financial pressure, come to an end
•The impairment charge for the year has increased significantly to £4,060 million (2019: £1,362 million). This is due to higher expected credit loss allowances taken predominantly in the first half of the year. These reflected the deterioration in economic outlook as a consequence of the coronavirus pandemic, as well as the charges taken on restructuring cases in the Commercial Business Support Unit (BSU)
•As a result, expected credit losses on loans and advances to customers increased to £6,127 million at 31 December 2020 (31 December 2019: £3,336 million). Notwithstanding the likelihood of rising defaults, the impairment impacts are expected largely to be covered by the forward looking provisions built up in 2020, subject to there being no material changes to the Group's overall expectations of the severity of the pandemic impact on the economy
•Stage 2 loans and advances to customers as a percentage of total lending have increased by 4.6 percentage points to 10.6 per cent at 31 December 2020 (31 December 2019: 6.0 per cent), reflecting the deterioration of the Group’s forward looking economic assumptions. Of these, 91.6 per cent are up to date (31 December 2019: 83.9 per cent). Stage 2 coverage increased to 4.6 per cent (31 December 2019: 3.8 per cent)
•Stage 3 loans and advances increased by £796 million to £6,443 million (31 December 2019: £5,647 million), although as a percentage of total lending remained stable at around 1.3 per cent. Stage 3 coverage increased by 6.6 percentage points to 31.6 per cent (31 December 2019: 25.1 per cent) largely driven by additional provisions predominantly raised against pre-existing restructuring cases in Commercial Banking’s BSU and to a lesser extent in Retail, due to the change in the Group’s economic forecast of collateral values for UK Mortgages and UK Motor Finance
OPERATING AND FINANCIAL REVIEW AND PROSPECTS
Low risk culture and prudent risk appetite
•The Group continues to take a prudent approach to credit risk and a through the cycle credit risk appetite, whilst working closely with customers to support them over this challenging period
•Although not immune, the Group's credit portfolios are well positioned against an uncertain economic outlook and potential market volatility
•The Group’s effective risk management seeks to ensure early identification and management of customers and counterparties who may be showing signs of distress
•Sector and asset class concentrations within the portfolios are closely monitored and controlled, with mitigating actions taken where appropriate. Sector and product caps limit exposure to certain higher risk and vulnerable sectors and asset classes
| | | | | | | | | | | | | | | | | | | | | | | | | | | | | | | | | | | |
| Group impairment charge |
| Loans
and
advances
to customers | | Loans and advances to banks | | Financial
assets at
fair value
through other
comprehensive
income | | Undrawn
balances | | 2020 | | |
| 2019 |
| £m | | £m | | £m | | £m | | £m | | £m |
| Retail | | | | | | | | | | | |
| UK Mortgages | 475 | | | — | | | — | | | 3 | | | 478 | | | (167) | |
| Credit cards | 721 | | | — | | | — | | | 79 | | | 800 | | | 503 | |
| Loans and overdrafts | 702 | | | — | | | — | | | 37 | | | 739 | | | 445 | |
| UK Motor Finance | 224 | | | — | | | — | | | 2 | | | 226 | | | 203 | |
| Other | 117 | | | — | | | — | | | 24 | | | 141 | | | 54 | |
| 2,239 | | | — | | | — | | | 145 | | | 2,384 | | | 1,038 | |
| Commercial Banking | | | | | | | | | | | |
| SME | 244 | | | — | | | — | | | 20 | | | 264 | | | (65) | |
| Other | 921 | | | 4 | | | 4 | | | 87 | | | 1,016 | | | 378 | |
| 1,165 | | | 4 | | | 4 | | | 107 | | | 1,280 | | | 313 | |
| Other | 394 | | | — | | | 1 | | | 1 | | | 396 | | | 11 | |
| Total impairment charge | 3,798 | | | 4 | | | 5 | | | 253 | | | 4,060 | | | 1,362 | |
Group loans and advances to customers
The following pages contain analysis of the Group’s loans and advances to customers by sub-portfolio. Loans and advances to customers are categorised into the following stages:
Stage 1 assets comprise of newly originated assets (unless purchased or originated credit impaired), as well as those which have not experienced a significant increase in credit risk. These assets carry an expected credit loss allowance equivalent to the expected credit losses that result from those default events that are possible within 12 months of the reporting date (12 month expected credit losses).
Stage 2 assets are those which have experienced a significant increase in credit risk since origination. These assets carry an expected credit loss allowance equivalent to the expected credit losses arising over the lifetime of the asset (lifetime expected credit losses).
Stage 3 assets have either defaulted or are otherwise considered to be credit impaired. These assets carry a lifetime expected credit loss.
Purchased or originated credit-impaired assets (POCI) are those that have been originated or acquired in a credit impaired state. This includes within the definition of credit impaired the purchase of a financial asset at a deep discount that reflects impaired credit losses.
OPERATING AND FINANCIAL REVIEW AND PROSPECTS
| | | | | | | | | | | |
| Group’s total expected credit loss allowance | | | |
| At 31 Dec
2020 | | At 31 Dec
2019 |
| £m | | £m |
| Loans and advances to customers | | | |
| Drawn | 5,701 | | | 3,163 | |
| Undrawn | 426 | | | 173 | |
| 6,127 | | | 3,336 | |
| Loans and advances to banks | 4 | | | — | |
| Debt securities | 1 | | | 1 | |
| Amounts due from fellow Lloyds Banking Group undertakings | — | | | 43 | |
| Total expected credit loss allowance | 6,132 | | | 3,380 | |
| | | | | | | | | | | | | | | | | | | | | | | | | | | | | |
| Movements in Group's total expected credit loss allowance | | | | | | | | | |
| At 31 December 2020 | | Net ECL
increase | | Write-offs
and other | | Income
statement
charge | | At 31 December 2019 |
| £m | | £m | | £m | | £m | | £m |
| Retail | | | | | | | | | |
| UK Mortgages | 1,027 | | | 458 | | | (20) | | | 478 | | | 569 | |
| Credit cards | 923 | | | 377 | | | (423) | | | 800 | | | 546 | |
| Loans and overdrafts | 715 | | | 254 | | | (485) | | | 739 | | | 461 | |
| UK Motor Finance | 501 | | | 114 | | | (112) | | | 226 | | | 387 | |
| Other | 229 | | | 102 | | | (39) | | | 141 | | | 127 | |
| 3,395 | | | 1,305 | | | (1,079) | | | 2,384 | | | 2,090 | |
| Commercial Banking | 2,315 | | | 1,052 | | | (228) | | | 1,280 | | | 1,263 | |
| Other | 422 | | | 395 | | | (1) | | | 396 | | | 27 | |
Total1 | 6,132 | | | 2,752 | | | (1,308) | | | 4,060 | | | 3,380 | |
1 Total ECL includes £5 million relating to other non customer-related assets (31 December 2019: £44 million).
OPERATING AND FINANCIAL REVIEW AND PROSPECTS
| | | | | | | | | | | | | | | | | | | | | | | | | | | | | | | | | | | | | | | | | |
| Group loans and advances to customers and expected credit loss allowances | | | | |
| Stage 1 | | Stage 2 | | Stage 3 | | POCI | | Total | | Stage 2
as % of
total | | Stage 3
as % of
total |
| £m | | £m | | £m | | £m | | £m | | % | | % |
| At 31 December 2020 | | | | | | | | | | | | | |
| Loans and advances to customers | | | | | | | | | | | | | |
| Retail | | | | | | | | | | | | | |
| UK Mortgages | 251,418 | | | 29,018 | | | 1,859 | | | 12,511 | | | 294,806 | | | 9.8 | | | 0.6 | |
| Credit cards | 11,496 | | | 3,273 | | | 340 | | | — | | | 15,109 | | | 21.7 | | | 2.3 | |
| Loans and overdrafts | 7,710 | | | 1,519 | | | 307 | | | — | | | 9,536 | | | 15.9 | | | 3.2 | |
| UK Motor Finance | 12,786 | | | 2,216 | | | 199 | | | — | | | 15,201 | | | 14.6 | | | 1.3 | |
| Other | 17,879 | | | 1,304 | | | 184 | | | — | | | 19,367 | | | 6.7 | | | 1.0 | |
| 301,289 | | | 37,330 | | | 2,889 | | | 12,511 | | | 354,019 | | | 10.5 | | | 0.8 | |
| Commercial Banking | | | | | | | | | | | | | |
| SME | 27,015 | | | 4,500 | | | 791 | | | — | | | 32,306 | | | 13.9 | | | 2.4 | |
| Other | 29,882 | | | 9,438 | | | 2,694 | | | — | | | 42,014 | | | 22.5 | | | 6.4 | |
| 56,897 | | | 13,938 | | | 3,485 | | | — | | | 74,320 | | | 18.8 | | | 4.7 | |
Other1 | 57,422 | | | 12 | | | 69 | | | — | | | 57,503 | | | — | | | 0.1 | |
| Total gross lending | 415,608 | | | 51,280 | | | 6,443 | | | 12,511 | | | 485,842 | | | 10.6 | | | 1.3 | |
| ECL allowance on drawn balances | (1,347) | | | (2,125) | | | (1,968) | | | (261) | | | (5,701) | | | | | |
| Net balance sheet carrying value | 414,261 | | | 49,155 | | | 4,475 | | | 12,250 | | | 480,141 | | | | | |
| Group ECL allowance (drawn and undrawn) | | | | | | | | | | | | | |
| Retail | | | | | | | | | | | | | |
| UK Mortgages | 107 | | | 468 | | | 191 | | | 261 | | | 1,027 | | | 45.6 | | | 18.6 | |
| Credit cards | 240 | | | 530 | | | 153 | | | — | | | 923 | | | 57.4 | | | 16.6 | |
| Loans and overdrafts | 224 | | | 344 | | | 147 | | | — | | | 715 | | | 48.1 | | | 20.6 | |
UK Motor Finance2 | 197 | | | 171 | | | 133 | | | — | | | 501 | | | 34.1 | | | 26.5 | |
| Other | 46 | | | 124 | | | 59 | | | — | | | 229 | | | 54.1 | | | 25.8 | |
| 814 | | | 1,637 | | | 683 | | | 261 | | | 3,395 | | | 48.2 | | | 20.1 | |
| Commercial Banking | | | | | | | | | | | | | |
| SME | 142 | | | 234 | | | 126 | | | — | | | 502 | | | 46.6 | | | 25.1 | |
| Other | 172 | | | 475 | | | 1,161 | | | — | | | 1,808 | | | 26.3 | | | 64.2 | |
| 314 | | | 709 | | | 1,287 | | | — | | | 2,310 | | | 30.7 | | | 55.7 | |
| Other | 410 | | | — | | | 12 | | | — | | | 422 | | | — | | | 2.8 | |
| Total ECL allowance (drawn and undrawn) | 1,538 | | | 2,346 | | | 1,982 | | | 261 | | | 6,127 | | | 38.3 | | | 32.3 | |
Group ECL allowances (drawn and undrawn) as a % of loans and advances to customers3 | | | | | | | | | | | | | |
| Retail | | | | | | | | | | | | | |
| UK Mortgages | — | | | 1.6 | | | 10.3 | | | 2.1 | | | 0.3 | | | | | |
| Credit cards | 2.1 | | | 16.2 | | | 56.0 | | | — | | | 6.1 | | | | | |
| Loans and overdrafts | 2.9 | | | 22.6 | | | 64.2 | | | — | | | 7.6 | | | | | |
| UK Motor Finance | 1.5 | | | 7.7 | | | 66.8 | | | — | | | 3.3 | | | | | |
| Other | 0.3 | | | 9.5 | | | 39.3 | | | — | | | 1.2 | | | | | |
| 0.3 | | | 4.4 | | | 25.2 | | | 2.1 | | | 1.0 | | | | | |
| Commercial Banking | | | | | | | | | | | | | |
| SME | 0.5 | | | 5.2 | | | 15.9 | | | — | | | 1.6 | | | | | |
| Other | 0.6 | | | 5.0 | | | 43.1 | | | — | | | 4.3 | | | | | |
| 0.6 | | | 5.1 | | | 36.9 | | | — | | | 3.1 | | | | | |
| Other | 0.7 | | | — | | | 17.4 | | | — | | | 0.7 | | | | | |
| Total | 0.4 | | | 4.6 | | | 31.6 | | | 2.1 | | | 1.3 | | | | | |
1Includes reverse repos of £54.4 billion.
2UK Motor Finance for Stages 1 and 2 include £192 million relating to provisions against residual values of vehicles subject to finance leasing agreements. These provisions are included within the calculation of coverage ratios.
3Total and Stage 3 ECL allowances as a percentage of drawn balances are calculated excluding loans in recoveries in Credit cards of £67 million, £78 million in Loans and overdrafts and £34 million in Business Banking within Retail other.
OPERATING AND FINANCIAL REVIEW AND PROSPECTS
| | | | | | | | | | | | | | | | | | | | | | | | | | | | | | | | | | | | | | | | | |
| Group loans and advances to customers and expected credit loss allowances | | | | |
| Stage 1 | | Stage 2 | | Stage 3 | | POCI | | Total | | Stage 2
as % of
total | | Stage 3
as % of
total |
| £m | | £m | | £m | | £m | | £m | | % | | % |
At 31 December 20191 | | | | | | | | | | | | | |
| Loans and advances to customers | | | | | | | | | | | | | |
| Retail | | | | | | | | | | | | | |
| UK Mortgages | 257,043 | | | 16,935 | | | 1,506 | | | 13,714 | | | 289,198 | | | 5.9 | | | 0.5 | |
| Credit cards | 16,132 | | | 1,681 | | | 385 | | | — | | | 18,198 | | | 9.2 | | | 2.1 | |
| Loans and overdrafts | 8,788 | | | 1,131 | | | 293 | | | — | | | 10,212 | | | 11.1 | | | 2.9 | |
| UK Motor Finance | 13,884 | | | 1,942 | | | 150 | | | — | | | 15,976 | | | 12.2 | | | 0.9 | |
| Other | 9,904 | | | 845 | | | 150 | | | — | | | 10,899 | | | 7.8 | | | 1.4 | |
| 305,751 | | | 22,534 | | | 2,484 | | | 13,714 | | | 344,483 | | | 6.5 | | | 0.7 | |
| Commercial Banking | | | | | | | | | | | | | |
| SME | 27,206 | | | 2,507 | | | 720 | | | — | | | 30,433 | | | 8.2 | | | 2.4 | |
| Other | 43,032 | | | 3,418 | | | 2,415 | | | — | | | 48,865 | | | 7.0 | | | 4.9 | |
| 70,238 | | | 5,925 | | | 3,135 | | | — | | | 79,298 | | | 7.5 | | | 4.0 | |
Other2 | 53,778 | | | 46 | | | 28 | | | — | | | 53,852 | | | 0.1 | | | 0.1 | |
| Total gross lending | 429,767 | | | 28,505 | | | 5,647 | | | 13,714 | | | 477,633 | | | 6.0 | | | 1.2 | |
| ECL allowance on drawn balances | (669) | | | (993) | | | (1,359) | | | (142) | | | (3,163) | | | | | |
| Net balance sheet carrying value | 429,098 | | | 27,512 | | | 4,288 | | | 13,572 | | | 474,470 | | | | | |
| Group ECL allowance (drawn and undrawn) | | | | | | | | | | | | | |
| Retail | | | | | | | | | | | | | |
| UK Mortgages | 24 | | | 281 | | | 122 | | | 142 | | | 569 | | | 49.4 | | | 21.4 | |
| Credit cards | 203 | | | 218 | | | 125 | | | — | | | 546 | | | 39.9 | | | 22.9 | |
| Loans and overdrafts | 160 | | | 193 | | | 108 | | | — | | | 461 | | | 41.9 | | | 23.4 | |
UK Motor Finance3 | 216 | | | 87 | | | 84 | | | — | | | 387 | | | 22.5 | | | 21.7 | |
| Other | 36 | | | 40 | | | 51 | | | — | | | 127 | | | 31.5 | | | 40.2 | |
| 639 | | | 819 | | | 490 | | | 142 | | | 2,090 | | | 39.2 | | | 23.4 | |
| Commercial Banking | | | | | | | | | | | | | |
| SME | 45 | | | 127 | | | 101 | | | — | | | 273 | | | 46.5 | | | 37.0 | |
| Other | 60 | | | 123 | | | 763 | | | — | | | 946 | | | 13.0 | | | 80.7 | |
| 105 | | | 250 | | | 864 | | | — | | | 1,219 | | | 20.5 | | | 70.9 | |
| Other | 16 | | | 1 | | | 10 | | | — | | | 27 | | | 3.7 | | | 37.0 | |
| Total ECL allowance (drawn and undrawn) | 760 | | | 1,070 | | | 1,364 | | | 142 | | | 3,336 | | | 32.1 | | | 40.9 | |
Group ECL allowances (drawn and undrawn) as a % of loans and advances to customers4 | | | | | | | | | | | | | |
| Retail | | | | | | | | | | | | | |
| UK Mortgages | — | | | 1.7 | | | 8.1 | | | 1.0 | | | 0.2 | | | | | |
| Credit cards | 1.3 | | | 13.0 | | | 41.0 | | | — | | | 3.0 | | | | | |
| Loans and overdrafts | 1.8 | | | 17.1 | | | 57.1 | | | — | | | 4.6 | | | | | |
| UK Motor Finance | 1.6 | | | 4.5 | | | 56.0 | | | — | | | 2.4 | | | | | |
| Other | 0.4 | | | 4.7 | | | 39.5 | | | — | | | 1.2 | | | | | |
| 0.2 | | | 3.6 | | | 21.5 | | | 1.0 | | | 0.6 | | | | | |
| Commercial Banking | | | | | | | | | | | | | |
| SME | 0.2 | | | 5.1 | | | 14.0 | | | — | | | 0.9 | | | | | |
| Other | 0.1 | | | 3.6 | | | 31.6 | | | — | | | 1.9 | | | | | |
| 0.1 | | | 4.2 | | | 27.6 | | | — | | | 1.5 | | | | | |
| Other | — | | | 2.2 | | | 35.7 | | | — | | | 0.1 | | | | | |
| Total | 0.2 | | | 3.8 | | | 25.1 | | | 1.0 | | | 0.7 | | | | | |
1Prior period segmental comparatives restated. See note 4 on page F-31.
2Includes reverse repos of £51.6 billion.
3UK Motor Finance for Stages 1 and 2 include £201 million relating to provisions against residual values of vehicles subject to finance leasing agreements. These provisions are included within the calculation of coverage ratios.
4Total and Stage 3 ECL allowances as a percentage of drawn balances are calculated excluding loans in recoveries in Credit cards of £80 million and £104 million in Loans and overdrafts and £21 million in Business Banking within Retail other.
OPERATING AND FINANCIAL REVIEW AND PROSPECTS
| | | | | | | | | | | | | | | | | | | | | | | | | | | | | | | | | | | | | | | | | | | | | | | | | | | | | | | | | | | | | | | | | | | | | | | | | | | | | | | | | | | | | | | | | |
| Group Stage 2 loans and advances to customers |
| Up to date | | 1-30 days past due2 | | Over 30 days past due | | Total |
| PD movements | | Other1 | | | | | | | | | | | | | | | | | | |
| Gross
lending | | ECL3 | | As
% of
gross
lending | | Gross
lending | | ECL3 | | As
% of
gross
lending | | Gross
lending | | ECL3 | | As
% of
gross
lending | | Gross
lending | | ECL3 | | As
% of
gross
lending | | Gross
lending | | ECL3 | | As
% of
gross
lending |
| £m | | £m | | % | | £m | | £m | | % | | £m | | £m | | % | | £m | | £m | | % | | £m | | £m | | % |
| At 31 December 2020 | | | | | | | | | | | | | | | | | | | | | | | | | | | | |
| Retail | | | | | | | | | | | | | | | | | | | | | | | | | | | | | |
| UK Mortgages | 22,569 | | | 215 | | | 1.0 | | | 3,078 | | | 131 | | | 4.3 | | | 1,648 | | | 43 | | | 2.6 | | | 1,723 | | | 79 | | | 4.6 | | | 29,018 | | | 468 | | | 1.6 | |
| Credit cards | 2,924 | | | 408 | | | 14.0 | | | 220 | | | 76 | | | 34.5 | | | 93 | | | 27 | | | 29.0 | | | 36 | | | 19 | | | 52.8 | | | 3,273 | | | 530 | | | 16.2 | |
| Loans and overdrafts | 959 | | | 209 | | | 21.8 | | | 388 | | | 68 | | | 17.5 | | | 126 | | | 45 | | | 35.7 | | | 46 | | | 22 | | | 47.8 | | | 1,519 | | | 344 | | | 22.6 | |
| UK Motor Finance | 724 | | | 62 | | | 8.6 | | | 1,321 | | | 55 | | | 4.2 | | | 132 | | | 37 | | | 28.0 | | | 39 | | | 17 | | | 43.6 | | | 2,216 | | | 171 | | | 7.7 | |
| Other | 512 | | | 56 | | | 10.9 | | | 651 | | | 44 | | | 6.8 | | | 69 | | | 14 | | | 20.3 | | | 72 | | | 10 | | | 13.9 | | | 1,304 | | | 124 | | | 9.5 | |
| 27,688 | | | 950 | | | 3.4 | | | 5,658 | | | 374 | | | 6.6 | | | 2,068 | | | 166 | | | 8.0 | | | 1,916 | | | 147 | | | 7.7 | | | 37,330 | | | 1,637 | | | 4.4 | |
Commercial
Banking | | | | | | | | | | | | | | | | | | | | | | | | | | | | | |
| SME | 4,229 | | | 219 | | | 5.2 | | | 150 | | | 6 | | | 4.0 | | | 40 | | | 5 | | | 12.5 | | | 81 | | | 4 | | | 4.9 | | | 4,500 | | | 234 | | | 5.2 | |
| Other | 9,151 | | | 469 | | | 5.1 | | | 83 | | | 3 | | | 3.6 | | | 28 | | | 2 | | | 7.1 | | | 176 | | | 1 | | | 0.6 | | | 9,438 | | | 475 | | | 5.0 | |
| 13,380 | | | 688 | | | 5.1 | | | 233 | | | 9 | | | 3.9 | | | 68 | | | 7 | | | 10.3 | | | 257 | | | 5 | | | 1.9 | | | 13,938 | | | 709 | | | 5.1 | |
| Other | 1 | | | — | | | — | | | 11 | | | — | | | — | | | — | | | — | | | — | | | — | | | — | | | — | | | 12 | | | — | | | — | |
| Total | 41,069 | | | 1,638 | | | 4.0 | | | 5,902 | | | 383 | | | 6.5 | | | 2,136 | | | 173 | | | 8.1 | | | 2,173 | | | 152 | | | 7.0 | | | 51,280 | | | 2,346 | | | 4.6 | |
| At 31 December 2019 | | | | | | | | | | | | | | | | | | | | | | | | | | | | |
| Retail | | | | | | | | | | | | | | | | | | | | | | | | | | | | | |
| UK Mortgages | 10,846 | | | 83 | | | 0.8 | | | 2,593 | | | 107 | | | 4.1 | | | 1,876 | | | 33 | | | 1.8 | | | 1,620 | | | 58 | | | 3.6 | | | 16,935 | | | 281 | | | 1.7 | |
| Credit cards | 1,093 | | | 129 | | | 11.8 | | | 423 | | | 47 | | | 11.1 | | | 124 | | | 26 | | | 21.0 | | | 41 | | | 16 | | | 39.0 | | | 1,681 | | | 218 | | | 13.0 | |
| Loans and overdrafts | 569 | | | 88 | | | 15.5 | | | 348 | | | 42 | | | 12.1 | | | 158 | | | 41 | | | 25.9 | | | 56 | | | 22 | | | 39.3 | | | 1,131 | | | 193 | | | 17.1 | |
| UK Motor Finance | 543 | | | 27 | | | 5.0 | | | 1,232 | | | 30 | | | 2.4 | | | 135 | | | 21 | | | 15.6 | | | 32 | | | 9 | | | 28.1 | | | 1,942 | | | 87 | | | 4.5 | |
| Other | 324 | | | 14 | | | 4.3 | | | 363 | | | 12 | | | 3.3 | | | 80 | | | 9 | | | 11.3 | | | 78 | | | 5 | | | 6.4 | | | 845 | | | 40 | | | 4.7 | |
| 13,375 | | | 341 | | | 2.5 | | | 4,959 | | | 238 | | | 4.8 | | | 2,373 | | | 130 | | | 5.5 | | | 1,827 | | | 110 | | | 6.0 | | | 22,534 | | | 819 | | | 3.6 | |
Commercial
Banking | | | | | | | | | | | | | | | | | | | | | | | | | | | | | |
| SME | 2,014 | | | 104 | | | 5.2 | | | 410 | | | 17 | | | 4.1 | | | 56 | | | 6 | | | 10.7 | | | 27 | | | — | | | — | | | 2,507 | | | 127 | | | 5.1 | |
| Other | 1,881 | | | 75 | | | 4.0 | | | 1,238 | | | 45 | | | 3.6 | | | 61 | | | 2 | | | 3.3 | | | 238 | | | 1 | | | 0.4 | | | 3,418 | | | 123 | | | 3.6 | |
| 3,895 | | | 179 | | | 4.6 | | | 1,648 | | | 62 | | | 3.8 | | | 117 | | | 8 | | | 6.8 | | | 265 | | | 1 | | | 0.4 | | | 5,925 | | | 250 | | | 4.2 | |
| Other | — | | | — | | | — | | | 42 | | | 1 | | | 2.4 | | | 1 | | | — | | | — | | | 3 | | | — | | | — | | | 46 | | | 1 | | | 2.2 | |
| Total | 17,270 | | | 520 | | | 3.0 | | | 6,649 | | | 301 | | | 4.5 | | | 2,491 | | | 138 | | | 5.5 | | | 2,095 | | | 111 | | | 5.3 | | | 28,505 | | | 1,070 | | | 3.8 | |
1Includes forbearance, client and product-specific indicators not reflected within quantitative PD assessments.
2Includes assets that have triggered PD movements, or other rules, given that being 1-29 days in arrears in and of itself is not a Stage 2 trigger.
3Expected credit loss allowances on loans and advances to customers (drawn and drawn).
The Group’s assessment of a significant increase in credit risk, and resulting categorisation of Stage 2, includes customers moving into early arrears as well as a broader assessment that an up to date customer has experienced a level of deterioration in credit risk since origination. A more sophisticated assessment is required for up to date customers, which varies across divisions and product type. This assessment incorporates specific triggers such as a significant proportionate increase in probability of default relative to that at origination, recent arrears, forbearance activity, internal watch lists and external bureau flags. Up to date exposures in Stage 2 are likely to show lower levels of expected credit loss (ECL) allowance relative to those that have already moved into arrears given that an arrears status typically reflects a stronger indication of future default and greater likelihood of credit losses.
Retail
•The Retail portfolio has remained robust and well positioned throughout the COVID-19 pandemic. Risk management has been enhanced since the last financial crisis, with strong affordability and indebtedness controls for both new and existing lending and a prudent risk appetite approach. This is evident in the significant improvement in credit quality and low arrears rates. However, customers have been significantly impacted by the pandemic and credit performance is expected to worsen as a result
•The Group has provided significant levels of support to Retail customers through 2020. Since March 2020, the Group has approved over 1.3 million payment holidays, while personal current accounts customers have had access to up to £500 interest free arranged overdrafts and repossession activity has been suspended
•As a result of payment holidays, the arrears rate across the portfolios is below pre-crisis levels
•The Group has taken targeted steps across the Retail product offering to implement tighter credit quality controls on key risk indicators such as indebtedness and credit scores to ensure that customers and the bank are protected
•The Group has participated fully in the Bounce Back Loan Scheme (BBLS) and the Coronavirus Business Interruption Loan Scheme (CBILS) for Retail Business Banking customers, where government guarantees are in place at 100 per cent and 80 per cent, respectively
•The Retail impairment charge increased to £2,384 million for 2020 compared to £1,038 million for 2019, largely driven by updates to the Group’s economic forecast following the coronavirus outbreak
OPERATING AND FINANCIAL REVIEW AND PROSPECTS
•Existing IFRS 9 staging rules and triggers have been maintained across Retail, with additional tightening on the credit cards portfolio. Transfers between stages have been primarily driven by credit risk rating movements and the estimated impact of the economic factors on a customer’s forward looking default risk
•Total Retail expected credit loss (ECL) allowance as a percentage of drawn loans and advances (coverage) increased to 1.0 per cent (31 December 2019: 0.6 per cent) due to the updates in the Group’s economic forecast. As at 31 December 2020, the majority of ECL increases are reflected within Stage 2 under IFRS 9, representing cases which have observed a Significant Increase in Credit Risk since origination (SICR). As such the proportion of Stage 2 loans and advances comprises 10.5 per cent of the Retail portfolio (31 December 2019: 6.5 per cent), of which 89.3 per cent are up to date, performing loans
•Stage 2 ECL coverage increased to 4.4 per cent (31 December 2019: 3.6 per cent), following updates to the Group’s economic forecast. This was offset by a slight reduction in UK Mortgages Stage 2 ECL coverage where a greater proportion of Stage 2 balances was from lower risk and up to date accounts, transferred into Stage 2 based on the forward looking view of their credit performance
•Stage 3 loans and advances have remained broadly flat at 0.8 per cent of total loans and advances (31 December 2019: 0.7 per cent, Stage 3 ECL coverage increased to 25.2 per cent (31 December 2019: 21.5 per cent) due to a combination of the UK Mortgages and Motor Finance portfolios where the impact of the coronavirus outbreak on collateral values is expected to result in increased loss given default (LGD), in addition to the impact of changes to collections processes within the credit cards portfolio
Portfolios
UK Mortgages
•The UK Mortgages portfolio is well positioned with low arrears and a strong Loan to Value (LTV) profile. The Group has actively improved the quality of the portfolio over the years using robust affordability and credit controls, whilst the balances of higher risk portfolios originated prior to 2008 have continued to reduce
•Whilst the housing market has remained resilient throughout 2020 with strong customer demand, the Group has taken action to protect credit quality, for example by reducing the maximum LTV on new lending to 85 per cent for the majority of 2020
•Total loans and advances increased to £294.8 billion (31 December 2019: £289.2 billion), with a small reduction in average LTV to 43.5 per cent (31 December 2019: 44.9 per cent). The proportion of balances with an LTV greater than 90 per cent decreased to 0.6 per cent (31 December 2019: 2.5 per cent). The average LTV of new business decreased to 63.9 per cent (31 December 2019: 64.3 per cent)
•The impairment charge was £478 million for 2020 compared to a release of £167 million for 2019, reflecting charges due to the weaker economic outlook. Total ECL coverage increased to 0.3 per cent (31 December 2019: 0.2 per cent)
•Stage 2 loans and advances increased to 9.8 per cent of the portfolio (31 December 2019: 5.9 per cent) which has contributed to a slight reduction in Stage 2 ECL coverage to 1.6 per cent (31 December 2019: 1.7 per cent) given a greater proportion of Stage 2 balances from lower risk up to date accounts, transferred into Stage 2 based on the forward looking view of their credit performance
•Stage 3 ECL Coverage increased to 10.3 per cent (31 December 2019: 8.1 per cent) largely due to the revised outlook for house prices across the multiple economic scenarios utilised for IFRS 9 provisioning
Credit cards
•Credit cards balances decreased to £15.1 billion (31 December 2019: £18.2 billion) due to reduced levels of customer spend, resulting in a reduction in the volume of customers with highly utilised cards
•The credit card book has performed well in recent years, with lower arrears rates compared to the High Street Bank peer group
•The impairment charge was £800 million for 2020 (2019: £503 million), with overall ECL coverage increasing to 6.1 per cent (31 December 2019: 3.0 per cent) and Stage 2 ECL coverage increasing to 16.2 per cent (31 December: 13.0 per cent). The increases were largely due to the weaker outlook within our economic forecasts
•In addition to increases caused by the weakening economic outlook, Stage 2 loans and advances also increased due to a stricter criteria adopted to trigger movements from Stage 1 to Stage 2. As a result, Stage 2 loans and advances as a percentage of total loans and advances increased to 21.7 per cent (31 December 2019: 9.2 per cent)
•Stage 3 ECL coverage increased to 56.0 per cent (31 December 2019: 41.0 per cent). This resulted from a refresh of data used to calculate loss rates that reflects changes in collections policy, some realignment of coverage across stages and a strengthening of coverage given the current environment
OPERATING AND FINANCIAL REVIEW AND PROSPECTS
Loans and overdrafts
•Loans and advances for personal current account and the personal loans portfolios decreased to £9.5 billion (31 December 2019: £10.2 billion) due to reduced customer spend and demand for credit
•The impairment charge was £739 million for the full year 2020 compared to £445 million for the full year 2019. This increase is primarily due to the weaker outlook within our economic forecasts, increasing both Stage 2 ECL coverage to 22.6 per cent (31 December 2019:17.1 per cent) and overall ECL coverage to 7.6 per cent (31 December 2019: 4.6 per cent)
UK Motor Finance
•The UK Motor Finance portfolio decreased slightly from £16.0 billion for 2019 to £15.2 billion for 2020 due to reduced market activity as a result of the pandemic
•The impairment charge increased to £226 million for 2020 compared to £203 million for 2019, due to the weaker outlook within our economic forecasts. ECL coverage increased to 3.3 per cent (31 December 2019: 2.4 per cent)
•Updates to Residual Value (RV) and Voluntary Termination (VT) risk held against Personal Contract Purchase (PCP) and Hire Purchase (HP) lending included within the impairment charge, however because the Group has adopted a prudent approach to modelling this risk in recent years, the updates to the Group’s economic outlook have not resulted in a material change to provisions, which remained relatively unchanged at £192 million as at 31 December 2020 (31 December 2019: £201 million)
•Stage 2 ECL coverage increased to 7.7 per cent (31 December 2019: 4.5 per cent) and Stage 3 ECL coverage increased to 66.8 per cent (31 December 2019: 56.0 per cent) both of which were due principally to the impact on Credit ECL from updates to the Group’s outlook on used car prices. Credit and RV provisioning are aligned in the assumption of an anticipated near-term reduction in car prices, with an expected slow recovery until 2024
Other
•Other loans and advances increased to £19.4 billion (31 December 2019: £10.9 billion). The increase was largely driven by increased lending to Retail Business Banking customers; £7.1 billion Bounce Back Loans, which are fully guaranteed by the UK Government, and £254 million Coronavirus Business Interruption Loans which are 80 per cent guaranteed
•The impairment charge was £141 million for 2020 compared to £54 million for 2019, primarily due to the weaker outlook within our economic forecasts
| | | | | | | | |
| Retail UK Mortgages loans and advances to customers | | |
| At 31 Dec
20201 | At 31 Dec
20191 |
| £m | £m |
| Mainstream | 234,273 | | 227,975 | |
| Buy-to-let | 49,634 | | 49,086 | |
| Specialist | 10,899 | | 12,137 | |
| Total | 294,806 | | 289,198 | |
1Balances include the impact of HBOS related acquisition adjustments.
OPERATING AND FINANCIAL REVIEW AND PROSPECTS
Interest only mortgages
The Group provides interest only mortgages to owner occupier mortgage customers whereby only payments of interest are made for the term of the mortgage with the customer responsible for repaying the principal outstanding at the end of the loan term. At 31 December 2020, owner occupier interest only balances as a proportion of total owner occupier balances had reduced to 21.6 per cent (31 December 2019: 23.9 per cent). The average indexed loan to value remained low at 39.0 per cent (31 December 2019: 41.2 per cent).
For existing interest only mortgages, a contact strategy is in place during the term of the mortgage to ensure that customers are aware of their obligations to repay the principal upon maturity of the loan.
Treatment strategies are in place to help customers anticipate and plan for repayment of capital at maturity and support those who may have difficulty in repaying the principal amount. A dedicated specialist team supports customers who have passed their contractual maturity date and are unable to fully repay the principal. A range of treatments are offered to customers based on their individual circumstances to create fair and sustainable outcomes.
| | | | | | | | |
| Analysis of owner occupier interest only mortgages |
| At 31 Dec
2020 | At 31 Dec
2019 |
| Total | Total |
| Interest only balances (£m) | 53,077 | | 57,437 | |
| Stage 1 (%) | 69.0 | | 75.6 | |
| Stage 2 (%) | 16.3 | | 10.0 | |
| Stage 3 (%) | 1.7 | | 1.2 | |
| Purchased or originated credit-impaired (%) | 13.0 | | 13.2 | |
| | |
Average loan to value (%)1 | 39.0 | | 41.2 | |
| | |
| Maturity profile (£m) | | |
| Due | 1,626 | | 1,459 | |
| 1 year | 2,045 | | 1,968 | |
| 2-5 years | 9,450 | | 9,852 | |
| 6-10 years | 18,351 | | 18,606 | |
| >11 years | 21,605 | | 25,552 | |
| | |
Past term interest only balances (£m)2 | 1,715 | | 1,677 | |
| Stage 1 (%) | 0.7 | | 0.9 | |
| Stage 2 (%) | 28.9 | | 23.9 | |
| Stage 3 (%) | 24.2 | | 21.8 | |
| Purchased or originated credit-impaired (%) | 46.2 | | 53.4 | |
| | |
Average loan to value (%)1 | 34.4 | | 35.7 | |
| Negative equity (%) | 2.5 | | 2.8 | |
12020 interest only LTVs (loan to value) use Markit’s 2019 Halifax House Price Index; 2019 LTVs have been restated on the same basis.
2Balances where all interest only elements have moved past term. Some may subsequently have had a term extension, so are no longer classed as due.
OPERATING AND FINANCIAL REVIEW AND PROSPECTS
Retail forbearance
The basis of disclosure for forbearance is aligned to definitions used in the European Banking Authority’s FINREP reporting. Total forbearance for the major retail portfolios has improved by £259 million to £5.9 billion driven primarily by a reduction in customers where arrears are written on to the loan balance (capitalisations).
The main customer treatments included are: repair, where arrears are written on to the loan balance and the arrears position cancelled; instances where there are suspensions of interest and/or capital repayments; past term interest only mortgages; and refinance personal loans.
As a percentage of loans and advances, forbearance loans improved to 1.7 per cent at 31 December 2020 (31 December 2019: 1.8 per cent).
Total expected credit losses (ECL) as a proportion of loans and advances which are forborne has increased to 7.0 per cent (31 December 2019: 5.0 per cent).
| | | | | | | | | | | | | | | | | |
| Retail forborne loans and advances (audited) |
| Total | Of which
Stage 2 | Of which
Stage 3 | Of which
purchased or
originated
credit-
impaired | Expected credit losses as a % of total loans and advances which are foreborne1 |
| £m | £m | £m | £m | % |
At 31 December 20202 | | | | | |
| UK Mortgages | 5,106 | | 1,192 | | 823 | | 3,081 | | 3.6 | |
| Credit cards | 356 | | 130 | | 191 | | — | | 40.0 | |
| Loans and overdrafts | 353 | | 154 | | 146 | | — | | 36.5 | |
| UK Motor Finance | 88 | | 50 | | 34 | | — | | 36.3 | |
| Total | 5,903 | | 1,526 | | 1,194 | | 3,081 | | 7.0 | |
| At 31 December 2019 | | | | | |
| UK Mortgages | 5,559 | | 1,156 | | 736 | | 3,659 | | 2.1 | |
| Credit cards | 321 | | 65 | | 210 | | — | | 32.8 | |
| Loans and overdrafts | 219 | | 103 | | 95 | | — | | 28.8 | |
| UK Motor Finance | 63 | | 35 | | 26 | | — | | 30.4 | |
| Total | 6,162 | | 1,359 | | 1,067 | | 3,659 | | 5.0 | |
1Expected credit loss allowance as a percentage of total loans and advances which are forborne is calculated excluding loans in recoveries for Credit cards, Loans and overdrafts (31 December 2020: £75 million; 31 December 2019: £82 million).
2In line with FINREP reporting and regulatory guidelines, Retail forborne loans and advances do not include COVID-19 moratoria.
OPERATING AND FINANCIAL REVIEW AND PROSPECTS
Commercial Banking
Portfolio Management and Supporting the Group's Customers
•Commercial Banking has actively supported its customers during this difficult time, through a range of propositions, including capital repayment holidays, working capital line increases and financial covenant waivers, as well as supporting small businesses and corporates through full use of UK Government schemes
•The coronavirus has resulted in widespread industry disruption, with some sectors such as travel, transportation, non-essential retail and hospitality particularly impacted, although as a proportion of the Group’s overall lending, these sectors remain relatively modest. The Group expects recovery to be slow in a number of vulnerable sectors and anticipates longer term structural changes in a number of these. Sector and credit risk appetite continue to be proactively managed to ensure the Group is protected and clients are supported in the right way
•As the crisis has developed, Commercial Banking has continued to support its more vulnerable clients early through focused risk management via the Group’s Watchlist and Business Support framework
•With the exception of certain risk appetite extensions made to accommodate UK Government scheme guidelines, particularly Bounce Back Loans and to a lesser extent, Coronavirus Business Interruption Loans (where government guarantees are in place at 100 per cent and 80 per cent, respectively), lending continues to be in line with the usual approach to credit risk and through the cycle credit risk appetite: credit analysis is undertaken to ensure continued financial viability, notwithstanding any short-term coronavirus related pressure
•Although the portfolios were well positioned pre crisis, as expected, deterioration has been seen with downgrades in credit risk ratings observed, although more so in the larger corporates segment, than in the SME book, which remains predominantly a secured portfolio. Risk rating downgrades to sub investment grade or equivalent have, however, been more modest
•Credit impacts were relatively muted in the SME portfolio in 2020. Observed credit quality is likely to be influenced by the significant temporary support provided by the Government in light of the COVID-19 pandemic, which has the potential to distort underlying credit risk. The Group expects arrears and defaults to increase in 2021 as this support comes to an end. Crystallisation of these impacts is expected to start from the second quarter of 2021 as payments start to fall due, and are anticipated to be protracted over a number of years, given the flexible payment deferral options available under the various government lending schemes
•Significant uncertainties remain, relating to both the coronavirus pandemic and the full impact of the UK's exit from the European Union on the portfolios. Notwithstanding this, the Group will continue to balance prudent risk appetite with ensuring support for financially viable clients on their road to recovery
Impairments
•The net impairment charge increased to £1,280 million in 2020, compared with £313 million in 2019. The increase largely reflects charges following updates to the economic outlook, together with charges on a small number of existing Stage 3 large corporate restructuring cases in the Business Support Unit (BSU), where coronavirus has directly hampered the client's existing recovery strategy and impairments crystallising on a small number of single name charges in the BSU
•As a result, expected credit loss allowances increased by £1,091 million to £2,310 million at 31 December 2020. The Group recognises that credit quality has been supported by the temporary measures provided by the UK Government schemes and the existing expected credit loss provision balance as at 31 December 2020 assumes additional losses will emerge as the support subsides and structural change emerges in some sectors
•Stage 3 loans and advances increased to £3,485 million (31 December 2019: £3,135 million) and given the overall Commercial portfolio reduction, as a proportion of total loans and advances, increased to 4.7 per cent (31 December 2019: 4.0 per cent). The increase was driven by non-SME flows to Stage 3 partially offset by repayments and write-offs. SME flows remain suppressed. Stage 3 ECL coverage increased to 36.9 per cent (31 December 2019: 27.6 per cent) predominantly driven by the additional provisions raised against the existing restructuring cases in the BSU
•Stage 2 loans and advances have increased by £8,013 million to £13,938 million at 31 December 2020, largely driven by the IFRS 9 forward look PD staging trigger, rather than actual PD deterioration, with 98 per cent of Stage 2 balances being current and up to date. As a result, Stage 2 loans as a proportion of total loans and advances to customers increased to 18.8 per cent (31 December 2019: 7.5 per cent). Stage 2 ECL coverage was higher at 5.1 per cent (31 December 2019: 4.2 per cent) with the increase in coverage a direct result of the forward look multiple economic scenarios
Commercial Banking UK Direct Real Estate
•Commercial Banking UK Direct Real Estate gross lending stood at £12.4 billion at 31 December 2020 (net of exposures subject to protection through Significant Risk Transfer securitisations). The Group has a further £1.0 billion of UK Direct Real Estate exposure in Business Banking within the Retail division
•The Group classifies Direct Real Estate as exposure which is directly supported by cash flows from property activities (as opposed to trading activities, such as hotels, care homes and housebuilders). Exposures of £5.5 billion to social housing providers are also excluded
•Recognising this is a cyclical sector, appropriate caps are in place to control origination and exposure. Focus remains on the UK market and business propositions have been written in line with a prudent, through the cycle risk appetite with conservative LTVs, strong quality of income and proven management teams
•Overall performance has remained generally acceptable, although an increase in cases moving to Watchlist has been seen, with some transfers to BSU concentrated in the retail/shopping centres sub sector. This is somewhat to be expected, as overall rent collection has been impacted by COVID-19, particularly in the retail space given the number of closed stores throughout the lockdowns, though the office sub sector has been reasonably resilient. Despite these challenges the portfolio is relatively well positioned and proactively managed with appropriate risk mitigants in place:
–Exposures over £1 million continue to be heavily weighted towards investment real estate (c.90 per cent) over development. Of these investment exposures, over 75 per cent have an LTV of less than 60 per cent, with an average LTV of 50 per cent
–C.90 per cent of exposures greater than £5 million have an interest cover ratio of greater than 2.0 times and in SME, LTV at origination has been typically limited to c.55 per cent, given prudent repayment cover criteria (including a notional base rate stress)
–Approximately 65 per cent of exposures over £1 million relate to commercial real estate (with no speculative development lending) with the remainder related to residential real estate. The underlying sub-sector split is diversified with c.13 per cent of exposures secured by Retail assets, with appetite tightened since 2018
–The Office portfolio is focused on prime locations with strong sponsors and low LTVs, as well as no speculative commercial development
–Use of Significant Risk Transfer (SRT) securitisations also acts as a risk mitigant, with run off of these carefully managed and tracked
OPERATING AND FINANCIAL REVIEW AND PROSPECTS
–Both investment and development lending is subject to specific credit risk appetite criteria. Development lending criteria includes maximum loan to gross development value and maximum loan to cost, with funding typically only released against completed work, as confirmed by the Group’s monitoring quantity surveyor
| | | | | | | | | | | | | | | | | | | | | | | | | | | | | |
| LTV – UK Direct Real Estate |
| At 31 December 20201 | | At 31 December 20191 |
| Stage 1/2 | Stage 3 | Total | | | Stage 1/2 | Stage 3 | Total | |
| £m | £m | £m | % | | £m | £m | £m | % |
| Investment Exposures > £1m | | | | | | | | | |
| Less than 60% | 5,942 | | 48 | | 5,990 | | 80.2 | | | 6,136 | | 89 | | 6,225 | | 79.2 | |
| 60% to 70% | 826 | | 7 | | 833 | | 11.2 | | | 911 | | 14 | | 925 | | 11.8 | |
| 70% to 80% | 143 | | — | | 143 | | 1.9 | | | 117 | | 7 | | 124 | | 1.6 | |
| 80% to 100% | 48 | | 4 | | 52 | | 0.7 | | | 138 | | 38 | | 176 | | 2.2 | |
| 100% to 120% | 69 | | 70 | | 139 | | 1.9 | | | 26 | | 37 | | 63 | | 0.8 | |
| 120% to 140% | — | | 40 | | 40 | | 0.5 | | | 4 | | 12 | | 16 | | 0.2 | |
| Greater than 140% | — | | 47 | | 47 | | 0.6 | | | 18 | | 1 | | 19 | | 0.2 | |
Unsecured2 | 125 | | 97 | | 222 | | 3.0 | | | 311 | | — | | 311 | | 4.0 | |
| Total Investment >£1m | 7,153 | | 313 | | 7,466 | | 100.0 | | | 7,661 | | 198 | | 7,859 | | 100.0 | |
| Investment <£1m | 3,238 | | 41 | | 3,279 | | | | 3,455 | | 88 | | 3,543 | | |
| Total Investment | 10,391 | | 354 | | 10,745 | | | | 11,116 | | 286 | | 11,402 | | |
| Development | 1,620 | | 27 | | 1,647 | | | | 1,805 | | 58 | | 1,863 | | |
| Total | 12,011 | | 381 | | 12,392 | | | | 12,921 | | 344 | | 13,265 | | |
1Excludes Commercial Banking UK Direct Real Estate exposures subject to protection through Significant Risk Transfer transactions.
2Predominantly Investment grade corporate CRE lending where Lloyds Bank Group is relying on the corporate covenant.
Commercial Banking forbearance
| | | | | | | | |
| Commercial Banking forborne loans and advances (audited) |
| Total | Of which
Stage 3 |
| £m | £m |
| At 31 December 2020 | | |
| Type of forbearance | | |
| Refinancing | 16 | | 15 | |
| Modification | 4,271 | | 3,470 | |
| Total | 4,287 | | 3,485 | |
| At 31 December 2019 | | |
| Type of forbearance | | |
| Refinancing | 70 | | 41 | |
| Modification | 3,809 | | 2,926 | |
| Total | 3,879 | | 2,967 | |
| | | | | | | | | | | | | | | | | | | | | | | |
Commercial Banking lending in key coronavirus-impacted sectors1 |
| Drawn | | Undrawn | | Drawn and undrawn | | Drawn as a
% of Group
loans and
advances |
| £bn | | £bn | | £bn | | % |
| At 31 December 2020 | | | | | | | |
Automotive dealerships2 | 1.7 | | | 2.1 | | | 3.8 | | | 0.4 | |
| Retail non-food | 2.2 | | | 1.5 | | | 3.7 | | | 0.5 | |
| Oil and gas | 1.1 | | | 2.5 | | | 3.6 | | | 0.2 | |
| Construction | 1.2 | | | 1.6 | | | 2.8 | | | 0.3 | |
| Passenger transport | 1.1 | | | 1.1 | | | 2.2 | | | 0.2 | |
| Hotels | 1.9 | | | 0.3 | | | 2.2 | | | 0.4 | |
| Leisure | 0.7 | | | 0.7 | | | 1.4 | | | 0.1 | |
| Restaurants and bars | 0.7 | | | 0.3 | | | 1.0 | | | 0.1 | |
| Total | 10.6 | | | 10.1 | | | 20.7 | | | 2.2 | |
1Lending classified using ONS SIC codes at legal entity level.
2Automotive dealerships includes Black Horse Motor Wholesale lending (within Retail Division).
OPERATING AND FINANCIAL REVIEW AND PROSPECTS
LOAN PORTFOLIO
SUMMARY OF LOAN LOSS EXPERIENCE
| | | | | | | | | | | |
| 2020 | 2019 | 2018 |
| IFRS | £m | £m | £m |
| Gross lending to banks and customers | 491,796 | | 482,485 | | 470,757 | |
| Allowance for impairment losses in relation to loans and advances to banks and customers | 5,705 | | 3,163 | | 3,021 | |
| Ratio of allowance for credit losses to total loans (%) | 1.2 | | 0.7 | | 0.6 | |
| | | | | | | | | | | |
| 2020 | 2019 | 2018 |
| IFRS | £m | £m | £m |
| Advances written off, net of recoveries | | | |
| Loans and advances to banks | — | | — | | — | |
| Loans and advances to customers: | | | |
| Mortgages | (71) | | (38) | | 7 | |
| Other personal lending | (849) | | (768) | | (655) | |
| Property companies and construction | (65) | | (362) | | (135) | |
| Financial, business and other services | (39) | | (146) | | (202) | |
| Transport, distribution and hotels | (52) | | (49) | | (33) | |
| Manufacturing | (6) | | (1) | | (1) | |
| Other | (197) | | (93) | | 22 | |
| Total net advances written off | (1,279) | | (1,457) | | (997) | |
Net write-offs during the year represented 0.3 per cent of average lending (2019: 0.3 per cent; 2018: 0.2 per cent); for mortgages, net write-offs in the year represented less than 0.03 per cent of average lending (2019: less than 0.02 per cent).
| | | | | | | | | | | | | | | | | | | | | | | |
| Allowance for expected credit losses | | As a percentage of closing lending |
| 2020 | 2019 | 2018 | | 2020 | 2019 | 2018 |
| IFRS | £m | £m | £m | | % | % | % |
| | | | | | | |
| Loans and advances to banks | 4 | | — | | 1 | | | 0.1 | | — | | — | |
| Loans and advances to customers: | | | | | | | |
| Mortgages | 1,075 | | 611 | | 509 | | | 0.4 | | 0.2 | | 0.2 | |
| Other personal lending | 1,649 | | 931 | | 822 | | | 6.5 | | 3.2 | | 2.9 | |
| Property companies and construction | 825 | | 443 | | 765 | | | 2.7 | | 1.4 | | 2.4 | |
| Financial, business and other services | 440 | | 191 | | 391 | | | 0.6 | | 0.3 | | 0.6 | |
| Transport, distribution and hotels | 917 | | 502 | | 161 | | | 6.4 | | 4.0 | | 1.2 | |
| Manufacturing | 111 | | 58 | | 65 | | | 2.5 | | 1.2 | | 1.0 | |
| Other | 684 | | 427 | | 307 | | | 2.4 | | 1.5 | | 1.1 | |
| At 31 December | 5,705 | | 3,163 | | 3,021 | | | 1.2 | | 0.7 | | 0.6 | |
OPERATING AND FINANCIAL REVIEW AND PROSPECTS
FUNDING AND LIQUIDITY RISK
DEFINITION
Funding risk is defined as the risk that Lloyds Bank Group does not have sufficiently stable and diverse sources of funding or the funding structure is inefficient. Liquidity risk is defined as the risk that Lloyds Bank Group has insufficient financial resources to meet its commitments as they fall due, or can only secure them at excessive cost.
EXPOSURE
Liquidity exposure represents the potential stressed outflows in any future period less expected inflows. Lloyds Bank Group considers liquidity exposure from both an internal and a regulatory perspective.
MEASUREMENT
Liquidity risk is managed through a series of measures, tests and reports that are primarily based on contractual maturities with behavioural overlays as appropriate. Lloyds Bank Group undertakes quantitative and qualitative analysis of the behavioural aspects of its assets and liabilities in order to reflect their expected behaviour.
MITIGATION
Lloyds Bank Group manages and monitors liquidity risks and ensures that liquidity risk management systems and arrangements are adequate with regard to the internal risk appetite, Group strategy and regulatory requirements. Liquidity policies and procedures are subject to independent internal oversight by Risk. Overseas branches and subsidiaries of Lloyds Bank Group may also be required to meet the liquidity requirements of the entity’s domestic country. Management of liquidity requirements is performed by the overseas branch or subsidiary in line with Lloyds Banking Group policy. Lloyds Bank Group plans funding requirements over its planning period, combining business as usual and stressed conditions. Lloyds Bank Group manages its liquidity position both with regard to its internal risk appetite and the Liquidity Coverage Ratio (LCR) as required by the PRA and Capital Requirements Directive and Regulation (CRD IV) liquidity requirements.
Lloyds Bank Group’s funding and liquidity position is underpinned by its significant customer deposit base, and is supported by strong relationships across customer segments. Lloyds Bank Group has consistently observed that in aggregate the retail deposit base provides a stable source of funding. Funding concentration by counterparty, currency and tenor is monitored on an ongoing basis and where concentrations do exist, these are managed as part of the planning process and limited by the internal funding and liquidity risk monitoring framework, with analysis regularly provided to senior management.
To assist in managing the balance sheet, Lloyds Bank Group operates a Liquidity Transfer Pricing (LTP) process which: allocates relevant interest expenses from the centre to Lloyds Bank Group’s banking businesses within the internal management accounts; helps drive the correct inputs to customer pricing; and is consistent with regulatory requirements. LTP makes extensive use of behavioural maturity profiles, taking account of expected customer loan prepayments and stability of customer deposits, modelled on historic data.
Lloyds Bank Group can monetise liquid assets quickly, either through the repurchase agreements (repo) market or through outright sale. In addition, Lloyds Bank Group has pre-positioned a substantial amount of assets at the Bank of England’s Discount Window Facility which can be used to access additional liquidity in a time of stress. Lloyds Bank Group considers diversification across geography, currency, markets and tenor when assessing appropriate holdings of liquid assets. Lloyds Bank Group’s liquid asset buffer is available for deployment at immediate notice, subject to complying with regulatory requirements.
MONITORING
Daily monitoring and control processes are in place to address internal and regulatory liquidity requirements. Lloyds Bank Group monitors a range of market and internal early warning indicators on a daily basis for early signs of liquidity risk in the market or specific to Lloyds Bank Group. This captures regulatory metrics as well as metrics Lloyds Bank Group considers relevant for its liquidity profile. These are a mixture of quantitative and qualitative measures, including: daily variation of customer balances; changes in maturity profiles; funding concentrations; changes in LCR outflows; credit default swap (CDS) spreads; and basis risks.
Lloyds Bank Group carries out internal stress testing of its liquidity and potential cash flow mismatch position over both short (up to one month) and longer-term horizons against a range of scenarios forming an important part of the internal risk appetite. The scenarios and assumptions are reviewed at least annually to ensure that they continue to be relevant to the nature of the business including reflecting emerging horizon risks to Lloyds Bank Group. For further information on Lloyds Bank Group’s 2020 liquidity stress testing results refer to page 55.
Lloyds Bank Group maintains a Contingency Funding Framework as part of the wider Recovery Plan which is designed to identify emerging liquidity concerns at an early stage, so that mitigating actions can be taken to avoid a more serious crisis developing. Contingency Funding Plan invocation and escalation processes are based on analysis of five major quantitative and qualitative components, comprising assessment of: early warning indicators; prudential and regulatory liquidity risk limits and triggers; stress testing results; event and systemic indicators; and market intelligence.
Funding and Liquidity Management in 2020
Lloyds Bank Group’s liquidity position remains strong and in excess of the regulatory minimum and internal risk appetite, with a LCR of 126 per cent (based on a monthly rolling average over the previous 12 months) as at 31 December 2020 based on the EU Delegated Act.
During 2020, Lloyds Bank Group repaid all outstanding amounts of its Term Funding Scheme (TFS) drawings of £15.4 billion and the remaining £1 billion outstanding of its Funding for Lending Scheme (FLS) drawings. The Group has drawn £13.7 billion from the Term Funding Scheme with additional incentives for SMEs (TFSME).
The strong ratings of the Bank and its rated subsidiaries continue to reflect the resilience of Lloyds Bank Group's business model and the strength of the balance sheet. In October, Moody's downgraded Lloyds Bank plc from Aa3/Negative to A1/Stable due to the removal of the uplift for Government support. This impacted a number of other UK peers and was triggered by the downgrade of the UK sovereign rating a few days earlier given the agency's concerns around the pandemic and the UK's exit from the European Union, but did not impact the standalone rating of the Bank. Over the year both S&P and Fitch have affirmed Lloyds Bank Group's ratings albeit with negative outlooks to reflect their concerns over the UK economy.
OPERATING AND FINANCIAL REVIEW AND PROSPECTS
| | | | | | | | | | | |
| Lloyds Bank Group funding position | | | |
| At 31 Dec | | At 31 Dec |
| 2020 | | 2019 |
| £bn | | £bn |
| Funding requirement | | | |
Loans and advances to customers1 | 425.6 | | | 422.8 | |
Other funded assets2 | 15.8 | | | 18.2 | |
| Funded assets | 441.4 | | | 441.0 | |
Other assets3 | 44.3 | | | 28.9 | |
| 485.7 | | | 469.9 | |
| On balance sheet LCR eligible liquid assets | | | |
| Cash and balances at central banks | 43.6 | | | 33.3 | |
| Debt securities at amortised cost | 2.1 | | | 2.4 | |
| Financial assets at fair value through other comprehensive income | 26.9 | | | 24.2 | |
Other LCR eligible liquid assets4 | 41.6 | | | 51.6 | |
| 114.2 | | | 111.5 | |
| Total Lloyds Bank Group assets | 599.9 | | | 581.4 | |
Less: other liabilities3 | (35.9) | | | (36.5) | |
| Funding requirement | 564.0 | | | 544.9 | |
| Funded by | | | |
Customer deposits5 | 425.2 | | | 387.3 | |
Wholesale funding6 | 79.6 | | | 100.3 | |
Term funding scheme7 | 13.7 | | | 15.4 | |
| Deposits from fellow Lloyds Banking Group undertakings | 4.4 | | | 3.0 | |
| 522.9 | | | 506.0 | |
| Total equity | 41.1 | | | 38.9 | |
| Total funding | 564.0 | | | 544.9 | |
1Excludes reverse repurchase agreements.
2Includes non-LCR eligible cash at central banks and financial assets held at fair value through other comprehensive income.
3Other assets and other liabilities primarily include the fair value of derivative assets and liabilities as well as non-LCR eligible repurchase agreements and reverse repurchase agreements.
4Other LCR-eligible assets includes LCR-eligible repurchase and reverse repurchase agreements.
5Excludes repurchase agreements.
6Lloyds Bank Group’s definition of wholesale funding aligns with that used by other international market participants; including bank deposits, debt securities in issue and subordinated liabilities. 31 December 2019 has been restated to exclude margins.
7Includes the Bank of England's Term Funding Scheme (TFS) and Term Funding Scheme with additional incentives for SMEs (TFSME).
| | | | | | | | | | | | | | | | | | | | | | | |
| Reconciliation of Lloyds Bank Group funding to the balance sheet (audited) |
| Included in
funding
analysis
£bn | Repos
and cash
collateral
£bn | Items due to
fellow Lloyds
Banking Group
undertakings
£bn | | Fair value
and other
accounting methods
£bn | | Balance
sheet
£bn |
| At 31 December 2020 | | | | | | | |
| Deposits from banks | 3.9 | | 18.8 | | — | | | 2.3 | | | 25.0 | |
| Debt securities in issue | 66.4 | | — | | (16.1) | | | 9.0 | | | 59.3 | |
| Subordinated liabilities | 9.3 | | — | | — | | | (0.1) | | | 9.2 | |
| Total wholesale funding | 79.6 | | 18.8 | | (16.1) | | | | | |
| Customer deposits | 425.2 | | 9.4 | | — | | | — | | | 434.6 | |
| Total | 504.8 | | 28.2 | | (16.1) | | | | | |
| | | | | | | |
At 31 December 20191 | | | | | | | |
| Deposits from banks | 4.3 | | 19.6 | | — | | | (0.3) | | | 23.6 | |
| Debt securities in issue | 83.6 | | — | | (13.4) | | | 6.2 | | | 76.4 | |
| Subordinated liabilities | 12.4 | | — | | — | | | 0.2 | | | 12.6 | |
| Total wholesale funding | 100.3 | | 19.6 | | (13.4) | | | | | |
| Customer deposits | 387.3 | | 9.5 | | — | | | — | | | 396.8 | |
| Total | 487.6 | | 29.1 | | (13.4) | | | | | |
12019 restated to exclude margins.
OPERATING AND FINANCIAL REVIEW AND PROSPECTS
| | | | | | | | | | | | | | | | | | | | | | | | | | | | | | | | | | | | | | | | | | | | | | | | | | | | | | | | | | | |
| Analysis of 2020 total wholesale funding by residual maturity |
| Less
than one
month
£bn | | One
to three
months
£bn | | Three
to six
months
£bn | | Six
to nine
months
£bn | Nine
months to
one year
£bn | | One to
two years
£bn | | Two to
five years
£bn | More than
five years
£bn | | Total at
31 Dec
2020
£bn | | Total at
31 Dec
2019
£bn |
| Deposit from banks | 2.9 | | | 1.0 | | | — | | | — | | | — | | | — | | | — | | | — | | | 3.9 | | | 4.3 | |
| Debt securities in issue: | | | | | | | | | | | | | | | | | | | |
| Certificates of deposit | 0.6 | | | 2.5 | | | 0.5 | | | — | | | — | | | — | | | — | | | — | | | 3.6 | | | 4.9 | |
| Commercial paper | 1.1 | | | 2.1 | | | 2.4 | | | — | | | — | | | — | | | — | | | — | | | 5.6 | | | 7.9 | |
| Medium-term notes | 0.9 | | | 0.9 | | | 2.0 | | | 0.9 | | | 1.1 | | | 5.4 | | | 12.2 | | | 7.8 | | | 31.2 | | | 36.2 | |
| Covered bonds | 2.3 | | | — | | | 0.8 | | | 2.0 | | | 0.5 | | | 4.3 | | | 8.4 | | | 4.8 | | | 23.1 | | | 28.8 | |
| Securitisation | 0.2 | | | — | | | 0.2 | | | 0.6 | | | 0.5 | | | 0.9 | | | 0.5 | | | — | | | 2.9 | | | 5.8 | |
| 5.1 | | | 5.5 | | | 5.9 | | | 3.5 | | | 2.1 | | | 10.6 | | | 21.1 | | | 12.6 | | | 66.4 | | | 83.6 | |
| Subordinated liabilities | — | | | — | | | 0.5 | | | 1.1 | | | 1.6 | | | 1.4 | | | 1.7 | | | 3.0 | | | 9.3 | | | 12.4 | |
Total wholesale funding1 | 8.0 | | | 6.5 | | | 6.4 | | | 4.6 | | | 3.7 | | | 12.0 | | | 22.8 | | | 15.6 | | | 79.6 | | | 100.3 | |
1The Group’s definition of wholesale funding aligns with that used by other international market participants; including bank deposits, debt securities and subordinated liabilities. Excludes balances relating to margins of £1.8 billion (31 December 2019: £1.6 billion). 2019 restated to exclude margins.
| | | | | | | | | | | | | | | | | |
| Total wholesale funding by currency (audited) |
| Sterling
£bn | US Dollar
£bn | Euro
£bn | Other
currencies
£bn | Total
£bn |
| At 31 December 2020 | 21.5 | | 28.0 | | 23.6 | | 6.5 | | 79.6 | |
At 31 December 20191 | 24.5 | | 35.1 | | 32.3 | | 8.4 | | 100.3 | |
12019 restated to exclude margins.
| | | | | | | | | | | | | | | | | |
| Analysis of 2020 term issuance (audited) |
| Sterling
£bn | US Dollar
£bn | Euro
£bn | Other
currencies
£bn | Total
£bn |
| | | | | |
| Medium-term notes | — | | 4.2 | | — | | — | | 4.2 | |
| Covered bonds | 1.0 | | — | | — | | — | | 1.0 | |
Private placements1 | — | | 0.1 | | — | | — | | 0.1 | |
Subordinated liabilities2 | 1.3 | | 0.4 | | 1.0 | | — | | 2.7 | |
| Total issuance | 2.3 | | 4.7 | | 1.0 | | — | | 8.0 | |
1Private placements include structured bonds.
2Subordinated liabilities include AT1s.
OPERATING AND FINANCIAL REVIEW AND PROSPECTS
Liquidity Portfolio
At 31 December 2020, the banking business had £113.4 billion of highly liquid unencumbered LCR eligible assets based on a monthly rolling average over the previous 12 months post any liquidity haircuts (31 December 2019: £112.2 billion), of which £112.0 billion is LCR level 1 eligible (31 December 2019: £111.0 billion) and £1.4 billion is LCR level 2 eligible (31 December 2019: £1.2 billion). These assets are available to meet cash and collateral outflows and regulatory requirements.
| | | | | | | | |
| LCR eligible assets | | |
| Average | Average |
| 20201 | 20191 |
| £bn | £bn |
| Level 1 | | |
| Cash and central bank reserves | 46.5 | | 37.8 | |
High quality government/MDB/agency bonds2 | 62.6 | | 71.4 | |
| High quality covered bonds | 2.9 | | 1.8 | |
| Total | 112.0 | | 111.0 | |
Level 23 | 1.4 | | 1.2 | |
| Total LCR eligible assets | 113.4 | | 112.2 | |
1Based on 12 months rolling average to 31 December. Eligible assets are calculated as an average of month-end observations over the previous 12 months post any liquidity haircut. 2019 assets have been restated accordingly.
2Designated multilateral development bank (MDB).
3Includes Level 2A and Level 2B.
| | | | | | | | | | | | | | | | | |
| LCR eligible assets by currency |
| Sterling
£bn | US Dollar
£bn | Euro
£bn | Other
currencies
£bn | Total
£bn |
| At 31 December 2020 | | | | | |
| Level 1 | 94.4 | | 7.3 | | 10.3 | | — | | 112.0 | |
| Level 2 | 0.9 | | 0.3 | | 0.2 | | — | | 1.4 | |
Total1 | 95.3 | | 7.6 | | 10.5 | | — | | 113.4 | |
| At 31 December 2019 | | | | | |
| Level 1 | 92.2 | | 9.2 | | 9.6 | | — | | 111.0 | |
| Level 2 | 0.7 | | 0.5 | | — | | — | | 1.2 | |
Total1 | 92.9 | | 9.7 | | 9.6 | | — | | 112.2 | |
1Based on 12 months rolling average to 31 December. Eligible assets are calculated as an average of month-end observations over the previous 12 months post any liquidity haircut. 2019 assets have been restated accordingly
The banking business also has a significant amount of non-LCR eligible liquid assets which are eligible for use in a range of central bank or similar facilities, including the Bank of England's Term Funding Scheme with additional incentives for SMEs (TFSME). Future use of such facilities will be based on prudent liquidity management and economic considerations, having regard for external market conditions.
Stress testing results
Internal liquidity stress testing results at 31 December 2020 (calculated as an average of month end observations over the previous 12 months) showed that Lloyds Bank Group had liquidity resources representing 129 per cent of modelled outflows over a three month period from all wholesale funding sources, retail and corporate deposits, intraday requirements and rating dependent contracts under Lloyds Bank Group’s most severe liquidity stress scenario.
This scenario includes a two notch downgrade of Lloyds Bank Group’s current long-term debt rating and accompanying one notch short-term downgrade implemented instantaneously by all major rating agencies.
OPERATING AND FINANCIAL REVIEW AND PROSPECTS
CAPITAL RISK
DEFINITION
Capital risk is defined as the risk that Lloyds Bank Group has a sub-optimal quantity or quality of capital or that capital is inefficiently deployed across Lloyds Bank Group.
EXPOSURES
A capital risk exposure arises when Lloyds Bank Group has insufficient capital resources to support its strategic objectives and plans, and to meet both regulatory and external stakeholder requirements and expectations. This could arise due to a depletion of Lloyds Bank Group’s capital resources as a result of the crystallisation of any of the risks to which it is exposed, or through a significant increase in risk-weighted assets as a result of rule changes or economic deterioration. Alternatively a shortage of capital could arise from an increase in the minimum requirements for capital, leverage or MREL either at Lloyds Bank Group level or regulated entity level. The Lloyds Bank Group capital management approach is focused on maintaining sufficient and appropriate capital resources across all regulated levels of its structure in order to prevent such exposures.
MEASUREMENT
In accordance with UK ring-fencing legislation, Lloyds Bank Group has been appointed as the Ring-Fenced Bank sub-group (‘RFB sub-group’) under Lloyds Banking Group plc. As a result Lloyds Bank Group is subject to separate supervision by the UK Prudential Regulation Authority (PRA) on a sub-consolidated basis (as the RFB sub-group) in addition to the existing supervision applied to Lloyds Bank plc on an individual basis.
Lloyds Bank Group maintains capital levels on a consolidated and individual basis commensurate with a prudent level of solvency to achieve financial resilience and market confidence. To support this, capital risk appetite is calibrated by taking into consideration both an internal view of the amount of capital to hold as well as external regulatory requirements.
Lloyds Bank Group measures both its capital requirements and the amount of capital resources it holds to meet those requirements through applying the regulatory framework defined by the Capital Requirements Directive and Regulation (CRD IV), as amended by revisions to the Capital Requirements Directive implemented in December 2020 (CRD V) and by those provisions of the revised Capital Requirements Regulation (CRR II) that came into force in June 2019 and December 2020. The requirements are implemented in the UK by the PRA and supplemented through additional regulation under the PRA Rulebook.
During 2020 regulators undertook a series of measures in response to the coronavirus pandemic. This included supportive revisions made to the IFRS 9 transitional arrangements for capital, which Lloyds Bank Group applies in full. Over the short to medium-term, these arrangements will provide some stability in capital requirements against the increased provisioning and subsequent volatility connected to the impact of IFRS 9. This is particularly evident from the current application of the arrangements which has seen the significant increase in Stage 1 and Stage 2 expected credit losses during the first half of 2020 partially offset for capital purposes.
The UK left the EU on 31 January 2020 but remained subject to changes to EU capital regulation until the end of the transition period on 31 December 2020. Under temporary transitional powers (TTP) granted to the PRA, EU capital rules that existed on 31 December 2020 will continue to generally apply until 31 March 2022. This is subject to revision following any significant changes introduced by UK regulators, including changes which implement the remaining parts of CRR II that are not yet in force.
The minimum amount of total capital, under Pillar 1 of the regulatory framework, is set at 8 per cent of total risk-weighted assets. At least 4.5 per cent of risk-weighted assets are required to be covered by common equity tier 1 (CET1) capital and at least 6 per cent of risk-weighted assets are required to be covered by tier 1 capital. These minimum Pillar 1 requirements are supplemented by additional minimum requirements under Pillar 2A of the regulatory framework, the aggregate of which is referred to as the Total Capital Requirement (TCR), and a number of regulatory buffers as described below.
Under Pillar 2A, additional requirements are set through the issuance of an Individual Capital Requirement (ICR), which adjusts the Pillar 1 minimum requirement for those risks not covered or not fully covered under Pillar 1. A key input into the PRA’s ICR process is Lloyds Bank Group’s own assessment of the amount of capital it needs, a process known as the Internal Capital Adequacy Assessment Process (ICAAP). During the year the Lloyds Bank Group Pillar 2A capital requirement reduced from c.4.9 per cent to c.4.0 per cent of risk-weighted assets at 31 December 2020, of which c.2.3 per cent must be met with CET1 capital.
A range of additional regulatory capital buffers apply under the capital rules, which are required to be met with CET1 capital. These include a capital conservation buffer (2.5 per cent of risk-weighted assets) and a time-varying countercyclical capital buffer which is currently around 0 per cent of risk-weighted assets following the decision by UK regulators to reduce the UK countercyclical buffer rate to nil during the first half of 2020 as part of the series of regulatory measures introduced in response to the coronavirus pandemic. In addition, Lloyds Bank Group in its capacity as the RFB sub-group is subject to an other systemically important institution (O-SII) buffer of 2.0 per cent of risk-weighted assets (formerly referred to as the systemic risk buffer) which is designed to hold systemically important banks to higher capital standards so that they can withstand a greater level of stress before requiring resolution.
As part of the capital planning process, forecast capital positions are subjected to stress testing to determine the adequacy of Lloyds Bank Group’s capital resources against minimum requirements, including the ICR. The PRA considers outputs from Lloyds Bank Group’s stress tests, in conjunction with other information, as part of the process for informing the setting of a capital buffer for Lloyds Bank Group, known as the PRA Buffer. The PRA requires this buffer to remain confidential.
All buffers are required to be met by CET1 capital. Usage of the PRA Buffer would trigger a dialogue between Lloyds Bank Group and the PRA to agree what action is required whereas a breach of the combined capital buffer (all other regulatory buffers, as referenced above) would give rise to mandatory restrictions upon any discretionary capital distributions. As part of the regulatory response to the coronavirus pandemic the PRA has communicated its expectation that banks' capital and liquidity buffers can be drawn down as necessary to support the real economy through the shock and that sufficient time will be made available to restore buffers in a gradual manner.
In addition to the risk-based capital framework outlined above, Lloyds Bank Group is also subject to minimum capital requirements under the UK Leverage Ratio Framework. The leverage ratio is calculated by dividing fully loaded tier 1 capital resources by the leverage exposure which is a defined measure of on-balance sheet assets and off-balance sheet items.
The minimum leverage ratio requirement under the UK Leverage Ratio Framework is 3.25 per cent. This is supplemented by a time-varying countercyclical leverage buffer (currently 0 per cent of the leverage exposure measure) and an additional leverage ratio buffer (0.7 per cent of the leverage exposure measure) which reflects the application of Lloyds Bank Group’s O-SII buffer.
OPERATING AND FINANCIAL REVIEW AND PROSPECTS
At least 75 per cent of the 3.25 per cent minimum leverage ratio requirement as well as 100 per cent of regulatory leverage buffers must be met by CET1 capital.
The leverage ratio framework does not currently give rise to higher regulatory capital requirements for Lloyds Bank Group than the risk-based capital framework.
MITIGATION
The Lloyds Bank Group capital management framework is part of a comprehensive capital management framework within Lloyds Banking Group that includes the setting of capital risk appetite and capital planning and stress testing activities. Close monitoring of capital and leverage ratios is undertaken to ensure Lloyds Bank Group meets regulatory requirements and risk appetite levels and deploys its capital resources efficiently.
Lloyds Bank Group monitors early warning indicators and maintains a Capital Contingency Framework as part of the Lloyds Banking Group Recovery Plan which are designed to identify emerging capital concerns at an early stage, so that mitigating actions can be taken, if needed. The Recovery Plan sets out a range of potential mitigating actions that Lloyds Bank Group could take in response to a stress, including as part of the wider Lloyds Banking Group response. For example Lloyds Bank Group is able to accumulate additional capital through the retention of profits over time, which can be enhanced through reducing or cancelling dividend payments upstreamed to its parent (Lloyds Banking Group plc), by raising new equity via an injection of capital from its parent and by issuing additional tier 1 or tier 2 capital securities to its parent. The cost and availability of additional capital from its parent is dependent upon market conditions and perceptions at the time.
Lloyds Bank Group is also able to manage the demand for capital through management actions including adjusting its lending strategy, risk hedging strategies and through business disposals.
Capital policies and procedures are well established and subject to independent oversight.
MONITORING
Lloyds Bank Group’s capital is actively managed and monitoring capital ratios is a key factor in Lloyds Bank Group’s planning processes and stress testing. Multi-year base case forecasts of Lloyds Bank Group’s capital position, based upon the Lloyds Bank Group operating plan, are produced at least annually to inform the Lloyds Bank Group capital plan whilst shorter term forecasts are undertaken to understand and respond to variations of Lloyds Bank Group’s actual performance against the plan. This has been a particular focus recently given the significant uncertainties caused by the coronavirus pandemic. Lloyds Bank Group’s capital plan is tested for capital adequacy using relevant stress scenarios and sensitivities covering adverse economic conditions as well as other adverse factors that could impact Lloyds Bank Group.
Regular monitoring of the capital position for Lloyds Bank Group and its key regulated entities is undertaken by a range of committees, including Group Capital Risk Committee (GCRC), Group Financial Risk Committee (GFRC), Group and Ring-Fenced Banks Asset and Liability Committees (GALCO), Group and Ring-Fenced Banks Risk Committees (GRC), Board Risk Committee (BRC) and the Board. This includes reporting of actual ratios against forecasts and risk appetite, base case and stress scenario projected ratios, and review of early warning indicators and assessment against the Capital Contingency Framework.
The regulatory framework within which Lloyds Bank Group operates continues to be developed at a global level through the Financial Stability Board (FSB) and Basel Committee on Banking Supervision (BCBS) and within the UK by the PRA and through directions from the Financial Policy Committee (FPC). Lloyds Bank Group continues to monitor these developments very closely, analysing potential capital impacts to ensure that, through organic capital generation and management actions, that Lloyds Bank Group continues to maintain a strong capital position that exceeds both minimum regulatory requirements and Lloyds Bank Group's risk appetite and is consistent with market expectations.
MINIMUM REQUIREMENT FOR OWN FUNDS AND ELIGIBLE LIABILITIES (MREL)
In 2015, the Financial Stability Board established an international standard for the total loss absorbing capacity (TLAC) of global systemically important banks (G-SIBs). The standard, which first applied from 1 January 2019, is designed to enhance the resilience of the global financial system by ensuring that failing G-SIBs have sufficient capital to absorb losses and recapitalise under resolution, whilst continuing to provide critical banking services. The minimum requirements for own funds and eligible liabilities (MREL) framework reflects the European implementation of the global TLAC standard.
In the UK the Bank of England has implemented MREL through the Banking Act and a statement of policy on MREL (the MREL SoP). The purpose of MREL is to require firms to maintain sufficient own funds and eligible liabilities that are capable of credibly bearing losses or recapitalising a bank whilst in resolution. MREL can be satisfied by a combination of regulatory capital and certain unsecured liabilities (which must be subordinate to a firm’s operating liabilities).
The MREL SoP sets out the Bank of England’s approach to setting external MREL and the distribution of MREL resources internally within groups. Internal MREL resources are intended to enable a material subsidiary to be recapitalised as part of a group resolution strategy without the need for the Bank of England to apply its resolution powers directly to the subsidiary itself.
Lloyds Bank Group’s parent, Lloyds Banking Group plc, is subject to the Bank of England’s MREL SoP and must therefore maintain a minimum level of external MREL resources. Lloyds Banking Group plc operates a single point of entry (SPE) resolution strategy, with Lloyds Banking Group plc as the designated resolution entity. Under this strategy, Lloyds Bank Group has been identified as a material subsidiary of Lloyds Banking Group plc and must therefore maintain a minimum level of internal MREL resources. As at 31 December 2020, Lloyds Bank Group's internal MREL resources exceeded the interim minimum required.
The Bank of England has commenced a review of the current MREL framework and expects to consult on proposed changes during the year with a view to setting final end-state requirements for 1 January 2022.
ANALYSIS OF CAPITAL POSITION
Lloyds Bank Group’s common equity tier 1 capital ratio increased to 15.5 per cent from 14.3 per cent at 31 December 2019 largely reflecting profits for the year, with the impact of the impairment charge partially mitigated through the increase in IFRS 9 transitional relief for capital. The introduction of the revised capital treatment of intangible software assets also resulted in a significant reduction in intangible assets deducted from capital. In addition, risk-weighted assets reduced and excess expected losses reduced to nil as they absorbed part of the increase in IFRS 9 expected credit losses. The resultant increases in capital were offset in part by pension contributions made during the year, an increase in deferred tax assets deducted from capital and the accrual for foreseeable dividends.
The tier 1 capital ratio increased to 19.8 per cent from 18.3 per cent at 31 December 2019, primarily reflecting the increase in common equity tier 1 capital and new AT1 issuances, offset in part by the annual reduction in the transitional limit applied to grandfathered AT1 capital.
The total capital ratio increased to 23.5 per cent from 22.1 per cent at 31 December 2019, which largely reflected the increase in tier 1 capital.
OPERATING AND FINANCIAL REVIEW AND PROSPECTS
Risk-weighted assets reduced by £1,078 million, or 1 per cent, to £170,862 million at 31 December 2020, compared to £171,940 million at 31 December 2019. Increases reflecting the impact of credit migrations, model calibrations and updates, the full implementation of the new securitisation framework and the introduction of the revised capital treatment of intangible software assets were more than offset by reductions in lending balances outside Government-backed schemes, optimisation activity undertaken in Commercial Banking and the impact of the revised SME supporting factor. In addition operational risk-weighted assets have reduced.
The PRA is consulting on a proposal to reverse the revised capital treatment of intangible software assets (which currently follows EU capital regulations), thereby reinstating the original requirement to deduct in full. Excluding the impact of the revised capital treatment Lloyds Bank Group's common equity tier 1 capital ratio would be 15.0 per cent.
TOTAL CAPITAL REQUIREMENT
Lloyds Bank Group’s total capital requirement (TCR) as at 31 December 2020, being the aggregate of its Pillar 1 and current Pillar 2A capital requirements, was £20,567 million (31 December 2019: £22,177 million).
OPERATING AND FINANCIAL REVIEW AND PROSPECTS
CAPITAL RESOURCES
An analysis of Lloyds Bank Group’s capital position as at 31 December 2020 is presented in the following section on both a transitional arrangements basis and a fully loaded basis in respect of legacy capital securities subject to current grandfathering provisions. In addition Lloyds Bank Group’s capital position under both bases reflects the application of the separate transitional arrangements for IFRS 9.
Capital resources (audited)
The table below summarises the consolidated capital position of Lloyds Bank Group. Lloyds Bank Group’s Pillar 3 Report will provide a comprehensive analysis of the own funds of the Group.
| | | | | | | | | | | | | | | | | |
| Transitional | | Fully loaded |
| At 31 Dec 2020 | At 31 Dec 2019 | | At 31 Dec 2020 | At 31 Dec 2019 |
| £m | £m | | £m | £m |
| Common equity tier 1 | | | | | |
| Shareholders’ equity per balance sheet | 35,105 | 33,973 | | 35,105 | 33,973 |
| Adjustment to retained earnings for foreseeable dividends | (1,000) | — | | (1,000) | — |
| Adjustment for own credit | 81 | 26 | | 81 | 26 |
| Cash flow hedging reserve | (1,507) | (1,556) | | (1,507) | (1,556) |
Other adjustments1 | 1,894 | 397 | | 1,894 | 397 |
| 34,573 | 32,840 | | 34,573 | 32,840 |
| less: deductions from common equity tier 1 | | | | | |
| Goodwill and other intangible assets | (2,986) | (4,050) | | (2,986) | (4,050) |
| Prudent valuation adjustment | (173) | (220) | | (173) | (220) |
| Excess of expected losses over impairment provisions and value adjustments | — | (195) | | — | (195) |
| Removal of defined benefit pension surplus | (1,322) | (531) | | (1,322) | (531) |
| Deferred tax assets | (3,525) | (3,207) | | (3,525) | (3,207) |
| Common equity tier 1 capital | 26,567 | 24,637 | | 26,567 | 24,637 |
| Additional tier 1 | | | | | |
| Additional tier 1 instruments | 7,295 | 6,905 | | 5,935 | 4,865 |
| Total tier 1 capital | 33,862 | 31,542 | | 32,502 | 29,502 |
| Tier 2 | | | | | |
| Tier 2 instruments | 6,825 | 6,914 | | 5,454 | 4,620 |
| Other adjustments | (524) | (480) | | (524) | (480) |
| Total tier 2 capital | 6,301 | 6,434 | | 4,930 | 4,140 |
| Total capital resources | 40,163 | 37,976 | | 37,432 | 33,642 |
| Risk-weighted assets (unaudited) | 170,862 | 171,940 | | 170,862 | 171,940 |
| Common equity tier 1 capital ratio | 15.5 | % | 14.3 | % | | 15.5 | % | 14.3 | % |
| Tier 1 capital ratio | 19.8 | % | 18.3 | % | | 19.0 | % | 17.2 | % |
| Total capital ratio | 23.5 | % | 22.1 | % | | 21.9 | % | 19.6 | % |
1Includes an adjustment applied to reserves to reflect the application of the IFRS 9 transitional arrangements for capital.
| | | | | | | | |
| Risk-weighted assets | | |
| At 31 Dec
2020 | At 31 Dec
2019 |
| £m | £m |
| Foundation Internal Ratings Based (IRB) Approach | 43,781 | | 46,500 | |
| Retail IRB Approach | 65,207 | | 63,192 | |
| Other IRB Approach | 11,916 | | 11,722 | |
| IRB Approach | 120,904 | | 121,414 | |
| Standardised (STA) Approach | 21,673 | | 22,074 | |
| Credit risk | 142,577 | | 143,488 | |
| Counterparty credit risk | 2,133 | | 1,830 | |
| Credit valuation adjustment risk | 355 | | 271 | |
| Operational risk | 23,307 | | 24,413 | |
| Market risk | 210 | | 171 | |
| Underlying risk-weighted assets | 168,582 | | 170,173 | |
Threshold risk-weighted assets1 | 2,280 | | 1,767 | |
| Total risk-weighted assets | 170,862 | | 171,940 | |
1Threshold risk-weighted assets reflect the element of deferred tax assets that are permitted to be risk-weighted instead of being deducted from CET1 capital.
OPERATING AND FINANCIAL REVIEW AND PROSPECTS
Leverage ratio
Analysis of leverage movements
Lloyds Bank Group’s fully loaded UK leverage ratio increased to 5.5 per cent (31 December 2019: 5.1 per cent), primarily driven by the increase in tier 1 capital. The leverage exposure measure increased by £10.6 billion during the year, largely reflecting the increase in the SFT and off-balance sheet exposure measures. Following a direction received from the PRA, Lloyds Bank Group is permitted to exclude lending under the UK Government’s Bounce Back Loan Scheme (BBLS) from the leverage exposure measure.
The average UK leverage ratio was 5.4 per cent over the quarter, with the actual ratio increasing slightly across the quarter to 5.5 per cent which largely reflected the growth in the tier 1 capital position.
Leverage ratio
The table below summarises the component parts of Lloyds Bank Group's leverage ratios.
| | | | | | | | | | | |
| Fully loaded |
| At 31 Dec
2020 | | At 31 Dec
2019 |
| £m | | £m |
| Total tier 1 capital for leverage ratio | | | |
| Common equity tier 1 capital | 26,567 | | | 24,637 | |
| Additional tier 1 capital | 5,935 | | | 4,865 | |
| Total tier 1 capital | 32,502 | | | 29,502 | |
| | | |
| Exposure measure | | | |
| Statutory balance sheet assets | | | |
| Derivative financial instruments | 8,341 | | | 8,494 | |
| Securities financing transactions | 56,073 | | | 52,032 | |
| Loans and advances and other assets | 535,525 | | | 520,842 | |
| Total assets | 599,939 | | | 581,368 | |
| | | |
| Qualifying central bank claims | (43,973) | | | (33,408) | |
| | | |
| Deconsolidation adjustments | | | |
| Derivative financial instruments | 16 | | | 32 | |
| Securities financing transactions | — | | | — | |
| Loans and advances and other assets | (139) | | | (1,326) | |
Total deconsolidation adjustments1 | (123) | | | (1,294) | |
| | | |
| Derivatives adjustments | | | |
| Adjustments for regulatory netting | (2,225) | | | (2,430) | |
| Adjustments for cash collateral | (5,601) | | | (6,869) | |
| Net written credit protection | 145 | | | 148 | |
| Regulatory potential future exposure | 5,744 | | | 8,186 | |
| Total derivatives adjustments | (1,937) | | | (965) | |
| | | |
| Securities financing transactions adjustments | 1,060 | | | 689 | |
| Off-balance sheet items | 53,350 | | | 44,172 | |
Regulatory deductions and other adjustments3 | (14,770) | | | (7,641) | |
| Total exposure measure | 593,546 | | | 582,921 | |
Average exposure measure2 | 603,330 | | | |
| | | |
| UK Leverage ratio | 5.5% | | 5.1% |
Average UK leverage ratio2 | 5.4% | | |
1Deconsolidation adjustments relate to the deconsolidation of certain Lloyds Bank Group entities that fall outside the scope of Lloyds Bank Group’s regulatory capital consolidation.
2The average UK leverage ratio is based on the average of the month end tier 1 capital position and average exposure measure over the quarter (1 October 2020 to 31 December 2020). The average of 5.4 per cent compares to 5.4 per cent at the start and 5.5 per cent at the end of the quarter.
3Includes adjustments to exclude lending under the UK Government’s Bounce Back Loan Scheme (BBLS) and the accelerated implementation for the netting of regular-way purchases and sales awaiting settlement in accordance with CRR Article 500d.
OPERATING AND FINANCIAL REVIEW AND PROSPECTS
| | | | | | | | |
| Application of IFRS 9 on a full impact basis for capital and leverage |
| IFRS 9 full impact |
| At 31 Dec
2020 | At 31 Dec
2019 |
| Common equity tier 1 (£m) | 24,591 | 24,185 |
| Transitional tier 1 (£m) | 31,886 | 31,090 |
| Transitional total capital (£m) | 39,422 | 38,004 |
| Total risk-weighted assets (£m) | 171,015 | 172,324 |
| Common equity tier 1 ratio (%) | 14.4 | % | 14.0 | % |
| Transitional tier 1 ratio (%) | 18.6 | % | 18.0 | % |
| Transitional total capital ratio (%) | 23.1 | % | 22.1 | % |
| UK leverage ratio exposure measure (£m) | 591,570 | 582,900 |
| UK leverage ratio (%) | 5.2 | % | 5.0 | % |
Lloyds Bank Group applies the full extent of the IFRS 9 transitional arrangements for capital as set out under CRR Article 473a (as amended via the CRR 'Quick Fix' revisions published in June 2020). Specifically, Lloyds Bank Group has opted to apply both paragraphs 2 and 4 of CRR Article 473a (static and dynamic relief) and in addition to apply a 100 per cent risk weight to the consequential Standardised credit risk exposure add-back as permitted under paragraph 7a of the revisions.
As at 31 December 2020, static relief under the transitional arrangements amounted to £370 million (31 December 2019: £452 million) and dynamic relief under the transitional arrangements amounted to £1,606 million (31 December 2019: £nil).
OPERATING AND FINANCIAL REVIEW AND PROSPECTS
CHANGE/EXECUTION RISK
DEFINITION
Change/execution risk is defined as the risk that, in delivering its change agenda, the Group fails to ensure compliance with laws and regulation, maintain effective customer service and availability, and/or operation within the Group’s risk appetite.
EXPOSURES
Change/execution risks arise when Lloyds Bank Group undertakes activities which require products, processes, people, systems or controls to change. These changes can be as a result of external drivers (for example, a new piece of regulation that requires Lloyds Bank Group to put in place a new process or reporting) and internal drivers (such as the strategic transformation that is outlined in Lloyds Banking Group's Strategic Review 2021).
MEASUREMENT
The Group currently measures change/execution risk against a defined risk appetite metric which is a combination of leading, quality and delivery indicators across the investment portfolio. These indicators are reported through defined internal governance structures in the form of a monthly execution risk dashboard. An associated measure, based on the aggregate performance of the dashboard is included in the Group balanced scorecard.
MITIGATION
The Group takes a range of mitigating actions with respect to change/execution risk. These include the following:
•The Board establishes a Group-wide risk appetite and metric for change/execution risk
•Ensuring compliance with the Change policy and associated policies and procedures, which set out the principles and key controls that apply across the business and are aligned to the Group risk appetite
•Businesses assess the potential impacts of undertaking any change activity on their ability to execute effectively, and the potential consequences for existing business risk profiles
•The implementation of effective governance and control frameworks to ensure adequate controls are in place to manage change activity and act to mitigate the change/execution risks identified. These controls are monitored in line with the Change policy and any additional monitoring that is deemed necessary
•Events related to change activities are escalated and managed appropriately in line with risk framework guidance
MONITORING
Change/execution risks from across the Group are monitored and reported through to Board and Group Governance Committees in accordance with the Group's enterprise risk management framework and aligned to Lloyds Banking Group's Strategic Review 2021 activities. Risk exposures are discussed monthly through established governance through to the Lloyds Banking Group Transformation Risk Committee with upwards reporting to Board Risk and Executive Committees. In addition, oversight, challenge and reporting are completed at Risk Division level to provide oversight management of risks and the effectiveness of controls, recommending follow up remedial action if required. All material change/execution risk events are escalated in accordance with the formal Lloyds Banking Group Operational Risk policy and Change policy.
OPERATING AND FINANCIAL REVIEW AND PROSPECTS
CONDUCT RISK
DEFINITION
Conduct risk is defined as the risk of customer detriment across the customer lifecycle including: failures in product management, distribution and servicing activities; from other risks materialising, or other activities which could undermine the integrity of the market or distort competition, leading to unfair customer outcomes, regulatory censure, reputational damage or financial loss.
EXPOSURES
The Group faces significant conduct risks, which affect all aspects of the Group’s operations and all types of customers.
Conduct risks can impact directly or indirectly on the Group's customers and could materialise from a number of areas across the Group, including:
•Business and strategic planning that does not sufficiently consider customer needs
•Ineffective development, management and monitoring of products, their distribution (including the sales process) and post- sales service (including the management of customers in financial difficulties)
•Unclear, unfair, misleading or untimely customer communications
•A culture that is not sufficiently customer-centric
•Poor governance of colleagues’ incentives and rewards and approval of schemes which drive unfair customer outcomes
•Ineffective management and oversight of legacy conduct issues
•Ineffective management and resolution of customers’ complaints or claims
•Outsourcing of customer service and product delivery to third-parties that do not have the same level of control, oversight and culture as the Group
•The risks associated with becoming a more digitised bank
•Poor management, governance and control of data
There is a high level of scrutiny regarding financial institutions' treatment of customers, including those in vulnerable circumstances, from regulatory bodies, the media, politicians and consumer groups. The COVID-19 pandemic has magnified existing challenges, and brought new challenges for customers, affecting health, income and relationships. The Group continues to apply significant focus to its treatment of customers in financial difficulties and ensuring fair outcomes.
The Group is also exposed to the risk of engaging in or failing to manage conduct which could constitute market abuse, undermine the integrity of a market in which it is active, distort competition or create conflicts of interest.
There continues to be a significant focus on market misconduct, resulting from previous issues such as London Inter-bank Offered Rate (LIBOR) and foreign exchange (FX).
Due to the level of enhanced focus on conduct, there is a risk that certain aspects of the Group's current or legacy business may be determined by the Financial Conduct Authority, other regulatory bodies or the courts as not being conducted in accordance with applicable laws or regulations, in a manner that fails to deliver fair and reasonable customer treatment, or is inconsistent with market integrity or competition requirements.
The evolving COVID-19 situation means increased uncertainty surrounding the future, which poses the risk that increasingly more customers face difficulties, become vulnerable and/or struggle to manage their existing commitments.
MEASUREMENT
To articulate its conduct risk appetite, the Group has sought more granularity through the use of suitable Conduct Risk Appetite Metrics (CRAMs) and tolerances that indicate where it may be operating outside its conduct risk appetite. These include Board-level conduct risk metrics covering an assessment of overall CRAMs performance, out of appetite CRAMs, Financial Ombudsman Service (FoS) change rates and complaints.
CRAMs have been designed for services and product families offered by the Group and are measured by a consistent set of common metrics. These contain a range of product design, sales and process metrics (including outcome testing outputs) to provide a more holistic view of conduct risks; some products also have a suite of additional bespoke metrics.
Each of the tolerances for the metrics are agreed for the individual product or service and are regularly tracked. At a consolidated level these metrics are part of the Board risk appetite. The Group has, and continues to, evolve its approach to conduct risk measurements, including those supporting customer vulnerability, process delivery and other emerging conduct themes.
MITIGATION
The Group takes a range of mitigating actions with respect to conduct risk and remains focused on delivering a leading customer experience. The Group’s ongoing commitment to good customer outcomes sets the tone from the top and supports the development of the right customer-centric culture, strengthening links between actions to support conduct, culture and customer and enabling more effective control management. Actions to encourage good conduct include:
•Conduct risk appetite established at Group and business area level, with metrics included in the Group risk appetite to ensure ongoing focus
•Simplified and enhanced conduct policies and procedures in place to ensure appropriate controls and processes that deliver fair customer outcomes, and support market integrity and competition requirements
•Customer needs considered through divisional customer plans, with integral conduct lens, reviewed and challenged by the Lloyds Banking Group Customer First Committee (GCFC)
•Cultural transformation: achieving a values-led culture through a focus on behaviours to ensure the Group is transforming its culture for success in a digital world. This is supported by strong direction and tone from senior executives and the Board
•Continuous embedding of the customer vulnerability framework aligned with the FCA guidance on fair treatment of vulnerable customers launched in January 2021. Development and continued oversight of the implementation of the vulnerability strategy continues through the Lloyds Banking Group Customer Vulnerability Committee (GCVC) operating at a senior level to prioritise change, drive implementation and ensure consistency across Lloyds Banking Group
OPERATING AND FINANCIAL REVIEW AND PROSPECTS
•Enhanced product governance framework to ensure products continue to offer customers fair value, and consistently meet their needs throughout their product life cycle; reviewed and challenged by the Lloyds Banking Group Product Governance Committee (GPGC)
•Enhanced complaints management through effectively responding to, and learning from, root causes of complaint volumes and Financial Ombudsman Service (FOS) change rates
•Review and oversight of thematic conduct agenda items at senior committees, ensuring holistic consideration of key Lloyds Banking Group-wide conduct risks
•Robust recruitment and training, with a continued focus on how the Group manages colleagues’ performance with clear customer accountabilities
•Ongoing engagement with third-parties involved in serving the Group’s customers to ensure consistent delivery
•Monitoring and testing of customer outcomes to ensure the Group delivers fair outcomes for customers throughout the product and service lifecycle, and make continuous improvements to products, services and processes
•Continued focus on market conduct and member of the Fixed Income, Currencies and Commodities Markets Standard Board
•Adoption of robust change delivery methodology to enable prioritisation and delivery of initiatives to address conduct challenges
•Continued focus on proactive identification and mitigation of conduct risk in the Lloyds Banking Group's Strategic Review 2021
•Active engagement with regulatory bodies and other stakeholders to develop understanding of concerns related to customer treatment, effective competition and market integrity, to ensure that the Group’s strategic conduct focus continues to meet evolving stakeholder expectations
•Adapting quickly to the evolving COVID-19 situation, being swift to offer the new to market products (BBILs, CBILs) and new regulatory requirements (payment holidays). The Group also continues to support customers in challenging times by adapting support, proactively contacting vulnerable customers, and using insight to understand who may become vulnerable and what their needs could be
MONITORING
Conduct risk is governed through divisional risk committees and significant issues are escalated to the Lloyds Banking Group Risk Committee, in accordance with Lloyds Banking Group's enterprise risk management framework, as well as through the monthly Consolidated Risk Report. Risk exposures are discussed at divisional risk committees, where oversight, challenge and reporting are completed to assess the effectiveness controls. Remedial action is recommended, if required. All material conduct risk events are escalated in accordance with Lloyds Banking Group's Operational Risk policy to the respective divisional Managing Directors and Conduct, Compliance and Operational Risk.
GCFC acts as the guardian of customer experience and has responsibility for monitoring and reviewing plans and actions to improve it, providing oversight of customer outcomes and customer experience and providing challenge to divisions to make changes to support the delivery of Lloyds Banking Group's vision and foster a customer-centric culture.
A number of activities support the close monitoring of conduct risk including:
•The use of CRAMs across the Group, with a clear escalation route to Board
•Second line oversight activities
•Horizon Scanning
OPERATING AND FINANCIAL REVIEW AND PROSPECTS
DATA RISK
DEFINITION
Data risk is defined as the risk of the Group failing to effectively govern, manage and control its data (including data processed by third party suppliers), leading to unethical decisions, poor customer outcomes, loss of value to the Group and mistrust.
EXPOSURES
Data risk is present in all aspects of the business where data is processed, both within the Group and by third parties including colleague and contractor, prospective and existing customer lifecycle and insight processes. Data risk manifests:
•When personal data is not gathered legally, for a legitimate purpose, or is not managed or protected from misuse and/or processed in a way that complies with General Data Protection Regulations (GDPR) and other data privacy regulatory obligations
•When data quality (accuracy, completeness, consistency, uniqueness, validity and timeliness) is not managed, resulting in data used in systems, processes and products not being fit for the intended purpose
•When data records are not created, retained, protected, destroyed, or retrieved appropriately
•When data governance fails to provide robust oversight of data decision-making and the control mechanisms to ensure strategies and management instructions are implemented effectively
•When data standards are not maintained across core data, data management risks are not managed and data related issues are not remediated as a result of poor data management resulting in inaccurate, incomplete data that is not available at the right time, to the right people, to enable business decisions to be made, and regulatory reporting requirements to be fulfilled
•When critical data mapping and data information standards are not followed impacting compliance, traceability and understanding of data
MEASUREMENT
Data risk is measured through a series of quantitative and qualitative indicators, aligned to key sources of data risk for the Group covering data governance, data management, data privacy and ethics. In addition to risk appetite measures and limits, data risks and controls are monitored and governed through Group and Sub-Group Committees on a monthly basis. Significant issues are escalated to Group Risk Committee.
MITIGATION
Data risk is a key component of the Group's enterprise risk management framework, where the focus is on the end to end management of data risk. This ensures that risks are identified, assessed, managed, monitored and reported using the risk and control self-assessment process.
Investment continues to be made to enhance the maturity of data risk management. Examples including:
•Delivering a data strategy and data risk and control library to ensure data risks are managed within appetite
•Enhancing capability and awareness in data management and privacy
•Enhancing assurance of suppliers
•Delivering enhanced controls and processes for data retention and destruction, deleting large volumes of historic over-retained data
•Embedding data by design and ethics principles into the data science lifecycle and progressing opportunities to simplify the completion of privacy records impact assessments
MONITORING
Data risk is governed through Group and Sub-Group committees and significant issues are escalated to Group Risk Committee, in accordance with the Lloyds Banking Group’s enterprise risk management framework. Risk exposures are discussed at Group and Sub-Group committees, where oversight, challenge and reporting are completed to assess the effectiveness of controls and agree remedial actions. All material data risk events are escalated in accordance with Lloyds Banking Group's Operational Risk policy and Data risk policies and where personal data is concerned, the Group Data Protection Officer. In addition, Group-wide data risk issues and the top data risks that Group faces are discussed at Data Cross Divisional Committee and Group Data Committee.
A number of activities support the close monitoring of data risk including:
•Implementation of the data risk and control library to ensure greater coverage and insight of data risk, and ensuring data risks are managed within appetite
•Design and monitoring of data risk appetite metrics, including key risk indicators and key performance indicators
•Monitoring and reporting of progress against the Data Capability Assessment Model
•Monitoring of significant data related issues complaints and breaches
•Identification and effective mitigation of data risk when planning and implementing transformation or business change
•Implementation of effective controls to mitigate data risk, including data privacy, ethics, data management and records management
•Effective monitoring and testing of compliance with data privacy and data management regulatory requirements. For example GDPR and Basel Committee on Banking Supervision (BCBS 239) requirements
•Horizon scanning for changes in the external environment, including but not limited to changes to laws, rules and regulations, for example, the UK's exit from the EU and ensuring data flows remain unaffected
OPERATING AND FINANCIAL REVIEW AND PROSPECTS
GOVERNANCE RISK
DEFINITION
Governance risk is defined as the risk that the Group’s organisational infrastructure fails to provide robust oversight of decision-making and the control mechanisms to ensure strategies and management instructions are implemented effectively.
EXPOSURES
The internal and corporate governance arrangements of major financial institutions continue to be subject to a high level of regulatory and public scrutiny. The Group’s exposure to governance risk is also reflective of the significant volume of existing and proposed legislation and regulation, both within the UK and across the multiple jurisdictions within which it operates, with which it must comply.
MEASUREMENT
The Group’s governance arrangements are assessed against new or proposed legislation and regulation and best practice among peer organisations in order to identify any areas of enhancement required.
MITIGATION
Lloyds Banking Group enterprise risk management framework (ERMF) establishes robust arrangements for risk governance, in particular by:
•Defining individual and collective accountabilities for risk management, risk oversight and risk assurance through a three lines of defence model which supports the discharge of responsibilities to customers, shareholders and regulators
•Outlining governance arrangements which articulate the enterprise-wide approach to risk management
•Supporting a consistent approach to Group-wide behaviour and risk decision-making through a Group policy framework which helps everyone understand their responsibilities by clearly articulating and communicating rules, standards, boundaries and risk appetite measures which can be controlled, enforced and monitored
Under the banner of the ERMF, training modules are in place to support all colleagues in understanding and fulfilling their risk responsibilities.
Lloyds Banking Group Code of Responsibility embodies its values and reflect its commitment to operating responsibly and ethically both at a business and an individual level. All colleagues are required to adhere to the code in all aspects of their roles.
Effective implementation of the ERMF mutually reinforces and is reinforced by the Group’s risk culture, which is embedded in its approach to recruitment, selection, training, performance management and reward.
MONITORING
A review of Lloyds Banking Group ERMF, which includes the status of Lloyds Bank Group's principles and policy framework, and the design and operational effectiveness of key governance committees, is undertaken on an annual basis and the findings are reported to the Group Risk Committee, Board Risk Committee and the Board.
For further information on corporate governance see pages 77 to 82.
OPERATING AND FINANCIAL REVIEW AND PROSPECTS
PEOPLE RISK
DEFINITION
People risk is defined as the risk that the Group fails to provide an appropriate colleague and customer-centric culture, supported by robust reward and wellbeing policies and processes; effective leadership to manage colleague resources; effective talent and succession management; and robust control to ensure all colleague-related requirements are met.
EXPOSURES
The Group’s management of material people risks is critical to its capacity to deliver against its strategic objectives, particularly in the context of increasing volumes of organisational, political and external market change and increasing digitisation. The Group is exposed to the following key people risks:
•Failure to recruit, develop and retain colleagues, including ineffective management of succession planning or failure to identify appropriate talent pipeline
•The increasing digitisation of the business is changing the capability mix required and may impact the Group's ability to attract and retain talent
•Senior Managers and Certification Regime (SM&CR) and additional regulatory constraints on remuneration structures may impact the Group’s ability to attract and retain talent
•Failure to manage capacity, colleagues having excessive demands placed on them resulting in wellbeing issues and business objectives not being met
•Failure to meet all colleague-related legal and regulatory requirements
•Ineffective leadership, poor communication, weak performance, inappropriate remuneration policies
•Colleague engagement may continue to be challenged by ongoing media attention on culture within the banking sector, conduct and ethical considerations
•Inadequately designed people processes that are not resilient to withstand unexpected events
MEASUREMENT
People risk is measured through a series of quantitative and qualitative indicators, aligned to key sources of people risk for the Group such as succession, retention, colleague engagement and wellbeing. In addition to risk appetite measures and limits, people risks and controls are monitored on a monthly basis via the Group’s risk governance framework and reporting structures.
MITIGATION
The Group takes many mitigating actions with respect to people risk. Key areas of focus include:
•Focusing on leadership and colleague engagement, through delivery of strategies to attract, retain and develop high calibre people together with implementation of rigorous succession planning
•Continued focus on the Group’s culture and inclusivity strategy by developing and delivering initiatives that reinforce the appropriate behaviours which generate the best possible long-term outcomes for customers and colleagues
•Managing organisational capability and capacity through divisional people strategies to ensure there are the right skills and resources to meet customers’ needs and deliver the Group's strategic plan
•Maintaining effective remuneration arrangements to ensure they promote an appropriate culture and colleague behaviours that meet customer needs and regulatory expectations
•Ensuring colleague wellbeing strategies and support are in place to meet colleague needs, and that the skills and capability growth required to build a workforce for the Bank of the Future are achieved
•Ensuring compliance with legal and regulatory requirements related to SM&CR, embedding compliant and appropriate colleague behaviours in line with Group policies, values and its people risk priorities
•Ongoing consultation with the Group’s recognised unions on changes which impact their members
•Reviewing and enhancing people processes to ensure they are fit for purpose and operationally resilient
MONITORING
Monitoring and reporting is undertaken at Board, Group, entity and divisional committees. Key people risk metrics are reported and discussed monthly at the Group People Risk Committee with escalation to Group Risk and Executive Committees and the Board where required.
All material people risk events are escalated in accordance with Lloyds Banking Group's Operational Risk Policy.
OPERATING AND FINANCIAL REVIEW AND PROSPECTS
OPERATIONAL RESILIENCE RISK
DEFINITION
Operational resilience risk is defined as the risk that the Group fails to design resilience into business operations, underlying infrastructure and controls (people, process, technology) so that it is able to withstand external or internal events which could impact the continuation of operations, and fails to respond in a way which meets customer and stakeholder expectations and needs when the continuity of operations is compromised.
EXPOSURES
Ineffective operational resilience risk management could lead to vital services not being available to customers, and in extreme circumstances, bank failure could result. The Group has in place a transparent and effective operating model to identify and monitor critical business processes from a customer, Group and financial industry perspective. The failure to adequately build resilience into a critical business process may occur in a variety of ways, including:
•The Group being overly reliant on one location to deliver a critical business process
•The Group not having an adequate succession plan in place for designated subject matter experts
•The Group being overly reliant on a supplier which fails to provide a service
•A weakness in the Group’s cyber or security defences leaving it vulnerable to an attack
•The Group failing to upgrade its IT systems and leaving them vulnerable to failure
•Operational resilience and damage to physical assets including: terrorist acts, other acts of war or hostility, geopolitical, pandemic or other such events
Effective operational resilience ensures the Group designs resilience into its systems, is able to withstand and/or recover from a significant unexpected event occurring and can continue to provide services to its customers. A significant outage could result in customers being unable to access accounts or conduct transactions, which as well as presenting significant reputational risk for the Group would negatively impact the Group’s purpose of Helping Britain Prosper. Operational resilience is also an area of continued regulatory and industry focus, similar in importance to financial resilience.
Failure to manage operational resilience effectively could impact the following other risk categories:
•Regulatory compliance: non-compliance with new/existing operational resilience regulations, for example, through failure to identify emerging regulation or not embedding regulatory requirements within the Group’s policies, processes and procedures
•Operational risk: being unable to safely provide customers with business services
•Conduct risk: an operational resilience failure may render the Group liable to fines from the FCA for poor conduct
•Market risk: the Group being unable to provide key services could have ramifications for the wider market and could impact share price
MEASUREMENT
Operational resilience risk is managed across the Group through the Group’s enterprise risk management framework and Operational risk policies. The Group’s enterprise risk management framework includes a risk and control self-assessment process, risk impact likelihood matrix, key risk and control indicators, risk appetite, a robust incident management and escalation process, scenario analysis and an operational losses process. Board risk appetite metrics are in place and are well understood. These specific measures are subject to ongoing monitoring and reporting, including a mandatory review of thresholds on at least an annual basis. To strengthen the management of operational resilience risk, the Group mobilised an operational resilience enhancement programme which is designed to focus on end to end resilience and the management of key risks to critical processes.
MITIGATION
The Group has increased its focus on operational resilience and has updated its operational resilience strategy to reflect changing priorities of both customers and regulators. The Group has carefully considered and provided a response to the publication of the consultation paper by the FCA, PRA and Bank of England (December 2019). Focus will be given to ensure that the Group’s strategy and approach to operational resilience aligns with industry thinking, expectation and anticipated regulatory policy. At the core of its approach to operational resilience are the Group’s critical business processes which drive all activity, including further mapping of the processes to identify any additional resilience requirements such as impact tolerances in the event of a service outage. The Group continues to maintain and develop playbooks that guide its response to a range of interruptions from internal and external threats and tests these through scenario-based testing and exercising.
Lloyds Banking Group's Strategic Review 2021 considers the changing risk management requirements, adapting the change delivery model to be more agile and develop the people skills and capabilities needed to be a Bank of the Future. The Group continues to review and invest in its control environment to ensure it addresses the risks it faces. Risks are reported and discussed at local governance forums and escalated to executive management and Board as appropriate. The Group employs a range of risk management strategies, including: avoidance, mitigation, transfer (including insurance) and acceptance. Where there is a reliance on third-party suppliers to provide services, Lloyds Banking Group’s sourcing policy ensures that outsourcing initiatives follow a defined process including due diligence, risk evaluation and ongoing assurance.
During the COVID-19 pandemic, business continuity plans have proved resilient, with particular attention applied to heightened risks in the supply chain.
Mitigating actions to the principal operational resilience risk are:
•Cyber: the threat landscape associated with cyber risk continues to evolve and there is significant regulatory attention on this subject. The Board continues to invest heavily to protect the Group from cyber-attacks. Investment continues to focus on improving the Group’s approach to identity and access management, improving capability to detect and respond to cyber-attacks and improved ability to manage vulnerabilities across the estate. With effect from 1 January 2021, the Group has entered in to a cyber insurance policy, which provides cover for specified information security risks.
•IT resilience: the Group continues to optimise its approach to IT and operational resilience by investing in technology improvements and enhancing the resilience of systems that support the Group’s critical business processes, primarily through the technology resilience programme, with independent verification of progress on an annual basis. The Board recognises the role that resilient technology plays in building the UK's preferred financial partner and in maintaining banking services across the wider industry. As such, the Board dedicates considerable time and focus to this subject at both the Board and the Board Risk Committee, and continues to sponsor key investment programmes that enhance resilience.
OPERATING AND FINANCIAL REVIEW AND PROSPECTS
•People: the Group acknowledges the risks associated to the failure to maintain appropriately skilled and available colleagues. The Group continues to optimise its approach to ensure that where applicable, colleagues are capable of supporting a critical business process. Key controls and processes are regularly reported to committee(s) and alignment to Lloyds Banking Group's Strategic Review 2021 is closely monitored.
•Property: the Group's property portfolio remains a key focus in ensuring resilience requirements are appropriately maintained. Processes are in place to identify key buildings where a critical business process is performed. Depending on criticality, a number of mitigating controls are in place to manage the risk of severe critical business process disruption. The Group remains committed to investment in the upkeep of the property portfolio, primarily through the Group Property upkeep investment programme.
•Sourcing: the threat landscape associated with third-party suppliers and the critical services they provide continues to receive a significant amount of regulatory attention. The Group acknowledges the importance of demonstrating control and responsibility for those critical business services which could cause significant harm to the Group's customers.
MONITORING
Monitoring and reporting of operational resilience risk is undertaken at Board, Group, entity and divisional committees. Each committee monitors key risks, control effectiveness, key risk and control indicators, events, operational losses, risk appetite metrics and the results of independent testing conducted by the Risk division and/or the internal audit function.
The Group maintains a formal approach to operational resilience risk event escalation, whereby material events are identified, captured and escalated. Root causes are determined, and action plans put in place to ensure an optimum level of control to keep customers and the business safe, reduce costs, and improve efficiency.
OPERATING AND FINANCIAL REVIEW AND PROSPECTS
OPERATIONAL RISK
DEFINITION
Operational risk is defined as the risk of loss resulting from inadequate or failed internal processes, people and systems or from external events.
EXPOSURES
The principal operational risks to the Group which could result in customer detriment, unfair customer outcomes, financial loss, disruption and/or reputational damage are:
•A cyber-attack
•Failure of IT systems, due to volume of change, and/or aged infrastructure
•Internal and/or external fraud or financial crime
•Failure to ensure compliance with increasingly complex and detailed regulation including anti-money laundering, anti-bribery, counter-terrorist financing, and financial sanctions and prohibitions laws and regulations
A number of these risks could increase where there is a reliance on third-party suppliers to provide services to the Group or its customers.
MEASUREMENT
Operational risk is managed across Lloyds Bank Group through an operational risk framework and operational risk policies. The operational risk framework includes a risk and control self-assessment process, risk impact likelihood matrix, key risk and control indicators, risk appetite, a robust operational event management and escalation process, scenario analysis and an operational losses process.
The table below shows high level loss and event trends for the Group using Basel II categories. Based on data captured on the One Risk and Control Self-Assessment, in 2020 the highest frequency of events occurred in external fraud (79.10 per cent) and clients, products and business practices (10.88 per cent). Clients, products and business practices accounted for 60.30 per cent of losses by value, driven by legacy issues where impacts materialised in 2020 (excluding PPI).
| | | | | | | | | | | | | | | | | |
Operational risk events by risk category (losses greater than or equal to £10,000), excluding PPI1 |
| % of total volume | | % of total losses |
| 2020 | 2019 | | 2020 | 2019 |
| Business disruption and system failures | 0.25 | | 0.57 | | | 0.04 | | 0.25 | |
| Clients, products and business practices | 10.88 | | 14.64 | | | 60.30 | | 73.62 | |
| Damage to physical assets | 0.15 | | 0.17 | | | 17.56 | | 0.06 | |
| Employee practices and workplace safety | 0.30 | | 0.29 | | | 0.05 | | 0.03 | |
| Execution, delivery and process management | 9.12 | | 13.89 | | | 13.71 | | 20.22 | |
| External fraud | 79.10 | | 70.21 | | | 8.25 | | 5.75 | |
| Internal fraud | 0.20 | | 0.23 | | | 0.09 | | 0.07 | |
| Total | 100.00 | | 100.00 | | | 100.00 | | 100.00 | |
12019 breakdowns have been restated to reflect a number of events that have been reclassified following an internal review.
Operational risk losses and scenario analysis is used to inform the Internal Capital Adequacy Assessment Process (ICAAP). The Group calculates its minimum (Pillar I) operational risk capital requirements using The Standardised Approach (TSA). Pillar II is calculated using internal and external loss data and extreme but plausible scenarios that may occur in the next 12 months.
MITIGATION
The Group continues to focus on changing risk management requirements, adapting the change delivery model to be more agile and developing the people skills and capabilities needed to be a Bank of the Future. Risks are reported and discussed at local governance forums and escalated to executive management and Board as appropriate to ensure the correct level of visibility and engagement. The Group employs a range of risk management strategies, including: avoidance, mitigation, transfer (including insurance) and acceptance. Where there is a reliance on third-party suppliers to provide services, Lloyds Banking Group’s sourcing policy ensures that outsourcing initiatives follow a defined process including due diligence, risk evaluation and ongoing assurance.
Mitigating actions to the principal operational risks are:
•The threat landscape associated with cyber risk continues to evolve and there is significant regulatory attention on this subject. The Board continues to invest heavily to protect the Group from cyber-attacks. Investment continues to focus on improving the Group’s approach to identity and access management, improving capability to detect and respond to cyber-attacks and improved ability to manage vulnerabilities across the estate
•The Group continues to optimise its approach to IT and operational resilience by investing in technology improvements and enhancing the resilience of systems that support the Group's critical business processes, primarily through the technology resilience programme, with independent verification of progress on an annual basis
•The Group adopts a risk-based approach to mitigate the internal and external fraud risks it faces, reflecting the current and emerging fraud risks within the market. Fraud risk appetite metrics holistically cover the impacts of fraud in terms of losses to the Group, costs of fraud systems and operations, and customer experience of actual and attempted fraud. Oversight of the appropriateness and performance of these metrics is undertaken regularly through business area and Group-level committees. This approach drives a continual programme of prioritised enhancements to the Group’s technology and process and people related controls; with an emphasis on preventative controls supported by real time detective controls wherever feasible. Group-wide policies and operational control frameworks are maintained and designed to provide customer confidence, protect the Group’s commercial interests and reputation, comply with legal requirements and meet regulatory requirements. The Group’s fraud awareness programme remains a key component of its fraud control environment, and awareness of fraud risk is supported by mandatory training for all colleagues. This is further strengthened by material annual investment into both technology and the personal development needs of colleagues. The Group also plays an active role with other financial institutions, industry bodies, and enforcement agencies in identifying and combatting fraud
OPERATING AND FINANCIAL REVIEW AND PROSPECTS
•The Group has adopted policies and procedures designed to detect and prevent the use of its banking network for money laundering, terrorist financing, bribery, tax evasion, human trafficking, modern-day slavery and wildlife trafficking, and activities prohibited by legal and regulatory sanctions. Against a background of complex and detailed laws and regulations, and of continued criminal and terrorist activity, the Group regularly reviews and assesses its policies, procedures and organisational arrangements to keep them current, effective and consistent across markets and jurisdictions. The Group requires mandatory training on these topics for all employees. Specifically, the anti-money laundering procedures include ‘know-your-customer’ requirements, transaction monitoring technologies, reporting of suspicions of money laundering or terrorist financing to the applicable regulatory authorities, and interaction between the Group’s Financial Intelligence Unit and external agencies and other financial institutions. The Anti-Bribery Policy prohibits the payment, offer, acceptance or request of a bribe, including ‘facilitation payments’ by any employee or agent and provides a confidential reporting service for anonymous reporting of suspected or actual bribery activity. The Sanctions and the Related Prohibitions Policy sets out a framework of controls for compliance with legal and regulatory sanctions
–In addition to its efforts internally the Group also contributes to fraud and financial crime prevention by supporting and championing industry level activity, including:
–Being a signatory to the industry code for Authorised Push Payment (APP) fraud, which has greatly increased consumer protection and the reimbursement of funds to victims
–Co-sponsorship the National Economic Crime Centre (NECC) Fusion Cell, which was established in response to the changing economic crime threat related to COVID-19
–Maintaining partnerships with key partners such as City of London Police, Trading Standards, Global Cyber Alliance and North East Business Resilience Centre
–Active membership of Stop Scams UK, designed to stop scams at source by bringing together partnership from various industry sectors
MONITORING
Monitoring and reporting of operational risk is undertaken at Board, Group, entity and divisional committees. Each committee monitors key risks, control effectiveness, key risk and control indicators, events, operational losses, risk appetite metrics and the results of independent testing conducted by the Risk Division and/or Group Internal Audit.
The Group maintains a formal approach to operational risk event escalation, whereby material events are identified, captured and escalated. Root causes of events are determined, and action plans put in place to ensure an optimum level of control to keep customers and the business safe, reduce costs, and improve efficiency.
The insurance programme is monitored and reviewed regularly, with recommendations being made to the Group’s senior management annually prior to each renewal. Insurers are monitored on an ongoing basis, to ensure counterparty risk is minimised. A process is in place to manage any insurer rating changes or insolvencies.
OPERATING AND FINANCIAL REVIEW AND PROSPECTS
MODEL RISK
DEFINITION
Model risk is defined as the risk of financial loss, regulatory censure, reputational damage or customer detriment, as a result of deficiencies in the development, application or ongoing operation of models and rating systems.
Models are defined as quantitative methods that process input data into quantitative outputs, or qualitative outputs (including ordinal letter output) which have a quantitative measure associated with them. Model Governance Policy is restricted to specific categories of application of models, principally financial risk, treasury and valuation, with certain exclusions, such as prescribed calculations and project appraisal calculations.
EXPOSURES
There are over 300 models in the Group performing a variety of functions including:
capital calculation
credit decisioning, including fraud
pricing models
impairment calculation
stress testing and forecasting
market risk measurement
As a result of the wide scope and breadth of coverage, there is exposure to model risk across a number of the Group’s principal risk categories.
Model risk has increased in 2020 due to the nature and uncertainty of the economic outlook, a result of the COVID-19 pandemic. The effect of government-led customer support initiatives have weakened established relationships between model inputs and outputs, reducing the ability to forecast using models alone. While underlying model drivers are expected to remain valid in the longer term, year-end impairment reporting contains a greater element of governed judgement that reflects current conditions.
MEASUREMENT
The Group risk appetite framework is the key component for measuring the Group’s model risk. Reported monthly to the Group Risk Committee and Board, focus is placed on the performance of the Group’s most material models.
MITIGATION
The model risk management framework, established by and with continued oversight from an independent team in the Risk division, provides the foundation for managing and mitigating model risk within the Group. Accountability is cascaded from the Board and senior management via the Group enterprise risk management framework.
This provides the basis for Lloyds Banking Group's Model Governance Policy, which defines the mandatory requirements for models across Lloyds Bank Group, including:
•the scope of models covered by the policy
•model materiality
•roles and responsibilities, including ownership, independent oversight and approval
•key principles and controls regarding data integrity, development, validation, implementation, ongoing maintenance and revalidation, monitoring, and the process for non-compliance
The model owner takes responsibility for ensuring the fitness for purpose of the models and rating systems, supported and challenged by the independent specialist Group function.
The above ensures all models in scope of policy, including those involved in regulatory capital calculation, are developed consistently and are of sufficient quality to support business decisions and meet regulatory requirements.
MONITORING
The Lloyds Banking Group Model Governance Committee is the primary body for overseeing model risk. Policy requires that key performance indicators are monitored for every model to ensure they remain fit for purpose and all issues are escalated appropriately. Material model issues are reported to the Group and Board Risk Committees monthly with more detailed papers as necessary to focus on key issues.
OPERATING AND FINANCIAL REVIEW AND PROSPECTS
REGULATORY AND LEGAL RISK
DEFINITION
Regulatory and legal risk is defined as the risk of financial penalties, regulatory censure, criminal or civil enforcement action or customer detriment as a result of failure to identify, assess, correctly interpret, comply with, or manage regulatory and/or legal requirements.
EXPOSURES
Whilst the Group has a zero risk appetite for material regulatory breaches or material legal incidents, the Group remains exposed to them, driven by significant ongoing and new legislation, regulation and court proceedings in the UK and overseas which in each case needs to be interpreted, implemented and embedded into day-to-day operational and business practices across the Group.
MEASUREMENT
Regulatory and legal risks are measured against a defined risk appetite metric, which is an assessment of material regulatory breaches and material legal incidents.
MITIGATION
The Group undertakes a range of key mitigating actions to manage regulatory and legal risk. These include the following:
•The Board has established a Group-wide risk appetite and metric for regulatory and legal risk
•Lloyds Banking Group policies and procedures set out the principles and key controls that should apply across Lloyds Bank Group which are aligned to the Lloyds Bank Group risk appetite. Mandated policies and processes require appropriate control frameworks, management information, standards and colleague training to be implemented to identify and manage regulatory and legal risk
•Business units identify, assess and implement policy and regulatory requirements and establish local controls, processes, procedures and resources to ensure appropriate governance and compliance
•Business units regularly produce management information to assist in the identification of issues and test management controls are working effectively
•Risk and Legal departments provide oversight, proactive support and constructive challenge to the business in identifying and managing regulatory and legal issues
•Risk department conducts thematic reviews of regulatory compliance and provides oversight of regulatory compliance assessments across businesses and divisions where appropriate
•Business units, with the support of divisional and Group-level teams, conduct ongoing horizon scanning to identify and address changes in regulatory and legal requirements
•The Group engages with regulatory authorities and industry bodies on forthcoming regulatory changes, market reviews and investigations, ensuring programmes are established to deliver new regulation and legislation
•The Group has adapted quickly to evolving regulatory expectations during the COVID-19 pandemic and has engaged with regulatory authorities throughout
MONITORING
Material risks are managed through the relevant divisional-level committees, with review and escalation through Group level committees where appropriate, including the escalation of any material regulatory breaches or material legal incidents.
STRATEGIC RISK
DEFINITION
Strategic risk is defined as the risk which results from:
•Incorrect assumptions about internal or external operating environments
•Failure to respond or the inappropriate strategic response to material changes in the external or internal operating environments
•Failure to understand the potential impact of strategic responses and business plans on existing risk types
EXPOSURES
The Group faces significant risks due to the changing regulatory and competitive environments in the financial services sector, with an increased pace, scale and complexity of change. Customers, shareholders and employees expectations continue to evolve and current societal trends are likely to be accelerated by the pandemic.
Strategic risks can manifest themselves in existing principal risks or as new exposures which could adversely impact the Group and its businesses.
In considering strategic risks, a key focus is the interconnectivity of individual risks and the cumulative effect of different risks on the Group’s overall risk profile.
The Group is working actively to implement a robust framework for the identification, assessment and quantification of strategic risks. This framework has been deployed as part of the recent strategic review and is being embedded into the Group's day to day business operations.
MEASUREMENT
The Group assesses and monitors strategic risk implications as part of business planning and in its day to day activities, ensuring they respond appropriately to internal and external factors including changes to regulatory, macroeconomic and competitive environments. An assessment is made of the key strategic risks that are considered to impact the Group, leveraging internal and external information and the key mitigants or actions that could be taken in response.
Through 2021, a clear set of strategic risks, mitigants and controls will be embedded to meet divisional, legal entity and Group-wide objectives. The assessment and measurement will be supported by a quantitative risk assessment approach and underpinned by the One Risk and Control Self-Assessment (One RCSA) framework. The Group's quantitative risk assessment will focus specifically on assessing the connectivity of inherent risks, which can magnify their impact and severity.
MITIGATION
The range of mitigating actions includes:
•Horizon scanning is conducted across the Group to identify potential threats, risks, emerging issues, opportunities and explore future trends
•The Group’s business planning processes includes formal assessment of the strategic risk implications of new business, product entries and other strategic initiatives
•The Group’s governance framework mandates individual's and committee’s responsibilities and decision making rights, to ensure that strategic risks are appropriately reported and escalated
MONITORING
A review of the Group’s strategic risks, which includes the risks to the current strategic review and the mitigating actions, is undertaken on an annual basis and the findings are reported to the Group and Board Risk Committees.
Risks, alongside their control effectiveness, are articulated and reported regularly to Group and Board Risk Committees.
OPERATING AND FINANCIAL REVIEW AND PROSPECTS
INVESTMENT PORTFOLIO, MATURITIES, DEPOSITS
MATURITIES AND WEIGHTED AVERAGE YIELDS OF INTEREST-BEARING SECURITIES
The weighted average yield for each range of maturities is calculated by dividing the annualised interest income prevailing at 31 December 2020 by the book value of securities held at that date.
| | | | | | | | | | | | | | | | | | | | | | | | | | | | | | | | | | | |
| Maturing within
one year | | Maturing after one
but within five years | | Maturing after five
but within ten years | | Maturing after
ten years |
| Amount
£m | Yield
% | | Amount
£m | Yield
% | | Amount
£m | Yield
% | | Amount
£m | Yield
% |
| Financial assets at fair value through other comprehensive income | | | | | | | | | | | |
| US treasury and US government agencies | — | | — | | | 626 | | 0.2 | | | 1,373 | | 5.8 | | | — | | — | |
| Other government securities | 36 | | 5.6 | | | 4,279 | | 1.4 | | | 6,519 | | 1.3 | | | 1,434 | | 2.9 | |
| Asset-backed securities | — | | — | | | — | | — | | | — | | — | | | 65 | | 4.6 | |
| Corporate and other debt securities | 1,398 | | 2.1 | | | 9,807 | | 1.2 | | | 1,723 | | 2.0 | | | — | | — | |
| | | | | | | | | | | |
| 1,434 | | | | 14,712 | | | | 9,615 | | | | 1,499 | | |
| Debt securities held at amortised cost | | | | | | | | | | | |
| Mortgage-backed securities | — | | — | | | 1,645 | | 0.8 | | | — | | — | | | 401 | | 0.6 | |
| Other asset-backed securities | 12 | | — | | | — | | — | | | 1,594 | | 0.8 | | | 7 | | 3.9 | |
| Corporate and other debt securities | 15 | | — | | | 1,089 | | 3.0 | | | 374 | | 2.0 | | | 1 | | — | |
| 27 | | | | 2,734 | | | | 1,968 | | | | 409 | | |
MATURITY ANALYSIS AND INTEREST RATE SENSITIVITY OF LOANS AND ADVANCES TO CUSTOMERS AND BANKS
The following table analyses the maturity profile and interest rate sensitivity of loans by type on a contractual repayment basis at 31 December 2020. All amounts are before deduction of impairment allowances. Demand loans are included in the ‘maturing in one year or less’ category; balances with no fixed maturity are included in the 'maturing after fifteen years' category.
| | | | | | | | | | | | | | | | | |
| Maturing
in one
year
or less
£m | Maturing
after one
but within
five years
£m | Maturing
after five
but within
fifteen years
£m | Maturing
after
fifteen
years
£m | Total
£m |
| Loans and advances to banks | 4,872 | | 1,080 | | 2 | | — | | 5,954 | |
| Loans and advances to customers: | | | | | |
| Mortgages | 14,985 | | 51,959 | | 128,381 | | 110,641 | | 305,966 | |
| Other personal lending | 1,680 | | 7,181 | | 1,519 | | 14,915 | | 25,295 | |
| Property companies and construction | 5,486 | | 12,227 | | 9,217 | | 3,208 | | 30,138 | |
| Financial, business and other services | 60,589 | | 7,935 | | 7,038 | | 1,709 | | 77,271 | |
| Transport, distribution and hotels | 4,640 | | 3,747 | | 5,477 | | 365 | | 14,229 | |
| Manufacturing | 1,739 | | 1,487 | | 1,110 | | 119 | | 4,455 | |
| Other | 6,589 | | 14,826 | | 4,395 | | 2,678 | | 28,488 | |
| Total loans | 100,580 | | 100,442 | | 157,139 | | 133,635 | | 491,796 | |
| Of which: | | | | | |
| Fixed interest rate | 71,377 | | 53,339 | | 97,865 | | 91,010 | | 313,591 | |
| Variable interest rate | 29,203 | | 47,103 | | 59,274 | | 42,625 | | 178,205 | |
| 100,580 | | 100,442 | | 157,139 | | 133,635 | | 491,796 | |
DEPOSITS
The following tables show the details of the Group’s average customer deposits in each of the past three years.
| | | | | | | | | | | | | | | | | | | | | | | | | | | | | |
| 2020 | 2020 | 2020 | 2019 | 2019 | 2019 | 2018 | 2018 | 2018 |
| Closing
balance | Average
balance | Average
rate | Closing
balance | Average
balance | Average
rate | Closing
balance | Average
balance | Average
rate |
| £m | £m | % | £m | £m | % | £m | £m | % |
| Non-interest bearing demand deposits | 116,214 | | 95,629 | | — | | 80,247 | | 74,130 | | — | | 73,364 | | 72,428 | | — | |
| Interest-bearing demand deposits | 244,119 | | 246,100 | | 0.41 | | 229,437 | | 237,495 | | 0.68 | | 235,475 | | 239,629 | | 0.51 | |
| Other deposits | 64,819 | | 69,971 | | 0.38 | | 77,625 | | 78,222 | | 0.57 | | 80,594 | | 91,377 | | 0.84 | |
| Total customer deposits | 425,152 | | 411,700 | | 0.31 | | 387,309 | | 389,847 | | 0.53 | | 389,433 | | 403,434 | | 0.50 | |
OPERATING AND FINANCIAL REVIEW AND PROSPECTS
UNINSURED DEPOSITS
The following table gives details of the Group’s customer deposits at 31 December 2020 which were not covered by any deposit protection scheme by time remaining to maturity.
| | | | | | | | | | | | | | | | | |
| 3 months
or less
£m | Over 3
months
but within
6 months
£m | Over 6
months
but within
12 months
£m | Over
12 months
£m | Total
£m |
| Uninsured customer deposits | 184,575 | | 832 | | 1,078 | | 2,092 | | 188,577 | |
Total uninsured customer deposits have been calculated as the aggregate carrying value of the Group’s customer deposits less the insured deposit amounts as determined for regulatory purposes by the Group’s licensed deposit-takers, being those deposits eligible for protection under deposit protection schemes (principally the Financial Services Compensation Scheme in the UK). The maturity analysis for uninsured deposits has been estimated using the weighted-average maturity profile of the total customer deposits of each of the Group’s licensed deposit-takers.
STATEMENT ON US CORPORATE GOVERNANCE STANDARDS
The Board is committed to the delivery of Lloyds Bank Group’s strategy which is underpinned by high standards of corporate governance designed to ensure consistency and rigour in its decision making. This report explains how those standards, in particular those laid down by the Financial Reporting Council in the Wates Corporate Governance Principles for Large Private Companies (the ‘Wates Code’), apply in practice to ensure that the Board and management work together for the long-term benefit of the Bank. The Wates Code can be found at www.frc.org.uk.
To assist the Board in carrying out its functions and to provide independent oversight of internal control and risk management, certain responsibilities are delegated to the Board’s Committees. The Board is kept up to date on the activities of the Committees through reports from each of the Committee Chairs. Terms of Reference for each of the Committees are available on the website www.lloydsbankinggroup.com. Information on the membership, role and activities of the Nomination Committee, the Audit Committee, the Board Risk Committee and the Remuneration Committee can be found on pages 77 and 79.
As a non-US company with securities listed on the New York Stock Exchange (NYSE) the Bank is required to disclose any significant ways in which its corporate governance practices differ from those followed by domestic US companies listed on the NYSE. Key differences are set out below.
The NYSE corporate governance listing standards require domestic US companies to adopt and disclose corporate governance policies. For the Bank, the Nomination Committee sets the appropriate corporate governance principles and oversees the annual evaluation of the performance of the Board, its Committees and its individual members.
Under the NYSE corporate governance listing standards, the remuneration, nomination and governance committees of domestic US companies must be comprised of entirely independent directors. However for the Bank, the Remuneration Committee and the Nomination Committee include the Chair, with all other members being independent non-executive directors.
Board and Committee Composition and Board Attendance in 20201
| | | | | | | | | | | | | | | | | | | | |
| Board Member | Date of
appointment to Board | Board | Nomination
Committee | Audit
Committee | Board Risk
Committee | Remuneration
Committee |
| Lord Blackwell (C) | June 2012 | 13/13 | 7/7 C | — | 8/8 | 7/7 |
| António Horta–Osório | January 2011 | 13/13 | — | — | — | — |
| William Chalmers | August 2019 | 13/13 | — | — | — | — |
Juan Colombás1 | November 2013 | 10/10 | — | — | — | — |
Robin Budenberg2 | October 2020 | 3/3 | 1/1 | — | 2/2 | 2/2 |
| Sarah Bentley | January 2019 | 12/1312 | — | — | 7/812 | 6/712 |
Alan Dickinson3 | September 2014 | 13/13 | 7/7 | 7/7 | 8/8 | 7/7 |
Anita Frew4 | December 2010 | 6/710 | 3/3 | 4/4 | 4/4 | 3/410 |
| Brendan Gilligan | January 2019 | 13/13 | — | 7/7 | 8/8 | — |
Simon Henry5 | June 2014 | 11/11 | — | 6/6 | 5/612 | — |
| Nigel Hinshelwood | January 2019 | 13/13 | 6/712 | 6/712 | 8/8 | 7/7 |
Sarah Legg6 | December 2019 | 13/13 | — | 7/7 C | 8/8 | — |
| Lord Lupton | June 2017 | 13/13 | — | — | 8/8 | — |
| Amanda Mackenzie | October 2018 | 13/13 | — | — | 8/8 | 7/7 |
Nick Prettejohn7 | June 2014 | 12/1311 | 5/611 | 7/7 | 8/8 C | — |
| Stuart Sinclair | January 2016 | 12/1310 | 6/712 | — | 8/8 | 7/7 C |
Sara Weller8 | February 2012 | 13/13 | 5/711 12 | — | 7/812 | 7/7 |
Catherine Woods7 9 | March 2020 | 11/11 | — | 1/1 | 6/6 | 5/5 |
CChair
1Juan Colombás retired from the Board on 18 September 2020.
2Robin Budenberg joined the Board and respective Committees on 1 October 2020 and became Chair of the Nomination Committee on 1 January 2021.
3Alan Dickinson succeeded Anita Frew as Deputy Chair on 21 May 2020.
4Anita Frew retired from the Board on 21 May 2020.
5Simon Henry retired from the Board on 30 September 2020.
6Sarah Legg succeeded Simon Henry as Chair of the Audit Committee with effect from 1 October 2020.
7Nick Prettejohn succeeded Alan Dickinson as Chair of the Board Risk Committee on 21 May 2020 and was succeeded in that role by Catherine Woods on 1 January 2021.
8Sara Weller plans to retire as a Non-Executive Director at the time of Lloyds Banking Group's AGM in May 2021.
9Catherine Woods joined the Board and the Board Risk and Remuneration Committees on 1 March 2020 and the Audit Committee on 10 September 2020.
10Unable to attend due to illness.
11Unable to attend ad hoc meeting scheduled on a Sunday evening at short notice.
12Unable to attend due to another business commitment.
13Where a Director is unable to attend a meeting s/he receives papers in advance and has the opportunity to provide comments to the Chair of the Board or to the relevant Committee Chair.
UK CORPORATE GOVERNANCE STATEMENT
In accordance with the Large and Medium-sized Companies and Groups (Accounts and Reports) Regulations 2008 (as amended by the Companies (Miscellaneous Reporting) Regulations 2018) (the ‘Regulations’), for the year ended 31 December 2020, the Bank has in its corporate governance arrangements applied the Wates Corporate Governance Principles for Large Private Companies (the ‘Principles’), which are available at frc.org.uk. The following section explains the Bank’s approach to corporate governance, and its application of the Principles.
Fundamental to the Bank’s strategy are high standards of corporate governance. A Corporate Governance Framework is in place for Lloyds Banking Group, the Bank, Bank of Scotland plc and HBOS plc, with all four companies sharing a common approach to governance. The framework is designed to meet the specific needs of each company, setting the wider approach and applicable standards in respect of the Bank’s corporate governance practices, including addressing the matters set out in the Principles and the governance requirements of the operation of the Bank as part of Lloyds Banking Group’s Ring Fenced Bank.
This includes the matters reserved to the Board, and the matters the Board has chosen to delegate to management, including decision making on operational matters such as those relating to credit, liquidity, and the day-to-day management of risk. Governance arrangements, including the Corporate Governance Framework, are reviewed at least annually to ensure they remain fit for purpose. The Board delegates further responsibilities to the Group Chief Executive, who is supported by the Group Executive Committee. The Corporate Governance Framework of the Bank further addresses the requirements of the Principles as discussed below.
Principle One – Purpose and Leadership
The Board is collectively responsible for the long term success of the Bank. It achieves this by agreeing the Bank’s strategy, within the wider strategy of Lloyds Banking Group, and overseeing delivery against it. The Bank’s strategy is discussed further on page 3. The Board also assumes responsibility for the management of the culture, values and wider standards of the Bank, within the equivalent standards set by Lloyds Banking Group.
Consideration of the needs of all stakeholders is fundamental to the way the Bank operates, as is maintaining the highest standards of business conduct, which along with ensuring delivery for customers is a vital part of the corporate culture. The Bank’s approach is further influenced by the need to build a culture in which everyone feels included, empowered and inspired to do the right thing for customers. To this end, the Board plays a lead role in establishing, promoting, and monitoring the Bank’s corporate culture and values, with the Corporate Governance Framework ensuring such matters receive the level of prominence in Board and Executive decision making which they require. The Bank’s corporate culture and values align to those of Lloyds Banking Group.
Principle Two – Board Composition
The Bank is led by a Board comprising a Non-Executive Chair, independent Non-Executive Directors and Executive Directors. The Board considers its composition regularly and is committed to ensuring it has the right balance of skills and experience. The Board considers its current size and composition is appropriate to the Bank’s circumstances. The Board places great emphasis on ensuring its membership reflects diversity in its broadest sense. New appointments are made on merit, taking account of the specific skills and experience, independence and knowledge needed to ensure a rounded board and the diversity benefits each candidate can bring overall. There are a range of initiatives across Lloyds Banking Group to help ensure unbiased career progression opportunities. Progress on diversity objectives is monitored by the Board and built into its assessment of executive performance.
The Board is supported by its committees, the operation of which are discussed below, which make recommendations to the Board on matters delegated to them, in particular in relation to internal control, risk, financial reporting and remuneration matters. Each committee has written terms of reference setting out its delegated responsibilities. Each committee comprises Non-Executive Directors with appropriate skills and experience and is chaired by an experienced chairman. The committee Chairs report to the Board at the next Board meeting. The Board undertakes an annual review of its effectiveness, which provides an opportunity to consider ways of identifying greater efficiencies, ways to maximise strengths and highlights areas of further development. The 2020 effectiveness review was commissioned by the Board, overseen by the Nomination Committee and conducted internally by the Company Secretary between November 2020 and January 2021. In addition to considering the effectiveness of the Board, the effectiveness of the Board committees and individual Directors was also considered, with individual performance evaluation conducted for each of the members of the Board.
Principle Three – Director Responsibilities
The Directors assume ultimate responsibility for all matters, and along with senior management are committed to maintaining a robust control framework as the foundation for the delivery of good governance, including the effective management of delegation through the Corporate Governance Framework. Policies are also in place in relation to potential conflicts of interest which may arise. All Directors have access to the services of the Company Secretary, and independent professional advice is available to the Directors at the expense of Lloyds Banking Group, where they judge it necessary to discharge their duties as directors.
The Board is supported by its committees which make recommendations on matters delegated to them under the Corporate Governance Framework. The management of all committees is in keeping with the basis on which meetings of the Board are managed, with open debate, and adequate time for members to consider proposals which are put forward. The Chair of the Board and each Board committee assumes responsibility with support from the Company Secretary for the provision to each meeting of accurate and timely information.
Principle Four – Opportunity and Risk
The Board oversees the development and implementation of the Bank’s strategy, within the context of the wider strategy of Lloyds Banking Group, which includes consideration of all strategic opportunities. The Board is also responsible for the long term sustainable success of the Bank, generating value for its shareholders and ensuring a positive contribution to society. The Board agrees the Bank’s culture, purpose, values and strategy, within that of Lloyds Banking Group, and agrees the related standards of the Bank, again within the relevant standards of Lloyds Banking Group. Further specific aims and objectives of the Board are formalised within the Corporate Governance Framework, which also sets out the matters reserved for the Board.
Strong risk management is central to the strategy of the Bank, which along with a robust risk control framework acts as the foundation for the delivery of effective management of risk. The Board agrees the Bank’s risk appetite and ensures the Bank manages risk effectively, delegating related authorities to individuals through the Corporate Governance Framework and the further management hierarchy. Board level engagement coupled with the direct involvement of senior management in risk issues ensures that escalated issues are promptly addressed, and remediation plans are initiated where required. The Bank’s risk appetite, principles, policies, procedures, controls and reporting are managed in conjunction with those of Lloyds Banking Group, and as such are regularly reviewed to ensure they remain fully in line with regulations, law, corporate governance and industry best practice. The Bank’s principal risks are discussed further on page 23.
Principle Five – Remuneration
The Remuneration Committee of the Board, in conjunction with the Remuneration Committee of Lloyds Banking Group (the ‘Remuneration Committees’), assume responsibility for the Bank’s approach to remuneration. This includes reviewing and making recommendations on remuneration policy as relevant to the Bank, ranging from the remuneration of Directors and members of the Executive to that of all other colleagues employed by the Bank. This includes colleagues where the regulators require the Bank to implement a specific approach to their remuneration, such as Senior Managers and other material risk takers. The activities of the Remuneration Committees extend to matters of remuneration relevant to subsidiaries of the Bank, where such subsidiary does not have its own remuneration committee. Certain members of the Lloyds Banking Group Executive, including the Group People and Property Director, are authorised to act upon the decisions made by the Remuneration Committees, and to undertake such other duties relevant to remuneration as delegated to them.
Principle Six – Stakeholders
The COVID-19 pandemic has during the year had a profound effect on the way we live, including on the Bank’s many stakeholders. The Board has monitored the impact of the pandemic on the Group’s and Bank’s business and its stakeholders, seeking to ensure that the challenges posed by the pandemic were addressed. The Board considered related updates from management as events unfolded, covering matters including the impact on customers, colleagues, suppliers and other stakeholders, approving suitable action as required.
The Bank as part of Lloyds Banking Group operates under Lloyds Banking Group’s wider Responsible Business approach, which acknowledges that the Bank has a responsibility to help address the economic, social and environmental challenges which the UK faces, and as part of this understand the needs of the Bank’s external stakeholders, including in the development and implementation of strategy. Central to this is Lloyds Banking Group’s Helping Britain Prosper plan, in which the Bank participates, which during the year has focused on the response to COVID, and Helping Britain Recover. This involved bringing together many of the Board’s key stakeholders, to determine how the Bank could best support the recovery from the pandemic.
In 2020 the Responsible Business Committee of Lloyds Banking Group provided further oversight and support of Lloyds Banking Group’s and the Bank’s strategy and plans for embedding responsible business in the Banks’ core purpose. The Responsible Business Committee determined that the Bank and Lloyds Banking Group continued to demonstrate responsibility as a key priority.
Committees of the Board
The Board operates a number of Committees, composed of Non-Executive Directors, with the responsibilities set out below.
Nomination Committee
Responsible for reviewing and making recommendations to the Board on the composition of the Bank’s Board and its Committees, taking into account the principles, policies and governance requirements of Lloyds Banking Group.
Audit Committee
Responsible for monitoring and reviewing the formal arrangements established by the Board in respect of the financial reporting and narrative reporting of the Bank, the effectiveness of the internal controls and the risk management framework, whistleblowing arrangements, internal and external audit process.
Board Risk Committee
Responsible for reviewing and reporting its conclusions to the Board on Lloyds Bank Group’s current and future risk appetite (the extent and categories of risk which the Board regards as acceptable for the Bank to bear), the Lloyds Bank Group’s risk management framework (setting out the procedures to manage risk, embracing principles, policies, methodologies, systems, processes, procedures and people), and Lloyds Bank Group’s risk culture to ensure that it supports Lloyds Bank Group’s risk appetite.
Remuneration Committee
Responsible for reviewing and making recommendations to the Board on the remuneration policy for the Bank and for performing such other duties as may be prescribed for remuneration committees by the Regulators of the Bank, taking into account the principles, policies and governance requirements of Lloyds Banking Group.
Service Agreements
The Service contracts of all current Executive Directors are terminable on 12 months’ notice from Lloyds Bank Group and six months’ notice from the individual. The Chair also has a letter of appointment. His engagement may be terminated on six months’ notice by the Group or him.
Letters of Appointment
The Non-Executive Directors all have letters of appointment and are appointed for an initial term of three years after which their appointment may continue subject to an annual review. Non-Executive Directors may have their appointment terminated, in accordance with statute and the articles of association, at any time with immediate effect and without compensation.
The service contracts and letters of appointments are available for inspection at the Company’s registered office.
Termination payments
It is the Group’s policy that where compensation on termination is due, it should be paid on a phased basis, mitigated in the event that alternative employment is secured. Where it is appropriate to make a bonus payment ( known as Group Performance Share) to the individual, this should relate to the period of actual service, rather than the full notice period. Any Group Performance Share payment will be determined on the basis of performance as for all continuing employees and will remain subject to performance adjustment (malus and clawback) and deferral. Generally, on termination of employment, Group Performance Share awards, in flight Group Ownership Share awards, Long Term Share Plan awards and other rights to payments will lapse except where termination falls within one of the reasons set out below. In the event of redundancy, the individual may receive a payment in line with statutory entitlements at that time. If an Executive Director is dismissed for gross misconduct, the Executive Director will receive normal contractual entitlements until the date of termination and all deferred Group Performance Share, Group Ownership Share and Long Term Share Plan awards will lapse.
| | | | | | | | | | | |
|
Base salary |
Fixed share award | Pension, Benefits and
other fixed remuneration |
| Resignation | In the case of resignation to take up new employment, paid until date of termination (including any period of leave required by the Group). In the case of resignation for other reasons, base salary will be paid in monthly instalments for the notice period (or any balance of it), offset by earnings from new employment during this period. | Awards continue and are released at the normal time and the number of shares subject to the award in the current year will be reduced to reflect the date of termination. | Paid until date of termination including any period of leave required by the Group (subject to individual benefit scheme rules). |
| Redundancy or termination by mutual agreement | Paid until date of termination (including any period of leave required by the Group). In respect of the balance of any notice period, base salary will be paid in monthly instalments, offset by earnings from new employment during this period. | Awards will normally continue and be released at the normal time and the number of shares subject to the award in the current year will be reduced to reflect the date of termination unless, in the case of mutual agreement, the Remuneration Committee (‘the Committee’) determines that exceptional circumstances apply in which case shares may be released on termination. | Paid until date of termination including any period of leave required by the Group (subject to individual benefit scheme rules). |
| Retirement/ill health, injury, permanent disability/death | Paid until date of retirement/death. For ill health, injury or permanent disability which results in the loss of employment, paid for the applicable notice period (including any period of leave required by the Group). | Awards will normally continue and be released at the normal time and the number of shares subject to the award in the current year will be reduced to reflect the date of termination except for (i) death where shares are released on the date of termination; or (ii) in the case of permanent disability the Committee determines that exceptional circumstances apply in which case shares may be released on the date of termination. | Paid until date of death/ retirement (subject to individual benefit scheme rules). For ill health, injury, permanent disability, paid for the notice period including any period of leave required by the Group (subject to individual benefit scheme rules). |
Change of control or merger2 | N/A | Awards will be payable on the date of the Change of Control and the number of shares subject to the award will be reduced to reflect the shorter accrual period. The Committee may decide that vested awards will be exchanged for (and future awards made over) shares in the acquiring company or other relevant company. | N/A |
| Other reason where the Committee determines that the executive should be treated as a good leaver | Paid until date of termination (including any period of leave required by the Group). In respect of the balance of any notice period, base salary will be paid in monthly instalments, offset by earnings from new employment during this period. | Awards continue and are released at the normal time and the number of shares subject to the award in the current year will be reduced to reflect the date of termination. | Paid until date of termination including any period of leave required by the Group (subject to individual benefit scheme rules). |
| | | | | | | | | | | |
| Group Performance Share (Annual bonus plan)1 | Long Term Share Plan (Long term variable reward plan)2 | Chairman and Non-Executive Directors Fees3 |
| Resignation | Unvested deferred Group Performance Share awards are forfeited and in-year Group Performance Share awards are accrued until the date of termination (or the commencement of garden leave if earlier) unless the Committee determines otherwise (in exceptional circumstances), in which case such awards are subject to deferral, malus and clawback. | Awards lapse on date of leaving (or on notice of leaving) unless the Committee determines otherwise in exceptional circumstances that they will vest on the original vesting date (or exceptionally on the date of leaving). Where award is to vest it will be subject to the underpins and time pro-rating (for months worked in underpin period). Malus and clawback will apply. | Paid until date of leaving Board. |
| Redundancy or termination by mutual agreement | For cases of redundancy, unvested deferred Group Performance Share awards are retained and in-year Group Performance Share awards are accrued until the date of termination (or the commencement of garden leave if earlier). Such awards would be subject to deferral, malus and clawback. For termination by mutual agreement, the same approach as for resignation would apply. | Awards vest on the original vesting date (or exceptionally on the date of leaving). Vesting is subject to the underpins and time pro-rating (for months worked in underpin period). Malus and clawback will apply. | Paid until date of leaving Board. |
| | | | | | | | | | | |
| Group Performance Share (Annual bonus plan)1 | Long Term Share Plan (Long term variable reward plan)2 | Chairman and Non-Executive Directors Fees3 |
| Retirement/ill health, injury, permanent disability | Unvested deferred Group Performance Share awards are retained and in-year Group Performance Share awards are accrued until the date of termination (or the commencement of garden leave if earlier). Such awards would be subject to deferral, malus and clawback. | Awards vest on the original vesting date (or exceptionally on the date of leaving). Vesting is subject to the underpins and time pro-rating (for months worked in underpin period). Malus and clawback will apply. | Paid until date of leaving Board. |
| Death | Unvested deferred Group Performance Share awards are retained and in-year Group Performance Share awards are accrued until the date of termination. Deferred Group Performance Share awards vest on death in cash, unless the Committee determines otherwise. | Awards vest in full on the date of death unless in exceptional circumstances the Remuneration Committee determines that the underpins or pre- vest test do not support full vesting. | Paid until date of leaving Board. |
Change of control or merger2 | In-year Group Performance Share accrued up until date of change of control or merger (current year). Where there is a Corporate Event, deferred Group Performance Share awards vest to the extent and timing determined by the Committee in its absolute discretion. | Awards vest on date of event. vesting is subject to the underpins and time pro-rating (for months worked in underpin period unless determined otherwise). Malus and clawback will normally apply. Instead of vesting, awards may be exchanged for equivalent awards over the shares of the acquiring company or another company or equivalent cash based awards. | Paid until date of leaving Board. |
| Other reason where the Committee determines that the executive should be treated as a good leaver | Unvested deferred Group Performance Share awards are retained and in-year Group Performance Share awards are accrued until the date of termination (or the commencement of garden leave if earlier). Deferred Group Performance Share awards vest in line with normal timeframes and are subject to malus and clawback. The Committee may allow awards to vest early if it considers it appropriate. | Awards vest on the original vesting date (or exceptionally on the date of leaving). vesting is subject to the underpins and time pro-rating (for months worked in underpin period). Malus and clawback will apply. | Paid until date of leaving Board. |
1If any Group Performance Share is to be paid to the Executive Director for the current year, this will be determined on the basis of performance for the period of actual service, rather than the full notice period (and so excluding any period of leave required by the Group).
2Reference to change of control or merger includes a compromise or arrangement under section 899 of the Companies Act 2006 or equivalent. Fixed share awards may also be released/ exchanged in the event of a resolution for the voluntary winding up of the Company; a demerger, delisting, distribution (other than an ordinary dividend) or other transaction, which, in the opinion of the Committee, might affect the current or future value of any award; or a reverse takeover, merger by way of a dual listed company or other significant corporate event, as determined by the Committee. In the event of a demerger, special dividend or other transaction which would in the Committee’s opinion affect the value of awards, the Committee may allow a deferred Group Performance Share award or a long term incentive award to vest to the extent relevant performance conditions are met to that date and if the Committee so determined, on a time pro-rated basis (unless determined otherwise) to reflect the number of months of the underpin period worked.
3The Chairman is entitled to six months’ notice.
On termination, the Executive Director will be entitled to payment for any accrued but untaken holiday calculated by reference to base salary and fixed share award.
The cost of legal, tax or other advice incurred by an Executive Director in connection with the termination of their employment and/or the cost of support in seeking alternative employment may be met up to a maximum of £100,000. Additional payments may be made where required to settle legal disputes, or as consideration for new or amended post-employment restrictions.
Where an Executive Director is in receipt of expatriate or relocation expenses at the time of termination (as at the date of the AGM no current Executive Directors are in receipt of such expenses), the cost of actual expenses incurred may continue to be reimbursed for up to 12 months after termination or, at the Group’s discretion, a one-off payment may be made to cover the costs of premature cancellation. The cost of repatriation may also be covered.
INTERNAL CONTROL
Board responsibility
The Board is responsible for Lloyds Bank Group’s risk management and internal control systems, which are designed to facilitate effective and efficient operations and to ensure the quality of internal and external reporting and compliance with applicable laws and regulations. The Directors and senior management are committed to maintaining a robust control framework as the foundation for the delivery of effective risk management. The Directors acknowledge their responsibilities in relation to the Lloyds Bank Group’s risk management and internal control systems and for reviewing their effectiveness.
In establishing and reviewing the risk management and internal control systems, the Directors carried out a robust assessment of the principal risks facing the Bank, including those that would threaten its business model, future performance, solvency or liquidity, the likelihood of a risk event occurring and the costs of control. The process for identification, evaluation and management of the principal risks faced by Lloyds Bank Group is integrated into Lloyds Bank Group’s overall framework for risk governance. The Lloyds Bank Group is forward-looking in its risk identification processes to ensure emerging risks are identified. The risk identification, evaluation and management process also identifies whether the controls in place result in an acceptable level of risk. At the Lloyds Bank Group level, a consolidated risk report and risk appetite dashboard are reviewed and regularly debated by the executive Lloyds Bank Group Risk Committee, Board Risk Committee and the Board to ensure that they are satisfied with the overall risk profile, risk accountabilities and mitigating actions. The report and dashboard provide a monthly view of Lloyds Bank Group’s overall risk profile, key risks and management actions, together with performance against risk appetite and an assessment of emerging risks which could affect Lloyds Bank Group’s performance over the life of the operating plan. Information regarding the main features of the internal control and risk management systems in relation to the financial reporting process is provided within the risk management report on pages 24 to 74. The Board concluded that Lloyds Bank Group’s risk management arrangements are adequate to provide assurance that the risk management systems put in place are suitable with regard to Lloyds Bank Group’s profile and strategy.
Control Effectiveness Review
An annual Control Effectiveness Review (CER) is undertaken to evaluate the effectiveness of Lloyds Bank Group’s control framework with regard to its material risks, and to ensure management actions are in place to address key gaps or weaknesses in the control framework. Business areas and head office functions assess the controls in place to address all material risk exposures across all risk types. The CER considers all material controls, including financial, operational and compliance controls. Senior management approve the CER findings which are reviewed and independently challenged by the Risk Division and Lloyds Bank Group Internal Audit and reported to the Board. Action plans are implemented to address any control deficiencies.
Reviews by the Board
The effectiveness of the risk management and internal control systems is reviewed regularly by the Board and the Audit Committee, which also receives reports of reviews undertaken by the Risk Division and Lloyds Bank Group Internal Audit. The Audit Committee also considers reports received from the Bank’s external auditor and has a discussion with it at least once a year without executives present.
Lloyds Bank Group’s risk management and internal control systems are regularly reviewed by the Board and are consistent with the guidance on Risk Management, Internal Control and Related Financial and Business Reporting issued by the Financial Reporting Council and compliant with the requirements of CRD IV. They have been in place for the year under review and up to the date of the approval of the Annual Report. Lloyds Bank Group has determined a pathway to compliance with BCBS 239 risk data aggregation and risk reporting requirements and continues to actively manage enhancements.
Auditor independence
Both the Lloyds Banking Group Board and the external auditor have policies and procedures designed to protect the independence and objectivity of the external auditor for Lloyds Banking Group plc and all of its subsidiary undertakings, including those entities within the Lloyds Bank Group. In 2020, the Lloyds Banking Group Audit Committee amended its policy to reflect changes to the Financial Reporting Council’s rules on auditor independence and to require Deloitte LLP, who will be appointed as the Bank’s auditors during 2021, to comply with the policy. To ensure that there is an appropriate level of oversight the Lloyds Banking Group Audit Committee approves the nature of services that the external auditor is permitted to perform and the policy sets a financial threshold above which it must approve in advance all non-audit engagements of the external auditor; the policy permits senior management to approve certain engagements for permitted services with fees for amounts below the threshold. The policy also details those services that the external auditor is prohibited from providing; these are consistent with the non-audit services which the FRC considers to be prohibited. The total amount of fees paid to the auditor for both audit and non-audit related services in 2020 is disclosed in note 10 to the financial statements.
DISCLOSURE CONTROLS AND PROCEDURES
As of 31 December 2020, the Lloyds Bank Group, under the supervision and with the participation of the Lloyds Bank Group’s management, including the Group Chief Executive and the Chief Financial Officer, performed an evaluation of the effectiveness of the Lloyds Bank Group’s disclosure controls and procedures. Based on this evaluation, the Group Chief Executive and Chief Financial Officer concluded that the Bank’s disclosure controls and procedures, at 31 December 2020, were effective for gathering, analysing and disclosing with reasonable assurance the information that the Lloyds Bank Group is required to disclose in the reports it files under the Securities Exchange Act of 1934, within the time periods specified in the SEC’s rules and forms. The Lloyds Bank Group’s management necessarily applied its judgement in assessing the costs and benefits of such controls and procedures, which by their nature can provide only reasonable assurance regarding management’s control objectives.
CHANGES IN INTERNAL CONTROL OVER FINANCIAL REPORTING
There have been no changes in the Lloyds Bank Group’s internal control over financial reporting during the year ended 31 December 2020 that have materially affected, or are reasonably likely to materially affect, the Group’s internal control over financial reporting.
MANAGEMENT REPORT ON INTERNAL CONTROL OVER FINANCIAL REPORTING
The management of Lloyds Bank plc is responsible for establishing and maintaining adequate internal control over financial reporting. Lloyds Bank plc’s internal control over financial reporting is a process designed to provide reasonable assurance regarding the reliability of financial reporting and the preparation of financial statements for external purposes in accordance with IFRS.
The Bank’s internal control over financial reporting includes those policies and procedures that (i) pertain to the maintenance of records that, in reasonable detail, accurately and fairly reflect transactions and dispositions of assets; (ii) provide reasonable assurance that transactions are recorded as necessary to permit preparation of financial statements in accordance with IFRS and that receipts and expenditures are being made only in accordance with authorisations of management and directors of Lloyds Bank plc; and (iii) provide reasonable assurance regarding prevention or timely detection of unauthorised acquisition, use, or disposition of the Bank’s assets that could have a material effect on the financial statements.
The management of Lloyds Bank plc assessed the effectiveness of the Bank’s internal control over financial reporting at 31 December 2020 based on the criteria established in Internal Control – Integrated Framework 2013 issued by the Committee of Sponsoring Organisations of the Treadway Commission (COSO). Based on this assessment, management concluded that, at 31 December 2020, the Bank’s internal control over financial reporting was effective.
Internal control systems, no matter how well designed, have inherent limitations and may not prevent or detect misstatements. Also, projections of any evaluation of effectiveness to future periods are subject to the risk that controls may become inadequate because of changes in conditions, or that the degree of compliance with the policies and procedures may deteriorate.
GOING CONCERN
The going concern of the Bank and the Lloyds Bank Group is dependent on successfully funding their respective balance sheets and maintaining adequate levels of capital. In order to satisfy themselves that the Bank and the Lloyds Bank Group have adequate resources to continue to operate for the foreseeable future, the Directors have considered a number of key dependencies which are set out in the risk management section under the Lloyds Bank Group’s principal risks: funding and liquidity on page 23 and pages 52 to 55 and capital position on pages 56 to 61. Additionally, the Directors have considered capital and funding projections for the Bank and the Lloyds Bank Group. Accordingly, the Directors conclude that the Bank and the Lloyds Bank Group have adequate resources to continue in operational existence for a period of at least 12 months from the date of approval of the financial statements and therefore it is appropriate to continue to adopt the going concern basis in preparing the accounts.
CHANGE IN THE BANK'S CERTIFYING ACCOUNTANT
In 2018, Lloyds Banking Group concluded a tender process for the statutory audit of Lloyds Banking Group plc and its subsidiaries. Following the completion of the audit of the consolidated financial statements of Lloyds Bank plc (the ‘Bank’) and its subsidiaries (together the ‘Lloyds Bank Group’) for the year ended 31 December 2020, Deloitte LLP (Deloitte) are expected to be appointed as the Bank’s statutory auditor for the year ending 31 December 2021, subject to approval by shareholders at the 2021 Annual General Meeting of the Bank. This change of auditor was recommended to the Board of Directors by the Audit Committee. Accordingly, the engagement of PricewaterhouseCoopers LLP (PwC) will not be renewed in 2021.
During the years ended 31 December 2019 and 2020:
•PwC has not issued any reports on the consolidated financial statements of the Lloyds Bank Group that contained an adverse opinion or a disclaimer of opinion, or was qualified or modified as to uncertainty, audit scope or accounting principles;
•there has not been any disagreement, as that term is used in Item 16(F)(a)(1)(iv) of Form 20-F, over any matter of accounting principles or practices, financial statement disclosure or auditing scope or procedure, which disagreement if not resolved to PwC’s satisfaction would have caused it to make reference to the subject matter of the disagreement in connection with its auditor’s reports; and
•PwC has not advised the Lloyds Bank Group of any of the kinds of events described in Item 16(F)(a)(1)(v) of Form 20-F.
The Lloyds Bank Group has provided PwC with a copy of the foregoing disclosure and has requested that it furnish the Lloyds Bank Group with a letter addressed to the SEC stating whether or not it agrees with the above statements. A copy of such letter, dated 11 March 2021, in which PwC states that it agrees with such disclosure, is filed as Exhibit 15.2 to this 2020 Form 20-F.
During the years ended 31 December 2019 and 2020, the Lloyds Bank Group has not consulted with Deloitte regarding either:
•the application of accounting principles to a specific transaction, either completed or proposed, or the type of audit opinion that might be rendered with respect to the consolidated financial statements of the Lloyds Bank Group and either a written report was provided to the Bank or oral advice was provided that Deloitte concluded was an important factor considered by the Bank in reaching a decision as to the accounting, auditing or financial reporting issue; or
•any matter that was the subject of a disagreement, as that term is used in Item 16(F)(a)(1)(iv) of Form 20-F, or a reportable event as described in Item 16F(a)(1)(v) of Form 20-F.
APPROACH OF THE FINANCIAL CONDUCT AUTHORITY (“FCA”)
As per the Financial Services and Markets Act FSMA (amended by the Financial Services Act 2012), the FCA has a strategic objective to ensure that the relevant markets function well. In support of this, the FCA has three operational objectives: to secure an appropriate degree of protection for consumers; to protect and enhance the integrity of the UK financial system and to promote effective competition in the interests of consumers.
The FCA Handbook sets out rules and guidance across a range of conduct issues with which financial institutions are required to comply including high level principles of business and detailed conduct of business standards and reporting standards.
APPROACH OF THE PRUDENTIAL REGULATION AUTHORITY (“PRA”)
The PRA is part of the Bank of England, with responsibility for the prudential regulation and supervision of circa 1,500 banks, building societies, credit unions, insurers and major investment firms. Their strategy is to deliver a resilient financial sector by seeking: an appropriate quantity and quality of capital and liquidity; effective risk management; robust business models; and sound governance including clear accountability of firms’ management. This strategy supports their two statutory objectives: to promote the safety and soundness of these firms; and to contribute to the securing of an appropriate degree of protection for policyholders (for insurers).
Through regulation, the PRA sets standards/policies which it expects firms to meet, and monitors firm’s compliance. The supervision approach includes three key characteristics:
–Use of judgement to determine whether financial firms are safe and sound, whether insurers provide appropriate protection for policyholders and whether firms continue to meet the Threshold Conditions (including maintaining appropriate capital and liquidity, and having suitable management arrangements).
–A forward looking approach to assess firms against risks which may arise in the future.
–Focus on those issues and those firms that pose the greatest risk to the stability of the UK financial system and policyholders.
The PRA will change a firm’s business model if they judge that mitigating risk measures are insufficient.
OTHER BODIES IMPACTING THE REGULATORY REGIME
THE BANK OF ENGLAND AND HM TREASURY
The agreed framework for co-operation in the field of financial stability in the financial markets is detailed in the Memorandum of Understanding published jointly by HM Treasury, the FCA and the Bank of England (now including the PRA) (together, the “Tripartite Authorities”). The Bank of England has specific responsibilities in relation to financial stability, including: (i) ensuring the stability of the monetary system; (ii) oversight of the financial system infrastructure, in particular payments systems in the UK and abroad; and (iii) maintaining a broad overview of the financial system through its monetary stability role.
UK FINANCIAL OMBUDSMAN SERVICE (“FOS”)
The FOS provides consumers with a free and independent service designed to resolve disputes where the customer is not satisfied with the response received from the regulated firm. The FOS resolves disputes for eligible persons that cover most financial products and services provided in (or from) the UK. The jurisdiction of the FOS extends to include firms conducting activities under the Consumer Credit Act 1974. Although the FOS takes account of relevant regulation and legislation, its guiding principle is to resolve cases individually on merit on the basis of what is fair and reasonable; in this regard, the FOS is not bound by law or even its own precedent. The final decisions made by the FOS are legally binding on regulated firms who also have a requirement under the FCA rules to ensure that lessons learned as a result of determinations by the FOS are effectively applied in future complaint handling.
THE FINANCIAL SERVICES COMPENSATION SCHEME (“FSCS”)
The FSCS was established under the FSMA and is the UK’s statutory fund of last resort for customers of authorised financial services firms. Companies within Lloyds Bank Group are responsible for contributing to compensation schemes in respect of banks and other authorised financial services firms that are unable to meet their obligations to customers. The FSCS can pay compensation to customers if a firm is unable, or likely to be unable, to pay claims against it. The FSCS is funded by levies on firms authorised by the PRA and the FCA, including companies within Lloyds Bank Group.
LENDING STANDARDS BOARD
The Lending Standards Board is responsible for overseeing the Standards of Lending Practice (for both personal and business customers). The Standards of Lending Practice for personal customers cover six main areas: Financial promotions and communications; product sales; account maintenance and servicing; money management; financial difficulty; and customer vulnerability across key lending (current account overdrafts, credit cards, loans and chargecards) to consumers and charities with an income of less than £1 million. The Standards of Lending Practice for business customers apply to business customers, which at the point of lending have an annual turnover of up to £25 million. The standards cover nine main areas: product information; product sale; declined applications; product execution; credit monitoring; treatment of customers in financial difficulty; business support units; portfolio management; and customers in vulnerable circumstances for products including loans, overdrafts, commercial mortgages, credit cards, and chargecards.
UK COMPETITION AND MARKETS AUTHORITY (“CMA”)
The objective of the CMA is to promote competition to ensure that markets work well for consumers, businesses and the economy. Since 1 April 2014 the CMA has, with the FCA, exercised the competition functions previously exercised by the Office of Fair Trading and the Competition Commission. Through its five strategic goals (delivering effective enforcement; extending competition frontiers; refocusing competition protection; achieving professional excellence; and, developing integrated performance) the CMA impacts the banking sector in a number of ways, including powers to investigate and prosecute a number of criminal offences under competition law. In addition, the CMA is now the lead enforcer under the Unfair Terms in Consumer Contracts Regulations 1999.
UK INFORMATION COMMISSIONER’S OFFICE ("ICO")
The UK Information Commissioner’s Office is the UK's independent authority set up to uphold information rights in the public interest, promoting openness by public bodies and data privacy for individuals. The ICO is responsible for overseeing implementation of the Data Protection Act 2018 which enshrines the General Data Protection Regulation. This Act regulates, among other things, the lawful use of data relating to individual customers. The Freedom of Information Act 2000 (the “FOIA”) sets out a scheme under which any person can obtain information held by, or on behalf of, a “public authority” without needing to justify the request. A public authority will not be required to disclose information if certain exemptions set out in the FOIA apply.
THE PAYMENTS SYSTEM REGULATOR (“PSR”)
The PSR is an independent economic regulator for the payment systems industry, which was launched in April 2015. Payment systems form a vital part of the UK’s financial system – they underpin the services that enable funds to be transferred between people and institutions. The purpose of PSR is to make payment systems work well for those that use them. The PSR is a subsidiary of the FCA, but has its own statutory objectives, Managing Director and Board. In summary its objectives are: (i) to ensure that payment systems are operated and developed in a way that considers and promotes the interests of all the businesses and consumers that use them; (ii) to promote effective competition in the markets for payment systems and services between operators, payment services providers and infrastructure providers; and (iii) to promote the development of and innovation in payment systems, in particular the infrastructure used to operate those systems.
REGULATORY HORIZON SCANNING
The Financial Services Regulatory Initiatives Forum launched in 2020 with the aim of improving coordination among UK regulatory authorities and assisting firms that are subject to financial services regulation to keep track of forthcoming initiatives. The Forum is comprised of the Bank of England, Prudential Regulation Authority, Financial Conduct Authority, Payment Systems Regulator and Competition and Markets Authority, with HM Treasury as an observer. On 7 May 2020, the Forum launched the Regulatory Initiatives Grid, which lists regulatory initiatives whose implementation is expected to have a significant operational impact on regulated firms. The Grid is published at least twice a year and includes information such as key milestones and an indicative impact score in relation to each initiative.
COMPETITION REGULATION
The FCA obtained concurrent competition powers with the CMA on 1 April 2015 in relation to the provision of financial services in the UK, in addition to supplementing its existing competition objective. The FCA has been undertaking a programme of work to assess markets across financial services to ascertain whether or not competition is working effectively in the best interests of consumers. In addition, the PRA also has a secondary objective under the Financial Services (Banking Reform) Act to, so far as reasonably possible, act in a way which facilitates effective competition. In July 2019, the CMA signed memoranda of understanding with the FCA and the PSR, which sets out the arrangements for allocating cases, sharing information, dealing with confidentiality constraints, and pooling resources in relation to their concurrent objectives to promote competition. On 22nd December, the CMA signed memoranda of understanding with the FCA and the PSR, which sets out the arrangements for allocating cases, sharing information, dealing with confidentiality constraints and pooling resources in relation to their concurrent objectives to promote competition.
The FCA announced on 3 November 2016 that it will take action to improve competition in the current account market, following the CMA’s recommendations in the publication of its competition investigation into personal current account (PCA) and SME Banking (9 August 2016). The FCA has published its final report into the ‘Strategic Review of Retail Banking Business Models’ (18 December 2018) recognising that PCAs are an important source of competitive advantage for major banks. The focus on high cost credit continues with the FCA publishing rules in June 2019 to simplify the pricing of all overdrafts and end higher prices for unarranged overdrafts and enable consumers to compare pricing by including annual percentage rates in advertising. The FCA implemented reforms in the overdraft markets, which came into force in December 2019 and April 2020, which amongst other things required simplified overdraft pricing via an annual interest rate, prices advertised using APRs banning of fixed charges, firms can not charge more for unarranged overdraft compared with an arranged.
In February 2020 the CMA published a state of competition report to raise the collective understanding of the level of, and the trends in, competition across the UK economy. The main aim of this work is to better measure and understand the state of the UK competition now and in the future. Thus, Competition can directly benefit individual consumers and the economy as a whole through offering services and encouraging innovation and promoting efficiency, all of which can contribute to economic growth and productivity. This is particularly important given the need to support recovery in the economy following the COVID 19 pandemic.
The HM Treasury has launched the first phase ( a call for evidence on regulatory coordination) in its future Regulatory Framework Review (" the Review"). The Review as a whole has been triggered primarily by the UK's withdrawal from the EU which will require a recalibration of the regulatory framework.
The FCA continues to act as an observer on the "Open Banking" Steering Group and be involved in developing and testing "prompts" to encourage customers to consider their banking arrangements. The UK Government has a continuing interest in competition.
The current regulatory regime may lead to greater UK Government and regulatory scrutiny or intervention in the future, ranging from enforced product and service developments and payment system changes to significant structural changes. This could have a significant effect on Lloyds Bank Group’s operations, financial condition or the business of Lloyds Bank Group.
EU REGULATION
Following the UK’s withdrawal from the EU, financial institutions operating in the UK are no longer directly subject to EU legislation. However, much of the EU derived legislation that previously applied to UK financial institutions has been incorporated into UK law through a process known as on shoring. It is possible that over time the UK will depart from EU derived financial regulatory standards. The Group will continue to monitor changes to legislation, providing specialist input on their drafting and assess the likely impact on its business.
U.S. REGULATION
The existence of a branch of LBCM in the U.S. subjects LBCM, the Company and its subsidiaries doing business or conducting activities in the U.S. to oversight by the Federal Reserve Board. Each of the Lloyds Banking Group plc, the Bank, HBOS and Bank of Scotland plc as well as the Bank's sister company and LBCM are treated as a financial holding company under the Bank Holding Company Act. Financial holding companies may engage in a broader range of financial and related activities than are permitted to bank holding companies that do not maintain financial holding company status, including underwriting and dealing in all types of securities. A financial holding company and its depository institution subsidiaries must meet certain capital ratios and be deemed to be “well managed” for purposes of the Federal Reserve Board’s regulations. A financial holding company’s direct and indirect activities and investments in the United States are limited to those that are “financial in nature” or “incidental” or “complementary” to a financial activity, as determined by the Federal Reserve Board.
Financial holding companies may engage in a broader range of financial and related activities than are permitted to bank holding companies that do not maintain financial holding company status, including underwriting and dealing in all types of securities. A financial holding company and its depository institution subsidiaries must meet certain capital ratios and be deemed to be “well managed” for purposes of the Federal Reserve Board’s regulations. A financial holding company’s direct and indirect activities and investments in the United States are limited to those that are “financial in nature” or “incidental” or “complementary” to a financial activity, as determined by the Federal Reserve Board.
Financial holding companies are also subject to approval requirements in connection with certain acquisitions or investments. For example, Lloyds Banking Group plc is required to obtain the prior approval of the Federal Reserve Board before acquiring, directly or indirectly, the ownership or control of more than 5 per cent of any class of the voting shares of any U.S. bank or bank holding company.
A major focus of U.S. governmental policy relating to financial institutions in recent years has been combating money laundering and terrorist financing and enforcing compliance with U.S. economic sanctions, with serious legal and reputational consequences for any failures arising in these areas. Lloyds Bank Group engages, or has engaged, in a limited amount of business with counterparties in certain countries which the U.S. State Department designated during the reporting period as state sponsors of terrorism, including Iran, Syria, Sudan and North Korea. Lloyds Bank Group intends to engage in new business in such jurisdictions only in very limited circumstances where the Group is satisfied concerning legal, compliance and reputational issues. At 31 December 2020, Lloyds Bank Group did not believe that its business activities relating to countries designated as state sponsors of terrorism in 2020 were material to its overall business.
Lloyds Bank Group estimates that the value of its business in respect of such states represented less than 0.01 per cent of its total assets and, for the year ended December 2020, Lloyds Bank Group believes that its revenues from all activities relating to such states were less than 0.001 per cent of its total income. This information has been compiled from various sources within Lloyds Bank Group, including information manually collected from relevant business units, and this has necessarily involved some degree of estimate and judgement.
The Dodd-Frank Wall Street Reform and Consumer Protection Act of 2010 (the “Dodd-Frank Act”), established a regulatory framework for swap dealers and major swap participants including the requirement for entities that are swap dealers and major swap participants to register with the U.S. Commodity Futures Trading Commission (“CFTC”). The Bank was registered as a swap dealer and as such, was subject to regulation and supervision by the CFTC and the National Futures Association with respect to certain of its swap activities, including risk management practices, trade documentation and reporting, business conduct and recordkeeping, among others. On 8th January 2020, the Bank filed an NFA Form 7-W with the NFA to deregister as a swap dealer with the CFTC, effective 7 February 2020. The NFA has confirmed to us that Lloyds Bank plc status is "in transition", and confirmation of deregistration is anticipated imminently.
DISCLOSURE PURSUANT TO SECTION 219 OF THE IRAN THREAT REDUCTION AND SYRIA HUMAN RIGHTS ACT (ITRA)
Since the introduction of an enhanced financial sanctions policy, the Lloyds Bank Group has been proactive in reducing its dealings with Iran and individuals and entities associated with Iran. There remain a small number of historic Iran-related business activities which the Lloyds Bank Group has not yet been able to terminate for legal or contractual reasons.
Pursuant to ITRA Section 219, the Lloyds Bank Group notes that during 2020, its non-US affiliates, Lloyds Bank plc and Bank of Scotland plc, received or made payments involving entities owned or controlled by the Government of Iran as defined under section 560.304 of title 31, Code of Federal Regulations, and/or designated under Executive Order 13382 or 13224. In all cases, the payment was permitted under UK and EU sanctions legislation, specific authority was sought from and granted by HM Treasury, the UK’s Competent Authority to provide such authorisations or the payment(s) were credited to a blocked account, held in the name of the entity, in accordance with UK and EC sanctions legislation.
Gross revenues from these activities were approximately £4,000. Net profits from these activities were approximately £4,000.
The Lloyds Bank Group’s businesses, being reported below, are conducted in compliance with applicable laws in respect of Iran and Syria sanctions and, except as noted below, the Lloyds Bank Group intends to continue these historic activities until it is able to legally terminate the contractual relationships or to maintain/ manage them in accordance with prevailing sanctions obligations. The nature of these activities is as follows:
1.Limited and infrequent payments made to and received from entities directly or indirectly linked to the Government of Iran. Such payments are only made if they comply with UK regulation and legislation and/or licence from the U.S. Treasury Department’s Office of Foreign Assets Control.
2.Payments made to a blocked account in the name of Commercial Bank of Syria related to historic guarantees, entered into by the Lloyds Bank Group between 1997 and 2008, the majority of which relate to Bail Bonds for vessels. The Commercial Bank of Syria is designated under Executive Order 13382.
3.Lloyds Bank Group continues to provide payment clearing services to a UK based and UK authorised bank, one of whose account holders is an entity designated under Executive Order 13224 (although not by the UK or EU authorities). Lloyds Bank Group concludes from the nature of such payment clearing services that revenue and profit (if any) arising from indirectly providing such services to the designated entity is negligible and not material to the Lloyds Bank Group’s activities and in any event does not flow directly from the designated entity. To the extent that the activities of the designated entity and its UK authorised bank continue to comply with UK regulation and legislation, Lloyds Bank Group intends to continue its activities and keep them under review.
TRADING MARKETS
The ordinary shares of Lloyds Bank plc are not listed or traded on any stock exchange.
DIVIDENDS
Lloyds Bank plc’s ability to pay dividends is restricted under UK company law. Dividends may only be paid if distributable profits are available for that purpose. In the case of a public limited company, a dividend may only be paid if the amount of net assets is not less than the aggregate of the called-up share capital and undistributable reserves and if the payment of the dividend will not reduce the amount of the net assets to less than that aggregate. In addition, as a regulated entity, the Bank cannot pay a dividend if the payment of such dividend would result in regulatory capital requirements not being met. Similar restrictions exist over the ability of the Bank’s subsidiary companies to pay dividends to their immediate parent companies. Furthermore, in the case of Lloyds Bank plc, dividends may only be paid if sufficient distributable profits are available for distributions due in the financial year on certain preferred securities. The board has the discretion to decide whether to pay a dividend and the amount of any dividend.
The table below sets out the interim and final dividends paid by the Bank for fiscal years 2016 through 2020.
The directors have proposed an interim dividend of £1,000 million to be paid in May 2021.
| | | | | | | | | | | |
| Final dividends
for previous
year paid during
current year
£ million | Interim
dividends
£ million | Total
dividends
£ million |
| 2016 | — | | 3,040 | | 3,040 | |
| 2017 | — | | 2,650 | | 2,650 | |
| 2018 | — | | 11,022 | | 11,022 | |
| 2019 | — | | 4,100 | | 4,100 | |
| 2020 | — | | — | | — | |
ARTICLES OF ASSOCIATION OF LLOYDS BANK PLC
For information regarding the Articles of Association, please refer to the discussion under the corresponding section of the Annual Report on Form 20-F for the year ended 31 December 2019, filed with the SEC on 23 March 2020, which discussion is hereby incorporated by reference into this document.
https://www.lloydsbankinggroup.com/assets/pdfs/investors/financial-performance/lloyds-bank-plc/2019/2019-lb-form-20f.pdf
EXCHANGE CONTROLS
There are no UK laws, decrees or regulations that restrict Lloyds Bank plc’s import or export of capital, including the availability of cash and cash equivalents for use by the Lloyds Bank Group; or that affect the remittance of dividends, interest or other payments to non-UK holders of its securities.
TAXATION
Lloyds Bank plc does not have any listed shares or American Depositary Shares (ADSs). The Bank’s holding company, Lloyds Banking Group plc, has listed shares and ADSs, and includes in its Form 20-F a discussion intended as a general guide to current UK and US federal income tax considerations relevant to US holders of Lloyds Banking Group plc ordinary shares or ADSs.
WHERE YOU CAN FIND MORE INFORMATION
The SEC maintains a website at www.sec.gov which contains, in electronic form, each of the reports and other information that the Group has filed electronically with the SEC.
References herein to Lloyds Banking Group and Lloyds Bank Group websites are textual references only and information on or accessible through such websites does not form part of and is not incorporated into this Form 20-F.
ENFORCEABILITY OF CIVIL LIABILITIES
Lloyds Bank plc is a public limited company incorporated under the laws of England. Most of Lloyds Bank plc’s directors and executive officers and certain of the experts named herein are residents of the UK. A substantial portion of the assets of Lloyds Bank plc, its subsidiaries and such persons, are located outside the United States. As a result, it may not be possible for investors to effect service of process within the United States upon all such persons or to enforce against them in US courts judgments obtained in such courts, including those predicated upon the civil liability provisions of the federal securities laws of the United States. Furthermore, Lloyds Bank plc has been advised by its solicitors that there is doubt as to the enforceability in the UK, in original actions or in actions for enforcement of judgments of US courts, of certain civil liabilities, including those predicated solely upon the federal securities laws of the United States.
Set out below is a summary of certain risk factors which could affect Lloyds Bank Group’s future results and may cause them to differ from expected results materially. The factors discussed below should not be regarded as a complete and comprehensive statement of all potential risks and uncertainties that Lloyds Bank Group’s businesses face. This section should be read in conjunction with the more detailed information contained in this document, including as set forth in sections entitled “Business”, “Regulation” and “Operating and financial review and prospects”. For information on Lloyds Bank Group’s risk management policies and procedures (including the elevation of climate risk to a principal risk during 2020), see “Lloyds Bank Group — Operating and financial review and prospects — Risk Management”.
ECONOMIC AND FINANCIAL RISKS
1.Lloyds Bank Group’s businesses are subject to inherent and indirect risks arising from general macroeconomic conditions in the UK in particular, but also in the Eurozone, the U.S., Asia and globally
Lloyds Bank Group’s businesses are subject to inherent and indirect risks arising from general and sector-specific economic conditions in the markets in which it operates, particularly the UK, where Lloyds Bank Group’s earnings are predominantly generated, and its operations are increasingly concentrated following the strategic reduction of its international presence. Whilst Lloyds Bank Group’s revenues are predominantly generated in the UK, Lloyds Bank Group does have some credit exposure in countries outside the UK even if it does not have a presence in such countries. Any further significant macroeconomic deterioration in the UK and/or other economies as a result of the COVID-19 pandemic, or otherwise could lead to increased unemployment, reduced corporate profitability, reduced personal income levels, inflationary pressures, including those arising from sterling’s depreciation, reduced UK Government and/or consumer expenditure, increased corporate, SME or personal insolvency rates, increased tax rates, borrowers’ reduced ability to repay loans, increased tenant defaults, fluctuations in commodity prices and changes in foreign exchange rates, which could have a material adverse effect on the results of operations, financial condition or prospects of Lloyds Bank Group.
The effects on the UK, European and global economies following the UK’s exit from the EU and the impact of the EU-UK Trade and Cooperation Agreement signed on 30 December 2020 (the “EU-UK TCA”) remain difficult to predict but may include economic and financial instability in the UK, Europe and the global economy, constitutional instability in the UK and the other types of risks described in “Regulatory and Legal Risks — Legal and regulatory risk arising from the UK’s exit from the EU could adversely impact Lloyds Bank Group’s business, results of operations, financial condition and prospects”. In the event of any further substantial weakening in the UK’s economic growth, the possibility of decreases in interest rates by the Bank of England or sustained low or negative interest rates would put further pressure on Lloyds Bank Group’s interest margins and potentially adversely affect its profitability and prospects. Furthermore, such market conditions may also result in an increase in Lloyds Bank Group’s pension deficit.
In the Eurozone, the economic outlook is also uncertain. High levels of private and public debt, continued weakness in the financial sector and reform fatigue remain a concern. Conversely, further monetary policy stimulus from the European Central Bank could undermine financial stability by encouraging a further build-up of unsustainable debt. In addition, political uncertainty in the Eurozone and fragmentation risk in the EU, could create financial instability and have a negative impact on the Eurozone and global economies. Any default on the sovereign debt of a Eurozone country and the resulting impact on other Eurozone countries, including the potential that some countries could leave the Eurozone, could materially affect the capital and the funding position of participants in the banking industry, including Lloyds Bank Group.
Moreover, the effects on the UK, European and global economies of the exit of one or more EU member states from the Economic and Monetary Union, or the redenomination of financial instruments from the Euro to a different currency, are extremely uncertain and very difficult to predict and protect fully against in view of: (i) the potential for economic and financial instability in the Eurozone and possibly in the UK; (ii) the lasting impact on governments’ financial positions of the global financial crisis and the COVID-19 pandemic; (iii) the uncertain legal position; and (iv) the fact that many of the risks related to the business are totally, or in part, outside the control of Lloyds Bank Group. If any such events were to occur, they may result in: (a) significant market dislocation; (b) heightened counterparty risk; (c) an adverse effect on the management of market risk and, in particular, asset and liability management due, in part, to redenomination of financial assets and liabilities; (d) an indirect risk of counterparty failure; or (e) further political uncertainty in the UK or other countries, any of which could have a material adverse effect on the results of operations, financial condition or prospects of Lloyds Bank Group.
U.S. economic policies may have an adverse effect on both U.S. and global growth as well as global trade prospects. In addition, concerns remain around the impact of increased tariffs on trade between the U.S. and other nations including China, Canada and the EU. The potential for escalation of trade disputes and any retaliatory actions taken may adversely impact the global economic outlook.
Macroeconomic uncertainty in emerging markets in the wake of the COVID-19 pandemic, in particular the slowdown of international trade and industrial production, as well as the high and growing level of debt in China may be exacerbated by attempts to de-risk its highly leveraged economy, or a devaluation of the Renminbi. External debt levels are higher now in emerging markets than before the global financial crisis, which could lead to higher levels of defaults and non-performing loans.
Any adverse changes affecting the economies of the countries in which the Lloyds Bank Group has significant direct and indirect credit exposures and any further deterioration in global macroeconomic conditions, including as a result of geopolitical events, global health issues, including the COVID-19 pandemic (see "Economic and Financial Risks - Risks relating to the impact of COVID-19") or acts of war or terrorism, could have a material adverse effect on the Lloyds Bank Group’s results of operations, financial condition or prospects.
2.The Group's business is subject to risks relating to the COVID-19 pandemic
The global pandemic from the outbreak of COVID-19 continues to cause widespread disruption to normal patterns of business activity across the world, including in the UK, and volatility in financial markets. Measures taken to contain the health impact of the COVID-19 pandemic have resulted in an adverse impact on economic activity across the world and the duration of these measures remains uncertain. Monetary policy loosening has supported asset valuations across many financial markets, but longer-term impacts on inflation, interest rates, credit spreads, foreign exchange rates and commodity, equity and bond prices remain unclear.
Synchronisation of emergency measures to slow the spread of COVID-19 across the world has brought about rapid deterioration in economic growth across all countries and regions, directly adversely impacting the UK through many channels, including trade and capital flows. The recession will likely have a lasting negative impact on future path of global GDP, through its impact on human and physical capital accumulation, and supply chain disruption. The UK experienced a deep contraction in economic activity during 2020 as a result of the COVID-19 pandemic, and both private and public sector debt have risen significantly. If the economic downturn damage were to be prolonged significantly by inability to control COVID-19 spread with vaccines, public finances would likely continue to deteriorate and could result in a sovereign downgrade that could also impact the credit ratings of Lloyds Bank Group. Rating downgrades could have a material adverse impact on Lloyds Bank Group’s ability to raise funding in the wholesale markets (see “Economic and Financial Risks - A reduction in the Bank and its rated
subsidiaries' longer-term credit rating could materially adversely affect Lloyds Bank Group’s results of operations, financial condition or prospects").
Further, the economic impact of the COVID-19 pandemic, including increased levels of unemployment, corporate insolvencies and business failures could adversely impact Lloyds Bank Group’s retail or corporate customers and their ability to service their contractual obligations, including to the Lloyds Bank Group. Adverse changes in the credit quality of Lloyds Bank Group’s borrowers and counterparties or collateral held in support of exposures, or in their behaviour, may reduce the value of Lloyds Bank Group’s assets and materially increase its write-downs and allowances for impairment losses. This could have a material adverse effect on Lloyds Bank Group’s results of operations, financial condition or prospects.
As a result of recent monetary policy actions, interest rates have declined substantially and financial markets are applying an increased probability to a wider use of unconventional policy tools such as negative interest rates. In many countries, interest rates have already turned negative or are very close to zero and governments, including the UK, are borrowing at negative yields. If negative interest rates were to be applied in the UK and U.S., they could have an adverse impact on Lloyds Bank Group’s net income and profitability.
The effect of the COVID-19 virus on emerging markets increases the risks already identified from the slowdown of growth and trade, with limited capacity to respond effectively to the crisis impacting growth and potentially increasing the risk of default on debt.
Governments, central banks and regulators across the world are taking significant action to address this economic impact, which has led to deep recession in the UK and globally. Governments are likely to be judged for their policy responses and success in vaccine rollouts, which could result in political upheaval and destabilise governments and political movements even after the pandemic has passed. There is also the possibility that vaccines are not as effective as expected against current or future strains of coronavirus, which could result in significantly extended lockdowns or restrictions.
In addition to providing support under government support schemes, the Group has taken specific measures to alleviate the impact on Lloyds Bank Group's customers or borrowers, including payment holidays which, taken together with lower interest rates and restrictions on fees associated with certain products, may have an adverse impact on Lloyds Bank Group’s results of operations, financial conditions or prospects. Additionally, although the UK Government and the Bank of England have provided certain guarantees to banks relating to lending schemes that have been initiated to support businesses through the current COVID-19 pandemic, there is a risk that in some circumstances, Lloyds Bank Group may not be able to claim under the guarantees, or the claim may be rejected, if, for example, it later transpires that all terms and conditions under the relevant guarantee scheme were not met when the lending was originated.
As a result of the COVID-19 pandemic, the potential for conduct and compliance risks (see “Business and Operational Risks – Lloyds Bank Group is exposed to conduct risk”) as well as operational risks materialising has increased, notably in the areas of cyber, fraud, people, technology, operational resilience and where there is reliance on third-party suppliers. In addition to the key operational risks, new risks are likely to arise as Lloyds Bank Group may need to change its ways of working whilst managing any instances of COVID-19 among its employees and locations to ensure continuity and support to colleagues and customers.
Any and all such events described above could have a material adverse effect on Lloyds Bank Group’s business, financial condition, results of operations, prospects, liquidity, capital position and credit ratings (including potential changes of outlooks or ratings), as well as on its customers, borrowers, counterparties, employees and suppliers.
3.Lloyds Bank Group’s businesses are subject to inherent risks concerning borrower and counterparty credit quality which have affected and may adversely impact the recoverability and value of assets on Lloyds Bank Group’s balance sheet
Lloyds Bank Group has exposures to many different products, counterparties, obligors and other contractual relationships and the credit quality of its exposures can have a significant impact on its earnings. Credit risk exposures are categorised as either “retail” or “corporate” and reflect the risks inherent in Lloyds Bank Group’s lending and lending-related activities.
Adverse changes in the credit quality of Lloyds Bank Group’s UK and/or international borrowers and counterparties or collateral held in support of exposures, or in their behaviour or businesses, may reduce the value of Lloyds Bank Group’s assets and materially increase its write-downs and allowances for impairment losses. Credit risk can be affected by a range of factors outside Lloyds Bank Group’s control, which include but are not limited to an adverse economic environment, the effect of the UK’s withdrawal from the EU and the operation of the EU-UK TCA, reduced UK and global consumer and/or government spending and benefits, inflation, changes in the credit rating of individual counterparties, the debt levels of individual contractual counterparties, increased unemployment or reduced income, reduced asset values, increased personal or corporate insolvency levels, falling stock and bond/other financial markets, reduced corporate profits, over-indebtedness, changes in interest rates or foreign exchange rates, counterparty challenges to the interpretation or validity of contractual arrangements, an increase in credit spreads, changes to insolvency regimes which make it harder to enforce against counterparties, changes in consumer and customer demands and requirements, negative reputational impact or direct campaigns which adversely impact customers, industries or sectors and any external factors of a political, legislative, environmental or regulatory nature, including changes in accounting rules and changes to tax legislation and rates, some of which are materially heightened by the current COVID-19 pandemic.
In particular, Lloyds Bank Group has exposure to concentration risk where its business activities focus particularly on a single obligor, related/connected group of obligors or a similar type of customer (borrower, sovereign, financial institution or central counterparty), product, industrial sector or geographic location, including the UK.
Lloyds Bank Group’s credit exposure includes residential mortgage lending (in the UK and, to a lesser extent, the Netherlands) and commercial real estate lending, including lending secured against secondary and tertiary commercial property assets in the UK. As a result, decreases in residential or commercial property values and/or increases in tenant defaults are likely to lead to higher impairment charges, which could materially affect Lloyds Bank Group’s results of operations, financial condition or prospects. The COVID-19 pandemic led to an initial reduction in property transactions and hence, some uncertainty in property valuations, as well as increasing the risk of loss or reduced rental payments. Additionally, COVID-19 has led to and may lead to as yet unknown changes in the risk profile of a number of sectors and/or counterparties. Lloyds Bank Group also has significant credit exposure to certain individual counterparties in higher risk and cyclical asset classes and sectors (such as commercial real estate, financial intermediation, manufacturing, leveraged lending, oil and gas and related sectors, hotels, commodities trading, automotive and related sectors, construction, agriculture, consumer-related sectors (such as retail, passenger transport and leisure), house builders and outsourcing services). The Group’s retail customer portfolios will remain strongly linked to the UK economic environment, with house price deterioration, unemployment increases, inflationary pressures, consumer over-indebtedness and prolonged low or rising interest rates among the factors that may impact secured and unsecured retail credit exposures. Deterioration in used vehicle prices, including as a result of changing consumer demand, could result in increased provisions and/or losses and/or accelerated depreciation charges.
Lloyds Bank Group’s corporate lending portfolio also contains substantial exposure to large and mid-sized, public and private companies. In addition to exposures to sectors that have experienced cyclical weakness in recent years, the portfolio also contains exposures in key coronavirus impacted sectors, most notably consumer facing sectors such as travel, transportation, non-essential retail and hospitality. These exposures, along with a historic strategy of taking large single name concentrations to non-listed companies and entrepreneurs, and taking exposure at various levels of the capital structure, may give rise to single name concentration and risk capital exposure. The Group's corporate portfolios are also susceptible to "fallen angel" risk, that is, the probability of significant default increases following material unexpected events, and to risks related to the impact of the COVID-19 pandemic, resulting in the potential for large losses. As in the UK, Lloyds Bank Group’s lending business overseas is also exposed to a small number of long-term customer relationships and these single name concentrations place Lloyds Bank Group at risk of loss should default occur.
Any disruption to the liquidity or transparency of the financial markets may result in Lloyds Bank Group’s inability to sell or syndicate securities, loans or other instruments or positions held (including through underwriting), thereby leading to concentrations in these positions. These concentrations could expose Lloyds Bank Group to losses if the mark-to-market value of the securities, loans or other instruments or positions declines causing Lloyds Bank Group to take write-downs. Moreover, the inability to reduce Lloyds Bank Group’s positions not only increases the market and credit risks associated with such positions, but also increases the level of risk-weighted assets on Lloyds Bank Group’s balance sheet, thereby increasing its capital requirements and funding costs, all of which could materially adversely affect Lloyds Bank Group’s results of operations, financial condition or prospects.
Providing support to customers under the COVID-19 government schemes means Lloyds Bank Group has extended its lending risk appetite in line with the various scheme guidelines during the crisis and, despite the protection offered by the UK Government’s or by the Bank of England’s guarantees, as applicable, in respect of the schemes, this may lead to additional losses.
With the exception of COVID-19 related payment holidays to retail customers and lending provided through certain government support schemes, including the Bounce Back Loan Scheme (which provide support of up to £50,000 for smaller businesses), in respect of which no credit assessment is undertaken, all lending decisions, and decisions related to other exposures (including, but not limited to, undrawn commitments, derivative, equity, contingent and/or settlement risks), are dependent on Lloyds Bank Group’s assessment of each customer’s ability to repay and the value of any underlying security. Such assessments may also take into account future forecasts, which may be less reliable due to the uncertainty of their likely accuracy and probability as a result of the impact of the COVID-19 pandemic. There is an inherent risk that Lloyds Bank Group has incorrectly assessed the credit quality and/or the ability or willingness of borrowers to repay, possibly as a result of incomplete or inaccurate disclosure by those borrowers or as a result of the inherent uncertainty that is involved in the exercise of constructing and using models to estimate the risk of lending to counterparties.
In addition, observed credit quality of the portfolios is likely to be influenced by the significant temporary support provided in light of the COVID-19 pandemic, including government lending schemes, payment holidays and furlough arrangements, which have the potential to distort underlying credit risks in the portfolio and may lead to increases in arrears and/or defaults which remain unidentified. This may result in additional impairment charges if the forward looking economic scenarios used to raise expected credit loss allowances have not adequately captured the impact of the withdrawal of the temporary support measures.
4.Lloyds Bank Group’s businesses are subject to inherent risks concerning liquidity and funding, particularly if the availability of traditional sources of funding such as retail deposits or the access to wholesale funding markets becomes more limited
Liquidity and funding continues to remain a key area of focus for Lloyds Bank Group and the industry as a whole. Like all major banks, Lloyds Bank Group is dependent on confidence in the short and long-term wholesale funding markets. Lloyds Bank Group relies on customer savings and transmission balances, as well as ongoing access to the global wholesale funding markets to meet its funding needs. The ability of Lloyds Bank Group to gain access to wholesale and retail funding sources on satisfactory economic terms is subject to a number of factors outside its control, such as liquidity constraints, general market conditions, regulatory requirements, the encouraged or mandated repatriation of deposits by foreign wholesale or central bank depositors and the level of confidence in the UK banking system.
Lloyds Bank Group’s profitability or solvency could be adversely affected if access to liquidity and funding is constrained, made more expensive for a prolonged period of time or if Lloyds Bank Group experiences an unusually high and unforeseen level of withdrawals. In such circumstances, Lloyds Bank Group may not be in a position to continue to operate or meet its regulatory minimum liquidity requirements without additional funding support, which it may be unable to access (including government and central bank facilities).
Lloyds Bank Group is also subject to the risk of deterioration of the commercial soundness and/or perceived soundness of other financial services institutions within and outside the UK. Financial services institutions that deal with each other are interrelated as a result of trading, investment, clearing, counterparty and other relationships. This presents systemic risk and may adversely affect financial intermediaries, such as clearing agencies, clearing houses, banks, securities firms and exchanges with which Lloyds Bank Group interacts on a daily basis, any of which could have a material adverse effect on Lloyds Bank Group’s ability to raise new funding. A default by, or even concerns about the financial resilience of, one or more financial services institutions could lead to further significant systemic liquidity problems, or losses or defaults by other financial institutions, which could have a material adverse effect on Lloyds Bank Group’s results of operations, financial condition or prospects.
Corporate and institutional counterparties may also seek to reduce aggregate credit exposures to Lloyds Bank Group (or to all banks) which could increase Lloyds Bank Group’s cost of funding and limit its access to liquidity. The funding structure employed by Lloyds Bank Group may also prove to be inefficient, thus giving rise to a level of funding cost where the cumulative costs are not sustainable over the longer term.
In addition, medium-term growth in Lloyds Bank Group’s lending activities will rely, in part, on the availability of retail deposit funding on appropriate terms, which is dependent on a variety of factors outside Lloyds Bank Group’s control, such as general macroeconomic conditions and market volatility, the confidence of retail depositors in the economy, the financial services industry and Lloyds Bank Group, as well as the availability and extent of deposit guarantees. Increases in the cost of retail deposit funding will impact on Lloyds Bank Group’s margins and affect profit, and a lack of availability of retail deposit funding could have a material adverse effect on its future growth. Any loss in consumer confidence in Lloyds Bank Group could significantly increase the amount of retail deposit withdrawals in a short period of time. See “Economic and Financial Risks - Lloyds Bank Group’s businesses are subject to inherent and indirect risks arising from general macroeconomic conditions in the UK in particular, but also in the Eurozone, the U.S., Asia and globally."
Lloyds Bank Group makes use of central bank funding schemes such as the Bank of England’s Term Funding Scheme with additional incentives for SMEs (TFSME). Following the closure of this scheme in 2021, Lloyds Bank Group will have to replace matured central bank scheme funding, which could cause an increased dependence on term funding issuances. If the wholesale funding markets were to suffer stress or central bank provision of liquidity to the financial markets is abruptly curtailed, or Lloyds Bank Group’s credit ratings are downgraded, it is likely that wholesale funding will prove more difficult to obtain.
Any of the refinancing or liquidity risks mentioned above, in isolation or in concert, could have a material adverse effect on Lloyds Bank Group’s results or operations and its ability to meet its financial obligations as they fall due.
5.A reduction in the Bank and its rated subsidiaries' longer-term credit rating could materially adversely affect Lloyds Bank Group’s results of operations, financial condition or prospects
Rating agencies regularly evaluate the Bank and its rated subsidiaries, and their ratings of longer-term debt are based on a number of factors which can change over time, including Lloyds Bank Group’s financial strength as well as factors not entirely within its control, including conditions affecting the financial services industry generally, and the legal and regulatory frameworks affecting its legal structure, business activities and the rights of its creditors. In light of the difficulties in the financial services industry and the financial markets, there can be no assurance that or the Bank or its rated subsidiaries will maintain their current ratings. The credit rating agencies may also revise the ratings methodologies applicable to issuers within a particular industry or political or economic region. If credit rating agencies perceive there to be adverse changes in the factors affecting an issuer’s credit rating, including by virtue of change to applicable ratings methodologies, the credit rating agencies may downgrade, suspend or withdraw the ratings assigned to an issuer and/or its securities. Downgrades of the Bank and its rated subsidiaries’ longer-term credit rating could lead to additional collateral posting and cash outflow, significantly increase its borrowing costs, limit its issuance capacity in the capital markets and weaken Lloyds Bank Group’s competitive position in certain markets.
6.Lloyds Bank Group’s businesses are inherently subject to the risk of market fluctuations, which could have a material adverse effect on the results of operations, financial condition or prospects of Lloyds Bank Group
Lloyds Bank Group’s businesses are inherently subject to risks in financial markets including changes in, and increased volatility of, interest rates, inflation rates, credit spreads, foreign exchange rates, commodity, equity, bond and property prices and the risk that its customers act in a manner which is inconsistent with Lloyds Bank Group’s business, pricing and hedging assumptions. Movements in these markets will continue to have a significant impact on Lloyds Bank Group in a number of key areas.
For example, adverse market movements have had, and will likely continue to have, an adverse effect upon the financial condition of the defined benefit pension schemes of Lloyds Bank Group. The schemes’ main exposures are to real rate risk and credit spread risk. These risks arise from two main sources: the “AA” corporate bond liability discount rate and asset holdings.
In addition, Lloyds Bank Group’s banking and trading activities are also subject to market movements. For example, changes in interest rate levels, interbank margins over official rates, yield curves and spreads affect the interest rate margin realised between lending and borrowing costs. The potential for future volatility and margin changes remains. Competitive pressures on fixed rates or product terms in existing loans and deposits may restrict Lloyds Bank Group in its ability to change interest rates applying to customers in response to changes in official and wholesale market rates.
Changes in foreign exchange rates, including with respect to the U.S. dollar and the Euro, may also have a material adverse effect Lloyds Bank Group’s financial position and/or forecasted earnings.
7.Market conditions have resulted, and are expected to result in the future, in material changes to the estimated fair values of financial assets of Lloyds Bank Group, including negative fair value adjustments
Lloyds Bank Group has exposures to securities, derivatives and other investments, including asset-backed securities, structured investments and private equity investments that are recorded by Lloyds Bank Group at fair value, which may be subject to further negative fair value adjustments in view of the volatile global markets and challenging economic environment, including as a result of the COVID-19 pandemic. See (“Risks relating to the impact of COVID-19”).
In volatile markets, hedging and other risk management strategies (including collateralisation and the purchase of credit default swaps) may not be as effective as they are in normal market conditions, due in part to the decreasing credit quality of hedge counterparties, and general illiquidity in the markets within which transactions are executed.
In circumstances where fair values are determined using financial valuation models, Lloyds Bank Group’s valuation methodologies may require it to make assumptions, judgements and estimates in order to establish fair value. These valuation models are complex and the assumptions used are difficult to make and are inherently uncertain. This uncertainty may be amplified during periods of market volatility and illiquidity. Any consequential impairments, write-downs or adjustments could have a material adverse effect on Lloyds Bank Group’s results of operations, capital ratios, financial condition or prospects.
Any of these factors could cause the value ultimately realised by Lloyds Bank Group for its securities and other investments to be lower than their current fair value or require Lloyds Bank Group to record further negative fair value adjustments, which may have a material adverse effect on its results of operations, financial condition or prospects.
8.Any tightening of monetary policy in jurisdictions in which Lloyds Bank Group operates could affect the financial condition of its customers, clients and counterparties, including governments and other financial institutions
Quantitative easing measures implemented by major central banks, adopted alongside record low interest rates to support recovery from the global financial crisis and, more recently, the COVID-19 pandemic, have helped loosen financial conditions and reduced borrowing costs. These measures may have supported liquidity and valuations for asset classes that are vulnerable to rapid price corrections as financial conditions tighten, potentially causing losses to investors and increasing the risk of default on Lloyds Bank Group’s exposure to these sectors.
Monetary policy in the UK and in the markets in which Lloyds Bank Group operates has been highly accommodative in recent years and even more so as a result of the COVID-19 pandemic, however, there remains considerable uncertainty as to the direction of interest rates and the pace of change, as set by the Bank of England and other major central banks. In the UK, monetary policy has further been supported by the Bank of England and HM Treasury “Funding for Lending” scheme (which closed in January 2018), the “Help to Buy” scheme (which closed in November 2019), the “Term Funding Scheme” (which closed in February 2018) and the purchase of corporate bonds in the UK. In response to the COVID-19 pandemic, the UK Government and the Bank of England have adopted a series of financial measures to help offset the economic disruption caused by efforts to contain the spread of the virus. These include a package of government-backed and guaranteed loans to support businesses, announced on 17 March 2020, and which made available an initial £330 billion of guarantees (equivalent to approximately 15 per cent of the UK’s current GDP). These included a joint HM Treasury and Bank of England lending facility, the Covid Corporate Financing Facility (CCFF), designed to support liquidity among larger firms, as well as the Coronavirus Business Interruption Loan Scheme (CBILS) for small and medium-sized enterprises run by the British Business Bank. Further support is being provided through the Coronavirus Large Business Interruption Loan Scheme (CLBILS) and the Bounce Back Loans Scheme (BBLS). Further measures may be introduced depending on the length and severity of the crisis. However, such a long period of stimulus and support has increased uncertainty over the impact of its future reduction, which could lead to a risk of higher borrowing costs in wholesale markets, higher interest rates for retail borrowers, generally weaker than
expected growth, or even contracting GDP, reduced business and consumer confidence, higher levels of unemployment or underemployment, adverse changes to levels of inflation and falling property prices in the markets in which Lloyds Bank Group operates, and consequently to an increase in delinquency rates and default rates among its customers. Similar risks result from the low level of inflation in developed economies which, in Europe particularly, could deteriorate into sustained deflation if policy measures prove ineffective and economic growth weakens. Reduced monetary stimulus and the actions and commercial soundness of other financial institutions have the potential to impact market liquidity. The adverse impact on the credit quality of Lloyds Bank Group’s customers and counterparties, coupled with a decline in collateral values, could lead to a reduction in recoverability and value of Lloyds Bank Group’s assets and higher levels of expected credit loss allowances, which could have an adverse effect on its operations, financial condition or prospects.
9.Lloyds Bank Group’s defined benefit pension schemes are subject to longevity risks
Lloyds Bank Group’s defined benefit pension schemes are exposed to longevity risk. Increases in life expectancy (longevity) beyond current allowances will increase the period over which pension scheme benefits are paid and may adversely affect Lloyds Bank Group’s financial condition and results of operations.
10.Lloyds Bank Group may be required to record credit value adjustments, funding value adjustments and debit value adjustments on its derivative portfolio, which could have a material adverse effect on its results of operations, financial condition or prospects
Lloyds Bank Group continually seeks to limit and manage counterparty credit risk exposure to market counterparties. Credit value adjustment (“CVA”) and funding value adjustment (“FVA”) reserves are held against uncollateralised derivative exposures and a risk management framework is in place to mitigate reserve value changes. CVA is an expected loss calculation that incorporates current market factors including counterparty credit spreads. FVA reserves are held to capitalise the cost of funding uncollateralised derivative exposures. Lloyds Bank Group also calculates a debit value adjustment to reflect own credit spread risk as part of the fair value of derivative liabilities.
Deterioration in the creditworthiness of financial counterparties, or large adverse financial market movements, could impact the size of CVA and FVA reserves and result in a material charge to Lloyds Bank Group’s profit and loss account which could have a material adverse effect on its results of operations, financial condition or prospects.
11.Lloyds Bank Group is exposed to risks related to the uncertainty surrounding the integrity and continued existence of reference rates
Reference rates and indices, including interest rate benchmarks, such as the London Interbank Offered Rate (“LIBOR”) and the Euro Interbank Offered Rate (“EURIBOR”), which are used to determine the amounts payable under financial instruments or the value of such financial instruments (“Benchmarks”), have, in recent years, been the subject of political and regulatory scrutiny as to how they are created and operated. This has resulted in regulatory reform and changes to existing Benchmarks, with further changes anticipated. These reforms and changes may cause a Benchmark to perform differently than it has done in the past or to be discontinued.
At this time, it is not possible to predict the overall effect (including financial impacts) of any such reforms and changes, any establishment of alternative reference rates or any other reforms to these reference rates that may be enacted, including the potential or actual discontinuance of LIBOR publication, any transition away from LIBOR or ongoing reliance on LIBOR for some legacy products.
Uncertainty as to the nature of such potential changes, alternative reference rates (including, without limitation, SONIA, €STER and SOFR or term versions of those rates) or other reforms may adversely affect a broad array of financial products, including any LIBOR-based or EURIBOR-based securities, loans and derivatives that are included in Lloyds Bank Group’s financial assets and liabilities, that use these reference rates and may impact the availability and cost of hedging instruments and borrowings. If any of these reference rates are no longer available, Lloyds Bank Group may incur additional expenses in effecting the transition from such reference rates, and may be subject to disputes, which could have an adverse effect on its results of operations. In addition, it can have important operational impacts through Lloyds Bank Group’s systems and infrastructure as all systems will need to account for the changes in the reference rates. Any of these factors may have a material adverse effect on Lloyds Bank Group’s results of operations, financial condition or prospects.
REGULATORY AND LEGAL RISKS
1.Lloyds Bank Group and its businesses are subject to substantial regulation and oversight. Adverse legal or regulatory developments could have a material adverse effect on Lloyds Bank Group’s business, results of operations, financial condition or prospects
Lloyds Bank Group and its businesses are subject to legislation, regulation, court proceedings, policies and voluntary codes of practice in the UK, the EU and the other markets in which it operates which are impacted by factors beyond its control, including:
(i)general changes in government, central bank or regulatory policy, or changes in regulatory regimes that may influence investor decisions in particular markets in which Lloyds Bank Group operates, and which may change the structure of those markets and the products offered or may increase the costs of doing business in those markets;
(ii)external bodies applying or interpreting standards, laws, regulations or contracts differently to Lloyds Bank Group;
(iii)an uncertain and rapidly evolving prudential regulatory environment;
(iv)changes in competitive and pricing environments, including markets investigations, or one or more of Lloyds Bank Group’s regulators intervening to mandate the pricing of Lloyds Bank Group’s products, as a consumer protection measure;
(v)one or more of Lloyds Bank Group’s regulators intervening to prevent or delay the launch of a product or service, or prohibiting an existing product or service;
(vi)further requirements relating to financial reporting, corporate governance, corporate structure and conduct of business and employee compensation;
(vii)expropriation, nationalisation, confiscation of assets and changes in legislation relating to foreign ownership;
(viii)changes to regulation and legislation relating to economic and trading sanctions, money laundering and terrorist financing;
(ix)developments in the international or national legal environment resulting in regulation, legislation and/or litigation targeting entities such as Lloyds Bank Group for investing in, or lending to, organisations deemed to be responsible for, or contributing to, climate change; and
(x)regulatory changes which influence business strategy, particularly the rate of growth of the business, or which impose conditions on the sales and servicing of products, which have the effect of making such products unprofitable or unattractive to sell.
These laws and regulations include increased regulatory oversight, particularly in respect of conduct issues, data protection, product governance and prudential regulatory developments, including ring-fencing.
Unfavourable developments across any of these areas, both in and outside the UK, as a result of the factors above could materially affect Lloyds Bank Group’s ability to maintain appropriate liquidity, increase its funding costs, constrain the operation of its business and/or have a material adverse effect on its business, results of operations and financial condition.
2.Lloyds Bank Group faces risks associated with its compliance with a wide range of laws and regulations
Lloyds Bank Group is exposed to risk associated with compliance with laws and regulations, including:
(i)certain aspects of Lloyds Bank Group’s activities and business may be determined by the relevant authorities, the Financial Ombudsman Service (the “FOS”), or the courts, to have not been conducted in accordance with applicable laws or regulations, or, in the case of the FOS, with what is fair and reasonable in the Ombudsman’s opinion;
(ii)the possibility of alleged mis-selling of financial products or the mishandling of complaints related to the sale of such products by or attributed to a member of Lloyds Bank Group, resulting in disciplinary action or requirements to amend sales processes, withdraw products, or provide restitution to affected customers, all of which may require additional provisions;
(iii)risks relating to compliance with, or enforcement actions in respect of, existing and/or new regulatory or reporting requirements, including as a result of a change in focus of regulation or a transfer of responsibility for regulating certain aspects of Lloyds Bank Group’s activities and business to other regulatory bodies;
(iv)contractual and other obligations may either not be enforceable as intended or may be enforced against Lloyds Bank Group in an adverse way;
(v)the intellectual property of Lloyds Bank Group (such as trade names) may not be adequately protected;
(vi)Lloyds Bank Group may be liable for damages to third-parties harmed by the conduct of its business; and
(vii)the risk of regulatory proceedings, enforcement actions and/or private litigation, arising out of regulatory investigations or otherwise (brought by individuals or groups of plaintiffs) in the UK and other jurisdictions.
Regulatory and legal actions pose a number of risks to Lloyds Bank Group, including substantial monetary damages or fines, the amounts of which are difficult to predict and may exceed the amount of provisions set aside to cover such risks. See “Regulatory and Legal Risks - The financial impact of legal proceedings and regulatory risks might be material but is difficult to quantify. Amounts eventually paid may materially exceed the amount of provisions set aside to cover such risks, or existing provisions may need to be materially increased in response to changing circumstances, as has been the case in respect of payment protection insurance redress payments”. In addition, Lloyds Bank Group may be subject, including as a result of regulatory actions, to other penalties and injunctive relief, civil or private litigation arising out of a regulatory investigation or otherwise, the potential for criminal prosecution in certain circumstances and regulatory restrictions on Lloyds Bank Group’s business, all of which can have a negative effect on Lloyds Bank Group’s reputation as well as taking a significant amount of management time and resources away from the implementation of its strategy.
Lloyds Bank Group may settle litigation or regulatory proceedings prior to a final judgement or determination of liability to avoid the cost, management efforts or negative business, regulatory or reputational consequences of continuing to contest liability, even when Lloyds Bank Group believes that it has no liability or when the potential consequences of failing to prevail would be disproportionate to the costs of settlement. Furthermore, Lloyds Bank Group may, for similar reasons, reimburse counterparties for their losses even in situations where Lloyds Bank Group does not believe that it is legally compelled to do so. Failure to manage these risks adequately could materially affect Lloyds Bank Group, both financially and reputationally.
3.Legal and regulatory risk arising from the UK’s exit from the EU could adversely impact Lloyds Bank Group’s business, operations, financial condition and prospects
The EU-UK Trade and Cooperation Agreement ("EU-UK TCA") provides a structure for the future EU and UK relationship following the UK's exit from the EU. The EU-UK TCA applies provisionally from 1 January 2021 pending formal ratification by the EU parliament (with the UK having ratified the TCA on 30 December 2020).
The passporting of financial services between the UK and the EU ended on 31 December 2020, with the end of the Brexit transition period. However, the EU-UK TCA leaves open the possibility for future equivalence decisions being made by the UK and/or the EU on a unilateral basis (in addition to certain equivalence decisions already made by the UK and limited temporary equivalence decisions already made by the EU in relation to clearing and central securities depositaries). A short Joint Declaration on financial services, which accompanies the EU-UK TCA, also sets out the intention of the EU and the UK to agree a Memorandum of Understanding by March 2021 on regulatory cooperation on financial services to help preserve financial stability, market integrity, and the protection of investors and consumers. However, at this time, there can be no assurance as to the content of any such Memorandum of Understanding or the making of any further equivalence decisions (including as to the extent, duration and conditionality of any such decisions). The EU-UK TCA does not lay down any binding commitments on financial services and it remains uncertain if the UK and the EU financial regulatory regimes will diverge substantially in the future or not. This uncertainty may be exacerbated by the possible re-emergence of calls for a further Scottish independence referendum and/or the differential arrangements under the EU-UK TCA and the EU withdrawal agreement for Northern Ireland relative to the rest of the UK.
Lloyds Bank Group is subject to substantial EU-derived laws, regulation and oversight, which will be impacted as a result of the UK’s exit from the EU. Lloyds Bank Group and its subsidiaries in the UK will cease to be subject to EU law; but EU law will continue to apply to its EU subsidiaries. Divergence between UK law and EU law will increase the burden of associated compliance costs on Lloyds Bank Group. Moreover, Lloyds Bank Group and its counterparties will no longer be able to rely on the European passporting framework for financial services. The Group continues to service existing products in certain EU jurisdictions, except where its legal and regulatory outreach deemed that this was no longer permitted. A change to any EU jurisdiction's acceptance of continued servicing could potentially result in the loss of customers and/or the requirement for Lloyds Bank Group to apply for authorisation in EU jurisdictions where it is to continue business, with associated costs and operational considerations. Any new or amended legislation and regulation may have a significant impact on Lloyds Bank Group’s operations, profitability and business model.
4.Lloyds Banking Group and its subsidiaries, including Lloyds Bank Group, are subject to resolution planning requirements, which could have an adverse impact on Lloyds Bank Group's business
In July 2019, the Bank of England and the PRA have published final rules for a resolvability assessment framework (the “Resolvability Assessment Framework”), with full implementation of the framework required by 2022. This requires Lloyds Banking Group to carry out a detailed assessment of its preparations for resolution. These rules on the Resolvability Assessment Framework may affect the way in which Lloyds Banking Group manages its business and ultimately impact the profitability of Lloyds Bank Group. Further, the publication of the outcome of such assessment may affect the way Lloyds Bank Group is perceived by the market which, in turn, may affect the secondary market value of Lloyds Bank plc’s securities.
5.Lloyds Banking Group and its subsidiaries, including Lloyds Bank Group, are subject to regulatory actions which may be taken in the event of a bank or parent Group failure
Under the Banking Act 2009, as amended, (the “Banking Act”), substantial powers have been granted to HM Treasury, the Bank of England and the PRA and FCA (together, the “Authorities”) as part of the special resolution regime (the “SRR”). These powers enable the Authorities to deal with and stabilise UK-incorporated institutions with permission to accept deposits (including Lloyds Bank plc and members of its group) if they are failing or are likely to fail to satisfy certain threshold conditions.
The SRR consists of five stabilisation options: (i) transfer of all or part of the business of the relevant entity or the shares of the relevant entity to a private sector purchaser; (ii) transfer of all or part of the business of the relevant entity to a “bridge bank” established and wholly owned by the Bank of England; (iii) transfer all or part of the relevant entity or “bridge bank” to an asset management vehicle; (iv) making of one or more resolution instruments by the Bank of England; and (v) temporary public ownership of the relevant entity. HM Treasury may also take a parent company of a relevant entity into temporary public ownership where certain conditions are met. Certain ancillary powers include the power to modify contractual arrangements in certain circumstances.
Under the Banking Act, powers are granted to the Authorities which include, but are not limited to: (i) a “write-down and conversion power” relating to Tier 1 and Tier 2 capital instruments and (ii) a “bail-in” power relating to the majority of unsecured liabilities (including the capital instruments and senior unsecured debt securities issued by Lloyds Bank plc). While Lloyds Banking Group plc is currently the resolution entity for Lloyds Banking Group pursuant to the Bank of England’s “single point of entry” resolution model, bail-in is capable of being applied to all of Lloyds Bank plc’s senior unsecured and subordinated debt instruments with a remaining maturity of greater than seven days. Such loss absorption powers give resolution authorities the ability to write-down or write-off all or a portion of the claims of certain unsecured creditors of a failing institution or group and/or to convert certain debt claims into another security, including ordinary shares of the surviving group entity, if any. Such resulting ordinary shares may be subject to severe dilution, transfer for no consideration, write-down or write-off. The Banking Act specifies the order in which the bail-in tool should be applied, reflecting the hierarchy of capital instruments under CRD and otherwise respecting the hierarchy of claims in an ordinary insolvency. Moreover, the Banking Act and secondary legislation made thereunder provides certain limited safeguards for creditors in specific circumstances. For example, a holder of debt securities issued by Lloyds Bank plc should not suffer a worse outcome than it would in insolvency proceedings. However, this “no creditor worse off” safeguard may not apply in relation to an application of the write-down and conversion power in circumstances where a stabilisation power is not also used; holders of debt instruments which are subject to the power may, however, have ordinary shares transferred to or issued to them by way of compensation. The exercise of mandatory write-down and conversion power under the Banking Act or any suggestion of such exercise could, therefore, materially adversely affect the rights of the holders of equity and debt securities and the price or value of their investment and/or the ability of Lloyds Bank Group to satisfy its obligations under such debt securities.
Resolution authorities also have powers to amend the terms of contracts (for example, varying the maturity of a debt instrument) and to override events of default or termination rights that might be invoked as a result of the exercise of the resolution powers, which could have a material adverse effect on the rights of holders of the debt securities issued by Lloyds Bank plc, including through a material adverse effect on the price of such securities. The Banking Act also gives the Bank of England the power to override, vary or impose contractual obligations between a UK bank, its holding company and its group undertakings for reasonable consideration, in order to enable any transferee or successor bank to operate effectively. There is also power for HM Treasury to amend the law (excluding provisions made by or under the Banking Act) for the purpose of enabling it to use the regime powers effectively, potentially with retrospective effect.
The determination that securities and other obligations issued by Lloyds Bank plc will be subject to loss absorption is likely to be inherently unpredictable and may depend on a number of factors which may be outside of Lloyds Bank Group’s control. This determination will also be made by the relevant UK resolution authority and there may be many factors, including factors not directly related to Lloyds Bank Group, which could result in such a determination. Because of this inherent uncertainty and given that the relevant provisions of the Banking Act remain largely untested in practice, it will be difficult to predict when, if at all, the exercise of a loss absorption power may occur which would result in a principal write-off or conversion to other securities. Moreover, as the criteria that the relevant UK resolution authority will be obliged to consider in exercising any loss absorption power provide it with considerable discretion, holders of the securities issued by Lloyds Bank plc may not be able to refer to publicly available criteria in order to anticipate a potential exercise of any such power and consequently its potential effect on Lloyds Bank Group and the securities issued by Lloyds Bank plc.
Potential investors in the securities issued by Lloyds Bank plc should consider the risk that a holder may lose some or all of its investment, including the principal amount plus any accrued interest, if such statutory loss absorption measures are acted upon. The Banking Act provides that, other than in certain limited circumstances set out in the Banking Act, extraordinary governmental financial support will only be available to Lloyds Bank plc as a last resort once the write-down and conversion powers and resolution tools referred to above have been exploited to the maximum extent possible. Accordingly, it is unlikely that investors in securities issued by the Company will benefit from such support even if it were provided.
Holders of Lloyds Bank plc’s securities may have limited rights or no rights to challenge any decision of the relevant UK resolution authority to exercise the UK resolution powers or to have that decision reviewed by a judicial or administrative process or otherwise. Accordingly, trading behaviour in respect of such securities is not necessarily expected to follow the trading behaviour associated with other types of securities that are not subject to such resolution powers. Further, the introduction or amendment of such recovery and resolution powers, and/or any implication or anticipation that they may be used, may have a significant adverse effect on the market price of such securities, even if such powers are not used.
The minimum requirement for own funds and eligible liabilities (“MREL”) applies to UK financial institutions and covers own funds and debt instruments that are capable of being written-down or converted to equity in order to prevent a financial institution or its group from failing in a crisis. The Bank of England has set a final MREL conformance date for larger banks of 1 January 2022 with interim compliance required from 1 January 2020. Lloyds Bank Group has been identified as material subsidiary of Lloyds Banking Group plc and must therefore maintain internal MREL resources from 1 January 2020 at the higher of minimum requirements calculated on a sub consolidated basis and on an individual basis.
In addition, Lloyds Bank Group’s costs of doing business may increase by amendments made to the Banking Act in relation to deposits covered by the UK Financial Services Compensation Scheme (the “FSCS”). Lloyds Banking Group contributes to compensation schemes such as the FSCS in respect of banks and other authorised financial services firms that are unable to meet their obligations to customers. Further provisions in respect of these costs are likely to be necessary in the future. The ultimate cost to the industry, which will also include the cost of any compensation payments made by the FSCS and, if necessary, the cost of meeting any shortfall after recoveries on the borrowings entered into by the FSCS, remains uncertain but may be significant and may have a material effect on Lloyds Bank Group’s business, results of operations or financial condition.
6.Lloyds Bank Group is subject to the risk of having insufficient capital resources and/or not meeting liquidity requirements
Under PRA requirements, Lloyds Bank Group (as the ring-fenced bank sub-group) became subject to prudential requirements on a sub-consolidated basis from 1 January 2019. These requirements are in addition to the requirements that Lloyds Bank plc must meet under the existing prudential regime on an individual basis.
If Lloyds Bank plc and/or Lloyds Bank Group has, or is perceived to have, a shortage of regulatory capital or to be unable to meet its regulatory minimum liquidity requirements, then it may be subject to regulatory interventions and sanctions and may suffer a loss of confidence in the market with the result that access to sources of liquidity and funding may become constrained, more expensive or unavailable. This, in turn, may affect Lloyds Bank Group’s capacity to continue its business operations, pay future dividends to its parent and make other distributions or pursue acquisitions or other strategic opportunities, impacting future growth potential.
See also the risk factor above entitled “Lloyds Bank Group’s businesses are subject to inherent risks concerning liquidity and funding, particularly if the availability of traditional sources of funding such as retail deposits or the access to wholesale funding markets becomes more limited”.
A shortage of capital could arise from (i) a depletion of Lloyds Bank Group and/or Lloyds Bank plc’s capital resources through increased costs or liabilities and reduced asset values which could arise as a result of the crystallisation of credit-related risks, regulatory and legal risks, business and economic risks, operational risks, financial soundness-related risks and other risks; and/or (ii) an increase in the amount of capital that is needed to be held; and/or (iii) changes in the manner in which Lloyds Bank Group and/or Lloyds Bank plc is required to calculate its capital and/or the risk-weightings applied to its assets. This might be driven by a change to the actual level of risk faced by Lloyds Bank Group or to changes in the minimum capital required by legislation or by the regulatory authorities. For example, an aggregated risk weighted asset output floor has been proposed by the Basel Committee, with an expected transitional period from 2023 to 2028. The application of Basel 3.1, including the output floor, will be a matter for the UK legislature and Lloyds Bank Group and Lloyds Bank plc’s prudential regulators and there remains uncertainty until such rules translate into UK legislation.
Lloyds Bank Group and/or Lloyds Bank plc may address a shortage of capital by acting to reduce leverage exposures and/or risk-weighted assets, for example by way of business disposals. Such actions may impact the profitability of Lloyds Bank Group.
Whilst Lloyds Bank Group monitors current and expected future capital, MREL and liquidity requirements, including having regard to both leverage and risk weighted assets-based requirements, and seeks to manage and plan the prudential position accordingly and on the basis of current assumptions regarding future regulatory capital and liquidity requirements, there can be no assurance that the assumptions will be accurate in all respects or that it will not be required to take additional measures to strengthen its capital or liquidity position. Market expectations as to capital and liquidity levels may also increase, driven by, for example, the capital and liquidity levels (or targets) of peer banking groups.
Lloyds Bank Group’s borrowing costs and access to capital markets, as well as its ability to lend or carry out certain aspects of its business, could also be affected by future prudential regulatory developments more generally, including: (i) evolving UK and global prudential and regulatory changes, for example the UK consultation on the remaining changes to implement CRRII, and the final phase of implementation of Basel reforms (Basel 3.1) in the UK; (ii) regulatory changes in other jurisdictions to which Lloyds Bank Group has exposure and (iii) the evolving regulatory and legal impacts of the UK’s exit from the EU.
Any of the risks mentioned above could have a material adverse effect on Lloyds Bank Group’s capital resources and/or liquidity, results of operations, its ability to continue its business operations and its financial condition.
7.The financial impact of legal proceedings and regulatory risks may be material and is difficult to quantify. Amounts eventually paid may materially exceed the amount of provisions set aside to cover such risks, or existing provisions may need to be materially increased in response to changing circumstances, as has been the case in respect of payment protection insurance (“PPI”) redress payments
Where provisions have already been taken in published financial statements of Lloyds Bank Group or results announcements for ongoing legal or regulatory matters, these have been recognised, in accordance with IAS 37 (“Provisions, Contingent Liabilities and Contingent Assets”) (“IAS 37”), as the best estimate of the expenditure required to settle the obligation as at the reporting date. Such estimates are inherently uncertain and it is possible that the eventual outcomes may differ materially from current estimates, resulting in future increases or decreases to the required provisions, or actual losses that exceed or fall short of the provisions taken.
Excluding MBNA Limited (“MBNA”), Lloyds Bank Group increased provisions for expected PPI costs by a further £0.1 billion recognised in the final quarter of the year ended 31 December 2020. Of the approximately six million enquiries received pre-deadline, more than 99 per cent have now been processed. The £0.1 billion charge in the fourth quarter was driven by the impact of the COVID-19 pandemic delaying operational activities during 2020, the final stages of work to ensure operational completeness ahead of an orderly programme close and final validation of information requests and complaints with third parties that resulted in a limited number of additional complaints to be handled. A small part of the costs incurred during the year also reflect the costs associated with litigation activity to date.
This brings the total amount provided for at the end of 2020 to £21.9 billion, of which £0.2 billion remains unutilised relating to complaints and associated administration costs.
With regard to MBNA, as announced in December 2016, Lloyds Bank Group's exposure continues to remain capped at £240 million under the terms of the MBNA sale and purchase agreement. No additional charge has been made by MBNA to its PPI provision in the year ended 31 December 2020.
Provisions have not been taken where no obligation (as defined in IAS 37) has been established, whether associated with a known or potential future litigation or regulatory matter. Accordingly, an adverse decision in any such matters could result in significant losses to Lloyds Bank Group which have not been provided for. Such losses would have an adverse impact on Lloyds Bank Group’s financial condition and operations.
In November 2014, the UK Supreme Court ruled in Plevin v Paragon Personal Finance Limited 2014 UKSC 61 (“Plevin”) that failure to disclose to a customer a “high” commission payment on a single premium PPI policy sold with a consumer credit agreement created an unfair relationship between the lender and the borrower under s140 of the Consumer Credit Act 1974. It did not define a tipping point above which commission was deemed “high”. The disclosure of commission was not a requirement of the FSA’s (now FCA’s) Insurance: Conduct of Business sourcebook rules for the sale of general insurance (including PPI). Permission to appeal the redress outcome in the Plevin case was refused by the Court of Appeal in July 2015 and by the President of the Family Division in November 2015.
In November 2015 and August 2016, the FCA consulted on the introduction of a two year industry deadline by which consumers would need to make their PPI complaints or lose their right to have them assessed, and proposed rules and guidance about how firms should handle PPI
complaints fairly in light of the Plevin judgment discussed above. On 2 March 2017, the FCA confirmed an industry deadline of 29 August 2019. The FCA’s rules to address Plevin commenced on 29 August 2017. The industry deadline also applies to the handling of these complaints. The FCA’s rules, issued on 2 March 2017, could have a material adverse effect on Lloyds Bank Group’s reputation, business, financial condition, results of operations and prospects.
Further, no assurance can be given that Lloyds Bank Group will not incur liability in connection with any past, current or future non-compliance with legislation or regulation, and any such non-compliance could be significant and materially adversely affect its reputation, business, financial condition, results of operations and prospects.
8.Lloyds Bank Group must comply with anti-money laundering, counter terrorist financing, anti-bribery and sanctions regulations, and a failure to prevent or detect any illegal or improper activities fully or on a timely basis could negatively impact customers and expose Lloyds Bank Group to liability
Lloyds Bank Group is required to comply with applicable anti-money laundering, anti-terrorism, sanctions, anti-bribery and other laws and regulations in the jurisdictions in which it operates. These extensive laws and regulations require Lloyds Bank Group, amongst other things, to adopt and enforce “know-your-customer” policies and procedures and to report suspicions of money laundering and terrorist financing, and in some countries specific transactions to the applicable regulatory authorities. These laws and regulations have become increasingly complex and detailed, require improved systems and sophisticated monitoring and compliance personnel, and have become the subject of enhanced government and regulatory supervision.
Lloyds Bank Group has adopted policies and procedures aimed at detecting and preventing the use of its banking network and services for money laundering, financing terrorism, bribery, tax evasion, human trafficking, modern day slavery, wildlife trafficking and related activities. These controls, however, may not eliminate instances where third parties seek to use Lloyds Bank Group’s products and services to engage in illegal or improper activities. In addition, while Lloyds Bank Group reviews its relevant counterparties’ internal policies and procedures with respect to such matters, Lloyds Bank Group, to a large degree, relies upon its relevant counterparties to maintain and properly apply their own appropriate anti-money laundering procedures. Such measures, procedures and compliance may not be effective in preventing third parties from using Lloyds Bank Group (and its relevant counterparties) as a conduit for money laundering and terrorist financing (including illegal cash operations) without Lloyds Bank Group’s (and its relevant counterparties’) knowledge. If Lloyds Bank Group is associated with, or even accused of being associated with, or becomes a party to, money laundering or terrorist financing, its reputation could suffer and it could become subject to fines, sanctions and/or legal enforcement (including being added to any “black lists” that would prohibit certain parties from engaging in transactions with Lloyds Bank Group), any one of which could have a material adverse effect on its results of operations, financial condition and prospects.
Furthermore, failure to comply with trade and economic sanctions, both primary and secondary (which are frequently subject to change by relevant governments and agencies in the jurisdictions in which Lloyds Bank Group operates), and failure to comply fully with other applicable compliance laws and regulations, may result in the imposition of fines and other penalties on Lloyds Bank, including the revocation of licences. In addition, Lloyds Bank Group’s business and reputation could suffer if customers use its banking network for money laundering, financing terrorism, or other illegal or improper purposes.
9.Failure to manage the risks associated with changes in taxation rates or applicable tax laws, or misinterpretation of such tax laws, could materially adversely affect Lloyds Bank Group’s results of operations, financial condition or prospects
Tax risk is the risk associated with changes in taxation rates, applicable tax laws, misinterpretation of such tax laws, disputes with relevant tax authorities in relation to historic transactions, or conducting a challenge to a relevant tax authority. Failure to manage this risk adequately could cause Lloyds Bank Group to suffer losses due to additional tax charges and other financial costs including penalties. Such failure could lead to adverse publicity, reputational damage and potentially costs materially exceeding current provisions, in each case to an extent which could have an adverse effect on Lloyds Bank Group’s results of operations, financial condition or prospects.
BUSINESS AND OPERATIONAL RISKS
1.Operational risks, including the risk that the Lloyds Bank Group fails to design resilience into business operations, underlying infrastructure and controls, including weaknesses or failures in the Lloyds Bank Group’s processes, systems and security, and risks due to reliance on third party services and products could materially adversely affect the Lloyds Bank Group’s operations
Operational risks, through inadequate or failed processes, systems (including financial reporting and risk monitoring processes) or security, or from people-related or external events, including the risk of fraud and other criminal acts carried out against Lloyds Bank Group, are present in Lloyds Bank Group’s businesses. Lloyds Bank Group’s businesses are dependent on processing and reporting accurately and efficiently a high volume of complex transactions across numerous and diverse products and services, in different currencies and subject to a number of different legal and regulatory regimes. Any weakness or errors in these processes, systems or security could have an adverse effect on Lloyds Bank Group’s results, reporting of such results, and on the ability to deliver appropriate customer outcomes during the affected period which may lead to an increase in complaints and damage to the reputation of Lloyds Bank Group.
Specifically, failure to develop, deliver or maintain effective IT solutions in line with Lloyds Bank Group’s operating environment could have a material adverse impact on customer service and business operations. Any prolonged loss of service availability could damage Lloyds Bank Group’s ability to service its customers, could result in compensation costs and could cause long-term damage to its business and brand. See “Business and Operational Risks - Lloyds Bank Group’s business is subject to risks related to cybercrime”.
Third parties such as suppliers and vendors upon which Lloyds Bank Group relies for important products and services could also be sources of operational risk, specifically with regard to security breaches affecting such parties. Lloyds Bank Group may be required to take steps to protect the integrity of its operational systems, thereby increasing its operational costs. Additionally, any problems caused by these third parties, including as a result of their not providing Lloyds Bank Group their services for any reason, their performing their services poorly, or employee misconduct, could adversely affect Lloyds Bank Group’s ability to deliver products and services to customers and otherwise to conduct business. Replacing these third party vendors or moving critical services from one provider to another could also entail significant delays and expense.
Lloyds Bank Group is also exposed to risk of fraud and other criminal activities (both internal and external) due to the operational risks inherent in banking operations. These risks are also present when Lloyds Bank Group relies on outside suppliers or vendors to provide services to Lloyds Bank Group and its customers. Fraudsters may target any of Lloyds Bank Group’s products, services and delivery channels, including lending, internet banking, payments, bank accounts and cards. This may result in financial loss to Lloyds Bank Group and/or Lloyds Bank Group’s customers, poor customer experience, reputational damage, potential litigation and regulatory proceedings. Industry reported gross fraud losses have continued to increase as both financial institutions and their customers are targeted.
Fraud losses and their impacts on customers and the wider society are now an increasing priority for consumer groups, regulators and the UK Government. Any weakness or errors in Lloyds Bank Group’s processes, systems or security could have an adverse effect on Lloyds Bank Group’s results and on the ability to deliver appropriate customer responses, which may lead to an increase in complaints and damage to Lloyds Bank Group’s reputation. Please see “Regulatory and Legal Risks - Lloyds Bank Group must comply with anti-money laundering, counter terrorist financing, anti-bribery and sanctions regulations, and a failure to prevent or detect any illegal or improper activities fully or on a timely basis could negatively impact customers and expose Lloyds Bank Group to liability”.
In addition, the COVID-19 pandemic has resulted in heightened operational risk as Lloyds Bank Group responds to the pandemic, including in the areas of cyber, fraud, people, technology and operational resilience. Cyber criminals continue to exploit COVID-19, seeking to mislead customers and colleagues. The impact of COVID-19 has required the reprioritising of planned activities and provided a challenge on colleagues’ ability to absorb increased workloads, whilst adapting to new ways of working. As a result, there has been heightened focus on colleague wellbeing and resilience. There has also been significant levels of stress on supplier business models and the possibility of multiple supplier failures. Despite anticipated heightened operational risks, the volume of operational loss events has remained broadly consistent in 2020 compared to 2019. As with other businesses, how Lloyds Bank Group is perceived to have supported its clients, employees and suppliers through the challenges presented by the COVID-19 pandemic could have a material effect on its reputation.
2.Lloyds Bank Group is exposed to conduct risk
Lloyds Bank Group is exposed to various forms of conduct risk in its operations. Conduct risk is the risk of customer detriment across the customer lifecycle including: failures in product management, distribution and servicing activities; from other risks materialising, or other activities which could undermine the integrity of the market or distort competition, leading to unfair customer outcomes, regulatory censure, or reputational damage or financial loss. Such risks are inherent in banking services. Forms of conduct risk include business and strategic planning that does not sufficiently consider customer need (leading to products being offered beyond target markets and mis-selling of financial products), ineffective management and monitoring of products and their distribution (which could result in customers receiving unfair outcomes), customer communications that are unclear, unfair, misleading or untimely (which could impact customer decision-making and result in customers receiving unfair outcomes), a culture that is not sufficiently customer-centric (potentially driving improper decision-making and unfair outcomes for customers), outsourcing of customer service and product delivery via third-parties that do not have the same level of control, oversight and customer-centric culture as Lloyds Bank Group (which could result in potentially unfair or inconsistent customer outcomes), the possibility of alleged mis-selling of financial products (which could require amendments to sales processes, withdrawal of products or the provision of restitution to affected customers, all of which may require additional provisions in Lloyds Bank Group’s financial accounts), ineffective management of customer complaints or claims (which could result in customers receiving unfair outcomes), ineffective processes or procedures to support customers, including those in potentially vulnerable circumstances (which could result in customers receiving unfair outcomes or treatments which do not support their needs), and poor governance of colleagues’ incentives and rewards and approval of schemes which drive unfair customer outcomes. Ineffective management and oversight of legacy conduct issues can also result in customers who are undergoing remediation being unfairly treated and therefore further rectification being required. Lloyds Bank Group is also exposed to the risk of engaging in, or failing to manage, conduct which could constitute market abuse, undermine the integrity of a market in which it is active, distort competition or create conflicts of interest. Each of these risks can lead to regulatory censure, reputational damage, regulatory intervention/enforcement, the imposition of lengthy remedial redress programmes and financial penalties or other loss for Lloyds Bank Group, all of which could have a material adverse effect on its results of operations, financial condition or prospects.
3.Lloyds Bank Group’s business is subject to risks related to cybercrime
Lloyds Bank Group holds personally identifiable information on its systems aligned to product and services delivered to customers. Protection is delivered in accordance with data protection legislation, including the General Data Protection Regulation, Data Protection Act 2018 and the Private and Electronic Communication Regulation. In certain international locations, there are additional regulatory requirements that must be followed for business conducted in that jurisdiction. In the U.S., for example, the company's U.S. entity is required to formally attest that it complies with specific cyber security requirements put forth by the New York State Department of Financial Services in Part 500 of Title 23 of the Official Compilation of Codes, Rules and Regulations of the State of New York.
Lloyds Bank Group’s IT infrastructure, and that of third parties on whom it relies, may be vulnerable to cyber-attacks, malware, denial of services, unauthorised access and other events that have a security impact. Such an event may impact the confidentiality or integrity of Lloyds Bank Group’s or its clients’, employees’ or counterparties’ information or the availability of services to customers. As a result of such an event or a failure in Lloyds Bank Group’s cyber security policies, Lloyds Bank Group could experience material financial loss, loss of competitive position, regulatory actions, breach of client contracts, reputational harm or legal liability, which, in turn, could have a material adverse effect on its results of operations, financial condition or prospects. Lloyds Bank Group may be required to spend additional resources to modify its protective measures or to investigate and remediate vulnerabilities or other exposures, and it may be subject to litigation and financial losses that are either not insured against fully or not fully covered through any insurance that it maintains. Lloyds Bank Group is committed to continued participation in industry-wide activity relating to cyber risk. This includes working with relevant regulatory and government departments to evaluate the approach Lloyds Bank Group is taking to mitigate this risk and sharing relevant information across the financial services sector.
4.Lloyds Bank Group is subject to the emerging risks associated with climate change
The risks associated with climate change are coming under an increasing focus, both in the UK and internationally, from governments, regulators and large sections of society. These risks include: physical risks, arising from climate and weather-related events of increasing severity and/or frequency; transition risks resulting from the process of adjustment towards a lower carbon economy (including stranded, redundant or prohibited assets); and liability risks arising from Lloyds Bank Group or clients experiencing litigation or reputational damage as a result of sustainability issues.
Physical risks from climate change arise from a number of factors and relate to specific weather events and longer term shifts in the climate. The nature and timing of extreme weather events are uncertain but they are increasing in frequency and their impact on the economy is predicted to be more acute in the future. The potential impact on the economy includes, but is not limited to, lower GDP growth, higher unemployment and significant changes in asset prices and profitability of industries. The physical risks could also lead to the disruption of business activity at clients' locations. In addition, Lloyds Bank Group’s premises and resilience may also suffer physical damage due to weather events leading to increased costs for Lloyds Bank Group.
The move towards a low-carbon economy will also create transition risks, due to potential significant and rapid developments in the expectations of policymakers, regulators and society resulting in policy, regulatory and technological changes which could impact Lloyds Bank Group. These risks may cause the impairment of asset values, impact the creditworthiness of clients of Lloyds Bank Group, and impact defaults among retail customers (including through the ability of customers to repay their mortgages, as well as the impact on the value of the underlying property), which could result in currently profitable business deteriorating over the term of agreed facilities.
In 2020, Lloyds Banking Group announced an ambitious goal to work with customers, government and the market to help reduce the emissions Lloyds Banking Group finances by more than 50 percent by 2030 on the path to net zero greenhouse gas emissions by 2050 or sooner, supporting both the UK Government's ambition and the 2015 Paris Agreement. Achieving this goal will require, among other things: customers to change their behaviours; governments to introduce new policies, incentives and to invest in infrastructure; new market developments; and technological advancements. If these changes, most of which are out of Lloyds Banking Group’s control, do not occur, Lloyds Banking Group (of which Lloyds Bank Group forms a large part) may have difficulty achieving its targets. Furthermore, in order to reach its targets, Lloyds Banking Group will need to further develop sustainable finance products and may be required to alter its business model.
If Lloyds Bank Group does not adequately embed the risks associated with climate change identified above into its risk framework to appropriately measure, manage and disclose the various financial and operational risks it faces as a result of climate change, or fails to adapt its strategy and business model to the changing regulatory requirements and market expectations on a timely basis, this could have an adverse impact on Lloyds Bank Group’s results of operations, financial condition and prospects. Furthermore, inadequate climate risk disclosure could result in the loss of Lloyds Banking Group's investor base as it will not be perceived to be a green investment. Implications of inadequately managing or disclosing climate-related risk or evidencing progress in line with expectations, could also result in potential reputational damage, customer attrition or loss of investor confidence.
5.Lloyds Bank Group’s businesses are conducted in competitive environments, with increased competition scrutiny, and Lloyds Bank Group’s financial performance depends upon management’s ability to respond effectively to competitive pressures and scrutiny
The markets for UK financial services, and the other markets within which Lloyds Bank Group operates, are competitive, and management expects such competition to continue or intensify. This expectation is due to competitor behaviour, new entrants to the market (including a number of new retail banks as well as non-traditional financial services providers), consumer demand, technological changes such as the growth of digital banking, and the impact of regulatory actions and other factors. Lloyds Bank Group’s financial performance and its ability to maintain existing or capture additional market share depends significantly upon the competitive environment and management’s response thereto.
The competitive environment can be, and is, influenced by intervention by the UK Government competition authorities and/or European regulatory bodies and/or governments of other countries in which Lloyds Bank Group operates, including in response to any perceived lack of competition within these markets. This may significantly impact the competitive position of Lloyds Bank Group relative to its international competitors, which may be subject to different forms of government intervention.
The Competition and Markets Authority (the “CMA”) launched a full market investigation into competition in the SME banking and personal current account (“PCA”) markets in November 2014 and published its final report on 9 August 2016, followed by the Retail Banking Market Investigation Order 2017 on 2 February 2017. The key final remedies include: the introduction of “Open Banking”, the publication of service quality information and customer information prompts. Recommendations were also made regarding improvements to current account switching, monthly maximum charges for PCA overdraft users, overdraft notifications and additional measures to assist small business in comparing the different products available. The FCA has also undertaken market reviews in each of the major retail product markets and introduced remedies to help customers compare products and switch between products and product providers.
Additionally, the internet and mobile technologies are changing customer behaviour and the competitive environment. There has been a steep rise in customer use of mobile banking over the last several years. Lloyds Bank Group faces competition from established providers of financial services as well as from banking business developed by non-financial companies, including technology companies with strong brand recognition.
As a result of any restructuring or evolution in the market, there may emerge one or more new viable competitors in the UK banking market or a material strengthening of one or more of Lloyds Bank Group’s existing competitors in that market. Any of these factors or a combination thereof could result in a significant reduction in the profit of Lloyds Bank Group.
6.Lloyds Bank Group could fail to attract or retain senior management or other key employees
Lloyds Bank Group’s success depends on its ability to attract, retain and develop high calibre talent. If Lloyds Bank Group was to unexpectedly lose a member of its key management or fail to maintain one of the strategic relationships of its key management team, its business and results of operations could be materially adversely affected.
In addition, Lloyds Bank Group also relies upon the services of other third-party providers for certain services and it may exercise limited control over the activities and business practices of these providers and any inability on Lloyds Bank Group’s part to maintain satisfactory commercial relationships with them or their failure to provide quality services could adversely affect Lloyds Bank Group’s business.
Attracting additional and retaining existing skilled personnel is fundamental to the continued growth of Lloyds Bank Group’s business. Personnel costs, including salaries, are increasing as the general level of prices and the standard of living increases in the countries in which Lloyds Bank Group does business and as industry-wide demand for suitably qualified personnel increases. No assurance can be given that Lloyds Bank Group will successfully attract new personnel or retain existing personnel required to continue to expand its business and to successfully execute and implement its business strategy. In addition, the uncertainty resulting from the UK’s exit from the EU on foreign nationals’ long-term residency permissions in the UK may make it challenging for Lloyds Bank Group to retain and recruit colleagues with relevant skills and experience.
7.Lloyds Bank Group may fail to execute its ongoing strategic change initiatives, and the expected benefits of such initiatives may not be achieved on time or as planned
In order to maintain and enhance Lloyds Bank Group’s strategic position, it continues to invest in new initiatives and programmes. Lloyds Bank Group acknowledges the challenges faced with delivering these initiatives and programmes alongside the extensive agenda of regulatory and legal changes whilst safely operating existing systems and controls.
The successful completion of these programmes and Lloyds Bank Group’s other strategic initiatives requires ongoing subjective and complex judgements, including forecasts of economic conditions in various parts of the world, and can be subject to significant risks. For example, Lloyds Bank Group’s ability to execute its strategic initiatives successfully may be adversely impacted by a significant global macroeconomic downturn, legacy issues, limitations in its management or operational capacity and capability or significant and unexpected regulatory change in countries in which it operates.
Failure to execute Lloyds Bank Group’s strategic initiatives successfully could have an adverse effect on Lloyds Bank Group’s ability to achieve the stated targets and other expected benefits of these initiatives, and there is also a risk that the costs associated with implementing such initiatives may be higher than expected or benefits may be lesser than expected. Both of these factors could materially adversely impact Lloyds Bank Group’s results of operations, financial condition or prospects.
8.Lloyds Bank Group may be unable to fully capture the expected value from acquisitions, which could materially and adversely affect its results of operations, financial condition or prospects
Lloyds Bank Group may from time to time undertake acquisitions as part of its growth strategy, which could subject it to a number of risks, such as: (i) the rationale and assumptions underlying the business plans supporting the valuation of a target business may prove inaccurate, in particular with respect to synergies and expected commercial demand; (ii) Lloyds Bank Group may fail to successfully integrate any acquired business, including its technologies, products and personnel; (iii) Lloyds Bank Group may fail to retain key employees, customers and suppliers of any acquired business; (iv) Lloyds Bank Group may be required or wish to terminate pre-existing contractual relationships, which could prove costly and/or be executed at unfavourable terms and conditions; (v) Lloyds Bank Group may fail to discover certain contingent or undisclosed liabilities in businesses that it acquires, or its due diligence to discover any such liabilities may be inadequate; and (vi) it may be necessary to obtain regulatory and other approvals in connection with certain acquisitions and there can be no assurance that such approvals will be obtained and even if granted, that there will be no burdensome conditions attached to such approvals, all of which could materially and adversely affect Lloyds Bank Group’s results of operations, financial conditions or prospects.
9.Lloyds Bank Group could be exposed to industrial action and increased labour costs resulting from a lack of agreement with trade unions
Within Lloyds Bank Group, there are currently two recognised unions for the purposes of collective bargaining. Combined, these collective bargaining arrangements apply to around 95 per cent of Lloyds Bank Group’s total workforce.
Where Lloyds Bank Group or its employees or their unions seek to change any of their contractual terms, a consultation and negotiation process is undertaken. Such a process could potentially lead to increased labour costs or, in the event that any such negotiations were to be unsuccessful and result in formal industrial action, Lloyds Bank Group could experience a work stoppage that could materially adversely impact its business, financial condition and results of operations.
10.Lloyds Bank Group’s financial statements are based, in part, on assumptions and estimates
The preparation of Lloyds Bank Group’s financial statements requires management to make judgements, estimates and assumptions that affect the reported amounts of assets, liabilities, income and expenses. Due to the inherent uncertainty in making estimates, actual results reported in future periods may be based upon amounts which differ from those estimates. Estimates, judgements and assumptions are continually evaluated and are based on historical experience and other factors, including expectations of future events that are believed to be reasonable under the circumstances. Revisions to accounting estimates are recognised in the period in which the estimate is revised and in any future periods affected.
Lloyds Bank Group and the Bank’s financial statements are prepared using judgements, estimates and assumptions based on information available at the reporting date. If one or more of these judgements, estimates and assumptions is subsequently revised as a result of new factors or circumstances emerging, there could be a material adverse effect on the Bank and/or Lloyds Bank Group’s results of operations, financial condition or prospects and a corresponding impact on its funding requirements and capital ratios.
FORWARD LOOKING STATEMENTS
This document contains certain forward looking statements within the meaning of Section 21E of the US Securities Exchange Act of 1934, as amended, and section 27A of the US Securities Act of 1933, as amended, with respect to the business, strategy, plans and/or results of Lloyds Bank plc together with its subsidiaries (the Lloyds Bank Group) and its current goals and expectations relating to its future financial condition and performance. Statements that are not historical facts, including statements about the Lloyds Bank Group's or its directors' and/or management's beliefs and expectations, are forward looking statements.
Words such as ‘believes’, ‘achieves’, ‘anticipates’, ‘estimates’, ‘expects’, ‘targets’, ‘should’, ‘intends’, ‘aims’, ‘projects’, ‘plans’, ‘potential’, ‘will’, ‘would’, ‘could’, ‘considered’, ‘likely’, ‘may’, ‘seek’, ‘estimate’ and variations of these words and similar future or conditional expressions are intended to identify forward looking statements but are not the exclusive means of identifying such statements.
Examples of such forward looking statements include, but are not limited to, statements or guidance relating to: projections or expectations of the Lloyds Bank Group’s future financial position including profit attributable to shareholders, provisions, economic profit, dividends, capital structure, portfolios, net interest margin, capital ratios, liquidity, risk-weighted assets (RWAs), expenditures or any other financial items or ratios; litigation, regulatory and governmental investigations; the Lloyds Bank Group’s future financial performance; the level and extent of future impairments and write-downs; statements of plans, objectives or goals of the Lloyds Bank Group or its management including in respect of statements about the future business and economic environments in the UK and elsewhere including, but not limited to, future trends in interest rates, foreign exchange rates, credit and equity market levels and demographic developments; statements about competition, regulation, disposals and consolidation or technological developments in the financial services industry; and statements of assumptions underlying such statements.
By their nature, forward looking statements involve risk and uncertainty because they relate to events and depend upon circumstances that will or may occur in the future.
Factors that could cause actual business, strategy, plans and/or results (including but not limited to the payment of dividends) to differ materially from forward looking statements made by the Lloyds Bank Group or on its behalf include, but are not limited to: general economic and business conditions in the UK and internationally; market related trends and developments; fluctuations in interest rates, inflation, exchange rates, stock markets and currencies; any impact of the transition from IBORs to alternative reference rates; the ability to access sufficient sources of capital, liquidity and funding when required; changes to the Lloyds Bank Group’s or Lloyds Banking Group plc’s credit ratings; the ability to derive cost savings and other benefits including, but without limitation as a result of any acquisitions, disposals and other strategic transactions; the ability to achieve strategic objectives; the Lloyds Bank Group’s ESG targets and/or commitments; changing customer behaviour including consumer spending, saving and borrowing habits; changes to borrower or counterparty credit quality impacting the recoverability and value of balance sheet assets; concentration of financial exposure; management and monitoring of conduct risk; exposure to counterparty risk (including but not limited to third parties conducting illegal activities without the Lloyds Bank Group’s knowledge); instability in the global financial markets, including Eurozone instability, instability as a result of uncertainty surrounding the exit by the UK from the European Union (EU), the EU-UK Trade and Cooperation Agreement, and as a result of such exit and the potential for other countries to exit the EU or the Eurozone and the impact of any sovereign credit rating downgrade or other sovereign financial issues; political instability including as a result of any UK general election and any further possible referendum on Scottish independence; technological changes and risks to the security of IT and operational infrastructure, systems, data and information resulting from increased threat of cyber and other attacks; natural, pandemic (including but not limited to the COVID-19 pandemic) and other disasters, adverse weather and similar contingencies outside the Lloyds Bank Group’s or Lloyds Banking Group plc’s control; inadequate or failed internal or external processes or systems; acts of war, other acts of hostility, terrorist acts and responses to those acts, or other such events; geopolitical unpredictability; risks relating to climate change; changes in laws, regulations, practices and accounting standards or taxation, including as a result of the UK's exit from the EU; changes to regulatory capital or liquidity requirements (including regulatory measures to restrict distributions to address potential capital and liquidity stress) and similar contingencies outside the Lloyds Bank Group’s or Lloyds Banking Group plc’s control; the policies, decisions and actions of governmental or regulatory authorities or courts in the UK, the EU, the US or elsewhere including the implementation and interpretation of key laws, legislation and regulation together with any resulting impact on the future structure of the Lloyds Bank Group; the ability to attract and retain senior management and other employees and meet its diversity objectives; actions or omissions by the Lloyds Bank Group's directors, management or employees including industrial action; changes to the Lloyds Bank Group's post-retirement defined benefit scheme obligations; the extent of any future impairment charges or write-downs caused by, but not limited to, depressed asset valuations, market disruptions and illiquid markets; the value and effectiveness of any credit protection purchased by the Lloyds Bank Group; the inability to hedge certain risks economically; the adequacy of loss reserves; the actions of competitors, including non-bank financial services, lending companies and digital innovators and disruptive technologies; and exposure to regulatory or competition scrutiny, legal, regulatory or competition proceedings, investigations or complaints. Please refer to the latest Annual Report on Form 20-F filed by Lloyds Bank plc with the US Securities and Exchange Commission for a discussion of certain factors and risks.
Lloyds Banking Group may also make or disclose written and/or oral forward looking statements in reports filed with or furnished to the US Securities and Exchange Commission, Lloyds Banking Group annual reviews, half-year announcements, proxy statements, offering circulars, prospectuses, press releases and other written materials and in oral statements made by the directors, officers or employees of Lloyds Banking Group to third parties, including financial analysts.
Except as required by any applicable law or regulation, the forward looking statements contained in this document are made as of today's date, and the Lloyds Bank Group expressly disclaims any obligation or undertaking to release publicly any updates or revisions to any forward looking statements contained in this document to reflect any change in the Lloyds Bank Group’s expectations with regard thereto or any change in events, conditions or circumstances on which any such statement is based. The information, statements and opinions contained in this document do not constitute a public offer under any applicable law or an offer to sell any securities or financial instruments or any advice or recommendation with respect to such securities or financial instruments.
LLOYDS BANK GROUP STRUCTURE
The following are significant subsidiaries of Lloyds Bank plc as at 31 December 2020.
| | | | | | | | | | | | | | |
| Name of subsidiary undertaking | Country of
registration/
incorporation | Percentage of equity share
capital and voting
rights held | Nature of business | Registered office |
| HBOS plc | Scotland | 100% | Holding company | The Mound
Edinburgh EH1 1YZ |
| Bank of Scotland plc | Scotland | 100%* | Banking and financial services | The Mound
Edinburgh EH1 1YZ |
*Indirect interest
INDEX TO THE FINANCIAL STATEMENTS
Throughout these financial statements, references to the ‘Bank’ are to Lloyds Bank plc; references to the ‘Group’ are to Lloyds Bank plc and its subsidiary and associated undertakings.
REPORT OF INDEPENDENT REGISTERED PUBLIC ACCOUNTING FIRM
To the board of directors and shareholder of Lloyds Bank plc
OPINION ON THE FINANCIAL STATEMENTS
We have audited the accompanying balance sheets of Lloyds Bank plc and its subsidiaries (the “Company”) as of 31 December 2020 and 31 December 2019, and the related consolidated income statements, statements of comprehensive income, statements of changes in equity and cash flow statements for each of the three years in the period ended 31 December 2020, including the related notes (collectively referred to as the “consolidated financial statements”). In our opinion, the consolidated financial statements present fairly, in all material respects, the financial position of the Company as of 31 December 2020 and 31 December 2019, and the results of its operations and its cash flows for each of the three years in the period ended 31 December 2020 in conformity with International Financial Reporting Standards as issued by the International Accounting Standards Board.
CHANGES IN ACCOUNTING PRINCIPLES
As discussed in note 1 to the consolidated financial statements, the Company changed the manner in which it accounts for leases , income taxes and hedge accounting in 2019.
BASIS FOR OPINION
These consolidated financial statements are the responsibility of the Company’s management. Our responsibility is to express an opinion on the Company’s consolidated financial statements based on our audits. We are a public accounting firm registered with the Public Company Accounting Oversight Board (United States) (PCAOB) and are required to be independent with respect to the Company in accordance with the U.S. federal securities laws and the applicable rules and regulations of the Securities and Exchange Commission and the PCAOB.
We conducted our audits of these consolidated financial statements in accordance with the standards of the PCAOB. Those standards require that we plan and perform the audit to obtain reasonable assurance about whether the consolidated financial statements are free of material misstatement, whether due to error or fraud. The Company is not required to have, nor were we engaged to perform, an audit of its internal control over financial reporting. As part of our audits we are required to obtain an understanding of internal control over financial reporting but not for the purpose of expressing an opinion on the effectiveness of the Company's internal control over financial reporting. Accordingly, we express no such opinion.
Our audits included performing procedures to assess the risks of material misstatement of the consolidated financial statements, whether due to error or fraud, and performing procedures that respond to those risks. Such procedures included examining, on a test basis, evidence regarding the amounts and disclosures in the consolidated financial statements. Our audits also included evaluating the accounting principles used and significant estimates made by management, as well as evaluating the overall presentation of the consolidated financial statements. We believe that our audits provide a reasonable basis for our opinion.
CRITICAL AUDIT MATTERS
The critical audit matters communicated below are matters arising from the current period audit of the consolidated financial statements that were communicated or required to be communicated to the audit committee and that (i) relate to accounts or disclosures that are material to the consolidated financial statements and (ii) involved our especially challenging, subjective, or complex judgments.
The communication of critical audit matters does not alter in any way our opinion on the consolidated financial statements, taken as a whole, and we are not, by communicating the critical audit matters below, providing separate opinions on the critical audit matters or on the accounts or disclosures to which they relate.
ALLOWANCE FOR EXPECTED CREDIT LOSSES
As described in notes 2, 3 and 16 to the consolidated financial statements, the allowance for expected credit losses (ECL) was £6,132 million as of 31 December 2020. The calculation of the allowance for ECL required management to make a number of judgments, assumptions and estimates. The most significant included probability of default, lifetime of an exposure, significant increase in credit risk, certain post-model adjustments, the accuracy of borrower credit risk ratings, and the determination of the base case and multiple economic scenarios assumptions. The allowance for ECL for individual exposures takes into account the value of any collateral held, repayments, or other mitigants of loss.
The principal considerations for our determination that performing procedures relating to the allowance for ECL is a critical audit matter are (i) there was significant judgment by management in determining the allowance, which in turn led to a high degree of auditor subjectivity in performing procedures related to the impairment models, key assumptions, including the probability of default and significant increase in credit risk, the determination of certain post-model adjustments, the value of any collateral held, repayments, or other mitigants of loss for individual exposures, the accuracy of borrower credit risk ratings, and the determination of the base case scenario, (ii) there was significant judgment and effort in evaluating audit evidence related to these models, judgments and assumptions used to determine the allowance and (iii) the audit effort involved the use of professionals with specialised skill and knowledge.
Addressing the matter involved performing procedures and evaluating audit evidence in connection with forming our overall opinion on the consolidated financial statements. These procedures included testing the effectiveness of controls relating to the estimation process, which included controls over the data, models and assumptions used in determining the allowance for ECL. These procedures also included, among others, the involvement of professionals with specialised skill and knowledge to assist in testing management’s process to estimate the allowance for ECL including evaluating the appropriateness of methodology and models, evaluating the reasonableness of significant assumptions used in the impairment models including the probability of default and significant increase in credit risk, and testing certain post -model adjustments. It also included evaluating the reasonableness of key assumptions in the base case scenario. Evaluating the base case scenario assumptions involved assessing their reasonableness against external data and economic events that have occurred. We also assessed the reasonableness of the accuracy of borrower credit risk ratings and the value of any collateral held, repayments, or other mitigants of loss for individual exposures.
REPORT OF INDEPENDENT REGISTERED PUBLIC ACCOUNTING FIRM
DEFINED BENEFIT OBLIGATION
As described in notes 2, 3 and 28 to the consolidated financial statements, the carrying value of the defined benefit obligation was £49,549 million as of 31 December 2020. The valuation of the defined benefit obligation required management to make a number of assumptions. The key assumptions include the discount rate applied to future cash flows, the rate of inflation and the expected lifetime of the schemes’ members. The discount rate is set by management with reference to market yields at the end of the reporting period on high quality corporate bonds in the currency of and with a term consistent with the defined benefit pension schemes’ obligations. The rate of inflation is set by management with reference to market indices. The expected lifetime of the schemes’ members is set by management by considering latest market practice and actual experience in determining both current mortality expectations and the rate of future mortality improvement.
The principal considerations for our determination that performing procedures relating to the defined benefit obligation is a critical audit matter are (i) there was significant judgment by management to determine the discount rate to be applied to the future cash flows, the rate of inflation and the expected lifetime of the schemes’ members, which in turn led to significant auditor judgment and audit effort to evaluate the evidence obtained related to the valuation models and assumptions and (ii) the audit effort involved the use of professionals with specialised skill or knowledge.
Addressing the matter involved performing procedures and evaluating audit evidence in connection with forming our overall opinion on the consolidated financial statements. These procedures included testing the effectiveness of controls relating to the estimation process, which included controls over models and key assumptions including the discount rate applied to future cash flows, the rate of inflation and the expected lifetime of the schemes’ members, used to calculate the defined benefit obligation. These procedures also included, among others, the involvement of professionals with specialised skill and knowledge to assist in testing management’s process to estimate the defined benefit obligation, including evaluating the appropriateness of methodology and models, and evaluating the reasonableness of key assumptions, including the discount rate, the rate of inflation and the expected lifetime of the schemes’ members. Evaluating the assumptions used in the models involved assessing their reasonableness and comparing them to our own independently determined benchmarks.
VALUATION OF CERTAIN LEVEL 3 FINANCIAL INSTRUMENT ASSETS
As described in notes 2, 3 and 42 to the consolidated financial statements, the carrying value of the level 3 financial instrument assets held at fair value was £1,576 million as of 31 December 2020. Within this balance, the Loans and advances to customers includes a certain loan portfolio which is a concentration of similar, non-traded assets. The fair value of these assets is determined using discounted cash flow techniques. The discount rates are derived from market observable interest rates, a risk margin that reflects loan credit ratings and an incremental illiquidity premium based on historical spreads at origination on similar loans.
The principal considerations for our determination that performing procedures relating to the valuation of certain level 3 financial instrument assets is a critical audit matter are (i) there was significant judgment by management to determine the fair value of the level 3 financial instrument assets using valuation models which relied upon unobservable inputs, (ii) there was judgment required to evaluate the audit evidence obtained related to the valuation models and key assumptions including loan credit ratings, and (iii) the audit effort involved the use of professionals with specialised skill or knowledge.
Addressing the matter involved performing procedures and evaluating audit evidence in connection with forming our overall opinion on the consolidated financial statements. These procedures included testing the effectiveness of controls relating to the valuation of the financial instrument assets, including controls over the methodology and key assumptions including loan credit ratings. These procedures also included, among others, the involvement of professionals with specialised skill and knowledge to assist in reviewing the methodology, and assessing the reasonableness of key assumptions, including loan credit ratings.
/s/ PricewaterhouseCoopers LLP
London, United Kingdom
11 March 2021
We have served as the Company’s auditor since 1995.
CONSOLIDATED INCOME STATEMENTS
for the years ended 31 December 2020, 31 December 2019 and 31 December 2018
| | | | | | | | | | | | | | | | | | | | | | | |
| | | 2020 | | 2019 | | 2018 |
| Note | | £ million | | £ million | | £ million |
| Interest income | | | 13,866 | | | 16,098 | | | 16,216 | |
| Interest expense | | | (3,096) | | | (3,878) | | | (3,462) | |
| Net interest income | 5 | | 10,770 | | | 12,220 | | | 12,754 | |
| Fee and commission income | | | 1,924 | | | 2,363 | | | 2,497 | |
| Fee and commission expense | | | (909) | | | (1,027) | | | (1,228) | |
| Net fee and commission income | 6 | | 1,015 | | | 1,336 | | | 1,269 | |
| Net trading income | 7 | | 750 | | | 360 | | | 408 | |
| Other operating income | 8 | | 2,050 | | | 2,692 | | | 2,543 | |
| Other income | | | 3,815 | | | 4,388 | | | 4,220 | |
| Total income | | | 14,585 | | | 16,608 | | | 16,974 | |
| Regulatory provisions | 30 | | (414) | | | (2,190) | | | (1,956) | |
| Other operating expenses | | | (8,782) | | | (8,933) | | | (9,812) | |
| Total operating expenses | 9 | | (9,196) | | | (11,123) | | | (11,768) | |
| Impairment | 11 | | (4,060) | | | (1,362) | | | (926) | |
| Profit before tax – continuing operations | | | 1,329 | | | 4,123 | | | 4,280 | |
| Tax credit (expense) | 12 | | 137 | | | (1,287) | | | (1,377) | |
| Profit after tax – continuing operations | | | 1,466 | | | 2,836 | | | 2,903 | |
| Profit after tax – discontinued operations | 13 | | 0 | | | 0 | | | 1,314 | |
| Profit for the year | | | 1,466 | | | 2,836 | | | 4,217 | |
| | | | | | | |
| Profit attributable to ordinary shareholders | | | 1,023 | | | 2,515 | | | 3,907 | |
| Profit attributable to other equity holders | | | 417 | | | 281 | | | 275 | |
| Profit attributable to equity holders | | | 1,440 | | | 2,796 | | | 4,182 | |
| Profit attributable to non-controlling interests | | | 26 | | | 40 | | | 35 | |
| Profit for the year | | | 1,466 | | | 2,836 | | | 4,217 | |
The accompanying notes are an integral part of the financial statements.
STATEMENTS OF COMPREHENSIVE INCOME
for the years ended 31 December 2020, 31 December 2019 and 31 December 2018
| | | | | | | | | | | | | | | | | |
| The Group | 2020 | | 2019 | | 2018 |
| £ million | | £ million | | £ million |
| Profit for the year | 1,466 | | | 2,836 | | | 4,217 | |
| Other comprehensive income | | | | | |
| Items that will not subsequently be reclassified to profit or loss: | | | | | |
Post-retirement defined benefit scheme remeasurements1: | | | | | |
| Remeasurements before tax | 138 | | | (1,433) | | | 167 | |
| Tax | (25) | | | 316 | | | (47) | |
| 113 | | | (1,117) | | | 120 | |
| Movements in revaluation reserve in respect of equity shares held at fair value through other comprehensive income: | | | | | |
| Change in fair value | 0 | | | 0 | | | (98) | |
| Tax | (16) | | | 12 | | | 22 | |
| (16) | | | 12 | | | (76) | |
| Gains and losses attributable to own credit risk: | | | | | |
| (Losses) gains before tax | (75) | | | (419) | | | 533 | |
| Tax | 20 | | | 113 | | | (144) | |
| (55) | | | (306) | | | 389 | |
| Share of other comprehensive income of associates and joint ventures | 0 | | | 0 | | | 8 | |
| | | | | |
| Items that may subsequently be reclassified to profit or loss: | | | | | |
| Movements in revaluation reserve in respect of debt securities held at fair value through other comprehensive income: | | | | | |
| Change in fair value | 46 | | | (34) | | | (31) | |
| Income statement transfers in respect of disposals | (145) | | | (196) | | | (268) | |
| Income statement transfers in respect of impairment | 5 | | | (1) | | | 0 | |
| Tax | 74 | | | 72 | | | 115 | |
| (20) | | | (159) | | | (184) | |
| Movements in cash flow hedging reserve: | | | | | |
| Effective portion of changes in fair value taken to other comprehensive income | 709 | | | 1,166 | | | 91 | |
| Net income statement transfers | (727) | | | (580) | | | (691) | |
| Tax | (31) | | | (140) | | | 137 | |
| (49) | | | 446 | | | (463) | |
| Movements in foreign currency translation reserve: | | | | | |
| Currency translation differences (tax: £NaN) | 0 | | | (2) | | | (15) | |
| Transfers to income statement (tax: £NaN) | 0 | | | 0 | | | 108 | |
| 0 | | | (2) | | | 93 | |
| Other comprehensive income for the year, net of tax | (27) | | | (1,126) | | | (113) | |
| Total comprehensive income for the year | 1,439 | | | 1,710 | | | 4,104 | |
| | | | | |
| Total comprehensive income attributable to ordinary shareholders arising from continuing operations | 996 | | | 1,389 | | | 2,450 | |
Total comprehensive income attributable to ordinary shareholders arising from discontinued operations1 | 0 | | | 0 | | | 1,344 | |
| Total comprehensive income attributable to ordinary shareholders | 996 | | | 1,389 | | | 3,794 | |
| Total comprehensive income attributable to other equity holders | 417 | | | 281 | | | 275 | |
| Total comprehensive income attributable to equity holders | 1,413 | | | 1,670 | | | 4,069 | |
| Total comprehensive income attributable to non-controlling interests | 26 | | | 40 | | | 35 | |
| Total comprehensive income for the year | 1,439 | | | 1,710 | | | 4,104 | |
1 2018 included post-retirement defined benefit scheme remeasurements in the Group’s discontinued operations of £37 million (£30 million after tax).
The accompanying notes are an integral part of the financial statements.
STATEMENTS OF COMPREHENSIVE INCOME
for the years ended 31 December 2020, 31 December 2019 and 31 December 2018
| | | | | | | | | | | | | | | | | |
| The Bank | 2020 | | 2019 | | 2018 |
| £ million | | £ million | | £ million |
| Profit for the year | 641 | | | 2,446 | | | 6,141 | |
| Other comprehensive income: | | | | | |
| Items that will not subsequently be reclassified to profit or loss: | | | | | |
| Post-retirement defined benefit scheme remeasurements: | | | | | |
| Remeasurements before tax | (133) | | | (776) | | | (206) | |
| Tax | 31 | | | 200 | | | 44 | |
| (102) | | | (576) | | | (162) | |
| Movements in revaluation reserve in respect of equity shares held at fair value through other comprehensive income: | | | | | |
| Change in fair value | 0 | | | 0 | | | (102) | |
| Tax | 4 | | | 12 | | | 0 | |
| 4 | | | 12 | | | (102) | |
| Gains and losses attributable to own credit risk: | | | | | |
| (Losses) gains before tax | (75) | | | (419) | | | 533 | |
| Tax | 20 | | | 113 | | | (144) | |
| (55) | | | (306) | | | 389 | |
| Items that may subsequently be reclassified to profit or loss: | | | | | |
| Movements in revaluation reserve in respect of debt securities held at fair value through other comprehensive income: | | | | | |
| Change in fair value | 12 | | | (50) | | | (58) | |
| Income statement transfers in respect of disposals | (138) | | | (201) | | | (258) | |
| Income statement transfers in respect of impairment | 1 | | | (1) | | | 0 | |
| Tax | 36 | | | 74 | | | 114 | |
| (89) | | | (178) | | | (202) | |
| Movements in cash flow hedging reserve: | | | | | |
| Effective portion of changes in fair value taken to other comprehensive income | 85 | | | 892 | | | 255 | |
| Net income statement transfers | (355) | | | (448) | | | (628) | |
| Tax | 30 | | | (105) | | | 87 | |
| (240) | | | 339 | | | (286) | |
| Movements in foreign currency translation reserve: | | | | | |
| Currency translation differences (tax: £NaN) | 1 | | | 6 | | | 2 | |
| Transfers to income statement (tax: £NaN) | 0 | | | 0 | | | (84) | |
| 1 | | | 6 | | | (82) | |
| Other comprehensive income for the year, net of tax | (481) | | | (703) | | | (445) | |
| Total comprehensive income for the year | 160 | | | 1,743 | | | 5,696 | |
| | | | | |
| Total comprehensive income attributable to ordinary shareholders | (257) | | | 1,462 | | | 5,421 | |
| Total comprehensive income attributable to other equity holders | 417 | | | 281 | | | 275 | |
| Total comprehensive income for the year | 160 | | | 1,743 | | | 5,696 | |
The accompanying notes are an integral part of the financial statements.
BALANCE SHEETS
at 31 December 2020 and 31 December 2019
| | | | | | | | | | | | | | | | | | | | | | | | | | | | | |
| | | The Group | | The Bank |
| | | 2020 | | 2019 | | 2020 | | 2019 |
| Note | | £ million | | £ million | | £ million | | £ million |
| Assets | | | | | | | | | |
| Cash and balances at central banks | | | 49,888 | | | 38,880 | | | 45,753 | | | 35,741 | |
| Items in the course of collection from banks | | | 300 | | | 292 | | | 257 | | | 252 | |
| Financial assets at fair value through profit or loss | 14 | | 1,674 | | | 2,284 | | | 1,724 | | | 703 | |
| Derivative financial instruments | 15 | | 8,341 | | | 8,494 | | | 12,595 | | | 13,638 | |
| Loans and advances to banks | 16 | | 5,950 | | | 4,852 | | | 5,656 | | | 4,453 | |
| Loans and advances to customers | 16 | | 480,141 | | | 474,470 | | | 178,269 | | | 177,569 | |
| Debt securities | 16 | | 5,137 | | | 5,325 | | | 4,315 | | | 5,241 | |
| Due from fellow Lloyds Banking Group undertakings | 16 | | 738 | | | 1,854 | | | 128,771 | | | 202,277 | |
| Financial assets at amortised cost | | | 491,966 | | | 486,501 | | | 317,011 | | | 389,540 | |
| Financial assets at fair value through other comprehensive income | 18 | | 27,260 | | | 24,617 | | | 24,647 | | | 22,160 | |
| Goodwill | 19 | | 470 | | | 474 | | | 0 | | | 0 | |
| Other intangible assets | 20 | | 4,112 | | | 3,781 | | | 2,960 | | | 2,618 | |
| Property, plant and equipment | 21 | | 8,317 | | | 9,467 | | | 3,098 | | | 3,594 | |
| Current tax recoverable | | | 537 | | | 4 | | | 440 | | | 7 | |
| Deferred tax assets | 29 | | 3,468 | | | 3,366 | | | 2,109 | | | 2,029 | |
| Investment in subsidiary undertakings | 22 | | 0 | | | 0 | | | 33,353 | | | 34,084 | |
| Retirement benefit assets | 28 | | 1,714 | | | 681 | | | 765 | | | 386 | |
| Other assets | 23 | | 1,892 | | | 2,527 | | | 754 | | | 998 | |
| Total assets | | | 599,939 | | | 581,368 | | | 445,466 | | | 505,750 | |
The accompanying notes are an integral part of the financial statements.
BALANCE SHEETS
at 31 December 2020 and 31 December 2019
| | | | | | | | | | | | | | | | | | | | | | | | | | | | | |
| Equity and liabilities | | | The Group | | The Bank |
| | 2020 | | 2019 | | 2020 | | 2019 |
| Note | | £ million | | £ million | | £ million | | £ million |
| Liabilities | | | | | | | | | |
| Deposits from banks | | | 24,997 | | | 23,593 | | | 10,304 | | | 7,122 | |
| Customer deposits | | | 434,569 | | | 396,839 | | | 264,473 | | | 239,762 | |
| Due to fellow Lloyds Banking Group undertakings | | | 6,875 | | | 4,893 | | | 39,836 | | | 109,771 | |
| Items in course of transmission to banks | | | 302 | | | 354 | | | 199 | | | 198 | |
| Financial liabilities at fair value through profit or loss | 24 | | 6,831 | | | 7,702 | | | 7,907 | | | 7,697 | |
| Derivative financial instruments | 15 | | 8,228 | | | 9,831 | | | 11,072 | | | 14,211 | |
| Notes in circulation | | | 1,305 | | | 1,079 | | | 0 | | | 0 | |
| Debt securities in issue | 25 | | 59,293 | | | 76,431 | | | 48,109 | | | 61,509 | |
| Other liabilities | 27 | | 5,181 | | | 5,600 | | | 2,573 | | | 2,792 | |
| Retirement benefit obligations | 28 | | 245 | | | 257 | | | 106 | | | 124 | |
| Current tax liabilities | | | 31 | | | 166 | | | 0 | | | 0 | |
| Other provisions | 30 | | 1,722 | | | 3,138 | | | 968 | | | 1,436 | |
| Subordinated liabilities | 31 | | 9,242 | | | 12,586 | | | 7,751 | | | 9,909 | |
| Total liabilities | | | 558,821 | | | 542,469 | | | 393,298 | | | 454,531 | |
| Equity | | | | | | | | | |
| Share capital | 32 | | 1,574 | | | 1,574 | | | 1,574 | | | 1,574 | |
| Share premium account | 33 | | 600 | | | 600 | | | 600 | | | 600 | |
| Other reserves | 34 | | 7,181 | | | 7,250 | | | 1,382 | | | 1,710 | |
| Retained profits | 35 | | 25,750 | | | 24,549 | | | 42,677 | | | 42,470 | |
| Shareholders’ equity | | | 35,105 | | | 33,973 | | | 46,233 | | | 46,354 | |
| Other equity instruments | 36 | | 5,935 | | | 4,865 | | | 5,935 | | | 4,865 | |
| Total equity excluding non-controlling interests | | | 41,040 | | | 38,838 | | | 52,168 | | | 51,219 | |
| Non-controlling interests | | | 78 | | | 61 | | | 0 | | | 0 | |
| Total equity | | | 41,118 | | | 38,899 | | | 52,168 | | | 51,219 | |
| Total equity and liabilities | | | 599,939 | | | 581,368 | | | 445,466 | | | 505,750 | |
The accompanying notes are an integral part of the financial statements.
STATEMENTS OF CHANGES IN EQUITY
for the years ended 31 December 2020, 31 December 2019 and 31 December 2018
| | | | | | | | | | | | | | | | | | | | | | | | | | | | | | | | | | | | | | | | | |
| The Group | Attributable to ordinary shareholders | | | | | | |
Share
capital and
premium | | Other
reserves | | Retained
profits | | Total | | Other
equity
instruments | | Non-
controlling
interests | | Total |
| £ million | | £ million | | £ million | | £ million | | £ million | | £ million | | £ million |
| At 1 January 2020 | 2,174 | | | 7,250 | | | 24,549 | | | 33,973 | | | 4,865 | | | 61 | | | 38,899 | |
| Comprehensive income | | | | | | | | | | | | | |
| Profit for the year | — | | | — | | | 1,023 | | | 1,023 | | | 417 | | | 26 | | | 1,466 | |
| Other comprehensive income | | | | | | | | | | | | | |
| Post-retirement defined benefit scheme remeasurements, net of tax | — | | | — | | | 113 | | | 113 | | | — | | | — | | | 113 | |
| Movements in revaluation reserve in respect of financial assets held at fair value through other comprehensive income, net of tax: | | | | | | | | | | | | | |
| Debt securities | — | | | (20) | | | — | | | (20) | | | — | | | — | | | (20) | |
| Equity shares | — | | | (16) | | | — | | | (16) | | | — | | | — | | | (16) | |
| Gains and losses attributable to own credit risk, net of tax | — | | | — | | | (55) | | | (55) | | | — | | | — | | | (55) | |
| Movements in cash flow hedging reserve, net of tax | — | | | (49) | | | — | | | (49) | | | — | | | — | | | (49) | |
| Currency translation differences (tax: £NaN) | — | | | 0 | | | — | | | 0 | | | — | | | — | | | 0 | |
| Total other comprehensive income | — | | | (85) | | | 58 | | | (27) | | | — | | | — | | | (27) | |
Total comprehensive income1 | — | | | (85) | | | 1,081 | | | 996 | | | 417 | | | 26 | | | 1,439 | |
| Transactions with owners | | | | | | | | | | | | | |
| Dividends | — | | | — | | | — | | | — | | | — | | | (7) | | | (7) | |
| Distributions on other equity instruments | — | | | — | | | — | | | — | | | (417) | | | — | | | (417) | |
| Issue of other equity instruments (note 36) | — | | | — | | | — | | | — | | | 1,070 | | | — | | | 1,070 | |
| Capital contributions received | — | | | — | | | 140 | | | 140 | | | — | | | — | | | 140 | |
| Return of capital contributions | — | | | — | | | (4) | | | (4) | | | — | | | — | | | (4) | |
| Changes in non-controlling interests | — | | | — | | | — | | | — | | | — | | | (2) | | | (2) | |
| Total transactions with owners | — | | | — | | | 136 | | | 136 | | | 653 | | | (9) | | | 780 | |
| Realised gains and losses on equity shares held at fair value through other comprehensive income | — | | | 16 | | | (16) | | | — | | | — | | | — | | | 0 | |
| At 31 December 2020 | 2,174 | | | 7,181 | | | 25,750 | | | 35,105 | | | 5,935 | | | 78 | | | 41,118 | |
1Total comprehensive income attributable to owners of the parent was £1,413 million (2019: £1,670 million; 2018: £4,069 million).
Further details of movements in the Group’s share capital and reserves are provided in notes 32, 33, 34, 35 and 36.
The accompanying notes are an integral part of the financial statements.
STATEMENTS OF CHANGES IN EQUITY
for the years ended 31 December 2020, 31 December 2019 and 31 December 2018
| | | | | | | | | | | | | | | | | | | | | | | | | | | | | | | | | | | | | | | | | |
| Attributable to ordinary shareholders | | | | | | |
| The Group | Share
capital and
premium | | Other
reserves | | Retained
profits | | Total | | Other
equity
instruments | | Non-
controlling
interests | | Total |
| £ million | | £ million | | £ million | | £ million | | £ million | | £ million | | £ million |
| At 1 January 2019 | 2,174 | | | 6,965 | | | 27,321 | | | 36,460 | | | 3,217 | | | 73 | | | 39,750 | |
| Comprehensive income | | | | | | | | | | | | | |
| Profit for the year | — | | | — | | | 2,515 | | | 2,515 | | | 281 | | | 40 | | | 2,836 | |
| Other comprehensive income | | | | | | | | | | | | | |
| Post-retirement defined benefit scheme remeasurements, net of tax | — | | | — | | | (1,117) | | | (1,117) | | | — | | | — | | | (1,117) | |
| Movements in revaluation reserve in respect of financial assets held at fair value through other comprehensive income, net of tax: | | | | | | | | | | | | | |
| Debt securities | — | | | (159) | | | — | | | (159) | | | — | | | — | | | (159) | |
| Equity shares | — | | | 12 | | | — | | | 12 | | | — | | | — | | | 12 | |
| Gains and losses attributable to own credit risk, net of tax | — | | | — | | | (306) | | | (306) | | | — | | | — | | | (306) | |
| Movements in cash flow hedging reserve, net of tax | — | | | 446 | | | — | | | 446 | | | — | | | — | | | 446 | |
| Currency translation differences (tax: £NaN) | — | | | (2) | | | — | | | (2) | | | — | | | — | | | (2) | |
| Total other comprehensive income | — | | | 297 | | | (1,423) | | | (1,126) | | | — | | | — | | | (1,126) | |
| Total comprehensive income | — | | | 297 | | | 1,092 | | | 1,389 | | | 281 | | | 40 | | | 1,710 | |
| Transactions with owners | | | | | | | | | | | | | |
| Dividends (note 37) | — | | | — | | | (4,100) | | | (4,100) | | | — | | | (38) | | | (4,138) | |
| Distributions on other equity instruments | — | | | — | | | — | | | — | | | (281) | | | — | | | (281) | |
| Issue of other equity instruments (note 36) | — | | | — | | | — | | | — | | | 1,648 | | | — | | | 1,648 | |
| Capital contributions received | — | | | — | | | 229 | | | 229 | | | — | | | — | | | 229 | |
| Return of capital contributions | — | | | — | | | (5) | | | (5) | | | — | | | — | | | (5) | |
| Changes in non-controlling interests | — | | | — | | | — | | | — | | | — | | | (14) | | | (14) | |
| Total transactions with owners | — | | | — | | | (3,876) | | | (3,876) | | | 1,367 | | | (52) | | | (2,561) | |
| Realised gains and losses on equity shares held at fair value through other comprehensive income | — | | | (12) | | | 12 | | | — | | | — | | | — | | | 0 | |
| At 31 December 2019 | 2,174 | | | 7,250 | | | 24,549 | | | 33,973 | | | 4,865 | | | 61 | | | 38,899 | |
The accompanying notes are an integral part of the financial statements.
STATEMENTS OF CHANGES IN EQUITY
for the years ended 31 December 2020, 31 December 2019 and 31 December 2018
| | | | | | | | | | | | | | | | | | | | | | | | | | | | | | | | | | | | | | | | | |
| Attributable to ordinary shareholders | | | | | | |
| The Group | Share
capital and
premium | | Other
reserves | | Retained
profits | | Total | | Other
equity
instruments | | Non-
controlling
interests | | Total |
| £ million | | £ million | | £ million | | £ million | | £ million | | £ million | | £ million |
| At 1 January 2018 | 2,174 | | | 7,484 | | | 36,749 | | | 46,407 | | | 3,217 | | | 379 | | | 50,003 | |
| Comprehensive income | | | | | | | | | | | | | |
| Profit for the year | — | | | — | | | 3,907 | | | 3,907 | | | 275 | | | 35 | | | 4,217 | |
| Other comprehensive income | | | | | | | | | | | | | |
| Post-retirement defined benefit scheme remeasurements, net of tax | — | | | — | | | 120 | | | 120 | | | — | | | — | | | 120 | |
| Share of other comprehensive income of associates and joint ventures | — | | | — | | | 8 | | | 8 | | | — | | | — | | | 8 | |
| Movements in revaluation reserve in respect of financial assets held at fair value through other comprehensive income, net of tax: | | | | | | | | | | | | | |
| Debt securities | — | | | (184) | | | — | | | (184) | | | — | | | — | | | (184) | |
| Equity shares | — | | | (76) | | | — | | | (76) | | | — | | | — | | | (76) | |
| Gains and losses attributable to own credit risk, net of tax | — | | | — | | | 389 | | | 389 | | | — | | | — | | | 389 | |
| Movements in cash flow hedging reserve, net of tax | — | | | (463) | | | — | | | (463) | | | — | | | — | | | (463) | |
| Currency translation differences (tax: £NaN) | — | | | 93 | | | — | | | 93 | | | — | | | — | | | 93 | |
| Total other comprehensive income | — | | | (630) | | | 517 | | | (113) | | | — | | | — | | | (113) | |
| Total comprehensive income | — | | | (630) | | | 4,424 | | | 3,794 | | | 275 | | | 35 | | | 4,104 | |
| Transactions with owners | | | | | | | | | | | | | |
| Dividends (note 37) | — | | | — | | | (11,022) | | | (11,022) | | | — | | | (36) | | | (11,058) | |
| Distributions on other equity instruments | — | | | — | | | — | | | — | | | (275) | | | — | | | (275) | |
| Capital repayment to parent | — | | | — | | | (2,975) | | | (2,975) | | | — | | | — | | | (2,975) | |
| Capital contributions received | — | | | — | | | 265 | | | 265 | | | — | | | — | | | 265 | |
| Return of capital contributions | — | | | — | | | (9) | | | (9) | | | — | | | — | | | (9) | |
| Changes in non-controlling interests | — | | | — | | | — | | | — | | | — | | | (305) | | | (305) | |
| Total transactions with owners | 0 | | | — | | | (13,741) | | | (13,741) | | | (275) | | | (341) | | | (14,357) | |
| Realised gains and losses on equity shares held at fair value through other comprehensive income | — | | | 111 | | | (111) | | | — | | | — | | | — | | | 0 | |
| At 31 December 2018 | 2,174 | | | 6,965 | | | 27,321 | | | 36,460 | | | 3,217 | | | 73 | | | 39,750 | |
The accompanying notes are an integral part of the financial statements.
STATEMENTS OF CHANGES IN EQUITY
for the years ended 31 December 2020, 31 December 2019 and 31 December 2018
| | | | | | | | | | | | | | | | | | | | | | | | | | | | | | | | | | | |
| Attributable to ordinary shareholders | | | | |
| The Bank | Share
capital and
premium | | Other
reserves | | Retained
profits | | Total | | Other
equity
instruments | | Total |
| £ million | | £ million | | £ million | | £ million | | £ million | | £ million |
| At 1 January 2020 | 2,174 | | | 1,710 | | | 42,470 | | | 46,354 | | | 4,865 | | | 51,219 | |
| Comprehensive income | | | | | | | | | | | |
| Profit for the year | — | | | — | | | 224 | | | 224 | | | 417 | | | 641 | |
| Other comprehensive income | | | | | | | | | | | |
| Post-retirement defined benefit scheme remeasurements, net of tax | — | | | — | | | (102) | | | (102) | | | — | | | (102) | |
| Movements in revaluation reserve in respect of financial assets held at fair value through other comprehensive income, net of tax: | | | | | | | | | | | |
| Debt securities | — | | | (89) | | | — | | | (89) | | | — | | | (89) | |
| Equity shares | — | | | 4 | | | — | | | 4 | | | — | | | 4 | |
| Gains and losses attributable to own credit risk, net of tax | — | | | — | | | (55) | | | (55) | | | — | | | (55) | |
| Movements in cash flow hedging reserve, net of tax | — | | | (240) | | | — | | | (240) | | | — | | | (240) | |
| Currency translation differences (tax: £NaN) | — | | | 1 | | | — | | | 1 | | | — | | | 1 | |
| Total other comprehensive income | — | | | (324) | | | (157) | | | (481) | | | — | | | (481) | |
Total comprehensive income1 | — | | | (324) | | | 67 | | | (257) | | | 417 | | | 160 | |
| Transactions with owners | | | | | | | | | | | |
| | | | | | | | | | | |
| Distributions on other equity instruments | — | | | — | | | — | | | — | | | (417) | | | (417) | |
| Issue of other equity instruments (note 36) | — | | | — | | | — | | | — | | | 1,070 | | | 1,070 | |
| Capital contributions received | — | | | — | | | 140 | | | 140 | | | — | | | 140 | |
| Return of capital contributions | — | | | — | | | (4) | | | (4) | | | — | | | (4) | |
| Total transactions with owners | — | | | — | | | 136 | | | 136 | | | 653 | | | 789 | |
| Realised gains and losses on equity shares held at fair value through other comprehensive income | — | | | (4) | | | 4 | | | — | | | — | | | 0 | |
| At 31 December 2020 | 2,174 | | | 1,382 | | | 42,677 | | | 46,233 | | | 5,935 | | | 52,168 | |
1Total comprehensive income attributable to owners of the parent was £160 million (2019:£1,743 million; 2018: £5,696 million).
The accompanying notes are an integral part of the financial statements.
STATEMENTS OF CHANGES IN EQUITY
for the years ended 31 December 2020, 31 December 2019 and 31 December 2018
| | | | | | | | | | | | | | | | | | | | | | | | | | | | | | | | | | | |
| Attributable to ordinary shareholders | | | | |
| The Bank | Share
capital and
premium | | Other
reserves | | Retained
profits | | Total | | Other
equity
instruments | | Total |
| £ million | | £ million | | £ million | | £ million | | £ million | | £ million |
| At 1 January 2018 | 2,174 | | | 2,071 | | | 52,843 | | | 57,088 | | | 3,217 | | | 60,305 | |
| Comprehensive income | | | | | | | | | | | |
| Profit for the year | — | | | — | | | 5,866 | | | 5,866 | | | 275 | | | 6,141 | |
| Other comprehensive income | | | | | | | | | | | |
| Post-retirement defined benefit scheme remeasurements, net of tax | — | | | — | | | (162) | | | (162) | | | — | | | (162) | |
| Movements in revaluation reserve in respect of financial assets held at fair value through other comprehensive income, net of tax: | | | | | | | | | | | |
| Debt securities | — | | | (202) | | | — | | | (202) | | | — | | | (202) | |
| Equity shares | — | | | (102) | | | — | | | (102) | | | — | | | (102) | |
| Gains and losses attributable to own credit risk, net of tax | — | | | — | | | 389 | | | 389 | | | — | | | 389 | |
| Movements in cash flow hedging reserve, net of tax | — | | | (286) | | | — | | | (286) | | | — | | | (286) | |
| Currency translation differences (tax: £NaN) | — | | | (82) | | | — | | | (82) | | | — | | | (82) | |
| Total other comprehensive income | — | | | (672) | | | 227 | | | (445) | | | — | | | (445) | |
| Total comprehensive income | — | | | (672) | | | 6,093 | | | 5,421 | | | 275 | | | 5,696 | |
| Transactions with owners | | | | | | | | | | | |
| Dividends (note 37) | — | | | — | | | (11,022) | | | (11,022) | | | — | | | (11,022) | |
| Distributions on other equity instruments | — | | | — | | | — | | | — | | | (275) | | | (275) | |
| Capital repayment to parent | — | | | — | | | (2,975) | | | (2,975) | | | — | | | (2,975) | |
| Capital contributions received | — | | | — | | | 265 | | | 265 | | | — | | | 265 | |
| Return of capital contributions | — | | | — | | | (9) | | | (9) | | | — | | | (9) | |
| Total transactions with owners | 0 | | | — | | | (13,741) | | | (13,741) | | | (275) | | | (14,016) | |
| Realised gains and losses on equity shares held at fair value through other comprehensive income | — | | | 144 | | | (144) | | | — | | | — | | | 0 | |
| At 31 December 2018 | 2,174 | | | 1,543 | | | 45,051 | | | 48,768 | | | 3,217 | | | 51,985 | |
| Comprehensive income | | | | | | | | | | | |
| Profit for the year | — | | | — | | | 2,165 | | | 2,165 | | | 281 | | | 2,446 | |
| Other comprehensive income | | | | | | | | | | | |
| Post-retirement defined benefit scheme remeasurements, net of tax | — | | | — | | | (576) | | | (576) | | | — | | | (576) | |
| Movements in revaluation reserve in respect of financial assets held at fair value through other comprehensive income, net of tax: | | | | | | | | | | | |
| Debt securities | — | | | (178) | | | — | | | (178) | | | — | | | (178) | |
| Equity shares | — | | | 12 | | | — | | | 12 | | | — | | | 12 | |
| Gains and losses attributable to own credit risk, net of tax | — | | | — | | | (306) | | | (306) | | | — | | | (306) | |
| Movements in cash flow hedging reserve, net of tax | — | | | 339 | | | — | | | 339 | | | — | | | 339 | |
| Currency translation differences (tax: £NaN) | — | | | 6 | | | — | | | 6 | | | — | | | 6 | |
| Total other comprehensive income | — | | | 179 | | | (882) | | | (703) | | | — | | | (703) | |
| Total comprehensive income | — | | | 179 | | | 1,283 | | | 1,462 | | | 281 | | | 1,743 | |
| Transactions with owners | | | | | | | | | | | |
| Dividends (note 37) | — | | | — | | | (4,100) | | | (4,100) | | | — | | | (4,100) | |
| Distributions on other equity instruments | 0 | | | 0 | | | 0 | | | 0 | | | (281) | | | (281) | |
| Issue of other equity instruments (note 36) | — | | | — | | | — | | | — | | | 1,648 | | | 1,648 | |
| Capital contributions received | — | | | — | | | 229 | | | 229 | | | — | | | 229 | |
| Return of capital contributions | — | | | — | | | (5) | | | (5) | | | — | | | (5) | |
| Total transactions with owners | — | | | — | | | (3,876) | | | (3,876) | | | 1,367 | | | (2,509) | |
| Realised gains and losses on equity shares held at fair value through other comprehensive income | — | | | (12) | | | 12 | | | — | | | — | | | 0 | |
| At 31 December 2019 | 2,174 | | | 1,710 | | | 42,470 | | | 46,354 | | | 4,865 | | | 51,219 | |
The accompanying notes are an integral part of the financial statements.
CASH FLOW STATEMENTS
for the years ended 31 December 2020, 31 December 2019 and 31 December 2018
| | | | | | | | | | | | | | | | | | | | | | | | | | | | | | | | | | | | | | | | | |
| | | The Group | | The Bank |
| | | 2020 | | 2019 | | 2018 | | 2020 | | 2019 | | 2018 |
| Note | | £ million | | £ million | | £ million | | £ million | | £ million | | £ million |
Profit before tax1 | | | 1,329 | | | 4,123 | | | 5,660 | | | 444 | | | 3,091 | | | 6,898 | |
| Adjustments for: | | | | | | | | | | | | | |
| Change in operating assets | 46(a) | | (6,856) | | | 12,904 | | | 34,184 | | | 71,662 | | | (31,543) | | | 46,534 | |
| Change in operating liabilities | 46(b) | | 17,841 | | | (5,630) | | | (61,433) | | | (61,993) | | | 39,301 | | | (76,719) | |
| Non-cash and other items | 46(c) | | 3,484 | | | 1,469 | | | (743) | | | 1,820 | | | (950) | | | (3,610) | |
| Tax paid | | | (616) | | | (1,232) | | | (1,616) | | | (194) | | | (596) | | | (393) | |
| Net cash provided by (used in) operating activities | | | 15,182 | | | 11,634 | | | (23,948) | | | 11,739 | | | 9,303 | | | (27,290) | |
| Cash flows from investing activities | | | | | | | | | | | | | |
| Purchase of financial assets | | | (8,539) | | | (9,108) | | | (12,309) | | | (7,793) | | | (7,748) | | | (11,699) | |
| Proceeds from sale and maturity of financial assets | | | 6,225 | | | 8,847 | | | 26,863 | | | 5,599 | | | 8,664 | | | 25,927 | |
| Purchase of fixed assets | | | (2,815) | | | (3,552) | | | (3,450) | | | (1,186) | | | (1,638) | | | (1,486) | |
| Proceeds from sale of fixed assets | | | 1,063 | | | 1,258 | | | 1,262 | | | 12 | | | 91 | | | 113 | |
| Additional capital injections to subsidiaries | | | 0 | | | 0 | | | 0 | | | (1,055) | | | (1,766) | | | (13) | |
| | | | | | | | | | | | | |
| Dividends received from subsidiaries | | | 0 | | | 0 | | | 0 | | | 44 | | | 1,331 | | | 4,867 | |
| Distributions on other equity instruments received | | | 0 | | | 0 | | | 0 | | | 167 | | | 103 | | | 101 | |
| Capital repayments and redemptions | | | 0 | | | 0 | | | 0 | | | 1,801 | | | 212 | | | 210 | |
| Acquisition of businesses, net of cash acquired | 46(e) | | 0 | | | 0 | | | (26) | | | 0 | | | 0 | | | (98) | |
| Disposal of businesses, net of cash disposed | 46(f) | | 0 | | | 107 | | | 8,604 | | | 0 | | | 20 | | | 7,704 | |
| Net cash (used in) provided by investing activities | | | (4,066) | | | (2,448) | | | 20,944 | | | (2,411) | | | (731) | | | 25,626 | |
| Cash flows from financing activities | | | | | | | | | | | | | |
| Dividends paid to ordinary shareholders | | | 0 | | | (4,100) | | | (11,022) | | | 0 | | | (4,100) | | | (11,022) | |
| Distributions on other equity instruments | | | (417) | | | (281) | | | (275) | | | (417) | | | (281) | | | (275) | |
| Dividends paid to non-controlling interests | | | (7) | | | (38) | | | (36) | | | 0 | | | 0 | | | 0 | |
| Return of capital contributions | | | (4) | | | (5) | | | (9) | | | (4) | | | (5) | | | (9) | |
| Interest paid on subordinated liabilities | | | (852) | | | (906) | | | (1,022) | | | (759) | | | (674) | | | (659) | |
| Proceeds from issue of subordinated liabilities | | | 303 | | | 780 | | | 201 | | | 496 | | | 780 | | | 0 | |
| Proceeds from issue of other equity instruments | | | 1,070 | | | 1,648 | | | 0 | | | 1,070 | | | 1,648 | | | 0 | |
| Return of capital to parent company | | | 0 | | | 0 | | | (2,975) | | | 0 | | | 0 | | | (2,975) | |
| Repayment of subordinated liabilities | | | (4,156) | | | (762) | | | (2,256) | | | (2,726) | | | (184) | | | 0 | |
| Borrowings from parent company | | | 4,799 | | | 916 | | | 9,860 | | | 4,799 | | | 916 | | | 9,860 | |
| Repayments to parent company | | | (1,403) | | | (7,357) | | | (10,354) | | | (1,403) | | | (7,357) | | | (10,354) | |
| Interest paid on borrowing from parent company | | | (98) | | | (187) | | | (370) | | | (98) | | | (187) | | | (370) | |
| Net cash (used in) provided by financing activities | | (765) | | | (10,292) | | | (18,258) | | | 958 | | | (9,444) | | | (15,804) | |
| Effect of exchange rate changes on cash and cash equivalents | | | 1 | | | (3) | | | 3 | | | 0 | | | 0 | | | 2 | |
| Change in cash and cash equivalents | | | 10,352 | | | (1,109) | | | (21,259) | | | 10,286 | | | (872) | | | (17,466) | |
| Cash and cash equivalents at beginning of year | | | 38,614 | | | 39,723 | | | 60,982 | | | 37,782 | | | 38,654 | | | 56,120 | |
| Cash and cash equivalents at end of year | 46(d) | | 48,966 | | | 38,614 | | | 39,723 | | | 48,068 | | | 37,782 | | | 38,654 | |
1The Group profit before tax in 2018 comprised £4,280 million in respect of continuing operations and £1,380 million in respect of discontinued operations.
The accompanying notes are an integral part of the financial statements.
NOTES TO THE ACCOUNTS
for the year ended 31 December 2020
1 BASIS OF PREPARATION
These financial statements have been prepared in accordance with International Financial Reporting Standards (IFRS). IFRS comprises accounting standards prefixed IFRS issued by the International Accounting Standards Board (IASB) and those prefixed IAS issued by the IASB’s predecessor body as well as interpretations issued by the IFRS Interpretations Committee and its predecessor body. On adoption of IFRS 9 in 2018, the Bank (Lloyds Bank plc) and the Group (the Bank and its subsidiary undertakings) elected to continue applying hedge accounting under IAS 39.
The financial information has been prepared under the historical cost convention, as modified by the revaluation of investment properties, financial assets measured at fair value through other comprehensive income, trading securities and certain other financial assets and liabilities at fair value through profit or loss and all derivative contracts.
The directors consider that it is appropriate to continue to adopt the going concern basis in preparing the financial statements. In reaching this assessment, the directors have considered the implications of the COVID-19 pandemic upon the Group's performance and projected funding and capital position and have also taken into account the impact of further stress scenarios. On this basis, the directors are satisfied that the Group will maintain adequate levels of funding and capital for the foreseeable future.
Details of those IFRS pronouncements which will be relevant to the Group but which were not effective at 31 December 2020 and which have not been applied in preparing these financial statements are given in note 47.
In 2019 the Group adopted IFRS 16 and amendments to IAS 12 and early-adopted the hedge accounting amendments Interest Rate Benchmark Reform issued by the IASB.
2 ACCOUNTING POLICIES
The accounting policies are set out below. These accounting policies have been applied consistently.
(A)Consolidation
The assets, liabilities and results of Group undertakings (including structured entities) are included in the financial statements on the basis of accounts made up to the reporting date. Group undertakings include subsidiaries, associates and joint ventures.
(1)Subsidiaries
Subsidiaries are entities controlled by the Group. The Group controls an entity when it has power over the entity, is exposed to, or has rights to, variable returns from its involvement with the entity, and has the ability to affect those returns through the exercise of its power. This generally accompanies a shareholding of more than one half of the voting rights although in certain circumstances a holding of less than one half of the voting rights may still result in the ability of the Group to exercise control. The existence and effect of potential voting rights that are currently exercisable or convertible are considered when assessing whether the Group controls another entity. The Group reassesses whether or not it controls an entity if facts and circumstances indicate that there are changes to any of the above elements. Subsidiaries are fully consolidated from the date on which control is transferred to the Group; they are de-consolidated from the date that control ceases.
Structured entities are entities that are designed so that their activities are not governed by way of voting rights. In assessing whether the Group has power over such entities in which it has an interest, the Group considers factors such as the purpose and design of the entity; its practical ability to direct the relevant activities of the entity; the nature of the relationship with the entity; and the size of its exposure to the variability of returns of the entity.
The treatment of transactions with non-controlling interests depends on whether, as a result of the transaction, the Group loses control of the subsidiary. Changes in the parent’s ownership interest in a subsidiary that do not result in a loss of control are accounted for as equity transactions; any difference between the amount by which the non-controlling interests are adjusted and the fair value of the consideration paid or received is recognised directly in equity and attributed to the owners of the parent entity. Where the Group loses control of the subsidiary, at the date when control is lost the amount of any non-controlling interest in that former subsidiary is derecognised and any investment retained in the former subsidiary is remeasured to its fair value; the gain or loss that is recognised in profit or loss on the partial disposal of the subsidiary includes the gain or loss on the remeasurement of the retained interest.
Intercompany transactions, balances and unrealised gains and losses on transactions between Group companies are eliminated.
The acquisition method of accounting is used to account for business combinations by the Group. The consideration for the acquisition of a subsidiary is the fair value of the assets transferred, the liabilities incurred and the equity interests issued by the Group. The consideration includes the fair value of any asset or liability resulting from a contingent consideration arrangement. Acquisition related costs are expensed as incurred except those relating to the issuance of debt instruments (see (E)(4) below) or share capital (see (O) below). Identifiable assets acquired and liabilities assumed in a business combination are measured initially at their fair value at the acquisition date.
(2)Joint ventures and associates
Joint ventures are joint arrangements over which the Group has joint control with other parties and has rights to the net assets of the arrangements. Joint control is the contractually agreed sharing of control of an arrangement and only exists when decisions about the relevant activities require the unanimous consent of the parties sharing control. Associates are entities over which the Group has significant influence. Significant influence is the power to participate in the financial and operating policy decisions of the entity, but is not control or joint control of those policies, and is generally achieved through holding between 20 per cent and 50 per cent of the voting share capital of the entity.
The Group utilises the venture capital exemption for investments where significant influence or joint control is present and the business unit operates as a venture capital business. These investments are designated at initial recognition at fair value through profit or loss. Otherwise, the Group’s investments in joint ventures and associates are accounted for by the equity method of accounting.
NOTES TO THE ACCOUNTS
for the year ended 31 December 2020
2 ACCOUNTING POLICIES (continued)
(B)Goodwill
Goodwill arises on business combinations and represents the excess of the cost of an acquisition over the fair value of the Group’s share of the identifiable assets, liabilities and contingent liabilities acquired. Where the fair value of the Group’s share of the identifiable assets, liabilities and contingent liabilities of the acquired entity is greater than the cost of acquisition, the excess is recognised immediately in the income statement.
Goodwill is recognised as an asset at cost and is tested at least annually for impairment. If an impairment is identified the carrying value of the goodwill is written down immediately through the income statement and is not subsequently reversed. At the date of disposal of a subsidiary, the carrying value of attributable goodwill is included in the calculation of the profit or loss on disposal.
(C)Other intangible assets
Intangible assets which have been determined to have a finite useful life are amortised on a straight line basis over their estimated useful life as follows: up to 7 years for capitalised software; 10 to 15 years for brands and other intangible assets.
Intangible assets with finite useful lives are reviewed at each reporting date to assess whether there is any indication that they are impaired. If any such indication exists the recoverable amount of the asset is determined and in the event that the asset’s carrying amount is greater than its recoverable amount, it is written down immediately. Certain brands have been determined to have an indefinite useful life and are not amortised. Such intangible assets are reassessed annually to reconfirm that an indefinite useful life remains appropriate. In the event that an indefinite life is inappropriate a finite life is determined and an impairment review is performed on the asset.
(D)Revenue recognition
(1)Net interest income
Interest income and expense are recognised in the income statement using the effective interest method for all interest-bearing financial instruments, except for those classified at fair value through profit or loss. The effective interest method is a method of calculating the amortised cost of a financial asset or liability and of allocating the interest income or interest expense over the expected life of the financial instrument. The effective interest rate is the rate that exactly discounts the estimated future cash payments or receipts over the expected life of the financial instrument to the gross carrying amount of the financial asset (before adjusting for expected credit losses) or to the amortised cost of the financial liability, including early redemption fees, and related penalties, and premiums and discounts that are an integral part of the overall return. In the case of financial assets that are purchased or originated credit-impaired, the effective interest rate is the rate that discounts the estimated future cash flows to the amortised cost of the instrument. Direct incremental transaction costs related to the acquisition, issue or disposal of a financial instrument are also taken into account. Interest income from non-credit impaired financial assets is recognised by applying the effective interest rate to the gross carrying amount of the asset; for credit impaired financial assets, the effective interest rate is applied to the net carrying amount after deducting the allowance for expected credit losses. Impairment policies are set out in (H) below.
(2)Fee and commission income and expense
Fees and commissions receivable which are not an integral part of the effective interest rate are recognised as income as the Group fulfils its performance obligations. The Group’s principal performance obligations arising from contracts with customers are in respect of value added current accounts, credit cards and debit cards. These fees are received, and the Group’s provides the service, monthly; the fees are recognised in income on this basis. The Group also receives certain fees in respect of its asset finance business where the performance obligations are typically fulfilled towards the end of the customer contract; these fees are recognised in income on this basis. Where it is unlikely that the loan commitments will be drawn, loan commitment fees are recognised in fee and commission income over the life of the facility, rather than as an adjustment to the effective interest rate for loans expected to be drawn. Incremental costs incurred to generate fee and commission income are charged to fees and commissions expense as they are incurred.
(3)Other
Dividend income is recognised when the right to receive payment is established.
Revenue recognition policies specific to trading income are set out in (E)(3) below; those relating to leases are set out in (J)(1) below.
(E)Financial assets and liabilities
On initial recognition, financial assets are classified as measured at amortised cost, fair value through other comprehensive income or fair value through profit or loss, depending on the Group’s business model for managing the financial assets and whether the cash flows represent solely payments of principal and interest. The Group assesses its business models at a portfolio level based on its objectives for the relevant portfolio, how the performance of the portfolio is managed and reported, and the frequency of asset sales. Financial assets with embedded derivatives are considered in their entirety when considering their cash flow characteristics. The Group reclassifies financial assets when and only when its business model for managing those assets changes. A reclassification will only take place when the change is significant to the Group’s operations and will occur at a portfolio level and not for individual instruments; reclassifications are expected to be rare. Equity investments are measured at fair value through profit or loss unless the Group elects at initial recognition to account for the instruments at fair value through other comprehensive income. For these instruments, principally strategic investments, dividends are recognised in profit or loss but fair value gains and losses are not subsequently reclassified to profit or loss following derecognition of the investment.
The Group initially recognises loans and advances, deposits, debt securities in issue and subordinated liabilities when the Group becomes a party to the contractual provisions of the instrument. Regular way purchases and sales of securities and other financial assets and trading liabilities are recognised on trade date, being the date that the Group is committed to purchase or sell an asset.
Financial assets are derecognised when the contractual right to receive cash flows from those assets has expired or when the Group has transferred its contractual right to receive the cash flows from the assets and either: substantially all of the risks and rewards of ownership have been transferred; or the Group has neither retained nor transferred substantially all of the risks and rewards, but has transferred control.
Financial liabilities are derecognised when the obligation is discharged, cancelled or expires.
NOTES TO THE ACCOUNTS
for the year ended 31 December 2020
2 ACCOUNTING POLICIES (continued)
(1)Financial instruments measured at amortised cost
Financial assets that are held to collect contractual cash flows where those cash flows represent solely payments of principal and interest are measured at amortised cost. A basic lending arrangement results in contractual cash flows that are solely payments of principal and interest on the principal amount outstanding. Where the contractual cash flows introduce exposure to risks or volatility unrelated to a basic lending arrangement such as changes in equity prices or commodity prices, the payments do not comprise solely principal and interest. Financial assets measured at amortised cost are predominantly loans and advances to customers and banks together with certain debt securities used by the Group to manage its liquidity. Loans and advances are initially recognised when cash is advanced to the borrower at fair value inclusive of transaction costs. Interest income is accounted for using the effective interest method (see (D) above).
Financial liabilities are measured at amortised cost, except for trading liabilities and other financial liabilities designated at fair value through profit or loss on initial recognition which are held at fair value.
(2)Financial assets measured at fair value through other comprehensive income
Financial assets that are held to collect contractual cash flows and for subsequent sale, where the assets’ cash flows represent solely payments of principal and interest, are recognised in the balance sheet at their fair value, inclusive of transaction costs. Interest calculated using the effective interest method and foreign exchange gains and losses on assets denominated in foreign currencies are recognised in the income statement. All other gains and losses arising from changes in fair value are recognised directly in other comprehensive income, until the financial asset is either sold or matures, at which time the cumulative gain or loss previously recognised in other comprehensive income is recognised in the income statement other than in respect of equity shares, for which the cumulative revaluation amount is transferred directly to retained profits. The Group recognises a charge for expected credit losses in the income statement (see (H) below). As the asset is measured at fair value, the charge does not adjust the carrying value of the asset, it is reflected in other comprehensive income.
(3)Financial instruments measured at fair value through profit or loss
Financial assets are classified at fair value through profit or loss where they do not meet the criteria to be measured at amortised cost or fair value through other comprehensive income or where they are designated at fair value through profit or loss to reduce an accounting mismatch. All derivatives are carried at fair value through profit or loss.
Trading securities, which are debt securities and equity shares acquired principally for the purpose of selling in the short-term or which are part of a portfolio which is managed for short-term gains, do not meet these criteria and are also measured at fair value through profit or loss. Financial assets measured at fair value through profit or loss are recognised in the balance sheet at their fair value. Fair value gains and losses together with interest coupons and dividend income are recognised in the income statement within net trading income.
Financial liabilities are measured at fair value through profit or loss where they are trading liabilities or where they are designated at fair value through profit or loss in order to reduce an accounting mismatch; where the liabilities are part of a group of liabilities (or assets and liabilities) which is managed, and its performance evaluated, on a fair value basis; or where the liabilities contain one or more embedded derivatives that significantly modify the cash flows arising under the contract and would otherwise need to be separately accounted for. Financial liabilities measured at fair value through profit or loss are recognised in the balance sheet at their fair value. Fair value gains and losses are recognised in the income statement within net trading income in the period in which they occur, except that gains and losses attributable to changes in own credit risk are recognised in other comprehensive income.
The fair values of assets and liabilities traded in active markets are based on current bid and offer prices respectively. If the market is not active the Group establishes a fair value by using valuation techniques. The fair values of derivative financial instruments are adjusted where appropriate to reflect credit risk (via credit valuation adjustments (CVAs), debit valuation adjustments (DVAs) and funding valuation adjustments (FVAs)), market liquidity and other risks.
(4)Borrowings
Borrowings (which include deposits from banks, customer deposits, debt securities in issue and subordinated liabilities) are recognised initially at fair value, being their issue proceeds net of transaction costs incurred. These instruments are subsequently stated at amortised cost using the effective interest method.
Preference shares and other instruments which carry a mandatory coupon or are redeemable on a specific date are classified as financial liabilities. The coupon on these instruments is recognised in the income statement as interest expense. Securities which carry a discretionary coupon and have no fixed maturity or redemption date are classified as other equity instruments. Interest payments on these securities are recognised, as distributions from equity in the period in which they are paid. An exchange of financial liabilities on substantially different terms is accounted for as an extinguishment of the original financial liability and the recognition of a new financial liability. The difference between the carrying amount of a financial liability extinguished and the new financial liability is recognised in profit or loss together with any related costs or fees incurred.
When a financial liability is exchanged for an equity instrument, the new equity instrument is recognised at fair value and any difference between the carrying value of the liability and the fair value of the new equity is recognised in profit or loss.
(5)Sale and repurchase agreements (including securities lending and borrowing)
Securities sold subject to repurchase agreements (repos) continue to be recognised on the balance sheet where substantially all of the risks and rewards are retained. Funds received under these arrangements are included in deposits from banks, customer deposits, or trading liabilities. Conversely, securities purchased under agreements to resell (reverse repos), where the Group does not acquire substantially all of the risks and rewards of ownership, are recorded as loans and advances measured at amortised cost or trading securities. The difference between sale and repurchase price is treated as interest and accrued over the life of the agreements using the effective interest method.
Securities borrowing and lending transactions are typically secured; collateral takes the form of securities or cash advanced or received. Securities lent to counterparties are retained on the balance sheet. Securities borrowed are not recognised on the balance sheet, unless these are sold to third parties, in which case the obligation to return them is recorded at fair value as a trading liability. Cash collateral given or received is treated as a loan and advance measured at amortised cost or customer deposit.
(F)Derivative financial instruments and hedge accounting
As permitted by IFRS 9, the Group continues to apply the requirements of IAS 39 to its hedging relationships. All derivatives are recognised at their fair value. Derivatives are carried on the balance sheet as assets when their fair value is positive and as liabilities when their fair value is negative. Refer to note 42(3) (Financial instruments: Financial assets and liabilities carried at fair value) for details of valuation techniques and significant inputs to valuation models.
NOTES TO THE ACCOUNTS
for the year ended 31 December 2020
2 ACCOUNTING POLICIES (continued)
Changes in the fair value of all derivative instruments, other than those in effective cash flow and net investment hedging relationships, are recognised immediately in the income statement. As noted in (2) and (3) below, the change in fair value of a derivative in an effective cash flow or net investment hedging relationship is allocated between the income statement and other comprehensive income.
Derivatives embedded in a financial asset are not considered separately; the financial asset is considered in its entirety when determining whether its cash flows are solely payments of principal and interest. Derivatives embedded in financial liabilities treated as separate derivatives when their economic characteristics and risks are not closely related to those of the host contract and the host contract is not carried at fair value through profit or loss. These embedded derivatives are measured at fair value with changes in fair value recognised in the income statement.
Hedge accounting allows one financial instrument, generally a derivative such as a swap, to be designated as a hedge of another financial instrument such as a loan or deposit or a portfolio of such instruments. At the inception of the hedge relationship, formal documentation is drawn up specifying the hedging strategy, the hedged item, the hedging instrument and the methodology that will be used to measure the effectiveness of the hedge relationship in offsetting changes in the fair value or cash flow of the hedged risk. The effectiveness of the hedging relationship is tested both at inception and throughout its life and if at any point it is concluded that it is no longer highly effective in achieving its documented objective, hedge accounting is discontinued. Note 15 provides details of the types of derivatives held by the Group and presents separately those designated in hedge relationships.
Where there is uncertainty arising from interest rate benchmark reform, the Group assumes that the interest rate benchmark on which the hedged cash flows and/or the hedged risk are based, or the interest rate benchmark on which the cash flows of the hedging instrument are based, are not altered as a result of interest rate benchmark reform. The Group does not discontinue a hedging relationship during the period of uncertainty arising from the interest rate benchmark reform solely because the actual results of the hedge are not highly effective.
(1)Fair value hedges
Changes in the fair value of derivatives that are designated and qualify as fair value hedges are recorded in the income statement, together with the changes in the fair value of the hedged asset or liability that are attributable to the hedged risk; this also applies if the hedged asset is classified as a financial asset at fair value through other comprehensive income. If the hedge no longer meets the criteria for hedge accounting, changes in the fair value of the hedged item attributable to the hedged risk are no longer recognised in the income statement. The cumulative adjustment that has been made to the carrying amount of the hedged item is amortised to the income statement using the effective interest method over the period to maturity.
(2)Cash flow hedges
The effective portion of changes in the fair value of derivatives that are designated and qualify as cash flow hedges is recognised in other comprehensive income in the cash flow hedging reserve. The gain or loss relating to the ineffective portion is recognised immediately in the income statement. Amounts accumulated in equity are reclassified to the income statement in the periods in which the hedged item affects profit or loss. When a hedging instrument expires or is sold, or when a hedge no longer meets the criteria for hedge accounting, any cumulative gain or loss existing in equity at that time remains in equity and is recognised in the income statement when the forecast transaction is ultimately recognised in the income statement. When a forecast transaction is no longer expected to occur, the cumulative gain or loss that was reported in equity is immediately transferred to the income statement.
(3)Net investment hedges
Hedges of net investments in foreign operations are accounted for similarly to cash flow hedges. Any gain or loss on the hedging instrument relating to the effective portion of the hedge is recognised in other comprehensive income, the gain or loss relating to the ineffective portion is recognised immediately in the income statement. Gains and losses accumulated in equity are included in the income statement when the foreign operation is disposed of. The hedging instrument used in net investment hedges may include non-derivative liabilities as well as derivative financial instruments.
(G)Offset
Financial assets and liabilities are offset and the net amount reported in the balance sheet when there is a legally enforceable right of offset and there is an intention to settle on a net basis, or realise the asset and settle the liability simultaneously. Cash collateral on exchange traded derivative transactions is presented gross unless the collateral cash flows are always settled net with the derivative cash flows. In certain situations, even though master netting agreements exist, the lack of management intention to settle on a net basis results in the financial assets and liabilities being reported gross on the balance sheet.
(H)Impairment of financial assets
The impairment charge in the income statement includes the change in expected credit losses and including those arising from fraud. Expected credit losses are recognised for loans and advances to customers and banks, other financial assets held at amortised cost, financial assets measured at fair value through other comprehensive income, and certain loan commitments and financial guarantee contracts. Expected credit losses are calculated as an unbiased and probability-weighted estimate using an appropriate probability of default, adjusted to take into account a range of possible future economic scenarios, and applying this to the estimated exposure of the Group at the point of default after taking into account the value of any collateral held, repayments, or other mitigants of loss and including the impact of discounting using the effective interest rate.
At initial recognition, allowance (or provision in the case of some loan commitments and financial guarantees) is made for expected credit losses resulting from default events that are possible within the next 12 months (12-month expected credit losses). In the event of a significant increase in credit risk since origination, allowance (or provision) is made for expected credit losses resulting from all possible default events over the expected life of the financial instrument (lifetime expected credit losses). Financial assets where 12-month expected credit losses are recognised are considered to be Stage 1; financial assets which are considered to have experienced a significant increase in credit risk since initial recognition are in Stage 2; and financial assets which have defaulted or are otherwise considered to be credit impaired are allocated to Stage 3. Some Stage 3 assets, mainly in Commercial Banking, are subject to individual rather than collective assessment. Such cases are subject to a risk-based impairment sanctioning process, and these are reviewed and updated at least quarterly, or more frequently if there is a significant change in the credit profile. The collective assessment of impairment aggregates financial instruments with similar risk characteristics such as whether the facility is revolving in nature or secured and the type of security against financial assets.
NOTES TO THE ACCOUNTS
for the year ended 31 December 2020
2 ACCOUNTING POLICIES (continued)
An assessment of whether credit risk has increased significantly since initial recognition considers the change in the risk of default occurring over the remaining expected life of the financial instrument. In determining whether there has been a significant increase in credit risk, the Group uses quantitative tests based on relative and absolute probability of default (PD) movements linked to internal credit ratings together with qualitative indicators such as watchlists and other indicators of historical delinquency, credit weakness or financial difficulty. The use of internal credit ratings and qualitative indicators ensure alignment between the assessment of staging and the Group’s management of credit risk which utilises these internal metrics within distinct retail and commercial portfolio risk management practices. However, unless identified at an earlier stage, the credit risk of financial assets is deemed to have increased significantly when more than 30 days past due. The use of a payment holiday in itself has not been judged to indicate a significant increase in credit risk, with the underlying long-term credit risk deemed to be driven by economic conditions and captured through the use of forward-looking models. These portfolio level models are capturing the anticipated volume of increased defaults and therefore an appropriate assessment of staging and expected credit loss. Where the credit risk subsequently improves such that it no longer represents a significant increase in credit risk since initial recognition, the asset is transferred back to Stage 1.
Assets are transferred to Stage 3 when they have defaulted or are otherwise considered to be credit impaired. Default is considered to have occurred when there is evidence that the customer is experiencing financial difficulty which is likely to affect significantly the ability to repay the amount due. IFRS 9 contains a rebuttable presumption that default occurs no later than when a payment is 90 days past due. The Group uses this 90 day backstop for all its products except for UK mortgages. For UK mortgages, the Group uses a backstop of 180 days past due as mortgage exposures more than 90 days past due, but less than 180 days, typically show high cure rates and this aligns with the Group’s risk management practices. Key differences between Stage 3 balances and non-performing loans relate to the use of 180 days past due for Stage 3 mortgages and to the cure periods applied to forbearance exposures. The use of payment holidays is not considered to be an automatic trigger of regulatory default and therefore does not automatically trigger Stage 3. Days past due will also not accumulate on any accounts that have taken a payment holiday including those already past due.
In certain circumstances, the Group will renegotiate the original terms of a customer’s loan, either as part of an ongoing customer relationship or in response to adverse changes in the circumstances of the borrower. In the latter circumstances, the loan will remain classified as either Stage 2 or Stage 3 until the credit risk has improved such that it no longer represents a significant increase since origination (for a return to Stage 1), or the loan is no longer credit impaired (for a return to Stage 2). On renegotiation the gross carrying amount of the loan is recalculated as the present value of the renegotiated or modified contractual cash flows, which are discounted at the original effective interest rate. Renegotiation may also lead to the loan and associated allowance being derecognised and a new loan being recognised initially at fair value.
Purchased or originated credit-impaired financial assets (POCI) include financial assets that are purchased or originated at a deep discount that reflects incurred credit losses. At initial recognition, POCI assets do not carry an impairment allowance; instead, lifetime expected credit losses are incorporated into the calculation of the effective interest rate. All changes in lifetime expected credit losses subsequent to the assets’ initial recognition are recognised as an impairment charge.
A loan or advance is normally written off, either partially or in full, against the related allowance when the proceeds from realising any available security have been received or there is no realistic prospect of recovery and the amount of the loss has been determined. Subsequent recoveries of amounts previously written off decrease the amount of impairment losses recorded in the income statement. For both secured and unsecured retail balances, the write-off takes place only once an extensive set of collections processes has been completed, or the status of the account reaches a point where policy dictates that continuing attempts to recover are no longer appropriate. For commercial lending, a write-off occurs if the loan facility with the customer is restructured, the asset is under administration and the only monies that can be received are the amounts estimated by the administrator, the underlying assets are disposed and a decision is made that no further settlement monies will be received, or external evidence (for example, third party valuations) is available that there has been an irreversible decline in expected cash flows.
(I)Property, plant and equipment
Property, plant and equipment (other than investment property) is included at cost less accumulated depreciation. The value of land (included in premises) is not depreciated. Depreciation on other assets is calculated using the straight-line method to allocate the difference between the cost and the residual value over their estimated useful lives, as follows: the shorter of 50 years and the remaining period of the lease for freehold/long and short leasehold premises; the shorter of 10 years and, if lease renewal is not likely, the remaining period of the lease for leasehold improvements; 10 to 20 years for fixtures and furnishings; and 2 to 8 years for other equipment and motor vehicles.
The assets’ residual values and useful lives are reviewed, and adjusted if appropriate, at each balance sheet date.
Assets are reviewed for impairment whenever events or changes in circumstances indicate that the carrying amount may not be recoverable. In the event that an asset’s carrying amount is determined to be greater than its recoverable amount it is written down immediately. The recoverable amount is the higher of the asset’s fair value less costs to sell and its value in use.
Investment property comprises freehold and long leasehold land and buildings that are held either to earn rental income or for capital accretion or both. In accordance with the guidance published by the Royal Institution of Chartered Surveyors, investment property is carried at fair value based on current prices for similar properties, adjusted for the specific characteristics of the property (such as location or condition). If this information is not available, the Group uses alternative valuation methods such as discounted cash flow projections or recent prices in less active markets. These valuations are reviewed at least annually by independent professionally qualified valuers. Investment property being redeveloped for continuing use as investment property, or for which the market has become less active, continues to be valued at fair value.
(J)Leases
Under IFRS 16, a lessor is required to determine whether a lease is a finance or operating lease. A lessee is not required to make this determination.
(1)As lessor
Assets leased to customers are classified as finance leases if the lease agreements transfer substantially all the risks and rewards of ownership to the lessee but not necessarily legal title. All other leases are classified as operating leases. When assets are subject to finance leases, the present value of the lease payments, together with any unguaranteed residual value, is recognised as a receivable, net of allowances for expected credit losses and residual value impairment, within loans and advances to banks and customers. The difference between the gross receivable and the present value of the receivable is recognised as unearned finance lease income. Finance lease income is recognised in interest income over the term of the lease using the net investment method (before tax) so as to give a constant rate of return on the net investment in the leases. Unguaranteed residual values are reviewed regularly to identify any impairment.
NOTES TO THE ACCOUNTS
for the year ended 31 December 2020
2 ACCOUNTING POLICIES (continued)
Operating lease assets are included within property, plant and equipment at cost and depreciated over their estimated useful lives, which equates to the lives of the leases, after taking into account anticipated residual values. Operating lease rental income is recognised on a straight-line basis over the life of the lease.
The Group evaluates non-lease arrangements such as outsourcing and similar contracts to determine if they contain a lease which is then accounted for separately.
(2)As lessee
Leases are recognised as a right-of-use asset and a corresponding liability at the date at which the leased asset is available for use by the Group. Assets and liabilities arising from a lease are initially measured on a present value basis. The lease payments are discounted using the interest rate implicit in the lease, if that rate can be determined, or the Group’s incremental borrowing rate appropriate for the right-of-use asset arising from the lease.
Lease payments are allocated between the liability and finance cost. The finance cost is charged to profit or loss over the lease period so as to produce a constant periodic rate of interest on the remaining balance of the liability for each period. The right-of-use asset is depreciated over the shorter of the asset's useful life and the lease term on a straight-line basis.
Payments associated with short-term leases and leases of low-value assets are recognised on a straight-line basis as an expense in profit or loss. Short-term leases are leases with a lease term of twelve months or less. Low-value assets comprise IT equipment and small items of office furniture.
(K)Employee benefits
Short-term employee benefits, such as salaries, paid absences, performance-based cash awards and social security costs are recognised over the period in which the employees provide the related services.
(1)Pension schemes
The Group operates a number of post-retirement benefit schemes for its employees including both defined benefit and defined contribution pension plans. A defined benefit scheme is a pension plan that defines an amount of pension benefit that an employee will receive on retirement, dependent on one or more factors such as age, years of service and salary. A defined contribution plan is a pension plan into which the Group pays fixed contributions; there is no legal or constructive obligation to pay further contributions.
Scheme assets are included at their fair value and scheme liabilities are measured on an actuarial basis using the projected unit credit method. The defined benefit scheme liabilities are discounted using rates equivalent to the market yields at the balance sheet date on high-quality corporate bonds that are denominated in the currency in which the benefits will be paid, and that have terms to maturity approximating to the terms of the related pension liability. The Group’s income statement charge includes the current service cost of providing pension benefits, past service costs, net interest expense (income), and plan administration costs that are not deducted from the return on plan assets. Past service costs, which represents the change in the present value of the defined benefit obligation resulting from a plan amendment or curtailment, are recognised when the plan amendment or curtailment occurs. Net interest expense (income) is calculated by applying the discount rate at the beginning of the period to the net defined benefit liability or asset.
Remeasurements, comprising actuarial gains and losses, the return on plan assets (excluding amounts included in net interest expense (income) and net of the cost of managing the plan assets), and the effect of changes to the asset ceiling (if applicable) are reflected immediately in the balance sheet with a charge or credit recognised in other comprehensive income in the period in which they occur. Remeasurements recognised in other comprehensive income are reflected immediately in retained profits and will not subsequently be reclassified to profit or loss.
The Group’s balance sheet includes the net surplus or deficit, being the difference between the fair value of scheme assets and the discounted value of scheme liabilities at the balance sheet date. Surpluses are only recognised to the extent that they are recoverable through reduced contributions in the future or through refunds from the schemes. In assessing whether a surplus is recoverable, the Group considers (i) its current right to obtain a refund or a reduction in future contributions and (ii) the rights of other parties existing at the balance sheet date. In determining the rights of third parties existing at the balance sheet date, the Group does not anticipate any future acts by other parties.
The costs of the Group’s defined contribution plans are charged to the income statement in the period in which they fall due.
(2)Share-based compensation
Lloyds Banking Group operates a number of equity-settled, share-based compensation plans in respect of services received from certain of its employees. The value of the employee services received in exchange for equity instruments granted under these plans is recognised as an expense over the vesting period of the instruments, with a corresponding increase in equity. This expense is determined by reference to the fair value of the number of equity instruments that are expected to vest. The fair value of equity instruments granted is based on market prices, if available, at the date of grant. In the absence of market prices, the fair value of the instruments at the date of grant is estimated using an appropriate valuation technique, such as a Black-Scholes option pricing model or a Monte Carlo simulation. The determination of fair values excludes the impact of any non-market vesting conditions, which are included in the assumptions used to estimate the number of options that are expected to vest. At each balance sheet date, this estimate is reassessed and if necessary revised. Any revision of the original estimate is recognised in the income statement, together with a corresponding adjustment to equity. Cancellations by employees of contributions to the Group’s Save As You Earn plans are treated as non-vesting conditions and the Group recognises, in the year of cancellation, the amount of the expense that would have otherwise been recognised over the remainder of the vesting period. Modifications are assessed at the date of modification and any incremental charges are charged to the income statement.
(L)Taxation
Tax expense comprises current and deferred tax. Current and deferred tax are charged or credited in the income statement except to the extent that the tax arises from a transaction or event which is recognised, in the same or a different period, outside the income statement (either in other comprehensive income, directly in equity, or through a business combination), in which case the tax appears in the same statement as the transaction that gave rise to it. The tax consequences of the Group's dividend payments (including distributions on other equity instruments), if any, are charged or credited to the statement in which the profit distributed originally arose.
Current tax is the amount of corporate income taxes expected to be payable or recoverable based on the profit for the period as adjusted for items that are not taxable or not deductible, and is calculated using tax rates and laws that were enacted or substantively enacted at the balance sheet date.
NOTES TO THE ACCOUNTS
for the year ended 31 December 2020
2 ACCOUNTING POLICIES (continued)
Current tax includes amounts provided in respect of uncertain tax positions when management expects that, upon examination of the uncertainty by Her Majesty’s Revenue and Customs (HMRC) or other relevant tax authority, it is more likely than not that an economic outflow will occur. Provisions reflect management’s best estimate of the ultimate liability based on their interpretation of tax law, precedent and guidance, informed by external tax advice as necessary. Changes in facts and circumstances underlying these provisions are reassessed at each balance sheet date, and the provisions are remeasured as required to reflect current information.
Deferred tax is recognised on temporary differences arising between the tax bases of assets and liabilities and their carrying amounts in the balance sheet. Deferred tax is calculated using tax rates and laws that have been enacted or substantively enacted at the balance sheet date, and which are expected to apply when the related deferred tax asset is realised or the deferred tax liability is settled.
Deferred tax liabilities are generally recognised for all taxable temporary differences but not recognised for taxable temporary differences arising on investments in subsidiaries where the reversal of the temporary difference can be controlled and it is probable that the difference will not reverse in the foreseeable future. Deferred tax liabilities are not recognised on temporary differences that arise from goodwill which is not deductible for tax purposes.
Deferred tax assets are recognised to the extent it is probable that taxable profits will be available against which the deductible temporary differences can be utilised, and are reviewed at each balance sheet date and reduced to the extent that it is no longer probable that sufficient taxable profits will be available to allow all or part of the asset to be recovered.
Deferred tax assets and liabilities are not recognised in respect of temporary differences that arise on initial recognition of assets and liabilities acquired other than in a business combination. Deferred tax is not discounted.
(M)Foreign currency translation
Items included in the financial statements of each of the Group’s entities are measured using the currency of the primary economic environment in which the entity operates (the functional currency). Foreign currency transactions are translated into the appropriate functional currency using the exchange rates prevailing at the dates of the transactions. Foreign exchange gains and losses resulting from the settlement of such transactions and from the translation at year end exchange rates of monetary assets and liabilities denominated in foreign currencies are recognised in the income statement, except when recognised in other comprehensive income as qualifying cash flow or net investment hedges. Non-monetary assets that are measured at fair value are translated using the exchange rate at the date that the fair value was determined. Translation differences on equities and similar non-monetary items held at fair value through profit and loss are recognised in profit or loss as part of the fair value gain or loss. Translation differences on non-monetary financial assets measured at fair value through other comprehensive income, such as equity shares, are included in the fair value reserve in equity unless the asset is a hedged item in a fair value hedge.
The results and financial position of all Group entities that have a functional currency different from the presentation currency are translated into the presentation currency as follows: the assets and liabilities of foreign operations, including goodwill and fair value adjustments arising on the acquisition of a foreign entity, are translated into sterling at foreign exchange rates ruling at the balance sheet date; and the income and expenses of foreign operations are translated into sterling at average exchange rates unless these do not approximate to the foreign exchange rates ruling at the dates of the transactions in which case income and expenses are translated at the dates of the transactions.
Foreign exchange differences arising on the translation of a foreign operation are recognised in other comprehensive income and accumulated in a separate component of equity together with exchange differences arising from the translation of borrowings and other currency instruments designated as hedges of such investments (see (F)(3) above). On disposal or liquidation of a foreign operation, the cumulative amount of exchange differences relating to that foreign operation are reclassified from equity and included in determining the profit or loss arising on disposal or liquidation.
(N)Provisions and contingent liabilities
Provisions are recognised in respect of present obligations arising from past events where it is probable that outflows of resources will be required to settle the obligations and they can be reliably estimated.
Contingent liabilities are possible obligations whose existence depends on the outcome of uncertain future events or those present obligations where the outflows of resources are uncertain or cannot be measured reliably. Contingent liabilities are not recognised in the financial statements but are disclosed unless they are remote.
Provision is made for expected credit losses in respect of irrevocable undrawn loan commitments and financial guarantee contracts (see (H) above).
(O)Share capital
Incremental costs directly attributable to the issue of new shares or options or to the acquisition of a business are shown in equity as a deduction, net of tax, from the proceeds. Dividends paid on the Group’s ordinary shares are recognised as a reduction in equity in the period in which they are paid.
(P)Cash and cash equivalents
For the purposes of the cash flow statement, cash and cash equivalents comprise cash and non-mandatory balances with central banks and amounts due from banks with a maturity of less than three months.
(Q)Investment in subsidiaries
Investments in subsidiaries are carried at historical cost, less any provisions for impairment.
(R)Discontinued operations
A discontinued operation is a cash generating unit or a group of cash generating units that has been disposed of, or is classified as held for sale, and (a) represents a separate major line of business or geographical area of operations, (b) is part of a single co-ordinated plan to dispose of a separate major line of business or geographical area of operations or (c) is a subsidiary acquired exclusively with a view to resale. The results after tax of discontinued operations are shown as a single line item on the face of the income statement.
NOTES TO THE ACCOUNTS
for the year ended 31 December 2020
3 CRITICAL ACCOUNTING JUDGEMENTS AND ESTIMATES
The preparation of the Group’s financial statements in accordance with IFRS requires management to make judgements, estimates and assumptions in applying the accounting policies that affect the reported amounts of assets, liabilities, income and expenses. Due to the inherent uncertainty in making estimates, actual results reported in future periods may be based upon amounts which differ from those estimates. Estimates, judgements and assumptions are continually evaluated and are based on historical experience and other factors, including expectations of future events that are believed to be reasonable under the circumstances.
The significant judgements made by management in applying the Group’s accounting policies and the key sources of estimation uncertainty in these financial statements, which together are deemed critical to the Group’s results and financial position, are as follows:
Allowance for expected credit losses
| | | | | |
| Key judgements: | Determining an appropriate definition of default against which a probability of default, exposure at default and loss given default parameter can be evaluated |
| The appropriate lifetime of an exposure to credit risk for the assessment of lifetime losses, notably on revolving products |
| Establishing the criteria for a significant increase in credit risk |
| The use of management judgement alongside impairment modelling processes to adjust inputs, parameters and outputs to reflect risks not captured by models |
| Key estimates: | Base case and Multiple Economic Scenarios (MES) assumptions, including the rate of unemployment and the rate of change of house prices, required for creation of MES scenarios and forward looking credit parameters |
These judgements and estimates are subject to significant uncertainty.
The Group recognises an allowance for expected credit losses for loans and advances to customers and banks, other financial assets held at amortised cost, financial assets measured at fair value through other comprehensive income and certain loan commitment and financial guarantee contracts. At 31 December 2020 the Group’s expected credit loss allowance was £6,132 million (2019: £3,380 million), of which £5,706 million (2019: £3,207 million) was in respect of drawn balances; and the Bank’s expected credit loss allowance was £2,558 million (2019: £1,336 million), of which £2,313 million (2019: £1,246 million) was in respect of drawn balances.
The calculation of the Group’s expected credit loss (ECL) allowances and provisions against loan commitments and guarantees under IFRS 9 requires the Group to make a number of judgements, assumptions and estimates. The most significant are set out below.
Definition of default
The probability of default (PD) of an exposure, both over a 12 month period and over its lifetime, is a key input to the measurement of the ECL allowance. Default has occurred when there is evidence that the customer is experiencing significant financial difficulty which is likely to affect the ability to repay amounts due. The definition of default adopted by the Group is described in note 2(H) Impairment of financial assets. The Group has rebutted the presumption in IFRS 9 that default occurs no later than when a payment is 90 days past due for UK mortgages. As a result, at 31 December 2020, approximately £0.6 billion of UK mortgages (2019: £0.6 billion) were classified as Stage 2 rather than Stage 3; the impact on the Group’s ECL allowance was not material.
Lifetime of an exposure
A range of approaches, segmented by product type, has been adopted by the Group to estimate a product’s expected life. These include using the full contractual life and taking into account behavioural factors such as early repayments and refinancing. For non-revolving retail assets, the Group has assumed the expected life for each product to be the time taken for all significant losses to be observed. For retail revolving products, the Group has considered the losses beyond the contractual term over which the Group is exposed to credit risk. For commercial overdraft facilities, the average behavioural life has been used. Changes to the assumed expected lives of the Group’s assets could impact the ECL allowance recognised by the Group. The assessment of SICR and corresponding lifetime loss, and the PD, of a financial asset deemed to be Stage 2, or Stage 3, is dependent on its expected life.
Significant increase in credit risk
Performing assets are classified as either Stage 1 or Stage 2. An ECL allowance equivalent to 12 months expected losses is established against assets in Stage 1; assets classified as Stage 2 carry an ECL allowance equivalent to lifetime expected losses. Assets are transferred from Stage 1 to Stage 2 when there has been a significant increase in credit risk (SICR) since initial recognition. Credit impaired assets are transferred to Stage 3 with a lifetime expected losses allowance. The Group uses both quantitative and qualitative indicators to determine whether there has been a SICR for an asset. For Retail, the following tables set out the Retail Master Scale (RMS) grade triggers which result in a SICR for financial assets and the PD boundaries for each RMS grade. Credit cards SICR triggers have been refined in 2020 following a review of sensitivity to changes in economic assumptions, 2019 triggers were previously aligned to Loans and overdrafts. The impact of this has been approximately £1.4 billion of additional assets being classified as Stage 2 at 31 December 2020, with a corresponding increase in the ECL of £48 million resulting from the transfer to a lifetime expected loss.
| | | | | | | | | | | | | | | | | | | | | | | |
| SICR Triggers for key Retail portfolios | | | | | | | |
| Origination grade | 1 | 2 | 3 | 4 | 5 | 6 | 7 |
| Mortgages SICR grade | 5 | 5 | 6 | 7 | 8 | 9 | 10 |
| Credit cards SICR grade | 4 | 5 | 6 | 7 | 8 | 9 | 10 |
| Loans and overdrafts SICR grade | 5 | 6 | 7 | 8 | 9 | 10 | 11 |
| | | | | | | | | | | | | | | | | | | | | | | | | | | | | | | | | | | | | | | | | | | | |
| RMS grade | 1 | 2 | 3 | 4 | 5 | 6 | 7 | 8 | 9 | 10 | 11 | 12 | 13 | 14 |
| PD boundary % | 0.10 | 0.40 | 0.80 | 1.20 | 2.50 | 4.50 | 7.50 | 10.00 | 14.00 | 20.00 | 30.00 | 45.00 | 99.99 | 100.00 |
For Commercial a doubling of PD with a minimum increase in PD of 1 per cent and a resulting change in the underlying grade is treated as a SICR.
NOTES TO THE ACCOUNTS
for the year ended 31 December 2020
3 CRITICAL ACCOUNTING JUDGEMENTS AND ESTIMATES (continued)
The Group uses the internal credit risk classification and watchlist as qualitative indicators to identify a SICR. The Group does not use the low credit risk exemption in its staging assessments. The use of a payment holiday in and of itself has not been judged to indicate a significant increase in credit risk, nor forbearance, with the underlying long-term credit risk deemed to be driven by economic conditions and captured through the use of forward-looking models. These portfolio level models are capturing the anticipated volume of increased defaults and therefore an appropriate assessment of staging and expected credit loss. During 2020, the Group has granted payment holidays on Retail loans and advances, £6.4 billion remained in place at 31 December 2020, £4.3 billion of these balances were classified as Stage 1. If all of these assets were classified as Stage 2, the Group's ECL would have been less than £50 million higher.
All financial assets are assumed to have suffered a SICR if they are more than 30 days past due; non-mortgage Retail financial assets are also assumed to have suffered a SICR if they are in arrears on three or more separate occasions in a rolling twelve month period. Financial assets are classified as credit impaired if they are 90 days past due except for UK mortgages where a 180 days backstop is used.
A Stage 3 asset that is no longer credit-impaired is transferred back to Stage 2 as no cure period is applied to Stage 3. If an exposure that is classified as Stage 2 no longer meets the SICR criteria, which in some cases include a minimum cure period, it is moved back to Stage 1.
The setting of precise trigger points combined with risk indicators requires judgement. The use of different trigger points may have a material impact upon the size of the ECL allowance. The Group monitors the effectiveness of SICR criteria on an ongoing basis.
Generation of Multiple Economic Scenarios (MES)
The measurement of expected credit losses is required to reflect an unbiased probability-weighted range of possible future outcomes. The Group considers the choice of approach used to generate the range of economic outcomes to be judgemental, given several methods can be adopted. In addition to a defined base case, as used for planning, the Group’s approach relies on model-generated scenarios, reducing scope for bias in the selection of scenarios and their weightings. The conditioning assumptions underpinning the base case scenario reflect the Group’s best view of future events. Where outcomes materially diverge from the conditioning assumptions adopted, the base case scenario is updated. The base case is therefore central to the range of outcomes created as no alternative conditioning assumptions are factored into the model-generated scenarios.
The Group models a full distribution of economic scenarios around this base case, ranking them using estimated relationships with industry-wide historical loss data. The full distribution is summarised by a practical number of scenarios to run through ECL models representing four sections: an upside, the base case, and a downside scenario weighted at 30 per cent each, with a severe downside scenario weighted at 10 per cent. With the base case already pre-defined, the other three scenarios are constructed as averages of constituent modelled scenarios around the 15th, 75th and 95th percentiles of the distribution. The scenario weights therefore represent the allocation to each summary segment of the distribution and not a subjective view on likelihood. The inclusion of a severe downside scenario with a smaller weighting but relatively large credit losses, ensures the non-linearity of losses in the tail of the distribution is captured when ECL based on the weighted result of the four scenarios is calculated.
A committee under the chairmanship of the Chief Economist meets at least quarterly to review and, if appropriate, recommend changes to the method by which economic scenarios are generated; for approval by the Chief Financial Officer and Chief Risk Officer. In 2020, a change was made to the way in which the distribution of scenarios is created. This change allows for a greater dispersal of economic outcomes in the early periods of the forecast, to recognise the increased near-term profile of risks present since the onset of the coronavirus pandemic. This change allows for a wider distribution of losses both on the upside and downside, although is most evident in the severe downside scenario, given it represents a more adverse segment of the distribution. The change is estimated to have driven an additional £200 million of ECL resulting from the inclusion of more adverse economic outcomes.
Base Case and MES Economic Assumptions
The Group’s base case economic scenario has continued to be revised in light of the impact of the coronavirus pandemic in the UK and globally. The scenario reflects judgements of the net effect of government-mandated restrictions on economic activity, large-scale government interventions, and behavioural changes by households and businesses that may persist beyond the rollout of coronavirus vaccination programmes.
Despite large-scale vaccination efforts commencing in the UK and globally, there remains considerable uncertainty about the pace and eventual extent of the post-pandemic recovery. The Group’s current base case scenario builds in three key conditioning assumptions. First, the UK vaccine rollout successfully protects the elderly, key workers and the clinically vulnerable by mid-2021. Second, national lockdowns end by April 2021, allowing a phased return to a tiered system of restrictions that are progressively eased in the second quarter and second half of 2021, leaving only limited restrictions in place by the end of 2021. Third, government policy measures including specifically the furlough scheme continue to provide support for the duration of severe economic restrictions, through to mid-2021.
Conditioned on the above assumptions and despite the recovery in economic activity resuming from the second quarter of 2021, the Group’s base case outlook assumes a rise in the unemployment rate and weakness in residential and commercial property prices. Risks around this base case economic view lie in both directions and are partly captured by the MES generated. But uncertainties relating to the key conditioning assumptions, including epidemiological developments and the efficacy of vaccine rollouts, are not specifically captured by the MES scenarios. These specific risks have been recognised outside the modelled scenarios published below.
The Group has accommodated the latest available information at the reporting date in defining its base case scenario and generating the MES. The scenarios include forecasts for key variables in the fourth quarter of 2020, for which actuals may have since emerged prior to publication.
NOTES TO THE ACCOUNTS
for the year ended 31 December 2020
3 CRITICAL ACCOUNTING JUDGEMENTS AND ESTIMATES (continued)
Base case scenario by quarter1
| | | | | | | | | | | | | | | | | | | | | | | | | | |
| First
quarter
2020 | Second
quarter
2020 | Third
quarter
2020 | Fourth
quarter
2020 | First
quarter
2021 | Second
quarter
2021 | Third
quarter
2021 | Fourth
quarter
2021 |
| Base case | % | % | % | % | % | % | % | % |
| Gross domestic product | (3.0) | | (18.8) | | 16.0 | | (1.9) | | (3.8) | | 5.6 | | 3.6 | | 1.5 | |
| UK Bank Rate | 0.10 | | 0.10 | | 0.10 | | 0.10 | | 0.10 | | 0.10 | | 0.10 | | 0.10 | |
| Unemployment rate | 4.0 | | 4.1 | | 4.8 | | 5.0 | | 5.2 | | 6.5 | | 8.0 | | 7.5 | |
| House price growth | 2.8 | | 2.6 | | 7.2 | | 5.9 | | 5.5 | | 4.7 | | (1.6) | | (3.8) | |
| Commercial real estate price growth | (5.0) | | (7.8) | | (7.8) | | (7.0) | | (6.1) | | (2.9) | | (2.2) | | (1.7) | |
1Gross domestic product presented quarter on quarter, house price growth and commercial real estate growth presented year on year - i.e. from the equivalent quarter the previous year. Bank Rate is presented end quarter.
Scenarios by year
Key annual assumptions made by the Group are shown below. Gross domestic product is presented as an annual change, house price growth and commercial real estate price growth are presented as the growth in the respective indices within the period. UK Bank Rate and unemployment rate are averages for the period.
| | | | | | | | | | | | | | | | | |
| 2020 | 2021 | 2022 | 2023 | 2024 |
| % | % | % | % | % |
| Upside | | | | | |
| Gross domestic product | (10.5) | | 3.7 | | 5.7 | | 1.7 | | 1.5 | |
| UK Bank Rate | 0.10 | | 1.14 | | 1.27 | | 1.20 | | 1.21 | |
| Unemployment rate | 4.3 | | 5.4 | | 5.4 | | 5.0 | | 4.5 | |
| House price growth | 6.3 | | (1.4) | | 5.2 | | 6.0 | | 5.0 | |
| Commercial real estate price growth | (4.6) | | 9.3 | | 3.9 | | 2.1 | | 0.3 | |
| Base case | | | | | |
| Gross domestic product | (10.5) | | 3.0 | | 6.0 | | 1.7 | | 1.4 | |
| UK Bank Rate | 0.10 | | 0.10 | | 0.10 | | 0.21 | | 0.25 | |
| Unemployment rate | 4.5 | | 6.8 | | 6.8 | | 6.1 | | 5.5 | |
| House price growth | 5.9 | | (3.8) | | 0.5 | | 1.5 | | 1.5 | |
| Commercial real estate price growth | (7.0) | | (1.7) | | 1.6 | | 1.1 | | 0.6 | |
| Downside | | | | | |
| Gross domestic product | (10.6) | | 1.7 | | 5.1 | | 1.4 | | 1.4 | |
| UK Bank Rate | 0.10 | | 0.06 | | 0.02 | | 0.02 | | 0.03 | |
| Unemployment rate | 4.6 | | 7.9 | | 8.4 | | 7.8 | | 7.0 | |
| House price growth | 5.6 | | (8.4) | | (6.5) | | (4.7) | | (3.0) | |
| Commercial real estate price growth | (8.7) | | (10.6) | | (3.2) | | (0.8) | | (0.8) | |
| Severe downside | | | | | |
| Gross domestic product | (10.8) | | 0.3 | | 4.8 | | 1.3 | | 1.2 | |
| UK Bank Rate | 0.10 | | 0.00 | | 0.00 | | 0.01 | | 0.01 | |
| Unemployment rate | 4.8 | | 9.9 | | 10.7 | | 9.8 | | 8.7 | |
| House price growth | 5.3 | | (11.1) | | (12.5) | | (10.7) | | (7.6) | |
| Commercial real estate price growth | (11.0) | | (21.4) | | (9.8) | | (3.9) | | (0.8) | |
NOTES TO THE ACCOUNTS
for the year ended 31 December 2020
3 CRITICAL ACCOUNTING JUDGEMENTS AND ESTIMATES (continued)
Economic assumptions - five year average
The key UK economic assumptions made by the Group averaged over a five-year period are shown below. The five-year period reflects movements within the current reporting year such that 31 December 2020 reflects five years 2020 to 2024. The prior year comparative data has been re-presented to align to the equivalent period, 2019 to 2023. The inclusion of the reporting year within the five-year period reflects the need to predict variables which remain unpublished at the reporting date, and recognises that credit models utilise both level and annual change in calculating ECL. The use of calendar years also maintains a comparability between tables disclosed.
| | | | | | | | | | | | | | | | | | | | | | | | | | | | | |
| At 31 December 2020 | | At 31 December 2019 |
| Upside | Base case | Downside | Severe
downside | | Upside | Base case | Downside | Severe
downside |
| % | % | % | % | | % | % | % | % |
| Gross domestic product | 0.3 | | 0.1 | | (0.4) | | (0.8) | | | 1.6 | | 1.3 | | 1.0 | | 0.3 | |
| UK Bank Rate | 0.98 | | 0.15 | | 0.05 | | 0.02 | | | 1.87 | | 1.15 | | 0.51 | | 0.17 | |
| Unemployment rate | 5.0 | | 5.9 | | 7.1 | | 8.8 | | | 3.9 | | 4.3 | | 5.5 | | 6.7 | |
| House price growth | 4.2 | | 1.1 | | (3.5) | | (7.5) | | | 5.1 | | 1.4 | | (2.5) | | (7.0) | |
| Commercial real estate price growth | 2.1 | | (1.1) | | (4.9) | | (9.7) | | | 1.6 | | (0.3) | | (3.9) | | (7.3) | |
Economic assumptions - start to peak
| | | | | | | | | | | | | | | | | | | | | | | | | | | | | |
| At 31 December 2020 | | At 31 December 2019 |
| Upside | Base case | Downside | Severe
downside | | Upside | Base case | Downside | Severe
downside |
| % | % | % | % | | % | % | % | % |
| Gross domestic product | 1.4 | | 0.8 | | (1.7) | | (3.0) | | | 8.4 | | 6.6 | | 5.5 | | 1.8 | |
| UK Bank Rate | 1.44 | | 0.25 | | 0.10 | | 0.10 | | | 2.56 | | 1.75 | | 0.75 | | 0.75 | |
| Unemployment rate | 6.5 | | 8.0 | | 9.3 | | 11.5 | | | 4.4 | | 4.6 | | 6.9 | | 8.3 | |
| House price growth | 22.6 | | 5.9 | | 5.6 | | 5.3 | | | 28.3 | | 7.1 | | 2.7 | | 2.7 | |
| Commercial real estate price growth | 11.0 | | (2.7) | | (2.7) | | (2.7) | | | 8.8 | | (0.8) | | (0.8) | | (0.8) | |
Economic assumptions - start to trough
| | | | | | | | | | | | | | | | | | | | | | | | | | | | | |
| At 31 December 2020 | | At 31 December 2019 |
| Upside | Base case | Downside | Severe
downside | | Upside | Base case | Downside | Severe
downside |
| % | % | % | % | | % | % | % | % |
| Gross domestic product | (21.2) | | (21.2) | | (21.2) | | (21.2) | | | 0.3 | | 0.3 | | 0.3 | | (2.4) | |
| UK Bank Rate | 0.10 | | 0.10 | | 0.01 | | 0.00 | | | 0.75 | | 0.75 | | 0.35 | | 0.01 | |
| Unemployment rate | 4.0 | | 4.0 | | 4.0 | | 4.0 | | | 3.4 | | 3.8 | | 3.8 | | 3.8 | |
| House price growth | (0.5) | | (0.5) | | (16.4) | | (32.4) | | | 1.5 | | 0.0 | | (12.0) | | (30.3) | |
| Commercial real estate price growth | (6.9) | | (9.0) | | (22.2) | | (39.9) | | | (1.4) | | (2.3) | | (17.9) | | (31.4) | |
NOTES TO THE ACCOUNTS
for the year ended 31 December 2020
3 CRITICAL ACCOUNTING JUDGEMENTS AND ESTIMATES (continued)
ECL sensitivity to economic assumptions
The table below shows the extent to which a higher ECL allowance has been recognised to take account of forward looking information from the weighted multiple economic scenarios. A significant difference between these bases arises on UK mortgages as the probability-weighted ECL includes the impact of house price movements on the loss given default (LGD). Commercial Banking also reflects movements in the loss given default, whereas for Other Retail portfolios only the probability of default responds to changes in the economic outlook. ECL applied through individual assessments and post-model adjustments is reported flat against each economic scenario, reflecting the basis on which they are evaluated. Judgements applied through changes to inputs are reflected in the scenario sensitivities.
| | | | | | | | | | | | | | | | | | | | | | | |
| At 31 December 2020 | | At 31 December 2019 |
| Base case | Probability
weighted | Difference | | Base case | Probability
weighted | Difference |
| Impact of multiple economic scenarios | £m | £m | £m | | £m | £m | £m |
| UK mortgages | 803 | | 1,027 | | 224 | | | 464 | | 569 | | 105 | |
| Other Retail | 2,310 | | 2,368 | | 58 | | | 1,492 | | 1,521 | | 29 | |
| Commercial Banking | 2,102 | | 2,315 | | 213 | | | 1,206 | | 1,263 | | 57 | |
| Other | 422 | | 422 | | 0 | | | 27 | | 27 | | 0 | |
| 5,637 | | 6,132 | | 495 | | | 3,189 | | 3,380 | | 191 | |
The table below shows the Group’s ECL for the upside, base case, downside and severe downside scenarios. The stage allocation for an asset is based on the overall scenario probability-weighted PD and, hence, the Stage 2 allocation is constant across all the scenarios. ECL applied through individual assessments and post-model adjustments is reported flat against each economic scenario, reflecting the basis on which they are evaluated. Judgements applied through changes to inputs are reflected in the scenario sensitivities.
| | | | | | | | | | | | | | | | | | | | | | | | | | | | | | | | | | | |
| At 31 December 2020 | | At 31 December 2019 |
| Probability-
weighted | Upside | Base case | Downside | Severe
downside | | Probability-
weighted | Upside | Base case | Downside | Severe
downside |
| £m | £m | £m | £m | £m | | £m | £m | £m | £m | £m |
| UK mortgages | 1,027 | | 614 | | 803 | | 1,237 | | 2,306 | | | 569 | | 317 | | 464 | | 653 | | 1,389 | |
| Other Retail | 2,368 | | 2,181 | | 2,310 | | 2,487 | | 2,745 | | | 1,521 | | 1,443 | | 1,492 | | 1,564 | | 1,712 | |
| Commercial Banking | 2,315 | | 1,853 | | 2,102 | | 2,575 | | 3,554 | | | 1,263 | | 1,163 | | 1,206 | | 1,327 | | 1,535 | |
| Other | 422 | | 420 | | 422 | | 422 | | 428 | | | 27 | | 27 | | 27 | | 27 | | 27 | |
| ECL allowance | 6,132 | | 5,068 | | 5,637 | | 6,721 | | 9,033 | | | 3,380 | | 2,950 | | 3,189 | | 3,571 | | 4,663 | |
The table below shows the Group’s ECL for the upside, base case, downside and severe downside scenarios, with stage allocation based on each specific scenario. ECL applied through individual assessments and post-model adjustments is reported flat against each economic scenario, reflecting the basis on which they are evaluated. Judgements applied through changes to inputs are reflected in the scenario sensitivities. A probability-weighted scenario is not shown as this does not reflect the basis on which ECL is reported.
| | | | | | | | | | | | | | | | | | | | | | | | | | | | | |
| At 31 December 2020 | | At 31 December 2019 |
| Upside | Base case | Downside | Severe
downside | | Upside | Base case | Downside | Severe
downside |
| £m | £m | £m | £m | | £m | £m | £m | £m |
| UK mortgages | 602 | | 797 | | 1,269 | | 2,578 | | | 311 | | 461 | | 670 | | 1,667 | |
| Other Retail | 2,154 | | 2,299 | | 2,509 | | 2,819 | | | 1,435 | | 1,486 | | 1,570 | | 1,740 | |
| Commercial Banking | 1,842 | | 2,079 | | 2,629 | | 3,985 | | | 1,154 | | 1,202 | | 1,335 | | 1,573 | |
| Other | 420 | | 421 | | 422 | | 429 | | | 27 | | 27 | | 27 | | 27 | |
| ECL allowance | 5,018 | | 5,596 | | 6,829 | | 9,811 | | | 2,927 | | 3,176 | | 3,602 | | 5,007 | |
The impact of changes in the UK unemployment rate and House Price Index (HPI) have also been assessed. Although such changes would not be observed in isolation, as economic indicators tend to be correlated in a coherent scenario, this gives insight into the sensitivity of the Group’s ECL to gradual changes in these two critical economic factors. The assessment has been made against the base case with the reported staging unchanged.
The table below shows the impact on the Group’s ECL in respect of UK mortgages resulting from a decrease/increase in loss given default for a 10 percentage point (pp) increase or decrease in the UK House Price Index (HPI). The increase/decrease is presented based on the adjustment phased evenly over the first ten quarters of the base case scenario.
| | | | | | | | | | | | | | | | | |
| At 31 December 2020 | | At 31 December 2019 |
| 10pp increase
in HPI | 10pp decrease
in HPI | | 10pp increase
in HPI | 10pp decrease
in HPI |
| ECL impact, £m | (206) | | 284 | | | (110) | | 147 | |
NOTES TO THE ACCOUNTS
for the year ended 31 December 2020
3 CRITICAL ACCOUNTING JUDGEMENTS AND ESTIMATES (continued)
The table below shows the impact on the Group’s ECL resulting from a 1 percentage point (pp) increase or decrease in the UK unemployment rate. The increase or decrease is presented based on the adjustment phased evenly over the first ten quarters of the base case scenario. An immediate increase or decrease would drive a more material ECL impact as it would be fully reflected in both 12 month and lifetime PDs.
| | | | | | | | | | | | | | | | | |
| At 31 December 2020 | | At 31 December 2019 |
| 1pp increase in
unemployment | 1pp decrease in
unemployment | | 1pp increase in
unemployment | 1pp decrease in
unemployment |
| £m | £m | | £m | £m |
| UK mortgages | 25 | | (23) | | | 33 | | (34) | |
| Other Retail | 54 | | (54) | | | 39 | | (54) | |
| Commercial Banking | 123 | | (110) | | | 68 | | (54) | |
| Other | 1 | | (1) | | | 1 | | (1) | |
| ECL impact | 203 | | (188) | | | 141 | | (143) | |
Individual assessments
Stage 3 ECL in Commercial Banking is largely assessed on an individual basis using bespoke assessment of loss for each specific client. These assessments are carried out by the Business Support Unit based on detailed reviews and expected recovery strategies. While these assessments are based on the Group’s latest economic view, the use of group-wide multiple economic scenarios and weightings is not considered appropriate for these cases due to their individual characteristics. In place of this a range of case specific outcomes are considered with any alternative better or worse outcomes that carry a 25 per cent likelihood taken into account in establishing a probability-weighted ECL. At 31 December 2020 individually assessed provisions for Commercial Banking were £1,215 million (2019: £812 million) which reflected a range of £977 million to £1,536 million (2019: £438 million to £1,095 million), based on the range of alternative outcomes considered.
Application of judgement in adjustments to modelled ECL
Impairment models fall within the Group’s Model Risk framework with model monitoring, periodic validation and back testing performed on model components (i.e. probability of default, exposure at default and loss given default). Limitations in the Group’s impairment models or data inputs, may be identified through the ongoing assessment and validation of the output of the models. In these circumstances, management make appropriate adjustments to the Group’s allowance for impairment losses to ensure that the overall provision adequately reflects all material risks. These adjustments are determined by considering the particular attributes of exposures which have not been adequately captured by the impairment models and range from changes to model inputs and parameters, at account level, through to more qualitative post-model overlays.
Judgements are not typically assessed under each distinct economic scenario used to generate ECL, but instead are applied on the basis of final modelled ECL which reflects the probability weighted view of all scenarios. All adjustments are reviewed quarterly and are subject to internal review and challenge, including by the Audit Committee, to ensure that amounts are appropriately calculated and that there are specific release criteria within a reasonable timeframe.
At 31 December 2020 the coronavirus pandemic and the various support measures that have been put in place have resulted in an economic environment which differs significantly from the historical economic conditions upon which the impairment models have been built. As a result there is a greater need for management judgements to be applied alongside the use of models. At 31 December 2020 management judgement resulted in additional ECL allowances totalling £1,333 million (2019: £153 million). This comprises judgements added due to COVID-19 in the year and other judgements not directly linked to COVID-19 but which have increased in size under the current outlook. The table below analyses total ECL allowance at 31 December 2020 by portfolio, separately identifying the amounts that have been modelled, those that have been individually assessed and those arising through the application of management judgement.
| | | | | | | | | | | | | | | | | |
| Modelled
ECL | Individually
assessed | Judgements
due to
COVID-191 | Other
judgements | Total ECL |
| £m | £m | £m | £m | £m |
| At 31 December 2020 | | | | | |
| UK mortgages | 481 | | 0 | | 36 | | 510 | | 1,027 | |
| Other Retail | 2,060 | | 0 | | 321 | | (13) | | 2,368 | |
| Commercial Banking | 1,021 | | 1,215 | | 81 | | (2) | | 2,315 | |
| Other | 22 | | 0 | | 400 | | 0 | | 422 | |
| Total | 3,584 | | 1,215 | | 838 | | 495 | | 6,132 | |
| At 31 December 2019 | | | | | |
| UK mortgages | 386 | | 0 | | 0 | | 183 | | 569 | |
| Other Retail | 1,531 | | 0 | | 0 | | (10) | | 1,521 | |
| Commercial Banking | 471 | | 812 | | 0 | | (20) | | 1,263 | |
| Other | 27 | | 0 | | 0 | | 0 | | 27 | |
| Total | 2,415 | | 812 | | 0 | | 153 | | 3,380 | |
1Judgements introduced in 2020 due to the impact that COVID-19 and resulting interventions have had on the Group’s economic outlook and observed loss experience, which have required additional model limitations to be addressed.
NOTES TO THE ACCOUNTS
for the year ended 31 December 2020
3 CRITICAL ACCOUNTING JUDGEMENTS AND ESTIMATES (continued)
Judgements due to COVID-19
UK mortgages: £36 million
This reflects an adjustment made to reflect an increase in the time assumed between default and repossession as a result of the Group temporarily suspending the repossession of properties to support customers during the pandemic.
Other Retail: £321 million
These adjustments principally comprise:
Recognition of impact of support measures: £218 million
The use of payment holidays along with subdued levels of consumer spending is judged to have temporarily reduced the flow of accounts into arrears and default and to have also improved average credit scores across portfolios. Management believes that the resulting position does not fully reflect the underlying credit risk in the portfolios. Adjustments have therefore been made to increase expected future rates of default and remove the impact of the observed improvement in average credit scores.
Incorporation of forward-looking LGDs: £86 million
Modelled LGDs in non-mortgage Retail portfolios are predominantly based on observed customer behaviour and resulting incurred losses. Management believes that this may not be representative of future experience, given the current economic outlook, and consequently an adjustment has been made to increase forward-looking LGDs to reflect a deterioration in cure and recovery rates. The impact has been estimated by using experience of losses in previous downturns and management’s view of relative comparability of anticipated economic scenarios.
Commercial Banking: £81 million
This adjustment principally comprises:
Adjustment to economic variables used as inputs to models: £91 million
Management does not believe that the observed corporate insolvency rates used as an input to Commercial default models adequately reflect the current economic situation and outlook given the temporary government support. As a result, the observed reductions in the rate of insolvencies have been replaced with an increase proportionate to that seen in unemployment to generate a level of predicted defaults.
Other: £400 million
Central overlay in respect of economic uncertainty: £400 million
An important element of the methodology used to calculate the Group’s ECL allowance is the determination of a base case economic scenario, predicated on certain conditioning assumptions, from which alternative scenarios are derived using stochastic shocks. The rapid evolution of the pandemic and significant changes that this has brought about could continue into 2021 and may partially invalidate the conditioning assumptions that underpin the Group’s base case scenario. Management believes that the risks to the conditioning assumptions around the base case scenario are markedly to the downside, reflecting notably the potential for a material delay in the vaccination programme or reduction in its effectiveness from further virus mutation and the corresponding delayed withdrawal of restrictions on social interaction or introduction of further lockdowns. The Group's ECL allowances are required to reflect an unbiased probability-weighted view of all possible future outcomes and therefore management believes that an adjustment is required to capture these additional risks.
An adjustment of £400 million has been made to increase the Group’s ECL allowances to reflect this increased uncertainty around the conditioning assumptions. This equates to a 1 percentage point increase in unemployment allied with a 5 per cent lower HPI in 2021, reflecting a more immediate and therefore greater ECL impact than the gradual increase reflected in the stated univariate sensitivity. It is proportionate to the level of volatility seen in forecasts as the pandemic has unfolded and is also equivalent to a 10 per cent re-weighting from the upside to the severe downside scenario. The adjustment, which has not been allocated to a specific portfolio, has been allocated against Stage 1 assets given the downside risks are largely considered to relate to exposures with currently low default probabilities, the majority of which are in Stage 1. Through 2021 the scale of the uncertainty is expected to diminish and the need for this adjustment will then be reassessed.
Other judgements
UK mortgages: £510 million (2019: £183 million)
These adjustments principally comprise:
Adjustment to modelled forecast parameters: £193 million (2019: £NaN)
Adjustments have been required to the estimated defaults used within the ECL calculation for UK mortgages following the adoption of new default forecast models. Forecast models which predict quarterly defaults based on several economic variables have been developed using the response from the previous recession, as per usual modelling best practice. However, management believe further adjustments are necessary when the results of these models have been benchmarked to observed levels, given the atypical nature of the current economic outlook. These were derived using historical observed default rates under previous downturn conditions to ensure that the resulting forecast best reflected management’s view given the current economic outlook. The adjustment to forward looking parameters prior to their use in ECL calculations ensures that all downstream account level calculations reflect the Group’s best view of credit losses in respect of the economic scenarios stated. As such this in-model adjustment is reflected within all scenarios, assessment of staging and in subsequent assessment of all post-model adjustments.
End-of-term interest only: £179 million (2019: £132 million)
The current definition of default used in the UK mortgages impairment model excludes past term interest only accounts that continue to make interest payments but have missed their capital payment upon maturity of the loan. This adjustment therefore mitigates the risk that the model understates the credit losses associated with interest-only accounts which have missed, or will potentially miss, their final capital payment. For those accounts that have reached end of term this adjustment manually overwrites PDs to 70 per cent or 100 per cent, thereby moving them into Stage 2, or Stage 3, depending on whether they are deemed performing, or non-performing respectively. For interest-only accounts with six years or less to maturity an appropriate incremental PD uplift is made to PDs based on the probability of missing a future capital payment, assessed through segmentation of behaviour score, debt-to-value and worst ever arrears status. The increase in the judgement in 2020 is primarily driven by an increase in the stock of long-term defaults following COVID-19 related litigation suspension.
NOTES TO THE ACCOUNTS
for the year ended 31 December 2020
3 CRITICAL ACCOUNTING JUDGEMENTS AND ESTIMATES (continued)
Long-term defaults: £87 million (2019: £33 million)
The Group suspended mortgage litigation activity between late 2014 and mid 2018 as changes were implemented to the treatment of amounts in arrears, interrupting the natural flow of accounts to possession. An adjustment is made to ensure adequate provision coverage considering the resulting build-up of accounts in long term default. Coverage is uplifted to the equivalent levels of those accounts already in repossession on an estimated shortfall of balances expected to flow to possession. A further adjustment is made to mitigate for the risk that credit model provision understates the probability of possession for accounts which have been in default for more than 24 months, with an arrears balance increase in the last 6 months. These accounts have their probability of possession set to 95 per cent based on observed historical losses incurred on accounts that were of an equivalent status. The increase in judgement in 2020 is primarily driven by an increase in the stock of long-term defaults following COVID-19 related litigation suspension.
Other Retail: £(13) million (2019: £(10) million)
These adjustments principally comprise:
Lifetime extension on revolving products: £81 million (2019: £36 million)
Unsecured revolving products use a model lifetime definition of three years based on historic data which shows that substantially all accounts resolve in this time. An adjustment is made to extend the lifetime used for Stage 2 exposures to six years by adding incremental probability of default through the extrapolation of the default trajectory observed throughout the three years and beyond. The resulting additional ECL allowance is added to Stage 2 accounts proportionate to the modelled three year PD. The increase in the judgement in 2020 is driven by growth in Stage 2 assets and their coverage, rather than any change to the lifetime assumption.
Unsecured non-scored accounts: £(72) million (2019: £NaN)
Due to a shortcoming in the models, it is not possible to retrieve relevant credit data for a number of accounts and therefore no PD is available and no assessment of whether there has been a SICR can be carried out. The model defaults these accounts to Stage 2 and a proxy ECL allowance is calculated based on similar accounts within the portfolio. The deterioration in the economic outlook and growth in the number of accounts subject to this proxy have resulted in this approach having a more significant effect and an exercise has been carried out to identify and adjust those accounts which should not have been allocated to Stage 2.
Credit Card LGD alignment: £(55) million (2019: £(22) million)
The MBNA impairment model was developed using historical MBNA data. Following the acquisition of the business and the subsequent migration of this portfolio to Lloyds Banking Group collections strategies an adjustment is required to reflect the recent improvement in cure rates now evident as collections strategies harmonise, which are not captured by the original MBNA model development data.
Defined benefit pension scheme obligations
| | | | | |
| Key estimates: | Discount rate applied to future cash flows |
| Expected lifetime of the schemes' members |
The net asset recognised in the balance sheet at 31 December 2020 in respect of the Group’s defined benefit pension scheme obligations was £1,578 million comprising an asset of £1,714 million and a liability of £136 million (2019: a net asset of £550 million comprising an asset of £681 million and a liability of £131 million); and for the Bank was £727 million (comprising an asset of £765 million and a liability of £38 million) (2019: a net asset of £347 million comprising an asset of £386 million and a liability of £39 million). The Group’s accounting policy for its defined benefit pension scheme obligations is set out in note 2(K).
The accounting valuation of the Group’s defined benefit pension schemes’ liabilities requires management to make a number of assumptions. The key areas of estimation uncertainty are the discount rate applied to future cash flows and the expected lifetime of the schemes’ members.
The discount rate is required to be set with reference to market yields at the end of the reporting period on high quality corporate bonds in the currency of and with a term consistent with the defined benefit pension schemes’ obligations. The average duration of the schemes’ obligations is approximately 19 years. The market for bonds with a similar duration is limited and, as a result, significant management judgement is required to determine an appropriate yield curve on which to base the discount rate. Assuming that there is no change in other assumptions or in the value of the schemes' assets, the effect on the net accounting surplus at 31 December 2020 of a decrease of 10 basis points in the discount rate would be a reduction of £890 million (2019: £784 million). To the extent that changes in the discount rate arise from changes in gilt yields, rather than credit spreads, the impact is largely mitigated by the schemes' asset-liability matching strategies.
The cost of the benefits payable by the schemes will also depend upon the life expectancy of the members. The mortality assumptions used by the Group are based on standard industry tables for both current mortality rates and the rate of future mortality improvement, adjusted in line with the actual experience of the Group's schemes. Assuming that there is no change in other assumptions or in the value of the schemes' assets, the effect on the net accounting surplus at 31 December 2020 of an increase of one year in the average life of scheme members would be a reduction of £2,146 million (2019: £1,636 million). The Group has in place a longevity swap, as described in note 28, to partially mitigate mortality risk.
Further sensitivities and the balance sheet impact of changes in the principal actuarial assumptions are provided in part (v) of note 28.
Recoverability of deferred tax assets and uncertain tax positions
| | | | | |
| Key judgements: | Assessing the likely level of future taxable profits taking into account the Group’s long-term financial and strategic plans |
| Interpreting tax rules on the Group’s open tax matters |
At 31 December 2020 the Group carried deferred tax assets on its balance sheet of £3,468 million (2019: £3,366 million) and the Bank carried deferred tax assets of £2,109 million (2019: £2,029 million) principally relating to tax losses carried forward. Further information on the Group's deferred tax assets and uncertain tax positions is provided in notes 29 and 40 respectively.
Estimation of income taxes includes the assessment of recoverability of deferred tax assets. Deferred tax assets are only recognised to the extent that they are considered more likely than not to be recoverable based on existing tax laws and forecasts of future taxable profits against which the underlying tax deductions can be utilised. The Group has recognised a deferred tax asset of £4,054 million (2019: £3,600 million), and the Bank £2,507 million (2019: £2,198 million) in respect of trading losses carried forward. Substantially all of these losses have arisen in Bank of Scotland plc and Lloyds Bank plc, and they will be utilised as taxable profits arise in those legal entities in future periods.
NOTES TO THE ACCOUNTS
for the year ended 31 December 2020
3 CRITICAL ACCOUNTING JUDGEMENTS AND ESTIMATES (continued)
The Group’s expectations of future UK taxable profits require management judgement, and take into account the Group’s long-term financial and strategic plans and anticipated future tax-adjusting items. In making this assessment, account is taken of business plans, the Board-approved operating plan and the expected future economic outlook as set out in the strategic report, as well as the risks associated with future regulatory change, in order to produce a base case forecast of future UK taxable profits. Under current law there is no expiry date for UK trading losses not yet utilised, and given the forecast of future profitability and the Group’s commitment to the UK market, it is more likely than not that the value of the losses will be recovered at some point in the future. Banking tax losses that arose before 1 April 2015 can only be used against 25 per cent of taxable profits arising after 1 April 2016, and they cannot be used to reduce the surcharge on banking profits. These restrictions in utilisation mean that the value of the deferred tax asset in respect of tax losses is only expected to be fully recovered by 2049 (2019: 2039) in the base case forecast. The rate of recovery of the Group’s tax loss asset is not a straight line, being affected by the relative profitability of the legal entities in future periods, and the relative size of their tax losses carried forward. It is expected in the base case that 60 per cent of the value will be recovered by 2034, when Bank of Scotland plc will have utilised all of its available tax losses. It is possible that future tax law changes could materially affect the timing of recovery and the value of these losses ultimately realised by the Group. The value of the deferred tax asset in respect of tax losses increased by £420 million in 2020 as a result of the change in UK tax rates (see note 29).
As disclosed in note 40, the Group has an open matter in relation to a claim for group relief of losses incurred in its former Irish banking subsidiary, where the final tax position will remain uncertain until the matter is finally determined by judicial process.
Regulatory provisions
| | | | | |
| Key judgements: | Determining the scope of reviews required by regulators |
| The impact of legal decisions that may be relevant to claims received |
| Key estimates: | The number of future complaints |
| The proportion of complaints that will be upheld |
| The average cost of redress |
At 31 December 2020, the Group carried provisions of £520 million (2019: £2,269 million) and the Bank £140 million (2019: £783 million) against the cost of making redress payments to customers and the related administration costs in connection with historical regulatory breaches.
Determining the amount of the provisions, which represent management’s best estimate of the cost of settling these issues, requires the exercise of significant judgement and estimation. It will often be necessary to form a view on matters which are inherently uncertain, such as the scope of reviews required by regulators, and to estimate the number of future complaints, the extent to which they will be upheld, the average cost of redress and the impact of decisions reached by legal and other review processes that may be relevant to claims received. Consequently the continued appropriateness of the underlying assumptions is reviewed on a regular basis against actual experience and other relevant evidence and adjustments made to the provisions where appropriate.
Fair value of financial instruments
| | | | | |
| Key estimates: | Interest rate spreads, earnings multiples and interest rate volatility |
At 31 December 2020, the carrying value of the Group’s financial instrument assets held at fair value was £37,275 million (2019: £35,395 million), and its financial instrument liabilities held at fair value was £15,059 million (2019: £17,533 million). The carrying value of the Bank’s financial instrument assets held at fair value was £38,966 million (2019: £36,501 million) and financial instrument liabilities held at fair value was £18,979 million (2019: £21,908 million).
The valuation techniques for level 3 financial instruments involve management judgement and estimates the extent of which depends on the complexity of the instrument and the availability of market observable information. In addition, in line with market practice, the Group applies credit, debit and funding valuation adjustments in determining the fair value of its uncollateralised derivative positions. A description of these adjustments is set out in note 42.
Recoverability of other intangible assets
| | | | | |
| Key judgements: | Assessing future trading conditions that could affect the Group’s business operations |
| Assessing whether certain of the Group’s purchased brands have an indefinite life |
| Key estimates: | The value-in-use calculations require management to estimate future cash flows, appropriate discount rates for those cash flows and long-term sustainable growth rates |
| Estimated useful life of internally generated capitalised software |
At 31 December 2020, the carrying value of the Group’s other intangible assets was £4,112 million (2019: £3,781 million), including capitalised software enhancements of £3,281 million (2019: £2,880 million) and brands of £380 million (2019: £380 million).
In determining the estimated useful life of capitalised software enhancements, management consider the product's lifecycle and the Group's technology strategy; assets are reviewed annually to assess whether there is any indication of impairment and to confirm that the remaining estimated useful life is still appropriate. For the year ended 31 December 2020, the amortisation charge was £583 million and at 31 December 2020, the weighted-average remaining estimated useful life of the Group’s capitalised software enhancements was 4.9 years (2019: 4.7 years). If the Group reduced by one year the estimated useful life of those assets with a remaining estimated useful life of more than two years at 31 December 2020, the 2021 amortisation charge would be approximately £175 million higher.
Brands arising from the acquisition of Bank of Scotland in 2009 are recognised on the Group's balance sheet and have been determined to have an indefinite useful life. The carrying value at 31 December 2020 was £380 million (2019: £380 million). The recoverable amount has been based on a value-in-use calculation. The calculation uses post-tax projections of the income generated by the brands, a discount rate of 9.31 per cent and a future growth rate of 2.5 per cent . Management estimates that if the growth rate were decreased by 1 per cent there would have been an impairment charge of £50 million.
NOTES TO THE ACCOUNTS
for the year ended 31 December 2020
4 SEGMENTAL ANALYSIS
The Group provides a wide range of banking and financial services in the UK and in certain locations overseas. The Group Executive Committee (GEC) of the Lloyds Banking Group has been determined to be the chief operating decision maker for the Group. The Group’s operating segments reflect its organisational and management structures. The GEC reviews the Group’s internal reporting based around these segments in order to assess performance and allocate resources. GEC considers interest income and expense on a net basis and consequently the total interest income and expense for all reportable segments is presented net. The segments are differentiated by the type of products provided and by whether the customers are individuals or corporate entities.
During 2020, the Group migrated certain customer relationships from the SME business within Commercial Banking to Business Banking within Retail; the Group has also revised its approach to internal funding charges, including the adoption of the Sterling Overnight Index Average (SONIA) interest rate benchmark in place of LIBOR. Comparatives have been restated accordingly.
The Group’s activities are organised into 2 financial reporting segments: Retail and Commercial Banking.
Retail offers a broad range of financial service products, including current accounts, savings, mortgages, motor finance and unsecured consumer lending to personal and small business customers.
Commercial Banking provides a range of products and services such as lending, transactional banking, working capital management, risk management and debt capital markets services to SMEs, corporates and financial institutions.
Income and expenditure not attributed to these financial reporting segments, including the costs of certain central and head office functions, is disclosed as Other.
Inter-segment services are generally recharged at cost, although some attract a margin. Inter-segment lending and deposits are generally entered into at market rates, except that non-interest bearing balances are priced at a rate that reflects the external yield that could be earned on such funds.
For the majority of those derivative contracts entered into by business units for risk management purposes, the business unit recognises the net interest income or expense on an accrual accounting basis and transfers the remainder of the movement in the fair value of the derivative to the central function where the resulting accounting volatility is managed where possible through the establishment of hedge accounting relationships. Any change in fair value of the hedged instrument attributable to the hedged risk is also recorded within the central function. This allocation of the fair value of the derivative and change in fair value of the hedged instrument attributable to the hedged risk avoids accounting asymmetry in segmental results and leads to accounting volatility, which is managed centrally and reported within Other.
NOTES TO THE ACCOUNTS
for the year ended 31 December 2020
4 SEGMENTAL ANALYSIS (continued)
| | | | | | | | | | | | | | |
| Retail | Commercial
Banking | Other | Group |
| £m | £m | £m | £m |
| Year ended 31 December 2020 | | | | |
| Net interest income | 8,321 | | 2,300 | | 149 | | 10,770 | |
| Other income | 1,735 | | 673 | | 1,407 | | 3,815 | |
| Total income | 10,056 | | 2,973 | | 1,556 | | 14,585 | |
| Costs | (5,816) | | (1,673) | | (1,707) | | (9,196) | |
| Impairment charge | (2,384) | | (1,280) | | (396) | | (4,060) | |
| Profit (loss) before tax | 1,856 | | 20 | | (547) | | 1,329 | |
| External income | 11,859 | | 2,496 | | 230 | | 14,585 | |
| Inter-segment income | (1,803) | | 477 | | 1,326 | | 0 | |
| Segment income | 10,056 | | 2,973 | | 1,556 | | 14,585 | |
| Segment external assets | 359,171 | | 83,155 | | 157,613 | | 599,939 | |
| Segment external liabilities | 295,216 | | 126,008 | | 137,597 | | 558,821 | |
| Analysis of segment other income: | | | | |
| Current accounts | 497 | | 109 | | 4 | | 610 | |
| Credit and debit card fees | 517 | | 231 | | 0 | | 748 | |
| Commercial banking fees | 0 | | 169 | | 0 | | 169 | |
| Private banking and asset management | 0 | | 0 | | 1 | | 1 | |
| Factoring | 0 | | 76 | | 0 | | 76 | |
| Other fees and commissions | 63 | | 157 | | 100 | | 320 | |
| Fees and commissions receivable | 1,077 | | 742 | | 105 | | 1,924 | |
| Fees and commissions payable | (571) | | (195) | | (143) | | (909) | |
| Net fee and commission income | 506 | | 547 | | (38) | | 1,015 | |
| Operating lease rental income | 1,104 | | 16 | | 0 | | 1,120 | |
| Gains less losses on disposal of financial assets at fair value through other comprehensive income | 0 | | 0 | | 145 | | 145 | |
| Other income | 125 | | 110 | | 1,300 | | 1,535 | |
| Segment other income | 1,735 | | 673 | | 1,407 | | 3,815 | |
| Other segment items reflected in income statement above: | | | | |
| Depreciation and amortisation | 1,760 | | 242 | | 668 | | 2,670 | |
| Defined benefit scheme charges | 97 | | 28 | | 122 | | 247 | |
| Other segment items: | | | | |
| Additions to fixed assets | 1,684 | | 89 | | 1,042 | | 2,815 | |
| Investments in joint ventures and associates at end of year | 4 | | 0 | | 0 | | 4 | |
NOTES TO THE ACCOUNTS
for the year ended 31 December 2020
4 SEGMENTAL ANALYSIS (continued)
| | | | | | | | | | | | | | |
| Retail | Commercial
Banking | Other | Group |
| £m | £m | £m | £m |
Year ended 31 December 20191 | | | | |
| Net interest income | 9,129 | | 2,691 | | 400 | | 12,220 | |
| Other income | 2,025 | | 870 | | 1,493 | | 4,388 | |
| Total income | 11,154 | | 3,561 | | 1,893 | | 16,608 | |
| Costs | (7,912) | | (1,818) | | (1,393) | | (11,123) | |
| Impairment charge | (1,038) | | (313) | | (11) | | (1,362) | |
| Profit before tax | 2,204 | | 1,430 | | 489 | | 4,123 | |
| External income | 13,111 | | 2,773 | | 724 | | 16,608 | |
| Inter-segment income | (1,957) | | 788 | | 1,169 | | 0 | |
| Segment income | 11,154 | | 3,561 | | 1,893 | | 16,608 | |
| Segment external assets | 351,301 | | 89,630 | | 140,437 | | 581,368 | |
| Segment external liabilities | 261,019 | | 125,240 | | 156,210 | | 542,469 | |
| Analysis of segment other income: | | | | |
| Current accounts | 518 | | 133 | | 5 | | 656 | |
| Credit and debit card fees | 634 | | 327 | | 0 | | 961 | |
| Commercial banking fees | 0 | | 166 | | 0 | | 166 | |
| Private banking and asset management | 0 | | 0 | | 38 | | 38 | |
| Factoring | 0 | | 103 | | 0 | | 103 | |
| Other fees and commissions | 68 | | 219 | | 152 | | 439 | |
| Fees and commissions receivable | 1,220 | | 948 | | 195 | | 2,363 | |
| Fees and commissions payable | (571) | | (299) | | (157) | | (1,027) | |
| Net fee and commission income | 649 | | 649 | | 38 | | 1,336 | |
| Operating lease rental income | 1,225 | | 22 | | 0 | | 1,247 | |
| Gains less losses on disposal of financial assets at fair value through other comprehensive income | 0 | | (5) | | 201 | | 196 | |
| Other income | 151 | | 204 | | 1,254 | | 1,609 | |
| Segment other income | 2,025 | | 870 | | 1,493 | | 4,388 | |
| Other segment items reflected in income statement above: | | | | |
| Depreciation and amortisation | 1,712 | | 315 | | 575 | | 2,602 | |
| Defined benefit scheme charges | 108 | | 43 | | 94 | | 245 | |
| Other segment items: | | | | |
| Additions to fixed assets | 2,208 | | 247 | | 1,097 | | 3,552 | |
| Investments in joint ventures and associates at end of year | 3 | | 0 | | 0 | | 3 | |
1Restated, see page F-31.
NOTES TO THE ACCOUNTS
for the year ended 31 December 2020
4 SEGMENTAL ANALYSIS (continued)
| | | | | | | | | | | | | | |
| Retail | Commercial
Banking | Other | Continuing
operations |
| £m | £m | £m | £m |
Year ended 31 December 20181 | | | | |
| Net interest income | 9,379 | | 2,893 | | 482 | | 12,754 | |
| Other income | 1,922 | | 1,447 | | 851 | | 4,220 | |
| Total income | 11,301 | | 4,340 | | 1,333 | | 16,974 | |
| Costs | (7,709) | | (2,160) | | (1,899) | | (11,768) | |
| Impairment (charge) credit | (861) | | (80) | | 15 | | (926) | |
| Profit (loss) before tax | 2,731 | | 2,100 | | (551) | | 4,280 | |
| External income | 12,924 | | 3,722 | | 328 | | 16,974 | |
| Inter-segment income | (1,623) | | 618 | | 1,005 | | 0 | |
| Segment income | 11,301 | | 4,340 | | 1,333 | | 16,974 | |
| Segment external assets | 349,755 | | 115,444 | | 128,325 | | 593,524 | |
| Segment external liabilities | 261,457 | | 137,172 | | 155,145 | | 553,774 | |
| Analysis of segment other income: | | | | |
| Current accounts | 503 | | 139 | | 5 | | 647 | |
| Credit and debit card fees | 646 | | 328 | | 0 | | 974 | |
| Commercial banking fees | 0 | | 271 | | 0 | | 271 | |
| Private banking and asset management | 0 | | 2 | | 92 | | 94 | |
| Factoring | 0 | | 83 | | 0 | | 83 | |
| Other fees and commissions | 57 | | 248 | | 123 | | 428 | |
| Fees and commissions receivable | 1,206 | | 1,071 | | 220 | | 2,497 | |
| Fees and commissions payable | (757) | | (310) | | (161) | | (1,228) | |
| Net fee and commission income | 449 | | 761 | | 59 | | 1,269 | |
| Operating lease rental income | 1,305 | | 36 | | 0 | | 1,341 | |
| Gains less losses on disposal of financial assets at fair value through other comprehensive income | 0 | | 0 | | 268 | | 268 | |
| Other income | 168 | | 650 | | 524 | | 1,342 | |
| Segment other income | 1,922 | | 1,447 | | 851 | | 4,220 | |
| Other segment items reflected in income statement above: | | | | |
| Depreciation and amortisation | 1,573 | | 278 | | 498 | | 2,349 | |
| Defined benefit scheme charges | 121 | | 48 | | 231 | | 400 | |
| Other segment items: | | | | |
| Additions to fixed assets | 2,092 | | 208 | | 1,078 | | 3,378 | |
| Investments in joint ventures and associates at end of year | 4 | | 0 | | 1 | | 5 | |
1Restated, see page F-31.
The Group’s operations are predominantly UK-based and as a result an analysis between UK and non-UK activities is not provided.
The Group’s discontinued operations in 2018 were previously in its Insurance segment (see note 13).
NOTES TO THE ACCOUNTS
for the year ended 31 December 2020
5 NET INTEREST INCOME
| | | | | | | | | | | | | | | | | | | | | | | |
| Weighted average
effective interest rate | | | | |
| 2020 | 2019 | 2018 | | 2020 | 2019 | 2018 |
| % | % | % | | £m | £m | £m |
| Interest income: | | | | | | | |
| Loans and advances to customers | 2.76 | | 3.21 | | 3.23 | | | 13,358 | | 15,281 | | 15,049 | |
| Loans and advances to banks | 0.20 | | 0.57 | | 0.76 | | | 114 | | 269 | | 462 | |
| Debt securities | 1.82 | | 2.26 | | 1.61 | | | 92 | | 118 | | 66 | |
| Interest income on financial assets held at amortised cost | 2.48 | | 2.97 | | 2.93 | | | 13,564 | | 15,668 | | 15,577 | |
| Financial assets at fair value through other comprehensive income | 1.12 | | 1.64 | | 1.98 | | | 302 | | 430 | | 639 | |
Total interest income1 | 2.42 | | 2.90 | | 2.88 | | | 13,866 | | 16,098 | | 16,216 | |
| Interest expense: | | | | | | | |
| Deposits from banks, excluding liabilities under sale and repurchase transactions | 1.19 | | 1.39 | | 1.36 | | | (82) | | (87) | | (81) | |
| Customer deposits, excluding liabilities under sale and repurchase transactions | 0.40 | | 0.65 | | 0.60 | | | (1,270) | | (2,054) | | (1,997) | |
Debt securities in issue2 | 1.13 | | 0.71 | | 0.10 | | | (761) | | (476) | | (66) | |
| Subordinated liabilities | 7.19 | | 9.89 | | 10.18 | | | (827) | | (921) | | (1,072) | |
| Lease liabilities | 2.36 | | 2.41 | | 2.44 | | | (39) | | (39) | | (1) | |
| Liabilities under sale and repurchase agreements | 0.36 | | 1.08 | | 0.87 | | | (117) | | (301) | | (245) | |
Total interest expense3 | 0.71 | | 0.91 | | 0.78 | | | (3,096) | | (3,878) | | (3,462) | |
| Net interest income | | | | | 10,770 | | 12,220 | | 12,754 | |
1Includes £10 million (2019: £26 million; 2018: £31 million) of interest income on liabilities with negative interest rates and £42 million (2019: £39 million; 2018: £45 million) in respect of interest income on finance leases.
2The impact of the Group’s hedging arrangements is included on this line; excluding this impact the weighted average effective interest rate in respect of debt securities in issue would be 2.42 per cent (2019: 2.25 per cent; 2018: 2.74 per cent).
3Includes £23 million (2019: £119 million; 2018: £10 million) of interest expense on assets with negative interest rates.
Included within interest income is £170 million (2019: £196 million; 2018: £222 million) in respect of credit-impaired financial assets. Net interest income also includes a credit of £727 million (2019: credit of £580 million; 2018: credit of £691 million) transferred from the cash flow hedging reserve (see note 34).
6 NET FEE AND COMMISSION INCOME
| | | | | | | | | | | |
| 2020 | 2019 | 2018 |
| £m | £m | £m |
| Fee and commission income: | | | |
| Current accounts | 610 | | 656 | | 647 | |
| Credit and debit card fees | 748 | | 961 | | 974 | |
| Commercial banking fees | 169 | | 166 | | 271 | |
| Private banking and asset management | 1 | | 38 | | 94 | |
| Factoring | 76 | | 103 | | 83 | |
| Other fees and commissions | 320 | | 439 | | 428 | |
| Total fee and commission income | 1,924 | | 2,363 | | 2,497 | |
| Fee and commission expense | (909) | | (1,027) | | (1,228) | |
| Net fee and commission income | 1,015 | | 1,336 | | 1,269 | |
Fees and commissions which are an integral part of the effective interest rate form part of net interest income shown in note 5. Fees and commissions relating to instruments that are held at fair value through profit or loss are included within net trading income shown in note 7.
At 31 December 2020, the Group held on its balance sheet £76 million (31 December 2019: £105 million) in respect of services provided to customers and £83 million (31 December 2019: £120 million) in respect of amounts received from customers for services to be provided after the balance sheet date. Current unsatisfied performance obligations amount to £172 million (31 December 2019: £250 million); the Group expects to receive substantially all of this revenue by 2023.
NOTES TO THE ACCOUNTS
for the year ended 31 December 2020
6 NET FEE AND COMMISSION INCOME (continued)
Income recognised during the year included £18 million (31 December 2019: £54 million) in respect of amounts included in the contract liability balance at the start of the year and £NaN (31 December 2019: £9 million) in respect of amounts from performance obligations satisfied in previous years.
The most significant performance obligations undertaken by the Group are in respect of current accounts, the provision of other banking services for commercial customers and credit and debit card services.
In respect of current accounts, the Group receives fees for the provision of bank account and transaction services such as ATM services, fund transfers, overdraft facilities and other value-added offerings.
For commercial customers, alongside its provision of current accounts, the Group provides other corporate banking services including factoring and commitments to provide loan financing. Loan commitment fees are included in fees and commissions where the loan is not expected to be drawn down by the customer.
The Group receives interchange and merchant fees, together with fees for overseas use and cash advances, for provision of card services to cardholders and merchants.
7 NET TRADING INCOME
| | | | | | | | | | | |
| 2020 | 2019 | 2018 |
| £m | £m | £m |
| Foreign exchange translation gains (losses) | 74 | | (203) | | 132 | |
| Gains on foreign exchange trading transactions | 326 | | 336 | | 235 | |
| Total foreign exchange | 400 | | 133 | | 367 | |
| Investment property losses (note 21) | (20) | | (8) | | 0 | |
| Securities and other gains (see below) | 370 | | 235 | | 41 | |
| Net trading income | 750 | | 360 | | 408 | |
Securities and other gains comprise net gains (losses) arising on assets and liabilities held at fair value through profit or loss as follows:
| | | | | | | | | | | | | | | | | |
| 2020 | | 2019 | | 2018 |
| £m | | £m | | £m |
| Net income arising on assets and liabilities mandatorily held at fair value through profit or loss: | | | | | |
| Financial instruments held for trading | 440 | | | 427 | | | 127 | |
| Other financial instruments mandatorily held at fair value through profit or loss: | | | | | |
| Debt securities, loans and advances | 37 | | | 25 | | | 11 | |
| Equity shares | 9 | | | (3) | | | 86 | |
| 486 | | | 449 | | | 224 | |
| Net expense arising on assets and liabilities designated at fair value through profit or loss | (116) | | | (214) | | | (183) | |
| Securities and other gains | 370 | | | 235 | | | 41 | |
8 OTHER OPERATING INCOME
| | | | | | | | | | | |
| 2020 | 2019 | 2018 |
| £m | £m | £m |
| Operating lease rental income | 1,120 | | 1,247 | | 1,341 | |
| Gains less losses on disposal of financial assets at fair value through other comprehensive income (note 34) | 145 | | 196 | | 268 | |
| Liability management | (216) | | (101) | | 0 | |
| Share of results of joint ventures and associates | 0 | | 0 | | 5 | |
| Intercompany recharges and other | 1,001 | | 1,350 | | 929 | |
| Total other operating income | 2,050 | | 2,692 | | 2,543 | |
NOTES TO THE ACCOUNTS
for the year ended 31 December 2020
9 OPERATING EXPENSES
| | | | | | | | | | | | | | | | | |
| 2020 | | 2019 | | 2018 |
| £m | | £m | | £m |
| Staff costs: | | | | | |
| Salaries | 2,382 | | | 2,370 | | | 2,379 | |
| Performance-based compensation | 106 | | | 340 | | | 485 | |
| Social security costs | 271 | | | 308 | | | 330 | |
| Pensions and other post-retirement benefit schemes (note 28) | 552 | | | 518 | | | 688 | |
| Restructuring costs | 161 | | | 89 | | | 247 | |
| Other staff costs | 143 | | | 360 | | | 444 | |
| 3,615 | | | 3,985 | | | 4,573 | |
| Premises and equipment: | | | | | |
| Rent and rates | 115 | | | 114 | | | 364 | |
| Repairs and maintenance | 172 | | | 182 | | | 189 | |
Other1 | 138 | | | 150 | | | 126 | |
| 425 | | | 446 | | | 679 | |
| Other expenses: | | | | | |
| Communications and data processing | 996 | | | 1,022 | | | 1,116 | |
| Advertising and promotion | 184 | | | 173 | | | 192 | |
| Professional fees | 128 | | | 144 | | | 230 | |
| Other | 760 | | | 561 | | | 673 | |
| 2,068 | | | 1,900 | | | 2,211 | |
| Depreciation and amortisation: | | | | | |
| Depreciation of property, plant and equipment (note 21) | 2,017 | | | 2,040 | | | 1,849 | |
| Amortisation of other intangible assets (note 20) | 653 | | | 562 | | | 500 | |
| 2,670 | | | 2,602 | | | 2,349 | |
| Goodwill impairment (note 19) | 4 | | | 0 | | | 0 | |
| Total operating expenses, excluding regulatory provisions | 8,782 | | | 8,933 | | | 9,812 | |
| Regulatory provisions: | | | | | |
| Payment protection insurance provision (note 30) | 85 | | | 1,795 | | | 1,395 | |
| Other regulatory provisions (note 30) | 329 | | | 395 | | | 561 | |
| 414 | | | 2,190 | | | 1,956 | |
| Total operating expenses | 9,196 | | | 11,123 | | | 11,768 | |
1Net of profits on disposal of operating lease assets of £127 million (2019: £41 million; 2018: £60 million).
The average number of persons on a headcount basis employed by the Group during the year was as follows:
| | | | | | | | | | | | | | | | | |
| 2020 | | 2019 | | 2018 |
| UK | 67,115 | | 69,321 | | 71,017 |
| Overseas | 515 | | 762 | | 769 |
| Total | 67,630 | | 70,083 | | 71,786 |
NOTES TO THE ACCOUNTS
for the year ended 31 December 2020
10 AUDITORS’ REMUNERATION
Fees payable to the Bank’s auditors
During the year the auditors earned the following fees:
| | | | | | | | | | | |
| 2020 | 2019 | 2018 |
| £m | £m | £m |
| Fees payable for the audit of the Bank’s current year annual report | 4.5 | | 4.2 | | 3.8 | |
| Fees payable for other services: | | | |
| Audit of the Bank’s subsidiaries pursuant to legislation | 8.9 | | 8.6 | | 10.2 | |
| Other services supplied pursuant to legislation | 1.6 | | 1.3 | | 1.5 | |
| Other services – audit-related fees | 0.3 | | 0.2 | | 0 | |
| All other services | 0.9 | | 0.3 | | 0.1 | |
| Total fees payable to the Bank’s auditors | 16.2 | | 14.6 | | 15.6 | |
Audit fees payable in respect of the statutory audit of Group entities totalled £13.4 million (2019: £12.8 million; 2018: £14.0 million) and non-audit fees, as defined by the Financial Reporting Council's Ethical Guidance, totalled £2.8 million (2019: £1.8 million; 2018: £1.6 million).
The following types of services are included in the categories listed above:
Audit fees: This category includes fees in respect of the audit of the Group’s annual financial statements and other services in connection with regulatory filings. Other services supplied pursuant to legislation relate primarily to costs incurred in connection with client asset assurance and with the Sarbanes-Oxley Act requirements associated with the audit of the financial statements of Lloyds Banking Group filed on Form 20-F.
Audit related fees: This category includes fees in respect of services for assurance and related services that are reasonably related to the performance of the audit or review of the financial statements, for example acting as reporting accountants in respect of debt prospectuses required by the listing rules.
Other non-audit fees: This category includes other assurance services not related to the performance of the audit or review of the financial statements, for example the review of controls operated by the Group on behalf of a third party. The auditors are not engaged to provide tax services.
It is the Group’s policy to use the auditors on assignments in cases where their knowledge of the Group means that it is neither efficient nor cost effective to employ another firm of accountants.
Lloyds Banking Group has procedures that are designed to ensure auditor independence for Lloyds Banking Group plc and all of its subsidiaries, including prohibiting certain non-audit services. All audit and non-audit assignments must be pre-approved by the Lloyds Banking Group audit committee (the Audit Committee) on an individual engagement basis; for certain types of non-audit engagements where the fee is ‘de minimis’ the Audit Committee has pre-approved all assignments subject to confirmation by management. On a quarterly basis, the Audit Committee receives and reviews a report detailing all pre-approved services and amounts paid to the auditors for such pre-approved services.
During the year the auditors also earned fees payable by entities outside the consolidated Lloyds Bank Group in respect of the following:
| | | | | | | | | | | |
| 2020 | 2019 | 2018 |
| £m | £m | £m |
| Audits of Group pension schemes | 0.1 | | 0.1 | | 0.1 | |
| Audits of the unconsolidated Open Ended Investment Companies managed by the Group | 0 | | 0 | | 0.1 | |
| Reviews of the financial position of corporate and other borrowers | 1.3 | | 0 | | 0.4 | |
NOTES TO THE ACCOUNTS
for the year ended 31 December 2020
11 IMPAIRMENT
| | | | | | | | | | | | | | | | | | | | | | | | | | | | | |
| Stage 1 | | Stage 2 | | Stage 3 | | POCI | | Total |
| £m | | £m | | £m | | £m | | £m |
| Year ended 31 December 2020 | | | | | | | | | |
| Impact of transfers between stages | (168) | | | 925 | | | 699 | | | 0 | | | 1,456 | |
| Other changes in credit quality | 909 | | | 6 | | | 1,164 | | | 167 | | | 2,246 | |
| Additions (repayments) | 77 | | | 173 | | | (52) | | | (30) | | | 168 | |
| Methodology and model changes | (31) | | | 170 | | | 26 | | | 0 | | | 165 | |
| Other items | 0 | | | 0 | | | 25 | | | 0 | | | 25 | |
| 955 | | | 349 | | | 1,163 | | | 137 | | | 2,604 | |
| Total impairment | 787 | | | 1,274 | | | 1,862 | | | 137 | | | 4,060 | |
| | | | | | | | | |
| In respect of: | | | | | | | | | |
| Loans and advances to banks | 4 | | | 0 | | | 0 | | | 0 | | | 4 | |
| Loans and advances to customers | 678 | | | 1,130 | | | 1,853 | | | 137 | | | 3,798 | |
| Due from fellow Lloyds Banking Group undertakings | 0 | | | 0 | | | 0 | | | 0 | | | 0 | |
| Financial assets at amortised cost | 682 | | | 1,130 | | | 1,853 | | | 137 | | | 3,802 | |
| Other assets | 0 | | | 0 | | | 0 | | | 0 | | | 0 | |
| Impairment charge on drawn balances | 682 | | | 1,130 | | | 1,853 | | | 137 | | | 3,802 | |
| Loan commitments and financial guarantees | 100 | | | 144 | | | 9 | | | 0 | | | 253 | |
| Financial assets at fair value through other comprehensive income | 5 | | | 0 | | | 0 | | | 0 | | | 5 | |
| Total impairment | 787 | | | 1,274 | | | 1,862 | | | 137 | | | 4,060 | |
| | | | | | | | | | | | | | | | | | | | | | | | | | | | | |
| Stage 1 | | Stage 2 | | Stage 3 | | POCI | | Total |
| £m | | £m | | £m | | £m | | £m |
| Year ended 31 December 2019 | | | | | | | | | |
| Impact of transfers between stages | (17) | | | 89 | | | 532 | | | 0 | | | 604 | |
| Other changes in credit quality | 6 | | | 2 | | | 939 | | | (106) | | | 841 | |
| Additions (repayments) | 93 | | | (41) | | | (60) | | | (87) | | | (95) | |
| Methodology and model changes | 33 | | | (27) | | | 8 | | | 0 | | | 14 | |
| Other items | (5) | | | 0 | | | 3 | | | 0 | | | (2) | |
| 127 | | | (66) | | | 890 | | | (193) | | | 758 | |
| Total impairment | 110 | | | 23 | | | 1,422 | | | (193) | | | 1,362 | |
| | | | | | | | | |
| In respect of: | | | | | | | | | |
| Loans and advances to banks | 0 | | | 0 | | | 0 | | | 0 | | | 0 | |
| Loans and advances to customers | 141 | | | 10 | | | 1,382 | | | (193) | | | 1,340 | |
| Due from fellow Lloyds Banking Group undertakings | (1) | | | 0 | | | 41 | | | 0 | | | 40 | |
| Financial assets at amortised cost | 140 | | | 10 | | | 1,423 | | | (193) | | | 1,380 | |
| Other assets | 0 | | | 0 | | | 0 | | | 0 | | | 0 | |
| Impairment charge on drawn balances | 140 | | | 10 | | | 1,423 | | | (193) | | | 1,380 | |
| Loan commitments and financial guarantees | (29) | | | 13 | | | (1) | | | 0 | | | (17) | |
| Financial assets at fair value through other comprehensive income | (1) | | | 0 | | | 0 | | | 0 | | | (1) | |
| Total impairment | 110 | | | 23 | | | 1,422 | | | (193) | | | 1,362 | |
NOTES TO THE ACCOUNTS
for the year ended 31 December 2020
11 IMPAIRMENT (continued)
| | | | | | | | | | | | | | | | | | | | | | | | | | | | | |
| Stage 1 | | Stage 2 | | Stage 3 | | POCI | | Total |
| £m | | £m | | £m | | £m | | £m |
| Year ended 31 December 2018 | | | | | | | | | |
| Impact of transfers between stages | (10) | | | 18 | | | 445 | | | 0 | | | 453 | |
| Other changes in credit quality | (23) | | | (14) | | | 545 | | | 69 | | | 577 | |
| Additions (repayments) | 19 | | | (84) | | | 27 | | | (69) | | | (107) | |
| Methodology and model changes | (71) | | | (21) | | | 72 | | | 0 | | | (20) | |
| Other items | (13) | | | 0 | | | 36 | | | 0 | | | 23 | |
| (88) | | | (119) | | | 680 | | | 0 | | | 473 | |
| Total impairment | (98) | | | (101) | | | 1,125 | | | 0 | | | 926 | |
| | | | | | | | | |
| In respect of: | | | | | | | | | |
| Loans and advances to banks | 1 | | | 0 | | | 0 | | | 0 | | | 1 | |
| Loans and advances to customers | (65) | | | (53) | | | 1,129 | | | 0 | | | 1,011 | |
| Financial assets at amortised cost | (64) | | | (53) | | | 1,129 | | | 0 | | | 1,012 | |
| Impairment charge on drawn balances | (64) | | | (53) | | | 1,129 | | | 0 | | | 1,012 | |
| Loan commitments and financial guarantees | (20) | | | (48) | | | (4) | | | 0 | | | (72) | |
| Financial assets at fair value through other comprehensive income | (14) | | | 0 | | | 0 | | | 0 | | | (14) | |
| Total impairment | (98) | | | (101) | | | 1,125 | | | 0 | | | 926 | |
The impairment charge includes £41 million (2019: £134 million; 2018: £29 million) in respect of residual value impairment and voluntary terminations within the Group’s UK motor finance business.
The Group’s impairment charge comprises the following items:
Transfers between stages
The net impact on the impairment charge of transfers between stages.
Other changes in credit quality
Changes in loss allowance as a result of movements in risk parameters that reflect changes in customer quality, but which have not resulted in a transfer to a different stage. This also contains the impact on the impairment charge as a result of write-offs and recoveries, where the related loss allowances are reassessed to reflect ultimate realisable or recoverable value.
Additions (repayments)
Expected loss allowances are recognised on origination of new loans or further drawdowns of existing facilities. Repayments relate to the reduction of loss allowances as a result of repayments of outstanding balances.
Methodology and model changes
Increase or decrease in impairment charge as a result of adjustments to the models used for expected credit loss calculations; either as changes to the model inputs or to the underlying assumptions, as well as the impact of changing the models used.
Movements in the Group's impairment allowances are shown in note 16.
NOTES TO THE ACCOUNTS
for the year ended 31 December 2020
12 TAX EXPENSE
(a)Analysis of tax credit (expense) for the year
| | | | | | | | | | | | | | | | | |
| 2020 | | 2019 | | 2018 |
| £m | | £m | | £m |
| UK corporation tax: | | | | | |
| Current tax on profit for the year | (423) | | | (1,279) | | | (1,108) | |
| Adjustments in respect of prior years | 336 | | | 98 | | | (10) | |
| (87) | | | (1,181) | | | (1,118) | |
| Foreign tax: | | | | | |
| Current tax on profit for the year | (18) | | | (58) | | | (24) | |
| Adjustments in respect of prior years | 24 | | | 4 | | | 0 | |
| 6 | | | (54) | | | (24) | |
| Current tax expense | (81) | | | (1,235) | | | (1,142) | |
| | | | | |
| Deferred tax: | | | | | |
| Current year | 508 | | | (110) | | | (234) | |
| Adjustments in respect of prior years | (290) | | | 58 | | | (1) | |
| Deferred tax credit (expense) | 218 | | | (52) | | | (235) | |
| Tax credit (expense) | 137 | | | (1,287) | | | (1,377) | |
(b)Factors affecting the tax credit (expense) for the year
The UK corporation tax rate for the year was 19.0 per cent (2019: 19.0 per cent; 2018: 19.0 per cent). An explanation of the relationship between tax credit (expense) and accounting profit is set out below:
| | | | | | | | | | | |
| 2020 | 2019 | 2018 |
| £m | £m | £m |
| Profit before tax from continuing operations | 1,329 | | 4,123 | | 4,280 | |
| UK corporation tax thereon | (253) | | (783) | | (813) | |
| Impact of surcharge on banking profits | (122) | | (377) | | (388) | |
| Non-deductible costs: conduct charges | (24) | | (283) | | (189) | |
| Non-deductible costs: bank levy | (30) | | 0 | | 0 | |
| Other non-deductible costs | (62) | | (77) | | (74) | |
| Non-taxable income | 37 | | 36 | | 25 | |
| Tax relief on coupons on other equity instruments | 79 | | 53 | | 52 | |
| Tax-exempt gains on disposals | 0 | | 25 | | 11 | |
| Tax losses where no deferred tax recognised | (3) | | (7) | | (9) | |
| Remeasurement of deferred tax due to rate changes | 435 | | (25) | | 18 | |
| Differences in overseas tax rates | 10 | | (9) | | 1 | |
| Adjustments in respect of prior years | 70 | | 160 | | (11) | |
| Tax credit (expense) on profit from continuing operations | 137 | | (1,287) | | (1,377) | |
In 2020, the Group submitted claims to HMRC to accelerate tax deductions in respect of certain capitalised software enhancement costs incurred in 2018 and 2019. The Group has recognised a net prior year tax impact of £NaN in respect of these claims, being a current tax credit of £215 million in respect of the reduced cash tax liability for those years, a deferred tax charge of £261 million in respect of the future amortisation of those costs, plus a deferred tax credit of £46 million in respect of tax losses carried forward. No other items included in the net prior year tax adjustments credit of £70 million were of individual significance.
NOTES TO THE ACCOUNTS
for the year ended 31 December 2020
13 DISCONTINUED OPERATIONS
The Group completed the sale of the Scottish Widows Group to its ultimate holding company, Lloyds Banking Group plc, in May 2018. Scottish Widows represented the entirety of the Group’s insurance business and consequently these operations were classified as discontinued and the profit after tax from these activities reported as a single line on the Group’s income statement.
In order to fairly reflect the results and financial position of the Group’s continuing operations and its discontinued operations, transactions that the continuing operations had with the discontinued operations were reported on the relevant line in the Group’s income statement, with the matching transaction similarly reported in the discontinued operations income statement. All such transactions fully eliminated within the Group’s statutory consolidation and there was no net impact on profit before tax.
The results of the discontinued operations in 2018 were as follows:
| | | | | |
| 2018 |
| £ million |
| Interest and similar income | 14 | |
| Interest and similar expense | (3) | |
| Net interest income | 11 | |
| Fee and commission income | 106 | |
| Fee and commission expense | (180) | |
| Net fee and commission income | (74) | |
| Net trading income (see (a) below) | (790) | |
| Insurance premium income (see (b) below) | 2,714 | |
| Other operating income | 205 | |
| Other income | 2,055 | |
| Total income | 2,066 | |
| Insurance claims (see (c) below) | (1,363) | |
| Total income, net of insurance claims | 703 | |
| Operating expenses | (333) | |
| Profit on disposal of the discontinued operations | 1,010 | |
| Profit before tax | 1,380 | |
| Taxation | (66) | |
| Profit after tax from discontinued operations | 1,314 | |
(a)Net trading income
| | | | | |
| 2018 |
| £m |
| Foreign exchange translation gains | 31 | |
| Gains on foreign exchange trading transactions | 0 | |
| Total foreign exchange | 31 | |
| Investment property gains | 45 | |
| Securities and other gains (see below) | (866) | |
| Net trading income | (790) | |
Securities and other gains comprised net gains arising on assets and liabilities held at fair value through profit or loss and for trading as follows:
| | | | | |
| 2018 |
| £m |
| Net income arising on assets designated at fair value through profit or loss: | |
| Debt securities, loans and advances | (426) | |
| Equity shares | (535) | |
| Total net gains arising on assets designated at fair value through profit or loss | (961) | |
| Net gains on financial instruments held for trading | 95 | |
| Securities and other gains | (866) | |
NOTES TO THE ACCOUNTS
for the year ended 31 December 2020
13 DISCONTINUED OPERATIONS (continued)
(b)Insurance premium income
| | | | | |
| 2018 |
| £m |
| Life insurance | |
| Gross premiums: | |
| Life and pensions | 2,198 | |
| Annuities | 366 | |
| 2,564 | |
| Ceded reinsurance premiums | (73) | |
| Net earned premiums | 2,491 | |
| Non-life insurance | |
| Net earned premiums | 223 | |
| Total net earned premiums | 2,714 | |
(c)Insurance claims
| | | | | |
| 2018 |
| Insurance claims comprise: | £m |
| Life insurance and participating investment contracts | |
| Claims and surrenders | (2,788) | |
| Change in insurance and participating investment contracts | 1,533 | |
| Change in non-participating investment contracts | (73) | |
| (1,328) | |
| Reinsurers’ share | 86 | |
| (1,242) | |
| Change in unallocated surplus | 14 | |
| Total life insurance and participating investment contracts | (1,228) | |
| Non-life insurance | |
| Total non-life insurance claims, net of reinsurance | (135) | |
| Total insurance claims | (1,363) | |
| |
| Life insurance and participating investment contracts gross claims and surrenders can also be analysed as follows: | |
| Deaths | (267) | |
| Maturities | (393) | |
| Surrenders | (1,734) | |
| Annuities | (336) | |
| Other | (58) | |
| Total life insurance gross claims and surrenders | (2,788) | |
The impact of the discontinued operations on the Group’s cash flow statements was as follows:
| | | | | |
| 2018 |
| £m |
| Net cash used in operating activities | (1,715) | |
| Net cash from investing activities | 60 | |
| Net cash used in financing activities | (682) | |
| Change in cash and cash equivalents | (2,337) | |
NOTES TO THE ACCOUNTS
for the year ended 31 December 2020
14 FINANCIAL ASSETS AT FAIR VALUE THROUGH PROFIT OR LOSS
| | | | | | | | | | | | | | | | | |
| The Group | | The Bank |
| 2020 | 2019 | | 2020 | 2019 |
| £m | £m | | £m | £m |
| Trading assets | 0 | | 290 | | | 0 | | 290 | |
| Other financial assets mandatorily at fair value through profit or loss | 1,674 | | 1,994 | | | 1,724 | | 413 | |
| Total | 1,674 | | 2,284 | | | 1,724 | | 703 | |
These assets are comprised as follows:
| | | | | | | | | | | | | | | | | | | | | | | | | | | | | | | | | | | | | | | | | | | | | | | |
| The Group | | The Bank |
| 2020 | | 2019 | | 2020 | | 2019 |
| Trading
assets | | Other
financial
assets
mandatorily
at fair value
through
profit or loss | | Trading
assets | | Other
financial
assets
mandatorily
at fair value
through
profit or loss | | Trading
assets | | Other
financial
assets
mandatorily
at fair value
through
profit or loss | | Trading
assets | | Other
financial
assets
mandatorily
at fair value
through
profit or loss |
| £m | | £m | | £m | | £m | | £m | | £m | | £m | | £m |
| Loans and advances to customers | 0 | | | 1,511 | | | 0 | | | 1,782 | | | 0 | | | 517 | | | 0 | | | 362 | |
| | | | | | | | | | | | | | | |
| Debt securities: | | | | | | | | | | | | | | | |
| Government securities | 0 | | | 0 | | | 290 | | | 0 | | | 0 | | | 0 | | | 290 | | | 0 | |
| Corporate and other debt securities | 0 | | | 0 | | | 0 | | | 47 | | | 0 | | | 1,203 | | | 0 | | | 47 | |
| 0 | | | 0 | | | 290 | | | 47 | | | 0 | | | 1,203 | | | 290 | | | 47 | |
| Equity shares | 0 | | | 163 | | | 0 | | | 165 | | | 0 | | | 4 | | | 0 | | | 4 | |
| Total | 0 | | | 1,674 | | | 290 | | | 1,994 | | | 0 | | | 1,724 | | | 290 | | | 413 | |
At 31 December 2020 £1,099 million (2019: £1,943 million) of trading and other financial assets at fair value through profit or loss of the Group and £1,600 million (2019: £665 million) of the Bank had a contractual residual maturity of greater than one year.
For amounts included above which are subject to repurchase and reverse repurchase agreements see note 45.
NOTES TO THE ACCOUNTS
for the year ended 31 December 2020
15 DERIVATIVE FINANCIAL INSTRUMENTS
The fair values and notional amounts of derivative instruments are set out in the following table:
| | | | | | | | | | | | | | | | | | | | | | | | | | | | | | | | | | | |
| 2020 | | 2019 |
| Contract/
notional
amount | | Fair value
assets | | Fair value
liabilities | | Contract/
notional
amount | | Fair value
assets | | Fair value
liabilities |
| The Group | £m | | £m | | £m | | £m | | £m | | £m |
| Trading and other | | | | | | | | | | | |
| Exchange rate contracts: | | | | | | | | | | | |
| Spot, forwards and futures | 15,055 | | | 360 | | | 124 | | | 11,066 | | | 272 | | | 142 | |
| Currency swaps | 147,303 | | | 1,314 | | | 1,650 | | | 156,224 | | | 1,184 | | | 2,492 | |
| Options purchased | 12 | | | 0 | | | 0 | | | 681 | | | 9 | | | 0 | |
| Options written | 12 | | | 0 | | | 0 | | | 681 | | | 0 | | | 9 | |
| 162,382 | | | 1,674 | | | 1,774 | | | 168,652 | | | 1,465 | | | 2,643 | |
| Interest rate contracts: | | | | | | | | | | | |
| Interest rate swaps | 1,312,974 | | | 5,872 | | | 5,421 | | | 1,822,407 | | | 5,779 | | | 5,685 | |
| Forward rate agreements | 81,305 | | | 0 | | | 3 | | | 30,192 | | | 1 | | | 2 | |
| Options purchased | 3,745 | | | 55 | | | 0 | | | 4,124 | | | 77 | | | 0 | |
| Options written | 3,064 | | | 0 | | | 62 | | | 3,682 | | | 0 | | | 78 | |
| 1,401,088 | | | 5,927 | | | 5,486 | | | 1,860,405 | | | 5,857 | | | 5,765 | |
| Credit derivatives | 5,362 | | | 65 | | | 120 | | | 7,546 | | | 39 | | | 99 | |
| Equity and other contracts | 50 | | | 1 | | | 258 | | | 338 | | | 16 | | | 295 | |
| Total derivative assets/liabilities - trading and other | 1,568,882 | | | 7,667 | | | 7,638 | | | 2,036,941 | | | 7,377 | | | 8,802 | |
| Hedging | | | | | | | | | | | |
| Derivatives designated as fair value hedges: | | | | | | | | | | | |
| Currency swaps | 36 | | | 11 | | | 0 | | | 34 | | | 8 | | | 0 | |
| Interest rate swaps | 185,958 | | | 336 | | | 255 | | | 160,942 | | | 696 | | | 229 | |
| 185,994 | | | 347 | | | 255 | | | 160,976 | | | 704 | | | 229 | |
| Derivatives designated as cash flow hedges: | | | | | | | | | | | |
| Interest rate swaps | 316,776 | | | 290 | | | 262 | | | 417,718 | | | 343 | | | 736 | |
| Currency swaps | 4,030 | | | 37 | | | 73 | | | 7,593 | | | 70 | | | 64 | |
| 320,806 | | | 327 | | | 335 | | | 425,311 | | | 413 | | | 800 | |
| Total derivative assets/liabilities - hedging | 506,800 | | | 674 | | | 590 | | | 586,287 | | | 1,117 | | | 1,029 | |
| Total recognised derivative assets/liabilities | 2,075,682 | | | 8,341 | | | 8,228 | | | 2,623,228 | | | 8,494 | | | 9,831 | |
The notional amount of the contract does not represent the Group’s exposure to credit risk which is limited to the current cost of replacing contracts with a positive value to the Group should the counterparty default. To reduce credit risk the Group uses a variety of credit enhancement techniques such as netting and collateralisation, where security is provided against the exposure; a large proportion of the Group's derivatives are held through exchanges such as London Clearing House and are collateralised through those exchanges. Further details are provided in note 45 Credit risk.
NOTES TO THE ACCOUNTS
for the year ended 31 December 2020
15 DERIVATIVE FINANCIAL INSTRUMENTS (continued)
The Group holds derivatives as part of the following strategies:
–Customer driven, where derivatives are held as part of the provision of risk management products to Group customers;
–To manage and hedge the Group’s interest rate and foreign exchange risk arising from normal banking business. The hedge accounting strategy adopted by the Group is to utilise a combination of fair value and cash flow hedge approaches as described in note 45.
The principal derivatives used by the Group are as follows:
–Interest rate related contracts include interest rate swaps, forward rate agreements and options. An interest rate swap is an agreement between two parties to exchange fixed and floating interest payments, based upon interest rates defined in the contract, without the exchange of the underlying principal amounts. Forward rate agreements are contracts for the payment of the difference between a specified rate of interest and a reference rate, applied to a notional principal amount at a specific date in the future. An interest rate option gives the buyer, on payment of a premium, the right, but not the obligation, to fix the rate of interest on a future loan or deposit, for a specified period and commencing on a specified future date.
–Exchange rate related contracts include forward foreign exchange contracts, currency swaps and options. A forward foreign exchange contract is an agreement to buy or sell a specified amount of foreign currency on a specified future date at an agreed rate. Currency swaps generally involve the exchange of interest payment obligations denominated in different currencies; the exchange of principal can be notional or actual. A currency option gives the buyer, on payment of a premium, the right, but not the obligation, to sell specified amounts of currency at agreed rates of exchange on or before a specified future date.
–Credit derivatives, principally credit default swaps, are used by the Group as part of its trading activity and to manage its own exposure to credit risk. A credit default swap is a swap in which one counterparty receives a premium at pre-set intervals in consideration for guaranteeing to make a specific payment should a negative credit event take place.
–Equity derivatives are also used by the Group as part of its equity-based retail product activity to eliminate the Group’s exposure to fluctuations in various international stock exchange indices. Index-linked equity options are purchased which give the Group the right, but not the obligation, to buy or sell a specified amount of equities, or basket of equities, in the form of published indices on or before a specified future date.
Details of the Group’s hedging instruments are set out below:
| | | | | | | | | | | | | | | | | | | | |
| Maturity |
| Up to 1 month | 1-3 months | 3-12 months | 1-5 years | Over 5 years | Total |
| The Group - At 31 December 2020 | £m | £m | £m | £m | £m | £m |
| Fair value hedges | | | | | | |
| Interest rate | | | | | | |
| Cross currency swap | | | | | | |
| Notional | 0 | | 0 | | 0 | | 0 | | 36 | | 36 | |
| Average fixed interest rate | 0 | | 0 | | 0 | | 0 | | 1.28% | |
| Average EUR/GBP exchange rate | 0 | | 0 | | 0 | | 0 | | 1.38 | | |
| | | | | | |
| | | | | | |
| Interest rate swap | | | | | | |
| Notional | 6,032 | | 6,031 | | 37,531 | | 116,487 | | 19,877 | | 185,958 | |
| Average fixed interest rate | 2.01% | 1.69% | 1.49% | 1.23% | 2.07% | |
| Cash flow hedges | | | | | | |
| Foreign exchange | | | | | | |
| Currency swap | | | | | | |
| Notional | 28 | | 102 | | 408 | | 941 | | 2,551 | | 4,030 | |
| | | | | | |
| Average USD/GBP exchange rate | 1.30 | | 1.31 | | 1.30 | | 1.32 | | 1.32 | | |
| Interest rate | | | | | | |
| Interest rate swap | | | | | | |
| Notional | 5,026 | | 11,449 | | 41,348 | | 164,893 | | 94,060 | | 316,776 | |
| Average fixed interest rate | 1.09% | 1.05% | 1.18% | 1.57% | 2.36% | |
NOTES TO THE ACCOUNTS
for the year ended 31 December 2020
15 DERIVATIVE FINANCIAL INSTRUMENTS (continued)
| | | | | | | | | | | | | | | | | | | | |
| Maturity |
| Up to 1 month | 1-3 months | 3-12 months | 1-5 years | Over 5 years | Total |
| The Group - At 31 December 2019 | £m | £m | £m | £m | £m | £m |
| Fair value hedges | | | | | | |
| Interest rate | | | | | | |
| Cross currency swap | | | | | | |
| Notional | 0 | | 0 | | 0 | | 0 | | 34 | | 34 | |
| Average fixed interest rate | 0 | | 0 | | 0 | | 0 | | 1.28% | |
| Average EUR/GBP exchange rate | 0 | | 0 | | 0 | | 0 | | 1.38 | | |
| | | | | | |
| | | | | | |
| Interest rate swap | | | | | | |
| Notional | 331 | | 9,305 | | 37,948 | | 91,535 | | 21,823 | | 160,942 | |
| Average fixed interest rate | 2.58% | 1.74% | 1.22% | 1.78% | 2.72% | |
| Cash flow hedges | | | | | | |
| Foreign exchange | | | | | | |
| Currency swap | | | | | | |
| Notional | 0 | | 364 | | 390 | | 1,766 | | 5,073 | | 7,593 | |
| Average EUR/GBP exchange rate | 0 | | 0 | | 1.21 | | 1.10 | | 0 | | |
| Average USD/GBP exchange rate | 0 | | 1.33 | | 1.36 | | 1.30 | | 1.30 | | |
| Interest rate | | | | | | |
| Interest rate swap | | | | | | |
| Notional | 9,395 | | 23,424 | | 57,950 | | 205,603 | | 121,346 | | 417,718 | |
| Average fixed interest rate | 1.06% | 1.23% | 1.29% | 1.48% | 2.43% | |
The carrying amounts of the Group’s hedging instruments are as follows:
| | | | | | | | | | | | | | |
| Carrying amount of the hedging instrument |
| Contract/
notional
amount | Assets | Liabilities | Changes in fair
value used for
calculating hedge
ineffectiveness |
| The Group - At 31 December 2020 | £m | £m | £m | £m |
| Fair value hedges | | | | |
| Interest rate | | | | |
| Currency swaps | 36 | | 11 | | 0 | | 1 | |
| Interest rate swaps | 185,958 | | 336 | | 255 | | (88) | |
| Cash flow hedges | | | | |
| Foreign exchange | | | | |
| Currency swaps | 4,030 | | 37 | | 73 | | (64) | |
| Interest rate | | | | |
| Interest rate swaps | 316,776 | | 290 | | 262 | | 527 | |
NOTES TO THE ACCOUNTS
for the year ended 31 December 2020
15 DERIVATIVE FINANCIAL INSTRUMENTS (continued)
| | | | | | | | | | | | | | |
| Carrying amount of the hedging instrument |
| Contract/
notional
amount | Assets | Liabilities | Changes in fair
value used for
calculating hedge
ineffectiveness |
| The Group - At 31 December 2019 | £m | £m | £m | £m |
| Fair value hedges | | | | |
| Interest rate | | | | |
| Currency swaps | 34 | | 8 | | 0 | | 2 | |
| Interest rate swaps | 160,942 | | 696 | | 229 | | 351 | |
| Cash flow hedges | | | | |
| Foreign exchange | | | | |
| Currency swaps | 7,593 | | 70 | | 64 | | (141) | |
| Interest rate | | | | |
| Interest rate swaps | 417,718 | | 343 | | 736 | | 920 | |
All amounts are held within Derivative financial instruments.
The Group’s hedged items are as follows:
| | | | | | | | | | | | | | | | | | | | | | | | | | | | | | | | |
| Carrying amount of
the hedged item | | Accumulated amount of
fair value adjustment on
the hedged item | | Change in
fair value of
hedged item for
ineffectiveness
assessment | | Cash flow hedge reserve |
| | | | Continuing
hedges | Discontinued
hedges |
| Assets | Liabilities | | Assets | Liabilities | | |
| The Group - At 31 December 2020 | £m | £m | | £m | £m | | £m | | £m | £m |
| Fair value hedges | | | | | | | | | | |
| Interest rate | | | | | | | | | | |
Fixed rate mortgages1 | 125,183 | | 0 | | | 661 | | 0 | | | 355 | | | | |
Fixed rate issuance2 | 0 | | 37,323 | | | 0 | | 1,357 | | | (179) | | | | |
Fixed rate borrowings3 | 0 | | 1,404 | | | 0 | | 304 | | | (184) | | | | |
Fixed rate bonds4 | 24,111 | | 0 | | | 1,178 | | 0 | | | 641 | | | | |
| Cash flow hedges | | | | | | | | | | |
| Foreign exchange | | | | | | | | | | |
Foreign currency issuance2 | | | | | | | (8) | | | (40) | | 64 | |
Customer deposits5 | | | | | | | 74 | | | 13 | | (41) | |
| Interest rate | | | | | | | | | | |
Customer loans1 | | | | | | | (508) | | | 1,918 | | (2) | |
Central bank balances6 | | | | | | | (71) | | | 19 | | 270 | |
Customer deposits5 | | | | | | | 38 | | | (233) | | 97 | |
NOTES TO THE ACCOUNTS
for the year ended 31 December 2020
15 DERIVATIVE FINANCIAL INSTRUMENTS (continued)
| | | | | | | | | | | | | | | | | | | | | | | | | | | | | | | | |
| Carrying amount of
the hedged item | | Accumulated amount of
fair value adjustment on
the hedged item | | Change in
fair value of
hedged item for
ineffectiveness
assessment | | Cash flow hedge reserve |
| | | | Continuing
hedges | Discontinued
hedges |
| Assets | Liabilities | | Assets | Liabilities | | |
| The Group - At 31 December 2019 | £m | £m | | £m | £m | | £m | | £m | £m |
| Fair value hedges | | | | | | | | | | |
| Interest rate | | | | | | | | | | |
Fixed rate mortgages1 | 83,818 | | 0 | | | 154 | | 0 | | | (73) | | | | |
Fixed rate issuance2 | 0 | | 47,689 | | | 0 | | 1,590 | | | (326) | | | | |
Fixed rate borrowings3 | 0 | | 1,272 | | | 0 | | 136 | | | (206) | | | | |
Fixed rate bonds4 | 21,354 | | 0 | | | 660 | | 0 | | | 405 | | | | |
| Cash flow hedges | | | | | | | | | | |
| Foreign exchange | | | | | | | | | | |
Foreign currency issuance2 | | | | | | | 28 | | | (20) | | 90 | |
Customer deposits5 | | | | | | | 116 | | | 18 | | (48) | |
| Interest rate | | | | | | | | | | |
Customer loans1 | | | | | | | (657) | | | 1,226 | | 531 | |
Central bank balances6 | | | | | | | (220) | | | 85 | | 163 | |
Customer deposits5 | | | | | | | (1) | | | (40) | | 6 | |
1Included within loans and advances to customers.
2Included within debt securities in issue.
3Included within amounts due to fellow Lloyds Banking Group undertakings.
4Included within financial assets at fair value through other comprehensive income.
5Included within customer deposits.
6Included within cash and balances at central banks.
The accumulated amount of fair value hedge adjustments remaining in the balance sheet for hedged items that have ceased to be adjusted for hedging gains and losses is a liability of £360 million (fixed rate issuance liability of £360 million, fixed rate bonds and mortgages £NaN) (2019: liability of £315 million (fixed rate issuance liability of £344 million, fixed rate bonds asset of £29 million and fixed rate mortgages of £NaN)).
NOTES TO THE ACCOUNTS
for the year ended 31 December 2020
15 DERIVATIVE FINANCIAL INSTRUMENTS (continued)
Gains and losses arising from hedge accounting are summarised as follows:
| | | | | | | | | | | | | | | | | |
| Gain (loss)
recognised
in other
comprehensive
income | Hedge
ineffectiveness
recognised in the
income statement1 | Amounts reclassified from reserves
to income statement as: |
| Hedged cash
flows will no
longer occur | Hedged item
affected income
statement | Income
statement line
item that includes
reclassified amount |
| The Group - At 31 December 2020 | £m | £m | £m | £m |
| Fair value hedges | | | | | |
| Interest rate | | | | | |
| Fixed rate mortgages | | 571 | | | | |
| Fixed rate issuance | | (35) | | | | |
| Fixed rate borrowings | | 1 | | | | |
| Fixed rate bonds | | 9 | | | | |
| Cash flow hedges | | | | | |
| Foreign exchange | | | | | |
| Foreign currency issuance | (45) | | 0 | | (6) | | (47) | | Interest expense |
| Customer deposits | 3 | | 0 | | 0 | | 9 | | Interest expense |
| Interest rate | | | | | |
| Customer loans | 23 | | 262 | | 0 | | (633) | | Interest income |
| Central bank balances | 28 | | (3) | | 0 | | (95) | | Interest income |
| Customer deposits | (27) | | 0 | | 0 | | 45 | | Interest expense |
| | | | | | | | | | | | | | | | | |
| Gain (loss)
recognised
in other
comprehensive
income | Hedge
ineffectiveness
recognised in the
income statement1 | Amounts reclassified from reserves
to income statement as: |
| Hedged cash
flows will no
longer occur | Hedged item
affected income
statement | Income
statement line
item that includes
reclassified amount |
| The Group - At 31 December 2019 | £m | £m | £m | £m |
| Fair value hedges | | | | | |
| Interest rate | | | | | |
| Fixed rate mortgages | | 186 | | | | |
| Fixed rate issuance | | (28) | | | | |
| Fixed rate borrowings | | 6 | | | | |
| Fixed rate bonds | | (11) | | | | |
| Cash flow hedges | | | | | |
| Foreign exchange | | | | | |
| Foreign currency issuance | (202) | | 0 | | (101) | | (73) | | Interest expense |
| Customer deposits | (22) | | 0 | | 0 | | 6 | | Interest expense |
| Interest rate | | | | | |
| Customer loans | 616 | | 99 | | 0 | | (367) | | Interest income |
| Central bank balances | 194 | | 32 | | 0 | | (52) | | Interest income |
| Customer deposits | 0 | | 0 | | 0 | | 7 | | Interest expense |
1Hedge ineffectiveness is included in the income statement within net trading income.
There was a gain of £6 million (2019: gain of £101 million) reclassified from the cash flow hedging reserve for which hedge accounting had previously been used but for which the hedged future cash flows are no longer expected to occur.
At 31 December 2020 £7,393 million of total recognised derivative assets of the Group and £7,064 million of total recognised derivative liabilities of the Group (2019: £7,569 million of assets and £9,213 million of liabilities) had a contractual residual maturity of greater than one year.
NOTES TO THE ACCOUNTS
for the year ended 31 December 2020
15 DERIVATIVE FINANCIAL INSTRUMENTS (continued)
| | | | | | | | | | | | | | | | | | | | | | | | | | | | | | | | | | | |
| 2020 | | 2019 |
| Contract/
notional
amount | | Fair value
assets | | Fair value
liabilities | | Contract/
notional
amount | | Fair value
assets | | Fair value
liabilities |
| The Bank | £m | | £m | | £m | | £m | | £m | | £m |
| Trading and other | | | | | | | | | | | |
| Exchange rate contracts: | | | | | | | | | | | |
| Spot, forwards and futures | 14,117 | | | 268 | | | 83 | | | 8,564 | | | 154 | | | 123 | |
| Currency swaps | 168,605 | | | 1,683 | | | 1,960 | | | 183,675 | | | 1,401 | | | 2,748 | |
| Options purchased | 12 | | | 0 | | | 0 | | | 682 | | | 9 | | | 0 | |
| Options written | 11 | | | 0 | | | 0 | | | 682 | | | 0 | | | 9 | |
| 182,745 | | | 1,951 | | | 2,043 | | | 193,603 | | | 1,564 | | | 2,880 | |
| Interest rate contracts: | | | | | | | | | | | |
| Interest rate swaps | 1,762,919 | | | 10,287 | | | 8,562 | | | 2,370,877 | | | 11,714 | | | 10,776 | |
| Forward rate agreements | 84,245 | | | 0 | | | 4 | | | 30,192 | | | 1 | | | 2 | |
| Options purchased | 3,824 | | | 56 | | | 0 | | | 4,176 | | | 78 | | | 0 | |
| Options written | 3,025 | | | 0 | | | 75 | | | 3,697 | | | 0 | | | 89 | |
| 1,854,013 | | | 10,343 | | | 8,641 | | | 2,408,942 | | | 11,793 | | | 10,867 | |
| Credit derivatives | 5,407 | | | 59 | | | 99 | | | 4,618 | | | 59 | | | 182 | |
| Equity and other contracts | 3 | | | 0 | | | 0 | | | 368 | | | 15 | | | 15 | |
| Total derivative assets/liabilities - trading and other | 2,042,168 | | | 12,353 | | | 10,783 | | | 2,607,531 | | | 13,431 | | | 13,944 | |
| Hedging | | | | | | | | | | | |
| Derivatives designated as fair value hedges: | | | | | | | | | | | |
| Currency swaps | 36 | | | 11 | | | 0 | | | 34 | | | 8 | | | 0 | |
| Interest rate swaps | 58,030 | | | 217 | | | 221 | | | 66,833 | | | 153 | | | 213 | |
| 58,066 | | | 228 | | | 221 | | | 66,867 | | | 161 | | | 213 | |
| Derivatives designated as cash flow hedges: | | | | | | | | | | | |
| Interest rate swaps | 93,353 | | | 11 | | | 42 | | | 130,477 | | | 9 | | | 35 | |
| Currency swaps | 616 | | | 3 | | | 26 | | | 1,101 | | | 37 | | | 19 | |
| 93,969 | | | 14 | | | 68 | | | 131,578 | | | 46 | | | 54 | |
| Total derivative assets/liabilities - hedging | 152,035 | | | 242 | | | 289 | | | 198,445 | | | 207 | | | 267 | |
| Total recognised derivative assets/liabilities | 2,194,203 | | | 12,595 | | | 11,072 | | | 2,805,976 | | | 13,638 | | | 14,211 | |
Details of the Bank’s hedging instruments are set out below:
| | | | | | | | | | | | | | | | | | | | |
| Maturity |
| Up to 1 month | 1-3 months | 3-12 months | 1-5 years | Over 5 years | Total |
| The Bank - At 31 December 2020 | £m | £m | £m | £m | £m | £m |
| Fair value hedges | | | | | | |
| Interest rate | | | | | | |
| Cross currency swap | | | | | | |
| Notional | 0 | | 0 | | 0 | | 0 | | 36 | | 36 | |
| Average fixed interest rate | 0 | | 0 | | 0 | | 0 | | 1.28% | |
| Average EUR/GBP exchange rate | 0 | | 0 | | 0 | | 0 | | 1.38 | | |
| | | | | | |
| | | | | | |
| Interest rate swap | | | | | | |
| Notional | 2,421 | | 489 | | 3,386 | | 31,239 | | 20,495 | | 58,030 | |
| Average fixed interest rate | 1.94% | 1.67% | 2.13% | 1.82% | 1.89% | |
| Cash flow hedges | | | | | | |
| Foreign exchange | | | | | | |
| Currency swap | | | | | | |
| Notional | 25 | | 130 | | 296 | | 165 | | 0 | | 616 | |
| Average EUR/GBP exchange rate | 0 | | 0 | | 1.13 | | 1.11 | | 0 | | |
| Average USD/GBP exchange rate | 1.30 | | 1.30 | | 1.31 | | 1.34 | | 0 | | |
| Interest rate | | | | | | |
| Interest rate swap | | | | | | |
| Notional | 844 | | 4,363 | | 9,375 | | 67,534 | | 11,237 | | 93,353 | |
| Average fixed interest rate | 1.40% | 1.07% | 1.00% | 1.47% | 2.33% | |
NOTES TO THE ACCOUNTS
for the year ended 31 December 2020
15 DERIVATIVE FINANCIAL INSTRUMENTS (continued)
| | | | | | | | | | | | | | | | | | | | |
| Maturity |
| Up to 1 month | 1-3 months | 3-12 months | 1-5 years | Over 5 years | Total |
| The Bank - At 31 December 2019 | £m | £m | £m | £m | £m | £m |
| Fair value hedges | | | | | | |
| Interest rate | | | | | | |
| Cross currency swap | | | | | | |
| Notional | 0 | | 0 | | 0 | | 0 | | 34 | | 34 | |
| Average fixed interest rate | 0 | | 0 | | 0 | | 0 | | 1.28% | |
| Average EUR/GBP exchange rate | 0 | | 0 | | 0 | | 0 | | 1.38 | | |
| | | | | | |
| | | | | | |
| Interest rate swap | | | | | | |
| Notional | 331 | | 1,445 | | 8,378 | | 34,930 | | 21,749 | | 66,833 | |
| Average fixed interest rate | 2.58% | 2.39% | 1.49% | 1.82% | 2.24% | |
| Cash flow hedges | | | | | | |
| Foreign exchange | | | | | | |
| Currency swap | | | | | | |
| Notional | 53 | | 210 | | 539 | | 299 | | 0 | | 1,101 | |
| Average EUR/GBP exchange rate | 0 | | 0 | | 1.15 | | 1.11 | | 0 | | |
| Average USD/GBP exchange rate | 1.37 | | 1.38 | | 1.36 | | 1.36 | | 0 | | |
| Interest rate | | | | | | |
| Interest rate swap | | | | | | |
| Notional | 3,473 | | 6,771 | | 22,444 | | 66,892 | | 30,897 | | 130,477 | |
| Average fixed interest rate | 1.10% | 1.58% | 1.57% | 1.41% | 1.93% | |
The carrying amounts of the Bank’s hedging instruments are as follows:
| | | | | | | | | | | | | | |
| Carrying amount of the hedging instrument |
| Contract/
notional
amount | Assets | Liabilities | Changes in fair
value used for
calculating hedge
ineffectiveness |
| The Bank - At 31 December 2020 | £m | £m | £m | £m |
| Fair value hedges | | | | |
| Interest rate | | | | |
| Currency swaps | 36 | | 11 | | 0 | | 1 | |
| Interest rate swaps | 58,030 | | 217 | | 221 | | (226) | |
| Cash flow hedges | | | | |
| Foreign exchange | | | | |
| Currency swaps | 616 | | 3 | | 26 | | 4 | |
| Interest rate | | | | |
| Interest rate swaps | 93,353 | | 11 | | 42 | | 130 | |
| | | | | | | | | | | | | | |
| Carrying amount of the hedging instrument |
| Contract/
notional
amount | Assets | Liabilities | Changes in fair
value used for
calculating hedge
ineffectiveness |
| The Bank - At 31 December 2019 | £m | £m | £m | £m |
| Fair value hedges | | | | |
| Interest rate | | | | |
| Currency swaps | 34 | | 8 | | 0 | | 2 | |
| Interest rate swaps | 66,833 | | 153 | | 213 | | 118 | |
| Cash flow hedges | | | | |
| Foreign exchange | | | | |
| Currency swaps | 1,101 | | 37 | | 19 | | (31) | |
| Interest rate | | | | |
| Interest rate swaps | 130,477 | | 9 | | 35 | | 777 | |
All amounts are held within Derivative financial instruments.
NOTES TO THE ACCOUNTS
for the year ended 31 December 2020
15 DERIVATIVE FINANCIAL INSTRUMENTS (continued)
The Bank’s hedged items are as follows:
| | | | | | | | | | | | | | | | | | | | | | | | | | | | | | | | |
| Carrying amount of
the hedged item | | Accumulated amount of
fair value adjustment on
the hedged item | | Change in
fair value of
hedged item for
ineffectiveness
assessment | | Cash flow hedge reserve |
| | | | Continuing
hedges | Discontinued
hedges |
| Assets | Liabilities | | Assets | Liabilities | | |
| The Bank - At 31 December 2020 | £m | £m | | £m | £m | | £m | | £m | £m |
| Fair value hedges | | | | | | | | | | |
| Interest rate | | | | | | | | | | |
Fixed rate issuance1 | 0 | | 32,044 | | | 0 | | 793 | | | (243) | | | | |
Fixed rate borrowings2 | 0 | | 1,404 | | | 0 | | 304 | | | (184) | | | | |
Fixed rate bonds3 | 23,239 | | 0 | | | 1,158 | | 0 | | | 625 | | | | |
| Cash flow hedges | | | | | | | | | | |
| Foreign exchange | | | | | | | | | | |
Foreign currency issuance1 | | | | | | | (4) | | | (49) | | 16 | |
| Interest rate | | | | | | | | | | |
Customer loans4 | | | | | | | (119) | | | 1,486 | | 281 | |
| Central bank balances5 | | | | | | | 0 | | | 0 | | 324 | |
Customer deposits6 | | | | | | | 15 | | | (189) | | 3 | |
| | | | | | | | | | | | | | | | | | | | | | | | | | | | | | | | |
| Carrying amount of
the hedged item | | Accumulated amount of
fair value adjustment on
the hedged item | | Change in
fair value of
hedged item for
ineffectiveness
assessment | | Cash flow hedge reserve |
| | | | Continuing
hedges | Discontinued
hedges |
| Assets | Liabilities | | Assets | Liabilities | | |
| The Bank - At 31 December 2019 | £m | £m | | £m | £m | | £m | | £m | £m |
| Fair value hedges | | | | | | | | | | |
| Interest rate | | | | | | | | | | |
Fixed rate issuance1 | — | | 40,557 | | | 0 | | 565 | | | (357) | | | | |
Fixed rate borrowings2 | 0 | | 1,272 | | | 0 | | 136 | | | (206) | | | | |
Fixed rate bonds3 | 20,632 | | 0 | | | 655 | | 0 | | | 400 | | | | |
| Cash flow hedges | | | | | | | | | | |
| Foreign exchange | | | | | | | | | | |
Foreign currency issuance1 | | | | | | | 31 | | | (38) | | 7 | |
| Interest rate | | | | | | | | | | |
Customer loans4 | | | | | | | (344) | | | 1,037 | | 881 | |
Central bank balances5 | | | | | | | (388) | | | 0 | | 441 | |
Customer deposits6 | | | | | | | (1) | | | (126) | | (58) | |
1Included within debt securities in issue.
2Included within amounts due to fellow Lloyds Banking Group undertakings.
3Included within financial assets at fair value through other comprehensive income.
4Included within loans and advances to customers.
5Included within cash and balances at central banks.
6Included within customer deposits.
The accumulated amount of fair value hedge adjustments remaining in the balance sheet for hedged items that have ceased to be adjusted for hedging gains and losses is an asset of £9 million (fixed rate issuance asset of £9 million, fixed rate bonds and mortgages £NaN) (2019: asset of £54 million (fixed rate issuance asset of £25 million, fixed rate bonds asset of £29 million and fixed rate mortgages of £NaN)).
NOTES TO THE ACCOUNTS
for the year ended 31 December 2020
15 DERIVATIVE FINANCIAL INSTRUMENTS (continued)
Gains and losses arising from hedge accounting are summarised as follows:
| | | | | | | | | | | | | | | | | |
| Gain (loss)
recognised
in other
comprehensive
income | Hedge
ineffectiveness
recognised in the
income statement1 | Amounts reclassified from reserves
to income statement as: |
| Hedged cash
flows will no
longer occur | Hedged item
affected income
statement | Income
statement line
item that includes
reclassified amount |
| The Bank - At 31 December 2020 | £m | £m | £m | £m |
| Fair value hedges | | | | | |
| Interest rate | | | | | |
| Fixed rate mortgages | | 0 | | | | |
| Fixed rate issuance | | (35) | | | | |
| Fixed rate bonds | | 8 | | | | |
| Fixed rate borrowings | | 0 | | | | |
| Cash flow hedges | | | | | |
| Foreign exchange | | | | | |
| Foreign currency issuance | (1) | | 0 | | (1) | | (4) | | Interest expense |
| Interest rate | | | | | |
| Customer loans | (166) | | (31) | | 0 | | (324) | | Interest income |
| Central bank balances | (111) | | 0 | | 0 | | (60) | | Interest income |
| Customer deposits | 8 | | 4 | | 0 | | 34 | | Interest expense |
| | | | | | | | | | | | | | | | | |
| Gain (loss)
recognised
in other
comprehensive
income | Hedge
ineffectiveness
recognised in the
income statement1 | Amounts reclassified from reserves
to income statement as: |
| Hedged cash
flows will no
longer occur | Hedged item
affected income
statement | Income
statement line
item that includes
reclassified amount |
| The Bank - At 31 December 2019 | £m | £m | £m | £m |
| Fair value hedges | | | | | |
| Interest rate | | | | | |
| Fixed rate mortgages | | (15) | | | | |
| Fixed rate issuance | | (38) | | | | |
| Fixed rate bonds | | 4 | | | | |
| Fixed rate borrowings | | 6 | | | | |
| Cash flow hedges | | | | | |
| Foreign exchange | | | | | |
| Foreign currency issuance | (67) | | 0 | | (25) | | (11) | | Interest expense |
| Interest rate | | | | | |
| Customer loans | 125 | | 27 | | 0 | | (363) | | Interest income |
| Central bank balances | 361 | | 35 | | 0 | | (84) | | Interest income |
| Customer deposits | 25 | | 0 | | 0 | | 35 | | Interest expense |
1Hedge ineffectiveness is included in the income statement within net trading income.
There was a gain of £1 million (2019: gain of £25 million) reclassified from the cash flow hedging reserve for which hedge accounting had previously been used but for which the hedged future cash flows are no longer expected to occur.
At 31 December 2020 £11,755 million of total recognised derivative assets of the Bank and £10,009 million of total recognised derivative liabilities of the Bank (2019: £4,256 million of assets and £5,101 million of liabilities) had a contractual residual maturity of greater than one year.
NOTES TO THE ACCOUNTS
for the year ended 31 December 2020
16 FINANCIAL ASSETS AT AMORTISED COST
Year ended 31 December 2020
| | | | | | | | | | | | | | | | | | | | | | | | | | | | | | | | | | | | | | | | | | | | | | | | | | | | | | | | | | | |
| Gross carrying amount | | Allowance for expected credit losses |
| Stage 1 | | Stage 2 | | Stage 3 | | POCI | | Total | | Stage 1 | | Stage 2 | | Stage 3 | | POCI | | Total |
| The Group | £m | | £m | | £m | | £m | | £m | | £m | | £m | | £m | | £m | | £m |
| Loans and advances to banks | | | | | | | | | | | | | | | | | | | |
| At 1 January 2020 | 4,852 | | | 0 | | | 0 | | | 0 | | | 4,852 | | | 0 | | | 0 | | | 0 | | | 0 | | | 0 | |
| Exchange and other adjustments | (25) | | | 0 | | | 0 | | | 0 | | | (25) | | | 0 | | | 0 | | | 0 | | | 0 | | | 0 | |
| Additions (repayments) | 1,127 | | | 0 | | | 0 | | | 0 | | | 1,127 | | | 0 | | | 0 | | | 0 | | | 0 | | | 0 | |
| | | | | | | | | | | | | | | | | | | |
| Charge to the income statement | | | | | | | | | | | 4 | | | 0 | | | 0 | | | 0 | | | 4 | |
| | | | | | | | | | | | | | | | | | | |
| | | | | | | | | | | | | | | | | | | |
| | | | | | | | | | | | | | | | | | | |
| At 31 December 2020 | 5,954 | | | 0 | | | 0 | | | 0 | | | 5,954 | | | 4 | | | 0 | | | 0 | | | 0 | | | 4 | |
| Allowance for impairment losses | (4) | | | 0 | | | 0 | | | 0 | | | (4) | | | | | | | | | | | |
| Net carrying amount | 5,950 | | | 0 | | | 0 | | | 0 | | | 5,950 | | | | | | | | | | | |
| | | | | | | | | | | | | | | | | | | |
| Loans and advances to customers | | | | | | | | | | | | | | | | | | |
| At 1 January 2020 | 429,767 | | | 28,505 | | | 5,647 | | | 13,714 | | | 477,633 | | | 669 | | | 993 | | | 1,359 | | | 142 | | | 3,163 | |
Exchange and other adjustments1 | 1,013 | | | 24 | | | (198) | | | (8) | | | 831 | | | 0 | | | 2 | | | 43 | | | 21 | | | 66 | |
| | | | | | | | | | | | | | | | | | | |
| Transfers to Stage 1 | 4,970 | | | (4,954) | | | (16) | | | | | 0 | | | 144 | | | (141) | | | (3) | | | | | 0 | |
| Transfers to Stage 2 | (28,516) | | | 29,128 | | | (612) | | | | | 0 | | | (217) | | | 267 | | | (50) | | | | | 0 | |
| Transfers to Stage 3 | (1,615) | | | (2,001) | | | 3,616 | | | | | 0 | | | (9) | | | (156) | | | 165 | | | | | 0 | |
| Impact of transfers between stages | (25,161) | | | 22,173 | | | 2,988 | | | | | 0 | | | (84) | | | 880 | | | 570 | | | | | 1,366 | |
| | | | | | | | | | | (166) | | | 850 | | | 682 | | | | | 1,366 | |
| Other changes in credit quality | | | | | | | | | | | 838 | | | (33) | | | 1,183 | | | 167 | | | 2,155 | |
| Additions (repayments) | 9,989 | | | 578 | | | (754) | | | (1,156) | | | 8,657 | | | 37 | | | 143 | | | (38) | | | (30) | | | 112 | |
| Methodology and model changes | | | | | | | | | | | (31) | | | 170 | | | 26 | | | 0 | | | 165 | |
| Charge to the income statement | | | | | | | | | | | 678 | | | 1,130 | | | 1,853 | | | 137 | | | 3,798 | |
| Advances written off | | | | | (1,490) | | | (39) | | | (1,529) | | | | | | | (1,490) | | | (39) | | | (1,529) | |
| Recoveries of advances written off in previous years | | | | | 250 | | | 0 | | | 250 | | | | | | | 250 | | | 0 | | | 250 | |
| Discount unwind | | | | | | | | | | | | | | | (47) | | | 0 | | | (47) | |
| At 31 December 2020 | 415,608 | | | 51,280 | | | 6,443 | | | 12,511 | | | 485,842 | | | 1,347 | | | 2,125 | | | 1,968 | | | 261 | | | 5,701 | |
| Allowance for impairment losses | (1,347) | | | (2,125) | | | (1,968) | | | (261) | | | (5,701) | | | | | | | | | | | |
| Net carrying amount | 414,261 | | | 49,155 | | | 4,475 | | | 12,250 | | | 480,141 | | | | | | | | | | | |
| | | | | | | | | | | | | | | | | | | |
| Debt securities | | | | | | | | | | | | | | | | | | | |
| At 1 January 2020 | 5,325 | | | 0 | | | 1 | | | 0 | | | 5,326 | | | 0 | | | 0 | | | 1 | | | 0 | | | 1 | |
| Exchange and other adjustments | (17) | | | 0 | | | 0 | | | 0 | | | (17) | | | 0 | | | 0 | | | 0 | | | 0 | | | 0 | |
| Additions (repayments) | (171) | | | 0 | | | 0 | | | 0 | | | (171) | | | 0 | | | 0 | | | 0 | | | 0 | | | 0 | |
| | | | | | | | | | | | | | | | | | | |
| At 31 December 2020 | 5,137 | | | 0 | | | 1 | | | 0 | | | 5,138 | | | 0 | | | 0 | | | 1 | | | 0 | | | 1 | |
| Allowance for impairment losses | 0 | | | 0 | | | (1) | | | 0 | | | (1) | | | | | | | | | | | |
| Net carrying amount | 5,137 | | | 0 | | | 0 | | | 0 | | | 5,137 | | | | | | | | | | | |
| | | | | | | | | | | | | | | | | | | |
| Due from fellow Lloyds Banking Group undertakings | 738 | | | 0 | | | 0 | | | 0 | | | 738 | | | | | | | | | | | |
| Allowance for impairment losses | 0 | | | 0 | | | 0 | | | 0 | | | 0 | | | | | | | | | | | |
| Net carrying amount | 738 | | | 0 | | | 0 | | | 0 | | | 738 | | | | | | | | | | | |
| Total financial assets at amortised cost | 426,086 | | | 49,155 | | | 4,475 | | | 12,250 | | | 491,966 | | | | | | | | | | | |
1Exchange and other adjustments includes the impact of movements in exchange rates, derecognising assets as a result of modifications and adjustments, in respect of purchased or originated credit-impaired financial assets.
During the year, the economic outlook deteriorated markedly as a consequence of the COVID-19 pandemic. The Group's economic assumptions are outlined in note 3 and these have resulted in a significant increase in the expected credit loss (ECL) allowance.
The total allowance for impairment losses includes £192 million (2019: £201 million) in respect of residual value impairment and voluntary terminations within the Group’s UK motor finance business.
Movements in UK retail mortgage balances were as follows:
NOTES TO THE ACCOUNTS
for the year ended 31 December 2020
16 FINANCIAL ASSETS AT AMORTISED COST (continued)
| | | | | | | | | | | | | | | | | | | | | | | | | | | | | | | | | | | | | | | | | | | | | | | | | | | | | | | | | | | |
| Gross carrying amount | | Allowance for expected credit losses |
| Stage 1 | | Stage 2 | | Stage 3 | | POCI | | Total | | Stage 1 | | Stage 2 | | Stage 3 | | POCI | | Total |
| £m | | £m | | £m | | £m | | £m | | £m | | £m | | £m | | £m | | £m |
| UK retail mortgages | | | | | | | | | | | | | | | | | | | |
| At 1 January 2020 | 257,043 | | | 16,935 | | | 1,506 | | | 13,714 | | | 289,198 | | | 23 | | | 281 | | | 122 | | | 142 | | | 568 | |
Exchange and other adjustments1 | 0 | | | 0 | | | 0 | | | (8) | | | (8) | | | 0 | | | 0 | | | 0 | | | 21 | | | 21 | |
| | | | | | | | | | | | | | | | | | | |
| Transfers to Stage 1 | 2,418 | | | (2,414) | | | (4) | | | | | 0 | | | 17 | | | (17) | | | 0 | | | | | 0 | |
| Transfers to Stage 2 | (16,463) | | | 16,882 | | | (419) | | | | | 0 | | | (4) | | | 22 | | | (18) | | | | | 0 | |
| Transfers to Stage 3 | (199) | | | (974) | | | 1,173 | | | | | 0 | | | 0 | | | (35) | | | 35 | | | | | 0 | |
| Impact of transfers between stages | (14,244) | | | 13,494 | | | 750 | | | | | 0 | | | (15) | | | 198 | | | 66 | | | | | 249 | |
| | | | | | | | | | | (2) | | | 168 | | | 83 | | | | | 249 | |
| Other changes in credit quality | | | | | | | | | | | 63 | | | (26) | | | (23) | | | 167 | | | 181 | |
| Additions (repayments) | 8,619 | | | (1,411) | | | (375) | | | (1,156) | | | 5,677 | | | 14 | | | (15) | | | (13) | | | (30) | | | (44) | |
| Methodology and model changes | | | | | | | | | | | 6 | | | 60 | | | 24 | | | 0 | | | 90 | |
| Charge to the income statement | | | | | | | | | | | 81 | | | 187 | | | 71 | | | 137 | | | 476 | |
| Advances written off | | | | | (37) | | | (39) | | | (76) | | | | | | | (37) | | | (39) | | | (76) | |
Recoveries of advances written
off in previous years | | | | | 15 | | | 0 | | | 15 | | | | | | | 15 | | | 0 | | | 15 | |
| Discount unwind | | | | | | | | | | | | | | | 20 | | | 0 | | | 20 | |
| At 31 December 2020 | 251,418 | | | 29,018 | | | 1,859 | | | 12,511 | | | 294,806 | | | 104 | | | 468 | | | 191 | | | 261 | | | 1,024 | |
| Allowance for impairment losses | (104) | | | (468) | | | (191) | | | (261) | | | (1,024) | | | | | | | | | | | |
| Net carrying amount | 251,314 | | | 28,550 | | | 1,668 | | | 12,250 | | | 293,782 | | | | | | | | | | | |
1Exchange and other adjustments includes the impact of movements in exchange rates, derecognising assets as a result of modifications and adjustments in respect of purchased or originated credit-impaired financial assets.
Movements in allowance for expected credit losses in respect of undrawn balances were as follows:
| | | | | | | | | | | | | | | | | | | | | | | | | | | | | | | | | | | | | | | | | | | | | | | | | | | | | | | | | | | |
| | | | | | | | | | | Allowance for expected credit losses |
| | | | | | | | | | | Stage 1 | | Stage 2 | | Stage 3 | | POCI | | Total |
| The Group | | | | | | | | | | | £m | | £m | | £m | | £m | | £m |
| Undrawn balances | | | | | | | | | | | | | | | | | | | |
| At 1 January 2020 | | | | | | | | | | | 91 | | | 77 | | | 5 | | | 0 | | | 173 | |
| Exchange and other adjustments | | | | | | | | | | | 0 | | | 0 | | | 0 | | | 0 | | | 0 | |
| Transfers to Stage 1 | | | | | | | | | | | 19 | | | (19) | | | 0 | | | | | 0 | |
| Transfers to Stage 2 | | | | | | | | | | | (10) | | | 10 | | | 0 | | | | | 0 | |
| Transfers to Stage 3 | | | | | | | | | | | (1) | | | (6) | | | 7 | | | | | 0 | |
| Impact of transfers between stages | | | | | | | | | | | (10) | | | 90 | | | 10 | | | | | 90 | |
| | | | | | | | | | | (2) | | | 75 | | | 17 | | | | | 90 | |
| Other items charged to the income statement | | | | | | | | 102 | | | 69 | | | (8) | | | 0 | | | 163 | |
| Charge to the income statement | | | | | | | | | | | 100 | | | 144 | | | 9 | | | 0 | | | 253 | |
| At 31 December 2020 | | | | | | | | | | | 191 | | | 221 | | | 14 | | | 0 | | | 426 | |
The Group's total impairment allowances were as follows:
| | | | | | | | | | | | | | | | | | | | | | | | | | | | | | | | | | | | | | | | | | | | | | | | | | | | | | | | | | | |
| | | | | | | | | | | Allowance for expected credit losses |
| | | | | | | | | | | Stage 1 | | Stage 2 | | Stage 3 | | POCI | | Total |
| The Group | | | | | | | | | | | £m | | £m | | £m | | £m | | £m |
| In respect of: | | | | | | | | | | | | | | | | | | | |
| Loans and advances to banks | | | | | | | | | | | 4 | | | 0 | | | 0 | | | 0 | | | 4 | |
| Loans and advances to customers | | | | | | | | | | 1,347 | | | 2,125 | | | 1,968 | | | 261 | | | 5,701 | |
| Debt securities | | | | | | | | | | | 0 | | | 0 | | | 1 | | | 0 | | | 1 | |
| Due from fellow Lloyds Banking Group undertakings | | | | | | | | 0 | | | 0 | | | 0 | | | 0 | | | 0 | |
| Financial assets at amortised cost | | | | | | | | | | | 1,351 | | | 2,125 | | | 1,969 | | | 261 | | | 5,706 | |
| Provisions in relation to loan commitments and financial guarantees | | | | | | 191 | | | 221 | | | 14 | | | 0 | | | 426 | |
| Total | | | | | | | | | | | 1,542 | | | 2,346 | | | 1,983 | | | 261 | | | 6,132 | |
| Expected credit loss in respect of financial assets at fair value through other comprehensive income (memorandum item) | | 0 | | | 0 | | | 0 | | | 0 | | | 0 | |
NOTES TO THE ACCOUNTS
for the year ended 31 December 2020
16 FINANCIAL ASSETS AT AMORTISED COST (continued)
Year ended 31 December 2019
| | | | | | | | | | | | | | | | | | | | | | | | | | | | | | | | | | | | | | | | | | | | | | | | | | | | | | | | | | | |
| Gross carrying amount | | Allowance for expected credit losses |
| Stage 1 | | Stage 2 | | Stage 3 | | POCI | | Total | | Stage 1 | | Stage 2 | | Stage 3 | | POCI | | Total |
| The Group | £m | | £m | | £m | | £m | | £m | | £m | | £m | | £m | | £m | | £m |
| Loans and advances to banks | | | | | | | | | | | | | | | | | | | |
| At 1 January 2019 | 3,691 | | | 2 | | | 0 | | | 0 | | | 3,693 | | | 1 | | | 0 | | | 0 | | | 0 | | | 1 | |
| Exchange and other adjustments | (125) | | | 0 | | | 0 | | | 0 | | | (125) | | | (1) | | | 0 | | | 0 | | | 0 | | | (1) | |
| Additions (repayments) | 1,286 | | | (2) | | | 0 | | | 0 | | | 1,284 | | | 0 | | | 0 | | | 0 | | | 0 | | | 0 | |
| | | | | | | | | | | | | | | | | | | |
| | | | | | | | | | | | | | | | | | | |
| | | | | | | | | | | | | | | | | | | |
| | | | | | | | | | | | | | | | | | | |
| | | | | | | | | | | | | | | | | | | |
| At 31 December 2019 | 4,852 | | | 0 | | | 0 | | | 0 | | | 4,852 | | | 0 | | | 0 | | | 0 | | | 0 | | | 0 | |
| Allowance for impairment losses | 0 | | | 0 | | | 0 | | | 0 | | | 0 | | | | | | | | | | | |
| Net carrying amount | 4,852 | | | 0 | | | 0 | | | 0 | | | 4,852 | | | | | | | | | | | |
| | | | | | | | | | | | | | | | | | | |
| Loans and advances to customers | | | | | | | | | | | | | | | | | | |
| At 1 January 2019 | 420,968 | | | 25,308 | | | 5,397 | | | 15,391 | | | 467,064 | | | 518 | | | 992 | | | 1,432 | | | 78 | | | 3,020 | |
Exchange and other adjustments1 | (312) | | | (44) | | | 26 | | | 283 | | | (47) | | | 10 | | | (9) | | | 28 | | | 283 | | | 312 | |
| Acquisition of portfolios | 3,694 | | | 0 | | | 0 | | | 0 | | | 3,694 | | | | | | | | | | | |
| Transfers to Stage 1 | 6,318 | | | (6,286) | | | (32) | | | | | 0 | | | 229 | | | (222) | | | (7) | | | | | 0 | |
| Transfers to Stage 2 | (13,052) | | | 13,484 | | | (432) | | | | | 0 | | | (53) | | | 92 | | | (39) | | | | | 0 | |
| Transfers to Stage 3 | (1,539) | | | (1,437) | | | 2,976 | | | | | 0 | | | (15) | | | (140) | | | 155 | | | | | 0 | |
| Impact of transfers between stages | (8,273) | | | 5,761 | | | 2,512 | | | | | 0 | | | (175) | | | 353 | | | 420 | | | | | 598 | |
| | | | | | | | | | | (14) | | | 83 | | | 529 | | | | | 598 | |
| Other changes in credit quality | | | | | | | | | | | 31 | | | 2 | | | 905 | | | (106) | | | 832 | |
| Additions (repayments) | 13,690 | | | (2,520) | | | (857) | | | (1,934) | | | 8,379 | | | 91 | | | (48) | | | (60) | | | (87) | | | (104) | |
| Methodology and model changes | | | | | | | | | | | 33 | | | (27) | | | 8 | | | 0 | | | 14 | |
| Charge to the income statement | | | | | | | | | | | 141 | | | 10 | | | 1,382 | | | (193) | | | 1,340 | |
| Advances written off | | | | | (1,827) | | | (54) | | | (1,881) | | | | | | | (1,827) | | | (54) | | | (1,881) | |
Recoveries of advances written
off in previous years | | | | | 396 | | | 28 | | | 424 | | | | | | | 396 | | | 28 | | | 424 | |
| Discount unwind | | | | | | | | | | | | | | | (52) | | | 0 | | | (52) | |
| At 31 December 2019 | 429,767 | | | 28,505 | | | 5,647 | | | 13,714 | | | 477,633 | | | 669 | | | 993 | | | 1,359 | | | 142 | | | 3,163 | |
| Allowance for impairment losses | (669) | | | (993) | | | (1,359) | | | (142) | | | (3,163) | | | | | | | | | | | |
| Net carrying amount | 429,098 | | | 27,512 | | | 4,288 | | | 13,572 | | | 474,470 | | | | | | | | | | | |
| | | | | | | | | | | | | | | | | | | |
| Debt securities | | | | | | | | | | | | | | | | | | | |
| At 1 January 2019 | 5,095 | | | 0 | | | 2 | | | 0 | | | 5,097 | | | 0 | | | 0 | | | 2 | | | 0 | | | 2 | |
| Exchange and other adjustments | (90) | | | 0 | | | (1) | | | 0 | | | (91) | | | 0 | | | 0 | | | (1) | | | 0 | | | (1) | |
| Additions (repayments) | 320 | | | 0 | | | 0 | | | 0 | | | 320 | | | 0 | | | 0 | | | 0 | | | 0 | | | 0 | |
| | | | | | | | | | | | | | | | | | | |
| | | | | | | | | | | | | | | | | | | |
| At 31 December 2019 | 5,325 | | | 0 | | | 1 | | | 0 | | | 5,326 | | | 0 | | | 0 | | | 1 | | | 0 | | | 1 | |
| Allowance for impairment losses | 0 | | | 0 | | | (1) | | | 0 | | | (1) | | | | | | | | | | | |
| Net carrying amount | 5,325 | | | 0 | | | 0 | | | 0 | | | 5,325 | | | | | | | | | | | |
| | | | | | | | | | | | | | | | | | | |
| Due from fellow Lloyds Banking Group undertakings | 1,854 | | | 0 | | | 43 | | | 0 | | | 1,897 | | | | | | | | | | | |
| Allowance for impairment losses | 0 | | | 0 | | | (43) | | | 0 | | | (43) | | | | | | | | | | | |
| Net carrying amount | 1,854 | | | 0 | | | 0 | | | 0 | | | 1,854 | | | | | | | | | | | |
| Total financial assets at amortised cost | 441,129 | | | 27,512 | | | 4,288 | | | 13,572 | | | 486,501 | | | | | | | | | | | |
1Exchange and other adjustments includes the impact of movements in exchange rates, derecognising assets as a result of modifications and adjustments, in respect of purchased or originated credit-impaired financial assets.
Movements in UK retail mortgage balances were as follows:
NOTES TO THE ACCOUNTS
for the year ended 31 December 2020
16 FINANCIAL ASSETS AT AMORTISED COST (continued)
| | | | | | | | | | | | | | | | | | | | | | | | | | | | | | | | | | | | | | | | | | | | | | | | | | | | | | | | | | | |
| Gross carrying amount | | Allowance for expected credit losses |
| Stage 1 | | Stage 2 | | Stage 3 | | POCI | | Total | | Stage 1 | | Stage 2 | | Stage 3 | | POCI | | Total |
| £m | | £m | | £m | | £m | | £m | | £m | | £m | | £m | | £m | | £m |
| UK retail mortgages | | | | | | | | | | | | | | | | | | | |
| At 1 January 2019 | 257,797 | | | 13,654 | | | 1,393 | | | 15,391 | | | 288,235 | | | 37 | | | 226 | | | 118 | | | 78 | | | 459 | |
Exchange and other adjustments1 | (1) | | | 0 | | | 2 | | | 283 | | | 284 | | | 0 | | | 0 | | | 0 | | | 283 | | | 283 | |
| Acquisition of portfolios | 3,694 | | | 0 | | | 0 | | | 0 | | | 3,694 | | | | | | | | | | | |
| Transfers to Stage 1 | 3,060 | | | (3,057) | | | (3) | | | | | 0 | | | 17 | | | (17) | | | — | | | | | 0 | |
| Transfers to Stage 2 | (7,879) | | | 8,242 | | | (363) | | | | | 0 | | | (13) | | | 33 | | | (20) | | | | | 0 | |
| Transfers to Stage 3 | (427) | | | (472) | | | 899 | | | | | 0 | | | (5) | | | (21) | | | 26 | | | | | 0 | |
| Impact of transfers between stages | (5,246) | | | 4,713 | | | 533 | | | | | 0 | | | (15) | | | 104 | | | 39 | | | | | 128 | |
| | | | | | | | | | | (16) | | | 99 | | | 45 | | | | | 128 | |
| Other changes in credit quality | | | | | | | | | | | 6 | | | 10 | | | (33) | | | (106) | | | (123) | |
| Additions (repayments) | 799 | | | (1,432) | | | (416) | | | (1,934) | | | (2,983) | | | (4) | | | (20) | | | (16) | | | (87) | | | (127) | |
| Methodology and model changes | | | | | | | | | | | 0 | | | (34) | | | (10) | | | 0 | | | (44) | |
| Charge to the income statement | | | | | | | | | | | (14) | | | 55 | | | (14) | | | (193) | | | (166) | |
| Advances written off | | | | | (35) | | | (54) | | | (89) | | | | | | | (35) | | | (54) | | | (89) | |
Recoveries of advances written
off in previous years | | | | | 29 | | | 28 | | | 57 | | | | | | | 29 | | | 28 | | | 57 | |
| Discount unwind | | | | | | | | | | | | | | | 24 | | | 0 | | | 24 | |
| At 31 December 2019 | 257,043 | | | 16,935 | | | 1,506 | | | 13,714 | | | 289,198 | | | 23 | | | 281 | | | 122 | | | 142 | | | 568 | |
| Allowance for impairment losses | (23) | | | (281) | | | (122) | | | (142) | | | (568) | | | | | | | | | | | |
| Net carrying amount | 257,020 | | | 16,654 | | | 1,384 | | | 13,572 | | | 288,630 | | | | | | | | | | | |
1Exchange and other adjustments includes the impact of movements in exchange rates, derecognising assets as a result of modifications and adjustments in respect of purchased or originated credit-impaired financial assets.
Movements in allowance for expected credit losses in respect of undrawn balances were as follows:
| | | | | | | | | | | | | | | | | | | | | | | | | | | | | | | | | | | | | | | | | | | | | | | | | | | | | | | | | | | |
| | | | | | | | | | | Allowance for expected credit losses |
| | | | | | | | | | | Stage 1 | | Stage 2 | | Stage 3 | | POCI | | Total |
| The Group | | | | | | | | | | | £m | | £m | | £m | | £m | | £m |
| Undrawn balances | | | | | | | | | | | | | | | | | | | |
| At 1 January 2019 | | | | | | | | | | | 121 | | | 63 | | | 6 | | | 0 | | | 190 | |
| Exchange and other adjustments | | | | | | | | | | | (1) | | | 1 | | | 0 | | | 0 | | | 0 | |
| Transfers to Stage 1 | | | | | | | | | | | 19 | | | (19) | | | 0 | | | | | 0 | |
| Transfers to Stage 2 | | | | | | | | | | | (4) | | | 4 | | | 0 | | | | | 0 | |
| Transfers to Stage 3 | | | | | | | | | | | (1) | | | (3) | | | 4 | | | | | 0 | |
| Impact of transfers between stages | | | | | | | | | | | (17) | | | 24 | | | (1) | | | | | 6 | |
| | | | | | | | | | | (3) | | | 6 | | | 3 | | | | | 6 | |
| Other items charged to the income statement | | | | | | | | (26) | | | 7 | | | (4) | | | 0 | | | (23) | |
| Charge to the income statement | | | | | | | | | | | (29) | | | 13 | | | (1) | | | 0 | | | (17) | |
| At 31 December 2019 | | | | | | | | | | | 91 | | | 77 | | | 5 | | | 0 | | | 173 | |
The Group's total impairment allowances were as follows:
| | | | | | | | | | | | | | | | | | | | | | | | | | | | | | | | | | | | | | | | | | | | | | | | | | | | | | | | | | | |
| | | | | | | | | | | Allowance for expected credit losses |
| | | | | | | | | | | Stage 1 | | Stage 2 | | Stage 3 | | POCI | | Total |
| The Group | | | | | | | | | | | £m | | £m | | £m | | £m | | £m |
| In respect of: | | | | | | | | | | | | | | | | | | | |
| Loans and advances to banks | | | | | | | | | | | 0 | | | 0 | | | 0 | | | 0 | | | 0 | |
| Loans and advances to customers | | | | | | | | | | 669 | | | 993 | | | 1,359 | | | 142 | | | 3,163 | |
| Debt securities | | | | | | | | | | | 0 | | | 0 | | | 1 | | | 0 | | | 1 | |
| Due from fellow Lloyds Banking Group undertakings | | | | | | | | 0 | | | 0 | | | 43 | | | 0 | | | 43 | |
| Financial assets at amortised cost | | | | | | | | | | | 669 | | | 993 | | | 1,403 | | | 142 | | | 3,207 | |
| Provisions in relation to loan commitments and financial guarantees | | | | | | 91 | | | 77 | | | 5 | | | 0 | | | 173 | |
| Total | | | | | | | | | | | 760 | | | 1,070 | | | 1,408 | | | 142 | | | 3,380 | |
| Expected credit loss in respect of financial assets at fair value through other comprehensive income (memorandum item) | | 0 | | | 0 | | | 0 | | | 0 | | | 0 | |
NOTES TO THE ACCOUNTS
for the year ended 31 December 2020
16 FINANCIAL ASSETS AT AMORTISED COST (continued)
Year ended 31 December 2020
| | | | | | | | | | | | | | | | | | | | | | | | | | | | | | | | | | | | | | | | | | | | | | | |
| Gross carrying amount | | Allowance for expected credit losses |
| Stage 1 | | Stage 2 | | Stage 3 | | Total | | Stage 1 | | Stage 2 | | Stage 3 | | Total |
| The Bank | £m | | £m | | £m | | £m | | £m | | £m | | £m | | £m |
| Loans and advances to banks | | | | | | | | | | | | | | | |
| At 1 January 2020 | 4,453 | | | 0 | | | 0 | | | 4,453 | | | 0 | | | 0 | | | 0 | | | 0 | |
| Exchange and other adjustments | (19) | | | 0 | | | 0 | | | (19) | | | 0 | | | 0 | | | 0 | | | 0 | |
| Additions (repayments) | 1,226 | | | 0 | | | 0 | | | 1,226 | | | 0 | | | 0 | | | 0 | | | 0 | |
| | | | | | | | | | | | | | | |
| Charge to the income statement | | | | | | | | | 4 | | | 0 | | | 0 | | | 4 | |
| | | | | | | | | | | | | | | |
| | | | | | | | | | | | | | | |
| | | | | | | | | | | | | | | |
| At 31 December 2020 | 5,660 | | | 0 | | | 0 | | | 5,660 | | | 4 | | | 0 | | | 0 | | | 4 | |
| Allowance for impairment losses | (4) | | | 0 | | | 0 | | | (4) | | | | | | | | | |
| Net carrying amount | 5,656 | | | 0 | | | 0 | | | 5,656 | | | | | | | | | |
| | | | | | | | | | | | | | | |
| Loans and advances to customers | | | | | | | | | | | | | | | |
| At 1 January 2020 | 165,676 | | | 10,681 | | | 2,385 | | | 178,742 | | | 238 | | | 435 | | | 500 | | | 1,173 | |
| Exchange and other adjustments | 40 | | | (1) | | | (220) | | | (181) | | | 0 | | | 0 | | | 23 | | | 23 | |
| Transfers to Stage 1 | 1,974 | | | (1,967) | | | (7) | | | 0 | | | 73 | | | (72) | | | (1) | | | 0 | |
| Transfers to Stage 2 | (11,777) | | | 12,089 | | | (312) | | | 0 | | | (49) | | | 66 | | | (17) | | | 0 | |
| Transfers to Stage 3 | (955) | | | (900) | | | 1,855 | | | 0 | | | (10) | | | (59) | | | 69 | | | 0 | |
| Impact of transfers between stages | (10,758) | | | 9,222 | | | 1,536 | | | 0 | | | (49) | | | 340 | | | 311 | | | 602 | |
| | | | | | | | | (35) | | | 275 | | | 362 | | | 602 | |
| Other changes in credit quality | | | | | | | | | 382 | | | (43) | | | 479 | | | 818 | |
| Additions (repayments) | 1,231 | | | 1,592 | | | (212) | | | 2,611 | | | 35 | | | 137 | | | (19) | | | 153 | |
| Methodology and model changes | | | | | | | | | (31) | | | 170 | | | 26 | | | 165 | |
| Charge to the income statement | | | | | | | | | 351 | | | 539 | | | 848 | | | 1,738 | |
| Advances written off | | | | | (708) | | | (708) | | | | | | | (708) | | | (708) | |
Recoveries of advances written off in previous
years | | | | | 86 | | | 86 | | | | | | | 86 | | | 86 | |
| Discount unwind | | | | | | | | | | | | | (31) | | | (31) | |
| At 31 December 2020 | 156,189 | | | 21,494 | | | 2,867 | | | 180,550 | | | 589 | | | 974 | | | 718 | | | 2,281 | |
| Allowance for impairment losses | (589) | | | (974) | | | (718) | | | (2,281) | | | | | | | | | |
| Net carrying amount | 155,600 | | | 20,520 | | | 2,149 | | | 178,269 | | | | | | | | | |
| | | | | | | | | | | | | | | |
| Debt securities | | | | | | | | | | | | | | | |
| At 1 January 2020 | 5,241 | | | 0 | | | 0 | | | 5,241 | | | 0 | | | 0 | | | 0 | | | 0 | |
| Exchange and other adjustments | (16) | | | 0 | | | 0 | | | (16) | | | 0 | | | 0 | | | 0 | | | 0 | |
| Additions (repayments) | (909) | | | 0 | | | 0 | | | (909) | | | 1 | | | 0 | | | 0 | | | 1 | |
| | | | | | | | | | | | | | | |
| At 31 December 2020 | 4,316 | | | 0 | | | 0 | | | 4,316 | | | 1 | | | 0 | | | 0 | | | 1 | |
| Allowance for impairment losses | (1) | | | 0 | | | 0 | | | (1) | | | | | | | | | |
| Net carrying amount | 4,315 | | | 0 | | | 0 | | | 4,315 | | | | | | | | | |
| | | | | | | | | | | | | | | |
| Due from fellow Lloyds Banking Group undertakings | 128,791 | | | 0 | | | 7 | | | 128,798 | | | | | | | | | |
| Allowance for impairment losses | (20) | | | 0 | | | (7) | | | (27) | | | | | | | | | |
| Net carrying amount | 128,771 | | | 0 | | | 0 | | | 128,771 | | | | | | | | | |
| Total financial assets at amortised cost | 294,342 | | | 20,520 | | | 2,149 | | | 317,011 | | | | | | | | | |
NOTES TO THE ACCOUNTS
for the year ended 31 December 2020
16 FINANCIAL ASSETS AT AMORTISED COST (continued)
Movements in allowance for expected credit losses in respect of undrawn balances were as follows:
| | | | | | | | | | | | | | | | | | | | | | | | | | | | | | | | | | | | | | | | | | | | | | | |
| | | | | | | | | Allowance for expected credit losses |
| | | | | | | | | Stage 1 | | Stage 2 | | Stage 3 | | Total |
| The Bank | | | | | | | | | £m | | £m | | £m | | £m |
| Undrawn balances | | | | | | | | | | | | | | | |
| At 1 January 2020 | | | | | | | | | 44 | | | 42 | | | 4 | | | 90 | |
| Exchange and other adjustments | | | | | | | | | 0 | | | 0 | | | 0 | | | 0 | |
| Transfers to Stage 1 | | | | | | | | | 9 | | | (9) | | | 0 | | | 0 | |
| Transfers to Stage 2 | | | | | | | | | (5) | | | 5 | | | 0 | | | 0 | |
| Transfers to Stage 3 | | | | | | | | | 0 | | | (3) | | | 3 | | | 0 | |
| Impact of transfers between stages | | | | | | | | | (5) | | | 58 | | | 0 | | | 53 | |
| | | | | | | | | (1) | | | 51 | | | 3 | | | 53 | |
| Other items charged to the income statement | | | | | | | | | 59 | | | 42 | | | 1 | | | 102 | |
| Charge to the income statement | | | | | | | | | 58 | | | 93 | | | 4 | | | 155 | |
| At 31 December 2020 | | | | | | | | | 102 | | | 135 | | | 8 | | | 245 | |
The Bank's total impairment allowances were as follows:
| | | | | | | | | | | | | | | | | | | | | | | | | | | | | | | | | | | | | | | | | | | | | | | |
| | | | | | | | | Allowance for expected credit losses |
| | | | | | | | | Stage 1 | | Stage 2 | | Stage 3 | | Total |
| The Bank | | | | | | | | | £m | | £m | | £m | | £m |
| In respect of: | | | | | | | | | | | | | | | |
| Loans and advances to banks | | | | | | | | | 4 | | | 0 | | | 0 | | | 4 | |
| Loans and advances to customers | | | | | | | | | 589 | | | 974 | | | 718 | | | 2,281 | |
| Debt securities | | | | | | | | | 1 | | | 0 | | | 0 | | | 1 | |
| Due from fellow Lloyds Banking Group undertakings | | | | | | 20 | | | 0 | | | 7 | | | 27 | |
| Financial assets at amortised cost | | | | | | | | | 614 | | | 974 | | | 725 | | | 2,313 | |
| Provisions in relation to loan commitments and financial guarantees | | | | 102 | | | 135 | | | 8 | | | 245 | |
| Total | | | | | | | | | 716 | | | 1,109 | | | 733 | | | 2,558 | |
| Expected credit loss in respect of financial assets at fair value through other comprehensive income (memorandum item) | | 0 | | | 0 | | | 0 | | | 0 | |
NOTES TO THE ACCOUNTS
for the year ended 31 December 2020
16 FINANCIAL ASSETS AT AMORTISED COST (continued)
Year ended 31 December 2019
| | | | | | | | | | | | | | | | | | | | | | | | | | | | | | | | | | | | | | | | | | | | | | | |
| Gross carrying amount | | Allowance for expected credit losses |
| Stage 1 | | Stage 2 | | Stage 3 | | Total | | Stage 1 | | Stage 2 | | Stage 3 | | Total |
| The Bank | £m | | £m | | £m | | £m | | £m | | £m | | £m | | £m |
| Loans and advances to banks | | | | | | | | | | | | | | | |
| At 1 January 2019 | 3,154 | | | 0 | | | 0 | | | 3,154 | | | 1 | | | 0 | | | 0 | | | 1 | |
| Exchange and other adjustments | (105) | | | 0 | | | 0 | | | (105) | | | (1) | | | 0 | | 0 | | (1) | |
| Additions (repayments) | 1,404 | | | 0 | | | 0 | | | 1,404 | | | 0 | | | 0 | | | 0 | | | 0 | |
| | | | | | | | | | | | | | | |
| | | | | | | | | | | | | | | |
| | | | | | | | | | | | | | | |
| | | | | | | | | | | | | | | |
| | | | | | | | | | | | | | | |
| | | | | | | | | | | | | | | |
| At 31 December 2019 | 4,453 | | | 0 | | | 0 | | | 4,453 | | | 0 | | | 0 | | | 0 | | | 0 | |
| Allowance for impairment losses | 0 | | | 0 | | | 0 | | | 0 | | | | | | | | | |
| Net carrying amount | 4,453 | | | 0 | | | 0 | | | 4,453 | | | | | | | | | |
| | | | | | | | | | | | | | | |
| Loans and advances to customers | | | | | | | | | | | | | | | |
| At 1 January 2019 | 160,379 | | | 11,006 | | | 2,464 | | | 173,849 | | | 209 | | | 502 | | | 823 | | | 1,534 | |
| Exchange and other adjustments | (325) | | | (14) | | | 0 | | | (339) | | | 1 | | | 0 | | | (33) | | | (32) | |
| Transfers to Stage 1 | 2,805 | | | (2,782) | | | (23) | | | 0 | | | 113 | | | (109) | | | (4) | | | 0 | |
| Transfers to Stage 2 | (4,236) | | | 4,455 | | | (219) | | | 0 | | | (17) | | | 33 | | | (16) | | | 0 | |
| Transfers to Stage 3 | (649) | | | (560) | | | 1,209 | | | 0 | | | (7) | | | (68) | | | 75 | | | 0 | |
| Impact of transfers between stages | (2,080) | | | 1,113 | | | 967 | | | 0 | | | (96) | | | 127 | | | 227 | | | 258 | |
| | | | | | | | | (7) | | | (17) | | | 282 | | | 258 | |
| Other changes in credit quality | | | | | | | | | (11) | | | 18 | | | 226 | | | 233 | |
| Additions (repayments) | 7,702 | | | (1,424) | | | (287) | | | 5,991 | | | 13 | | | (41) | | | (15) | | | (43) | |
| Methodology and model changes | | | | | | | | | 33 | | | (27) | | | 8 | | | 14 | |
| Charge to the income statement | | | | | | | | | 28 | | | (67) | | | 501 | | | 462 | |
| Advances written off | | | | | (911) | | | (911) | | | | | | | (911) | | | (911) | |
Recoveries of advances written off in previous
years | | | | | 152 | | | 152 | | | | | | | 152 | | | 152 | |
| Discount unwind | | | | | | | | | | | | | (32) | | | (32) | |
| At 31 December 2019 | 165,676 | | | 10,681 | | | 2,385 | | | 178,742 | | | 238 | | | 435 | | | 500 | | | 1,173 | |
| Allowance for impairment losses | (238) | | | (435) | | | (500) | | | (1,173) | | | | | | | | | |
| Net carrying amount | 165,438 | | | 10,246 | | | 1,885 | | | 177,569 | | | | | | | | | |
| | | | | | | | | | | | | | | |
| Debt securities | | | | | | | | | | | | | | | |
| At 1 January 2019 | 4,960 | | | 0 | | | 0 | | | 4,960 | | | 0 | | | 0 | | | 0 | | | 0 | |
| Exchange and other adjustments | (91) | | | 0 | | | 0 | | | (91) | | | 0 | | | 0 | | | 0 | | | 0 | |
| Additions (repayments) | 372 | | | 0 | | | 0 | | | 372 | | | 0 | | | 0 | | | 0 | | | 0 | |
| | | | | | | | | | | | | | | |
| At 31 December 2019 | 5,241 | | | 0 | | | 0 | | | 5,241 | | | 0 | | | 0 | | | 0 | | | 0 | |
| Allowance for impairment losses | 0 | | | 0 | | | 0 | | | 0 | | | | | | | | | |
| Net carrying amount | 5,241 | | | 0 | | | 0 | | | 5,241 | | | | | | | | | |
| | | | | | | | | | | | | | | |
Due from fellow Lloyds Banking Group
undertakings | 202,295 | | | 0 | | | 55 | | | 202,350 | | | | | | | | | |
| Allowance for impairment losses | (18) | | | 0 | | | (55) | | | (73) | | | | | | | | | |
| Net carrying amount | 202,277 | | | 0 | | | 0 | | | 202,277 | | | | | | | | | |
| Total financial assets at amortised cost | 377,409 | | | 10,246 | | | 1,885 | | | 389,540 | | | | | | | | | |
NOTES TO THE ACCOUNTS
for the year ended 31 December 2020
16 FINANCIAL ASSETS AT AMORTISED COST (continued)
Movements in allowance for expected credit losses in respect of undrawn balances were as follows:
| | | | | | | | | | | | | | | | | | | | | | | | | | | | | | | | | | | | | | | | | | | | | | | |
| | | | | | | | | Allowance for expected credit losses |
| | | | | | | | | Stage 1 | | Stage 2 | | Stage 3 | | Total |
| The Bank | | | | | | | | | £m | | £m | | £m | | £m |
| Undrawn balances | | | | | | | | | | | | | | | |
| At 1 January 2019 | | | | | | | | | 41 | | | 32 | | | 3 | | | 76 | |
| Exchange and other adjustments | | | | | | | | | 0 | | | 0 | | | 0 | | | 0 | |
| Transfers to Stage 1 | | | | | | | | | 8 | | | (8) | | | 0 | | | 0 | |
| Transfers to Stage 2 | | | | | | | | | (2) | | | 2 | | | 0 | | | 0 | |
| Transfers to Stage 3 | | | | | | | | | 0 | | | (2) | | | 2 | | | 0 | |
| Impact of transfers between stages | | | | | | | | | (7) | | | 15 | | | (1) | | | 7 | |
| | | | | | | | | (1) | | | 7 | | | 1 | | | 7 | |
| Other items charged to the income statement | | | | | | | | | 4 | | | 3 | | | 0 | | | 7 | |
| Charge to the income statement | | | | | | | | | 3 | | | 10 | | | 1 | | | 14 | |
| At 31 December 2019 | | | | | | | | | 44 | | | 42 | | | 4 | | | 90 | |
The Bank's total impairment allowances were as follows:
| | | | | | | | | | | | | | | | | | | | | | | | | | | | | | | | | | | | | | | | | | | | | | | |
| | | | | | | | | Allowance for expected credit losses |
| | | | | | | | | Stage 1 | | Stage 2 | | Stage 3 | | Total |
| The Bank | | | | | | | | | £m | | £m | | £m | | £m |
| In respect of: | | | | | | | | | | | | | | | |
| Loans and advances to banks | | | | | | | | | 0 | | | 0 | | | 0 | | | 0 | |
| Loans and advances to customers | | | | | | | | | 238 | | | 435 | | | 500 | | | 1,173 | |
| Debt securities | | | | | | | | | 0 | | | 0 | | | 0 | | | 0 | |
| Due from fellow Lloyds Banking Group undertakings | | | | | | 18 | | | 0 | | | 55 | | | 73 | |
| Financial assets at amortised cost | | | | | | | | | 256 | | | 435 | | | 555 | | | 1,246 | |
| Provisions in relation to loan commitments and financial guarantees | | | | 44 | | | 42 | | | 4 | | | 90 | |
| Total | | | | | | | | | 300 | | | 477 | | | 559 | | | 1,336 | |
| Expected credit loss in respect of financial assets at fair value through other comprehensive income (memorandum item) | | 0 | | | 0 | | | 0 | | | 0 | |
The movement tables are compiled by comparing the position at 31 December to that at the beginning of the year. Transfers between stages are deemed to have taken place at the start of the reporting period, with all other movements shown in the stage in which the asset is held at 31 December, with the exception of those held within purchased or originated credit-impaired, which are not transferrable.
Additions (repayments) comprise new loans originated and repayments of outstanding balances throughout the reporting period. Loans which are written off in the period are first transferred to Stage 3 before acquiring a full allowance and subsequent write-off.
At 31 December 2020 £385,517 million (2019: £378,457 million) of loans and advances to customers of the Group and £105,738 million (2019: £103,042 million) of the Bank had a contractual residual maturity of greater than one year.
At 31 December 2020 £1,082 million (2019: £1,498 million) of loans and advances to banks of the Group and £1,024 million (2019: £1,231 million) of the Bank had a contractual residual maturity of greater than one year.
At 31 December 2020 £5,110 million (2019: £5,314 million) of debt securities of the Group and £4,300 million (2019: £5,241 million) of the Bank had a contractual residual maturity of greater than one year.
For amounts included above which are subject to reverse repurchase agreements see note 45.
NOTES TO THE ACCOUNTS
for the year ended 31 December 2020
17 FINANCE LEASE RECEIVABLES
The Group’s finance lease receivables are classified as loans and advances to customers and accounted for at amortised cost. The balance is analysed as follows:
| | | | | | | | | | | | | | | | | |
| The Group | | The Bank |
| 2020 | 2019 | | 2020 | 2019 |
| £m | £m | | £m | £m |
| Gross investment in finance leases, receivable: | | | | | |
| Not later than 1 year | 308 | | 484 | | | 18 | | 70 | |
| Later than 1 year and not later than 2 years | 180 | | 340 | | | 2 | | 6 | |
| Later than 2 years and not later than 3 years | 143 | | 174 | | | 2 | | 6 | |
| Later than 3 years and not later than 4 years | 191 | | 138 | | | 7 | | 6 | |
| Later than 4 years and not later than 5 years | 110 | | 201 | | | 2 | | 5 | |
| Later than 5 years | 571 | | 695 | | | 0 | | 0 | |
| 1,503 | | 2,032 | | | 31 | | 93 | |
| Unearned future finance income on finance leases | (440) | | (478) | | | 0 | | 0 | |
| Rentals received in advance | (16) | | (18) | | | (1) | | 0 | |
| Net investment in finance leases | 1,047 | | 1,536 | | | 30 | | 93 | |
The net investment in finance leases represents amounts recoverable as follows:
| | | | | | | | | | | | | | | | | |
| The Group | | The Bank |
| 2020 | 2019 | | 2020 | 2019 |
| £m | £m | | £m | £m |
| Not later than 1 year | 237 | | 404 | | | 17 | | 70 | |
| Later than 1 year and not later than 2 years | 135 | | 322 | | | 2 | | 6 | |
| Later than 2 years and not later than 3 years | 104 | | 126 | | | 2 | | 6 | |
| Later than 3 years and not later than 4 years | 159 | | 98 | | | 7 | | 6 | |
| Later than 4 years and not later than 5 years | 86 | | 166 | | | 2 | | 5 | |
| Later than 5 years | 326 | | 420 | | | 0 | | 0 | |
| Net investment in finance leases | 1,047 | | 1,536 | | | 30 | | 93 | |
Equipment leased to customers under finance leases primarily relates to structured financing transactions to fund the purchase of aircraft, ships and other large individual value items. There was an allowance for uncollectable finance lease receivables included in the allowance for impairment losses for the Group of £22 million (2019: £12 million).
18 FINANCIAL ASSETS AT FAIR VALUE THROUGH OTHER COMPREHENSIVE INCOME
| | | | | | | | | | | | | | | | | | | | | | | |
| The Group | | The Bank |
| 2020 | | 2019 | | 2020 | | 2019 |
| £m | | £m | | £m | | £m |
| Debt securities: | | | | | | | |
| Government securities | 14,267 | | | 13,082 | | | 14,114 | | | 12,938 | |
| Asset-backed securities | 65 | | | 60 | | | 0 | | | 0 | |
| Corporate and other debt securities | 12,928 | | | 11,036 | | | 10,533 | | | 8,783 | |
| 27,260 | | | 24,178 | | | 24,647 | | | 21,721 | |
| Treasury and other bills | 0 | | | 439 | | | 0 | | | 439 | |
| Total financial assets at fair value through other comprehensive income | 27,260 | | | 24,617 | | | 24,647 | | | 22,160 | |
At 31 December 2020 £25,826 million (2019: £23,385 million) of financial assets at fair value through other comprehensive income of the Group and £23,494 million (2019: £21,052 million) of the Bank had a contractual residual maturity of greater than one year.
All assets were assessed at Stage 1 at 31 December 2019 and 2020.
NOTES TO THE ACCOUNTS
for the year ended 31 December 2020
19 GOODWILL OF THE GROUP
| | | | | | | | |
| 2020 | 2019 |
| £m | £m |
| At 1 January | 474 | | 474 | |
| Impairment charged to the income statement | (4) | | 0 | |
| At 31 December | 470 | | 474 | |
Cost1 | 814 | | 814 | |
| Accumulated impairment losses | (344) | | (340) | |
| At 31 December | 470 | | 474 | |
1For acquisitions made prior to 1 January 2004, the date of transition to IFRS, cost is included net of amounts amortised up to 31 December 2003.
The goodwill held in the Group’s balance sheet is tested at least annually for impairment. For the purposes of impairment testing the goodwill is allocated to the appropriate cash generating unit; of the total balance of £470 million (2019: £474 million), £302 million, or 64 per cent (2019: £302 million, 64 per cent) has been allocated to Cards and £166 million, or 35 per cent (2019: £170 million, 36 per cent) has been allocated to Motor Finance, both in the Group’s Retail division.
The recoverable amount of the goodwill relating to Motor Finance has been based on a value-in-use calculation using pre-tax cash flow projections based on financial budgets and plans approved by management covering a four-year period and a discount rate of 14 per cent. The cash flows beyond the four-year period are extrapolated using a growth rate of 0.5 per cent which does not exceed the long-term average growth rates for the markets in which Motor Finance participates. Management believes that any reasonably possible change in the key assumptions above would not cause the recoverable amount of the goodwill relating to Motor Finance to fall below the balance sheet carrying value. The impairment charge of £4 million related to the goodwill arising on a small, separable acquisition a number of years ago.
The recoverable amount of the goodwill relating to the Cards business has been based on a value-in-use calculation using pre-tax cash flow projections based on financial budgets and plans approved by management covering a five-year period and a discount rate of 13 per cent. The cash flows beyond the five year period assume no growth. Management believes that any reasonably possible change in the key assumptions above would not cause the recoverable amount of the goodwill relating to the Cards business to fall below the balance sheet carrying value.
20 OTHER INTANGIBLE ASSETS
| | | | | | | | | | | | | | | | | | | | | | | | | | |
| The Group | | The Bank |
| Brands | Core deposit
intangible | Purchased
credit card
relationships | Customer-
related
intangibles | Capitalised
software
enhancements | Total | | Capitalised
software
enhancements |
| £m | £m | £m | £m | £m | £m | | £m |
| Cost: | | | | | | | | |
| At 1 January 2019 | 584 | | 2,770 | | 1,002 | | 50 | | 3,907 | | 8,313 | | | 3,306 | |
| Additions | 0 | | 0 | | 0 | | 0 | | 1,029 | | 1,029 | | | 978 | |
| Disposals | 0 | | 0 | | 0 | | 0 | | (10) | | (10) | | | (4) | |
| At 31 December 2019 | 584 | | 2,770 | | 1,002 | | 50 | | 4,926 | | 9,332 | | | 4,280 | |
| Additions | 0 | | 0 | | 0 | | 0 | | 984 | | 984 | | | 857 | |
| Disposals | 0 | | 0 | | 0 | | 0 | | (55) | | (55) | | | (6) | |
| At 31 December 2020 | 584 | | 2,770 | | 1,002 | | 50 | | 5,855 | | 10,261 | | | 5,131 | |
| Accumulated amortisation: | | | | | | | | |
| At 1 January 2019 | 204 | | 2,770 | | 411 | | 50 | | 1,556 | | 4,991 | | | 1,244 | |
| Charge for the year (note 9) | 0 | | 0 | | 70 | | 0 | | 492 | | 562 | | | 420 | |
| Disposals | 0 | | 0 | | 0 | | 0 | | (2) | | (2) | | | (2) | |
| At 31 December 2019 | 204 | | 2,770 | | 481 | | 50 | | 2,046 | | 5,551 | | | 1,662 | |
| Charge for the year (note 9) | 0 | | 0 | | 70 | | 0 | | 583 | | 653 | | | 515 | |
| Disposals | 0 | | 0 | | 0 | | 0 | | (55) | | (55) | | | (6) | |
| At 31 December 2020 | 204 | | 2,770 | | 551 | | 50 | | 2,574 | | 6,149 | | | 2,171 | |
Balance sheet amount at
31 December 2020 | 380 | | 0 | | 451 | | 0 | | 3,281 | | 4,112 | | | 2,960 | |
Balance sheet amount at
31 December 2019 | 380 | | 0 | | 521 | | 0 | | 2,880 | | 3,781 | | | 2,618 | |
Brands arising from the acquisition of Bank of Scotland in 2009 are recognised on the Group's balance sheet and have been determined to have an indefinite useful life. The carrying value at 31 December 2020 was £380 million (2019: £380 million). The Bank of Scotland name has been in existence for over 300 years and there are no indications that the brand should not have an indefinite useful life. The recoverable amount has been based on a value-in-use calculation. The calculation uses post-tax projections of the income generated by the brands, a discount rate of 9.31 per cent and a future growth rate of 2.5 per cent. Management estimates that if the growth rate were decreased by 1 per cent there would have been impairment charge of £50 million.
NOTES TO THE ACCOUNTS
for the year ended 31 December 2020
21 PROPERTY, PLANT AND EQUIPMENT
| | | | | | | | | | | | | | | | | | | | | | | | | | | | | | | | | | | |
| The Group | | The Bank |
| Investment
properties | Premises | Equipment | Operating
lease assets | Right-of-use asset1 | Total | | Premises | Equipment | Right-of-use asset1 | Total |
| £m | £m | £m | £m | £m | £m | | £m | £m | £m | £m |
| Cost or valuation: | | | | | | | | | | | |
| At 1 January 2019 | 35 | | 1,180 | | 4,966 | | 6,642 | | 1,655 | | 14,478 | | | 1,275 | | 6,267 | | 883 | | 8,425 | |
| Exchange and other adjustments | 0 | | 3 | | 4 | | 0 | | 0 | | 7 | | | 21 | | 0 | 0 | | 21 | |
| Additions | 0 | | 118 | | 518 | | 1,693 | | 183 | | 2,512 | | | 62 | | 484 | | 114 | | 660 | |
| Expenditure on investment properties (see below) | 11 | | 0 | | 0 | | 0 | | 0 | | 11 | | | 0 | | 0 | | 0 | | 0 | |
| Change in fair value of investment properties (note 7) | (8) | | 0 | | 0 | | 0 | | 0 | | (8) | | | 0 | | 0 | | 0 | | 0 | |
| Disposals | (23) | | (243) | | (231) | | (1,681) | | (25) | | (2,203) | | | (271) | | (210) | | (16) | | (497) | |
| At 31 December 2019 | 15 | | 1,058 | | 5,257 | | 6,654 | | 1,813 | | 14,797 | | | 1,087 | | 6,541 | | 981 | | 8,609 | |
| Exchange and other adjustments | 0 | | 1 | | 0 | | 0 | | 0 | | 1 | | | 7 | | 0 | | 0 | | 7 | |
| Additions | 0 | | 72 | | 314 | | 1,436 | | 122 | | 1,944 | | | 42 | | 287 | | 104 | | 433 | |
| Expenditure on investment properties (see below) | 9 | | 0 | | 0 | | 0 | | 0 | | 9 | | | 0 | | 0 | | 0 | | 0 | |
| Change in fair value of investment properties (note 7) | (20) | | 0 | | 0 | | 0 | | 0 | | (20) | | | 0 | | 0 | | 0 | | 0 | |
| Disposals | 0 | | (184) | | (501) | | (1,914) | | (124) | | (2,723) | | | (113) | | (472) | | (103) | | (688) | |
| At 31 December 2020 | 4 | | 947 | | 5,070 | | 6,176 | | 1,811 | | 14,008 | | | 1,023 | | 6,356 | | 982 | | 8,361 | |
| Accumulated depreciation and impairment: | | | | | | | | | | | |
| At 1 January 2019 | 0 | | 199 | | 2,270 | | 1,839 | | 0 | | 4,308 | | | 687 | | 3,915 | | 0 | | 4,602 | |
| Exchange and other adjustments | 0 | | 0 | | (1) | | (33) | | 1 | | (33) | | | 8 | | 0 | | 3 | | 11 | |
| Depreciation charge for the year (note 9) | 0 | | 121 | | 710 | | 1,006 | | 203 | | 2,040 | | | 67 | | 648 | | 110 | | 825 | |
| Disposals | 0 | | (225) | | (176) | | (584) | | 0 | | (985) | | | (257) | | (166) | | 0 | | (423) | |
| At 31 December 2019 | 0 | | 95 | | 2,803 | | 2,228 | | 204 | | 5,330 | | | 505 | | 4,397 | | 113 | | 5,015 | |
| Exchange and other adjustments | 0 | | (1) | | 2 | | 0 | | 0 | | 1 | | | 0 | | 2 | | 0 | | 2 | |
| Depreciation charge for the year (note 9) | 0 | | 124 | | 676 | | 1,002 | | 215 | | 2,017 | | | 70 | | 619 | | 121 | | 810 | |
| Disposals | 0 | | (137) | | (466) | | (1,012) | | (42) | | (1,657) | | | (93) | | (441) | | (30) | | (564) | |
| At 31 December 2020 | 0 | | 81 | | 3,015 | | 2,218 | | 377 | | 5,691 | | | 482 | | 4,577 | | 204 | | 5,263 | |
Balance sheet amount at
31 December 2020 | 4 | | 866 | | 2,055 | | 3,958 | | 1,434 | | 8,317 | | | 541 | | 1,779 | | 778 | | 3,098 | |
Balance sheet amount at
31 December 2019 | 15 | | 963 | | 2,454 | | 4,426 | | 1,609 | | 9,467 | | | 582 | | 2,144 | | 868 | | 3,594 | |
1Primarily premises.
Expenditure on investment properties is comprised as follows:
| | | | | | | | |
| 2020 | 2019 |
| £m | £m |
| Acquisitions of new properties | 9 | | 11 | |
| Additional expenditure on existing properties | 0 | | 0 | |
| 9 | | 11 | |
NOTES TO THE ACCOUNTS
for the year ended 31 December 2020
21 PROPERTY, PLANT AND EQUIPMENT (continued)
The table above analyses movements in investment properties, all of which are categorised as level 3. See note 42 for details of levels in the fair value hierarchy.
At 31 December the future minimum rentals receivable by the Group under non-cancellable operating leases were as follows:
| | | | | | | | |
| 2020 | 2019 |
| £m | £m |
| Receivable within 1 year | 864 | | 977 | |
| 1 to 2 years | 548 | | 620 | |
| 2 to 3 years | 274 | | 312 | |
| 3 to 4 years | 78 | | 102 | |
| 4 to 5 years | 7 | | 12 | |
| Over 5 years | 0 | | 2 | |
| Total future minimum rentals receivable | 1,771 | | 2,025 | |
Equipment leased to customers under operating leases primarily relates to vehicle contract hire arrangements.
22 INVESTMENT IN SUBSIDIARY UNDERTAKINGS OF THE BANK
| | | | | | | | |
| 2020 | 2019 |
| £m | £m |
| At 1 January | 34,084 | | 32,656 | |
| Additions and capital injections | 1,055 | | 1,766 | |
| Capital contributions | 33 | | 53 | |
| Capital repayments | (1,801) | | (212) | |
| Disposals | (18) | | (20) | |
Impairment1 | 0 | | (159) | |
| At 31 December | 33,353 | | 34,084 | |
1During the year ended 31 December 2019 the Bank wrote-down the carrying value of its investments in certain subsidiaries, following a review of their financial position and anticipated future activities.
Certain subsidiary companies currently have insufficient distributable reserves to make dividend payments, however, there were no further significant restrictions on any of the Bank’s subsidiaries in paying dividends or repaying loans and advances. All regulated banking subsidiaries are required to maintain capital at levels agreed with the regulators; this may impact those subsidiaries’ ability to make distributions.
23 OTHER ASSETS
| | | | | | | | | | | | | | | | | |
| The Group | | The Bank |
| 2020 | 2019 | | 2020 | 2019 |
| £m | £m | | £m | £m |
| Settlement balances | 202 | | 490 | | | 100 | | 437 | |
| Prepayments | 1,030 | | 1,229 | | | 443 | | 469 | |
| Other assets | 660 | | 808 | | | 211 | | 92 | |
| Total other assets | 1,892 | | 2,527 | | | 754 | | 998 | |
NOTES TO THE ACCOUNTS
for the year ended 31 December 2020
24 FINANCIAL LIABILITIES AT FAIR VALUE THROUGH PROFIT OR LOSS
| | | | | | | | | | | | | | | | | | | | | | | |
| The Group | | The Bank |
| 2020 | | 2019 | | 2020 | | 2019 |
| £m | | £m | | £m | | £m |
| Liabilities designated at fair value through profit or loss: debt securities in issue | 6,828 | | | 7,531 | | | 7,905 | | | 7,484 | |
| Trading liabilities: | | | | | | | |
| | | | | | | |
| Other deposits | 2 | | | 98 | | | 2 | | | 140 | |
| Short positions in securities | 1 | | | 73 | | | 0 | | | 73 | |
| 3 | | | 171 | | | 2 | | | 213 | |
| Total financial liabilities at fair value through profit or loss | 6,831 | | | 7,702 | | | 7,907 | | | 7,697 | |
At 31 December 2020, the Group had £6,682 million (2019: £7,376 million) and the Bank had £7,758 million (2019: £7,328 million) of trading and other liabilities at fair value through profit or loss with a contractual residual maturity of greater than one year.
Liabilities designated at fair value through profit or loss primarily represent debt securities in issue which either contain substantive embedded derivatives which would otherwise need to be recognised and measured at fair value separately from the related debt securities, or which are accounted for at fair value to significantly reduce an accounting mismatch.
For the Group, the amount contractually payable on maturity of the debt securities held at fair value through profit or loss at 31 December 2020 was £11,503 million, which was £4,675 million higher than the balance sheet carrying value (2019: £14,365 million. which was £6,834 million higher than the balance sheet carrying value). At 31 December 2020 there was a cumulative £109 million increase in the fair value of these liabilities attributable to changes in credit spread risk; this is determined by reference to the quoted credit spreads of the Bank. Of the cumulative amount, an increase of £75 million arose in 2020 and an increase of £419 million arose in 2019.
In addition, the Bank has £1,122 million (2019: £NaN) of debt securities in issue which are accounted for at fair value to significantly reduce an accounting mismatch. The changes in the credit risk of these liabilities are linked to the changes in credit risk on corresponding assets that the Bank holds at fair value through profit or loss, representing debt securities issued by subsidiaries. Given the economic relationship between these assets and liabilities, the Bank presents changes in the credit risk of these liabilities in profit or loss in order to avoid creating or enlarging an accounting mismatch.
For the fair value of collateral pledged in respect of repurchase agreements see note 45.
25 DEBT SECURITIES IN ISSUE
| | | | | | | | | | | | | | | | | |
| The Group | | The Bank |
| 2020 | 2019 | | 2020 | 2019 |
| £m | £m | | £m | £m |
| Medium-term notes issued | 21,501 | | 26,628 | | | 19,546 | | 25,603 | |
| Covered bonds (note 26) | 23,977 | | 29,818 | | | 20,895 | | 25,359 | |
| Certificates of deposit issued | 3,597 | | 4,925 | | | 3,597 | | 4,925 | |
| Securitisation notes (note 26) | 4,436 | | 7,329 | | | 0 | | 0 | |
| Commercial paper | 5,782 | | 7,731 | | | 4,071 | | 5,622 | |
| Total debt securities in issue | 59,293 | | 76,431 | | | 48,109 | | 61,509 | |
At 31 December 2020 £40,765 million (2019: £41,762 million) of debt securities in issue of the Group and £33,582 million (2019: £32,152 million) of the Bank had a contractual residual maturity of greater than one year.
NOTES TO THE ACCOUNTS
for the year ended 31 December 2020
26 SECURITISATIONS AND COVERED BONDS
Securitisation programmes
The Group’s balance sheet includes loans securitised under the Group’s securitisation programmes, the majority of which have been sold by Group companies to bankruptcy remote structured entities. As the structured entities are funded by the issue of debt on terms whereby the majority of the risks and rewards of the portfolio are retained by the Group company, the structured entities are consolidated fully and all of these loans are retained on the Group’s balance sheet, with the related notes in issue included within debt securities in issue.
Covered bond programmes
Certain loans and advances to customers have been assigned to bankruptcy remote limited liability partnerships to provide security for issues of covered bonds by the Group. The Group retains all of the risks and rewards associated with these loans and the partnerships are consolidated fully with the loans retained on the Group’s balance sheet, and the related covered bonds in issue included within debt securities in issue.
The Group’s principal securitisation and covered bond programmes, together with the balances of the advances subject to these arrangements and the carrying value of the notes in issue at 31 December, are listed below. The notes in issue are reported in note 25.
| | | | | | | | | | | | | | | | | |
| 2020 | | 2019 |
| Loans and
advances
securitised | Notes in
issue | | Loans and
advances
securitised | Notes in
issue |
| £m | £m | | £m | £m |
| Securitisation programmes | | | | | |
| UK residential mortgages | 23,984 | | 21,640 | | | 25,815 | | 23,505 | |
| Commercial loans | 2,884 | | 4,004 | | | 5,116 | | 6,038 | |
| Credit card receivables | 5,890 | | 4,340 | | | 8,164 | | 5,767 | |
| Motor vehicle finance | 1,826 | | 1,915 | | | 3,450 | | 3,462 | |
| 34,584 | | 31,899 | | | 42,545 | | 38,772 | |
| Less held by the Group | | (27,418) | | | | (31,396) | |
Total securitisation programmes (notes 24 and 25)1 | | 4,481 | | | | 7,376 | |
| | | | | |
| Covered bond programmes | | | | | |
| Residential mortgage-backed | 33,980 | | 23,477 | | | 37,579 | | 29,318 | |
| Social housing loan-backed | 980 | | 600 | | | 1,552 | | 600 | |
| 34,960 | | 24,077 | | | 39,131 | | 29,918 | |
| Less held by the Group | | (100) | | | | (100) | |
| Total covered bond programmes (note 25) | | 23,977 | | | | 29,818 | |
| | | | | |
| Total securitisation and covered bond programmes | | 28,458 | | | | 37,194 | |
1Includes £45 million (2019: £47 million) of securitisation notes held at fair value through profit or loss.
Cash deposits of £3,930 million (2019: £4,703 million) which support the debt securities issued by the structured entities, the term advances related to covered bonds and other legal obligations are held by the Group. Additionally, the Group has certain contractual arrangements to provide liquidity facilities to some of these structured entities. At 31 December 2020 these obligations had not been triggered; the maximum exposure under these facilities was £52 million (2019: £56 million).
The Group has a number of covered bond programmes, for which limited liability partnerships have been established to ring-fence asset pools and guarantee the covered bonds issued by the Group. At the reporting date the Group had over-collateralised these programmes as set out in the table above to meet the terms of the programmes, to secure the rating of the covered bonds and to provide operational flexibility. From time-to-time, the obligations of the Group to provide collateral may increase due to the formal requirements of the programmes. The Group may also voluntarily contribute collateral to support the ratings of the covered bonds.
The Group recognises the full liabilities associated with its securitisation and covered bond programmes within debt securities in issue, although the obligations of the Group in respect of its securitisation issuances are limited to the cash flows generated from the underlying assets. The Group could be required to provide additional support to a number of the securitisation programmes to support the credit ratings of the debt securities issued, in the form of increased cash reserves and the holding of subordinated notes. Further, certain programmes contain contractual obligations that require the Group to repurchase assets should they become credit impaired or as otherwise required by the transaction documents.
The Group has not provided financial or other support by voluntarily offering to repurchase assets from any of its public securitisation programmes during 2020 (2019: none).
NOTES TO THE ACCOUNTS
for the year ended 31 December 2020
27 OTHER LIABILITIES
| | | | | | | | | | | | | | | | | |
| The Group | | The Bank |
| 2020 | 2019 | | 2020 | 2019 |
| £m | £m | | £m | £m |
| Settlement balances | 36 | | 274 | | | 11 | | 9 | |
| Lease liabilities | 1,592 | | 1,755 | | | 885 | | 975 | |
| Other creditors and accruals | 3,553 | | 3,571 | | | 1,677 | | 1,808 | |
| 5,181 | | 5,600 | | | 2,573 | | 2,792 | |
The maturity of the lease liabilities was as follows:
| | | | | | | | | | | | | | | | | |
| The Group | | The Bank |
| 2020 | 2019 | | 2020 | 2019 |
| £m | £m | | £m | £m |
| Not later than 1 year | 227 | | 238 | | | 125 | | 132 | |
| Later than 1 year and not later than 2 years | 192 | | 220 | | | 102 | | 124 | |
| Later than 2 years and not later than 3 years | 157 | | 192 | | | 80 | | 106 | |
| Later than 3 years and not later than 4 years | 146 | | 156 | | | 74 | | 84 | |
| Later than 4 years and not later than 5 years | 117 | | 156 | | | 57 | | 84 | |
| Later than 5 years | 753 | | 793 | | | 447 | | 445 | |
| 1,592 | | 1,755 | | | 885 | | 975 | |
28 RETIREMENT BENEFIT OBLIGATIONS
| | | | | | | | | | | |
| 2020 | 2019 | 2018 |
| £m | £m | £m |
| Charge to the Group income statement | | | |
| Defined benefit pension schemes | 244 | | 241 | | 396 | |
| Other post-retirement benefit schemes | 3 | | 4 | | 4 | |
| Total defined benefit schemes | 247 | | 245 | | 400 | |
| Defined contribution pension schemes | 305 | | 273 | | 288 | |
| Total charge to the income statement – continuing operations (note 9) | 552 | | 518 | | 688 | |
In addition, in 2018 there was charge of £8 million within discontinued operations (see note 13).
| | | | | | | | | | | | | | | | | |
| The Group | | The Bank |
| 2020 | 2019 | | 2020 | 2019 |
| £m | £m | | £m | £m |
| Amounts recognised in the balance sheet | | | | | |
| Retirement benefit assets | 1,714 | | 681 | | | 765 | | 386 | |
| Retirement benefit obligations | (245) | | (257) | | | (106) | | (124) | |
| Total amounts recognised in the balance sheet | 1,469 | | 424 | | | 659 | | 262 | |
The total amounts recognised in the balance sheet relate to:
| | | | | | | | | | | | | | | | | |
| The Group | | The Bank |
| 2020 | 2019 | | 2020 | 2019 |
| £m | £m | | £m | £m |
| Defined benefit pension schemes | 1,578 | | 550 | | | 727 | | 347 | |
| Other post-retirement benefit schemes | (109) | | (126) | | | (68) | | (85) | |
| Total amounts recognised in the balance sheet | 1,469 | | 424 | | | 659 | | 262 | |
NOTES TO THE ACCOUNTS
for the year ended 31 December 2020
28 RETIREMENT BENEFIT OBLIGATIONS (continued)
Pension schemes
Defined benefit schemes
(i)Characteristics of and risks associated with the Group’s schemes
The Group has established a number of defined benefit pension schemes in the UK and overseas. All significant schemes are based in the UK, with the three most significant being the main sections of the Lloyds Bank Pension Scheme No. 1, the Lloyds Bank Pension Scheme No. 2 and the HBOS Final Salary Pension Scheme. At 31 December 2020, these schemes represented 94 per cent of the Group’s total gross defined benefit pension assets (2019: 94 per cent). These schemes provide retirement benefits calculated as a percentage of final pensionable salary depending upon the length of service; the minimum retirement age under the rules of the schemes at 31 December 2020 is generally 55 although certain categories of member are deemed to have a contractual right to retire at 50.
The Group operates both funded and unfunded pension arrangements; the majority, including the three most significant schemes, are funded schemes in the UK. All of these UK funded schemes are operated as separate legal entities under trust law, are in compliance with the Pensions Act 2004 and are managed by a Trustee Board (the Trustee) whose role is to ensure that their Scheme is administered in accordance with the Scheme rules and relevant legislation, and to safeguard the assets in the best interests of all members and beneficiaries. The Trustee is solely responsible for setting investment policy and for agreeing funding requirements with the employer through the funding valuation process. The Board of Trustees must be composed of representatives of the Company and plan participants in accordance with the Scheme’s regulations.
A valuation to determine the funding status of each scheme is carried out at least every three years, whereby scheme assets are measured at market value and liabilities (technical provisions) are measured using prudent assumptions. If a deficit is identified a recovery plan is agreed between the employer and the scheme Trustee and sent to the Pensions Regulator for review. The Group has not provided for these deficit contributions as the future economic benefits arising from these contributions are expected to be available to the Group. The Group’s overseas defined benefit pension schemes are subject to local regulatory arrangements.
Terms have now been agreed in principle with the Trustee in respect of the most recent triennial funding valuations of the Group's three main defined benefit pension schemes. The valuations showed an aggregate ongoing funding deficit of approximately £7.3 billion as at 31 December 2019 (a funding level of 85.7 per cent) compared to a £7.3 billion deficit at 31 December 2016 (a funding level of 85.9 per cent).The revised deficit now includes an allowance for the impact of RPI reform announced by the Chancellor of the Exchequer in November 2020. Under the old recovery plan deficit contributions of approximately £0.8 billion were paid in 2020 and £1.3 billion was committed from 2021 to 2024. Under the new recovery plan, £0.8 billion plus a further 30 per cent of Lloyds Banking Group plc's in-year capital distributions to ordinary shareholders, up to a limit on total deficit contributions of £2.0 billion, per annum, is payable from 2021 until this deficit has been removed. The deficit contributions are in addition to the regular contributions to meet benefits accruing over the year, and to cover the expenses of running the schemes. The Group expects to pay contributions of at least £1.1 billion to its defined benefit schemes in 2021.
During 2009, the Group made one-off contributions to the Lloyds Bank Pension Scheme No. 1 and Lloyds Bank Pension Scheme No. 2 in the form of interests in limited liability partnerships for each of the two schemes which hold assets to provide security for the Group’s obligations to the two schemes. At 31 December 2020, the limited liability partnerships held assets of approximately £6.7 billion. The limited liability partnerships are consolidated fully in the Group’s balance sheet.
The Group has also established three private limited companies which hold assets to provide security for the Group’s obligations to the HBOS Final Salary Pension Scheme, a section of the Lloyds Bank Pension Scheme No. 1 and the Lloyds Bank Offshore Pension Scheme. At 31 December 2020 these held assets of approximately £4.7 billion in aggregate. The private limited companies are consolidated fully in the Group’s balance sheet. The terms of these arrangements require the Group to maintain assets in these vehicles to agreed minimum values in order to secure obligations owed to the relevant Group pension schemes. The Group has satisfied this requirement during 2020.
The last funding valuations of other Group schemes were carried out on a number of different dates. In order to report the position under IAS 19 as at 31 December 2020 the most recent valuation results for all schemes have been updated by qualified independent actuaries. The funding valuations use a more prudent approach to setting the discount rate and more conservative longevity assumptions than the IAS 19 valuations.
In July 2018 a decision was sought from the High Court in respect of the requirement to equalise the Guaranteed Minimum Pension (GMP) benefits accrued between 1990 and 1997 from contracting out of the State Earnings Related Pension Scheme. In its judgment handed down on 26 October 2018 the High Court confirmed the requirement to treat men and women equally with respect to these benefits and a range of methods that the Trustee is entitled to adopt to achieve equalisation. The Group recognised a past service cost of £108 million in respect of equalisation in 2018 and, following agreement of the detailed implementation approach with the Trustee, a further £33 million was recognised in 2019. A further hearing was held during 2020 which confirmed the extent of the Trustee's obligation to revisit past transfers out of the Schemes. The amount of any additional liability as a result of this judgment is still being reviewed but is not considered likely to be material.
(ii)Amounts in the financial statements
| | | | | | | | | | | | | | | | | |
| The Group | | The Bank |
| 2020 | 2019 | | 2020 | 2019 |
| £m | £m | | £m | £m |
| Amount included in the balance sheet | | | | | |
| Present value of funded obligations | (49,549) | | (45,241) | | | (30,597) | | (28,072) | |
| Fair value of scheme assets | 51,127 | | 45,791 | | | 31,324 | | 28,419 | |
| Net amount recognised in the balance sheet | 1,578 | | 550 | | | 727 | | 347 | |
NOTES TO THE ACCOUNTS
for the year ended 31 December 2020
28 RETIREMENT BENEFIT OBLIGATIONS (continued)
| | | | | | | | | | | | | | | | | |
| The Group | | The Bank |
| 2020 | 2019 | | 2020 | 2019 |
| £m | £m | | £m | £m |
| Net amount recognised in the balance sheet | | | | | |
| At 1 January | 550 | | 1,146 | | | 347 | | 667 | |
| Net defined benefit pension charge | (244) | | (241) | | | (119) | | (129) | |
| Actuarial losses on defined benefit obligation | (5,443) | | (4,958) | | | (3,365) | | (3,473) | |
| Return on plan assets | 5,565 | | 3,531 | | | 3,217 | | 2,700 | |
| Employer contributions | 1,149 | | 1,062 | | | 647 | | 558 | |
| Exchange and other adjustments | 1 | | 10 | | | 0 | | 24 | |
| At 31 December | 1,578 | | 550 | | | 727 | | 347 | |
| | | | | | | | | | | | | | | | | |
| The Group | | The Bank |
| 2020 | 2019 | | 2020 | 2019 |
| £m | £m | | £m | £m |
| Movements in the defined benefit obligation | | | | | |
| At 1 January | (45,241) | | (41,092) | | | (28,072) | | (25,198) | |
| Current service cost | (206) | | (201) | | | (97) | | (98) | |
| Interest expense | (914) | | (1,172) | | | (568) | | (737) | |
| Remeasurements: | | | | | |
| Actuarial gains (losses) – experience | 493 | | (29) | | | 441 | | 35 | |
| Actuarial (losses) gains – demographic assumptions | (218) | | 471 | | | (282) | | 304 | |
| Actuarial losses – financial assumptions | (5,718) | | (5,400) | | | (3,524) | | (3,812) | |
| Benefits paid | 2,254 | | 2,174 | | | 1,504 | | 1,436 | |
| Past service cost | (5) | | (44) | | | (2) | | (33) | |
| Settlements | 20 | | 17 | | | 0 | | 0 | |
| Exchange and other adjustments | (14) | | 35 | | | 3 | | 31 | |
| At 31 December | (49,549) | | (45,241) | | | (30,597) | | (28,072) | |
| | | | | | | | | | | | | | | | | |
| The Group | | The Bank |
| 2020 | 2019 | | 2020 | 2019 |
| £m | £m | | £m | £m |
| Analysis of the defined benefit obligation: | | | | | |
| Active members | (6,550) | | (6,413) | | | (3,415) | | (3,433) | |
| Deferred members | (17,647) | | (16,058) | | | (10,493) | | (9,679) | |
| Pensioners | (23,409) | | (21,032) | | | (15,311) | | (13,714) | |
| Dependants | (1,943) | | (1,738) | | | (1,378) | | (1,246) | |
| At 31 December | (49,549) | | (45,241) | | | (30,597) | | (28,072) | |
| | | | | | | | | | | | | | | | | |
| The Group | | The Bank |
| 2020 | 2019 | | 2020 | 2019 |
| £m | £m | | £m | £m |
| Changes in the fair value of scheme assets | | | | | |
| At 1 January | 45,791 | | 42,238 | | | 28,419 | | 25,865 | |
| Return on plan assets excluding amounts included in interest income | 5,565 | | 3,531 | | | 3,217 | | 2,700 | |
| Interest income | 937 | | 1,220 | | | 581 | | 765 | |
| Employer contributions | 1,149 | | 1,062 | | | 647 | | 558 | |
| Benefits paid | (2,254) | | (2,174) | | | (1,504) | | (1,436) | |
| Settlements | (22) | | (18) | | | 0 | | 0 | |
| Administrative costs paid | (54) | | (43) | | | (33) | | (26) | |
| Exchange and other adjustments | 15 | | (25) | | | (3) | | (7) | |
| At 31 December | 51,127 | | 45,791 | | | 31,324 | | 28,419 | |
NOTES TO THE ACCOUNTS
for the year ended 31 December 2020
28 RETIREMENT BENEFIT OBLIGATIONS (continued)
The expense recognised in the income statement for the year ended 31 December comprises:
| | | | | | | | | | | |
| The Group |
| 2020 | 2019 | 2018 |
| £m | £m | £m |
| Current service cost | 206 | | 201 | | 257 | |
| Net interest amount | (23) | | (48) | | (22) | |
| Past service credits and curtailments | 0 | | 0 | | 12 | |
| Settlements | 2 | | 1 | | 1 | |
| Past service cost – plan amendments | 5 | | 44 | | 108 | |
| Plan administration costs incurred during the year | 54 | | 43 | | 40 | |
| Total defined benefit pension expense | 244 | | 241 | | 396 | |
(iii)Composition of scheme assets
| | | | | | | | | | | | | | | | | | | | | | | | | | | | | | | | | | | |
| 2020 | | 2019 |
| Quoted | | Unquoted | | Total | | Quoted | | Unquoted | | Total |
| The Group | £m | | £m | | £m | | £m | | £m | | £m |
| Equity instruments | 616 | | | 45 | | | 661 | | | 555 | | | 39 | | | 594 | |
Debt instruments1: | | | | | | | | | | | |
| Fixed interest government bonds | 11,328 | | | 0 | | | 11,328 | | | 8,893 | | | 0 | | | 8,893 | |
| Index-linked government bonds | 21,058 | | | 0 | | | 21,058 | | | 18,207 | | | 0 | | | 18,207 | |
| Corporate and other debt securities | 12,736 | | | 0 | | | 12,736 | | | 10,588 | | | 0 | | | 10,588 | |
| | | | | | | | | | | |
| 45,122 | | | 0 | | | 45,122 | | | 37,688 | | | 0 | | | 37,688 | |
| Property | 0 | | | 136 | | | 136 | | | 0 | | | 158 | | | 158 | |
| Pooled investment vehicles | 650 | | | 13,022 | | | 13,672 | | | 4,773 | | | 10,585 | | | 15,358 | |
| Money market instruments, cash, derivatives, and other assets and liabilities | 812 | | | (9,276) | | | (8,464) | | | 204 | | | (8,211) | | | (8,007) | |
| At 31 December | 47,200 | |
| 3,927 | |
| 51,127 | |
| 43,220 | |
| 2,571 | |
| 45,791 | |
1Of the total debt instruments, £39,439 million (2019: £33,134 million) were investment grade (credit ratings equal to or better than ‘BBB’).
| | | | | | | | | | | | | | | | | | | | | | | | | | | | | | | | | | | |
| 2020 | | 2019 |
| Quoted | | Unquoted | | Total | | Quoted | | Unquoted | | Total |
| The Bank | £m | | £m | | £m | | £m | | £m | | £m |
| Equity instruments | 423 | | | 34 | | | 457 | | | 385 | | | 26 | | | 411 | |
Debt instruments1: | | | | | | | | | | | |
| Fixed interest government bonds | 4,591 | | | 0 | | | 4,591 | | | 3,198 | | | 0 | | | 3,198 | |
| Index-linked government bonds | 12,638 | | | 0 | | | 12,638 | | | 11,254 | | | 0 | | | 11,254 | |
| Corporate and other debt securities | 7,878 | | | 0 | | | 7,878 | | | 6,791 | | | 0 | | | 6,791 | |
| 25,107 | | | 0 | | | 25,107 | | | 21,243 | | | 0 | | | 21,243 | |
| Pooled investment vehicles | 124 | | | 8,569 | | | 8,693 | | | 2,527 | | | 7,203 | | | 9,730 | |
| Money market instruments, derivatives, cash and other assets and liabilities | 365 | | | (3,298) | | | (2,933) | | | (145) | | | (2,820) | | | (2,965) | |
| At 31 December | 26,019 | |
| 5,305 | |
| 31,324 | |
| 24,010 | |
| 4,409 | |
| 28,419 | |
1Of the total debt instruments, £21,938 million (2019: £18,724 million) were investment grade (credit ratings equal to or better than ‘BBB’).
The assets of all the funded plans are held independently of the Group’s assets in separate trustee administered funds.
NOTES TO THE ACCOUNTS
for the year ended 31 December 2020
28 RETIREMENT BENEFIT OBLIGATIONS (continued)
The pension schemes’ pooled investment vehicles comprise:
| | | | | | | | | | | | | | | | | |
| The Group | | The Bank |
| 2020 | 2019 | | 2020 | 2019 |
| £m | £m | | £m | £m |
| Equity funds | 3,169 | | 2,429 | | | 2,044 | | 1,706 | |
| Hedge and mutual funds | 2,181 | | 2,886 | | | 1,427 | | 1,818 | |
| Alternative credit funds | 4,072 | | 4,716 | | | 2,620 | | 3,061 | |
| Property funds | 1,551 | | 1,536 | | | 1,100 | | 1,127 | |
| Infrastructure funds | 1,405 | | 1,648 | | | 620 | | 827 | |
| Liquidity funds | 847 | | 1,126 | | | 598 | | 980 | |
| Bond and debt funds | 396 | | 971 | | | 284 | | 211 | |
| Other | 51 | | 46 | | | 0 | | 0 | |
| At 31 December | 13,672 | | 15,358 | | | 8,693 | | 9,730 | |
The Trustee’s approach to investment is focused on acting in the members’ best financial interests, with the integration of ESG (Environmental, Social and Governance) considerations into investment management processes and practices. This policy is reviewed annually (or more frequently as required) and has been shared with the schemes’ investment managers for implementation.
(iv)Assumptions
The principal actuarial and financial assumptions used in valuations of the defined benefit pension schemes were as follows:
| | | | | | | | |
| 2020 | 2019 |
| % | % |
| Discount rate | 1.44 | | 2.05 | |
| Rate of inflation: | | |
| Retail Price Index (RPI) | 2.80 | | 2.94 | |
| Consumer Price Index (CPI) | 2.41 | | 1.99 | |
| Rate of salary increases | 0.00 | | 0.00 | |
| Weighted-average rate of increase for pensions in payment | 2.61 | | 2.57 | |
On 25 November 2020 the Chancellor of the Exchequer announced the outcome of a consultation into a reform of the calculation of RPI. It is now expected that from 2030 RPI will be aligned with CPIH (the Consumer Price Index including owner-occupiers' housing costs). To determine the RPI assumption a term-dependent inflation curve has been used adjusting for an assumed inflation risk premium. In the period to 2030 a gap of 100 basis points has been assumed between RPI and CPI; thereafter no gap has been assumed.
| | | | | | | | |
| 2020 | 2019 |
| Years | Years |
| Life expectancy for member aged 60, on the valuation date: | | |
| Men | 27.0 | 27.5 |
| Women | 29.0 | 29.2 |
| Life expectancy for member aged 60, 15 years after the valuation date: | | |
| Men | 28.1 | 28.5 |
| Women | 30.2 | 30.3 |
The mortality assumptions used in the UK scheme valuations are based on standard tables published by the Institute and Faculty of Actuaries which were adjusted in line with the actual experience of the relevant schemes. The table shows that a member retiring at age 60 at 31 December 2020 is assumed to live for, on average, 27.0 years for a male and 29.0 years for a female. In practice there will be much variation between individual members but these assumptions are expected to be appropriate across all members. It is assumed that younger members will live longer in retirement than those retiring now. This reflects the expectation that mortality rates will continue to fall over time as medical science and standards of living improve. To illustrate the degree of improvement assumed the table also shows the life expectancy for members aged 45 now, when they retire in 15 years’ time at age 60. The Group has considered the impact of COVID-19 and whilst a higher number of deaths have been experienced in 2020, this does not have a material impact on the defined benefit obligation.
NOTES TO THE ACCOUNTS
for the year ended 31 December 2020
28 RETIREMENT BENEFIT OBLIGATIONS (continued)
(v)Amount, timing and uncertainty of future cash flows
Risk exposure of the defined benefit schemes
Whilst the Group is not exposed to any unusual, entity specific or scheme specific risks in its defined benefit pension schemes, it is exposed to a number of significant risks, detailed below:
Inflation rate risk: the majority of the plans’ benefit obligations are linked to inflation both in deferment and once in payment. Higher inflation will lead to higher liabilities although this will be materially offset by holdings of inflation-linked gilts and, in most cases, caps on the level of inflationary increases are in place to protect against extreme inflation.
Interest rate risk: The defined benefit obligation is determined using a discount rate derived from yields on AA-rated corporate bonds. A decrease in corporate bond yields will increase plan liabilities although this will be materially offset by an increase in the value of bond holdings and through the use of derivatives.
Longevity risk: The majority of the schemes obligations are to provide benefits for the life of the members so increases in life expectancy will result in an increase in the plans’ liabilities.
Investment risk: Scheme assets are invested in a diversified portfolio of debt securities, equities and other return-seeking assets. If the assets underperform the discount rate used to calculate the defined benefit obligation, it will reduce the surplus or increase the deficit. Volatility in asset values and the discount rate will lead to volatility in the net pension asset on the Group’s balance sheet and in other comprehensive income. To a lesser extent this will also lead to volatility in the pension expense in the Group’s income statement.
The ultimate cost of the defined benefit obligations to the Group will depend upon actual future events rather than the assumptions made. The assumptions made are unlikely to be borne out in practice and as such the cost may be higher or lower than expected.
Sensitivity analysis
The effect of reasonably possible changes in key assumptions on the value of scheme liabilities and the resulting pension charge in the Group’s income statement and on the net defined benefit pension scheme asset, for the Group’s three most significant schemes, is set out below. The sensitivities provided assume that all other assumptions and the value of the schemes’ assets remain unchanged, and are not intended to represent changes that are at the extremes of possibility. The calculations are approximate in nature and full detailed calculations could lead to a different result. It is unlikely that isolated changes to individual assumptions will be experienced in practice. Due to the correlation of assumptions, aggregating the effects of these isolated changes may not be a reasonable estimate of the actual effect of simultaneous changes in multiple assumptions.
| | | | | | | | | | | | | | | | | | | | | | | | | | | | | | | | | | | |
| The Group | | The Bank |
| Effect of reasonably possible alternative assumptions | | Effect of reasonably possible alternative assumptions |
| Increase (decrease) in the
income statement charge | | (Increase) decrease in the
net defined benefit
pension scheme surplus | | Increase (decrease) in the
income statement charge | | (Increase) decrease in the
net defined benefit
pension scheme surplus |
| 2020 | 2019 | | 2020 | 2019 | | 2020 | 2019 | | 2020 | 2019 |
| £m | £m | | £m | £m | | £m | £m | | £m | £m |
Inflation (including pension increases)1: | | | | | | | | | | | |
| Increase of 0.1 per cent | 11 | | 12 | | | 531 | | 467 | | | 6 | | 7 | | | 337 | | 302 | |
| Decrease of 0.1 per cent | (11) | | (12) | | | (522) | | (460) | | | (6) | | (7) | | | (332) | | (296) | |
Discount rate2: | | | | | | | | | | | |
| Increase of 0.1 per cent | (20) | | (20) | | | (866) | | (763) | | | (12) | | (11) | | | (534) | | (471) | |
| Decrease of 0.1 per cent | 19 | | 21 | | | 890 | | 784 | | | 11 | | 12 | | | 548 | | 484 | |
| Expected life expectancy of members: | | | | | | | | | | |
| Increase of one year | 39 | | 40 | | | 2,146 | | 1,636 | | | 23 | | 24 | | | 1,370 | | 1,038 | |
| Decrease of one year | (37) | | (39) | | | (2,052) | | (1,575) | | | (23) | | (23) | | | (1,310) | | (1,000) | |
1At 31 December 2020, the assumed rate of RPI inflation is 2.80 per cent and CPI inflation 2.41 per cent (2019: RPI 2.94 per cent and CPI 1.99 per cent).
2At 31 December 2020, the assumed discount rate is 1.44 per cent (2019: 2.05 per cent).
Sensitivity analysis method and assumptions
The sensitivity analysis above reflects the impact on the liabilities of the Group’s three most significant schemes which account for over 90 per cent of the Group’s defined benefit obligations. Whilst differences in the underlying liability profiles for the remainder of the Group’s pension arrangements mean they may exhibit slightly different sensitivities to variations in these assumptions, the sensitivities provided above are indicative of the impact across the Group as a whole.
The inflation assumption sensitivity applies to both the assumed rate of increase in the Consumer Price Index (CPI) and the Retail Price Index (RPI), and includes the impact on the rate of increases to pensions, both before and after retirement. These pension increases are linked to inflation (either CPI or RPI) subject to certain minimum and maximum limits.
The sensitivity analysis (including the inflation sensitivity) does not include the impact of any change in the rate of salary increases as pensionable salaries have been frozen since 2 April 2014.
The life expectancy assumption has been applied by allowing for an increase/decrease in life expectation from age 60 of one year, based upon the approximate weighted average age for each scheme. Whilst this is an approximate approach and will not give the same result as a one year increase in life expectancy at every age, it provides an appropriate indication of the potential impact on the schemes from changes in life expectancy.
There was no change in the methods and assumptions used in preparing the sensitivity analysis from the prior year.
NOTES TO THE ACCOUNTS
for the year ended 31 December 2020
28 RETIREMENT BENEFIT OBLIGATIONS (continued)
Asset-liability matching strategies
The main schemes’ assets are invested in a diversified portfolio, consisting primarily of debt securities. The investment strategy is not static and will evolve to reflect the structure of liabilities within the schemes. Specific asset-liability matching strategies for each pension plan are independently determined by the responsible governance body for each scheme and in consultation with the employer.
A significant goal of the asset-liability matching strategies adopted by Group schemes is to reduce volatility caused by changes in market expectations of interest rates and inflation. In the main schemes, this is achieved by investing scheme assets in bonds, primarily fixed interest gilts and index linked gilts, and by entering into interest rate and inflation swap arrangements. These investments are structured to take into account the profile of scheme liabilities and actively managed to reflect both changing market conditions and changes to the liability profile.
On 28 January 2020, the main schemes entered into a £10 billion longevity insurance arrangement to hedge around 20 per cent of the schemes’ exposure to unexpected increases in life expectancy. This arrangement forms part of the schemes’ investment portfolio and will provide income to the schemes in the event that pensions are paid out for longer than expected. The transaction is structured as a pass-through with Scottish Widows as the insurer, and onwards reinsurance to Pacific Life Re Limited. The valuation of the swap was NaN at inception and whilst there has been a slightly higher than expected number of deaths in the population covered by the arrangement, this has not had a material impact on the value of the swap.
At 31 December 2020 the asset-liability matching strategy mitigated around 105 per cent of the liability sensitivity to interest rate movements and around 100 per cent of the liability sensitivity to inflation movements. In addition a small amount of interest rate sensitivity arises through holdings of corporate and other debt securities.
Maturity profile of defined benefit obligation
The following table provides information on the weighted average duration of the defined benefit pension obligation and the distribution and timing of benefit payments:
| | | | | | | | | | | | | | | | | |
| The Group | | The Bank |
| 2020 | 2019 | | 2020 | 2019 |
| Years | Years | | Years | Years |
| Duration of the defined benefit obligation | 19 | 18 | | 17 | 16 |
| | | | | | | | | | | | | | | | | |
| The Group | | The Bank |
| 2020 | 2019 | | 2020 | 2019 |
| £m | £m | | £m | £m |
| Maturity analysis of benefits expected to be paid: | | | | | |
| Within 12 months | 1,293 | | 1,274 | | | 914 | | 892 | |
| Between 1 and 2 years | 1,350 | | 1,373 | | | 940 | | 963 | |
| Between 2 and 5 years | 4,347 | | 4,455 | | | 2,989 | | 3,086 | |
| Between 5 and 10 years | 8,301 | | 8,426 | | | 5,547 | | 5,673 | |
| Between 10 and 15 years | 9,093 | | 9,229 | | | 5,796 | | 5,962 | |
| Between 15 and 25 years | 17,485 | | 17,400 | | | 10,590 | | 10,603 | |
| Between 25 and 35 years | 13,479 | | 13,999 | | | 7,709 | | 8,044 | |
| Between 35 and 45 years | 7,162 | | 8,291 | | | 3,645 | | 4,266 | |
| In more than 45 years | 2,287 | | 3,160 | | | 874 | | 1,208 | |
Maturity analysis method and assumptions
The projected benefit payments are based on the assumptions underlying the assessment of the obligations, including allowance for expected future inflation. They are shown in their undiscounted form and therefore appear large relative to the discounted assessment of the defined benefit obligations recognised in the Group’s balance sheet. They are in respect of benefits that have been accrued prior to the respective year-end date only and make no allowance for any benefits that may have been accrued subsequently.
Defined contribution schemes
The Group operates a number of defined contribution pension schemes in the UK and overseas, principally Your Tomorrow and the defined contribution sections of the Lloyds Bank Pension Scheme No. 1.
During the year ended 31 December 2020 the charge to the continuing operations income statement in respect of defined contribution schemes was £305 million (2019: £273 million; 2018: £288 million), representing the contributions payable by the employer in accordance with each scheme’s rules. In addition, in 2018 £3 million was charged within discontinued operations (see note 13).
NOTES TO THE ACCOUNTS
for the year ended 31 December 2020
28 RETIREMENT BENEFIT OBLIGATIONS (continued)
Other post-retirement benefit schemes
The Group operates a number of schemes which provide post-retirement healthcare benefits to certain employees, retired employees and their dependants. The principal scheme relates to former Lloyds Bank staff and under this scheme the Group has undertaken to meet the cost of post-retirement healthcare for all eligible former employees (and their dependants) who retired prior to 1 January 1996. The Group has entered into an insurance contract to provide these benefits and a provision has been made for the estimated cost of future insurance premiums payable.
For the principal post-retirement healthcare scheme, the latest actuarial valuation of the liability was carried out at 31 December 2020 by qualified independent actuaries. The principal assumptions used were as set out above, except that the rate of increase in healthcare premiums has been assumed at 6.40 per cent (2019: 6.54 per cent).
Movements in the other post-retirement benefits obligation:
| | | | | | | | | | | | | | | | | |
| The Group | | The Bank |
| 2020 | 2019 | | 2020 | 2019 |
| £m | £m | | £m | £m |
| At 1 January | (126) | | (124) | | | (85) | | (84) | |
| Actuarial gains (losses) | 16 | | (6) | | | 15 | | (3) | |
| Insurance premiums paid | 4 | | 7 | | | 3 | | 5 | |
| Charge for the year | (3) | | (4) | | | (2) | | (2) | |
| Exchange and other adjustments | 0 | | 1 | | | 1 | | (1) | |
| At 31 December | (109) | | (126) | |
| (68) | | (85) | |
29 DEFERRED TAX
The Group’s and the Bank’s deferred tax assets and liabilities are as follows:
| | | | | | | | | | | | | | | | | |
| The Group | | The Bank |
| 2020 | 2019 | | 2020 | 2019 |
| £m | £m | | £m | £m |
| Statutory position | | | | | |
| Deferred tax assets | 3,468 | | 3,366 | | | 2,109 | | 2,029 | |
| Deferred tax liabilities | 0 | | 0 | | | 0 | | 0 | |
| Net deferred tax asset | 3,468 | | 3,366 | | | 2,109 | | 2,029 | |
| | | | | |
| Tax disclosure | | | | | |
| Deferred tax assets | 5,327 | | 4,731 | | | 3,042 | | 2,734 | |
| Deferred tax liabilities | (1,859) | | (1,365) | | | (933) | | (705) | |
| Net deferred tax asset | 3,468 | | 3,366 | | | 2,109 | | 2,029 | |
The statutory position reflects the deferred tax assets and liabilities as disclosed in the consolidated balance sheet and takes into account the ability of the Group and the Bank to net assets and liabilities where there is a legally enforceable right of offset. The tax disclosure of deferred tax assets and liabilities ties to the amounts outlined in the tables below which splits the deferred tax assets and liabilities by type, before such netting.
As a result of legislation enacted in 2016, the UK corporation tax rate had been expected to reduce from 19 per cent to 17 per cent on 1 April 2020. The Group measures its deferred tax assets and liabilities at the value expected to be recoverable or payable in future periods, and so at 31 December 2019 substantially all of its deferred tax was measured using the 17 per cent tax rate. During the December 2019 election campaign, however, the UK government stated its intention to maintain the corporation tax rate at 19 per cent, and this tax rate was substantively enacted on 17 March 2020. The Group therefore remeasured its deferred tax assets and liabilities at 19 per cent. The deferred tax impact of this remeasurement in 2020 is a credit of £435 million in the income statement and a charge of £50 million in other comprehensive income.
On 3 March 2021, the UK Government announced its intention to increase the rate of corporation tax from 19 per cent to 25 per cent with effect from 1 April 2023. Had this change in corporation tax been enacted on 31 December 2020, the impact would have been to increase net deferred tax assets by approximately £900 million. The UK Government also announced that in 2021 it will undertake a review of the surcharge on banking companies, its intention being to ensure that the combined rate of corporation tax and banking surcharge on bank profits does not increase substantially from its current level. The results of this review are expected to be announced later in 2021.
On 29 October 2018, the UK government announced its intention to restrict the use of capital tax losses to 50 per cent of any future gains arising. This restriction was substantively enacted on 2 July 2020 and as a result additional deferred tax liabilities of £16 million for the Group and £3 million for the Bank were recognised, with an impact of £NaN in the income statement and £16 million in other comprehensive income for the Group and £7 million in the income statement and a credit of £4 million in other comprehensive income for the Bank, in respect of unrealised gains at that date.
NOTES TO THE ACCOUNTS
for the year ended 31 December 2020
29 DEFERRED TAX (continued)
Movements in deferred tax liabilities and assets (before taking into consideration the offsetting of balances within the same taxing jurisdiction) can be summarised as follows:
| | | | | | | | | | | | | | | | | | | | | | | | | | | | | |
| The Group | Tax losses | Property,
plant and
equipment | Pension
liabilities | Provisions | Share-based
payments | Derivatives | Asset
revaluations1 | Other
temporary
differences | Total |
| Deferred tax assets | £m | £m | £m | £m | £m | £m | £m | £m | £m |
| At 1 January 2019 | 3,783 | | 682 | | 79 | | 196 | | 28 | | 0 | | 0 | | 6 | | 4,774 | |
| (Charge) credit to the income statement | (183) | | (12) | | (100) | | (87) | | 4 | | 19 | | 0 | | 126 | | (233) | |
| Credit to other comprehensive income | 0 | | 0 | | 74 | | 116 | | 0 | | 0 | | 0 | | 0 | | 190 | |
| At 31 December 2019 | 3,600 | | 670 | | 53 | | 225 | | 32 | | 19 | | 0 | | 132 | | 4,731 | |
| (Charge) credit to the income statement | 454 | | 8 | | 6 | | 4 | | (5) | | (12) | | 28 | | 94 | | 577 | |
| (Charge) credit to other comprehensive income | 0 | | 0 | | (3) | | 22 | | 0 | | 0 | | 0 | | 0 | | 19 | |
| At 31 December 2020 | 4,054 | | 678 | | 56 | | 251 | | 27 | | 7 | | 28 | | 226 | | 5,327 | |
| | Capitalised
software
enhancements | Acquisition
fair value | Pension
assets | Derivatives | Asset
revaluations1 | Other
temporary
differences | Total |
| Deferred tax liabilities | | | £m | £m | £m | £m | £m | £m | £m |
| At 1 January 2019 | | | (36) | | (698) | | (273) | | (388) | | (101) | | (56) | | (1,552) | |
| (Charge) credit to the income statement | 15 | | 215 | | 59 | | (34) | | (21) | | (53) | | 181 | |
| (Charge) credit to other comprehensive income | 0 | | 0 | | 64 | | (140) | | 84 | | 0 | | 8 | |
| Exchange and other adjustments | | | 0 | | 0 | | 0 | | 0 | | 0 | | (2) | | (2) | |
| At 31 December 2019 | | | (21) | | (483) | | (150) | | (562) | | (38) | | (111) | | (1,365) | |
| (Charge) credit to the income statement | (207) | | 147 | | (77) | | (106) | | (22) | | (94) | | (359) | |
| (Charge) credit to other comprehensive income | 0 | | 0 | | (165) | | (31) | | 60 | | 0 | | (136) | |
| Exchange and other adjustments | | | 0 | | 0 | | 0 | | 0 | | 0 | | 1 | | 1 | |
| At 31 December 2020 | | | (228) | | (336) | | (392) | | (699) | | 0 | | (204) | | (1,859) | |
1Financial assets at fair value through other comprehensive income.
| | | | | | | | | | | | | | | | | | | | | | | |
| The Bank | Tax losses | Property,
plant and
equipment | Pension
liabilities | Provisions | Share-based
payments | Other
temporary
differences | Total |
| Deferred tax assets | £m | £m | £m | £m | £m | £m | £m |
| At 1 January 2019 | 2,284 | | 375 | | 30 | | 53 | | 20 | | 1 | | 2,763 | |
| (Charge) credit to the income statement | (86) | | (32) | | (57) | | (41) | | (1) | | 12 | | (205) | |
| Credit to other comprehensive income | 0 | | 0 | | 60 | | 116 | | 0 | | 0 | 176 | |
| At 31 December 2019 | 2,198 | | 343 | | 33 | | 128 | | 19 | | 13 | | 2,734 | |
| (Charge) credit to the income statement | 309 | | (38) | | 1 | | 10 | | (1) | | 9 | | 290 | |
| (Charge) credit to other comprehensive income | 0 | | 0 | | (4) | | 22 | | 0 | | 0 | | 18 | |
| At 31 December 2020 | 2,507 | | 305 | | 30 | | 160 | | 18 | | 22 | | 3,042 | |
| Capitalised
software
enhancements | Pension
assets | Derivatives | Asset
revaluations1 | Other
temporary
differences | Total |
| Deferred tax liabilities | | £m | £m | £m | £m | £m | £m |
| At 1 January 2019 | | (31) | | (176) | | (431) | | (103) | | (38) | | (779) | |
| (Charge) credit to the income statement | | 12 | | 59 | | 0 | (19) | | 17 | | 69 | |
| (Charge) credit to other comprehensive income | | 0 | | 20 | | (105) | | 86 | | (1) | | 0 | |
| Exchange and other adjustments | | 0 | | 0 | | 0 | | 0 | | 5 | | 5 | |
| At 31 December 2019 | | (19) | | (97) | | (536) | | (36) | | (17) | | (705) | |
| (Charge) credit to the income statement | | (193) | | (5) | | 1 | | (9) | | 12 | | (194) | |
| (Charge) credit to other comprehensive income | | 0 | | (105) | | 30 | | 40 | | 0 | | (35) | |
| Exchange and other adjustments | | 0 | | 0 | | 0 | | 0 | | 1 | | 1 | |
| At 31 December 2020 | | (212) | | (207) | | (505) | | (5) | | (4) | | (933) | |
1Financial assets at fair value through other comprehensive income.
NOTES TO THE ACCOUNTS
for the year ended 31 December 2020
29 DEFERRED TAX (continued)
Deferred tax not recognised
Deferred tax assets of approximately £104 million (2019: £111 million) for the Group and £90 million (2019: £84 million) for the Bank have not been recognised in respect of £532 million for the Group and £460 million for the Bank of UK tax losses and other temporary differences which can only be used to offset future capital gains. UK capital losses can be carried forward indefinitely.
In addition, 0 deferred tax asset is recognised in respect of unrelieved foreign tax credits of £46 million (2019: £46 million) for the Group and £7 million (2019: £7 million) for the Bank, as there are no expected future taxable profits against which the credits can be utilised. These credits can be carried forward indefinitely.
No deferred tax has been recognised in respect of foreign trade losses where it is not more likely than not that we will be able to utilise them in future periods. Of the asset not recognised, £34 million for the Group and £NaN for the Bank (2019: £35 million for the Group and £NaN for the Bank) relates to losses that will expire if not used within 20 years, and £43 million for the Group and £4 million for the Bank (2019: £45 million for the Group and £5 million for the Bank) relates to losses with no expiry date.
As a result of parent company exemptions on dividends from subsidiaries and on capital gains on disposal there are no significant taxable temporary differences associated with investments in subsidiaries, branches, associates and joint arrangements.
30 OTHER PROVISIONS
| | | | | | | | | | | | | | | | | |
| The Group | Provisions
for financial
commitments
and guarantees | Payment
protection
insurance | Other
regulatory
provisions | Other | Total |
| £m | £m | £m | £m | £m |
| At 1 January 2020 | 173 | | 1,874 | | 395 | | 696 | | 3,138 | |
| Exchange and other adjustments | 0 | | 0 | | 2 | | 0 | | 2 | |
| Provisions applied | 0 | | (1,700) | | (465) | | (190) | | (2,355) | |
| Charge for the year | 253 | | 85 | | 329 | | 270 | | 937 | |
| At 31 December 2020 | 426 | | 259 | | 261 | | 776 | | 1,722 | |
| | | | | | | | | | | | | | | | | |
| The Bank | Provisions
for financial
commitments
and guarantees | Payment
protection
insurance | Other
regulatory
provisions | Other | Total |
| £m | £m | £m | £m | £m |
| At 1 January 2020 | 90 | | 622 | | 161 | | 563 | | 1,436 | |
| Exchange and other adjustments | 0 | | 0 | | 4 | | 2 | | 6 | |
| Provisions applied | 0 | | (726) | | (233) | | (148) | | (1,107) | |
| Charge for the year | 155 | | 169 | | 143 | | 166 | | 633 | |
| At 31 December 2020 | 245 | | 65 | | 75 | | 583 | | 968 | |
Provisions for financial commitments and guarantees
Provisions are recognised for expected credit losses on undrawn loan commitments and financial guarantees. See also note 16.
Payment protection insurance (excluding MBNA)
The Group has made provisions for PPI costs totalling £21,906 million; of which £85 million was recognised in the final quarter of the year ended 31 December 2020. Of the approximately six million enquiries received pre-deadline, more than 99 per cent have now been processed. The £85 million charge in the fourth quarter was driven by the impact of coronavirus delaying operational activities during 2020, the final stages of work to ensure operational completeness ahead of an orderly programme close and final validation of information requests and complaints with third parties that resulted in a limited number of additional complaints to be handled. A small part of the costs incurred during the year also reflect the costs associated with litigation activity to date.
At 31 December 2020, a provision of £198 million remained unutilised relating to complaints and associated administration costs excluding amounts relating to MBNA. Total cash payments were £1,459 million during the year ended 31 December 2020.
Payment protection insurance (MBNA)
As announced in December 2016, the Group's exposure continues to remain capped at £240 million under the terms of the MBNA sale and purchase agreement. NaN additional charge has been made by MBNA to its PPI provision in the year ended 31 December 2020; total cash payments in the year were £241 million and the remaining provision at 31 December 2020 was £61 million (31 December 2019: £302 million).
Other provisions for legal actions and regulatory matters
In the course of its business, the Group is engaged in discussions with the PRA, FCA and other UK and overseas regulators and other governmental authorities on a range of matters. The Group also receives complaints in connection with its past conduct and claims brought by or on behalf of current and former employees, customers, investors and other third parties and is subject to legal proceedings and other legal actions. Where significant, provisions are held against the costs expected to be incurred in relation to these matters and matters arising from related internal reviews. During the year ended 31 December 2020 the Group charged a further £329 million in respect of legal actions and other regulatory matters, and the unutilised balance at 31 December 2020 was £261 million (31 December 2019: £395 million). The most significant items are as follows.
NOTES TO THE ACCOUNTS
for the year ended 31 December 2020
30 OTHER PROVISIONS (continued)
HBOS Reading – review
The Group completed its compensation assessment for those within the Customer Review in 2019 with more than £109 million of compensation paid, in addition to £15 million for ex-gratia payments and £6 million for the reimbursement of legal fees. The Group is applying the recommendations from Sir Ross Cranston’s review, issued in December 2019, including a reassessment of direct and consequential losses by an independent panel, an extension of debt relief and a wider definition of de facto directors. Further details of the panel were announced on 3 April 2020 and the panel's full scope and methodology was published on 7 July 2020. The panel’s stated objective is to consider cases via a non-legalistic and fair process, and to make their decisions in a generous, fair and common-sense manner. Details of an appeal process for the further assessments of debt relief and de facto director status have also been announced. The Group continues to make progress on its assessment of claims for further debt relief and de facto director status, completing preliminary assessments for 98 per cent of claims on both debt relief and de facto directors. As part of these activities the Group has recorded charges in relation to compensation payments and associated costs (projected to the fourth quarter of 2021) in 2020 in applying the recommendations, in respect of debt relief and de facto director status. During 2021, decisions from the independent panel re-review on direct and consequential losses will start to be issued, which is likely to result in further charges but it is not possible to estimate the potential impact at this stage. The Group is committed to implementing Sir Ross' recommendations in full.
The Dame Linda Dobbs review, which is considering the Group’s handling of HBOS Reading between January 2009 and January 2017, is now expected to complete towards the end of 2021. The cost of undertaking the review is included in the revised provision.
The 2020 charge of £159 million, and lifetime cost of £435 million, includes both compensation payments and operational costs.
Arrears handling related activities
The Group has provided an additional £35 million in the year ended 31 December 2020 for arrears handling related activities, bringing the total provided to date to £1,016 million; the unutilised balance at 31 December 2020 was £62 million.
Other
Following the sale of TSB Banking Group plc, the Group raised a provision of £665 million in relation to various ongoing commitments; £111 million of this provision remained unutilised at 31 December 2020.
Provisions are made for staff and other costs related to Group restructuring initiatives at the point at which the Group becomes committed to the expenditure. At 31 December 2020 provisions of £196 million (31 December 2019: £114 million) were held.
The Group carries provisions of £112 million (2019: £118 million) for indemnities and other matters relating to legacy business disposals in prior years.
NOTES TO THE ACCOUNTS
for the year ended 31 December 2020
31 SUBORDINATED LIABILITIES
The movement in subordinated liabilities during the year was as follows:
| | | | | | | | | | | | | | | | | | | | | | | |
| Preferred
securities | | Undated
subordinated
liabilities | | Dated
subordinated
liabilities | | Total |
| The Group | £m | | £m | | £m | | £m |
| At 1 January 2019 | 3,210 | | | 529 | | | 9,006 | | | 12,745 | |
| | | | | | | |
| Issued during the year: | | | | | | | |
| 4.1378% Dated Subordinated Notes due 2026 | 0 | | | 0 | | | 492 | | | 492 | |
| 2.68229% Dated Subordinated Notes due 2038 | 0 | | | 0 | | | 70 | | | 70 | |
| 2.0367% Dated Subordinated Notes due 2028 | 0 | | | 0 | | | 218 | | | 218 | |
| 0 | | | 0 | | | 780 | | | 780 | |
Repurchases and redemptions during the year1: | | | | | | | |
| 13% Step-up Perpetual Capital Securities callable 2019 | (49) | | | 0 | | | 0 | | | (49) | |
| 10.375% Subordinated Fixed to Fixed Rate Notes 2024 callable 2019 | 0 | | | 0 | | | (135) | | | (135) | |
| 9.375% Subordinated Bonds 2021 | 0 | | | 0 | | | (328) | | | (328) | |
| 6.375% Subordinated Instruments 2019 | 0 | | | 0 | | | (250) | | | (250) | |
| (49) | | | 0 | | | (713) | | | (762) | |
| Foreign exchange movements | (83) | | | (36) | | | (276) | | | (395) | |
| Other movements (all non-cash) | 189 | | | 23 | | | 6 | | | 218 | |
| At 31 December 2019 | 3,267 | | | 516 | | | 8,803 | | | 12,586 | |
| | | | | | | |
| Issued during the year: | | | | | | | |
| 2.6787% Fixed rate bond due 2025 | 0 | | | 0 | | | 303 | | | 303 | |
| £914,633,000 2.73% Dated Subordinated Fixed Rate Reset Notes due 2035 | 0 | | | 0 | | | 471 | | | 471 | |
| £393,939,000 2.61% Dated Subordinated Fixed Rate Reset Notes due 2035 | 0 | | | 0 | | | 293 | | | 293 | |
| | | | | | | |
| 0 | | | 0 | | | 1,067 | | | 1,067 | |
Repurchases and redemptions during the year1: | | | | | | | |
| 12% Fixed to Floating Rate Perpetual Tier 1 Capital Securities callable 2024 (US$2,000 million) | (119) | | | 0 | | | 0 | | | (119) | |
| 13% Sterling Step-up Perpetual Capital Securities callable 2029 (£700 million) | (519) | | | 0 | | | 0 | | | (519) | |
| 7.281% Perpetual Regulatory Tier One Securities (Series B) (£150 million) | (123) | | | 0 | | | 0 | | | (123) | |
| 6.85% Non-cumulative Perpetual Preferred Securities (US$1,000 million) | (580) | | | 0 | | | 0 | | | (580) | |
| 7.881% Guaranteed Non-voting Non-cumulative Preferred Securities (£245 million) | (289) | | | 0 | | | 0 | | | (289) | |
| 6.5% Dated Subordinated Notes 2020 (€1,500 million) | 0 | | | 0 | | | (1,464) | | | (1,464) | |
| 4.50% Fixed Rate Step-up Subordinated Notes due 2030 (€309 million) | 0 | | | 0 | | | (276) | | | (276) | |
| 5.75% Subordinated Fixed to Floating Rate Notes 2025 callable 2020 (£350 million) | 0 | | | 0 | | | (370) | | | (370) | |
| 6.50% Subordinated Fixed Rate Notes 2020 (US$2,000 million) | 0 | | | 0 | | | (674) | | | (674) | |
| Subordinated Floating Rate Notes 2020 (€100 million) | 0 | | | 0 | | | (90) | | | (90) | |
| 9.625% Subordinated Bonds 2023 (£300 million) | 0 | | | 0 | | | (240) | | | (240) | |
| 7.375% Dated Subordinated Notes 2020 | 0 | | | 0 | | | (4) | | | (4) | |
| (1,630) | | | 0 | | | (3,118) | | | (4,748) | |
| Foreign exchange movements | (59) | | | 15 | | | 105 | | | 61 | |
| Other movements (all non-cash) | 194 | | | (26) | | | 108 | | | 276 | |
| At 31 December 2020 | 1,772 | | | 505 | | | 6,965 | | | 9,242 | |
1The repurchases and redemptions resulted in cash outflows of £4,156 million (2019: £762 million).
Certain of the above securities were issued or redeemed under exchange offers, which did not result in an extinguishment of the original financial liability for accounting purposes.
NOTES TO THE ACCOUNTS
for the year ended 31 December 2020
31 SUBORDINATED LIABILITIES (continued)
| | | | | | | | | | | | | | | | | | | | | | | |
| Preferred
securities | | Undated
subordinated
liabilities | | Dated
subordinated
liabilities | | Total |
| The Bank | £m | | £m | | £m | | £m |
| At 1 January 2019 | 2,312 | | | 437 | | | 6,779 | | | 9,528 | |
| Issued in the year: | | | | | | | |
| 4.1378% Dated Subordinated Notes due 2026 | 0 | | | 0 | | | 492 | | | 492 | |
| 2.68229% Dated Subordinated Notes due 2038 | 0 | | | 0 | | | 70 | | | 70 | |
| 2.0367% Dated Subordinated Notes due 2028 | 0 | | | 0 | | | 218 | | | 218 | |
| 0 | | | 0 | | | 780 | | | 780 | |
Repurchases and redemptions during the year1: | | | | | | | |
| 13% Step-up Perpetual Capital Securities callable 2019 | (49) | | | 0 | | | 0 | | | (49) | |
| 10.375% Subordinated Fixed to Fixed Rate Notes 2024 callable 2019 | 0 | | | 0 | | | (135) | | | (135) | |
| (49) | | | 0 | | | (135) | | | (184) | |
| Foreign exchange movements | (57) | | | (12) | | | (206) | | | (275) | |
| Other movements (all non-cash) | 28 | | | 0 | | | 32 | | | 60 | |
| At 31 December 2019 | 2,234 | |
| 425 | |
| 7,250 | |
| 9,909 | |
| Issued in the year: | | | | | | | |
| 2.6787% Fixed rate bond due 2025 | 0 | | | 0 | | | 303 | | | 303 | |
| £914,633,000 2.73% Dated Subordinated Fixed Rate Reset Notes due 2035 | 0 | | | 0 | | | 517 | | | 517 | |
| £393,939,000 2.61% Dated Subordinated Fixed Rate Reset Notes due 2035 | 0 | | | 0 | | | 394 | | | 394 | |
| 0 | | | 0 | | | 1,214 | | | 1,214 | |
Repurchases and redemptions during the year1: | | | | | | |
|
| 12% Fixed to Floating Rate Perpetual Tier 1 Capital Securities callable 2024 (US$2,000 million) | (119) | | | 0 | | | 0 | | | (119) | |
| 13% Sterling Step-up Perpetual Capital Securities callable 2029 (£700 million) | (519) | | | 0 | | | 0 | | | (519) | |
| 6.5% Dated Subordinated Notes 2020 (€1,500 million) | 0 | | | 0 | | | (1,464) | | | (1,464) | |
| 5.75% Subordinated Fixed to Floating Rate Notes 2025 callable 2020 (£350 million) | 0 | | | 0 | | | (370) | | | (370) | |
| 6.50% Subordinated Fixed Rate Notes 2020 (US$2,000 million) | 0 | | | 0 | | | (674) | | | (674) | |
| Subordinated Floating Rate Notes 2020 (€100 million) | 0 | | | 0 | | | (90) | | | (90) | |
| 9.625% Subordinated Bonds 2023 (£300 million) | 0 | | | 0 | | | (240) | | | (240) | |
| 7.375% Dated Subordinated Notes 2020 | 0 | | | 0 | | | (4) | | | (4) | |
| (638) | | | 0 | | | (2,842) | | | (3,480) | |
| Foreign exchange movements | (43) | | | (10) | | | 50 | | | (3) | |
| Other movements (all non-cash) | 19 | | | (1) | | | 93 | | | 111 | |
| At 31 December 2020 | 1,572 | |
| 414 | |
| 5,765 | |
| 7,751 | |
1The repurchases and redemptions resulted in cash outflows of £2,726 million (2019: £184 million).
Certain of the above securities were issued or redeemed under exchange offers, which did not result in an extinguishment of the original financial liability for accounting purposes.
These securities will, in the event of the winding-up of the issuer, be subordinated to the claims of depositors and all other creditors of the issuer, other than creditors whose claims rank equally with, or are junior to, the claims of the holders of the subordinated liabilities. The subordination of specific subordinated liabilities is determined in respect of the issuer and any guarantors of that liability. The claims of holders of preference shares and preferred securities are generally junior to those of the holders of undated subordinated liabilities, which in turn are junior to the claims of holders of the dated subordinated liabilities. Neither the Group nor the Bank has had any defaults of principal, interest or other breaches with respect to its subordinated liabilities during 2020 (2019: none).
NOTES TO THE ACCOUNTS
for the year ended 31 December 2020
32 SHARE CAPITAL
(1)Authorised share capital
| | | | | | | | | | | |
| The Group and Bank |
| 2020 | 2019 | 2018 |
| £m | £m | £m |
| Sterling | | | |
| 1,650 million ordinary shares of £1 each | 1,650 | | 1,650 | | 1,650 | |
| 1 cumulative floating rate Preference share of £1 | 0 | | 0 | | 0 | |
| 100 6 per cent Non-Cumulative Redeemable Preference shares of £1 each | 0 | | 0 | | 0 | |
| 175 million Preference shares of 25p each | 44 | | 44 | | 44 | |
| 1,694 | | 1,694 | | 1,694 | |
| | | |
| US dollars | US$m | US$m | US$m |
| 160 million Preference shares of 25 cents each | 40 | | 40 | | 40 | |
| | | |
| Euro | €m | €m | €m |
| 160 million Preference shares of 25 cents each | 40 | | 40 | | 40 | |
| | | |
| Japanese yen | ¥m | ¥m | ¥m |
| 50 million Preference shares of ¥25 each | 1,250 | | 1,250 | | 1,250 | |
(2)Issued and fully paid ordinary shares
| | | | | | | | | | | | | | | | | | | | |
| 2020 | 2019 | 2018 | 2020 | 2019 | 2018 |
| Number of
shares | Number of
shares | Number of
shares | £m | £m | £m |
| Sterling | | | | | | |
| Ordinary shares of £1 each | | | | | | |
| At 1 January | 1,574,285,751 | | 1,574,285,751 | | 1,574,285,751 | | 1,574 | | 1,574 | | 1,574 | |
| Issued in the year | 1 | | 0 | | 0 | | 0 | | 0 | | 0 | |
| At 31 December | 1,574,285,752 | | 1,574,285,751 | | 1,574,285,751 | | 1,574 | | 1,574 | | 1,574 | |
Share capital and control
There are no limitations on voting rights or restrictions on the transfer of shares in the Bank other than as set out in the articles of association, and certain restrictions which may from time to time be imposed by law and regulations (for example, insider trading laws).
Ordinary shares
The holders of ordinary shares are entitled to receive the Bank’s report and accounts, attend, speak and vote at general meetings and appoint proxies to exercise voting rights. Holders of ordinary shares may also receive a dividend (subject to the provisions of the Bank’s articles of association) and on a winding up may share in the assets of the Bank.
Issued and fully paid preference shares
The Bank has in issue various classes of preference shares which are all classified as liabilities under accounting standards.
33 SHARE PREMIUM ACCOUNT
| | | | | | | | | | | |
| The Group and Bank |
| 2020 | 2019 | 2018 |
| £m | £m | £m |
| At 1 January and 31 December | 600 | | 600 | | 600 | |
NOTES TO THE ACCOUNTS
for the year ended 31 December 2020
34 OTHER RESERVES
| | | | | | | | | | | | | | | | | | | | | | | |
| The Group | | The Bank |
| 2020 | 2019 | 2018 | | 2020 | 2019 | 2018 |
| £m | £m | £m | | £m | £m | £m |
| Other reserves comprise: | | | | | | | |
| Merger reserve | 6,348 | | 6,348 | | 6,348 | | | 0 | | 0 | | 0 | |
| Revaluation reserve in respect of debt securities held at fair value through other comprehensive income | (558) | | (538) | | (379) | | | 14 | | 103 | | 281 | |
| Revaluation reserve in respect of equity shares held at fair value through other comprehensive income | 0 | | 0 | | 0 | | | 0 | | 0 | | 0 | |
| Cash flow hedging reserve | 1,507 | | 1,556 | | 1,110 | | | 1,367 | | 1,607 | | 1,268 | |
| Foreign currency translation reserve | (116) | | (116) | | (114) | | | 1 | | 0 | | (6) | |
| At 31 December | 7,181 | | 7,250 | | 6,965 | | | 1,382 | | 1,710 | | 1,543 | |
The merger reserve arose on the transfer of HBOS plc from the Bank’s ultimate holding company in January 2010.
The revaluation reserve in respect of debt securities held at fair value through other comprehensive income represents the cumulative after tax unrealised change in the fair value of financial assets so classified since initial recognition; or in the case of financial assets obtained on acquisitions of businesses, since the date of acquisition.
The cash flow hedging reserve represents the cumulative after-tax gains and losses on effective cash flow hedging instruments that will be reclassified to the income statement in the periods in which the hedged item affects profit or loss.
The foreign currency translation reserve represents the cumulative after-tax gains and losses on the translation of foreign operations and exchange differences arising on financial instruments designated as hedges of the Group’s net investment in foreign operations.
Movements in other reserves were as follows:
| | | | | | | | | | | | | | | | | | | | | | | |
| The Group | | The Bank |
| 2020 | 2019 | 2018 | | 2020 | 2019 | 2018 |
| £m | £m | £m | | £m | £m | £m |
| Merger reserve | | | | | | | |
| At 1 January and 31 December | 6,348 | | 6,348 | | 6,348 | | | 0 | | 0 | | 0 | |
| | | | | | | | | | | | | | | | | | | | | | | | | | | | | | | | | | | |
| The Group | | The Bank |
| 2020 | | 2019 | | 2018 | | 2020 | | 2019 | | 2018 |
| £m | | £m | | £m | | £m | | £m | | £m |
| Revaluation reserve in respect of debt securities held at fair value through other comprehensive income | | | | | | | | | | | |
| At 1 January | (538) | | | (379) | | | (195) | | | 103 | | | 281 | | | 483 | |
| | | | | | | | | | | |
| Change in fair value | 46 | | | (34) | | | (31) | | | 12 | | | (50) | | | (58) | |
| Deferred tax | 29 | | | 11 | | | 31 | | | (8) | | | 13 | | | 34 | |
| Current tax | (2) | | | 0 | | | 0 | | | 0 | | | 0 | | | 0 | |
| 73 | | | (23) | | | 0 | | | 4 | | | (37) | | | (24) | |
| Income statement transfers in respect of disposals (note 8) | (145) | | | (196) | | | (268) | | | (138) | | | (201) | | | (258) | |
| Deferred tax | 47 | | | 61 | | | 84 | | | 44 | | | 61 | | | 80 | |
| (98) | | | (135) | | | (184) | | | (94) | | | (140) | | | (178) | |
| Impairment recognised in the income statement | 5 | | | (1) | | | 0 | | | 1 | | | (1) | | | 0 | |
| At 31 December | (558) | | | (538) | | | (379) | | | 14 | | | 103 | | | 281 | |
NOTES TO THE ACCOUNTS
for the year ended 31 December 2020
34 OTHER RESERVES (continued)
| | | | | | | | | | | | | | | | | | | | | | | | | | | | | | | | | | | |
| The Group | | The Bank |
| 2020 | | 2019 | | 2018 | | 2020 | | 2019 | | 2018 |
| £m | | £m | | £m | | £m | | £m | | £m |
| Revaluation reserve in respect of equity shares held at fair value through other comprehensive income | | | | | | | | | | | |
| At 1 January | 0 | | | 0 | | | (35) | | | 0 | | | 0 | | | (42) | |
| | | | | | | | | | | |
| Change in fair value | 0 | | | 0 | | | (98) | | | 0 | | | 0 | | | (102) | |
| Deferred tax | (16) | | | 12 | | | 22 | | | 4 | | | 12 | | | 0 | |
| Current tax | 0 | | | 0 | | | 0 | | | 0 | | | 0 | | | 0 | |
| (16) | | | 12 | | | (76) | | | 4 | | | 12 | | | (102) | |
| Realised gains and losses transferred to retained profits | 0 | | | 0 | | | 132 | | | 0 | | | 0 | | | 144 | |
| Deferred tax | 16 | | | (12) | | | (21) | | | (4) | | | (12) | | | 0 | |
| Current tax | 0 | | | 0 | | | 0 | | | 0 | | | 0 | | | 0 | |
| 16 | | | (12) | | | 111 | | | (4) | | | (12) | | | 144 | |
| At 31 December | 0 | | | 0 | | | 0 | | | 0 | | | 0 | | | 0 | |
| | | | | | | | | | | | | | | | | | | | | | | | | | | | | | | | | | | |
| The Group | | The Bank |
| 2020 | | 2019 | | 2018 | | 2020 | | 2019 | | 2018 |
| £m | | £m | | £m | | £m | | £m | | £m |
| Cash flow hedging reserve | | | | | | | | | | | |
| At 1 January | 1,556 | | | 1,110 | | | 1,573 | | | 1,607 | | | 1,268 | | | 1,554 | |
| Change in fair value of hedging derivatives | 709 | | | 1,166 | | | 91 | | | 85 | | | 892 | | | 255 | |
| Deferred tax | (229) | | | (290) | | | (43) | | | (66) | | | (217) | | | (72) | |
| 480 | | | 876 | | | 48 | | | 19 | | | 675 | | | 183 | |
| Income statement transfers | (727) | | | (580) | | | (691) | | | (355) | | | (448) | | | (628) | |
| Deferred tax | 198 | | | 150 | | | 180 | | | 96 | | | 112 | | | 159 | |
| (529) | | | (430) | | | (511) | | | (259) | | | (336) | | | (469) | |
| At 31 December | 1,507 | | | 1,556 | | | 1,110 | | | 1,367 | | | 1,607 | | | 1,268 | |
| | | | | | | | | | | | | | | | | | | | | | | |
| The Group | | The Bank |
| 2020 | 2019 | 2018 | | 2020 | 2019 | 2018 |
| £m | £m | £m | | £m | £m | £m |
| Foreign currency translation reserve | | | | | | | |
| At 1 January | (116) | | (114) | | (207) | | | 0 | | (6) | | 76 | |
| Currency translation differences arising in the year | 0 | | (2) | | (15) | | | 1 | | 6 | | 2 | |
| Income statement transfers | 0 | | 0 | | 108 | | | 0 | | 0 | | (84) | |
| At 31 December | (116) | | (116) | | (114) | | | 1 | | 0 | | (6) | |
NOTES TO THE ACCOUNTS
for the year ended 31 December 2020
35 RETAINED PROFITS
| | | | | | | | | | | | | | | | | | | | | | | | | | | | | | | | | | | |
| The Group | | The Bank |
| 2020 | | 2019 | | 2018 | | 2020 | | 2019 | | 2018 |
| £m | | £m | | £m | | £m | | £m | | £m |
| At 1 January | 24,549 | | | 27,321 | | | 36,749 | | | 42,470 | | | 45,051 | | | 52,843 | |
| Profit attributable to ordinary shareholders (see below for the Bank) | 1,023 | | | 2,515 | | | 3,907 | | | 224 | | | 2,165 | | | 5,866 | |
| Capital transactions with parent | | | | | | | | | | | |
| Dividends paid (note 37) | 0 | | | (4,100) | | | (11,022) | | | 0 | | | (4,100) | | | (11,022) | |
| Capital repayments | 0 | | | 0 | | | (2,975) | | | 0 | | | 0 | | | (2,975) | |
| Capital contributions received | 140 | | | 229 | | | 265 | | | 140 | | | 229 | | | 265 | |
| Return of capital contributions | (4) | | | (5) | | | (9) | | | (4) | | | (5) | | | (9) | |
| 136 | | | (3,876) | | | (13,741) | | | 136 | | | (3,876) | | | (13,741) | |
| Realised gains and losses on equity shares held at fair value through other comprehensive income | (16) | | | 12 | | | (111) | | | 4 | | | 12 | | | (144) | |
| Post-retirement defined benefit scheme remeasurements | 113 | | | (1,117) | | | 120 | | | (102) | | | (576) | | | (162) | |
| Share of other comprehensive income of associates and joint ventures | 0 | | | 0 | | | 8 | | | 0 | | | 0 | | | 0 | |
Gains and losses attributable to own credit risk (net of tax)1 | (55) | | | (306) | | | 389 | | | (55) | | | (306) | | | 389 | |
| At 31 December | 25,750 | | | 24,549 | | | 27,321 | | | 42,677 | | | 42,470 | | | 45,051 | |
1During 2020 the Group derecognised, on redemption, financial liabilities on which cumulative fair value movements relating to own credit of £1 million net of tax (2019: £NaN; 2018: £NaN), had been recognised directly in retained profits.
The profit after tax of the Bank was arrived at as follows:
| | | | | | | | | | | | | | | | | |
| 2020 | | 2019 | | 2018 |
| £m | | £m | | £m |
| Net interest income | 4,519 | | | 5,684 | | | 6,129 | |
| Net fee and commission income | 655 | | | 743 | | | 839 | |
| Dividends received | 44 | | | 1,331 | | | 4,848 | |
| Net trading and other operating income | 2,952 | | | 2,169 | | | 2,389 | |
| Other income | 3,651 | | | 4,243 | | | 8,076 | |
| Total income | 8,170 | | | 9,927 | | | 14,205 | |
| Regulatory provisions | (312) | | | (996) | | | (939) | |
| Other operating expenses | (5,516) | | | (5,337) | | | (5,864) | |
| Total operating expenses | (5,828) | | | (6,333) | | | (6,803) | |
| Impairment | (1,898) | | | (503) | | | (504) | |
| Profit before tax | 444 | | | 3,091 | | | 6,898 | |
| Tax credit (expense) | 197 | | | (645) | | | (757) | |
| Profit for the year | 641 | | | 2,446 | | | 6,141 | |
| | | | | |
| Profit attributable to ordinary shareholders | 224 | | | 2,165 | | | 5,866 | |
| Profit attributable to other equity holders | 417 | | | 281 | | | 275 | |
| Profit for the year | 641 | | | 2,446 | | | 6,141 | |
NOTES TO THE ACCOUNTS
for the year ended 31 December 2020
36 OTHER EQUITY INSTRUMENTS
| | | | | | | | | | | | | | | | | |
| The Group and Bank |
| 2020 | | 2019 | | 2018 |
| £m | | £m | | £m |
| At 1 January | 4,865 | | | 3,217 | | | 3,217 | |
| Issued in the year: | | | | | |
| US$500 million Fixed Rate Reset Additional Tier 1 Perpetual Subordinated Permanent Write-Down Securities | 383 | | | 0 | | | 0 | |
| €750 million Fixed Rate Reset Additional Tier 1 Perpetual Subordinated Permanent Write-Down Securities | 687 | | | 0 | | | 0 | |
| £500 million Fixed Rate Reset Additional Tier 1 Perpetual Subordinated Permanent Write-Down Securities | 0 | | | 496 | | | 0 | |
| US$1,500 million Fixed Rate Reset Additional Tier 1 Perpetual Subordinated Permanent Write-Down Securities | 0 | | | 1,152 | | | 0 | |
| 1,070 | |
| 1,648 | |
| 0 | |
| Profit for the year attributable to other equity holders | 417 | | | 281 | | | 275 | |
| Distributions on other equity instruments | (417) | | | (281) | | | (275) | |
| At 31 December | 5,935 | |
| 4,865 | |
| 3,217 | |
The Bank has in issue £5,935 million of Sterling, Dollar and Euro Additional Tier 1 (AT1) securities to Lloyds Banking Group plc. The AT1 securities are fixed rate resetting or floating rate Perpetual Subordinated Permanent Write-Down Securities with no fixed maturity or redemption date.
The principal terms of the AT1 securities are described below:
–The securities rank behind the claims against the Bank of unsubordinated creditors on a Winding-Up.
–The fixed rate reset securities bear a fixed rate of interest until the first call date. After the initial call date, in the event that they are not redeemed, the fixed rate reset AT1 securities will bear interest at rates fixed periodically in advance. The floating rate AT1 securities will be reset quarterly both prior to and following the first call date.
–Interest on the securities will be due and payable only at the sole discretion of the Bank and the Bank may at any time elect to cancel any Interest Payment (or any part thereof) which would otherwise be payable on any Interest Payment Date. There are also certain restrictions on the payment of interest as specified in the terms.
–The securities are undated and are repayable, at the option of the Bank, in whole at the first call date, or at any Interest Payment date thereafter. In addition, the AT1 securities are repayable, at the option of the Bank, in whole for certain regulatory or tax reasons. Any repayments require the prior consent of the PRA.
–The securities will be subject to a Permanent Write Down should the fully Loaded Common Equity Tier 1 ratio of the Bank fall below 7.0 per cent.
37 DIVIDENDS ON ORDINARY SHARES
| | | | | | | | | | | |
| 2020 | 2019 | 2018 |
| £m | £m | £m |
| Dividends paid during the year were as follows: | | | |
| Interim dividends | 0 | | 4,100 | | 11,022 | |
The directors have proposed an interim dividend of £1,000 million to be paid in May 2021.
NOTES TO THE ACCOUNTS
for the year ended 31 December 2020
38 SHARE-BASED PAYMENTS
During the year ended 31 December 2020 Lloyds Banking Group pic operated a number of share-based payment schemes for which employees of the Lloyds Bank Group were eligible and all of which are equity settled. Details of all schemes operated by Lloyds Banking Group are set out below; these are managed and operated on a Lloyds Banking Group-wide basis. The amount charged to the Group’s income statement in respect of Lloyds Banking Group share-based payment schemes, and which is included within staff costs (note 9), was £181 million (2019: £337 million; 2018: £417 million) with a further £6 million in 2018 included within discontinued operations (see note 13).
During the year ended 31 December 2020 the Lloyds Banking Group operated the following share-based payment schemes, all of which are equity settled.
Group Performance Share plan
The Group operates a Group Performance Share plan that is equity settled. No award has been made in respect of 2020; the charge in the year relates to prior year awards for which the deferral period has completed.
Save-As-You-Earn schemes
Eligible employees may enter into contracts through the Save-As-You-Earn (SAYE) schemes to save up to £500 per month and, at the expiry of a fixed term of three years, have the option to use these savings within six months of the expiry of the fixed term to acquire shares in the Group at a discounted price of no less than 80 per cent (90 per cent for the 2020 plan) of the market price at the start of the invitation.
Movements in the number of share options outstanding under the SAYE schemes are set out below:
| | | | | | | | | | | | | | | | | |
| 2020 | | 2019 |
| Number
of options | Weighted
average
exercise price
(pence) | | Number
of options | Weighted
average
exercise price
(pence) |
| Outstanding at 1 January | 1,068,094,073 | 44.55 | | | 802,994,918 | 49.30 | |
| Granted | 779,229,797 | 24.25 | | | 487,654,212 | 39.87 | |
| Exercised | (255,706,663) | 47.51 | | | (27,303,963) | 51.23 | |
| Forfeited | (6,938,102) | 43.30 | | | (15,830,204) | 48.69 | |
| Cancelled | (389,767,675) | 42.24 | | | (130,068,149) | 49.03 | |
| Expired | (74,772,515) | 47.26 | | | (49,352,741) | 58.74 | |
| Outstanding at 31 December | 1,120,138,915 | 30.39 | | | 1,068,094,073 | 44.55 | |
| Exercisable at 31 December | 792,741 | 47.49 | | | 227,139 | 60.70 | |
The weighted average share price at the time that the options were exercised during 2020 was £0.61 (2019: £0.59). The weighted average remaining contractual life of options outstanding at the end of the year was 2.98 years (2019: 2.22 years).
The weighted average fair value of SAYE options granted during 2020 was £0.05 (2019: £0.10). The fair values of the SAYE options have been determined using a standard Black-Scholes model.
Other share option plans
Lloyds Banking Group Executive Share Plan 2003
The Plan was adopted in December 2003 and under the Plan share options may be granted to senior employees. Options under this plan have been granted specifically to facilitate recruitment (to compensate new recruits for any lost share awards), and also to make grants to key individuals for retention purposes. In some instances, grants may be made subject to individual performance conditions.
Participants are not entitled to any dividends paid during the vesting period.
| | | | | | | | | | | | | | | | | |
| 2020 | | 2019 |
| Number
of options | Weighted
average
exercise price
(pence) | | Number
of options | Weighted
average
exercise price
(pence) |
| Outstanding at 1 January | 7,634,638 | NaN | | 10,263,028 | NaN |
| Granted | 1,990,449 | NaN | | 2,336,171 | NaN |
| Exercised | (2,122,302) | NaN | | (4,455,481) | NaN |
| Vested | (47,337) | NaN | | (69,005) | NaN |
| Forfeited | (111,100) | NaN | | (39,250) | NaN |
| Lapsed | (677,976) | NaN | | (400,825) | NaN |
| Outstanding at 31 December | 6,666,372 | NaN | | 7,634,638 | NaN |
| Exercisable at 31 December | 3,150,407 | NaN | | 2,683,267 | NaN |
The weighted average fair value of options granted in the year was £0.33 (2019: £0.59). The fair values of options granted have been determined using a standard Black-Scholes model. The weighted average share price at the time that the options were exercised during 2020 was £0.36 (2019: £0.60). The weighted average remaining contractual life of options outstanding at the end of the year was 4.1 years (2019: 3.8 years).
NOTES TO THE ACCOUNTS
for the year ended 31 December 2020
38 SHARE-BASED PAYMENTS (continued)
Other share plans
Lloyds Banking Group Executive Group Ownership Share Plan
The plan, introduced in 2006, is aimed at delivering shareholder value by linking the receipt of shares to an improvement in the performance of the Group over a three year period. Awards are made within limits set by the rules of the plan, with the limits determining the maximum number of shares that can be awarded equating to three times annual salary. In exceptional circumstances this may increase to four times annual salary.
At the end of the performance period for the 2017 grant, the targets had not been fully met and therefore these awards vested in 2020 at a rate of 49.7 per cent.
| | | | | | | | |
| 2020 | 2019 |
| Number
of shares | Number
of shares |
| Outstanding at 1 January | 459,904,745 | 417,385,636 |
| Granted | 211,214,605 | 174,490,843 |
| Vested | (47,775,806) | (88,318,950) |
| Forfeited | (96,015,542) | (55,029,439) |
| Dividend award | 6,659,525 | 11,376,655 |
| Outstanding at 31 December | 533,987,527 | 459,904,745 |
Awards in respect of the 2018 grant vested in 2021 at a rate of 33.75 per cent. In previous years participants were entitled to any dividends paid in the vesting period. However, following a regulatory change prohibiting the payment of dividend equivalents on awards, the number of shares subject to award was determined by applying an adjustment factor to the share price on grant.
The weighted average fair value of awards granted in the year was £0.28 (2019: £0.45).
Chief Financial Officer Buyout
William Chalmers joined the Group on 3 June 2019 and was appointed as Chief Financial Officer on 1 August 2019 on the retirement of George Culmer. He was granted deferred share awards over 4,086,632 shares, to replace unvested awards from his former employer, Morgan Stanley, that were forfeited as a result of him joining the Group.
| | | | | | | | |
| 2020 | 2019 |
| Number
of shares | Number
of shares |
| Outstanding at 1 January | 3,268,460 | 0 |
| Granted | 0 | 4,086,632 |
| Exercised | (1,457,748) | (818,172) |
| Outstanding at 31 December | 1,810,712 | 3,268,460 |
The weighted average fair value of awards granted in 2019 was £0.55.
The fair value calculations at 31 December 2020 for grants made in the year, using Black-Scholes models and Monte Carlo simulation, are based on the following assumptions:
| | | | | | | | | | | | |
| SAYE | Executive
Share Plan
2003 | Executive Group Ownership Share Plan | |
| Weighted average risk-free interest rate | (0.03%) | (0.01%) | 0.18% | |
| Weighted average expected life | 3.2 years | 1.2 years | 3.6 years | |
| Weighted average expected volatility | 32% | 42% | 23% | |
| Weighted average expected dividend yield | 5.3% | 5.3% | 5.3% | |
| Weighted average share price | £0.28 | £0.35 | £0.47 | |
| Weighted average exercise price | £0.24 | NaN | NaN | |
Expected volatility is a measure of the amount by which the Group’s shares are expected to fluctuate during the life of an option. The expected volatility is estimated based on the historical volatility of the closing daily share price over the most recent period that is commensurate with the expected life of the option. The historical volatility is compared to the implied volatility generated from market traded options in the Group’s shares to assess the reasonableness of the historical volatility and adjustments made where appropriate.
Share Incentive Plan
Free Shares
An award of shares may be made annually to employees up to a maximum of £3,600. The shares awarded are held in trust for a mandatory period of three years on the employee’s behalf, during which period the employee is entitled to any dividends paid on such shares. The award is subject to a non-market based condition. If an employee leaves the Group within this three year period for other than a ‘good’ reason, all of the shares awarded will be forfeited.
On 20 May 2020, the Group made an award of £200 (2019: £200) of shares to all eligible employees. The number of shares awarded was 45,612,424 (2019: 22,422,337), with an average fair value of £0.30 (2019: £0.62) based on the market price at the date of award.
NOTES TO THE ACCOUNTS
for the year ended 31 December 2020
38 SHARE-BASED PAYMENTS (continued)
Matching shares
The Group undertakes to match shares purchased by employees up to the value of £45 per month; these matching shares are held in trust for a mandatory period of three years on the employee’s behalf, during which period the employee is entitled to any dividends paid on such shares. The award is subject to a non-market based condition: if an employee leaves within this three year period for other than a ‘good’ reason, all of the matching shares are forfeited. Similarly if the employees sell their purchased shares within three years, their matching shares are forfeited.
The number of shares awarded relating to matching shares in 2020 was 62,262,140 (2019: 37,346,812), with an average fair value of £0.34 (2019: £0.56), based on market prices at the date of award.
Fixed share awards
Fixed share awards were introduced in 2014 in order to ensure that total fixed remuneration is commensurate with role and to provide a competitive reward package for certain Lloyds Banking Group employees, with an appropriate balance of fixed and variable remuneration, in line with regulatory requirements. The fixed share awards are delivered in Lloyds Banking Group shares, released over five years with 20 per cent being released each year following the year of award. From June 2020, the fixed share awards are released over three years with one third being released each year following the year of award. The number of shares purchased in 2020 was 13,975,993 (2019: 8,239,332).
The fixed share award is not subject to any performance conditions, performance adjustment or clawback. On an employee leaving the Group, there is no change to the timeline for which shares will become unrestricted.
39 RELATED PARTY TRANSACTIONS
Key management personnel
Key management personnel are those persons having authority and responsibility for planning, directing and controlling the activities of an entity; the Group’s key management personnel are the members of the Lloyds Banking Group plc Group Executive Committee together with its Non-Executive Directors.
The table below details, on an aggregated basis, key management personnel compensation:
| | | | | | | | | | | |
| 2020 | 2019 | 2018 |
| £m | £m | £m |
| Compensation | | | |
| Salaries and other short-term benefits | 12 | | 14 | | 13 | |
| Post-employment benefits | 0 | | 0 | | 0 | |
| Share-based payments | 12 | | 14 | | 17 | |
| Total compensation | 24 | | 28 | | 30 | |
The aggregate of the emoluments of the directors was £11.8 million (2019: £11.7 million; 2018: £12.2 million).
Aggregate company contributions in respect of key management personnel to defined contribution pension schemes were £NaN (2019: £NaN; 2018: £NaN).
The total for the highest paid director (Juan Colombás) was £4,169,000 (2019: (António Horta-Osório): £4,078,000; 2018: (António Horta-Osório): £5,472,000); this did not include any gain on exercise of Lloyds Banking Group plc shares in any year.
| | | | | | | | | | | |
| 2020 | 2019 | 2018 |
| million | million | million |
| Share options over Lloyds Banking Group plc shares | | | |
| At 1 January | 0 | | 0 | | 1 | |
| Granted, including certain adjustments (includes entitlements of appointed key management personnel) | 0 | | 0 | | 0 | |
| Exercised/lapsed (includes entitlements of former key management personnel) | 0 | | 0 | | (1) | |
| At 31 December | 0 | | 0 | | 0 | |
| | | | | | | | | | | |
| 2020 | 2019 | 2018 |
| million | million | million |
| Share plans settled in Lloyds Banking Group plc shares | | | |
| At 1 January | 101 | | 84 | | 82 | |
| Granted, including certain adjustments (includes entitlements of appointed key management personnel) | 46 | | 46 | | 39 | |
| Exercised/lapsed (includes entitlements of former key management personnel) | (30) | | (29) | | (37) | |
| At 31 December | 117 | | 101 | | 84 | |
NOTES TO THE ACCOUNTS
for the year ended 31 December 2020
39 RELATED PARTY TRANSACTIONS (continued)
The tables below detail, on an aggregated basis, balances outstanding at the year end and related income and expense, together with information relating to other transactions between the Group and its key management personnel:
| | | | | | | | | | | |
| 2020 | 2019 | 2018 |
| £m | £m | £m |
| Loans | | | |
| At 1 January | 2 | | 2 | | 2 | |
| Advanced (includes loans of appointed key management personnel) | 0 | | 1 | | 1 | |
| Repayments (includes loans of former key management personnel) | 0 | | (1) | | (1) | |
| At 31 December | 2 | | 2 | | 2 | |
The loans are on both a secured and unsecured basis and are expected to be settled in cash. The loans attracted interest rates of between 0.39 per cent and 24.20 per cent in 2020 (2019: 6.45 per cent and 24.20 per cent; 2018: 6.70 per cent and 24.20 per cent).
NaN provisions have been recognised in respect of loans given to key management personnel (2019 and 2018: £NaN).
| | | | | | | | | | | |
| 2020 | 2019 | 2018 |
| £m | £m | £m |
| Deposits | | | |
| At 1 January | 23 | | 20 | | 20 | |
| Placed (includes deposits of appointed key management personnel) | 26 | | 44 | | 33 | |
| Withdrawn (includes deposits of former key management personnel) | (38) | | (41) | | (33) | |
| At 31 December | 11 | | 23 | | 20 | |
Deposits placed by key management personnel attracted interest rates of up to 2.0 per cent (2019: 3.0 per cent; 2018: 3.5 per cent).
At 31 December 2020, the Group did not provide any guarantees in respect of key management personnel (2019 and 2018: none).
At 31 December 2020, transactions, arrangements and agreements entered into by the Group and its banking subsidiaries with directors and connected persons included amounts outstanding in respect of loans and credit card transactions of £0.6 million with five directors and two connected persons (2019: £0.6 million with five directors and two connected persons; 2018: £0.5 million with five directors and two connected persons).
Balances and transactions with fellow Lloyds Banking Group undertakings
Balances and transactions between members of the Lloyds Bank Group
In accordance with IFRS 10 Consolidated Financial Statements, transactions and balances between the Bank and its subsidiary undertakings, and between those subsidiary undertakings, have all been eliminated on consolidation and thus are not reported as related party transactions of the Group.
The Bank, as a result of its position as parent of a banking group, has a large number of transactions with various of its subsidiary undertakings; these are included on the balance sheet of the Bank as follows:
| | | | | | | | |
| 2020 | 2019 |
| £m | £m |
| Assets, included within: | | |
| Derivative financial instruments | 7,077 | | 8,546 | |
| Financial assets at fair value through profit or loss | 1,203 | | 0 | |
| Financial assets at amortised cost: due from fellow Lloyds Banking Group undertakings | 128,241 | | 200,696 | |
| 136,521 | | 209,242 | |
| Liabilities, included within: | | |
| Due to fellow Lloyds Banking Group undertakings | 33,170 | | 105,075 | |
| Financial liabilities at fair value through profit or loss | 0 | | 43 | |
| Derivative financial instruments | 4,738 | | 7,102 | |
| Debt securities in issue | 20 | | 0 | |
| | |
| 37,928 | | 112,220 | |
Due to the size and volume of transactions passing through these accounts, it is neither practical nor meaningful to disclose information on gross inflows and outflows. During 2020 the Bank earned interest income on the above asset balances of £1,995 million (2019: £2,491 million; 2018: £2,305 million) and incurred interest expense on the above liability balances of £336 million (2019: £655 million; 2018: £545 million).
In addition, the Bank raised recharges of £1,403 million (2019: £1,461 million; 2018: £1,315 million) on its subsidiaries in respect of costs incurred and also received fees of £56 million (2019: £62 million; 2018: £146 million), and paid fees of £26 million (2019: £57 million; 2018: £151 million), for various services provided between the Bank and its subsidiaries.
Details of contingent liabilities and commitments entered into on behalf of fellow Lloyds Banking Group undertakings are given in note 40.
NOTES TO THE ACCOUNTS
for the year ended 31 December 2020
39 RELATED PARTY TRANSACTIONS (continued)
Balances and transactions with Lloyds Banking Group plc and fellow subsidiaries of the Bank
The Bank and its subsidiaries have balances due to and from the Bank’s parent company, Lloyds Banking Group plc and fellow subsidiaries of the Bank. These are included on the balance sheet as follows:
| | | | | | | | | | | | | | | | | |
| The Group | | The Bank |
| 2020 | 2019 | | 2020 | 2019 |
| £m | £m | | £m | £m |
| Assets, included within: | | | | | |
| Financial assets at amortised cost: due from fellow Lloyds Banking Group undertakings | 738 | | 1,854 | | | 530 | | 1,581 | |
| | | | | |
| Derivative financial instruments | 690 | | 591 | | | 690 | | 591 | |
| 1,428 | | 2,445 | | | 1,220 | | 2,172 | |
| Liabilities, included within: | | | | | |
| Due to fellow Lloyds Banking Group undertakings | 6,875 | | 4,893 | | | 6,666 | | 4,696 | |
| Financial liabilities at fair value through profit or loss | 0 | | 1 | | | 1,121 | | 1 | |
| Derivative financial instruments | 1,424 | | 1,986 | | | 972 | | 1,547 | |
| Debt securities in issue | 12,686 | | 11,181 | | | 11,551 | | 11,136 | |
| Subordinated liabilities | 4,599 | | 3,663 | | | 4,745 | | 3,641 | |
| 25,584 | | 21,724 | | | 25,055 | | 21,021 | |
These balances include Lloyds Banking Group plc’s banking arrangements and, due to the size and volume of transactions passing through these accounts, it is neither practical nor meaningful to disclose information on gross inflows and outflows. During 2020 the Group earned £5 million and the Bank earned £5 million interest income on the above asset balances (2019: Group £20 million, Bank £20 million; 2018: Group £166 million, Bank £142 million); the Group incurred £478 million and the Bank incurred £461 million interest expense on the above liability balances (2019: Group £520 million, Bank £509 million; 2018: Group £370 million, Bank £334 million).
Other related party transactions
Pension funds
The Group provides banking services to certain of its pension funds. At 31 December 2020, customer deposits of £151 million (2019: £169 million) related to the Group’s pension funds.
Joint ventures and associates
At 31 December 2020 there were loans and advances to customers of £28 million (2019: £75 million) outstanding and balances within customer deposits of £73 million (2019: £5 million) relating to joint ventures and associates.
During the year the Group paid fees of £7 million (2019: £2 million) to the Lloyds Banking Group's Schroders Personal Wealth joint venture and also made a payment of £20 million under the terms of an Operating Margin Guarantee put in place as part of the agreements for the establishment of the joint venture.
40 CONTINGENT LIABILITIES, COMMITMENTS AND GUARANTEES
Interchange fees
With respect to multi-lateral interchange fees (MIFs), the Lloyds Banking Group is not involved in the ongoing litigation which involves card schemes such as Visa and Mastercard (as described below). However, the Group is a member/licensee of Visa and Mastercard and other card schemes. The litigation in question is as follows:
–litigation brought by retailers against both Visa and Mastercard continues in the English Courts (and includes a judgment of the Supreme Court in June 2020 upholding the Court of Appeal's finding in 2018 that historic interchange arrangements of Mastercard and Visa infringed competition law); and
–litigation brought on behalf of UK consumers in the English Courts against Mastercard, which the Supreme Court has now confirmed can proceed.
Any impact on the Group of the litigation against Visa and Mastercard remains uncertain at this time, such that it is not practicable for the Group to provide an estimate of any potential financial effect. Insofar as Visa is required to pay damages to retailers for interchange fees set prior to June 2016, contractual arrangements to allocate liability have been agreed between various UK banks (including the Lloyds Banking Group) and Visa Inc, as part of Visa Inc’s acquisition of Visa Europe in 2016. These arrangements cap the maximum amount of liability to which the Lloyds Banking Group may be subject and this cap is set at the cash consideration received by the Lloyds Banking Group for the sale of its stake in Visa Europe to Visa Inc in 2016. In 2016, the Group received Visa preference stock as part of the consideration for the sale of its shares in Visa Europe. In 2020, some of these Visa preference shares were converted into Visa Inc Class A common stock (in accordance with the provisions of the Visa Europe sale documentation) and they were subsequently sold by the Group. The sale had no impact on this contingent liability.
LIBOR and other trading rates
Certain Lloyds Banking Group companies, together with other panel banks, have been named as defendants in private lawsuits, including purported class action suits, in the US in connection with their roles as panel banks contributing to the setting of US Dollar, Japanese Yen and Sterling London Interbank Offered Rate and the Australian BBSW reference rate. Certain of the plaintiffs' claims have been dismissed by the US Federal Court for the Southern District of New York (subject to appeals).
Certain Lloyds Banking Group companies are also named as defendants in (i) UK based claims; and (ii) two Dutch class actions, raising LIBOR manipulation allegations. A number of the claims against the Lloyds Banking Group in relation to the alleged mis-sale of interest rate hedging products also include allegations of LIBOR manipulation.
Furthermore, the Swiss Competition Commission concluded its investigation against Lloyds Bank plc in June 2019. However, the Lloyds Banking Group continues to respond to litigation arising out of the investigations into submissions made by panel members to the bodies that set LIBOR and various other interbank offered rates.
NOTES TO THE ACCOUNTS
for the year ended 31 December 2020
40 CONTINGENT LIABILITIES, COMMITMENTS AND GUARANTEES (continued)
It is currently not possible to predict the scope and ultimate outcome on the Lloyds Banking Group of the various outstanding regulatory investigations not encompassed by the settlements, any private lawsuits or any related challenges to the interpretation or validity of any of the Lloyds Banking Group's contractual arrangements, including their timing and scale. As such, it is not practicable to provide an estimate of any potential financial effect.
Tax authorities
The Lloyds Banking Group has an open matter in relation to a claim for group relief of losses incurred in its former Irish banking subsidiary, which ceased trading on 31 December 2010. In 2013, HMRC informed the Lloyds Banking Group that its interpretation of the UK rules means that the group relief is not available. In 2020, HMRC concluded their enquiry into the matter and issued a closure notice. The Lloyds Banking Group's interpretation of the UK rules has not changed and hence it has appealed to the First Tier Tax Tribunal, with a hearing expected in early 2022. If the final determination of the matter by the judicial process is that HMRC’s position is correct, management estimate that this would result in an increase in current tax liabilities of approximately £700 million (including interest) and a reduction in deferred tax assets of approximately £270 million. The Lloyds Banking Group, having taken appropriate advice, does not consider that this is a case where additional tax will ultimately fall due.
There are a number of other open matters on which the Group is in discussions with HMRC (including the tax treatment of certain costs arising from the divestment of TSB Banking Group plc), none of which is expected to have a material impact on the financial position of the Group.
Other legal actions and regulatory matters
In addition, during the ordinary course of business the Group is subject to other complaints and threatened or actual legal proceedings (including class or group action claims) brought by or on behalf of current or former employees, customers, investors or other third parties, as well as legal and regulatory reviews, challenges, investigations and enforcement actions, both in the UK and overseas. All material such matters are periodically reassessed, with the assistance of external professional advisers where appropriate, to determine the likelihood of the Group incurring a liability. In those instances where it is concluded that it is more likely than not that a payment will be made, a provision is established to management's best estimate of the amount required at the relevant balance sheet date. In some cases it will not be possible to form a view, for example because the facts are unclear or because further time is needed properly to assess the merits of the case, and no provisions are held in relation to such matters. In these circumstances, specific disclosure in relation to a contingent liability will be made where material. However the Group does not currently expect the final outcome of any such case to have a material adverse effect on its financial position, operations or cash flows.
Contingent liabilities, commitments and guarantees arising from the banking business
| | | | | | | | | | | | | | | | | | | | | | | |
| The Group | | The Bank |
| 2020 | | 2019 | | 2020 | | 2019 |
| £m | | £m | | £m | | £m |
| Contingent liabilities | | | | | | | |
| Acceptances and endorsements | 73 | | | 17 | | | 73 | | | 16 | |
| Other: | | | | | | | |
| Other items serving as direct credit substitutes | 221 | | | 279 | | | 203 | | | 259 | |
| Performance bonds, including letters of credit, and other transaction-related contingencies | 2,070 | | | 2,274 | | | 1,817 | | | 2,014 | |
| 2,291 | | | 2,553 | | | 2,020 | | | 2,273 | |
| Total contingent liabilities | 2,364 | | | 2,570 | | | 2,093 | | | 2,289 | |
| | | | | | | | |
| The Bank |
| 2020 | 2019 |
| £m | £m |
| Incurred on behalf of fellow Lloyds Banking Group undertakings | 1 | | 1 | |
The contingent liabilities of the Group and the Bank arise in the normal course of banking business and it is not practicable to quantify their future financial effect.
| | | | | | | | | | | | | | | | | | | | | | | |
| The Group | | The Bank |
| 2020 | | 2019 | | 2020 | | 2019 |
| £m | | £m | | £m | | £m |
| Commitments and guarantees | | | | | | | |
| Documentary credits and other short-term trade-related transactions | 1 | | | 0 | | | 0 | | | 0 | |
| Forward asset purchases and forward deposits placed | 124 | | | 171 | | | 96 | | | 157 | |
| Undrawn formal standby facilities, credit lines and other commitments to lend: | | | | | | | |
| Less than 1 year original maturity: | | | | | | | |
| Mortgage offers made | 20,128 | | | 12,647 | | | 1,720 | | | 1,120 | |
| Other commitments and guarantees | 82,151 | | | 78,306 | | | 32,832 | | | 29,608 | |
| 102,279 | | | 90,953 | | | 34,552 | | | 30,728 | |
| 1 year or over original maturity | 31,194 | | | 25,310 | | | 28,118 | | | 21,664 | |
| Total commitments and guarantees | 133,598 | | | 116,434 | | | 62,766 | | | 52,549 | |
| | | | | | | | |
| The Bank |
| 2020 | 2019 |
| £m | £m |
| Incurred on behalf of fellow Lloyds Banking Group undertakings | 3,659 | | 4,647 | |
NOTES TO THE ACCOUNTS
for the year ended 31 December 2020
40 CONTINGENT LIABILITIES, COMMITMENTS AND GUARANTEES (continued)
Of the amounts shown above in respect of undrawn formal standby facilities, credit lines and other commitments to lend, £59,240 million (2019: £46,629 million) for the Group and £32,847 million (2019: £27,672 million) for the Bank were irrevocable.
Capital commitments
Excluding commitments of the Group in respect of investment property (note 21), capital expenditure contracted but not provided for at 31 December 2020 amounted to £501 million (2019: £405 million) for the Group and £NaN (2019: £2 million) for the Bank. Of this amount for the Group, £501 million (2019: £400 million) related to assets to be leased to customers under operating leases. The Group’s management is confident that future net revenues and funding will be sufficient to cover these commitments.
41 STRUCTURED ENTITIES
The Group’s interests in structured entities are consolidated. Details of the Group’s interests in these structured entities are set out in note 26 for securitisations and covered bond vehicles, note 28 for structured entities associated with the Group’s pension schemes, and below.
Asset-backed conduits
In addition to the structured entities discussed in note 26, which are used for securitisation and covered bond programmes, the Group sponsors an active asset-backed conduit, Cancara, which invests in client receivables and debt securities. The total consolidated exposure of Cancara at 31 December 2020 was £2,490 million (2019: £3,735 million), comprising £1,695 million of loans and advances (2019: £3,670 million) and £795 million of debt securities (2019: £65 million).
All lending assets and debt securities held by the Group in Cancara are restricted in use, as they are held by the collateral agent for the benefit of the commercial paper investors and the liquidity providers only. The Group provides liquidity facilities to Cancara under terms that are usual and customary for standard lending activities in the normal course of the Group’s banking activities. During 2020 there have continued to be planned drawdowns on certain liquidity facilities for balance sheet management purposes, supporting the programme to provide funding alongside the proceeds of the asset-backed commercial paper issuance. The Group could be asked to provide support under the contractual terms of these arrangements including, for example, if Cancara experienced a shortfall in external funding, which may occur in the event of market disruption.
The external assets in Cancara are consolidated in the Group’s financial statements.
NOTES TO THE ACCOUNTS
for the year ended 31 December 2020
42 FINANCIAL INSTRUMENTS
(1)Measurement basis of financial assets and liabilities
The accounting policies in note 2 describe how different classes of financial instruments are measured, and how income and expenses, including fair value gains and losses, are recognised. The following tables analyse the carrying amounts of the financial assets and liabilities by category and by balance sheet heading.
| | | | | | | | | | | | | | | | | | | | | | | | | | | | | | | | | | | | | | | | | |
| Derivatives
designated
as hedging
instruments | | Mandatorily held at
fair value through
profit or loss | | Designated
at fair value
through profit
or loss | | At fair value
through other
comprehensive
income | | Held at
amortised
cost | | Total |
| | Held for
trading | | Other | | | | |
| The Group | £m | | £m | | £m | | £m | | £m | | £m | | £m |
| At 31 December 2020 | | | | | | | | | | | | | |
| Financial assets | | | | | | | | | | | | | |
| Cash and balances at central banks | — | | | — | | | — | | | — | | | — | | | 49,888 | | | 49,888 | |
| Items in the course of collection from banks | — | | | — | | | — | | | — | | | — | | | 300 | | | 300 | |
| Financial assets at fair value through profit or loss | — | | | 0 | | | 1,674 | | | — | | | — | | | — | | | 1,674 | |
| Derivative financial instruments | 674 | | | 7,667 | | | — | | | — | | | — | | | — | | | 8,341 | |
| Loans and advances to banks | — | | | — | | | — | | | — | | | — | | | 5,950 | | | 5,950 | |
| Loans and advances to customers | — | | | — | | | — | | | — | | | — | | | 480,141 | | | 480,141 | |
| Debt securities | — | | | — | | | — | | | — | | | — | | | 5,137 | | | 5,137 | |
| Due from fellow Lloyds Banking Group undertakings | — | | | — | | | — | | | — | | | — | | | 738 | | | 738 | |
| Financial assets at amortised cost | — | | | — | | | — | | | — | | | — | | | 491,966 | | | 491,966 | |
| Financial assets at fair value through other comprehensive income | — | | | — | | | — | | | — | | | 27,260 | | | — | | | 27,260 | |
| Total financial assets | 674 | | | 7,667 | | | 1,674 | | | — | | | 27,260 | | | 542,154 | | | 579,429 | |
| Financial liabilities | | | | | | | | | | | | | |
| Deposits from banks | — | | | — | | | — | | | — | | | — | | | 24,997 | | | 24,997 | |
| Customer deposits | — | | | — | | | — | | | — | | | — | | | 434,569 | | | 434,569 | |
| Due to fellow Lloyds Banking Group undertakings | — | | | — | | | — | | | — | | | — | | | 6,875 | | | 6,875 | |
| Items in course of transmission to banks | — | | | — | | | — | | | — | | | — | | | 302 | | | 302 | |
| Financial liabilities at fair value through profit or loss | — | | | 3 | | | — | | | 6,828 | | | — | | | — | | | 6,831 | |
| Derivative financial instruments | 590 | | | 7,638 | | | — | | | — | | | — | | | — | | | 8,228 | |
| Notes in circulation | — | | | — | | | — | | | — | | | — | | | 1,305 | | | 1,305 | |
| Debt securities in issue | — | | | — | | | — | | | — | | | — | | | 59,293 | | | 59,293 | |
| Other | — | | | — | | | — | | | — | | | — | | | 1,592 | | | 1,592 | |
| Subordinated liabilities | — | | | — | | | — | | | — | | | — | | | 9,242 | | | 9,242 | |
| Total financial liabilities | 590 | | | 7,641 | | | — | | | 6,828 | | | — | | | 538,175 | | | 553,234 | |
NOTES TO THE ACCOUNTS
for the year ended 31 December 2020
42 FINANCIAL INSTRUMENTS (continued)
| | | | | | | | | | | | | | | | | | | | | | | | | | | | | | | | | | | | | | | | | |
| Derivatives
designated
as hedging
instruments | | Mandatorily held at
fair value through
profit or loss | | Designated
at fair value
through profit
or loss | | At fair value
through other
comprehensive
income | | Held at
amortised
cost | | Total |
| | Held for
trading | | Other | | | | |
| The Group | £m | | £m | | £m | | £m | | £m | | £m | | £m |
| At 31 December 2019 | | | | | | | | | | | | | |
| Financial assets | | | | | | | | | | | | | |
| Cash and balances at central banks | — | | | — | | | — | | | — | | | — | | | 38,880 | | | 38,880 | |
| Items in the course of collection from banks | — | | | — | | | — | | | — | | | — | | | 292 | | | 292 | |
| Financial assets at fair value through profit or loss | — | | | 290 | | | 1,994 | | | — | | | — | | | — | | | 2,284 | |
| Derivative financial instruments | 1,117 | | | 7,377 | | | — | | | — | | | — | | | — | | | 8,494 | |
| Loans and advances to banks | — | | | — | | | — | | | — | | | — | | | 4,852 | | | 4,852 | |
| Loans and advances to customers | — | | | — | | | — | | | — | | | — | | | 474,470 | | | 474,470 | |
| Debt securities | — | | | — | | | — | | | — | | | — | | | 5,325 | | | 5,325 | |
| Due from fellow Lloyds Banking Group undertakings | — | | | — | | | — | | | — | | | — | | | 1,854 | | | 1,854 | |
| Financial assets at amortised cost | — | | | — | | | — | | | — | | | — | | | 486,501 | | | 486,501 | |
| Financial assets at fair value through other comprehensive income | — | | | — | | | — | | | — | | | 24,617 | | | — | | | 24,617 | |
| Total financial assets | 1,117 | | | 7,667 | | | 1,994 | | | — | | | 24,617 | | | 525,673 | | | 561,068 | |
| Financial liabilities | | | | | | | | | | | | | |
| Deposits from banks | — | | | — | | | — | | | — | | | — | | | 23,593 | | | 23,593 | |
| Customer deposits | — | | | — | | | — | | | — | | | — | | | 396,839 | | | 396,839 | |
| Due to fellow Lloyds Banking Group undertakings | — | | | — | | | — | | | — | | | — | | | 4,893 | | | 4,893 | |
| Items in course of transmission to banks | — | | | — | | | — | | | — | | | — | | | 354 | | | 354 | |
| Financial liabilities at fair value through profit or loss | — | | | 171 | | | — | | | 7,531 | | | — | | | — | | | 7,702 | |
| Derivative financial instruments | 1,029 | | | 8,802 | | | — | | | — | | | — | | | — | | | 9,831 | |
| Notes in circulation | — | | | — | | | — | | | — | | | — | | | 1,079 | | | 1,079 | |
| Debt securities in issue | — | | | — | | | — | | | — | | | — | | | 76,431 | | | 76,431 | |
| Other | — | | | — | | | — | | | — | | | — | | | 1,755 | | | 1,755 | |
| Subordinated liabilities | — | | | — | | | — | | | — | | | — | | | 12,586 | | | 12,586 | |
| Total financial liabilities | 1,029 | | | 8,973 | | | — | | | 7,531 | | | — | | | 517,530 | | | 535,063 | |
NOTES TO THE ACCOUNTS
for the year ended 31 December 2020
42 FINANCIAL INSTRUMENTS (continued)
| | | | | | | | | | | | | | | | | | | | | | | | | | | | | | | | | | | | | | | | | |
| Derivatives
designated
as hedging
instruments | | Mandatorily held at
fair value through
profit or loss | | Designated
at fair value
through profit
or loss | | At fair value
through other
comprehensive
income | | Held at
amortised
cost | | Total |
| | Held for
trading | | Other | | | | |
| The Bank | £m | | £m | | £m | | £m | | £m | | £m | | £m |
| At 31 December 2020 | | | | | | | | | | | | | |
| Financial assets | | | | | | | | | | | | | |
| Cash and balances at central banks | — | | | — | | | — | | | — | | | — | | | 45,753 | | | 45,753 | |
| Items in the course of collection from banks | — | | | — | | | — | | | — | | | — | | | 257 | | | 257 | |
| Financial assets at fair value through profit or loss | — | | | 0 | | | 1,724 | | | — | | | — | | | — | | | 1,724 | |
| Derivative financial instruments | 242 | | | 12,353 | | | — | | | — | | | — | | | — | | | 12,595 | |
| Loans and advances to banks | — | | | — | | | — | | | — | | | — | | | 5,656 | | | 5,656 | |
| Loans and advances to customers | — | | | — | | | — | | | — | | | — | | | 178,269 | | | 178,269 | |
| Debt securities | — | | | — | | | — | | | — | | | — | | | 4,315 | | | 4,315 | |
| Due from fellow Lloyds Banking Group undertakings | — | | | — | | | — | | | — | | | — | | | 128,771 | | | 128,771 | |
| Financial assets at amortised cost | — | | | — | | | — | | | — | | | — | | | 317,011 | | | 317,011 | |
| Financial assets at fair value through other comprehensive income | — | | | — | | | — | | | — | | | 24,647 | | | — | | | 24,647 | |
| Total financial assets | 242 | | | 12,353 | | | 1,724 | | | — | | | 24,647 | | | 363,021 | | | 401,987 | |
| Financial liabilities | | | | | | | | | | | | | |
| Deposits from banks | — | | | — | | | — | | | — | | | — | | | 10,304 | | | 10,304 | |
| Customer deposits | — | | | — | | | — | | | — | | | — | | | 264,473 | | | 264,473 | |
| Due to fellow Lloyds Banking Group undertakings | — | | | — | | | — | | | — | | | — | | | 39,836 | | | 39,836 | |
| Items in course of transmission to banks | — | | | — | | | — | | | — | | | — | | | 199 | | | 199 | |
| Financial liabilities at fair value through profit or loss | — | | | 2 | | | — | | | 7,905 | | | — | | | — | | | 7,907 | |
| Derivative financial instruments | 289 | | | 10,783 | | | — | | | — | | | — | | | — | | | 11,072 | |
| Debt securities in issue | — | | | — | | | — | | | — | | | — | | | 48,109 | | | 48,109 | |
| Other | — | | | — | | | — | | | — | | | — | | | 885 | | | 885 | |
| Subordinated liabilities | — | | | — | | | — | | | — | | | — | | | 7,751 | | | 7,751 | |
| Total financial liabilities | 289 | | | 10,785 | | | — | | | 7,905 | | | — | | | 371,557 | | | 390,536 | |
NOTES TO THE ACCOUNTS
for the year ended 31 December 2020
42 FINANCIAL INSTRUMENTS (continued)
| | | | | | | | | | | | | | | | | | | | | | | | | | | | | | | | | | | | | | | | | |
| Derivatives
designated
as hedging
instruments | | Mandatorily held at
fair value through
profit or loss | | Designated
at fair value
through profit
or loss | | At fair value
through other
comprehensive
income | | Held at
amortised
cost | | Total |
| | Held for
trading | | Other | | | | |
| The Bank | £m | | £m | | £m | | £m | | £m | | £m | | £m |
| At 31 December 2019 | | | | | | | | | | | | | |
| Financial assets | | | | | | | | | | | | | |
| Cash and balances at central banks | — | | | — | | | — | | | — | | | — | | | 35,741 | | | 35,741 | |
| Items in the course of collection from banks | — | | | — | | | — | | | — | | | — | | | 252 | | | 252 | |
| Financial assets at fair value through profit or loss | — | | | 290 | | | 413 | | | — | | | — | | | — | | | 703 | |
| Derivative financial instruments | 207 | | | 13,431 | | | — | | | — | | | — | | | — | | | 13,638 | |
| Loans and advances to banks | — | | | — | | | — | | | — | | | — | | | 4,453 | | | 4,453 | |
| Loans and advances to customers | — | | | — | | | — | | | — | | | — | | | 177,569 | | | 177,569 | |
| Debt securities | — | | | — | | | — | | | — | | | — | | | 5,241 | | | 5,241 | |
| Due from fellow Lloyds Banking Group undertakings | — | | | — | | | — | | | — | | | — | | | 202,277 | | | 202,277 | |
| Financial assets at amortised cost | — | | | — | | | — | | | — | | | — | | | 389,540 | | | 389,540 | |
| Financial assets at fair value through other comprehensive income | — | | | — | | | — | | | — | | | 22,160 | | | — | | | 22,160 | |
| Total financial assets | 207 | | | 13,721 | | | 413 | | | — | | | 22,160 | | | 425,533 | | | 462,034 | |
| Financial liabilities | | | | | | | | | | | | | |
| Deposits from banks | — | | | — | | | — | | | — | | | — | | | 7,122 | | | 7,122 | |
| Customer deposits | — | | | — | | | — | | | — | | | — | | | 239,762 | | | 239,762 | |
| Due to fellow Lloyds Banking Group undertakings | — | | | — | | | — | | | — | | | — | | | 109,771 | | | 109,771 | |
| Items in course of transmission to banks | — | | | — | | | — | | | — | | | — | | | 198 | | | 198 | |
| Financial liabilities at fair value through profit or loss | — | | | 213 | | | — | | | 7,484 | | | — | | | — | | | 7,697 | |
| Derivative financial instruments | 267 | | | 13,944 | | | — | | | — | | | — | | | — | | | 14,211 | |
| Debt securities in issue | — | | | — | | | — | | | — | | | — | | | 61,509 | | | 61,509 | |
| Other | — | | | — | | | — | | | — | | | — | | | 975 | | | 975 | |
| Subordinated liabilities | — | | | — | | | — | | | — | | | — | | | 9,909 | | | 9,909 | |
| Total financial liabilities | 267 | | | 14,157 | | | — | | | 7,484 | | | — | | | 429,246 | | | 451,154 | |
NOTES TO THE ACCOUNTS
for the year ended 31 December 2020
42 FINANCIAL INSTRUMENTS (continued)
(2)Fair value measurement
Fair value is the price that would be received to sell an asset or paid to transfer a liability in an orderly transaction between market participants at the measurement date. It is a measure as at a specific date and may be significantly different from the amount which will actually be paid or received on maturity or settlement date.
Wherever possible, fair values have been calculated using unadjusted quoted market prices in active markets for identical instruments held by the Group. Where quoted market prices are not available, or are unreliable because of poor liquidity, fair values have been determined using valuation techniques which, to the extent possible, use market observable inputs, but in some cases use non-market observable inputs. Valuation techniques used include discounted cash flow analysis and pricing models and, where appropriate, comparison to instruments with characteristics similar to those of the instruments held by the Group. The Group measures valuation adjustments for its derivative exposures on the same basis as the derivatives are managed.
The carrying amount of the following financial instruments is a reasonable approximation of fair value: cash and balances at central banks, items in the course of collection from banks, items in course of transmission to banks and notes in circulation.
Because a variety of estimation techniques are employed and significant estimates made, comparisons of fair values between financial institutions may not be meaningful. Readers of these financial statements are thus advised to use caution when using this data to evaluate the Group’s financial position.
Fair value information is not provided for items that are not financial instruments or for other assets and liabilities which are not carried at fair value in the Group’s consolidated balance sheet. These items include intangible assets, such as brands and acquired credit card relationships; premises and equipment; and shareholders’ equity. These items are material and accordingly the Group believes that any fair value information presented would not represent the underlying value of the Group.
Valuation control framework
The key elements of the control framework for the valuation of financial instruments include model validation, product implementation review and independent price verification. These functions are carried out by appropriately skilled risk and finance teams, independent of the business area responsible for the products.
Model validation covers both qualitative and quantitative elements relating to new models. In respect of new products, a product implementation review is conducted pre- and post-trading. Pre-trade testing ensures that the new model is integrated into the Group’s systems and that the profit and loss and risk reporting are consistent throughout the trade life cycle. Post-trade testing examines the explanatory power of the implemented model, actively monitoring model parameters and comparing in-house pricing to external sources. Independent price verification procedures cover financial instruments carried at fair value. The frequency of the review is matched to the availability of independent data, monthly being the minimum. Valuation differences in breach of established thresholds are escalated to senior management. The results from independent pricing and valuation reserves are reviewed monthly by senior management.
Formal committees, consisting of senior risk, finance and business management, meet at least quarterly to discuss and approve valuations in more judgemental areas, in particular for unquoted equities, structured credit, over-the-counter options and the Credit Valuation Adjustment (CVA) reserve.
Valuation of financial assets and liabilities
Assets and liabilities carried at fair value or for which fair values are disclosed have been classified into three levels according to the quality and reliability of information used to determine the fair values.
Level 1
Level 1 fair value measurements are those derived from unadjusted quoted prices in active markets for identical assets or liabilities. Products classified as level 1 predominantly comprise equity shares, treasury bills and other government securities.
Level 2
Level 2 valuations are those where quoted market prices are not available, for example where the instrument is traded in a market that is not considered to be active or valuation techniques are used to determine fair value and where these techniques use inputs that are based significantly on observable market data. Examples of such financial instruments include most over-the-counter derivatives, financial institution issued securities, certificates of deposit and certain asset-backed securities.
Level 3
Level 3 portfolios are those where at least one input which could have a significant effect on the instrument’s valuation is not based on observable market data. Such instruments would include any unlisted equity investments which are valued using various valuation techniques that require significant management judgement in determining appropriate assumptions, including earnings multiples and estimated future cash flows. Certain of the Group’s asset-backed securities and derivatives, principally where there is no trading activity in such securities, are also classified as level 3.
Transfers out of the level 3 portfolio arise when inputs that could have a significant impact on the instrument’s valuation become market observable after previously having been non-market observable. In the case of asset-backed securities this can arise if more than one consistent independent source of data becomes available. Conversely transfers into the portfolio arise when consistent sources of data cease to be available.
NOTES TO THE ACCOUNTS
for the year ended 31 December 2020
42 FINANCIAL INSTRUMENTS (continued)
(3)Financial assets and liabilities carried at fair value
(A)Financial assets, excluding derivatives
Valuation hierarchy
At 31 December 2020, the Group’s financial assets carried at fair value, excluding derivatives, totalled £28,934 million (2019: £26,901 million). The table below analyses these financial assets by balance sheet classification, asset type and valuation methodology (level 1, 2 or 3, as described on page F-98). The fair value measurement approach is recurring in nature. There were no significant transfers between level 1 and 2 during the year.
Valuation hierarchy
| | | | | | | | | | | | | | | | | | | | | | | |
| Level 1 | | Level 2 | | Level 3 | | Total |
| The Group | £m | | £m | | £m | | £m |
| At 31 December 2020 | | | | | | | |
| Financial assets at fair value through profit or loss | | | | | | | |
| Loans and advances to customers | 0 | | | 0 | | | 1,511 | | | 1,511 | |
| Equity shares | 159 | | | 4 | | | 0 | | | 163 | |
| Total financial assets at fair value through profit or loss | 159 | | | 4 | | | 1,511 | | | 1,674 | |
| Financial assets at fair value through other comprehensive income | | | | | | | |
| Debt securities: | | | | | | | |
| Government securities | 14,267 | | | 0 | | | 0 | | | 14,267 | |
| Asset-backed securities | 0 | | | 0 | | | 65 | | | 65 | |
| Corporate and other debt securities | 491 | | | 12,437 | | | 0 | | | 12,928 | |
| 14,758 | | | 12,437 | | | 65 | | | 27,260 | |
| Total financial assets at fair value through other comprehensive income | 14,758 | | | 12,437 | | | 65 | | | 27,260 | |
| Total financial assets carried at fair value, excluding derivatives | 14,917 | | | 12,441 | | | 1,576 | | | 28,934 | |
| | | | | | | | | | | | | | | | | | | | | | | |
| Level 1 | | Level 2 | | Level 3 | | Total |
| The Group | £m | | £m | | £m | | £m |
| At 31 December 2019 | | | | | | | |
| Financial assets at fair value through profit or loss | | | | | | | |
| Loans and advances to customers | 0 | | | 0 | | | 1,782 | | | 1,782 | |
| Debt securities: | | | | | | | |
| Government securities | 290 | | | 0 | | | 0 | | | 290 | |
| Corporate and other debt securities | 0 | | | 0 | | | 47 | | | 47 | |
| 290 | | | 0 | | | 47 | | | 337 | |
| Equity shares | 161 | | | 4 | | | 0 | | | 165 | |
| Total financial assets at fair value through profit or loss | 451 | | | 4 | | | 1,829 | | | 2,284 | |
| Financial assets at fair value through other comprehensive income | | | | | | | |
| Debt securities: | | | | | | | |
| Government securities | 12,844 | | | 238 | | | 0 | | | 13,082 | |
| Asset-backed securities | 0 | | | 0 | | | 60 | | | 60 | |
| Corporate and other debt securities | 0 | | | 11,036 | | | 0 | | | 11,036 | |
| 12,844 | | | 11,274 | | | 60 | | | 24,178 | |
| Treasury and other bills | 439 | | | 0 | | | 0 | | | 439 | |
| Total financial assets at fair value through other comprehensive income | 13,283 | | | 11,274 | | | 60 | | | 24,617 | |
| Total financial assets carried at fair value, excluding derivatives | 13,734 | | | 11,278 | | | 1,889 | | | 26,901 | |
NOTES TO THE ACCOUNTS
for the year ended 31 December 2020
42 FINANCIAL INSTRUMENTS (continued)
Valuation hierarchy
| | | | | | | | | | | | | | | | | | | | | | | |
| Level 1 | | Level 2 | | Level 3 | | Total |
| The Bank | £m | | £m | | £m | | £m |
| At 31 December 2020 | | | | | | | |
| Financial assets at fair value through profit or loss | | | | | | | |
| Loans and advances to customers | 0 | | | 0 | | | 517 | | | 517 | |
| Debt securities: | | | | | | | |
| Government securities | 0 | | | 0 | | | 0 | | | 0 | |
| Corporate and other debt securities | 0 | | | 1,203 | | | 0 | | | 1,203 | |
| 0 | | | 1,203 | | | 0 | | | 1,203 | |
| Equity shares | 0 | | | 4 | | | 0 | | | 4 | |
| Total financial assets at fair value through profit or loss | 0 | | | 1,207 | | | 517 | | | 1,724 | |
| Financial assets at fair value through other comprehensive income | | | | | | | |
| Debt securities: | | | | | | | |
| Government securities | 14,114 | | | 0 | | | 0 | | | 14,114 | |
| Corporate and other debt securities | 491 | | | 10,042 | | | 0 | | | 10,533 | |
| 14,605 | | | 10,042 | | | 0 | | | 24,647 | |
| Total financial assets at fair value through other comprehensive income | 14,605 | | | 10,042 | | | 0 | | | 24,647 | |
| Total financial assets carried at fair value, excluding derivatives | 14,605 | | | 11,249 | | | 517 | | | 26,371 | |
| | | | | | | | | | | | | | | | | | | | | | | |
| Level 1 | | Level 2 | | Level 3 | | Total |
| The Bank | £m | | £m | | £m | | £m |
| At 31 December 2019 | | | | | | | |
| Financial assets at fair value through profit or loss | | | | | | | |
| Loans and advances to customers | 0 | | | 0 | | | 362 | | | 362 | |
| Debt securities: | | | | | | | |
| Government securities | 290 | | | 0 | | | 0 | | | 290 | |
| Corporate and other debt securities | 0 | | | 0 | | | 47 | | | 47 | |
| 290 | | | 0 | | | 47 | | | 337 | |
| Equity shares | 0 | | | 4 | | | 0 | | | 4 | |
| Total financial assets at fair value through profit or loss | 290 | | | 4 | | | 409 | | | 703 | |
| Financial assets at fair value through other comprehensive income | | | | | | | |
| Debt securities: | | | | | | | |
| Government securities | 12,700 | | | 238 | | | 0 | | | 12,938 | |
| Corporate and other debt securities | 0 | | | 8,783 | | | 0 | | | 8,783 | |
| 12,700 | | | 9,021 | | | 0 | | | 21,721 | |
| Treasury and other bills | 439 | | | 0 | | | 0 | | | 439 | |
| Total financial assets at fair value through other comprehensive income | 13,139 | | | 9,021 | | | 0 | | | 22,160 | |
| Total financial assets carried at fair value, excluding derivatives | 13,429 | | | 9,025 | | | 409 | | | 22,863 | |
NOTES TO THE ACCOUNTS
for the year ended 31 December 2020
42 FINANCIAL INSTRUMENTS (continued)
Movements in level 3 portfolio
The table below analyses movements in level 3 financial assets, excluding derivatives, carried at fair value (recurring measurement).
| | | | | | | | | | | | | | | | | | | | | | | |
| 2020 | | 2019 |
| Financial
assets at fair
value through
profit or loss | Financial
assets at
fair value
through other
comprehensive
income | Total level 3
assets carried
at fair value,
excluding
derivatives
(recurring
basis) | | Financial
assets at fair
value through
profit or loss | Financial
assets at
fair value
through other
comprehensive
income | Total level 3
assets carried
at fair value,
excluding
derivatives
(recurring
basis) |
| The Group | £m | £m | £m | | £m | £m | £m |
| At 1 January | 1,829 | | 60 | | 1,889 | | | 2,721 | | 53 | | 2,774 | |
| Exchange and other adjustments | 85 | | 3 | | 88 | | | (74) | | (3) | | (77) | |
| Gains recognised in the income statement within other income | 20 | | — | | 20 | | | 4 | | — | | 4 | |
| Gains recognised in other comprehensive income within the revaluation reserve in respect of financial assets at fair value through other comprehensive income | — | | 4 | | 4 | | | — | | 11 | | 11 | |
| Purchases/increases to customer loans | 303 | | 0 | | 303 | | | 686 | | 0 | | 686 | |
| Sales/repayments of customer loans | (677) | | (2) | | (679) | | | (1,956) | | (1) | | (1,957) | |
| Transfers into the level 3 portfolio | 0 | | 0 | | 0 | | | 448 | | 0 | | 448 | |
| Transfers out of the level 3 portfolio | (49) | | 0 | | (49) | | | 0 | | 0 | | 0 | |
| At 31 December | 1,511 | | 65 | | 1,576 | | | 1,829 | | 60 | | 1,889 | |
| Gains (losses) recognised in the income statement, within other income, relating to the change in fair value of those assets held at 31 December | 103 | | — | | 103 | | | (76) | | — | | (76) | |
| | | | | | | | | | | | | | | | | | | | | | | |
| 2020 | | 2019 |
| Financial
assets at fair
value through
profit or loss | Financial
assets at
fair value
through other
comprehensive
income | Total level 3
assets carried
at fair value,
excluding
derivatives
(recurring
basis) | | Financial
assets at fair
value through
profit or loss | Financial
assets at
fair value
through other
comprehensive
income | Total level 3
assets carried
at fair value,
excluding
derivatives
(recurring
basis) |
| The Bank | £m | £m | £m | | £m | £m | £m |
| At 1 January | 409 | | 0 | | 409 | | | 890 | | 0 | | 890 | |
| Exchange and other adjustments | 101 | | 0 | | 101 | | | (28) | | 0 | | (28) | |
| Gains recognised in the income statement within other income | 5 | | — | | 5 | | | 0 | | — | | 0 | |
| | | | | | | |
| Purchases/increases to customer loans | 258 | | 0 | | 258 | | | 101 | | 0 | | 101 | |
| Sales/repayments of customer loans | (207) | | 0 | | (207) | | | (603) | | 0 | | (603) | |
| Transfers into the level 3 portfolio | 0 | | 0 | | 0 | | | 49 | | 0 | | 49 | |
| Transfers out of the level 3 portfolio | (49) | | 0 | | (49) | | | 0 | | 0 | | 0 | |
| At 31 December | 517 | | 0 | | 517 | | | 409 | | 0 | | 409 | |
| Gains (losses) recognised in the income statement, within other income, relating to the change in fair value of those assets held at 31 December | 106 | | — | | 106 | | | (28) | | — | | (28) | |
Valuation methodology for financial assets, excluding derivatives
Loans and advances to customers and banks
The fair value of these assets is determined using discounted cash flow techniques. The discount rates are derived from market observable interest rates, a risk margin that reflects loan credit ratings and an incremental illiquidity premium based on historical spreads at origination on similar loans.
Debt securities
Debt securities measured at fair value and classified as level 2 are valued by discounting expected cash flows using an observable credit spread applicable to the particular instrument.
Where there is limited trading activity in debt securities, the Group uses valuation models, consensus pricing information from third party pricing services and broker or lead manager quotes to determine an appropriate valuation. Debt securities are classified as level 3 if there is a significant valuation input that cannot be corroborated through market sources or where there are materially inconsistent values for an input. Asset classes classified as level 3 mainly comprise certain collateralised loan obligations and collateralised debt obligations.
NOTES TO THE ACCOUNTS
for the year ended 31 December 2020
42 FINANCIAL INSTRUMENTS (continued)
(B)Financial liabilities, excluding derivatives
Valuation hierarchy
At 31 December 2020, the Group’s financial liabilities carried at fair value, excluding derivatives, comprised its financial liabilities at fair value through profit or loss and totalled £6,831 million (2019: £7,702 million). The table below analyses these financial liabilities by balance sheet classification and valuation methodology (level 1, 2 or 3, as described on page F-98). The fair value measurement approach is recurring in nature. There were no significant transfers between level 1 and 2 during the year.
| | | | | | | | | | | | | | | | | | | | | | | |
| Level 1 | | Level 2 | | Level 3 | | Total |
| The Group | £m | | £m | | £m | | £m |
| At 31 December 2020 | | | | | | | |
| Financial liabilities at fair value through profit or loss | | | | | | | |
| Liabilities designated at fair value through profit or loss | 0 | | | 6,783 | | | 45 | | | 6,828 | |
| Trading liabilities: | | | | | | | |
| Other deposits | 0 | | | 2 | | | 0 | | | 2 | |
| Short positions in securities | 1 | | | 0 | | | 0 | | | 1 | |
| 1 | | | 2 | | | 0 | | | 3 | |
| Total financial liabilities carried at fair value, excluding derivatives | 1 | | | 6,785 | | | 45 | | | 6,831 | |
| | | | | | | | | | | | | | | | | | | | | | | |
| Level 1 | | Level 2 | | Level 3 | | Total |
| The Group | £m | | £m | | £m | | £m |
| At 31 December 2019 | | | | | | | |
| Financial liabilities at fair value through profit or loss | | | | | | | |
| Liabilities designated at fair value through profit or loss | 0 | | | 7,484 | | | 47 | | | 7,531 | |
| Trading liabilities: | | | | | | | |
| Other deposits | 0 | | | 98 | | | 0 | | | 98 | |
| Short positions in securities | 73 | | | 0 | | | 0 | | | 73 | |
| 73 | | | 98 | | | 0 | | | 171 | |
| Total financial liabilities carried at fair value, excluding derivatives | 73 | | | 7,582 | | | 47 | | | 7,702 | |
| | | | | | | | | | | | | | | | | | | | | | | |
| Level 1 | | Level 2 | | Level 3 | | Total |
| The Bank | £m | | £m | | £m | | £m |
| At 31 December 2020 | | | | | | | |
| Financial liabilities at fair value through profit or loss | | | | | | | |
| Liabilities designated at fair value through profit or loss | 0 | | | 7,905 | | | 0 | | | 7,905 | |
| Trading liabilities: | | | | | | | |
| Other deposits | 0 | | | 2 | | | 0 | | | 2 | |
| Short positions in securities | 0 | | | 0 | | | 0 | | | 0 | |
| 0 | | | 2 | | | 0 | | | 2 | |
| Total financial liabilities carried at fair value, excluding derivatives | 0 | | | 7,907 | | | 0 | | | 7,907 | |
| | | | | | | | | | | | | | | | | | | | | | | |
| Level 1 | | Level 2 | | Level 3 | | Total |
| The Bank | £m | | £m | | £m | | £m |
| At 31 December 2019 | | | | | | | |
| Financial liabilities at fair value through profit or loss | | | | | | | |
| Liabilities designated at fair value through profit or loss | 0 | | | 7,484 | | | 0 | | | 7,484 | |
| Trading liabilities: | | | | | | | |
| | | | | | | |
| Other deposits | 0 | | | 140 | | | 0 | | | 140 | |
| Short positions in securities | 73 | | | 0 | | | 0 | | | 73 | |
| 73 | | | 140 | | | 0 | | | 213 | |
| Total financial liabilities carried at fair value, excluding derivatives | 73 | | | 7,624 | | | 0 | | | 7,697 | |
NOTES TO THE ACCOUNTS
for the year ended 31 December 2020
42 FINANCIAL INSTRUMENTS (continued)
The table below analyses movements in the level 3 financial liabilities portfolio, excluding derivatives.
| | | | | | | | |
| 2020 | 2019 |
| The Group | £m | £m |
| At 1 January | 47 | | 0 | |
| Gains recognised in the income statement within other income | 0 | | 1 | |
| Redemptions | (2) | | (5) | |
| Transfers into the level 3 portfolio | 0 | | 51 | |
| Transfers out of the level 3 portfolio | 0 | | 0 | |
| At 31 December | 45 | | 47 | |
| Gains recognised in the income statement, within other income, relating to the change in fair value of those liabilities held at 31 December | 0 | | 0 | |
Valuation methodology for financial liabilities, excluding derivatives
Liabilities held at fair value through profit or loss
These principally comprise debt securities in issue which are classified as level 2 and their fair value is determined using techniques whose inputs are based on observable market data. The carrying amount of the securities is adjusted to reflect the effect of changes in own credit spreads and the resulting gain or loss is recognised in other comprehensive income.
At 31 December 2020, the own credit adjustment arising from the fair valuation of £6,828 million (2019: £7,531 million) of the Group’s debt securities in issue designated at fair value through profit or loss resulted in a loss of £75 million (2019: loss of £419 million), before tax, recognised in other comprehensive income.
Trading liabilities in respect of securities sold under repurchase agreements
The fair value of these liabilities is determined using discounted cash flow techniques. The discount rates are derived from observable repo curves specific to the type of security sold under the repurchase agreement.
(C)Derivatives
All of the Group’s derivative assets and liabilities are carried at fair value. At 31 December 2020, such assets totalled £8,341 million for the Group and £12,595 million for the Bank (2019: £8,494 million for the Group and £13,638 million for the Bank) and liabilities totalled £8,228 million for the Group and £11,072 million for the Bank (2019: £9,831 million for the Group and £14,211 million for the Bank). The table below analyses these derivative balances by valuation methodology (level 1, 2 or 3, as described on page F-98). The fair value measurement approach is recurring in nature. There were no significant transfers between level 1 and level 2 during the year.
| | | | | | | | | | | | | | | | | | | | | | | | | | | | | |
| 2020 | | 2019 |
| Level 1 | Level 2 | Level 3 | Total | | Level 1 | Level 2 | Level 3 | Total |
| The Group | £m | £m | £m | £m | | £m | £m | £m | £m |
| Derivative assets | 0 | | 8,327 | | 14 | | 8,341 | | | 0 | | 8,494 | | 0 | | 8,494 | |
| Derivative liabilities | 0 | | (7,909) | | (319) | | (8,228) | | | 0 | | (9,534) | | (297) | | (9,831) | |
| | | | | | | | | | | | | | | | | | | | | | | | | | | | | |
| 2020 | | 2019 |
| Level 1 | Level 2 | Level 3 | Total | | Level 1 | Level 2 | Level 3 | Total |
| The Bank | £m | £m | £m | £m | | £m | £m | £m | £m |
| Derivative assets | 0 | | 12,581 | | 14 | | 12,595 | | | 0 | | 13,638 | | 0 | | 13,638 | |
| Derivative liabilities | 0 | | (11,012) | | (60) | | (11,072) | | | 0 | | (14,211) | | 0 | | (14,211) | |
Where the Group’s derivative assets and liabilities are not traded on an exchange, they are valued using valuation techniques, including discounted cash flow and options pricing models, as appropriate. The types of derivatives classified as level 2 and the valuation techniques used include:
–Interest rate swaps which are valued using discounted cash flow models; the most significant inputs into those models are interest rate yield curves which are developed from publicly quoted rates.
–Foreign exchange derivatives that do not contain options which are priced using rates available from publicly quoted sources.
–Credit derivatives which are valued using standard models with observable inputs, except for the items classified as level 3, which are valued using publicly available yield and credit default swap (CDS) curves.
–Less complex interest rate and foreign exchange option products which are valued using volatility surfaces developed from publicly available interest rate cap, interest rate swaption and other option volatilities; option volatility skew information is derived from a market standard consensus pricing service. For more complex option products, the Group calibrates its models using observable at-the-money data; where necessary, the Group adjusts for out-of-the-money positions using a market standard consensus pricing service.
Complex interest rate and foreign exchange products where inputs to the valuation are significant and unobservable are classified as level 3.
Where credit protection, usually in the form of credit default swaps, has been purchased or written on asset-backed securities, the security is referred to as a negative basis asset-backed security and the resulting derivative assets or liabilities have been classified as either level 2 or level 3 according to the classification of the underlying asset-backed security.
Certain unobservable inputs used to calculate CVA, FVA, and own credit adjustments, are not significant in determining the classification of the derivative and debt instruments. Consequently, these inputs do not form part of the level 3 sensitivities presented.
NOTES TO THE ACCOUNTS
for the year ended 31 December 2020
42 FINANCIAL INSTRUMENTS (continued)
The table below analyses movements in level 3 derivative assets and liabilities carried at fair value.
| | | | | | | | | | | | | | | | | |
| 2020 | | 2019 |
| Derivative
assets | Derivative
liabilities | | Derivative
assets | Derivative
liabilities |
| The Group | £m | £m | | £m | £m |
| At 1 January | 0 | | (297) | | | 5 | | (8) | |
| Exchange and other adjustments | 0 | | 0 | | | 0 | | 0 | |
| Losses (gains) recognised in the income statement within other income | 1 | | 0 | | | 0 | | 0 | |
| (Sales) redemptions | 0 | | 19 | | | 0 | | 47 | |
| Transfers into the level 3 portfolio | 13 | | (41) | | | 0 | | (344) | |
| Transfers out of the level 3 portfolio | 0 | | 0 | | | (5) | | 8 | |
| At 31 December | 14 | | (319) | | | 0 | | (297) | |
| Gains (losses) recognised in the income statement, within other income, relating to the change in fair value of those assets or liabilities held at 31 December | 1 | | 0 | | | 0 | | 0 | |
| | | | | | | | | | | | | | | | | |
| 2020 | | 2019 |
| Derivative
assets | Derivative
liabilities | | Derivative
assets | Derivative
liabilities |
| The Bank | £m | £m | | £m | £m |
| At 1 January | 0 | | 0 | | | 5 | | (8) | |
| Exchange and other adjustments | 0 | | 0 | | | 0 | | 0 | |
| Losses (gains) recognised in the income statement within other income | 1 | | (8) | | | 0 | | 0 | |
| (Sales) redemptions | 0 | | 0 | | | 0 | | 0 | |
| Transfers into the level 3 portfolio | 13 | | (52) | | | 0 | | 0 | |
| Transfers out of the level 3 portfolio | 0 | | 0 | | | (5) | | 8 | |
| At 31 December | 14 | | (60) | | | 0 | | — | |
| Gains (losses) recognised in the income statement, within other income, relating to the change in fair value of those assets or liabilities held at 31 December | 1 | | (8) | | | 0 | | 0 | |
Derivative valuation adjustments
Derivative financial instruments which are carried in the balance sheet at fair value are adjusted where appropriate to reflect credit risk, market liquidity and other risks.
(i)Uncollateralised derivative valuation adjustments
The following table summarises the movement on this valuation adjustment account for the Group during 2019 and 2020:
| | | | | | | | |
| 2020 | 2019 |
| £m | £m |
| At 1 January | 214 | | 272 | |
| Income statement charge (credit) | 28 | | (56) | |
| Transfers | 0 | | (2) | |
| At 31 December | 242 | | 214 | |
Represented by:
| | | | | | | | |
| 2020 | 2019 |
| £m | £m |
| Credit Valuation Adjustment | 178 | | 141 | |
| Debit Valuation Adjustment | (6) | | (5) | |
| Funding Valuation Adjustment | 70 | | 78 | |
| 242 | | 214 | |
Credit and Debit Valuation Adjustments (CVA and DVA) are applied to the Group’s over-the-counter derivative exposures with counterparties that are not subject to strong interbank collateral arrangements. These exposures largely relate to the provision of risk management solutions for corporate customers within the Commercial Banking division.
A CVA is taken where the Group has a positive future uncollateralised exposure (asset). A DVA is taken where the Group has a negative future uncollateralised exposure (liability). These adjustments reflect interest rates and expectations of counterparty creditworthiness and the Group’s own credit spread respectively.
NOTES TO THE ACCOUNTS
for the year ended 31 December 2020
42 FINANCIAL INSTRUMENTS (continued)
The CVA is sensitive to:
–the current size of the mark-to-market position on the uncollateralised asset;
–expectations of future market volatility of the underlying asset; and
–expectations of counterparty creditworthiness.
Market Credit Default Swap (CDS) spreads are used to develop the probability of default for quoted counterparties. For unquoted counterparties, internal credit ratings and market sector CDS curves and recovery rates are used. The Loss Given Default (LGD) is based on market recovery rates and internal credit assessments.
The combination of a one notch deterioration in the credit rating of derivative counterparties and a ten per cent increase in LGD increases the CVA by £46 million. Current market value is used to estimate the projected exposure for products not supported by the model, which are principally complex interest rate options that are traded in very low volumes. For these, the CVA is calculated on an add-on basis (although no such adjustment was required at 31 December 2020).
The DVA is sensitive to:
–the current size of the mark-to-market position on the uncollateralised liability;
–expectations of future market volatility of the underlying liability; and
–the Group’s own CDS spread.
A 1 per cent rise in the CDS spread would lead to an increase in the DVA of £14 million.
The risk exposures that are used for the CVA and DVA calculations are strongly influenced by interest rates. Due to the nature of the Group’s business the CVA/DVA exposures tend to be on average the same way around such that the valuation adjustments fall when interest rates rise. A one per cent rise in interest rates would lead to a £56 million fall in the overall valuation adjustment to £116 million. The CVA model used by the Group does not assume any correlation between the level of interest rates and default rates.
The Group has also recognised a Funding Valuation Adjustment to adjust for the net cost of funding uncollateralised derivative positions. This adjustment is calculated on the expected future exposure discounted at a suitable cost of funds. A ten basis points increase in the cost of funds will increase the funding valuation adjustment by approximately £12 million.
(ii)Market liquidity
The Group includes mid to bid-offer valuation adjustments against the expected cost of closing out the net market risk in the Group’s trading positions within a timeframe that is consistent with historical trading activity and spreads that the trading desks have accessed historically during the ordinary course of business in normal market conditions.
At 31 December 2020, the Group’s derivative trading business held mid to bid-offer valuation adjustments of £26 million (2019: £20 million).
NOTES TO THE ACCOUNTS
for the year ended 31 December 2020
42 FINANCIAL INSTRUMENTS (continued)
(D)Sensitivity of level 3 valuations
| | | | | | | | | | | | | | | | | | | | | | | | | | | | | | | | | | | |
| | | At 31 December 2020 | | At 31 December 2019 |
| | | | Effect of reasonably possible alternative assumptions2 | | | Effect of reasonably possible alternative assumptions2 |
| Valuation
techniques | Significant
unobservable inputs1 | Carrying
value | Favourable
changes | Unfavourable
changes | | Carrying
value | Favourable
changes | | Unfavourable
changes |
| £m | £m | | £m | | £m | £m | | £m |
| Financial assets at fair value through profit or loss: |
| Loans and advances to customers | Discounted cash flows | Interest rate spreads (bps) (-50bps/+106bps)3 | 1,511 | | 47 | | | (45) | | | 1,782 | | 36 | | | (39) | |
| Debt securities | Discounted cash flows | Credit spreads4 | 0 | | 0 | | | 0 | | | 47 | | 0 | | | 0 | |
| | | 1,511 | | | | | | 1,829 | | | | |
| Financial assets at fair value through other comprehensive income |
| Asset-backed securities | Lead manager or broker quote/consensus pricing | n/a | 65 | | 4 | | | (4) | | | 60 | | 4 | | | (4) | |
| | | 65 | | | | | | 60 | | | | |
| Derivative financial assets |
| Interest rate derivatives | Option pricing model | Interest rate volatility (13%/128%) | 14 | | 0 | | | 0 | | | 0 | | 0 | | | 0 | |
| | | 14 | | | | | | 0 | | | | |
| Level 3 financial assets carried at fair value | 1,590 | | | | | | 1,889 | | | | |
| Financial liabilities at fair value through profit or loss | Discounted cash flows | Interest rate spreads (+/-50bps)5 | 45 | | 1 | | | (1) | | | 47 | | 1 | | | (1) | |
| Derivative financial liabilities |
| Interest rate derivatives | Option pricing model | Interest rate volatility (33%/60%) | 48 | | 0 | | | 0 | | | 0 | | 0 | | | 0 | |
| Shared appreciation right | Market values – property valuation | HPI (+/-1%)6 | 271 | | 24 | | | (22) | | | 297 | | 17 | | | (17) | |
| | | 319 | | | | | | 297 | | | | |
| Level 3 financial liabilities carried at fair value | 364 | | | | | | 344 | | | | |
1Ranges are shown where appropriate and represent the highest and lowest inputs used in the level 3 valuations.
2Where the exposure to an unobservable input is managed on a net basis, only the net impact is shown in the table.
32019: 50bps/102bps
42019:+/- 3%
52019:+/- 50bps
62019:+/- 5%
NOTES TO THE ACCOUNTS
for the year ended 31 December 2020
42 FINANCIAL INSTRUMENTS (continued)
Unobservable inputs
Significant unobservable inputs affecting the valuation of debt securities and derivatives are as follows:
–Interest rates and inflation rates are referenced in some derivatives where the payoff that the holder of the derivative receives depends on the behaviour of those underlying references through time.
–Credit spreads represent the premium above the benchmark reference instrument required to compensate for lower credit quality; higher spreads lead to a lower fair value.
–Volatility parameters represent key attributes of option behaviour; higher volatilities typically denote a wider range of possible outcomes.
Reasonably possible alternative assumptions
Valuation techniques applied to many of the Group’s level 3 instruments often involve the use of two or more inputs whose relationship is interdependent. The calculation of the effect of reasonably possible alternative assumptions included in the table above reflects such relationships.
Debt securities
Reasonably possible alternative assumptions have been determined in respect of the Group’s structured credit investment by flexing credit spreads.
Derivatives
Reasonably possible alternative assumptions have been determined in respect of swaptions in the Group’s derivative portfolios which are priced using industry standard option pricing models. Such models require interest rate volatilities which may be unobservable at longer maturities. To derive reasonably possible alternative valuations these volatilities have been flexed within a range.
NOTES TO THE ACCOUNTS
for the year ended 31 December 2020
42 FINANCIAL INSTRUMENTS (continued)
(4)Financial assets and liabilities carried at amortised cost
(A)Financial assets
Valuation hierarchy
The table below analyses the fair values of the financial assets of the Group which are carried at amortised cost by valuation methodology (level 1, 2 or 3, as described on page F-98). Financial assets carried at amortised cost are mainly classified as level 3 due to significant unobservable inputs used in the valuation models. Where inputs are observable, debt securities are classified as level 1 or 2.
| | | | | | | | | | | | | | | | | |
| | | Valuation hierarchy |
| Carrying value | Fair value | Level 1 | Level 2 | Level 3 |
| The Group | £m | £m | £m | £m | £m |
| At 31 December 2020 | | | | | |
| Financial assets at amortised cost: | | | | | |
| Loans and advances to customers | 480,141 | | 479,518 | | 0 | | 54,447 | | 425,071 | |
| Loans and advances to banks | 5,950 | | 5,949 | | 0 | | 1,626 | | 4,323 | |
| Debt securities | 5,137 | | 5,129 | | 0 | | 5,129 | | 0 | |
| Due from fellow Lloyds Banking Group undertakings | 738 | | 738 | | 0 | | 0 | | 738 | |
| Reverse repos included in above amounts: | | | | | |
| Loans and advances to customers | 54,447 | | 54,447 | | 0 | | 54,447 | | 0 | |
| Loans and advances to banks | 1,626 | | 1,626 | | 0 | | 1,626 | | 0 | |
| At 31 December 2019 | | | | | |
| Financial assets at amortised cost: | | | | | |
| Loans and advances to customers | 474,470 | | 475,128 | | 0 | | 51,624 | | 423,504 | |
| Loans and advances to banks | 4,852 | | 4,849 | | 0 | | 408 | | 4,441 | |
| Debt securities | 5,325 | | 5,317 | | 0 | | 5,317 | | 0 | |
| Due from fellow Lloyds Banking Group undertakings | 1,854 | | 1,854 | | 0 | | 0 | | 1,854 | |
| Reverse repos included in above amounts: | | | | | |
| Loans and advances to customers | 51,624 | | 51,624 | | 0 | | 51,624 | | 0 | |
| Loans and advances to banks | 408 | | 408 | | 0 | | 408 | | 0 | |
| | | | | | | | | | | | | | | | | |
| Carrying value | Fair value | Valuation hierarchy |
| Level 1 | Level 2 | Level 3 |
| The Bank | £m | £m | £m | £m | £m |
| At 31 December 2020 | | | | | |
| Financial assets at amortised cost: | | | | | |
| Loans and advances to customers | 178,269 | | 176,523 | | 0 | | 54,447 | | 122,076 | |
| Loans and advances to banks | 5,656 | | 5,655 | | 0 | | 1,626 | | 4,029 | |
| Debt securities | 4,315 | | 4,315 | | 0 | | 4,315 | | 0 | |
| Due from fellow Lloyds Banking Group undertakings | 128,771 | | 128,771 | | 0 | | 0 | | 128,771 | |
| Reverse repos included in above amounts: | | | | | |
| Loans and advances to customers | 54,447 | | 54,447 | | 0 | | 54,447 | | 0 | |
| Loans and advances to banks | 1,626 | | 1,626 | | 0 | | 1,626 | | 0 | |
| At 31 December 2019 | | | | | |
| Financial assets at amortised cost: | | | | | |
| Loans and advances to customers | 177,569 | | 175,200 | | 0 | | 51,624 | | 123,576 | |
| Loans and advances to banks | 4,453 | | 4,450 | | 0 | | 408 | | 4,042 | |
| Debt securities | 5,241 | | 5,242 | | 0 | | 5,242 | | 0 | |
| Due from fellow Lloyds Banking Group undertakings | 202,277 | | 202,277 | | 0 | | 0 | | 202,277 | |
| Reverse repos included in above amounts: | | | | | |
| Loans and advances to customers | 51,624 | | 51,624 | | 0 | | 51,624 | | 0 | |
| Loans and advances to banks | 408 | | 408 | | 0 | | 408 | | 0 | |
NOTES TO THE ACCOUNTS
for the year ended 31 December 2020
42 FINANCIAL INSTRUMENTS (continued)
Valuation methodology
Loans and advances to customers
The Group provides loans and advances to commercial, corporate and personal customers at both fixed and variable rates. Due to their short-term nature, the carrying value of the variable rate loans and those relating to lease financing is assumed to be their fair value.
To determine the fair value of loans and advances to customers, loans are segregated into portfolios of similar characteristics. A number of techniques are used to estimate the fair value of fixed rate lending; these take account of expected credit losses based on historic trends, prevailing market interest rates and expected future cash flows. For retail exposures, fair value is usually estimated by discounting anticipated cash flows (including interest at contractual rates) at market rates for similar loans offered by the Group and other financial institutions. Certain loans secured on residential properties are made at a fixed rate for a limited period, typically two to five years, after which the loans revert to the relevant variable rate. The fair value of such loans is estimated by reference to the market rates for similar loans of maturity equal to the remaining fixed interest rate period. The fair value of commercial loans is estimated by discounting anticipated cash flows at a rate which reflects the effects of interest rate changes, adjusted for changes in credit risk.
Loans and advances to banks
The carrying value of short-dated loans and advances to banks is assumed to be their fair value. The fair value of loans and advances to banks is estimated by discounting the anticipated cash flows at a market discount rate adjusted for the credit spread of the obligor or, where not observable, the credit spread of borrowers of similar credit quality.
Debt securities
The fair values of debt securities are determined predominantly from lead manager quotes and, where these are not available, by alternative techniques including reference to credit spreads on similar assets with the same obligor, market standard consensus pricing services, broker quotes and other research data.
Reverse repurchase agreements
The carrying amount is deemed a reasonable approximation of fair value given the short-term nature of these instruments.
NOTES TO THE ACCOUNTS
for the year ended 31 December 2020
42 FINANCIAL INSTRUMENTS (continued)
(B)Financial liabilities
Valuation hierarchy
The table below analyses the fair values of the financial liabilities of the Group which are carried at amortised cost by valuation methodology (level 1, 2 or 3, as described on page F-98).
| | | | | | | | | | | | | | | | | |
| | | Valuation hierarchy |
| Carrying value | Fair value | Level 1 | Level 2 | Level 3 |
| The Group | £m | £m | £m | £m | £m |
| At 31 December 2020 | | | | | |
| Deposits from banks | 24,997 | | 24,998 | | 0 | | 24,998 | | 0 | |
| Customer deposits | 434,569 | | 434,740 | | 0 | | 427,663 | | 7,077 | |
| Due to fellow Lloyds Banking Group undertakings | 6,875 | | 6,875 | | 0 | | 6,875 | | 0 | |
| Debt securities in issue | 59,293 | | 62,931 | | 0 | | 62,931 | | 0 | |
| Subordinated liabilities | 9,242 | | 10,275 | | 0 | | 10,275 | | 0 | |
| Repos included in above amounts: | | | | | |
| Deposits from banks | 18,767 | | 18,767 | | 0 | | 18,767 | | 0 | |
| Customer deposits | 9,417 | | 9,417 | | 0 | | 9,417 | | 0 | |
| At 31 December 2019 | | | | | |
| Deposits from banks | 23,593 | | 23,497 | | 0 | | 23,497 | | 0 | |
| Customer deposits | 396,839 | | 397,222 | | 0 | | 391,987 | | 5,235 | |
| Due to fellow Lloyds Banking Group undertakings | 4,893 | | 4,893 | | 0 | | 4,893 | | 0 | |
| Debt securities in issue | 76,431 | | 78,632 | | 0 | | 78,632 | | 0 | |
| Subordinated liabilities | 12,586 | | 14,542 | | 0 | | 14,542 | | 0 | |
| Repos included in above amounts: | | | | | |
| Deposits from banks | 18,105 | | 18,105 | | 0 | | 18,105 | | 0 | |
| Customer deposits | 9,530 | | 9,530 | | 0 | | 9,530 | | 0 | |
| | | | | | | | | | | | | | | | | |
| | | Valuation hierarchy |
| Carrying value | Fair value | Level 1 | Level 2 | Level 3 |
| The Bank | £m | £m | £m | £m | £m |
| At 31 December 2020 | | | | | |
| Deposits from banks | 10,304 | | 10,304 | | 0 | | 10,304 | | 0 | |
| Customer deposits | 264,473 | | 264,497 | | 0 | | 264,497 | | 0 | |
| Due to fellow Lloyds Banking Group undertakings | 39,836 | | 39,836 | | 0 | | 39,836 | | 0 | |
| Debt securities in issue | 48,109 | | 50,824 | | 0 | | 50,824 | | 0 | |
| Subordinated liabilities | 7,751 | | 8,387 | | 0 | | 8,387 | | 0 | |
| Repos included in above amounts: | | | | | |
| Deposits from banks | 5,087 | | 5,087 | | 0 | | 5,087 | | 0 | |
| Customer deposits | 9,417 | | 9,417 | | 0 | | 9,417 | | 0 | |
| At 31 December 2019 | | | | | |
| Deposits from banks | 7,122 | | 7,025 | | 0 | | 7,025 | | 0 | |
| Customer deposits | 239,762 | | 239,952 | | 0 | | 239,952 | | 0 | |
| Due to fellow Lloyds Banking Group undertakings | 109,771 | | 109,771 | | 0 | | 109,771 | | 0 | |
| Debt securities in issue | 61,509 | | 63,483 | | 0 | | 63,483 | | 0 | |
| Subordinated liabilities | 9,909 | | 10,974 | | 0 | | 10,974 | | 0 | |
| Repos included in above amounts: | | | | | |
| Deposits from banks | 2,645 | | 2,645 | | 0 | | 2,645 | | 0 | |
| Customer deposits | 9,530 | | 9,530 | | 0 | | 9,530 | | 0 | |
NOTES TO THE ACCOUNTS
for the year ended 31 December 2020
42 FINANCIAL INSTRUMENTS (continued)
Valuation methodology
Deposits from banks and customer deposits
The fair value of bank and customer deposits repayable on demand is assumed to be equal to their carrying value.
The fair value for all other deposits is estimated using discounted cash flows applying either market rates, where applicable, or current rates for deposits of similar remaining maturities.
Debt securities in issue
The fair value of short-term debt securities in issue is approximately equal to their carrying value. Fair value for other debt securities is calculated based on quoted market prices where available. Where quoted market prices are not available, fair value is estimated using discounted cash flow techniques at a rate which reflects market rates of interest and the Group’s own credit spread.
Subordinated liabilities
The fair value of subordinated liabilities is determined by reference to quoted market prices where available or by reference to quoted market prices of similar instruments. Subordinated liabilities are classified as level 2, since the inputs used to determine their fair value are largely observable.
Repurchase agreements
The carrying amount is deemed a reasonable approximation of fair value given the short-term nature of these instruments.
(5)Reclassifications of financial assets
There have been no reclassifications of financial assets in 2019 or 2020.
NOTES TO THE ACCOUNTS
for the year ended 31 December 2020
43 TRANSFERS OF FINANCIAL ASSETS
There were no significant transferred financial assets which were derecognised in their entirety, but with ongoing exposure. Details of transferred financial assets that continue to be recognised in full are as follows.
The Group and the Bank enter into repurchase and securities lending transactions in the normal course of business that do not result in derecognition of the financial assets as substantially all of the risks and rewards, including credit, interest rate, prepayment and other price risks are retained by the Group. In all cases, the transferee has the right to sell or repledge the assets concerned.
As set out in note 26, included within financial assets measured at amortised cost are loans transferred under the Group’s securitisation and covered bond programmes. As the Group retains all or a majority of the risks and rewards associated with these loans, including credit, interest rate, prepayment and liquidity risk, they remain on the Group’s balance sheet. Assets transferred into the Group’s securitisation and covered bond programmes are not available to be used by the Group whilst the assets are within the programmes. However, the Group retains the right to remove loans from the covered bond programmes where they are in excess of the programme’s requirements. In addition, where the Group has retained some of the notes issued by securitisation and covered bond programmes, the Group has the ability to sell or pledge these retained notes.
The table below sets out the carrying values of the transferred assets and the associated liabilities. For repurchase and securities lending transactions, the associated liabilities represent the Group’s obligation to repurchase the transferred assets. For securitisation programmes, the associated liabilities represent the external notes in issue (note 26). Except as otherwise noted below, none of the liabilities shown in the table below have recourse only to the transferred assets.
| | | | | | | | | | | | | | | | | |
| The Group | | The Bank |
| Carrying
value of
transferred
assets | Carrying
value of
associated
liabilities | | Carrying
value of
transferred
assets | Carrying
value of
associated
liabilities |
| £m | £m | | £m | £m |
| At 31 December 2020 | | | | | |
| Repurchase and securities lending transactions | | | | | |
| Financial assets at fair value through profit or loss | 0 | | 0 | | | 3,244 | | 1,869 | |
| Financial assets at fair value through other comprehensive income | 7,475 | | 5,105 | | | 4,889 | | 3,895 | |
| Securitisation programmes | | | | | |
| Financial assets at amortised cost: | | | | | |
Loans and advances to customers1,2 | 34,584 | | 4,481 | | | 4,072 | | 0 | |
| | | | | | | | | | | | | | | | | |
| The Group | | The Bank |
| Carrying
value of
transferred
assets | Carrying
value of
associated
liabilities | | Carrying
value of
transferred
assets | Carrying
value of
associated
liabilities |
| £m | £m | | £m | £m |
| At 31 December 2019 | | | | | |
| Repurchase and securities lending transactions | | | | | |
| Financial assets at fair value through profit or loss | 3,123 | | 2,668 | | | 655 | | 21 | |
| Financial assets at fair value through other comprehensive income | 5,436 | | 4,560 | | | 7,552 | | 6,065 | |
| Securitisation programmes | | | | | |
| Financial assets at amortised cost: | | | | | |
Loans and advances to customers1,2 | 42,545 | | 7,376 | | | 6,433 | | 0 | |
1The carrying value of associated liabilities for the Group excludes securitisation notes held by the Group of £27,418 million (31 December 2019: £31,396 million).
2The carrying value of transferred assets for the Bank includes amounts relating to assets transferred to structured entities which are fully consolidated into the Group. The liabilities associated with such assets are issued by the structured entities.
NOTES TO THE ACCOUNTS
for the year ended 31 December 2020
44 OFFSETTING OF FINANCIAL ASSETS AND LIABILITIES
The following information relates to financial assets and liabilities which have been offset in the balance sheet and those which have not been offset but for which the Group has enforceable master netting agreements or collateral arrangements in place with counterparties.
| | | | | | | | | | | | | | | | | | | | | | | | | | | | | | | | | | | |
| | | | | | | Related amounts where set off in
the balance sheet not permitted3 | | Potential
net amounts
if offset
of related
amounts
permitted |
| Gross amounts
of assets and
liabilities1 | | Amount offset
in the balance
sheet2 | | Net amounts
presented in
the balance
sheet | | Cash
collateral
received/
pledged | | Non-cash
collateral
received/
pledged | |
| At 31 December 2020 | £m | | £m | | £m | | £m | | £m | | £m |
| Financial assets | | | | | | | | | | | |
| Financial assets at fair value through profit or loss: | | | | | | | | | | | |
| Excluding reverse repos | 1,674 | | | 0 | | | 1,674 | | | 0 | | | 0 | | | 1,674 | |
| Reverse repos | 0 | | | 0 | | | 0 | | | 0 | | | 0 | | | 0 | |
| 1,674 | | | 0 | | | 1,674 | | | 0 | | | — | | | 1,674 | |
| Derivative financial instruments | 67,428 | | | (59,087) | | | 8,341 | | | (2,702) | | | (3,555) | | | 2,084 | |
| Loans and advances to banks: | | | | | | | | | | | |
| Excluding reverse repos | 4,324 | | | 0 | | | 4,324 | | | (1,023) | | | 0 | | | 3,301 | |
| Reverse repos | 1,634 | | | (8) | | | 1,626 | | | 0 | | | (1,626) | | | 0 | |
| 5,958 | | | (8) | | | 5,950 | | | (1,023) | | | (1,626) | | | 3,301 | |
| Loans and advances to customers: | | | | | | | | | | | |
| Excluding reverse repos | 426,104 | | | (410) | | | 425,694 | | | (837) | | | (2,762) | | | 422,095 | |
| Reverse repos | 59,856 | | | (5,409) | | | 54,447 | | | 0 | | | (54,447) | | | 0 | |
| 485,960 | | | (5,819) | | | 480,141 | | | (837) | | | (57,209) | | | 422,095 | |
| Debt securities | 5,137 | | | 0 | | | 5,137 | | | 0 | | | 0 | | | 5,137 | |
| Financial assets at fair value through other comprehensive income | 27,260 | | | 0 | | | 27,260 | | | 0 | | | (5,132) | | | 22,128 | |
| Financial liabilities | | | | | | | | | | | |
| Deposits from banks: | | | | | | | | | | | |
| Excluding repos | 6,230 | | | 0 | | | 6,230 | | | (2,351) | | | 0 | | | 3,879 | |
| Repos | 18,775 | | | (8) | | | 18,767 | | | 0 | | | (18,767) | | | 0 | |
| 25,005 | | | (8) | | | 24,997 | | | (2,351) | | | (18,767) | | | 3,879 | |
| Customer deposits: | | | | | | | | | | | |
| Excluding repos | 426,874 | | | (1,722) | | | 425,152 | | | (350) | | | (2,762) | | | 422,040 | |
| Repos | 14,826 | | | (5,409) | | | 9,417 | | | 0 | | | (9,417) | | | 0 | |
| 441,700 | | | (7,131) | | | 434,569 | | | (350) | | | (12,179) | | | 422,040 | |
| Financial liabilities at fair value through profit or loss: | | | | | | | | | | | |
| Excluding repos | 6,831 | | | 0 | | | 6,831 | | | 0 | | | 0 | | | 6,831 | |
| Repos | 0 | | | 0 | | | 0 | | | 0 | | | 0 | | | 0 | |
| 6,831 | | | 0 | | | 6,831 | | | 0 | | | 0 | | | 6,831 | |
| Derivative financial instruments | 66,003 | | | (57,775) | | | 8,228 | | | (1,860) | | | (4,849) | | | 1,519 | |
NOTES TO THE ACCOUNTS
for the year ended 31 December 2020
44 OFFSETTING OF FINANCIAL ASSETS AND LIABILITIES (continued)
| | | | | | | | | | | | | | | | | | | | | | | | | | | | | | | | | | | |
| | | | | | | Related amounts where set off in
the balance sheet not permitted3 | | Potential
net amounts
if offset
of related
amounts
permitted |
| Gross amounts
of assets and
liabilities1 | | Amount offset
in the balance
sheet2 | | Net amounts
presented in
the balance
sheet | | Cash
collateral
received/
pledged | | Non-cash
collateral
received/
pledged | |
| At 31 December 2019 | £m | | £m | | £m | | £m | | £m | | £m |
| Financial assets | | | | | | | | | | | |
| Financial assets at fair value through profit or loss: | | | | | | | | | | | |
| Excluding reverse repos | 2,284 | | | 0 | | | 2,284 | | | 0 | | | (21) | | | 2,263 | |
| Reverse repos | 0 | | | 0 | | | 0 | | | 0 | | | 0 | | | 0 | |
| 2,284 | | | 0 | | | 2,284 | | | 0 | | | (21) | | | 2,263 | |
| Derivative financial instruments | 61,860 | | | (53,366) | | | 8,494 | | | (2,186) | | | (4,177) | | | 2,131 | |
| Loans and advances to banks: | | | | | | | | | | | |
| Excluding reverse repos | 4,444 | | | 0 | | | 4,444 | | | (1,288) | | | (2,792) | | | 364 | |
| Reverse repos | 408 | | | 0 | | | 408 | | | 0 | | | (408) | | | 0 | |
| 4,852 | | | 0 | | | 4,852 | | | (1,288) | | | (3,200) | | | 364 | |
| Loans and advances to customers: | | | | | | | | | | | |
| Excluding reverse repos | 422,846 | | | 0 | | | 422,846 | | | (879) | | | 0 | | | 421,967 | |
| Reverse repos | 56,089 | | | (4,465) | | | 51,624 | | | 0 | | | (51,624) | | | 0 | |
| 478,935 | | | (4,465) | | | 474,470 | | | (879) | | | (51,624) | | | 421,967 | |
| Debt securities | 5,325 | | | 0 | | | 5,325 | | | 0 | | | (211) | | | 5,114 | |
| Financial assets at fair value through other comprehensive income | 24,617 | | | 0 | | | 24,617 | | | 0 | | | (5,948) | | | 18,669 | |
| Financial liabilities | | | | | | | | | | | |
| Deposits from banks: | | | | | | | | | | | |
| Excluding repos | 5,488 | | | 0 | | | 5,488 | | | (1,684) | | | 0 | | | 3,804 | |
| Repos | 18,105 | | | 0 | | | 18,105 | | | 0 | | | (18,105) | | | 0 | |
| 23,593 | | | 0 | | | 23,593 | | | (1,684) | | | (18,105) | | | 3,804 | |
| Customer deposits: | | | | | | | | | | | |
| Excluding repos | 389,178 | | | (1,869) | | | 387,309 | | | (501) | | | (2,792) | | | 384,016 | |
| Repos | 9,530 | | | 0 | | | 9,530 | | | 0 | | | (9,530) | | | 0 | |
| 398,708 | | | (1,869) | | | 396,839 | | | (501) | | | (12,322) | | | 384,016 | |
| Financial liabilities at fair value through profit or loss: | | | | | | | | | | | |
| Excluding repos | 7,702 | | | 0 | | | 7,702 | | | 0 | | | 0 | | | 7,702 | |
| Repos | 4,465 | | | (4,465) | | | 0 | | | 0 | | | 0 | | | 0 | |
| 12,167 | | | (4,465) | | | 7,702 | | | 0 | | | 0 | | | 7,702 | |
| Derivative financial instruments | 61,328 | | | (51,497) | | | 9,831 | | | (2,168) | | | (5,020) | | | 2,643 | |
1After impairment allowance.
2The amounts offset in the balance sheet as shown above represent derivatives and repurchase agreements with central clearing houses which meet the criteria for offsetting under IAS 32.
3The Group enters into derivatives and repurchase and reverse repurchase agreements with various counterparties which are governed by industry standard master netting agreements. The Group holds and provides cash and securities collateral in respective of derivative transactions covered by these agreements. The right to set off balances under these master netting agreements or to set off cash and securities collateral only arises in the event of non-payment or default and, as a result, these arrangements do not qualify for offsetting under IAS 32.
The effects of over collateralisation have not been taken into account in the above table.
NOTES TO THE ACCOUNTS
for the year ended 31 December 2020
45 FINANCIAL RISK MANAGEMENT
Financial instruments are fundamental to the Group’s activities and, as a consequence, the risks associated with financial instruments represent a significant component of the risks faced by the Group.
The primary risks affecting the Group through its use of financial instruments are: credit risk; market risk, which includes interest rate risk and foreign exchange risk; liquidity risk and capital risk. Information about the Group’s exposure to each of the above risks and its capital can be found on pages 24 to 74. The following additional disclosures, which provide its quantitative information about the risks within financial instruments held or issued by the Group, should be read in conjunction with that earlier information.
(1)Credit risk
The Group’s credit risk exposure arises in respect of the instruments below and predominantly in the United Kingdom. Credit risk appetite is set at Board level and is described and reported through a suite of metrics devised from a combination of accounting and credit portfolio performance measures, which include the use of various credit risk rating systems as inputs and measure the credit risk of loans and advances to customers and banks at a counterparty level using three components: (i) the probability of default by the counterparty on its contractual obligations; (ii) the current exposures to the counterparty and their likely future development, from which the Group derives the exposure at default; and (iii) the likely loss ratio on the defaulted obligations, the loss given default. The Group uses a range of approaches to mitigate credit risk, including internal control policies, obtaining collateral, using master netting agreements and other credit risk transfers, such as asset sales and credit derivative based transactions.
A.Maximum credit exposure
The maximum credit risk exposure of the Group and the Bank in the event of other parties failing to perform their obligations is detailed below. No account is taken of any collateral held and the maximum exposure to loss is considered to be the balance sheet carrying amount or, for non-derivative off-balance sheet transactions and financial guarantees, their contractual nominal amounts.
| | | | | | | | | | | | | | | | | | | | | | | | | | | | | | | | | | | |
| The Group | 2020 | | 2019 |
Maximum
exposure | | Offset1 | | Net
exposure | | Maximum
exposure | | Offset1 | | Net
exposure |
| £m | | £m | | £m | | £m | | £m | | £m |
| | | | | | | | | | | |
Loans and advances to banks, net2 | 5,950 | | | 0 | | | 5,950 | | | 4,852 | | | 0 | | | 4,852 | |
Loans and advances to customers, net2 | 480,141 | | | (2,762) | | | 477,379 | | | 474,470 | | | (2,792) | | | 471,678 | |
Debt securities, net2 | 5,137 | | | 0 | | | 5,137 | | | 5,325 | | | 0 | | | 5,325 | |
| Financial assets at amortised cost | 491,228 | | | (2,762) | | | 488,466 | | | 484,647 | | | (2,792) | | | 481,855 | |
| Financial assets at fair value through other comprehensive income | 27,260 | | | 0 | | | 27,260 | | | 24,617 | | | 0 | | | 24,617 | |
Financial assets at fair value through profit or loss3: | | | | | | | | | | | |
| Loans and advances | 1,511 | | | 0 | | | 1,511 | | | 1,782 | | | 0 | | | 1,782 | |
| Debt securities, treasury and other bills | 0 | | | 0 | | | 0 | | | 337 | | | 0 | | | 337 | |
| 1,511 | | | 0 | | | 1,511 | | | 2,119 | | | 0 | | | 2,119 | |
| Derivative assets | 8,341 | | | (3,373) | | | 4,968 | | | 8,494 | | | (4,177) | | | 4,317 | |
| | | | | | | | | | | |
| Off-balance sheet items: | | | | | | | | | | | |
| Acceptances and endorsements | 73 | | | 0 | | | 73 | | | 17 | | | 0 | | | 17 | |
| Other items serving as direct credit substitutes | 221 | | | 0 | | | 221 | | | 279 | | | 0 | | | 279 | |
| Performance bonds, including letters of credit, and other transaction-related contingencies | 2,070 | | | 0 | | | 2,070 | | | 2,274 | | | 0 | | | 2,274 | |
| Irrevocable commitments and guarantees | 59,240 | | | 0 | | | 59,240 | | | 46,629 | | | 0 | | | 46,629 | |
| 61,604 | | | 0 | | | 61,604 | | | 49,199 | | | 0 | | | 49,199 | |
| 589,944 | | | (6,135) | | | 583,809 | | | 569,076 | | | (6,969) | | | 562,107 | |
NOTES TO THE ACCOUNTS
for the year ended 31 December 2020
45 FINANCIAL RISK MANAGEMENT (continued)
| | | | | | | | | | | | | | | | | | | | | | | | | | | | | | | | | | | |
| The Bank | 2020 | | 2019 |
Maximum
exposure | | Offset1 | | Net
exposure | | Maximum
exposure | | Offset1 | | Net
exposure |
| £m | | £m | | £m | | £m | | £m | | £m |
| | | | | | | | | | | |
Loans and advances to banks, net2 | 5,656 | | | 0 | | | 5,656 | | | 4,453 | | | 0 | | | 4,453 | |
Loans and advances to customers, net2 | 178,269 | | | (2,156) | | | 176,113 | | | 177,569 | | | (2,123) | | | 175,446 | |
Debt securities, net2 | 4,315 | | | 0 | | | 4,315 | | | 5,241 | | | 0 | | | 5,241 | |
| Financial assets at amortised cost | 188,240 | | | (2,156) | | | 186,084 | | | 187,263 | | | (2,123) | | | 185,140 | |
| Financial assets at fair value through other comprehensive income | 24,647 | | | 0 | | | 24,647 | | | 22,160 | | | 0 | | | 22,160 | |
Financial assets at fair value through profit or loss3: | | | | | | | | | | | |
| Loans and advances | 517 | | | 0 | | | 517 | | | 362 | | | 0 | | | 362 | |
| Debt securities, treasury and other bills | 1,203 | | | 0 | | | 1,203 | | | 337 | | | 0 | | | 337 | |
| 1,720 | | | 0 | | | 1,720 | | | 699 | | | 0 | | | 699 | |
| Derivative assets | 12,595 | | | (2,752) | | | 9,843 | | | 13,638 | | | (3,312) | | | 10,326 | |
| | | | | | | | | | | |
| Off-balance sheet items: | | | | | | | | | | | |
| Acceptances and endorsements | 73 | | | 0 | | | 73 | | | 16 | | | 0 | | | 16 | |
| Other items serving as direct credit substitutes | 203 | | | 0 | | | 203 | | | 259 | | | 0 | | | 259 | |
| Performance bonds, including letters of credit, and other transaction-related contingencies | 1,817 | | | 0 | | | 1,817 | | | 2,014 | | | 0 | | | 2,014 | |
| Irrevocable commitments and guarantees | 32,847 | | | 0 | | | 32,847 | | | 27,672 | | | 0 | | | 27,672 | |
| 34,940 | | | 0 | | | 34,940 | | | 29,961 | | | 0 | | | 29,961 | |
| 262,142 | | | (4,908) | | | 257,234 | | | 253,721 | | | (5,435) | | | 248,286 | |
1Offset items comprise deposit amounts available for offset, and amounts available for offset under master netting arrangements, that do not meet the criteria under IAS 32 to enable loans and advances and derivative assets respectively to be presented net of these balances in the financial statements.
2Amounts shown net of related impairment allowances.
3Excluding equity shares.
NOTES TO THE ACCOUNTS
for the year ended 31 December 2020
45 FINANCIAL RISK MANAGEMENT (continued)
B.Concentrations of exposure
The Group’s management of concentration risk includes single name, industry sector and country limits as well as controls over the Group’s overall exposure to certain products.
At 31 December 2020 the most significant concentrations of exposure were in mortgages (comprising 63 per cent of total loans and advances to customers) and to financial, business and other services (comprising 16 per cent of the total).
Loans and advances to customers
| | | | | | | | | | | | | | | | | |
| The Group | | The Bank |
| 2020 | 2019 | | 2020 | 2019 |
| £m | £m | | £m | £m |
| Agriculture, forestry and fishing | 7,835 | | 7,557 | | | 3,039 | | 2,949 | |
| Energy and water supply | 1,274 | | 1,423 | | | 1,189 | | 1,328 | |
| Manufacturing | 4,455 | | 4,869 | | | 3,770 | | 3,811 | |
| Construction | 5,046 | | 4,190 | | | 4,022 | | 3,255 | |
| Transport, distribution and hotels | 14,229 | | 12,657 | | | 10,160 | | 8,350 | |
| Postal and telecommunications | 2,261 | | 1,679 | | | 1,689 | | 1,130 | |
| Property companies | 25,092 | | 26,736 | | | 21,629 | | 22,982 | |
| Financial, business and other services | 77,271 | | 73,087 | | | 73,987 | | 68,461 | |
| Personal: | | | | | |
Mortgages1 | 305,966 | | 298,294 | | | 49,574 | | 52,341 | |
| Other | 25,295 | | 29,165 | | | 8,502 | | 10,060 | |
| Lease financing | 1,047 | | 1,536 | | | 30 | | 93 | |
| Hire purchase | 16,071 | | 16,440 | | | 2,959 | | 3,982 | |
| Total loans and advances to customers before allowance for impairment losses | 485,842 | | 477,633 | | | 180,550 | | 178,742 | |
| Allowance for impairment losses (note 16) | (5,701) | | (3,163) | | | (2,281) | | (1,173) | |
| Total loans and advances to customers | 480,141 | | 474,470 | | | 178,269 | | 177,569 | |
1Includes both UK and overseas mortgage balances.
The Group’s operations are predominantly UK-based and as a result an analysis of credit risk exposures by geographical region is not provided.
C.Credit quality of assets
Loans and advances
The analysis of lending has been prepared based on the division in which the asset is held; with the business segment in which the exposure is recorded reflected in the ratings system applied. The internal credit ratings systems used by the Group differ between Retail and Commercial, reflecting the characteristics of these exposures and the way that they are managed internally; these credit ratings are set out below. All probabilities of default (PDs) include forward-looking information and are based on 12 month values, with the exception of credit impaired.
| | | | | | | | | | | | | | |
| Retail | | Commercial |
| Quality classification | IFRS 9 PD range | | Quality classification | IFRS 9 PD range |
| RMS 1-6 | 0.00-4.50% | | CMS 1-10 | 0.00-0.50% |
| RMS 7-9 | 4.51-14.00% | | CMS 11-14 | 0.51-3.00% |
| RMS 10 | 14.01-20.00% | | CMS 15-18 | 3.01-20.00% |
| RMS 11-13 | 20.01-99.99% | | CMS 19 | 20.01-99.99% |
| RMS 14 | 100% | | CMS 20-23 | 100% |
Stage 3 assets of the Group include balances of £179 million (2019: £205 million) (with outstanding amounts due of £732 million (2019: £1,700 million)) which have been subject to a partial write-off and where the Group continues to enforce recovery action.
Stage 2 and Stage 3 assets of the Group with a carrying amount of £22,200 million (2019: £219 million) were modified during the year. NaN material gain or loss was recognised by the Group.
As at 31 December 2020 and 2019, assets that had been previously modified whilst classified as Stage 2 or Stage 3 and were classified as Stage 1 were not material.
NOTES TO THE ACCOUNTS
for the year ended 31 December 2020
45 FINANCIAL RISK MANAGEMENT (continued)
| | | | | | | | | | | | | | | | | | | | | | | | | | | | | | | | | | | | | | | | | | | | | | | | | | | | | | | | | | | |
| Drawn exposures | | Expected credit loss allowance |
| The Group - Gross drawn exposures and expected credit loss allowances | Stage 1 | | Stage 2 | | Stage 3 | | POCI | | Total | | Stage 1 | | Stage 2 | | Stage 3 | | POCI | | Total |
| £m | | £m | | £m | | £m | | £m | | £m | | £m | | £m | | £m | | £m |
| At 31 December 2020 | | | | | | | | | | | | | | | | | | | |
| Loans and advances to banks: | | | | | | | | | | | | | | | | | | | |
| CMS 1-10 | 5,951 | | | 0 | | | 0 | | | 0 | | | 5,951 | | | 4 | | | 0 | | | 0 | | | 0 | | | 4 | |
| CMS 11-14 | 3 | | | 0 | | | 0 | | | 0 | | | 3 | | | 0 | | | 0 | | | 0 | | | 0 | | | 0 | |
| CMS 15-18 | 0 | | | 0 | | | 0 | | | 0 | | | 0 | | | 0 | | | 0 | | | 0 | | | 0 | | | 0 | |
| CMS 19 | 0 | | | 0 | | | 0 | | | 0 | | | 0 | | | 0 | | | 0 | | | 0 | | | 0 | | | 0 | |
| CMS 20-23 | 0 | | | 0 | | | 0 | | | 0 | | | 0 | | | 0 | | | 0 | | | 0 | | | 0 | | | 0 | |
| 5,954 | | | 0 | | | 0 | | | 0 | | | 5,954 | | | 4 | | | 0 | | | 0 | | | 0 | | | 4 | |
| Loans and advances to customers: | | | | | | | | | | | | | | | | | | |
| Retail - UK mortgages | | | | | | | | | | | | | | | | | | | |
| RMS 1-6 | 251,372 | | | 21,010 | | | 0 | | | 0 | | | 272,382 | | | 103 | | | 247 | | | 0 | | | 0 | | | 350 | |
| RMS 7-9 | 46 | | | 4,030 | | | 0 | | | 0 | | | 4,076 | | | 1 | | | 66 | | | 0 | | | 0 | | | 67 | |
| RMS 10 | 0 | | | 907 | | | 0 | | | 0 | | | 907 | | | 0 | | | 25 | | | 0 | | | 0 | | | 25 | |
| RMS 11-13 | 0 | | | 3,071 | | | 0 | | | 0 | | | 3,071 | | | 0 | | | 130 | | | 0 | | | 0 | | | 130 | |
| RMS 14 | 0 | | | 0 | | | 1,859 | | | 12,511 | | | 14,370 | | | 0 | | | 0 | | | 191 | | | 261 | | | 452 | |
| 251,418 | | | 29,018 | | | 1,859 | | | 12,511 | | | 294,806 | | | 104 | | | 468 | | | 191 | | | 261 | | | 1,024 | |
| Retail - credit cards | | | | | | | | | | | | | | | | | | | |
| RMS 1-6 | 9,619 | | | 1,284 | | | 0 | | | 0 | | | 10,903 | | | 75 | | | 57 | | | 0 | | | 0 | | | 132 | |
| RMS 7-9 | 1,603 | | | 1,137 | | | 0 | | | 0 | | | 2,740 | | | 66 | | | 138 | | | 0 | | | 0 | | | 204 | |
| RMS 10 | 274 | | | 343 | | | 0 | | | 0 | | | 617 | | | 14 | | | 70 | | | 0 | | | 0 | | | 84 | |
| RMS 11-13 | 0 | | | 509 | | | 0 | | | 0 | | | 509 | | | 0 | | | 193 | | | 0 | | | 0 | | | 193 | |
| RMS 14 | 0 | | | 0 | | | 340 | | | 0 | | | 340 | | | 0 | | | 0 | | | 153 | | | 0 | | | 153 | |
| 11,496 | | | 3,273 | | | 340 | | | 0 | | | 15,109 | | | 155 | | | 458 | | | 153 | | | 0 | | | 766 | |
| Retail - loans and overdrafts | | | | | | | | | | | | | | | | | | | |
| RMS 1-6 | 5,559 | | | 291 | | | 0 | | | 0 | | | 5,850 | | | 80 | | | 15 | | | 0 | | | 0 | | | 95 | |
| RMS 7-9 | 1,990 | | | 580 | | | 0 | | | 0 | | | 2,570 | | | 99 | | | 66 | | | 0 | | | 0 | | | 165 | |
| RMS 10 | 116 | | | 181 | | | 0 | | | 0 | | | 297 | | | 13 | | | 36 | | | 0 | | | 0 | | | 49 | |
| RMS 11-13 | 45 | | | 467 | | | 0 | | | 0 | | | 512 | | | 9 | | | 178 | | | 0 | | | 0 | | | 187 | |
| RMS 14 | 0 | | | 0 | | | 307 | | | 0 | | | 307 | | | 0 | | | 0 | | | 147 | | | 0 | | | 147 | |
| 7,710 | | | 1,519 | | | 307 | | | 0 | | | 9,536 | | | 201 | | | 295 | | | 147 | | | 0 | | | 643 | |
| Retail - UK Motor Finance | | | | | | | | | | | | | | | | | | | |
| RMS 1-6 | 12,035 | | | 1,396 | | | 0 | | | 0 | | | 13,431 | | | 187 | | | 46 | | | 0 | | | 0 | | | 233 | |
| RMS 7-9 | 738 | | | 456 | | | 0 | | | 0 | | | 1,194 | | | 7 | | | 33 | | | 0 | | | 0 | | | 40 | |
| RMS 10 | 0 | | | 171 | | | 0 | | | 0 | | | 171 | | | 0 | | | 30 | | | 0 | | | 0 | | | 30 | |
| RMS 11-13 | 13 | | | 193 | | | 0 | | | 0 | | | 206 | | | 0 | | | 62 | | | 0 | | | 0 | | | 62 | |
| RMS 14 | 0 | | | 0 | | | 199 | | | 0 | | | 199 | | | 0 | | | 0 | | | 133 | | | 0 | | | 133 | |
| 12,786 | | | 2,216 | | | 199 | | | 0 | | | 15,201 | | | 194 | | | 171 | | | 133 | | | 0 | | | 498 | |
| Retail - other | | | | | | | | | | | | | | | | | | | |
| RMS 1-6 | 14,952 | | | 482 | | | 0 | | | 0 | | | 15,434 | | | 19 | | | 19 | | | 0 | | | 0 | | | 38 | |
| RMS 7-9 | 2,418 | | | 334 | | | 0 | | | 0 | | | 2,752 | | | 11 | | | 39 | | | 0 | | | 0 | | | 50 | |
| RMS 10 | 0 | | | 21 | | | 0 | | | 0 | | | 21 | | | 0 | | | 1 | | | 0 | | | 0 | | | 1 | |
| RMS 11-13 | 509 | | | 467 | | | 0 | | | 0 | | | 976 | | | 0 | | | 40 | | | 0 | | | 0 | | | 40 | |
| RMS 14 | 0 | | | 0 | | | 184 | | | 0 | | | 184 | | | 0 | | | 0 | | | 59 | | | 0 | | | 59 | |
| 17,879 | | | 1,304 | | | 184 | | | 0 | | | 19,367 | | | 30 | | | 99 | | | 59 | | | 0 | | | 188 | |
| Total Retail | 301,289 | | | 37,330 | | | 2,889 | | | 12,511 | | | 354,019 | | | 684 | | | 1,491 | | | 683 | | | 261 | | | 3,119 | |
NOTES TO THE ACCOUNTS
for the year ended 31 December 2020
45 FINANCIAL RISK MANAGEMENT (continued)
| | | | | | | | | | | | | | | | | | | | | | | | | | | | | | | | | | | | | | | | | | | | | | | | | | | | | | | | | | | |
| The Group - Gross drawn exposures and expected credit loss allowances continued | Drawn exposures | | Expected credit loss allowance |
| Stage 1 | | Stage 2 | | Stage 3 | | POCI | | Total | | Stage 1 | | Stage 2 | | Stage 3 | | POCI | | Total |
| £m | | £m | | £m | | £m | | £m | | £m | | £m | | £m | | £m | | £m |
| At 31 December 2020 | | | | | | | | | | | | | | | | | | | |
| Commercial | | | | | | | | | | | | | | | | | | | |
| CMS 1-10 | 22,218 | | | 177 | | | 0 | | | 0 | | | 22,395 | | | 23 | | | 2 | | | 0 | | | 0 | | | 25 | |
| CMS 11-14 | 30,023 | | | 6,662 | | | 0 | | | 0 | | | 36,685 | | | 135 | | | 106 | | | 0 | | | 0 | | | 241 | |
| CMS 15-18 | 4,656 | | | 6,430 | | | 0 | | | 0 | | | 11,086 | | | 96 | | | 397 | | | 0 | | | 0 | | | 493 | |
| CMS 19 | 0 | | | 669 | | | 0 | | | 0 | | | 669 | | | 0 | | | 129 | | | 0 | | | 0 | | | 129 | |
| CMS 20-23 | 0 | | | 0 | | | 3,485 | | | 0 | | | 3,485 | | | 0 | | | 0 | | | 1,273 | | | 0 | | | 1,273 | |
| 56,897 | | | 13,938 | | | 3,485 | | | 0 | | | 74,320 | | | 254 | | | 634 | | | 1,273 | | | 0 | | | 2,161 | |
| Other | | | | | | | | | | | | | | | | | | | |
| RMS 1-6 | 822 | | | 12 | | | 0 | | | 0 | | | 834 | | | 9 | | | 0 | | | 0 | | | 0 | | | 9 | |
| RMS 7-9 | 0 | | | 0 | | | 0 | | | 0 | | | 0 | | | 0 | | | 0 | | | 0 | | | 0 | | | 0 | |
| RMS 10 | 0 | | | 0 | | | 0 | | | 0 | | | 0 | | | 0 | | | 0 | | | 0 | | | 0 | | | 0 | |
| RMS 11-13 | 0 | | | 0 | | | 0 | | | 0 | | | 0 | | | 0 | | | 0 | | | 0 | | | 0 | | | 0 | |
| RMS 14 | 0 | | | 0 | | | 59 | | | 0 | | | 59 | | | 0 | | | 0 | | | 12 | | | 0 | | | 12 | |
| 822 | | | 12 | | | 59 | | | 0 | | | 893 | | | 9 | | | 0 | | | 12 | | | 0 | | | 21 | |
| CMS 1-10 | 56,362 | | | 0 | | | 0 | | | 0 | | | 56,362 | | | 0 | | | 0 | | | 0 | | | 0 | | | 0 | |
| CMS 11-14 | 236 | | | 0 | | | 0 | | | 0 | | | 236 | | | 0 | | | 0 | | | 0 | | | 0 | | | 0 | |
| CMS 15-18 | 0 | | | 0 | | | 0 | | | 0 | | | 0 | | | 0 | | | 0 | | | 0 | | | 0 | | | 0 | |
| CMS 19 | 2 | | | 0 | | | 0 | | | 0 | | | 2 | | | 0 | | | 0 | | | 0 | | | 0 | | | 0 | |
| CMS 20-23 | 0 | | | 0 | | | 10 | | | 0 | | | 10 | | | 0 | | | 0 | | | 0 | | | 0 | | | 0 | |
| 56,600 | | | 0 | | | 10 | | | 0 | | | 56,610 | | | 0 | | | 0 | | | 0 | | | 0 | | | 0 | |
| Central overlay | 0 | | | 0 | | | 0 | | | 0 | | | 0 | | | 400 | | | 0 | | | 0 | | | 0 | | | 400 | |
| Total loans and advances to customers | 415,608 | | | 51,280 | | | 6,443 | | | 12,511 | | | 485,842 | | | 1,347 | | | 2,125 | | | 1,968 | | | 261 | | | 5,701 | |
| | | | | | | | | | | | | | | | | | | |
| In respect of: | | | | | | | | | | | | | | | | | | | |
| Retail | 301,289 | | | 37,330 | | | 2,889 | | | 12,511 | | | 354,019 | | | 684 | | | 1,491 | | | 683 | | | 261 | | | 3,119 | |
| Commercial | 56,897 | | | 13,938 | | | 3,485 | | | 0 | | | 74,320 | | | 254 | | | 634 | | | 1,273 | | | 0 | | | 2,161 | |
Other1 | 57,422 | | | 12 | | | 69 | | | 0 | | | 57,503 | | | 409 | | | 0 | | | 12 | | | 0 | | | 421 | |
| Total loans and advances to customers | 415,608 | | | 51,280 | | | 6,443 | | | 12,511 | | | 485,842 | | | 1,347 | | | 2,125 | | | 1,968 | | | 261 | | | 5,701 | |
1Principally comprises reverse repurchase agreement balances.
NOTES TO THE ACCOUNTS
for the year ended 31 December 2020
45 FINANCIAL RISK MANAGEMENT (continued)
| | | | | | | | | | | | | | | | | | | | | | | | | | | | | | | | | | | | | | | | | | | | | | | | | | | | | | | | | | | |
| The Group - Gross undrawn exposures and expected credit loss allowances | Undrawn exposures | | Expected credit loss allowance |
| Stage 1 | | Stage 2 | | Stage 3 | | POCI | | Total | | Stage 1 | | Stage 2 | | Stage 3 | | POCI | | Total |
| £m | | £m | | £m | | £m | | £m | | £m | | £m | | £m | | £m | | £m |
| At 31 December 2020 | | | | | | | | | | | | | | | | | | | |
| Loans and advances to customers: | | | | | | | | | | | | | | | | | | |
| Retail - UK mortgages | | | | | | | | | | | | | | | | | | | |
| RMS 1-6 | 19,347 | | | 109 | | | 0 | | | 0 | | | 19,456 | | | 3 | | | 0 | | | 0 | | | 0 | | | 3 | |
| RMS 7-9 | 1 | | | 6 | | | 0 | | | 0 | | | 7 | | | 0 | | | 0 | | | 0 | | | 0 | | | 0 | |
| RMS 10 | 0 | | | 2 | | | 0 | | | 0 | | | 2 | | | 0 | | | 0 | | | 0 | | | 0 | | | 0 | |
| RMS 11-13 | 0 | | | 1 | | | 0 | | | 0 | | | 1 | | | 0 | | | 0 | | | 0 | | | 0 | | | 0 | |
| RMS 14 | 0 | | | 0 | | | 10 | | | 74 | | | 84 | | | 0 | | | 0 | | | 0 | | | 0 | | | 0 | |
| 19,348 | | | 118 | | | 10 | | | 74 | | | 19,550 | | | 3 | | | 0 | | | 0 | | | 0 | | | 3 | |
| Retail - credit cards | | | | | | | | | | | | | | | | | | | |
| RMS 1-6 | 54,694 | | | 3,044 | | | 0 | | | 0 | | | 57,738 | | | 67 | | | 46 | | | 0 | | | 0 | | | 113 | |
| RMS 7-9 | 772 | | | 463 | | | 0 | | | 0 | | | 1,235 | | | 11 | | | 8 | | | 0 | | | 0 | | | 19 | |
| RMS 10 | 602 | | | 282 | | | 0 | | | 0 | | | 884 | | | 7 | | | 11 | | | 0 | | | 0 | | | 18 | |
| RMS 11-13 | 0 | | | 85 | | | 0 | | | 0 | | | 85 | | | 0 | | | 7 | | | 0 | | | 0 | | | 7 | |
| RMS 14 | 0 | | | 0 | | | 56 | | | 0 | | | 56 | | | 0 | | | 0 | | | 0 | | | 0 | | | 0 | |
| 56,068 | | | 3,874 | | | 56 | | | 0 | | | 59,998 | | | 85 | | | 72 | | | 0 | | | 0 | | | 157 | |
| Retail - loans and overdrafts | | | | | | | | | | | | | | | | | | | |
| RMS 1-6 | 6,070 | | | 315 | | | 0 | | | 0 | | | 6,385 | | | 14 | | | 7 | | | 0 | | | 0 | | | 21 | |
| RMS 7-9 | 269 | | | 139 | | | 0 | | | 0 | | | 408 | | | 8 | | | 14 | | | 0 | | | 0 | | | 22 | |
| RMS 10 | 13 | | | 35 | | | 0 | | | 0 | | | 48 | | | 1 | | | 7 | | | 0 | | | 0 | | | 8 | |
| RMS 11-13 | 3 | | | 69 | | | — | | | 0 | | | 72 | | | 0 | | | 21 | | | 0 | | | 0 | | | 21 | |
| RMS 14 | 0 | | | 0 | | | 18 | | | 0 | | | 18 | | | 0 | | | 0 | | | 0 | | | 0 | | | 0 | |
| 6,355 | | | 558 | | | 18 | | | 0 | | | 6,931 | | | 23 | | | 49 | | | 0 | | | 0 | | | 72 | |
| Retail - UK Motor Finance | | | | | | | | | | | | | | | | | | | |
| RMS 1-6 | 1,275 | | | 0 | | | 0 | | | 0 | | | 1,275 | | | 2 | | | 0 | | | 0 | | | 0 | | | 2 | |
| RMS 7-9 | 381 | | | 3 | | | 0 | | | 0 | | | 384 | | | 1 | | | 0 | | | 0 | | | 0 | | | 1 | |
| RMS 10 | 0 | | | 0 | | | 0 | | | 0 | | | 0 | | | 0 | | | 0 | | | 0 | | | 0 | | | 0 | |
| RMS 11-13 | 1 | | | 0 | | | 0 | | | 0 | | | 1 | | | 0 | | | 0 | | | 0 | | | 0 | | | 0 | |
| RMS 14 | 0 | | | 0 | | | 0 | | | 0 | | | 0 | | | 0 | | | 0 | | | 0 | | | 0 | | | 0 | |
| 1,657 | | | 3 | | | 0 | | | 0 | | | 1,660 | | | 3 | | | 0 | | | 0 | | | 0 | | | 3 | |
| Retail - other | | | | | | | | | | | | | | | | | | | |
| RMS 1-6 | 1,672 | | | 23 | | | 0 | | | 0 | | | 1,695 | | | 7 | | | 5 | | | 0 | | | 0 | | | 12 | |
| RMS 7-9 | 140 | | | 36 | | | 0 | | | 0 | | | 176 | | | 9 | | | 13 | | | 0 | | | 0 | | | 22 | |
| RMS 10 | 0 | | | 0 | | | 0 | | | 0 | | | 0 | | | 0 | | | 0 | | | 0 | | | 0 | | | 0 | |
| RMS 11-13 | 0 | | | 10 | | | 0 | | | 0 | | | 10 | | | 0 | | | 7 | | | 0 | | | 0 | | | 7 | |
| RMS 14 | 0 | | | 0 | | | 1 | | | 0 | | | 1 | | | 0 | | | 0 | | | 0 | | | 0 | | | 0 | |
| 1,812 | | | 69 | | | 1 | | | 0 | | | 1,882 | | | 16 | | | 25 | | | 0 | | | 0 | | | 41 | |
| Total Retail | 85,240 | | | 4,622 | | | 85 | | | 74 | | | 90,021 | | | 130 | | | 146 | | | 0 | | | 0 | | | 276 | |
NOTES TO THE ACCOUNTS
for the year ended 31 December 2020
45 FINANCIAL RISK MANAGEMENT (continued)
| | | | | | | | | | | | | | | | | | | | | | | | | | | | | | | | | | | | | | | | | | | | | | | | | | | | | | | | | | | |
| The Group - Gross undrawn exposures and expected credit loss allowances continued | Undrawn exposures | | Expected credit loss allowance |
| Stage 1 | | Stage 2 | | Stage 3 | | POCI | | Total | | Stage 1 | | Stage 2 | | Stage 3 | | POCI | | Total |
| £m | | £m | | £m | | £m | | £m | | £m | | £m | | £m | | £m | | £m |
| At 31 December 2020 | | | | | | | | | | | | | | | | | | | |
| Commercial | | | | | | | | | | | | | | | | | | | |
| CMS 1-10 | 29,039 | | | 0 | | | 0 | | | 0 | | | 29,039 | | | 13 | | | 0 | | | 0 | | | 0 | | | 13 | |
| CMS 11-14 | 9,612 | | | 1,614 | | | 0 | | | 0 | | | 11,226 | | | 31 | | | 16 | | | 0 | | | 0 | | | 47 | |
| CMS 15-18 | 934 | | | 1,291 | | | 0 | | | 0 | | | 2,225 | | | 16 | | | 47 | | | 0 | | | 0 | | | 63 | |
| CMS 19 | 0 | | | 92 | | | 0 | | | 0 | | | 92 | | | 0 | | | 12 | | | 0 | | | 0 | | | 12 | |
| CMS 20-23 | 0 | | | 0 | | | 195 | | | 0 | | | 195 | | | 0 | | | 0 | | | 14 | | | 0 | | | 14 | |
| 39,585 | | | 2,997 | | | 195 | | | 0 | | | 42,777 | | | 60 | | | 75 | | | 14 | | | 0 | | | 149 | |
| Other | | | | | | | | | | | | | | | | | | | |
| RMS 1-6 | 299 | | | 0 | | | 0 | | | 0 | | | 299 | | | 1 | | | 0 | | | 0 | | | 0 | | | 1 | |
| RMS 7-9 | 0 | | | 0 | | | 0 | | | 0 | | | 0 | | | 0 | | | 0 | | | 0 | | | 0 | | | 0 | |
| RMS 10 | 0 | | | 0 | | | 0 | | | 0 | | | 0 | | | 0 | | | 0 | | | 0 | | | 0 | | | 0 | |
| RMS 11-13 | 0 | | | 0 | | | 0 | | | 0 | | | 0 | | | 0 | | | 0 | | | 0 | | | 0 | | | 0 | |
| RMS 14 | 0 | | | 0 | | | 0 | | | 0 | | | 0 | | | 0 | | | 0 | | | 0 | | | 0 | | | 0 | |
| 299 | | | 0 | | | 0 | | | 0 | | | 299 | | | 1 | | | 0 | | | 0 | | | 0 | | | 1 | |
| CMS 1-10 | 501 | | | 0 | | | 0 | | | 0 | | | 501 | | | 0 | | | 0 | | | 0 | | | 0 | | | 0 | |
| CMS 11-14 | 0 | | | 0 | | | 0 | | | 0 | | | 0 | | | 0 | | | 0 | | | 0 | | | 0 | | | 0 | |
| CMS 15-18 | 0 | | | 0 | | | 0 | | | 0 | | | 0 | | | 0 | | | 0 | | | 0 | | | 0 | | | 0 | |
| CMS 19 | 0 | | | 0 | | | 0 | | | 0 | | | 0 | | | 0 | | | 0 | | | 0 | | | 0 | | | 0 | |
| CMS 20-23 | 0 | | | 0 | | | 0 | | | 0 | | | 0 | | | 0 | | | 0 | | | 0 | | | 0 | | | 0 | |
| 501 | |
| 0 | | | 0 | | | 0 | | | 501 | | | 0 | | | 0 | | | 0 | | | 0 | | | 0 | |
| Total loans and advances to customers | 125,625 | | | 7,619 | | | 280 | | | 74 | | | 133,598 | | | 191 | | | 221 | | | 14 | | | 0 | | | 426 | |
| | | | | | | | | | | | | | | | | | | |
| In respect of: | | | | | | | | | | | | | | | | | | | |
| Retail | 85,240 | | | 4,622 | | | 85 | | | 74 | | | 90,021 | | | 130 | | | 146 | | | 0 | | | 0 | | | 276 | |
| Commercial | 39,585 | | | 2,997 | | | 195 | | | 0 | | | 42,777 | | | 60 | | | 75 | | | 14 | | | 0 | | | 149 | |
| Other | 800 | | | 0 | | | 0 | | | 0 | | | 800 | | | 1 | | | 0 | | | 0 | | | 0 | | | 1 | |
| Total loans and advances to customers | 125,625 | | | 7,619 | | | 280 | | | 74 | | | 133,598 | | | 191 | | | 221 | | | 14 | | | 0 | | | 426 | |
NOTES TO THE ACCOUNTS
for the year ended 31 December 2020
45 FINANCIAL RISK MANAGEMENT (continued)
| | | | | | | | | | | | | | | | | | | | | | | | | | | | | | | | | | | | | | | | | | | | | | | | | | | | | | | | | | | |
| Drawn exposures | | Expected credit loss allowance |
| The Group - Gross drawn exposures and expected credit loss allowances | Stage 1 | | Stage 2 | | Stage 3 | | POCI | | Total | | Stage 1 | | Stage 2 | | Stage 3 | | POCI | | Total |
| £m | | £m | | £m | | £m | | £m | | £m | | £m | | £m | | £m | | £m |
| At 31 December 2019 | | | | | | | | | | | | | | | | | | | |
| Loans and advances to banks: | | | | | | | | | | | | | | | | | | | |
| CMS 1-10 | 4,852 | | | 0 | | | 0 | | | 0 | | | 4,852 | | | 0 | | | 0 | | | 0 | | | 0 | | | 0 | |
| CMS 11-14 | 0 | | | 0 | | | 0 | | | 0 | | | 0 | | | 0 | | | 0 | | | 0 | | | 0 | | | 0 | |
| CMS 15-18 | 0 | | | 0 | | | 0 | | | 0 | | | 0 | | | 0 | | | 0 | | | 0 | | | 0 | | | 0 | |
| CMS 19 | 0 | | | 0 | | | 0 | | | 0 | | | 0 | | | 0 | | | 0 | | | 0 | | | 0 | | | 0 | |
| CMS 20-23 | 0 | | | 0 | | | 0 | | | 0 | | | 0 | | | 0 | | | 0 | | | 0 | | | 0 | | | 0 | |
| 4,852 | | | 0 | | | 0 | | | 0 | | | 4,852 | | | 0 | | | 0 | | | 0 | | | 0 | | | 0 | |
| Loans and advances to customers: | | | | | | | | | | | | | | | | | | |
| Retail - UK mortgages | | | | | | | | | | | | | | | | | | | |
| RMS 1-6 | 257,028 | | | 13,494 | | | 0 | | | 0 | | | 270,522 | | | 23 | | | 183 | | | 0 | | | 0 | | | 206 | |
| RMS 7-9 | 15 | | | 2,052 | | | 0 | | | 0 | | | 2,067 | | | 0 | | | 39 | | | 0 | | | 0 | | | 39 | |
| RMS 10 | 0 | | | 414 | | | 0 | | | 0 | | | 414 | | | 0 | | | 13 | | | 0 | | | 0 | | | 13 | |
| RMS 11-13 | 0 | | | 975 | | | 0 | | | 0 | | | 975 | | | 0 | | | 46 | | | 0 | | | 0 | | | 46 | |
| RMS 14 | 0 | | | 0 | | | 1,506 | | | 13,714 | | | 15,220 | | | 0 | | | 0 | | | 122 | | | 142 | | | 264 | |
| 257,043 | | | 16,935 | | | 1,506 | | | 13,714 | | | 289,198 | | | 23 | | | 281 | | | 122 | | | 142 | | | 568 | |
| Retail - credit cards | | | | | | | | |
| | | | | | | | | |
|
| RMS 1-6 | 14,744 | | | 729 | | | 0 | | | 0 | | | 15,473 | | | 103 | | | 25 | | | 0 | | | 0 | | | 128 | |
| RMS 7-9 | 1,355 | | | 556 | | | 0 | | | 0 | | | 1,911 | | | 49 | | | 54 | | | 0 | | | 0 | | | 103 | |
| RMS 10 | 32 | | | 105 | | | 0 | | | 0 | | | 137 | | | 3 | | | 19 | | | 0 | | | 0 | | | 22 | |
| RMS 11-13 | 1 | | | 291 | | | 0 | | | 0 | | | 292 | | | 0 | | | 91 | | | 0 | | | 0 | | | 91 | |
| RMS 14 | 0 | | | 0 | | | 385 | | | 0 | | | 385 | | | 0 | | | 0 | | | 125 | | | 0 | | | 125 | |
| 16,132 | | | 1,681 | | | 385 | | | 0 | | | 18,198 | | | 155 | | | 189 | | | 125 | | | 0 | | | 469 | |
| Retail - loans and overdrafts | | | | | | | | | | | | | | | | | | | |
| RMS 1-6 | 7,406 | | | 368 | | | 0 | | | 0 | | | 7,774 | | | 84 | | | 17 | | | 0 | | | 0 | | | 101 | |
| RMS 7-9 | 1,321 | | | 363 | | | 0 | | | 0 | | | 1,684 | | | 55 | | | 38 | | | 0 | | | 0 | | | 93 | |
| RMS 10 | 44 | | | 85 | | | 0 | | | 0 | | | 129 | | | 4 | | | 15 | | | 0 | | | 0 | | | 19 | |
| RMS 11-13 | 17 | | | 315 | | | 0 | | | 0 | | | 332 | | | 3 | | | 102 | | | 0 | | | 0 | | | 105 | |
| RMS 14 | 0 | | | 0 | | | 293 | | | 0 | | | 293 | | | 0 | | | 0 | | | 108 | | | 0 | | | 108 | |
| 8,788 | | | 1,131 | | | 293 | | | 0 | | | 10,212 | | | 146 | | | 172 | | | 108 | | | 0 | | | 426 | |
| Retail - UK Motor Finance | | | | | | | | |
| | | | | | | | | |
|
| RMS 1-6 | 13,568 | | | 1,297 | | | 0 | | | 0 | | | 14,865 | | | 203 | | | 30 | | | 0 | | | 0 | | | 233 | |
| RMS 7-9 | 314 | | | 368 | | | 0 | | | 0 | | | 682 | | | 10 | | | 15 | | | 0 | | | 0 | | | 25 | |
| RMS 10 | 0 | | | 99 | | | 0 | | | 0 | | | 99 | | | 0 | | | 10 | | | 0 | | | 0 | | | 10 | |
| RMS 11-13 | 2 | | | 178 | | | 0 | | | 0 | | | 180 | | | 1 | | | 32 | | | 0 | | | 0 | | | 33 | |
| RMS 14 | 0 | | | 0 | | | 150 | | | 0 | | | 150 | | | 0 | | | 0 | | | 84 | | | 0 | | | 84 | |
| 13,884 | | | 1,942 | | | 150 | | | 0 | | | 15,976 | | | 214 | | | 87 | | | 84 | | | 0 | | | 385 | |
| Retail - other | | | | | | | | |
| | | | | | | | | |
|
| RMS 1-6 | 9,762 | | | 395 | | | 0 | | | 0 | | | 10,157 | | | 25 | | | 10 | | | 0 | | | 0 | | | 35 | |
| RMS 7-9 | 8 | | | 420 | | | 0 | | | 0 | | | 428 | | | 0 | | | 26 | | | 0 | | | 0 | | | 26 | |
| RMS 10 | 0 | | | 7 | | | 0 | | | 0 | | | 7 | | | 0 | | | 0 | | | 0 | | | 0 | | | 0 | |
| RMS 11-13 | 134 | | | 23 | | | 0 | | | 0 | | | 157 | | | 0 | | | 1 | | | 0 | | | 0 | | | 1 | |
| RMS 14 | 0 | | | 0 | | | 150 | | | 0 | | | 150 | | | 0 | | | 0 | | | 51 | | | 0 | | | 51 | |
| 9,904 | | | 845 | | | 150 | | | 0 | | | 10,899 | | | 25 | | | 37 | | | 51 | | | 0 | | | 113 | |
| Total Retail | 305,751 | | | 22,534 | | | 2,484 | | | 13,714 | | | 344,483 | | | 563 | | | 766 | | | 490 | | | 142 | | | 1,961 | |
NOTES TO THE ACCOUNTS
for the year ended 31 December 2020
45 FINANCIAL RISK MANAGEMENT (continued)
| | | | | | | | | | | | | | | | | | | | | | | | | | | | | | | | | | | | | | | | | | | | | | | | | | | | | | | | | | | |
| The Group - Gross drawn exposures and expected credit loss allowances continued | Drawn exposures | | Expected credit loss allowance |
| Stage 1 | | Stage 2 | | Stage 3 | | POCI | | Total | | Stage 1 | | Stage 2 | | Stage 3 | | POCI | | Total |
| £m | | £m | | £m | | £m | | £m | | £m | | £m | | £m | | £m | | £m |
| At 31 December 2019 | | | | | | | | | | | | | | | | | | | |
| Commercial | | | | | | | | | | | | | | | | | | | |
| CMS 1-10 | 43,104 | | | 356 | | | 0 | | | 0 | | | 43,460 | | | 27 | | | 2 | | | 0 | | | 0 | | | 29 | |
| CMS 11-14 | 25,341 | | | 2,312 | | | 0 | | | 0 | | | 27,653 | | | 50 | | | 37 | | | 0 | | | 0 | | | 87 | |
| CMS 15-18 | 1,793 | | | 3,089 | | | 0 | | | 0 | | | 4,882 | | | 13 | | | 171 | | | 0 | | | 0 | | | 184 | |
| CMS 19 | 0 | | | 168 | | | 0 | | | 0 | | | 168 | | | 0 | | | 16 | | | 0 | | | 0 | | | 16 | |
| CMS 20-23 | 0 | | | 0 | | | 3,135 | | | 0 | | | 3,135 | | | 0 | | | 0 | | | 859 | | | 0 | | | 859 | |
| 70,238 | | | 5,925 | | | 3,135 | | | 0 | | | 79,298 | | | 90 | | | 226 | | | 859 | | | 0 | | | 1,175 | |
| Other | | | | | | | | | | | | | | | | | | | |
| RMS 1-6 | 768 | | | 46 | | | 0 | | | 0 | | | 814 | | | 16 | | | 1 | | | 0 | | | 0 | | | 17 | |
| RMS 7-9 | 0 | | | 0 | | | 0 | | | 0 | | | 0 | | | 0 | | | 0 | | | 0 | | | 0 | | | 0 | |
| RMS 10 | 0 | | | 0 | | | 0 | | | 0 | | | 0 | | | 0 | | | 0 | | | 0 | | | 0 | | | 0 | |
| RMS 11-13 | 0 | | | 0 | | | 0 | | | 0 | | | 0 | | | 0 | | | 0 | | | 0 | | | 0 | | | 0 | |
| RMS 14 | 0 | | | 0 | | | 28 | | | 0 | | | 28 | | | 0 | | | 0 | | | 10 | | | 0 | | | 10 | |
| 768 | | | 46 | | | 28 | | | 0 | | | 842 | | | 16 | | | 1 | | | 10 | | | 0 | | | 27 | |
| CMS 1-10 | 53,010 | | | 0 | | | 0 | | | 0 | | | 53,010 | | | 0 | | | 0 | | | 0 | | | 0 | | | 0 | |
| CMS 11-14 | 0 | | | 0 | | | 0 | | | 0 | | | 0 | | | 0 | | | 0 | | | 0 | | | 0 | | | 0 | |
| CMS 15-18 | 0 | | | 0 | | | 0 | | | 0 | | | 0 | | | — | | | 0 | | | 0 | | | 0 | | | 0 | |
| CMS 19 | 0 | | | 0 | | | 0 | | | 0 | | | 0 | | | 0 | | | 0 | | | 0 | | | 0 | | | 0 | |
| CMS 20-23 | 0 | | | 0 | | | 0 | | | 0 | | | 0 | | | 0 | | | 0 | | | 0 | | | 0 | | | 0 | |
| 53,010 | | | 0 | | | 0 | | | 0 | | | 53,010 | | | 0 | | | 0 | | | 0 | | | 0 | | | 0 | |
| Total loans and advances to customers | 429,767 | | | 28,505 | | | 5,647 | | | 13,714 | | | 477,633 | | | 669 | | | 993 | | | 1,359 | | | 142 | | | 3,163 | |
| | | | | | | | | | | | | | | | | | | |
| In respect of: | | | | | | | | | | | | | | | | | | | |
| Retail | 305,751 | | | 22,534 | | | 2,484 | | | 13,714 | | | 344,483 | | | 563 | | | 766 | | | 490 | | | 142 | | | 1,961 | |
| Commercial | 70,238 | | | 5,925 | | | 3,135 | | | 0 | | | 79,298 | | | 90 | | | 226 | | | 859 | | | 0 | | | 1,175 | |
Other1 | 53,778 | | | 46 | | | 28 | | | 0 | | | 53,852 | | | 16 | | | 1 | | | 10 | | | 0 | | | 27 | |
| Total loans and advances to customers | 429,767 | | | 28,505 | | | 5,647 | | | 13,714 | | | 477,633 | | | 669 | | | 993 | | | 1,359 | | | 142 | | | 3,163 | |
1Principally comprises reverse repurchase agreement balances.
NOTES TO THE ACCOUNTS
for the year ended 31 December 2020
45 FINANCIAL RISK MANAGEMENT (continued)
| | | | | | | | | | | | | | | | | | | | | | | | | | | | | | | | | | | | | | | | | | | | | | | | | | | | | | | | | | | |
| Undrawn exposures | | Expected credit loss allowance |
| The Group - Gross undrawn exposures and expected credit loss allowances | Stage 1 | | Stage 2 | | Stage 3 | | POCI | | Total | | Stage 1 | | Stage 2 | | Stage 3 | | POCI | | Total |
| £m | | £m | | £m | | £m | | £m | | £m | | £m | | £m | | £m | | £m |
| At 31 December 2019 | | | | | | | | | | | | | | | | | | | |
| Loans and advances to customers: | | | | | | | | | | | | | | | | | | |
| Retail - UK mortgages | | | | | | | | | | | | | | | | | | | |
| RMS 1-6 | 12,242 | | | 62 | | | 0 | | | 0 | | | 12,304 | | | 1 | | | 0 | | | 0 | | | 0 | | | 1 | |
| RMS 7-9 | 1 | | | 1 | | | 0 | | | 0 | | | 2 | | | 0 | | | 0 | | | 0 | | | 0 | | | 0 | |
| RMS 10 | 0 | | | 0 | | | 0 | | | 0 | | | 0 | | | 0 | | | 0 | | | 0 | | | 0 | | | 0 | |
| RMS 11-13 | 0 | | | 0 | | | 0 | | | 0 | | | 0 | | | 0 | | | 0 | | | 0 | | | 0 | | | 0 | |
| RMS 14 | 0 | | | 0 | | | 8 | | | 79 | | | 87 | | | 0 | | | 0 | | | 0 | | | 0 | | | 0 | |
| 12,243 | | | 63 | | | 8 | | | 79 | | | 12,393 | | | 1 | | | 0 | | | 0 | | | 0 | | | 1 | |
| Retail - credit cards | | | | | | | | | | | | | | | | | | | |
| RMS 1-6 | 54,216 | | | 1,762 | | | 0 | | | 0 | | | 55,978 | | | 44 | | | 21 | | | 0 | | | 0 | | | 65 | |
| RMS 7-9 | 293 | | | 162 | | | 0 | | | 0 | | | 455 | | | 4 | | | 3 | | | 0 | | | 0 | | | 7 | |
| RMS 10 | 3 | | | 28 | | | 0 | | | 0 | | | 31 | | | 0 | | | 1 | | | 0 | | | 0 | | | 1 | |
| RMS 11-13 | 1 | | | 44 | | | 0 | | | 0 | | | 45 | | | 0 | | | 4 | | | 0 | | | 0 | | | 4 | |
| RMS 14 | 0 | | | 0 | | | 75 | | | 0 | | | 75 | | | 0 | | | 0 | | | 0 | | | 0 | | | 0 | |
| 54,513 | | | 1,996 | | | 75 | | | 0 | | | 56,584 | | | 48 | | | 29 | | | 0 | | | 0 | | | 77 | |
| Retail - loans and overdrafts | | | | | | | | | | | | | | | | | | | |
| RMS 1-6 | 6,437 | | | 224 | | | 0 | | | 0 | | | 6,661 | | | 12 | | | 3 | | | 0 | | | 0 | | | 15 | |
| RMS 7-9 | 96 | | | 56 | | | 0 | | | 0 | | | 152 | | | 2 | | | 5 | | | 0 | | | 0 | | | 7 | |
| RMS 10 | 2 | | | 11 | | | 0 | | | 0 | | | 13 | | | 0 | | | 2 | | | 0 | | | 0 | | | 2 | |
| RMS 11-13 | 0 | | | 29 | | | 0 | | | 0 | | | 29 | | | 0 | | | 11 | | | 0 | | | 0 | | | 11 | |
| RMS 14 | 0 | | | 0 | | | 8 | | | 0 | | | 8 | | | 0 | | | 0 | | | 0 | | | 0 | | | 0 | |
| 6,535 | | | 320 | | | 8 | | | 0 | | | 6,863 | | | 14 | | | 21 | | | 0 | | | 0 | | | 35 | |
| Retail - UK Motor Finance | | | | | | | | | | | | | | | | | | | |
| RMS 1-6 | 1,181 | | | 0 | | | 0 | | | 0 | | | 1,181 | | | 2 | | | 0 | | | 0 | | | 0 | | | 2 | |
| RMS 7-9 | 193 | | | 4 | | | 0 | | | 0 | | | 197 | | | 0 | | | 0 | | | 0 | | | 0 | | | 0 | |
| RMS 10 | 0 | | | 0 | | | 0 | | | 0 | | | 0 | | | 0 | | | 0 | | | 0 | | | 0 | | | 0 | |
| RMS 11-13 | 0 | | | 0 | | | 0 | | | 0 | | | 0 | | | 0 | | | 0 | | | 0 | | | 0 | | | 0 | |
| RMS 14 | 0 | | | 0 | | | 0 | | | 0 | | | 0 | | | 0 | | | 0 | | | 0 | | | 0 | | | 0 | |
| 1,374 | | | 4 | | | 0 | | | 0 | | | 1,378 | | | 2 | | | 0 | | | 0 | | | 0 | | | 2 | |
| Retail - other | | | | | | | | | | | | | | | | | | | |
| RMS 1-6 | 1,240 | | | 0 | | | 0 | | | 0 | | | 1,240 | | | 11 | | | 0 | | | 0 | | | 0 | | | 11 | |
| RMS 7-9 | 0 | | | 62 | | | 0 | | | 0 | | | 62 | | | 0 | | | 3 | | | 0 | | | 0 | | | 3 | |
| RMS 10 | 0 | | | 0 | | | 0 | | | 0 | | | 0 | | | 0 | | | 0 | | | 0 | | | 0 | | | 0 | |
| RMS 11-13 | 0 | | | 0 | | | 0 | | | 0 | | | 0 | | | 0 | | | 0 | | | 0 | | | 0 | | | 0 | |
| RMS 14 | 0 | | | 0 | | | 2 | | | 0 | | | 2 | | | 0 | | | 0 | | | 0 | | | 0 | | | 0 | |
| 1,240 | | | 62 | | | 2 | | | 0 | | | 1,304 | | | 11 | | | 3 | | | 0 | | | 0 | | | 14 | |
| Total Retail | 75,905 | | | 2,445 | | | 93 | | | 79 | | | 78,522 | | | 76 | | | 53 | | | 0 | | | 0 | | | 129 | |
NOTES TO THE ACCOUNTS
for the year ended 31 December 2020
45 FINANCIAL RISK MANAGEMENT (continued)
| | | | | | | | | | | | | | | | | | | | | | | | | | | | | | | | | | | | | | | | | | | | | | | | | | | | | | | | | | | |
| The Group - Gross undrawn exposures and expected credit loss allowances continued | Undrawn exposures | | Expected credit loss allowance |
| Stage 1 | | Stage 2 | | Stage 3 | | POCI | | Total | | Stage 1 | | Stage 2 | | Stage 3 | | POCI | | Total |
| £m | | £m | | £m | | £m | | £m | | £m | | £m | | £m | | £m | | £m |
| At 31 December 2019 | | | | | | | | | | | | | | | | | | | |
| Commercial | | | | | | | | | | | | | | | | | | | |
| CMS 1-10 | 31,014 | | | 76 | | | 0 | | | 0 | | | 31,090 | | | 7 | | | 0 | | | 0 | | | 0 | | | 7 | |
| CMS 11-14 | 5,105 | | | 850 | | | 0 | | | 0 | | | 5,955 | | | 7 | | | 9 | | | 0 | | | 0 | | | 16 | |
| CMS 15-18 | 258 | | | 326 | | | 0 | | | 0 | | | 584 | | | 1 | | | 13 | | | 0 | | | 0 | | | 14 | |
| CMS 19 | 0 | | | 43 | | | 0 | | | 0 | | | 43 | | | 0 | | | 2 | | | 0 | | | 0 | | | 2 | |
| CMS 20-23 | 0 | | | 0 | | | 5 | | | 0 | | | 5 | | | 0 | | | 0 | | | 5 | | | 0 | | | 5 | |
| 36,377 | | | 1,295 | | | 5 | | | 0 | | | 37,677 | | | 15 | | | 24 | | | 5 | | | 0 | | | 44 | |
| Other | | | | | | | | | | | | | | | | | | | |
| RMS 1-6 | 235 | | | 0 | | | 0 | | | 0 | | | 235 | | | 0 | | | 0 | | | 0 | | | 0 | | | 0 | |
| RMS 7-9 | 0 | | | 0 | | | 0 | | | 0 | | | 0 | | | 0 | | | 0 | | | 0 | | | 0 | | | 0 | |
| RMS 10 | 0 | | | 0 | | | 0 | | | 0 | | | 0 | | | 0 | | | 0 | | | 0 | | | 0 | | | 0 | |
| RMS 11-13 | 0 | | | 0 | | | 0 | | | 0 | | | 0 | | | 0 | | | 0 | | | 0 | | | 0 | | | 0 | |
| RMS 14 | 0 | | | 0 | | | 0 | | | 0 | | | 0 | | | 0 | | | 0 | | | 0 | | | 0 | | | 0 | |
| 235 | | | 0 | | | 0 | | | 0 | | | 235 | | | 0 | | | 0 | | | 0 | | | 0 | | | 0 | |
| CMS 1-10 | 0 | | | 0 | | | 0 | | | 0 | | | 0 | | | 0 | | | 0 | | | 0 | | | 0 | | | 0 | |
| CMS 11-14 | 0 | | | 0 | | | 0 | | | 0 | | | 0 | | | 0 | | | 0 | | | 0 | | | 0 | | | 0 | |
| CMS 15-18 | 0 | | | 0 | | | 0 | | | 0 | | | 0 | | | 0 | | | 0 | | | 0 | | | 0 | | | 0 | |
| CMS 19 | 0 | | | 0 | | | 0 | | | 0 | | | 0 | | | 0 | | | 0 | | | 0 | | | 0 | | | 0 | |
| CMS 20-23 | 0 | | | 0 | | | 0 | | | 0 | | | 0 | | | 0 | | | 0 | | | 0 | | | 0 | | | 0 | |
| 0 | | | 0 | | | 0 | | | 0 | | | 0 | | | 0 | | | 0 | |
| 0 | | | 0 | | | 0 | |
| Total loans and advances to customers | 112,517 | | | 3,740 | | | 98 | | | 79 | | | 116,434 | | | 91 | | | 77 | | | 5 | | | 0 | | | 173 | |
| | | | | | | | | | | | | | | | | | | |
| In respect of: | | | | | | | | | | | | | | | | | | | |
| Retail | 75,905 | | | 2,445 | | | 93 | | | 79 | | | 78,522 | | | 76 | | | 53 | | | 0 | | | 0 | | | 129 | |
| Commercial | 36,377 | | | 1,295 | | | 5 | | | 0 | | | 37,677 | | | 15 | | | 24 | | | 5 | | | 0 | | | 44 | |
| Other | 235 | | | 0 | | | 0 | | | 0 | | | 235 | | | 0 | | | 0 | | | 0 | | | 0 | | | 0 | |
| Total loans and advances to customers | 112,517 | | | 3,740 | | | 98 | | | 79 | | | 116,434 | | | 91 | | | 77 | | | 5 | | | 0 | | | 173 | |
NOTES TO THE ACCOUNTS
for the year ended 31 December 2020
45 FINANCIAL RISK MANAGEMENT (continued)
| | | | | | | | | | | | | | | | | | | | | | | | | | | | | | | | | | | | | | | | | | | | | | | |
| Drawn exposures | | Expected credit loss allowance |
| The Bank - Gross drawn exposures and expected credit loss allowances | Stage 1 | | Stage 2 | | Stage 3 | | Total | | Stage 1 | | Stage 2 | | Stage 3 | | Total |
| £m | | £m | | £m | | £m | | £m | | £m | | £m | | £m |
| At 31 December 2020 | | | | | | | | | | | | | | | |
| Loans and advances to banks: | | | | | | | | | | | | | | | |
| CMS 1-10 | 5,660 | | | 0 | | | 0 | | | 5,660 | | | 4 | | | 0 | | | 0 | | | 4 | |
| CMS 11-14 | 0 | | | 0 | | | 0 | | | 0 | | | 0 | | | 0 | | | 0 | | | 0 | |
| CMS 15-18 | 0 | | | 0 | | | 0 | | | 0 | | | 0 | | | 0 | | | 0 | | | 0 | |
| CMS 19 | 0 | | | 0 | | | 0 | | | 0 | | | 0 | | | 0 | | | 0 | | | 0 | |
| CMS 20-23 | 0 | | | 0 | | | 0 | | | 0 | | | 0 | | | 0 | | | 0 | | | 0 | |
| 5,660 | | | 0 | | | 0 | | | 5,660 | | | 4 | | | 0 | | | 0 | | | 4 | |
| Loans and advances to customers: | | | | | | | | | | | | | | | |
| Retail - UK mortgages | | | | | | | | | | | | | | | |
| RMS 1-6 | 41,423 | | | 4,152 | | | 0 | | | 45,575 | | | 8 | | | 24 | | | 0 | | | 32 | |
| RMS 7-9 | 2 | | | 1,442 | | | 0 | | | 1,444 | | | 0 | | | 11 | | | 0 | | | 11 | |
| RMS 10 | 0 | | | 137 | | | 0 | | | 137 | | | 0 | | | 3 | | | 0 | | | 3 | |
| RMS 11-13 | 0 | | | 946 | | | 0 | | | 946 | | | 0 | | | 18 | | | 0 | | | 18 | |
| RMS 14 | 0 | | | 0 | | | 568 | | | 568 | | | 0 | | | 0 | | | 32 | | | 32 | |
| 41,425 | | | 6,677 | | | 568 | | | 48,670 | | | 8 | | | 56 | | | 32 | | | 96 | |
| Retail - credit cards | | | | | | | | | | | | | | | |
| RMS 1-6 | 2,248 | | | 363 | | | 0 | | | 2,611 | | | 18 | | | 17 | | | 0 | | | 35 | |
| RMS 7-9 | 290 | | | 342 | | | 0 | | | 632 | | | 14 | | | 45 | | | 0 | | | 59 | |
| RMS 10 | 2 | | | 94 | | | 0 | | | 96 | | | 0 | | | 22 | | | 0 | | | 22 | |
| RMS 11-13 | 0 | | | 134 | | | 0 | | | 134 | | | 0 | | | 57 | | | 0 | | | 57 | |
| RMS 14 | 0 | | | 0 | | | 88 | | | 88 | | | 0 | | | 0 | | | 40 | | | 40 | |
| 2,540 | | | 933 | | | 88 | | | 3,561 | | | 32 | | | 141 | | | 40 | | | 213 | |
| Retail - loans and overdrafts | | | | | | | | | | | | | | | |
| RMS 1-6 | 2,930 | | | 162 | | | 0 | | | 3,092 | | | 44 | | | 8 | | | 0 | | | 52 | |
| RMS 7-9 | 1,109 | | | 265 | | | 0 | | | 1,374 | | | 56 | | | 30 | | | 0 | | | 86 | |
| RMS 10 | 64 | | | 102 | | | 0 | | | 166 | | | 7 | | | 21 | | | 0 | | | 28 | |
| RMS 11-13 | 22 | | | 266 | | | 0 | | | 288 | | | 4 | | | 102 | | | 0 | | | 106 | |
| RMS 14 | 0 | | | 0 | | | 173 | | | 173 | | | 0 | | | 0 | | | 84 | | | 84 | |
| 4,125 | | | 795 | | | 173 | | | 5,093 | | | 111 | | | 161 | | | 84 | | | 356 | |
| Retail - UK Motor Finance | | | | | | | | | | | | | | | |
| RMS 1-6 | 382 | | | 40 | | | 0 | | | 422 | | | 7 | | | 2 | | | 0 | | | 9 | |
| RMS 7-9 | 6 | | | 18 | | | 0 | | | 24 | | | 0 | | | 1 | | | 0 | | | 1 | |
| RMS 10 | 0 | | | 9 | | | 0 | | | 9 | | | 0 | | | 2 | | | 0 | | | 2 | |
| RMS 11-13 | 0 | | | 13 | | | 0 | | | 13 | | | 0 | | | 5 | | | 0 | | | 5 | |
| RMS 14 | 0 | | | 0 | | | 44 | | | 44 | | | 0 | | | 0 | | | 26 | | | 26 | |
| 388 | | | 80 | | | 44 | | | 512 | | | 7 | | | 10 | | | 26 | | | 43 | |
| Retail - other | | | | | | | | | | | | | | | |
| RMS 1-6 | 5,173 | | | 188 | | | 0 | | | 5,361 | | | 9 | | | 11 | | | 0 | | | 20 | |
| RMS 7-9 | 2,186 | | | 214 | | | 0 | | | 2,400 | | | 10 | | | 32 | | | 0 | | | 42 | |
| RMS 10 | 0 | | | 0 | | | 0 | | | 0 | | | 0 | | | 0 | | | 0 | | | 0 | |
| RMS 11-13 | 345 | | | 395 | | | 0 | | | 740 | | | 0 | | | 35 | | | 0 | | | 35 | |
| RMS 14 | 0 | | | 0 | | | 123 | | | 123 | | | 0 | | | 0 | | | 37 | | | 37 | |
| 7,704 | | | 797 | | | 123 | | | 8,624 | | | 19 | | | 78 | | | 37 | | | 134 | |
| Total Retail | 56,182 | | | 9,282 | | | 996 | | | 66,460 | | | 177 | | | 446 | | | 219 | | | 842 | |
NOTES TO THE ACCOUNTS
for the year ended 31 December 2020
45 FINANCIAL RISK MANAGEMENT (continued)
| | | | | | | | | | | | | | | | | | | | | | | | | | | | | | | | | | | | | | | | | | | | | | | |
| Drawn exposures | | Expected credit loss allowance |
| The Bank - Gross drawn exposures and expected credit loss allowances continued | Stage 1 | | Stage 2 | | Stage 3 | | Total | | Stage 1 | | Stage 2 | | Stage 3 | | Total |
| £m | | £m | | £m | | £m | | £m | | £m | | £m | | £m |
| At 31 December 2020 | | | | | | | | | | | | | | | |
| Commercial | | | | | | | | | | | | | | | |
| CMS 1-10 | 17,907 | | | 175 | | | 0 | | | 18,082 | | | 20 | | | 0 | | | 0 | | | 20 | |
| CMS 11-14 | 22,449 | | | 5,928 | | | 0 | | | 28,377 | | | 114 | | | 94 | | | 0 | | | 208 | |
| CMS 15-18 | 3,722 | | | 5,548 | | | 0 | | | 9,270 | | | 76 | | | 332 | | | 0 | | | 408 | |
| CMS 19 | 0 | | | 549 | | | 0 | | | 549 | | | 0 | | | 101 | | | 0 | | | 101 | |
| CMS 20-23 | 0 | | | 0 | | | 1,865 | | | 1,865 | | | 0 | | | 0 | | | 496 | | | 496 | |
| 44,078 | | | 12,200 | | | 1,865 | | | 58,143 | | | 210 | | | 527 | | | 496 | | | 1,233 | |
| Other | | | | | | | | | | | | | | | |
| RMS 1-6 | 230 | | | 12 | | | 0 | | | 242 | | | 2 | | | 1 | | | 0 | | | 3 | |
| RMS 7-9 | 0 | | | 0 | | | 0 | | | 0 | | | 0 | | | 0 | | | 0 | | | 0 | |
| RMS 10 | 0 | | | 0 | | | 0 | | | 0 | | | 0 | | | 0 | | | 0 | | | 0 | |
| RMS 11-13 | 0 | | | 0 | | | 0 | | | 0 | | | 0 | | | 0 | | | 0 | | | 0 | |
| RMS 14 | 0 | | | 0 | | | 6 | | | 6 | | | 0 | | | 0 | | | 3 | | | 3 | |
| 230 | | | 12 | | | 6 | | | 248 | | | 2 | | | 1 | | | 3 | | | 6 | |
| CMS 1-10 | 55,595 | | | 0 | | | 0 | | | 55,595 | | | 0 | | | 0 | | | 0 | | | 0 | |
| CMS 11-14 | 104 | | | 0 | | | 0 | | | 104 | | | 0 | | | 0 | | | 0 | | | 0 | |
| CMS 15-18 | 0 | | | 0 | | | 0 | | | 0 | | | 0 | | | 0 | | | 0 | | | 0 | |
| CMS 19 | 0 | | | 0 | | | 0 | | | 0 | | | 0 | | | 0 | | | 0 | | | 0 | |
| CMS 20-23 | 0 | | | 0 | | | 0 | | | 0 | | | 0 | | | 0 | | | 0 | | | 0 | |
| 55,699 | | | 0 | | | 0 | | | 55,699 | | | 0 | | | 0 | | | 0 | | | 0 | |
| Central overlay | 0 | | | 0 | | | 0 | | | 0 | | | 200 | | | 0 | | | 0 | | | 200 | |
| Total loans and advances to customers | 156,189 | | | 21,494 | | | 2,867 | | | 180,550 | | | 589 | | | 974 | | | 718 | | | 2,281 | |
| | | | | | | | | | | | | | | |
| In respect of: | | | | | | | | | | | | | | | |
| Retail | 56,182 | | | 9,282 | | | 996 | | | 66,460 | | | 177 | | | 446 | | | 219 | | | 842 | |
| Commercial | 44,078 | | | 12,200 | | | 1,865 | | | 58,143 | | | 210 | | | 527 | | | 496 | | | 1,233 | |
Other1 | 55,929 | | | 12 | | | 6 | | | 55,947 | | | 202 | | | 1 | | | 3 | | | 206 | |
| Total loans and advances to customers | 156,189 | | | 21,494 | | | 2,867 | | | 180,550 | | | 589 | | | 974 | | | 718 | | | 2,281 | |
1Principally comprises reverse repurchase agreement balances.
NOTES TO THE ACCOUNTS
for the year ended 31 December 2020
45 FINANCIAL RISK MANAGEMENT (continued)
| | | | | | | | | | | | | | | | | | | | | | | | | | | | | | | | | | | | | | | | | | | | | | | |
| Undrawn exposures | | Expected credit loss allowance |
| The Bank - Gross undrawn exposures and expected credit loss allowances | Stage 1 | | Stage 2 | | Stage 3 | | Total | | Stage 1 | | Stage 2 | | Stage 3 | | Total |
| £m | | £m | | £m | | £m | | £m | | £m | | £m | | £m |
| At 31 December 2020 | | | | | | | | | | | | | | | |
| Loans and advances to customers: | | | | | | | | | | | | | | | |
| Retail - UK mortgages | | | | | | | | | | | | | | | |
| RMS 1-6 | 1,720 | | | 0 | | | 0 | | | 1,720 | | | 0 | | | 0 | | | 0 | | | 0 | |
| RMS 7-9 | 0 | | | 0 | | | 0 | | | 0 | | | 0 | | | 0 | | | 0 | | | 0 | |
| RMS 10 | 0 | | | 0 | | | 0 | | | 0 | | | 0 | | | 0 | | | 0 | | | 0 | |
| RMS 11-13 | 0 | | | 0 | | | 0 | | | 0 | | | 0 | | | 0 | | | 0 | | | 0 | |
| RMS 14 | 0 | | | 0 | | | 0 | | | 0 | | | 0 | | | 0 | | | 0 | | | 0 | |
| 1,720 | | | 0 | | | 0 | | | 1,720 | | | 0 | | | 0 | | | 0 | | | 0 | |
| Retail - credit cards | | | | | | | | | | | | | | | |
| RMS 1-6 | 14,814 | | | 1,081 | | | 0 | | | 15,895 | | | 17 | | | 19 | | | 0 | | | 36 | |
| RMS 7-9 | 154 | | | 154 | | | 0 | | | 308 | | | 3 | | | 4 | | | 0 | | | 7 | |
| RMS 10 | 3 | | | 21 | | | 0 | | | 24 | | | 0 | | | 1 | | | 0 | | | 1 | |
| RMS 11-13 | 0 | | | 24 | | | 0 | | | 24 | | | 0 | | | 2 | | | 0 | | | 2 | |
| RMS 14 | 0 | | | 0 | | | 13 | | | 13 | | | 0 | | | 0 | | | 0 | | | 0 | |
| 14,971 | | | 1,280 | | | 13 | | | 16,264 | | | 20 | | | 26 | | | 0 | | | 46 | |
| Retail - loan and overdrafts | | | | | | | | | | | | | | | |
| RMS 1-6 | 3,414 | | | 99 | | | 0 | | | 3,513 | | | 8 | | | 4 | | | 0 | | | 12 | |
| RMS 7-9 | 160 | | | 74 | | | 0 | | | 234 | | | 4 | | | 8 | | | 0 | | | 12 | |
| RMS 10 | 8 | | | 22 | | | 0 | | | 30 | | | 1 | | | 4 | | | 0 | | | 5 | |
| RMS 11-13 | 2 | | | 42 | | | 0 | | | 44 | | | 0 | | | 12 | | | 0 | | | 12 | |
| RMS 14 | 0 | | | 0 | | | 10 | | | 10 | | | 0 | | | 0 | | | 0 | | | 0 | |
| 3,584 | | | 237 | | | 10 | | | 3,831 | | | 13 | | | 28 | | | 0 | | | 41 | |
| Retail - UK Motor Finance | | | | | | | | | | | | | | | |
| RMS 1-6 | 24 | | | 0 | | | 0 | | | 24 | | | 0 | | | 0 | | | 0 | | | 0 | |
| RMS 7-9 | 0 | | | 0 | | | 0 | | | 0 | | | 0 | | | 0 | | | 0 | | | 0 | |
| RMS 10 | 0 | | | 0 | | | 0 | | | 0 | | | 0 | | | 0 | | | 0 | | | 0 | |
| RMS 11-13 | 0 | | | 0 | | | 0 | | | 0 | | | 0 | | | 0 | | | 0 | | | 0 | |
| RMS 14 | 0 | | | 0 | | | 0 | | | 0 | | | 0 | | | 0 | | | 0 | | | 0 | |
| 24 | | | 0 | | | 0 | | | 24 | | | 0 | | | 0 | | | 0 | | | 0 | |
| Retail - other | | | | | | | | | | | | | | | |
| RMS 1-6 | 923 | | | 18 | | | 0 | | | 941 | | | 6 | | | 2 | | | 0 | | | 8 | |
| RMS 7-9 | 131 | | | 31 | | | 0 | | | 162 | | | 8 | | | 12 | | | 0 | | | 20 | |
| RMS 10 | 0 | | | 0 | | | 0 | | | 0 | | | 0 | | | 0 | | | 0 | | | 0 | |
| RMS 11-13 | 0 | | | 10 | | | 0 | | | 10 | | | — | | | 6 | | | 0 | | | 6 | |
| RMS 14 | 0 | | | 0 | | | 1 | | | 1 | | | 0 | | | 0 | | | 0 | | | 0 | |
| 1,054 | | | 59 | | | 1 | | | 1,114 | | | 14 | | | 20 | | | 0 | | | 34 | |
| Total Retail | 21,353 | | | 1,576 | | | 24 | | | 22,953 | | | 47 | | | 74 | | | 0 | | | 121 | |
NOTES TO THE ACCOUNTS
for the year ended 31 December 2020
45 FINANCIAL RISK MANAGEMENT (continued)
| | | | | | | | | | | | | | | | | | | | | | | | | | | | | | | | | | | | | | | | | | | | | | | |
| Undrawn exposures | | Expected credit loss allowance |
| The Bank - Gross undrawn exposures and expected credit loss allowances continued | Stage 1 | | Stage 2 | | Stage 3 | | Total | | Stage 1 | | Stage 2 | | Stage 3 | | Total |
| £m | | £m | | £m | | £m | | £m | | £m | | £m | | £m |
| At 31 December 2020 | | | | | | | | | | | | | | | |
| Commercial | | | | | | | | | | | | | | | |
| CMS 1-10 | 27,598 | | | 0 | | | 0 | | | 27,598 | | | 14 | | | 0 | | | 0 | | | 14 | |
| CMS 11-14 | 8,105 | | | 1,239 | | | 0 | | | 9,344 | | | 26 | | | 13 | | | 0 | | | 39 | |
| CMS 15-18 | 829 | | | 1,057 | | | 0 | | | 1,886 | | | 13 | | | 41 | | | 0 | | | 54 | |
| CMS 19 | 0 | | | 54 | | | 0 | | | 54 | | | 0 | | | 7 | | | 0 | | | 7 | |
| CMS 20-23 | 0 | | | 0 | | | 189 | | | 189 | | | 0 | | | 0 | | | 8 | | | 8 | |
| 36,532 | | | 2,350 | | | 189 | | | 39,071 | | | 53 | | | 61 | | | 8 | | | 122 | |
| Other | | | | | | | | | | | | | | | |
| RMS 1-6 | 242 | | | 0 | | | 0 | | | 242 | | | 2 | | | 0 | | | 0 | | | 2 | |
| RMS 7-9 | 0 | | | 0 | | | 0 | | | 0 | | | 0 | | | 0 | | | 0 | | | 0 | |
| RMS 10 | 0 | | | 0 | | | 0 | | | 0 | | | 0 | | | 0 | | | 0 | | | 0 | |
| RMS 11-13 | 0 | | | 0 | | | 0 | | | 0 | | | 0 | | | 0 | | | 0 | | | 0 | |
| RMS 14 | 0 | | | 0 | | | 0 | | | 0 | | | 0 | | | 0 | | | 0 | | | 0 | |
| 242 | | | 0 | | | 0 | | | 242 | | | 2 | | | 0 | | | 0 | | | 2 | |
| CMS 1-10 | 500 | | | 0 | | | 0 | | | 500 | | | 0 | | | 0 | | | 0 | | | 0 | |
| CMS 11-14 | 0 | | | 0 | | | 0 | | | 0 | | | 0 | | | 0 | | | 0 | | | 0 | |
| CMS 15-18 | 0 | | | 0 | | | 0 | | | 0 | | | 0 | | | 0 | | | 0 | | | 0 | |
| CMS 19 | 0 | | | 0 | | | 0 | | | 0 | | | 0 | | | 0 | | | 0 | | | 0 | |
| CMS 20-23 | 0 | | | 0 | | | 0 | | | 0 | | | 0 | | | 0 | | | 0 | | | 0 | |
| 500 | | | 0 | | | 0 | | | 500 | | | 0 | | | 0 | | | 0 | | | 0 | |
| Total loans and advances to customers | 58,627 | | | 3,926 | | | 213 | | | 62,766 | | | 102 | | | 135 | | | 8 | | | 245 | |
| | | | | | | | | | | | | | | |
| In respect of: | | | | | | | | | | | | | | | |
| Retail | 21,353 | | | 1,576 | | | 24 | | | 22,953 | | | 47 | | | 74 | | | 0 | | | 121 | |
| Commercial | 36,532 | | | 2,350 | | | 189 | | | 39,071 | | | 53 | | | 61 | | | 8 | | | 122 | |
| Other | 742 | | | 0 | | | 0 | | | 742 | | | 2 | | | 0 | | | 0 | | | 2 | |
| Total loans and advances to customers | 58,627 | | | 3,926 | | | 213 | | | 62,766 | | | 102 | | | 135 | | | 8 | | | 245 | |
NOTES TO THE ACCOUNTS
for the year ended 31 December 2020
45 FINANCIAL RISK MANAGEMENT (continued)
| | | | | | | | | | | | | | | | | | | | | | | | | | | | | | | | | | | | | | | | | | | | | | | |
| Drawn exposures | | Expected credit loss allowance |
| The Bank - Gross drawn exposures and expected credit loss allowances | Stage 1 | | Stage 2 | | Stage 3 | | Total | | Stage 1 | | Stage 2 | | Stage 3 | | Total |
| £m | | £m | | £m | | £m | | £m | | £m | | £m | | £m |
| At 31 December 2019 | | | | | | | | | | | | | | | |
| Loans and advances to banks: | | | | | | | | | | | | | | | |
| CMS 1-10 | 4,453 | | | 0 | | | 0 | | | 4,453 | | | 0 | | | 0 | | | 0 | | | 0 | |
| CMS 11-14 | 0 | | | 0 | | | 0 | | | 0 | | | 0 | | | 0 | | | 0 | | | 0 | |
| CMS 15-18 | 0 | | | 0 | | | 0 | | | 0 | | | 0 | | | 0 | | | 0 | | | 0 | |
| CMS 19 | 0 | | | 0 | | | 0 | | | 0 | | | 0 | | | 0 | | | 0 | | | 0 | |
| CMS 20-23 | 0 | | | 0 | | | 0 | | | 0 | | | 0 | | | 0 | | | 0 | | | 0 | |
| 4,453 | | | 0 | | | 0 | | | 4,453 | | | 0 | | | 0 | | | 0 | | | 0 | |
| Loans and advances to customers: | | | | | | | | | | | | | | | |
| Retail - UK mortgages | | | | | | | | | | | | | | | |
| RMS 1-6 | 46,904 | | | 2,972 | | | 0 | | | 49,876 | | | 2 | | | 28 | | | 0 | | | 30 | |
| RMS 7-9 | 0 | | | 510 | | | 0 | | | 510 | | | 0 | | | 7 | | | 0 | | | 7 | |
| RMS 10 | 0 | | | 116 | | | 0 | | | 116 | | | 0 | | | 3 | | | 0 | | | 3 | |
| RMS 11-13 | 0 | | | 291 | | | 0 | | | 291 | | | 0 | | 9 | | | 0 | | | 9 | |
| RMS 14 | 0 | | | 0 | | | 558 | | | 558 | | | 0 | | | 0 | | | 30 | | | 30 | |
| 46,904 | | | 3,889 | | | 558 | | | 51,351 | | | 2 | | | 47 | | | 30 | | | 79 | |
| Retail - credit cards | | | | | | | | | | | | | | | |
| RMS 1-6 | 3,568 | | | 146 | | | 0 | | | 3,714 | | | 22 | | | 6 | | | 0 | | | 28 | |
| RMS 7-9 | 363 | | | 183 | | | 0 | | | 546 | | | 14 | | | 20 | | | 0 | | | 34 | |
| RMS 10 | 12 | | | 38 | | | 0 | | | 50 | | | 1 | | | 7 | | | 0 | | | 8 | |
| RMS 11-13 | 0 | | | 90 | | | 0 | | | 90 | | | 0 | | | 30 | | | 0 | | | 30 | |
| RMS 14 | 0 | | | 0 | | | 92 | | | 92 | | | 0 | | | 0 | | | 31 | | | 31 | |
| 3,943 | | | 457 | | | 92 | | | 4,492 | | | 37 | | | 63 | | | 31 | | | 131 | |
| Retail - loans and overdrafts | | | | | | | | | | | | | | | |
| RMS 1-6 | 4,018 | | | 152 | | | 0 | | | 4,170 | | | 47 | | | 7 | | | 0 | | | 54 | |
| RMS 7-9 | 774 | | | 199 | | | 0 | | | 973 | | | 32 | | | 21 | | | 0 | | | 53 | |
| RMS 10 | 26 | | | 51 | | | 0 | | | 77 | | | 3 | | | 9 | | | 0 | | | 12 | |
| RMS 11-13 | 8 | | | 184 | | | 0 | | | 192 | | | 2 | | | 59 | | | 0 | | | 61 | |
| RMS 14 | 0 | | | 0 | | | 168 | | | 168 | | | 0 | | | 0 | | | 62 | | | 62 | |
| 4,826 | | | 586 | | | 168 | | | 5,580 | | | 84 | | | 96 | | | 62 | | | 242 | |
| Retail - UK Motor Finance | | | | | | | | | | | | | | | |
| RMS 1-6 | 1,076 | | | 135 | | | 0 | | | 1,211 | | | 21 | | | 4 | | | 0 | | | 25 | |
| RMS 7-9 | 22 | | | 54 | | | 0 | | | 76 | | | 1 | | | 3 | | | 0 | | | 4 | |
| RMS 10 | 0 | | | 17 | | | 0 | | | 17 | | | 0 | | | 2 | | | 0 | | | 2 | |
| RMS 11-13 | 0 | | | 34 | | | 0 | | | 34 | | | 0 | | | 7 | | | 0 | | | 7 | |
| RMS 14 | 0 | | | 0 | | | 60 | | | 60 | | | 0 | | | 0 | | | 32 | | | 32 | |
| 1,098 | | | 240 | | | 60 | | | 1,398 | | | 22 | | | 16 | | | 32 | | | 70 | |
| Retail - other | | | | | | | | | | | | | | | |
| RMS 1-6 | 1,958 | | | 156 | | | 0 | | | 2,114 | | | 18 | | | 4 | | | 0 | | | 22 | |
| RMS 7-9 | 7 | | | 281 | | | 0 | | | 288 | | | 0 | | | 20 | | | 0 | | | 20 | |
| RMS 10 | 0 | | | 0 | | | 0 | | | 0 | | | 0 | | | 0 | | | 0 | | | 0 | |
| RMS 11-13 | 0 | | | 0 | | | 0 | | | 0 | | | 0 | | | 0 | | | 0 | | | 0 | |
| RMS 14 | 0 | | | 0 | | | 105 | | | 105 | | | 0 | | | 0 | | | 35 | | | 35 | |
| 1,965 | | | 437 | | | 105 | | | 2,507 | | | 18 | | | 24 | | | 35 | | | 77 | |
| Total Retail | 58,736 | | | 5,609 | | | 983 | | | 65,328 | | | 163 | | | 246 | | | 190 | | | 599 | |
NOTES TO THE ACCOUNTS
for the year ended 31 December 2020
45 FINANCIAL RISK MANAGEMENT (continued)
| | | | | | | | | | | | | | | | | | | | | | | | | | | | | | | | | | | | | | | | | | | | | | | |
| Drawn exposures | | Expected credit loss allowance |
| The Bank - Gross drawn exposures and expected credit loss allowances continued | Stage 1 | | Stage 2 | | Stage 3 | | Total | | Stage 1 | | Stage 2 | | Stage 3 | | Total |
| £m | | £m | | £m | | £m | | £m | | £m | | £m | | £m |
| At 31 December 2019 | | | | | | | | | | | | | | | |
| Commercial | | | | | | | | | | | | | | | |
| CMS 1-10 | 32,465 | | | 380 | | | 0 | | | 32,845 | | | 25 | | | 1 | | | 0 | | | 26 | |
| CMS 11-14 | 20,141 | | | 2,030 | | | 0 | | | 22,171 | | | 40 | | | 33 | | | 0 | | | 73 | |
| CMS 15-18 | 1,462 | | | 2,519 | | | 0 | | | 3,981 | | | 10 | | | 145 | | | 0 | | | 155 | |
| CMS 19 | 0 | | | 111 | | | 0 | | | 111 | | | 0 | | | 10 | | | 0 | | | 10 | |
| CMS 20-23 | 0 | | | 0 | | | 1,400 | | | 1,400 | | | 0 | | | 0 | | | 309 | | | 309 | |
| 54,068 | | | 5,040 | | | 1,400 | | | 60,508 | | | 75 | | | 189 | | | 309 | | | 573 | |
| Other | | | | | | | | | | | | | | | |
| RMS 1-6 | 267 | | | 32 | | | 0 | | | 299 | | | 0 | | | 0 | | | 0 | | | 0 | |
| RMS 7-9 | 0 | | | 0 | | | 0 | | | 0 | | | 0 | | | 0 | | | 0 | | | 0 | |
| RMS 10 | 0 | | | 0 | | | 0 | | | 0 | | | 0 | | | 0 | | | 0 | | | 0 | |
| RMS 11-13 | 0 | | | 0 | | | 0 | | | 0 | | | 0 | | | 0 | | | 0 | | | 0 | |
| RMS 14 | 0 | | | 0 | | | 2 | | | 2 | | | 0 | | | 0 | | | 1 | | | 1 | |
| 267 | | | 32 | | | 2 | | | 301 | | | 0 | | | 0 | | | 1 | | | 1 | |
| CMS 1-10 | 52,605 | | | 0 | | | 0 | | | 52,605 | | | 0 | | | 0 | | | 0 | | | 0 | |
| CMS 11-14 | 0 | | | 0 | | | 0 | | | 0 | | | 0 | | | 0 | | | 0 | | | 0 | |
| CMS 15-18 | 0 | | | 0 | | | 0 | | | 0 | | | 0 | | | 0 | | | 0 | | | 0 | |
| CMS 19 | 0 | | | 0 | | | 0 | | | 0 | | | 0 | | | 0 | | | 0 | | | 0 | |
| CMS 20-23 | 0 | | | 0 | | | 0 | | | 0 | | | 0 | | | 0 | | | 0 | | | 0 | |
| 52,605 | | | 0 | | | 0 | | | 52,605 | | | 0 | | | 0 | | | 0 | | | 0 | |
| Total loans and advances to customers | 165,676 | | | 10,681 | | | 2,385 | | | 178,742 | | | 238 | | | 435 | | | 500 | | | 1,173 | |
| | | | | | | | | | | | | | | |
| In respect of: | | | | | | | | | | | | | | | |
| Retail | 58,736 | | | 5,609 | | | 983 | | | 65,328 | | | 163 | | | 246 | | | 190 | | | 599 | |
| Commercial | 54,068 | | | 5,040 | | | 1,400 | | | 60,508 | | | 75 | | | 189 | | | 309 | | | 573 | |
Other1 | 52,872 | | | 32 | | | 2 | | | 52,906 | | | 0 | | | 0 | | | 1 | | | 1 | |
| Total loans and advances to customers | 165,676 | | | 10,681 | | | 2,385 | | | 178,742 | | | 238 | | | 435 | | | 500 | | | 1,173 | |
1Principally comprises reverse repurchase agreement balances.
NOTES TO THE ACCOUNTS
for the year ended 31 December 2020
45 FINANCIAL RISK MANAGEMENT (continued)
| | | | | | | | | | | | | | | | | | | | | | | | | | | | | | | | | | | | | | | | | | | | | | | |
| Undrawn exposures | | Expected credit loss allowance |
| The Bank - Gross undrawn exposures and expected credit loss allowances | Stage 1 | | Stage 2 | | Stage 3 | | Total | | Stage 1 | | Stage 2 | | Stage 3 | | Total |
| £m | | £m | | £m | | £m | | £m | | £m | | £m | | £m |
| At 31 December 2019 | | | | | | | | | | | | | | | |
| Loans and advances to customers: | | | | | | | | | | | | | | | |
| Retail - UK mortgages | | | | | | | | | | | | | | | |
| RMS 1-6 | 1,120 | | | 0 | | | 0 | | | 1,120 | | | 0 | | | 0 | | | 0 | | | 0 | |
| RMS 7-9 | 0 | | | 0 | | | 0 | | | 0 | | | 0 | | | 0 | | | 0 | | | 0 | |
| RMS 10 | 0 | | | 0 | | | 0 | | | 0 | | | 0 | | | 0 | | | 0 | | | 0 | |
| RMS 11-13 | 0 | | | 0 | | | 0 | | | 0 | | | 0 | | | 0 | | | 0 | | | 0 | |
| RMS 14 | 0 | | | 0 | | | 0 | | | 0 | | | 0 | | | 0 | | | 0 | | | 0 | |
| 1,120 | | | 0 | | | 0 | | | 1,120 | | | 0 | | | 0 | | | 0 | | | 0 | |
| Retail - credit cards | | | | | | | | | | | | | | | |
| RMS 1-6 | 15,052 | | | 369 | | | 0 | | | 15,421 | | | 12 | | | 7 | | | 0 | | | 19 | |
| RMS 7-9 | 96 | | | 60 | | | 0 | | | 156 | | | 1 | | | 1 | | | 0 | | | 2 | |
| RMS 10 | 1 | | | 8 | | | 0 | | | 9 | | | 0 | | | 0 | | | 0 | | | 0 | |
| RMS 11-13 | 0 | | | 11 | | | 0 | | | 11 | | | 0 | | | 1 | | | 0 | | | 1 | |
| RMS 14 | 0 | | | 0 | | | 13 | | | 13 | | | 0 | | | 0 | | | 0 | | | 0 | |
| 15,149 | | | 448 | | | 13 | | | 15,610 | | | 13 | | | 9 | | | 0 | | | 22 | |
| Retail - loans and overdrafts | | | | | | | | | | | | | | | |
| RMS 1-6 | 3,619 | | | 68 | | | 0 | | | 3,687 | | | 7 | | | 2 | | | 0 | | | 9 | |
| RMS 7-9 | 59 | | | 31 | | | 0 | | | 90 | | | 1 | | | 3 | | | 0 | | | 4 | |
| RMS 10 | 1 | | | 7 | | | 0 | | | 8 | | | 0 | | | 1 | | | 0 | | | 1 | |
| RMS 11-13 | 0 | | | 17 | | | 0 | | | 17 | | | 0 | | | 8 | | | 0 | | | 8 | |
| RMS 14 | 0 | | | 0 | | | 5 | | | 5 | | | 0 | | | 0 | | | 0 | | | 0 | |
| 3,679 | | | 123 | | | 5 | | | 3,807 | | | 8 | | | 14 | | | 0 | | | 22 | |
| Retail - UK Motor Finance | | | | | | | | | | | | | | | |
| RMS 1-6 | 84 | | | 0 | | | 0 | | | 84 | | | 0 | | | 0 | | | 0 | | | 0 | |
| RMS 7-9 | 13 | | | 4 | | | 0 | | | 17 | | | 0 | | | 0 | | | 0 | | | 0 | |
| RMS 10 | 0 | | | 0 | | | 0 | | | 0 | | | 0 | | | 0 | | | 0 | | | 0 | |
| RMS 11-13 | 0 | | | 0 | | | 0 | | | 0 | | | 0 | | | 0 | | | 0 | | | 0 | |
| RMS 14 | 0 | | | 0 | | | 0 | | | 0 | | | 0 | | | 0 | | | 0 | | | 0 | |
| 97 | | | 4 | | | 0 | | | 101 | | | 0 | | | 0 | | | 0 | | | 0 | |
| Retail - other | | | | | | | | | | | | | | | |
| RMS 1-6 | 839 | | | 0 | | | 0 | | | 839 | | | 10 | | | 0 | | | 0 | | | 10 | |
| RMS 7-9 | 0 | | | 54 | | | 0 | | | 54 | | | 0 | | | 3 | | | 0 | | | 3 | |
| RMS 10 | 0 | | | 0 | | | 0 | | | 0 | | | 0 | | | 0 | | | 0 | | | 0 | |
| RMS 11-13 | 0 | | | 0 | | | 0 | | | 0 | | | 0 | | | 0 | | | 0 | | | 0 | |
| RMS 14 | — | | | 0 | | | 2 | | | 2 | | | 0 | | | 0 | | | 0 | | | 0 | |
| 839 | | | 54 | | | 2 | | | 895 | | | 10 | | | 3 | | | 0 | | | 13 | |
| Total Retail | 20,884 | | | 629 | | | 20 | | | 21,533 | | | 31 | | | 26 | | | 0 | | | 57 | |
NOTES TO THE ACCOUNTS
for the year ended 31 December 2020
45 FINANCIAL RISK MANAGEMENT (continued)
| | | | | | | | | | | | | | | | | | | | | | | | | | | | | | | | | | | | | | | | | | | | | | | |
| Undrawn exposures | | Expected credit loss allowance |
| The Bank - Gross undrawn exposures and expected credit loss allowances continued | Stage 1 | | Stage 2 | | Stage 3 | | Total | | Stage 1 | | Stage 2 | | Stage 3 | | Total |
| £m | | £m | | £m | | £m | | £m | | £m | | £m | | £m |
| At 31 December 2019 | | | | | | | | | | | | | | | |
| Commercial | | | | | | | | | | | | | | | |
| CMS 1-10 | 25,847 | | | 44 | | | 0 | | | 25,891 | | | 5 | | | 0 | | | 0 | | | 5 | |
| CMS 11-14 | 3,771 | | | 718 | | | 0 | | | 4,489 | | | 7 | | | 5 | | | 0 | | | 12 | |
| CMS 15-18 | 197 | | | 206 | | | 0 | | | 403 | | | 1 | | | 9 | | | 0 | | | 10 | |
| CMS 19 | 0 | | | 38 | | | 0 | | | 38 | | | 0 | | | 2 | | | 0 | | | 2 | |
| CMS 20-23 | 0 | | | 0 | | | 4 | | | 4 | | | 0 | | | 0 | | | 4 | | | 4 | |
| 29,815 | | | 1,006 | | | 4 | | | 30,825 | | | 13 | | | 16 | | | 4 | | | 33 | |
| Other | | | | | | | | | | | | | | | |
| RMS 1-6 | 191 | | | 0 | | | 0 | | | 191 | | | 0 | | | 0 | | | 0 | | | 0 | |
| RMS 7-9 | 0 | | | 0 | | | 0 | | | 0 | | | 0 | | | 0 | | | 0 | | | 0 | |
| RMS 10 | 0 | | | 0 | | | 0 | | | 0 | | | 0 | | | 0 | | | 0 | | | 0 | |
| RMS 11-13 | 0 | | | 0 | | | 0 | | | 0 | | | 0 | | | 0 | | | 0 | | | 0 | |
| RMS 14 | 0 | | | 0 | | | 0 | | | 0 | | | 0 | | | 0 | | | 0 | | | 0 | |
| 191 | | | 0 | | | 0 | | | 191 | | | 0 | | | 0 | | | 0 | | | 0 | |
| CMS 1-10 | 0 | | | 0 | | | 0 | | | 0 | | | 0 | | | 0 | | | 0 | | | 0 | |
| CMS 11-14 | 0 | | | 0 | | | 0 | | | 0 | | | 0 | | | 0 | | | 0 | | | 0 | |
| CMS 15-18 | 0 | | | 0 | | | 0 | | | 0 | | | 0 | | | 0 | | | 0 | | | 0 | |
| CMS 19 | 0 | | | 0 | | | 0 | | | 0 | | | 0 | | | 0 | | | 0 | | | 0 | |
| CMS 20-23 | 0 | | | 0 | | | 0 | | | 0 | | | 0 | | | 0 | | | 0 | | | 0 | |
| 0 | | | 0 | | | 0 | | | 0 | | | 0 | | | 0 | | | 0 | | | 0 | |
| Total loans and advances to customers | 50,890 | | | 1,635 | | | 24 | | | 52,549 | | | 44 | | | 42 | | | 4 | | | 90 | |
| | | | | | | | | | | | | | | |
| In respect of: | | | | | | | | | | | | | | | |
| Retail | 20,884 | | | 629 | | | 20 | | | 21,533 | | | 31 | | | 26 | | | 0 | | | 57 | |
| Commercial | 29,815 | | | 1,006 | | | 4 | | | 30,825 | | | 13 | | | 16 | | | 4 | | | 33 | |
| Other | 191 | | | 0 | | | 0 | | | 191 | | | 0 | | | 0 | | | 0 | | | 0 | |
| Total loans and advances to customers | 50,890 | | | 1,635 | | | 24 | | | 52,549 | | | 44 | | | 42 | | | 4 | | | 90 | |
NOTES TO THE ACCOUNTS
for the year ended 31 December 2020
45 FINANCIAL RISK MANAGEMENT (continued)
Debt securities held at amortised cost
An analysis by credit rating of debt securities held at amortised cost is provided below:
| | | | | | | | | | | | | | | | | | | | | | | | | | | | | | | | | | | |
| 2020 | | 2019 |
| Investment grade1 | | Other2 | | Total | | Investment grade1 | | Other2 | | Total |
| The Group | £m | | £m | | £m | | £m | | £m | | £m |
| Asset-backed securities: | | | | | | | | | | | |
| Mortgage-backed securities | 2,046 | | | 0 | | | 2,046 | | | 2,934 | | | 0 | | | 2,934 | |
| Other asset-backed securities | 1,593 | | | 20 | | | 1,613 | | | 874 | | | 0 | | | 874 | |
| 3,639 | | | 20 | | | 3,659 | | | 3,808 | | | 0 | | | 3,808 | |
| Corporate and other debt securities | 1,463 | | | 16 | | | 1,479 | | | 1,517 | | | 1 | | | 1,518 | |
| Gross exposure | 5,102 | | | 36 | | | 5,138 | | | 5,325 | | | 1 | | | 5,326 | |
| Allowance for impairment losses | | | | | (1) | | | | | | | (1) | |
| Total debt securities held at amortised cost | | | | | 5,137 | | | | | | | 5,325 | |
| | | | | | | | | | | |
| The Bank | | | | | | | | | | | |
| Asset-backed securities: | | | | | | | | | | | |
| Mortgage-backed securities | 1,741 | | | 0 | | | 1,741 | | | 2,926 | | | 0 | | | 2,926 | |
| Other asset-backed securities | 1,103 | | | 0 | | | 1,103 | | | 798 | | | 0 | | | 798 | |
| 2,844 | | | 0 | | | 2,844 | | | 3,724 | | | 0 | | | 3,724 | |
| Corporate and other debt securities | 1,457 | | | 15 | | | 1,472 | | | 1,517 | | | 0 | | | 1,517 | |
| Gross exposure | 4,301 | | | 15 | | | 4,316 | | | 5,241 | | | 0 | | | 5,241 | |
| Allowance for impairment losses | | | | | (1) | | | | | | | 0 | |
| Total debt securities held at amortised cost | | | | | 4,315 | | | | | | | 5,241 | |
1Credit ratings equal to or better than ‘BBB’.
2Other comprises sub-investment grade (2020: £8 million for the Group and £NaN for the Bank; 2019: £NaN for the Group and £NaN for the Bank) and not rated (2020: £28 million for the Group and £15 million for the Bank; 2019: £1 million for the Group and £NaN for the Bank).
NOTES TO THE ACCOUNTS
for the year ended 31 December 2020
45 FINANCIAL RISK MANAGEMENT (continued)
Financial assets at fair value through other comprehensive income (excluding equity shares)
An analysis of financial assets at fair value through other comprehensive income is included in note 18. The credit quality of financial assets at fair value through other comprehensive income is set out below:
| | | | | | | | | | | | | | | | | | | | | | | |
| 2020 | | 2019 |
| Investment grade1 | Other2 | Total | | Investment grade1 | Other2 | Total |
| The Group | £m | £m | £m | | £m | £m | £m |
| Debt securities | | | | | | | |
| Government securities | 14,267 | | 0 | | 14,267 | | | 13,082 | | 0 | | 13,082 | |
| Asset-backed securities | 0 | | 65 | | 65 | | | 0 | | 60 | | 60 | |
| Corporate and other debt securities | 12,786 | | 142 | | 12,928 | | | 11,036 | | 0 | | 11,036 | |
| Total debt securities | 27,053 | | 207 | | 27,260 | | | 24,118 | | 60 | | 24,178 | |
| Treasury and other bills | 0 | | 0 | | 0 | | | 439 | | 0 | | 439 | |
| Total financial assets at fair value through other comprehensive income | 27,053 | | 207 | | 27,260 | | | 24,557 | | 60 | | 24,617 | |
1Credit ratings equal to or better than ‘BBB’.
2Other comprises sub-investment grade (2020: £65 million; 2019: £60 million) and not rated (2020: £142 million; 2019: £NaN).
| | | | | | | | | | | | | | | | | | | | | | | |
| 2020 | | 2019 |
| Investment grade1 | Other2 | Total | | Investment grade1 | Other2 | Total |
| The Bank | £m | £m | £m | | £m | £m | £m |
| Debt securities | | | | | | | |
| Government securities | 14,114 | | 0 | | 14,114 | | | 12,938 | | 0 | | 12,938 | |
| Corporate and other debt securities | 10,444 | | 89 | | 10,533 | | | 8,783 | | 0 | | 8,783 | |
| Total debt securities | 24,558 | | 89 | | 24,647 | | | 21,721 | | 0 | | 21,721 | |
| Treasury and other bills | 0 | | 0 | | 0 | | | 439 | | 0 | | 439 | |
| 24,558 | | 89 | | 24,647 | | | 22,160 | | 0 | | 22,160 | |
| Due from fellow Lloyds Banking Group undertakings: | | | | | | | |
| Corporate and other debt securities | | | 0 | | | | | 0 | |
| Total financial assets at fair value through other comprehensive income | | | 24,647 | | | | | 22,160 | |
1Credit ratings equal to or better than ‘BBB’.
2Other comprises sub-investment grade (2020: £NaN; 2019: £NaN) and not rated (2020: £89 million; 2019: £NaN).
NOTES TO THE ACCOUNTS
for the year ended 31 December 2020
45 FINANCIAL RISK MANAGEMENT (continued)
Debt securities, treasury and other bills held at fair value through profit or loss
An analysis of financial assets at fair value through profit or loss is included in note 14. Substantially all of the loans and advances to customers and banks recognised at fair value through profit or loss have a good quality rating. The credit quality of the Group’s debt securities, treasury and other bills held at fair value through profit or loss is set out below.
| | | | | | | | | | | | | | | | | | | | | | | |
| 2020 | | 2019 |
| The Group | Investment grade1 | Other2 | Total | | Investment grade1 | Other2 | Total |
| £m | £m | £m | | £m | £m | £m |
| Trading assets | | | | | | | |
| Government securities | 0 | | 0 | | 0 | | | 290 | | 0 | | 290 | |
| Total held as trading assets | 0 | | 0 | | 0 | | | 290 | | 0 | | 290 | |
| Other assets mandatorily at fair value through profit or loss | | | | | | | |
| Corporate and other debt securities | 0 | | 0 | | 0 | | | 47 | | 0 | | 47 | |
| Total other assets mandatorily at fair value through profit or loss | 0 | | 0 | | 0 | | | 47 | | 0 | | 47 | |
| 0 | | 0 | | 0 | | | 337 | | 0 | | 337 | |
| Due from fellow Lloyds Banking Group undertakings: | | | | | | | |
| Corporate and other debt securities | | | 0 | | | | | 0 | |
| Total held at fair value through profit or loss | | | 0 | | | | | 337 | |
1Credit ratings equal to or better than ‘BBB’.
2Other comprises sub-investment grade (2020: £NaN; 2019: £NaN) and not rated (2020: £NaN; 2019: £NaN).
| | | | | | | | | | | | | | | | | | | | | | | |
| 2020 | | 2019 |
| Investment grade1 | Other2 | Total | | Investment grade1 | Other2 | Total |
| The Bank | £m | £m | £m | | £m | £m | £m |
| Trading assets | | | | | | | |
| Government securities | 0 | | 0 | | 0 | | | 290 | | 0 | | 290 | |
| Total held as trading assets | 0 | | 0 | | 0 | | | 290 | | 0 | | 290 | |
| Other assets mandatorily at fair value through profit or loss | | | | | | | |
| Corporate and other debt securities | 0 | | 0 | | 0 | | | 47 | | 0 | | 47 | |
| Total other assets mandatorily at fair value through profit or loss | 0 | | 0 | | 0 | | | 47 | | 0 | | 47 | |
| 0 | | 0 | | 0 | | | 337 | | 0 | | 337 | |
| Due from fellow Lloyds Banking Group undertakings: | | | | | | | |
| Corporate and other debt securities | | | 1,203 | | | | | 0 | |
| Total held at fair value through profit or loss | | | 1,203 | | | | | 337 | |
1Credit ratings equal to or better than ‘BBB’.
2Other comprises sub-investment grade (2020: £NaN; 2019: £NaN) and not rated (2020: £NaN; 2019: £NaN).
NOTES TO THE ACCOUNTS
for the year ended 31 December 2020
45 FINANCIAL RISK MANAGEMENT (continued)
Derivative assets
An analysis of derivative assets is given in note 15. The Group reduces exposure to credit risk by using master netting agreements and by obtaining collateral in the form of cash or highly liquid securities. In respect of the net credit risk relating to derivative assets of £4,968 million for the Group and £9,843 million for the Bank (2019: £4,317 million for the Group and £10,326 million for the Bank), cash collateral of £2,702 million for the Group and £1,308 million for the Bank (2019: £2,186 million for the Group and £786 million for the Bank) was held and a further £151 million for the Group and £116 million for the Bank (2019: £120 million for the Group and £66 million for the Bank) was due from OECD banks.
| | | | | | | | | | | | | | | | | | | | | | | |
| 2020 | | 2019 |
| Investment grade1 | Other2 | Total | | Investment grade1 | Other2 | Total |
| The Group | £m | £m | £m | | £m | £m | £m |
| Trading and other | 5,942 | | 1,037 | | 6,979 | | | 5,531 | | 1,267 | | 6,798 | |
| Hedging | 667 | | 5 | | 672 | | | 1,047 | | 58 | | 1,105 | |
| 6,609 | | 1,042 | | 7,651 | | | 6,578 | | 1,325 | | 7,903 | |
| Due from fellow Lloyds Banking Group undertakings | | | 690 | | | | | 591 | |
| Total derivative financial instruments | | | 8,341 | | | | | 8,494 | |
| | | | | | | |
| The Bank | | | | | | | |
| Trading and other | 4,442 | | 146 | | 4,588 | | | 4,113 | | 209 | | 4,322 | |
| Hedging | 237 | | 3 | | 240 | | | 178 | | 1 | | 179 | |
| 4,679 | | 149 | | 4,828 | | | 4,291 | | 210 | | 4,501 | |
| Due from fellow Lloyds Banking Group undertakings | | | 7,767 | | | | | 9,137 | |
| Total derivative financial instruments | | | 12,595 | | | | | 13,638 | |
1Credit ratings equal to or better than ‘BBB’.
2Other comprises sub-investment grade (2020: £969 million for the Group and £135 million for the Bank; 2019: £953 million for the Group and £135 million for the Bank) and not rated (2020: £73 million for the Group and £14 million for the Bank; 2019: £372 million for the Group and £75 million for the Bank).
Financial guarantees and irrevocable loan commitments
Financial guarantees represent undertakings that the Group will meet a customer’s obligation to third parties if the customer fails to do so. Commitments to extend credit represent unused portions of authorisations to extend credit in the form of loans, guarantees or letters of credit. The Group is theoretically exposed to loss in an amount equal to the total guarantees or unused commitments, however, the likely amount of loss is expected to be significantly less; most commitments to extend credit are contingent upon customers maintaining specific credit standards.
NOTES TO THE ACCOUNTS
for the year ended 31 December 2020
45 FINANCIAL RISK MANAGEMENT (continued)
D.Collateral held as security for financial assets
The Group holds collateral against loans and advances and irrevocable loan commitments; qualitative and, where appropriate, quantitative information is provided in respect of this collateral below. Collateral held as security for financial assets at fair value through profit or loss and for derivative assets is also shown below.
The Group holds collateral in respect of loans and advances to banks and customers as set out below. The Group does not hold collateral against debt securities, comprising asset-backed securities and corporate and other debt securities, which are classified as financial assets held at amortised cost.
Loans and advances to banks
There were reverse repurchase agreements which are accounted for as collateralised loans within loans and advances to banks with a carrying value of £1,626 million for the Group and the Bank (2019: £408 million for the Group and the Bank), against which the Group and the Bank held collateral with a fair value of £1,040 million (2019: £388 million for the Group and the Bank).
These transactions were generally conducted under terms that are usual and customary for standard secured lending activities.
Loans and advances to customers
Retail lending
Mortgages
An analysis by loan-to-value ratio of the Group’s and the Bank’s residential mortgage lending is provided below. The value of collateral used in determining the loan-to-value ratios has been estimated based upon the last actual valuation, adjusted to take into account subsequent movements in house prices, after making allowances for indexation error and dilapidations.
In some circumstances, where the discounted value of the estimated net proceeds from the liquidation of collateral (i.e. net of costs, expected haircuts and anticipated changes in the value of the collateral to the point of sale) is greater than the estimated exposure at default, no credit losses are expected and no ECL allowance is recognised.
| | | | | | | | | | | | | | | | | |
| The Group | Stage 1 | Stage 2 | Stage 3 | POCI | Total gross |
| £m | £m | £m | £m | £m |
| At 31 December 2020 | | | | | |
| Less than 70 per cent | 185,548 | | 24,330 | | 1,547 | | 10,051 | | 221,476 | |
| 70 per cent to 80 per cent | 43,656 | | 3,364 | | 187 | | 1,303 | | 48,510 | |
| 80 per cent to 90 per cent | 21,508 | | 1,009 | | 74 | | 470 | | 23,061 | |
| 90 per cent to 100 per cent | 555 | | 126 | | 21 | | 190 | | 892 | |
| Greater than 100 per cent | 151 | | 189 | | 30 | | 497 | | 867 | |
| Total | 251,418 | | 29,018 | | 1,859 | | 12,511 | | 294,806 | |
| | | | | | | | | | | | | | | | | |
| The Group | Stage 1 | Stage 2 | Stage 3 | POCI | Total gross |
| £m | £m | £m | £m | £m |
| At 31 December 2019 | | | | | |
| Less than 70 per cent | 179,566 | | 13,147 | | 1,174 | | 10,728 | | 204,615 | |
| 70 per cent to 80 per cent | 44,384 | | 2,343 | | 181 | | 1,751 | | 48,659 | |
| 80 per cent to 90 per cent | 27,056 | | 1,057 | | 86 | | 677 | | 28,876 | |
| 90 per cent to 100 per cent | 5,663 | | 199 | | 34 | | 207 | | 6,103 | |
| Greater than 100 per cent | 374 | | 189 | | 31 | | 351 | | 945 | |
| Total | 257,043 | | 16,935 | | 1,506 | | 13,714 | | 289,198 | |
| | | | | | | | | | | | | | |
| The Bank | Stage 1 | Stage 2 | Stage 3 | Total gross |
| £m | £m | £m | £m |
| At 31 December 2020 | | | | |
| Less than 70 per cent | 36,418 | | 5,639 | | 456 | | 42,513 | |
| 70 per cent to 80 per cent | 3,603 | | 712 | | 66 | | 4,381 | |
| 80 per cent to 90 per cent | 1,298 | | 239 | | 30 | | 1,567 | |
| 90 per cent to 100 per cent | 94 | | 42 | | 9 | | 145 | |
| Greater than 100 per cent | 12 | | 45 | | 7 | | 64 | |
| Total | 41,425 | | 6,677 | | 568 | | 48,670 | |
| | | | | | | | | | | | | | |
| The Bank | Stage 1 | Stage 2 | Stage 3 | Total gross |
| £m | £m | £m | £m |
| At 31 December 2019 | | | | |
| Less than 70 per cent | 39,054 | | 3,004 | | 424 | | 42,482 | |
| 70 per cent to 80 per cent | 4,848 | | 529 | | 68 | | 5,445 | |
| 80 per cent to 90 per cent | 2,428 | | 264 | | 38 | | 2,730 | |
| 90 per cent to 100 per cent | 516 | | 49 | | 18 | | 583 | |
| Greater than 100 per cent | 58 | | 43 | | 10 | | 111 | |
| Total | 46,904 | | 3,889 | | 558 | | 51,351 | |
NOTES TO THE ACCOUNTS
for the year ended 31 December 2020
45 FINANCIAL RISK MANAGEMENT (continued)
Other
The majority of non-mortgage retail lending is unsecured. At 31 December 2020, Stage 3 non-mortgage lending amounted to £538 million, net of an impairment allowance of £492 million (2019: £610 million, net of an impairment allowance of £368 million).
Stage 1 and Stage 2 non-mortgage retail lending amounted to £58,183 million (2019: £54,307 million). Lending decisions are predominantly based on an obligor’s ability to repay from normal business operations rather than reliance on the disposal of any security provided. Collateral values are rigorously assessed at the time of loan origination and are thereafter monitored in accordance with business unit credit policy.
The Group's credit risk disclosures for unimpaired non-mortgage retail lending report assets gross of collateral and therefore disclose the maximum loss exposure. The Group believes that this approach is appropriate.
Commercial lending
Reverse repurchase transactions
At 31 December 2020 there were reverse repurchase agreements which were accounted for as collateralised loans with a carrying value of £54,447 million for the Group and the Bank (2019: £51,624 million for the Group and the Bank) against which the Group held collateral with a fair value of £60,441 million (2019: £50,130 million) and the Bank held collateral worth £55,031 million (2019: £50,130 million) all of which the Group was able to repledge. NaN collateral in the form of cash was provided in respect of reverse repurchase agreements to the Group or the Bank (2019: £NaN for the Group and the Bank). These transactions were generally conducted under terms that are usual and customary for standard secured lending activities.
Stage 3 secured lending
The value of collateral is re-evaluated and its legal soundness re-assessed if there is observable evidence of distress of the borrower; this evaluation is used to determine potential loss allowances and management’s strategy to try to either repair the business or recover the debt.
At 31 December 2020, Stage 3 secured commercial lending amounted to £704 million, net of an impairment allowance of £293 million (2019: £750 million, net of an impairment allowance of £167 million). The fair value of the collateral held in respect of impaired secured commercial lending was £753 million (2019: £744 million) for the Group. In determining the fair value of collateral, no specific amounts have been attributed to the costs of realisation. For the purposes of determining the total collateral held by the Group in respect of impaired secured commercial lending, the value of collateral for each loan has been limited to the principal amount of the outstanding advance in order to eliminate the effects of any over-collateralisation and to provide a clearer representation of the Group’s exposure.
Stage 3 secured commercial lending and associated collateral relates to lending to property companies and to customers in the financial, business and other services; transport, distribution and hotels; and construction industries.
Stage 1 and Stage 2 secured lending
For Stage 1 and Stage 2 secured commercial lending, the Group reports assets gross of collateral and therefore discloses the maximum loss exposure. The Group believes that this approach is appropriate as collateral values at origination and during a period of good performance may not be representative of the value of collateral if the obligor enters a distressed state.
Stage 1 and Stage 2 secured commercial lending is predominantly managed on a cash flow basis. On occasion, it may include an assessment of underlying collateral, although, for Stage 3 lending, this will not always involve assessing it on a fair value basis. No aggregated collateral information for the entire unimpaired secured commercial lending portfolio is provided to key management personnel.
Financial assets at fair value through profit or loss (excluding equity shares)
Securities held as collateral in the form of stock borrowed amounted to £11,925 million for the Group and £17,391 million for the Bank (2019: £8,867 million for the Group and £8,453 million for the Bank). Of this amount, £10,899 million for the Group and £16,639 million for the Bank (2019: £7,630 million for the Group and £8,178 million for the Bank) had been resold or repledged as collateral for the Group’s own transactions.
These transactions were generally conducted under terms that are usual and customary for standard secured lending activities.
Derivative assets, after offsetting of amounts under master netting arrangements
The Group reduces exposure to credit risk by using master netting agreements and by obtaining collateral in the form of cash or highly liquid securities. In respect of the net derivative assets after offsetting of amounts under master netting arrangements of £4,968 million for the Group and £9,843 million for the Bank (2019: £4,317 million for the Group and £10,326 million for the Bank), cash collateral of £2,702 million for the Group and £1,308 million for the Bank (2019: £2,186 million for the Group and £786 million for the Bank) was held.
Irrevocable loan commitments and other credit-related contingencies
At 31 December 2020, there were irrevocable loan commitments and other credit-related contingencies of £61,604 million for the Group and £34,940 million for the Bank (2019: £49,199 million for the Group and £29,961 million for the Bank). Collateral is held as security, in the event that lending is drawn down, on £19,548 million for the Group and £1,720 million for the Bank (2019: £12,391 million for the Group and £1,120 million for the Bank) of these balances.
Collateral repossessed
During the year, £125 million of collateral was repossessed (2019: £413 million), consisting primarily of residential property. In respect of retail portfolios, the Group does not take physical possession of properties or other assets held as collateral and uses external agents to realise the value as soon as practicable, generally at auction, to settle indebtedness. Any surplus funds are returned to the borrower or are otherwise dealt with in accordance with appropriate insolvency regulations. In certain circumstances the Group takes physical possession of assets held as collateral against commercial lending. In such cases, the assets are carried on the Group’s balance sheet and are classified according to the Group’s accounting policies.
NOTES TO THE ACCOUNTS
for the year ended 31 December 2020
45 FINANCIAL RISK MANAGEMENT (continued)
E.Collateral pledged as security
The Group pledges assets primarily for repurchase agreements and securities lending transactions which are generally conducted under terms that are usual and customary for standard securitised borrowing contracts.
Repurchase transactions
Deposits from banks
Included in deposits from banks are balances arising from repurchase transactions of £18,767 million for the Group and £5,087 million for the Bank (2019: £18,105 million for the Group and £2,645 million for the Bank); the fair value of the collateral provided under these agreements at 31 December 2020 was £18,874 million for the Group and £5,197 million for the Bank (2019: £17,545 million for the Group and £2,118 million for the Bank).
Customer deposits
Included in customer deposits are balances arising from repurchase transactions of £9,417 million for the Group and the Bank (2019: £9,530 million for the Group and the Bank); the fair value of the collateral provided under these agreements at 31 December 2020 was £8,087 million for the Group and the Bank (2019: £9,221 million for the Group and the Bank).
Financial liabilities at fair value through profit or loss
The fair value of collateral pledged in respect of repurchase transactions, accounted for as secured borrowing, where the secured party is permitted by contract or custom to repledge was £NaN for the Group and the Bank at 31 December 2020 (2019: £NaN for the Group and the Bank).
Securities lending transactions
The following on balance sheet financial assets have been lent to counterparties under securities lending transactions:
| | | | | | | | | | | | | | | | | |
| The Group | | The Bank |
| 2020 | 2019 | | 2020 | 2019 |
| £m | £m | | £m | £m |
| Financial assets at fair value through profit or loss | 0 | | 470 | | | 1,365 | | 634 | |
| Financial assets at fair value through other comprehensive income | 2,344 | | 854 | | | 969 | | 1,467 | |
| 2,344 | | 1,324 | | | 2,334 | | 2,101 | |
Securitisations and covered bonds
In addition to the assets detailed above, the Group also holds assets that are encumbered through the Group’s asset-backed conduits and its securitisation and covered bond programmes. Further details of these assets are provided in notes 26 and 41.
(2)Market risk
Interest rate risk
Interest rate risk arises from the different repricing characteristics of the assets and liabilities. Liabilities are either insensitive to interest rate movements, for example interest free or very low interest customer deposits, or are sensitive to interest rate changes but bear rates which may be varied at the Group’s discretion and that for competitive reasons generally reflect changes in the UK Bank Rate, set by the Bank of England. The rates on the remaining deposits are contractually fixed for their term to maturity.
Many banking assets are sensitive to interest rate movements; there is a large volume of managed rate assets such as variable rate mortgages which may be considered as a natural offset to the interest rate risk arising from the managed rate liabilities. However, a significant proportion of the Group’s lending assets, for example many personal loans and mortgages, bear interest rates which are contractually fixed.
The Group’s risk management policy is to optimise reward whilst managing its market risk exposures within the risk appetite defined by the Board. The largest residual risk exposure arises from balances that are deemed to be insensitive to changes in market rates (including current accounts, a portion of variable rate deposits and investable equity), and is managed through the Group’s structural hedge. The structural hedge consists of longer-term fixed rate assets or interest rate swaps and the amount and duration of the hedging activity is reviewed regularly by the Lloyds Banking Group Asset and Liability Committee.
The Group and the Bank establish hedge accounting relationships for interest rate risk using cash flow hedges and fair value hedges. The Group and the Bank are exposed to cash flow interest rate risk on their variable rate loans and deposits together with their floating rate subordinated debt. The derivatives used to manage the structural hedge may be designated into cash flow hedges to manage income statement volatility. The economic items related to the structural hedge, for example current accounts, are not eligible hedged items under IAS 39 for inclusion into accounting hedge relationships. The Group and the Bank are exposed to fair value interest rate risk on their fixed rate customer loans, their fixed rate customer deposits and the majority of their subordinated debt. The Group and the Bank apply netting between similar risks before applying hedge accounting.
Hedge ineffectiveness arises during the management of interest rate risk due to residual unhedged risk. Sources of ineffectiveness, which the Group may decide to not fully mitigate, can include basis differences, timing differences and notional amount differences. The effectiveness of accounting hedge relationships is assessed between the hedging derivatives and the documented hedged item, which can differ to the underlying economically hedged item.
At 31 December 2020 the aggregate notional principal of interest rate swaps designated as fair value hedges was £185,958 million (2019: £160,942 million) for the Group and £58,030 million (2019: £66,833 million) for the Bank with a net fair value asset of £81 million (2019: asset of £467 million) for the Group and a net fair value liability of £4 million (2019: liability of £60 million) for the Bank (note 15). There were losses recognised on the hedging instruments of £87 million (2019: gains of £353 million) for the Group and losses of £225 million (2019: gains of £120 million) for the Bank. There were gains on the hedged items attributable to the hedged risk of £633 million (2019: losses of £200 million) for the Group and gains of £198 million (2019: losses of £163 million) for the Bank. The gains and losses relating to the fair value hedges are recorded in net trading income.
In addition the Group has cash flow hedges which are primarily used to hedge the variability in the cost of funding within the commercial business. The notional principal of the interest rate swaps designated as cash flow hedges at 31 December 2020 was £316,776 million (2019: £417,718 million) for the Group and £93,353 million (2019: £130,477 million) for the Bank with a net fair value asset of £28 million (2019: liability of £393 million) for the Group and a net fair value liability of £31 million (2019: liability of £26 million) for the Bank (note 15). In 2020, ineffectiveness recognised in the income statement that arises from cash flow hedges was a gain of £259 million (2019: gain of £131 million) for the Group and a loss of £27 million (2019: gain of £62 million) for the Bank.
NOTES TO THE ACCOUNTS
for the year ended 31 December 2020
45 FINANCIAL RISK MANAGEMENT (continued)
Interest Rate Benchmark Reform
For the purposes of determining whether:
–a forecast transaction is highly probable;
–hedged future cash flows are expected to occur;
–a hedge is expected to be highly effective in achieving offsetting changes in fair value or cash flows attributable to the hedged risk; and
–an accounting hedging relationship should be discontinued because of a failure of the retrospective effectiveness test
the Group assumes that the interest rate benchmark on which the hedged risk or the cash flows of the hedged item or hedging instrument are based is not altered by uncertainties resulting from the proposed interest rate benchmark reform. In addition, for a fair value hedge of a non-contractually specified benchmark portion of interest rate risk, the Group assesses only at inception of the hedge relationship and not on an ongoing basis that the risk is separately identifiable and hedge effectiveness can be measured.
The Group’s most significant hedge accounting relationships are exposed to the following interest rate benchmarks: Sterling LIBOR, US Dollar LIBOR and EURIBOR.
At 31 December 2020, the Group expects that EURIBOR will continue to exist as a benchmark rate for the foreseeable future and as a result does not anticipate changing the hedged risk to a different benchmark. Accordingly, the Group does not consider its fair value or cash flow hedges of the EURIBOR benchmark interest rate to be directly affected by interest rate benchmark reform.
The notional of the hedged items that the Group has designated into cash flow hedge relationships that is directly affected by the interest rate benchmark reform is £18,107 million for the Group and £11,221 million for the Bank (2019: £26,774 million for the Group and £12,421 million for the Bank), of which £15,120 million for the Group and £11,221 million for the Bank (2019: £23,467 million for the Group and £12,421 million for the Bank) relates to Sterling LIBOR. These are principally loans and advances to customers in Commercial Banking.
The interest rate benchmark reforms also affect assets designated in fair value hedges with a notional of £107,340 million for the Group and £16,430 million for the Bank (2019: £102,969 million for the Group and £18,977 million for the Bank), of which £103,438 million for the Group and £12,535 million for the Bank (2019: £98,278 million for the Group and £14,286 million for the Bank) is in respect of Sterling LIBOR, and liabilities designated in fair value hedges with a notional of £19,567 million for the Group and £17,775 million for the Bank (2019: £45,183 million for the Group and £38,328 million for the Bank), of which £6,172 million for the Group and £5,455 million for the Bank (2019: £5,890 million for the Group and £4,824 million for the Bank) is in respect of Sterling LIBOR and £13,395 million for the Group and £12,320 million for the Bank (2019: £15,729 million for the Group and £14,517 million for the Bank) is in respect of US Dollar LIBOR. These fair value hedges principally relate to mortgages in Retail and debt securities in issue (for the Bank, principally debt securities in issue).
At 31 December 2020, the notional amount of the hedging instruments in hedging relationships to which these amendments apply was £439,139 million for the Group and £134,100 million for the Bank (2019: £576,356 million for the Group and £194,827 million for the Bank), of which £112,027 million for the Group and £21,226 million for the Bank (2019: £116,211 million for the Group and £25,070 million for the Bank) relates to Sterling LIBOR fair value hedges and £294,274 million for the Group and £93,353 million for the Bank (2019: £391,417 million for the Group and £130,477 million for the Bank) relates to Sterling LIBOR cash flow hedges.
The Group is managing the process to transition to alternative benchmark rates under its Group-wide IBOR Transition Programme. This programme has developed an implementation plan for new products and a transition plan for legacy products. The programme also encompasses the associated impacts on systems, processes, accounting and reporting and includes dealing with the impact on hedge accounting relationships of the transition to alternative reference rates.
Foreign exchange risk
The corporate and retail businesses incur foreign exchange risk in the course of providing services to their customers. All non-structural foreign exchange exposures in the non-trading book are transferred to the trading area where they are monitored and controlled. These risks reside in the authorised trading centres who are allocated exposure limits. The limits are monitored daily by the local centres and reported to the central market and liquidity risk function in London. The Group also manages foreign currency risk via cash flow hedge accounting, utilising currency swaps.
Risk arises from the Group’s investments in its overseas operations. The Group’s structural foreign currency exposure is represented by the net asset value of the foreign currency equity and subordinated debt investments in its subsidiaries and branches. Gains or losses on structural foreign currency exposures are taken to reserves.
The Group ceased all hedging of the currency translation risk of the net investment in foreign operations on 1 January 2018.
The Group has overseas operations in Europe. Structural foreign currency exposures in respect of operations with a Euro functional currency are £113 million (2019: £52 million) for the Group and £2 million (2019: £2 million) for the Bank.
NOTES TO THE ACCOUNTS
for the year ended 31 December 2020
45 FINANCIAL RISK MANAGEMENT (continued)
(3)Liquidity risk
Liquidity risk is defined as the risk that the Group has insufficient financial resources to meet its commitments as they fall due, or can only secure them at excessive cost. Liquidity risk is managed through a series of measures, tests and reports that are primarily based on contractual maturity. The Group carries out monthly stress testing of its liquidity position against a range of scenarios, including those prescribed by the PRA. The Group’s liquidity risk appetite is also calibrated against a number of stressed liquidity metrics.
The tables below analyse financial instrument liabilities of the Group and the Bank on an undiscounted future cash flow basis according to contractual maturity, into relevant maturity groupings based on the remaining period at the balance sheet date; balances with no fixed maturity are included in the over 5 years category. Certain balances, included in the table below on the basis of their residual maturity, are repayable on demand upon payment of a penalty.
| | | | | | | | | | | | | | | | | | | | |
| The Group | Up to 1
month | 1-3
months | 3-12
months | 1-5
years | Over 5
years | Total |
| £m | £m | £m | £m | £m | £m |
| At 31 December 2020 | | | | | | |
| Deposits from banks | 7,369 | | 1,564 | | 72 | | 19,438 | | 498 | | 28,941 | |
| Customer deposits | 413,374 | | 9,871 | | 5,366 | | 5,542 | | 595 | | 434,748 | |
| Financial liabilities at fair value through profit or loss | 40 | | 45 | | 141 | | 1,702 | | 10,110 | | 12,038 | |
| Debt securities in issue | 5,019 | | 5,195 | | 9,706 | | 33,338 | | 11,594 | | 64,852 | |
| Other liabilities (lease liabilities) | 10 | | 51 | | 174 | | 626 | | 751 | | 1,612 | |
| Subordinated liabilities | 81 | | 69 | | 3,609 | | 4,261 | | 3,601 | | 11,621 | |
| Total non-derivative financial liabilities | 425,893 | | 16,795 | | 19,068 | | 64,907 | | 27,149 | | 553,812 | |
| | | | | | |
| Derivative financial liabilities: | | | | | | |
| Gross settled derivatives – outflows | 4,358 | | 4,818 | | 4,390 | | 15,787 | | 8,397 | | 37,750 | |
| Gross settled derivatives – inflows | (3,795) | | (4,312) | | (4,272) | | (15,696) | | (8,885) | | (36,960) | |
| Gross settled derivatives – net flows | 563 | | 506 | | 118 | | 91 | | (488) | | 790 | |
| Net settled derivative liabilities | 4,648 | | 7 | | 89 | | 216 | | 329 | | 5,289 | |
| Total derivative financial liabilities | 5,211 | | 513 | | 207 | | 307 | | (159) | | 6,079 | |
| | | | | | | | | | | | | | | | | | | | |
| The Group | Up to 1
month | 1-3
months | 3-12
months | 1-5
years | Over 5
years | Total |
| £m | £m | £m | £m | £m | £m |
| At 31 December 2019 | | | | | | |
| Deposits from banks | 4,099 | | 2,302 | | 248 | | 17,142 | | 317 | | 24,108 | |
| Customer deposits | 368,331 | | 11,440 | | 11,861 | | 9,271 | | 1,276 | | 402,179 | |
| Financial liabilities at fair value through profit or loss | 30 | | 71 | | 298 | | 1,330 | | 13,213 | | 14,942 | |
| Debt securities in issue | 4,174 | | 8,186 | | 15,117 | | 41,816 | | 28,696 | | 97,989 | |
| Other liabilities (lease liabilities) | 2 | | 60 | | 187 | | 793 | | 935 | | 1,977 | |
| Subordinated liabilities | 245 | | 1,472 | | 1,711 | | 7,593 | | 6,513 | | 17,534 | |
| Total non-derivative financial liabilities | 376,881 | | 23,531 | | 29,422 | | 77,945 | | 50,950 | | 558,729 | |
| | | | | | |
| Derivative financial liabilities: | | | | | | |
| Gross settled derivatives – outflows | 2,492 | | 3,053 | | 10,815 | | 25,935 | | 13,884 | | 56,179 | |
| Gross settled derivatives – inflows | (968) | | (2,636) | | (10,744) | | (25,838) | | (13,829) | | (54,015) | |
| Gross settled derivatives – net flows | 1,524 | | 417 | | 71 | | 97 | | 55 | | 2,164 | |
| Net settled derivative liabilities | 14,654 | | (16) | | 1 | | 129 | | 383 | | 15,151 | |
| Total derivative financial liabilities | 16,178 | | 401 | | 72 | | 226 | | 438 | | 17,315 | |
The principal amount for undated subordinated liabilities with no redemption option is included within the over five years column; interest of approximately £23 million (2019: £28 million) per annum for the Group and £16 million (2019: £21 million) for the Bank which is payable in respect of those instruments for as long as they remain in issue is not included beyond five years.
NOTES TO THE ACCOUNTS
for the year ended 31 December 2020
45 FINANCIAL RISK MANAGEMENT (continued)
| | | | | | | | | | | | | | | | | | | | |
| The Bank | Up to 1
month | 1-3
months | 3-12
months | 1-5
years | Over 5
years | Total |
| £m | £m | £m | £m | £m | £m |
| At 31 December 2020 | | | | | | |
| Deposits from banks | 7,353 | | 1,562 | | 15 | | 1,108 | | 361 | | 10,399 | |
| Customer deposits | 254,667 | | 7,185 | | 1,334 | | 819 | | 457 | | 264,462 | |
| Financial liabilities at fair value through profit or loss | 40 | | 45 | | 141 | | 1,701 | | 10,065 | | 11,992 | |
| Debt securities in issue | 4,502 | | 4,200 | | 6,404 | | 27,908 | | 9,408 | | 52,422 | |
| Other liabilities (lease liabilities) | 1 | | 34 | | 97 | | 326 | | 445 | | 903 | |
| Subordinated liabilities | 9 | | 43 | | 3,069 | | 3,517 | | 3,016 | | 9,654 | |
| Total non-derivative financial liabilities | 266,572 | | 13,069 | | 11,060 | | 35,379 | | 23,752 | | 349,832 | |
| | | | | | |
| Derivative financial liabilities: | | | | | | |
| Gross settled derivatives – outflows | 3,881 | | 4,737 | | 3,433 | | 15,174 | | 6,337 | | 33,562 | |
| Gross settled derivatives – inflows | (3,405) | | (4,291) | | (3,336) | | (15,076) | | (6,629) | | (32,737) | |
| Gross settled derivatives – net flows | 476 | | 446 | | 97 | | 98 | | (292) | | 825 | |
| Net settled derivative liabilities | 3,885 | | 5 | | 3 | | 146 | | 208 | | 4,247 | |
| Total derivative financial liabilities | 4,361 | | 451 | | 100 | | 244 | | (84) | | 5,072 | |
| | | | | | | | | | | | | | | | | | | | |
| The Bank | Up to 1
month | 1-3
months | 3-12
months | 1-5
years | Over 5
years | Total |
| £m | £m | £m | £m | £m | £m |
| At 31 December 2019 | | | | | | |
| Deposits from banks | 3,933 | | 2,302 | | 144 | | 824 | | 317 | | 7,520 | |
| Customer deposits | 227,825 | | 9,620 | | 4,727 | | 1,330 | | 1,176 | | 244,678 | |
| Financial liabilities at fair value through profit or loss | 30 | | 71 | | 298 | | 1,330 | | 13,165 | | 14,894 | |
| Debt securities in issue | 3,323 | | 4,341 | | 12,569 | | 34,779 | | 26,628 | | 81,640 | |
| Other liabilities (lease liabilities) | 1 | | 35 | | 109 | | 446 | | 513 | | 1,104 | |
| Subordinated liabilities | 173 | | 1,416 | | 1,572 | | 6,254 | | 3,497 | | 12,912 | |
| Total non-derivative financial liabilities | 235,285 | | 17,785 | | 19,419 | | 44,963 | | 45,296 | | 362,748 | |
| | | | | | |
| Derivative financial liabilities: | | | | | | |
| Gross settled derivatives – outflows | 1,631 | | 2,906 | | 10,228 | | 24,164 | | 12,130 | | 51,059 | |
| Gross settled derivatives – inflows | (932) | | (2,523) | | (10,160) | | (24,038) | | (11,911) | | (49,564) | |
| Gross settled derivatives – net flows | 699 | | 383 | | 68 | | 126 | | 219 | | 1,495 | |
| Net settled derivative liabilities | 10,539 | | (19) | | (6) | | 59 | | 243 | | 10,816 | |
| Total derivative financial liabilities | 11,238 | | 364 | | 62 | | 185 | | 462 | | 12,311 | |
NOTES TO THE ACCOUNTS
for the year ended 31 December 2020
45 FINANCIAL RISK MANAGEMENT (continued)
The following tables set out the amounts and residual maturities of off balance sheet contingent liabilities, commitments and guarantees.
| | | | | | | | | | | | | | | | | | | | | | | | | | | | | |
| The Group | Within 1
year | | 1-3
years | | 3-5
years | | Over 5
years | | Total |
| £m | | £m | | £m | | £m | | £m |
| At 31 December 2020 | | | | | | | | | |
| Acceptances and endorsements | 73 | | | 0 | | | 0 | | | 0 | | | 73 | |
| Other contingent liabilities | 1,302 | | | 337 | | | 69 | | | 583 | | | 2,291 | |
| Total contingent liabilities | 1,375 | | | 337 | | | 69 | | | 583 | | | 2,364 | |
| Lending commitments and guarantees | 102,279 | | | 18,152 | | | 9,454 | | | 3,588 | | | 133,473 | |
| Other commitments | 1 | | | 44 | | | 16 | | | 64 | | | 125 | |
| Total commitments and guarantees | 102,280 | | | 18,196 | | | 9,470 | | | 3,652 | | | 133,598 | |
| Total contingents, commitments and guarantees | 103,655 | | | 18,533 | | | 9,539 | | | 4,235 | | | 135,962 | |
| At 31 December 2019 | | | | | | | | | |
| Acceptances and endorsements | 17 | | | 0 | | | 0 | | | 0 | | | 17 | |
| Other contingent liabilities | 1,422 | | | 349 | | | 99 | | | 683 | | | 2,553 | |
| Total contingent liabilities | 1,439 | | | 349 | | | 99 | | | 683 | | | 2,570 | |
| Lending commitments and guarantees | 90,953 | | | 11,756 | | | 10,571 | | | 2,983 | | | 116,263 | |
| Other commitments | 5 | | | 71 | | | 43 | | | 52 | | | 171 | |
| Total commitments and guarantees | 90,958 | | | 11,827 | | | 10,614 | | | 3,035 | | | 116,434 | |
| Total contingents, commitments and guarantees | 92,397 | | | 12,176 | | | 10,713 | | | 3,718 | | | 119,004 | |
| | | | | | | | | | | | | | | | | | | | | | | | | | | | | |
| The Bank | Within 1
year | | 1-3
years | | 3-5
years | | Over 5
years | | Total |
| £m | | £m | | £m | | £m | | £m |
| At 31 December 2020 | | | | | | | | | |
| Acceptances and endorsements | 73 | | | 0 | | | 0 | | | 0 | | | 73 | |
| Other contingent liabilities | 1,144 | | | 328 | | | 68 | | | 480 | | | 2,020 | |
| Total contingent liabilities | 1,217 | | | 328 | | | 68 | | | 480 | | | 2,093 | |
| Lending commitments and guarantees | 34,552 | | | 16,319 | | | 9,127 | | | 2,672 | | | 62,670 | |
| Other commitments | 0 | | | 27 | | | 16 | | | 53 | | | 96 | |
| Total commitments and guarantees | 34,552 | | | 16,346 | | | 9,143 | | | 2,725 | | | 62,766 | |
| Total contingents, commitments and guarantees | 35,769 | | | 16,674 | | | 9,211 | | | 3,205 | | | 64,859 | |
| At 31 December 2019 | | | | | | | | | |
| Acceptances and endorsements | 16 | | | 0 | | | 0 | | | 0 | | | 16 | |
| Other contingent liabilities | 1,323 | | | 271 | | | 99 | | | 580 | | | 2,273 | |
| Total contingent liabilities | 1,339 | | | 271 | | | 99 | | | 580 | | | 2,289 | |
| Lending commitments and guarantees | 30,727 | | | 9,806 | | | 9,694 | | | 2,165 | | | 52,392 | |
| Other commitments | 5 | | | 71 | | | 43 | | | 38 | | | 157 | |
| Total commitments and guarantees | 30,732 | | | 9,877 | | | 9,737 | | | 2,203 | | | 52,549 | |
| Total contingents, commitments and guarantees | 32,071 | | | 10,148 | | | 9,836 | | | 2,783 | | | 54,838 | |
NOTES TO THE ACCOUNTS
for the year ended 31 December 2020
46 CASH FLOW STATEMENTS
a.Change in operating assets
| | | | | | | | | | | | | | | | | | | | | | | |
| The Group | | The Bank |
| 2020 | 2019 | 2018 | | 2020 | 2019 | 2018 |
| £m | £m | £m | | £m | £m | £m |
| Change in financial assets held at amortised cost | (9,688) | | (11,832) | | (10,338) | | | (1,815) | | (5,482) | | (992) | |
| Change in amounts due from fellow Lloyds Banking Group undertakings | 1,116 | | 24 | | 4,827 | | | 73,506 | | (48,692) | | 9,875 | |
| Change in derivative financial instruments and financial assets at fair value through profit or loss | 1,089 | | 24,649 | | 40,137 | | | (268) | | 22,568 | | 37,356 | |
| Change in other operating assets | 627 | | 63 | | (442) | | | 239 | | 63 | | 295 | |
| Change in operating assets | (6,856) | | 12,904 | | 34,184 | | | 71,662 | | (31,543) | | 46,534 | |
b.Change in operating liabilities
| | | | | | | | | | | | | | | | | | | | | | | |
| The Group | | The Bank |
| 2020 | 2019 | 2018 | | 2020 | 2019 | 2018 |
| £m | £m | £m | | £m | £m | £m |
| Change in deposits from banks | 1,404 | | (2,670) | | (2,677) | | | 3,182 | | 1,802 | | (2,219) | |
| Change in customer deposits | 37,728 | | 5,593 | | (11,901) | | | 24,711 | | 10,360 | | (5,258) | |
| Change in amounts due to fellow Lloyds Banking Group undertakings | (1,316) | | (8,142) | | (5,466) | | | (73,233) | | 28,016 | | (23,522) | |
| Change in debt securities in issue | (17,138) | | 11,898 | | 4,730 | | | (13,400) | | 11,722 | | 1,442 | |
| Change in derivative financial instruments and financial liabilities at fair value through profit or loss | (2,549) | | (11,527) | | (45,383) | | | (3,004) | | (10,776) | | (46,514) | |
| Change in investment contract liabilities | 0 | | 0 | | (353) | | | 0 | | 0 | | 0 | |
Change in other operating liabilities1 | (288) | | (782) | | (383) | | | (249) | | (1,823) | | (648) | |
| Change in operating liabilities | 17,841 | | (5,630) | | (61,433) | | | (61,993) | | 39,301 | | (76,719) | |
1Includes a decrease of £163 million (2019: increase of £43 million; 2018: increase of £27 million) for the Group and a decrease of £42 million (2019: increase of £20 million; 2018: increase of £27 million) for the Bank in respect of lease liabilities.
NOTES TO THE ACCOUNTS
for the year ended 31 December 2020
46 CASH FLOW STATEMENTS (continued)
c.Non-cash and other items
| | | | | | | | | | | | | | | | | | | | | | | |
| The Group | | The Bank |
| 2020 | 2019 | 2018 | | 2020 | 2019 | 2018 |
| £m | £m | £m | | £m | £m | £m |
| Depreciation and amortisation | 2,670 | | 2,602 | | 2,374 | | | 1,325 | | 1,245 | | 1,031 | |
| Permanent diminution in value of investment in subsidiaries | 0 | | 0 | | 0 | | | 0 | | 159 | | 92 | |
| Dividends and distributions on other equity instruments received from subsidiary undertakings | 0 | | 0 | | 0 | | | (211) | | (1,434) | | (4,968) | |
| Revaluation of investment properties | 20 | | 8 | | (46) | | | 0 | | 0 | | 0 | |
| Allowance for loan losses | 3,802 | | 1,380 | | 1,012 | | | 1,742 | | 490 | | 553 | |
| Write-off of allowance for loan losses, net of recoveries | (1,279) | | (1,457) | | (1,000) | | | (622) | | (759) | | (608) | |
| Impairment charge relating to undrawn balances | 253 | | (17) | | (72) | | | 155 | | 14 | | (46) | |
| Impairment of financial assets at fair value through other comprehensive income | 5 | | (1) | | (14) | | | 1 | | (1) | | (2) | |
| Change in insurance contract liabilities | 0 | | 0 | | (1,520) | | | 0 | | 0 | | 0 | |
| Payment protection insurance provision | 85 | | 1,795 | | 1,395 | | | 169 | | 859 | | 628 | |
| Other regulatory provisions | 329 | | 395 | | 561 | | | 143 | | 137 | | 311 | |
| Other provision movements | 80 | | (161) | | (509) | | | 18 | | (43) | | (413) | |
| Additional capital injections to subsidiaries | 0 | | 0 | | 0 | | | (33) | | (53) | | (72) | |
| Net charge in respect of defined benefit schemes | 247 | | 245 | | 404 | | | 121 | | 131 | | 196 | |
| Unwind of discount on impairment allowances | (47) | | (52) | | (39) | | | (31) | | (32) | | (33) | |
Foreign exchange impact on balance sheet1 | 823 | | 420 | | (365) | | | 491 | | (230) | | (130) | |
| Interest expense on subordinated liabilities | 846 | | 947 | | 1,072 | | | 534 | | 657 | | 654 | |
| Loss (profit) on disposal of businesses | 0 | | (107) | | (1,010) | | | 0 | | 0 | | 21 | |
| Other non-cash items | (1,169) | | (295) | | 933 | | | (308) | | (142) | | 990 | |
| Total non-cash items | 6,665 | | 5,702 | | 3,176 | | | 3,494 | | 998 | | (1,796) | |
| Contributions to defined benefit schemes | (1,153) | | (1,069) | | (868) | | | (650) | | (563) | | (455) | |
| Payments in respect of payment protection insurance provision | (1,700) | | (2,457) | | (2,101) | | | (726) | | (1,156) | | (1,057) | |
| Payments in respect of other regulatory provisions | (465) | | (707) | | (956) | | | (233) | | (229) | | (302) | |
| Other | 137 | | 0 | | 6 | | | (65) | | 0 | | 0 | |
| Total other items | (3,181) | | (4,233) | | (3,919) | | | (1,674) | | (1,948) | | (1,814) | |
| Non-cash and other items | 3,484 | | 1,469 | | (743) | | | 1,820 | | (950) | | (3,610) | |
1When considering the movement on each line of the balance sheet, the impact of foreign exchange rate movements is removed in order to show the underlying cash impact.
d.Analysis of cash and cash equivalents as shown in the balance sheet
| | | | | | | | | | | | | | | | | | | | | | | | | | | | | | | | | | | |
| The Group | | The Bank |
| 2020 | | 2019 | | 2018 | | 2020 | | 2019 | | 2018 |
| £m | | £m | | £m | | £m | | £m | | £m |
| | | | | | | | | | | |
| Cash and balances at central banks | 49,888 | | | 38,880 | | | 40,213 | | | 45,753 | | | 35,741 | | | 37,632 | |
Less: mandatory reserve deposits1 | (4,392) | | | (3,177) | | | (2,541) | | | (954) | | | (764) | | | (803) | |
| 45,496 | | | 35,703 | | | 37,672 | | | 44,799 | | | 34,977 | | | 36,829 | |
| Loans and advances to banks | 5,950 | | | 4,852 | | | 3,692 | | | 5,656 | | | 4,453 | | | 3,153 | |
| Less: amounts with a maturity of three months or more | (2,480) | | | (1,941) | | | (1,641) | | | (2,387) | | | (1,648) | | | (1,328) | |
| 3,470 | | | 2,911 | | | 2,051 | | | 3,269 | | | 2,805 | | | 1,825 | |
| Total cash and cash equivalents | 48,966 | | | 38,614 | | | 39,723 | | | 48,068 | | | 37,782 | | | 38,654 | |
1Mandatory reserve deposits are held with local central banks in accordance with statutory requirements; these deposits are not available to finance the Group's day-to-day operations.
NOTES TO THE ACCOUNTS
for the year ended 31 December 2020
46 CASH FLOW STATEMENTS (continued)
e.Acquisition of group undertakings and businesses
| | | | | | | | | | | | | | | | | | | | | | | |
| The Group | | The Bank |
| 2020 | 2019 | 2018 | | 2020 | 2019 | 2018 |
| £m | £m | £m | | £m | £m | £m |
| Net assets acquired: | | | | | | | |
| Intangible assets | 0 | | 0 | | 21 | | | 0 | | 0 | | 0 | |
| Other assets | 0 | | 0 | | 6 | | | 0 | | 0 | | 0 | |
| Other liabilities | 0 | | 0 | | (1) | | | 0 | | 0 | | 0 | |
| Cash consideration | 0 | | 0 | | 26 | | | 0 | | 0 | | 0 | |
| Less: cash and cash equivalents acquired | 0 | | 0 | | 0 | | | 0 | | 0 | | 0 | |
| Net cash outflow arising from acquisitions of subsidiaries and businesses | 0 | | 0 | | 26 | | | 0 | | 0 | | 0 | |
| Investment in subsidiary acquired | 0 | | 0 | | 0 | | | 0 | | 0 | | 98 | |
| Net cash outflow from acquisitions in the year | 0 | | 0 | | 26 | | | 0 | | 0 | | 98 | |
f.Disposal of group undertakings and businesses
| | | | | | | | | | | | | | | | | | | | | | | |
| The Group | | The Bank |
| 2020 | 2019 | 2018 | | 2020 | 2019 | 2018 |
| £m | £m | £m | | £m | £m | £m |
| Financial assets at fair value through profit or loss | 0 | | 0 | | 125,379 | | | 0 | | 0 | | 0 | |
| Loans and advances to customers | 0 | | 0 | | 3,495 | | | 0 | | 0 | | 0 | |
| Due from fellow group undertakings | 0 | | 0 | | 14,436 | | | 0 | | 0 | | 0 | |
| Derivative financial instruments | 0 | | 0 | | 3,027 | | | 0 | | 0 | | 0 | |
| Investment property | 0 | | 0 | | 3,639 | | | 0 | | 0 | | 0 | |
| Goodwill | 0 | | 0 | | 1,836 | | | 0 | | 0 | | 0 | |
| Value of in-force business | 0 | | 0 | | 4,902 | | | 0 | | 0 | | 0 | |
| Property, plant and equipment | 0 | | 0 | | 48 | | | 0 | | 0 | | 0 | |
| 0 | | 0 | | 156,762 | | | 0 | | 0 | | 0 | |
| Customer deposits | 0 | | 0 | | (15,236) | | | 0 | | 0 | | 0 | |
| Due to fellow Lloyds Banking Group undertakings | 0 | | 0 | | (2,584) | | | 0 | | 0 | | 0 | |
| Derivative financial instruments | 0 | | 0 | | (2,762) | | | 0 | | 0 | | 0 | |
| Liabilities from insurance and investment contracts | 0 | | 0 | | (117,021) | | | 0 | | 0 | | 0 | |
| Subordinated liabilities | 0 | | 0 | | (2,494) | | | 0 | | 0 | | 0 | |
| Non-controlling interests | 0 | | 0 | | (305) | | | 0 | | 0 | | 0 | |
| Other net liabilities | 0 | | 0 | | (8,759) | | | 0 | | 0 | | 0 | |
| 0 | | 0 | | (149,161) | | | 0 | | 0 | | 0 | |
| Net assets disposed of | 0 | | 0 | | 7,601 | | | 0 | | 0 | | 0 | |
| Investment in subsidiary disposed of | 0 | | 0 | | 0 | | | 0 | | 20 | | 7,725 | |
| Profit (loss) on sale of businesses | 0 | | 107 | | 1,010 | | | 0 | | 0 | | (21) | |
| Cash consideration received on losing control of group undertakings and businesses | 0 | | 107 | | 8,611 | | | 0 | | 20 | | 7,704 | |
| Cash and cash equivalents disposed | 0 | | 0 | | (7) | | | 0 | | 0 | | 0 | |
| Net cash inflow | 0 | | 107 | | 8,604 | | | 0 | | 20 | | 7,704 | |
NOTES TO THE ACCOUNTS
for the year ended 31 December 2020
47 FUTURE ACCOUNTING DEVELOPMENTS
The following pronouncements are not applicable for the year ending 31 December 2020 and have not been applied in preparing these financial statements.
Interest Rate Benchmark Reform
The IASB’s Phase 2 amendments in response to issues arising from the replacement of interest rate benchmarks in a number of jurisdictions are effective for annual periods beginning on or after 1 January 2021.
Under these amendments, an immediate gain or loss is not recognised in the income statement where the contractual cash flows of a financial asset or financial liability are amended as a direct consequence of the rate reform and the revised contractual terms are economically equivalent to the previous terms. In addition, hedge accounting is continued for relationships that are directly affected by the reform.
These amendments are not expected to have a significant impact on the Group.
Minor amendments to other accounting standards
The IASB has issued a number of minor amendments to IFRSs effective 1 January 2021 and in later years (including IFRS 9 Financial Instruments and IAS 37 Provisions, Contingent Liabilities and Contingent Assets). These amendments are not expected to have a significant impact on the Group.
| | | | | |
| Term used | US equivalent or brief description. |
| Accounts | Financial statements. |
| Articles of association | Articles and bylaws. |
| Associates | Long-term equity investments accounted for by the equity method. |
| Attributable profit | Net income. |
| Balance sheet | Statement of financial position. |
| Broking | Brokerage. |
| Building society | A building society is a mutual institution set up to lend money to its members for house purchases. |
| Buy-to-let mortgages | Buy-to-let mortgages are those mortgages offered to customers purchasing residential property as a rental investment. |
| Called-up share capital | Ordinary shares, issued and fully paid. |
| Contract hire | Leasing. |
| Creditors | Payables. |
| Debtors | Receivables. |
| Deferred tax | Deferred income tax. |
| Depreciation | Amortisation. |
| Finance lease | Capital lease. |
| Freehold | Ownership with absolute rights in perpetuity. |
| Leasehold | Land or property which is rented from the owner for a specified term under a lease. At the expiry of the term the land or property reverts back to the owner. |
| Lien | Under UK law, a right to retain possession pending payment. |
| Loan capital | Long-term debt. |
| Members | Shareholders. |
| National Insurance | A form of taxation payable in the UK by employees, employers and the self-employed. It is part of the UK’s national social security system and ultimately controlled by HM Revenue & Customs. |
| Nominal value | Par value. |
| Ordinary shares | Common stock. |
| Overdraft | A line of credit, contractually repayable on demand unless a fixed-term has been agreed, established through a customer’s current account. |
| Preference shares | Preferred stock. |
| Premises | Real estate. |
| Profit attributable to equity shareholders | Net income. |
| Provisions | Reserves. |
| Retained profits | Retained earnings. |
| Share capital | Capital stock. |
| Shareholders’ equity | Stockholders’ equity. |
| Share premium account | Additional paid-in capital. |
| Shares in issue | Shares outstanding. |
| Specialist mortgages | Specialist mortgages include those mortgage loans provided to customers who have self-certified their income.New mortgage lending of this type has not been offered by the Group since early 2009. |
| Undistributable reserves | Restricted surplus. |
| Write-offs | Charge-offs. |
| | | | | | | | | | | |
| 1 | |
| | | |
| 2 | Neither Lloyds Bank plc nor any subsidiary is party to any single long-term debt instrument pursuant to which a total amount of securities exceeding 10 per cent of the Lloyds Bank Group’s total assets (on a consolidated basis) is authorised to be issued. Lloyds Bank plc hereby agrees to furnish to the Securities and Exchange Commission (the Commission), upon its request, a copy of any instrument defining the rights of holders of its long-term debt or the rights of holders of the long-term debt issued by it or any subsidiary for which consolidated or unconsolidated financial statements are required to be filed with the Commission. |
| | | |
| 2 | (d) | |
| | | |
| 4 | (b) | (i) | |
| | | |
| | (ii) | |
| | | |
| | (iii) | |
| | | |
| | (iv) | |
| | | |
| | (v) | |
| | | |
| | (vi) | |
| | | |
| | (vii) | |
| | | |
| | (viii) | |
| | | |
| | (ix) | |
| | | |
| | (x) | |
| | | |
| | (xi) | |
| | | |
| | (xii) | |
| | | |
| | (xiii) | |
| | | |
| | (xiv) | |
| | | |
| | (xv) | |
| | | |
| | (xvi) | |
| | | |
| | (xvii) | |
| | | |
| | (xviii) | |
| | | |
| | (xix) | |
| | | |
| | (xx) | |
| | | |
| | (xxi) | |
| | | |
| | (xxii) | |
| | | |
| | (xxiii) | |
| | | |
| | (xxiv) | |
| | | |
| | (xxv) | |
| | | |
| | (xxvi) | |
| | | |
| | (xxvii) | |
| | | |
| | (xxviii) | |
| | | |
| 12.1 | |
| | | |
| 12.2 | |
| | | |
| 13.1 | |
| | | |
| 15.1 | |
| | | |
| 15.2 | |
| | | |
| † | | Previously filed with the SEC on Lloyds Bank plc’s Form 20-F filed 31 July 2019. |
| | | |
| Δ | | Previously filed with the SEC on Lloyds Bank plc’s Form 20-F filed 23 March 2020. |
The exhibits shown above are listed according to the number assigned to them by the Form 20–F.
The registrant hereby certifies that it meets all of the requirements for filing on Form 20-F and that it has duly caused and authorised the undersigned to sign this annual report on its behalf.
| | | | | | | | |
| LLOYDS BANK plc | |
| By: | /s/ W Chalmers |
| | |
| Name: | William Chalmers |
| Title: | Chief Financial Officer |
| | |
| Dated: | 11 March 2021 |