| | | | | | | | | | | | | | | | | | | |
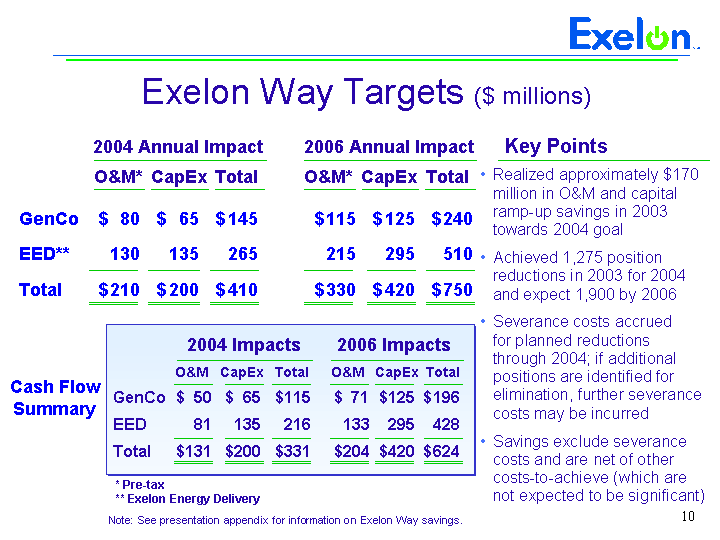
| ($ in millions) | | | | | | |
| | | | | | | |
| | | 2003 Pre-tax O&M | | | | 2003 Cap Ex |
| | | Ramp-up Savings
| | | | Ramp-up Savings
|
| | 2002
| | 2003
| | | | 2002
| | 2003
|
GAAP Operating and Maintenance (O&M) | | $ | 4,345 | | | $ | 4,587 | | | GAAP Cap Ex (1) | | $ | 2,150 | | | $ | 1,862 | |
Operating Adjustments: | | | | | | | | | | Adjustments: | | | | | | | | |
| March 2003 ComEd Settlement Agreement | | | — | | | | (41 | ) | | | | | | | | | | |
| Severance | | | (10 | ) | | | (256 | ) | | Remove net impact of Boston Generating (1) | | | — | | | | 20 | |
Enterprises goodwill impairment and impairments due
to anticipated sales | | | — | | | | (53 | ) | |
Add AmerGen | | | 155 | | | | 171 | |
| | | |
| | | |
| | | | | |
| | | |
| |
Operating O&M | | | 4,335 | | | | 4,237 | | | Adjusted Cap Ex | | $ | 2,305 | | | $ | 2,053 | |
| | | | | | | | | | | | | |
| | | |
| |
Exelon Way O&M Adjustments: | | | | | | | | | | Year-over-year Savings | | | | | | $ | 252 | |
| | | | | | | | | | | | | | | | | |
| |
| Remove Enterprises (1) | | | (1,228 | ) | | | (854 | ) | | | | | | | | | | |
| Add incremental impact of Texas Plants | | | 10 | | | | — | | | Exelon Way Cap Ex Savings: | | | | | | | | |
| | | | | | | | | | |
| | | | | | | | |
| Remove incremental impact of BG (2) | | | — | | | | (49 | ) | | | | | | | | | | |
| Remove decommissioning accretion | | | — | | | | (197 | ) | | Difference between 2002 and 2003 Exelon Way Cap Ex | | | | | | $ | 252 | |
| Add 2002 incremental impact of Exelon New England | | | 50 | | | | — | | | 2003 inflationary impact (2) | | | | | | | 69 | |
| | | | | | | | | | | | | | | | | |
| |
| Normalize incremental impact of nuclear outages | | | (24 | ) | | | — | | | Calculated 2003 Savings | | | | | | $ | 321 | |
| Add AmerGen, net of decommissioning accretion | | | 412 | | | | 393 | | | Exclude savings from prior cost management initiatives (e.g., CMI) | | | | | | | (254 | ) |
| | | | | | | | | | | | | | | | | |
| |
| Add Payroll Taxes (3) | | | 95 | | | | 91 | | | Exelon Way Savings - 2003 Ramp-up | | | | | | $ | 67 | |
| | | | | | | | | | | | | | | | | |
| |
| | | |
| | | |
| | | | | | | | | | | |
Exelon Way O&M | | $ | 3,650 | | | $ | 3,621 | | | | | | | | | | | |
| | | |
| | | |
| | | | | | | | | | | |
| | | | | | | (1) Net of proceeds from liquidated damages for 2003 |
Exelon Way O&M Savings: | | | | | | (2) Inflation assumed at 3% |
| | | | | | | | | | | | | | | | | | |
| Difference between 2002 and 2003 Exelon Way O&M | | | | | | $ | 29 | | | | | | | | | | | |
| | | | | | | | | | |
|
| 2003 inflationary impact (4) | | | | | | | 107 | | | | | | | | | | | |
| Pension and post-retirement increase (5) | | | | | | | 103 | | | Total Ramp-up Cash Savings | | | | | | | | |
| | | | | | | |
| | |
| | | | | | | | |
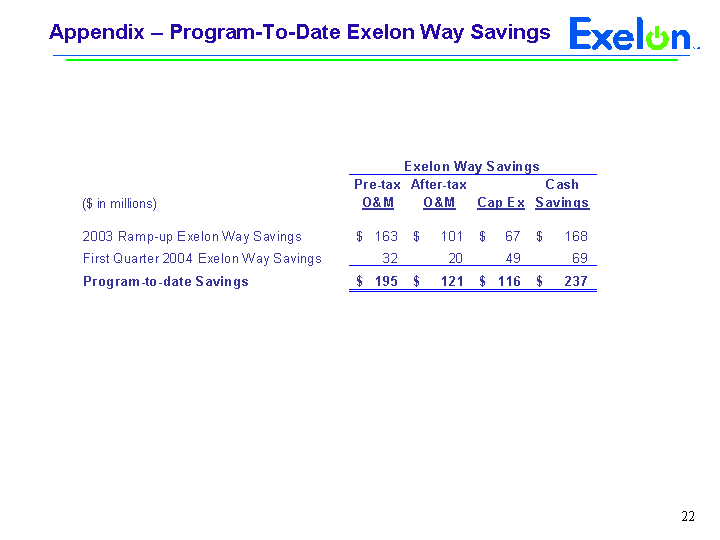
Calculated 2003 Savings | | | | | | $ | 239 | | | After-tax O&M | | | | | | $ | 101 | |
| Exclude savings from prior cost management initiatives (e.g., CMI) | | | | | | | (76 | ) | | Cap Ex | | | | | | | 67 | |
| | | | | | | |
| | | | | | | | | |
| |
Exelon Way O&M Savings — Pre-tax | | | | | | $ | 163 | | | Total Exelon Way Cash Savings | | | | | | $ | 168 | |
| | | | | | | |
| | | | | | | | | |
| |
After-tax O&M Savings (6) | | | | | | $ | 101 | | | | | | | | | | | |
| | | | | | | |
| | | | | | | | | | | |
| (1) Enterprises O&M net of intercompany impact; excludes Exelon Energy and corporate business services costs | | | | | | | | | | | | | | | | | | |
| (2) Excludes corporate business services costs | | | | | | | | | | | | | | | | | | |
| (3) Includes AmerGen and excludes Enterprises | | | | | | | | | | | | | | | | | | |
| (4) 2002 base excluding pension and post-retirement expenses of $103M, inflated at 3% | | | | | | | | | | | | | | | | | | |
| (5) Pension and post-retirement expense increase | | | | | | | | | | | | | | | | | | |
| (6) Tax rate is 38% | | | | | | | | | | | | | | | | | | |
