Exhibit 99
| Leading The Way Robert S. Shapard Executive Vice President & CFO Lehman Brothers CEO Energy/Power Conference New York City September 8, 2004 |
| Forward-Looking Statements This presentation contains certain forward-looking statements within the meaning of the Private Securities Litigation Reform Act of 1995, that are subject to risks and uncertainties. The factors that could cause actual results to differ materially from the forward-looking statements made by a registrant include those factors discussed herein, as well as the items discussed in (a) the Registrants' 2003 Annual Report on Form 10-K-ITEM 7. Management's Discussion and Analysis of Financial Condition and Results of Operations-Business Outlook and the Challenges in Managing Our Business for each of Exelon, ComEd, PECO and Generation, (b) the Registrants' 2003 Annual Report on Form 10-K-ITEM 8. Financial Statements and Supplementary Data: Exelon-Note 19, ComEd- Note 15, PECO-Note 14 and Generation-Note 13, and (c) other factors discussed in filings with the United States Securities and Exchange Commission (SEC) by Exelon Corporation, Commonwealth Edison Company, PECO Energy Company and Exelon Generation Company, LLC (Registrants). Readers are cautioned not to place undue reliance on these forward-looking statements, which apply only as of the date of this presentation. None of the Registrants undertakes any obligation to publicly release any revision to its forward-looking statements to reflect events or circumstances after the date of this presentation. |
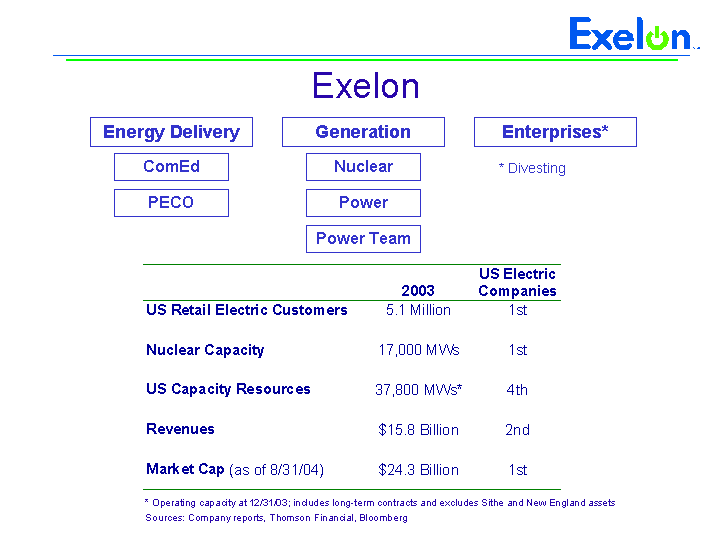
| Exelon * Operating capacity at 12/31/03; includes long-term contracts and excludes Sithe and New England assets Sources: Company reports, Thomson Financial, Bloomberg Energy Delivery Generation Enterprises* ComEd PECO Nuclear Power Power Team * Divesting |
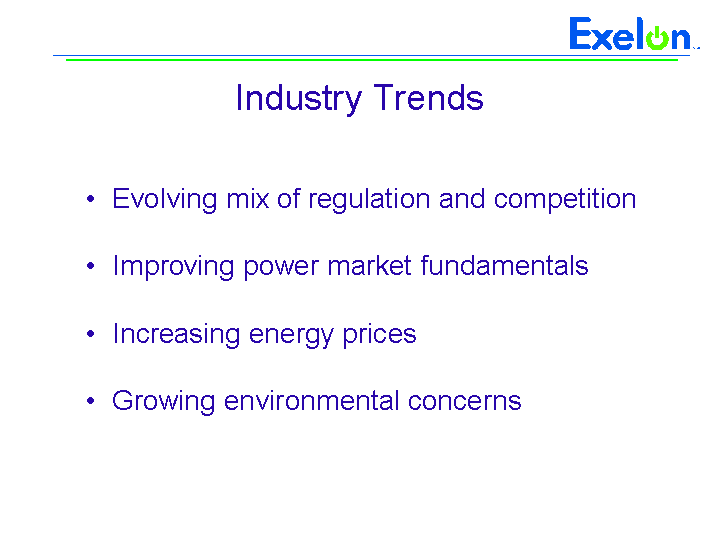
| Industry Trends Evolving mix of regulation and competition Improving power market fundamentals Increasing energy prices Growing environmental concerns |
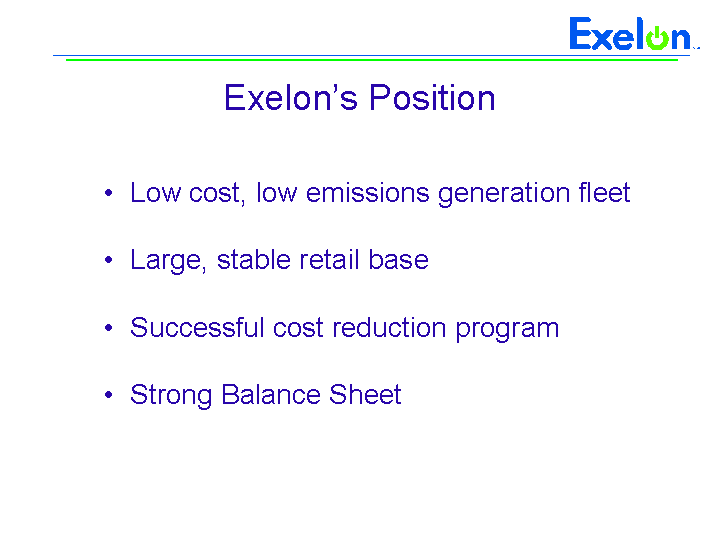
| Exelon's Position Low cost, low emissions generation fleet Large, stable retail base Successful cost reduction program Strong Balance Sheet |
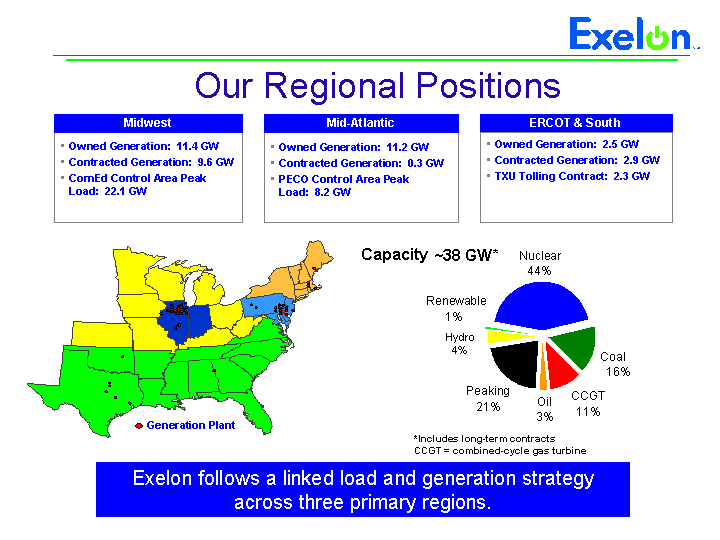
| Nuclear 44% Oil 3% Renewable 1% Peaking 21% CCGT 11% Hydro 4% Coal 16% Capacity ~38 GW* *Includes long-term contracts CCGT = combined-cycle gas turbine Our Regional Positions Owned Generation: 2.5 GW Contracted Generation: 2.9 GW TXU Tolling Contract: 2.3 GW ERCOT & South Owned Generation: 11.2 GW Contracted Generation: 0.3 GW PECO Control Area Peak Load: 8.2 GW Mid-Atlantic Owned Generation: 11.4 GW Contracted Generation: 9.6 GW ComEd Control Area Peak Load: 22.1 GW Midwest Exelon follows a linked load and generation strategy across three primary regions. |
| Illinois Post 2006 |
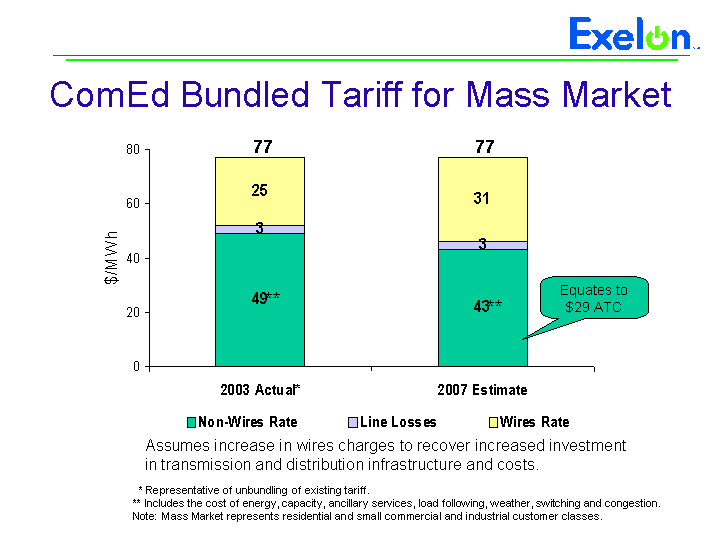
| ComEd Bundled Tariff for Mass Market 2003 Actual* 2007 Estimate RES SCI LCI LCI (< 3 MW) Non-Wires Rate 49 43 49.9 49.9 48.9 28 Line Losses 3 3 Wires Rate 25 31 35.1 15.1 10.1 3 77 77 Assumes increase in wires charges to recover increased investment in transmission and distribution infrastructure and costs. * Representative of unbundling of existing tariff. ** Includes the cost of energy, capacity, ancillary services, load following, weather, switching and congestion. Note: Mass Market represents residential and small commercial and industrial customer classes. ** Equates to $29 ATC ** |
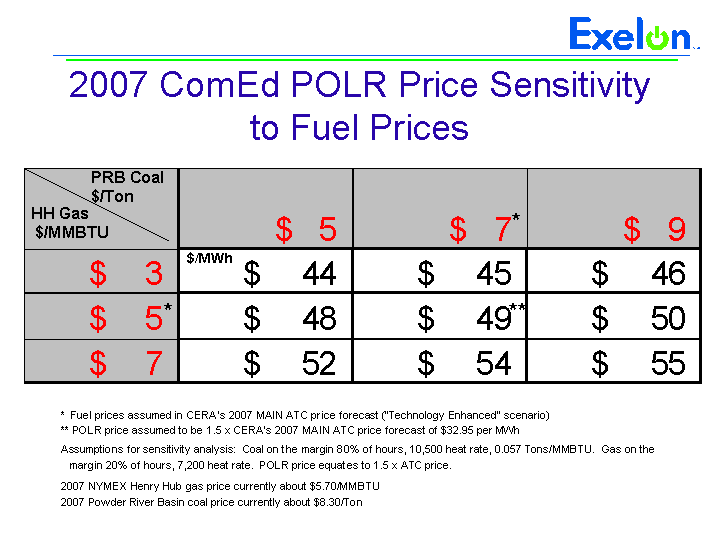
| 2007 ComEd POLR Price Sensitivity to Fuel Prices PRB Coal $/Ton HH Gas $/MMBTU * Fuel prices assumed in CERA's 2007 MAIN ATC price forecast ("Technology Enhanced" scenario) ** POLR price assumed to be 1.5 x CERA's 2007 MAIN ATC price forecast of $32.95 per MWh Assumptions for sensitivity analysis: Coal on the margin 80% of hours, 10,500 heat rate, 0.057 Tons/MMBTU. Gas on the margin 20% of hours, 7,200 heat rate. POLR price equates to 1.5 x ATC price. 2007 NYMEX Henry Hub gas price currently about $5.70/MMBTU 2007 Powder River Basin coal price currently about $8.30/Ton * * ** $/MWh |
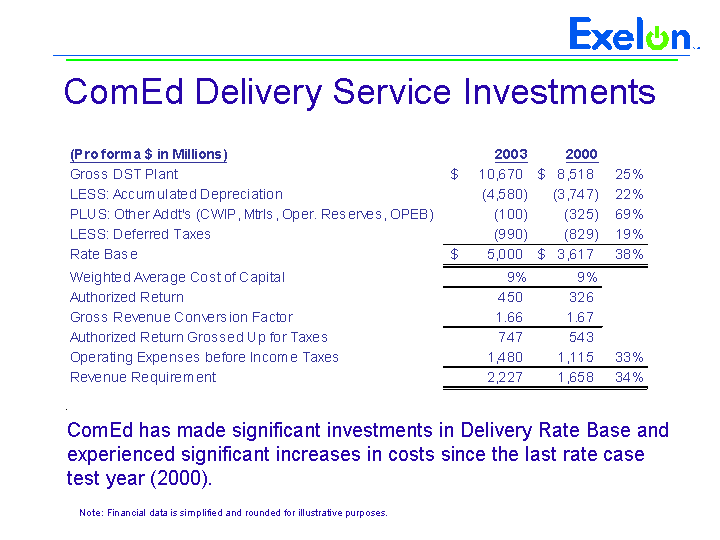
| ComEd Delivery Service Investments ComEd has made significant investments in Delivery Rate Base and experienced significant increases in costs since the last rate case test year (2000). Note: Financial data is simplified and rounded for illustrative purposes. |

| Financial Overview |
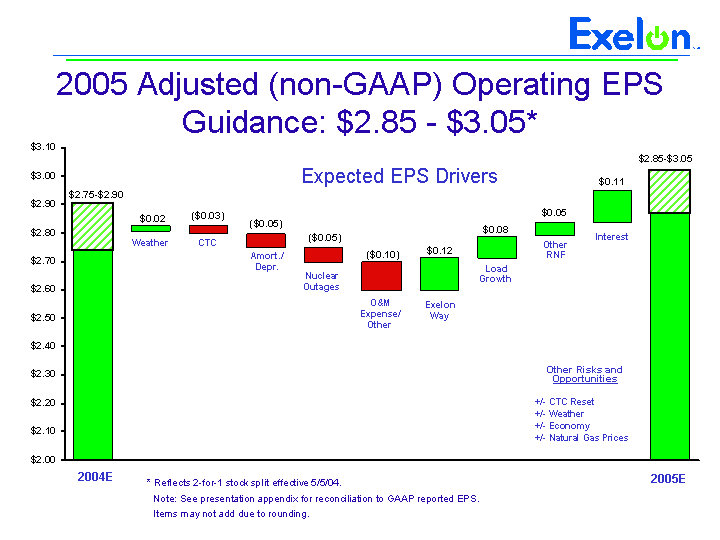
| 2004 Guidance Weather ComEd CTC Amort. / Depr. Nuclear Outages /Fuel O&M + Pension + All Other Exelon Way Load Growth Other RNF Interest 2005 Guidance Invisible dataset 0 2.807217509 2.796245631 2.746768665 2.697 2.597 2.597 2.71 2.79 2.837 0 Green 2.807217509 0.016342461 0.027314339 0.049476966 0.05 0.100410312 0.11678395 0.078531763 0.045085597 0.113539044 2.924126675 2004E 2005E Interest O&M Expense/ Other CTC Exelon Way Expected EPS Drivers Amort./ Depr. 2005 Adjusted (non-GAAP) Operating EPS Guidance: $2.85 - $3.05* * Reflects 2-for-1 stock split effective 5/5/04. Note: See presentation appendix for reconciliation to GAAP reported EPS. Items may not add due to rounding. Nuclear Outages Weather Load Growth Other RNF Other Risks and Opportunities +/- CTC Reset +/- Weather +/- Economy +/- Natural Gas Prices |
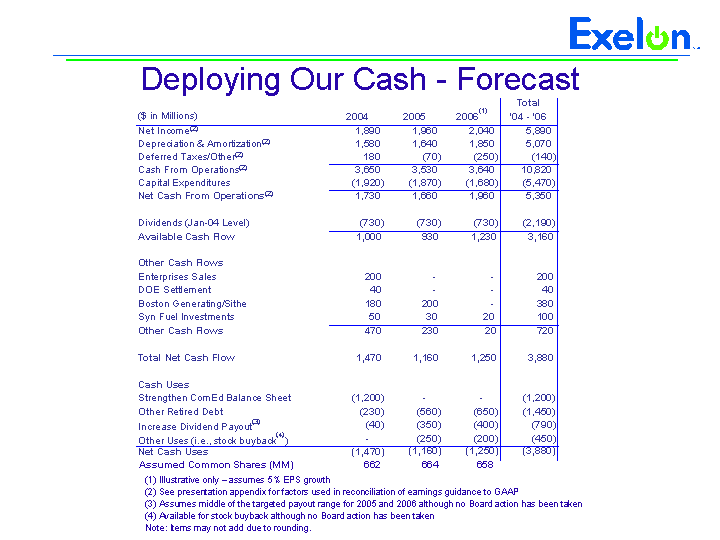
| Deploying Our Cash - Forecast (1) Illustrative only - assumes 5% EPS growth (2) See presentation appendix for factors used in reconciliation of earnings guidance to GAAP (3) Assumes middle of the targeted payout range for 2005 and 2006 although no Board action has been taken (4) Available for stock buyback although no Board action has been taken Note: Items may not add due to rounding. ($ in Millions) 2004 2005 2006 (1) Total '04 - '06 Net Income(2) 1,890 1,960 2,040 5,890 Depreciation & Amortization(2) 1,580 1,640 1,850 5,070 Deferred Taxes/Other(2) 180 (70) (250) (140) Cash From Operations(2) 3,650 3,530 3,640 10,820 Capital Expenditures (1,920) (1,870) (1,680) (5,470) Net Cash From Operations(2) 1,730 1,660 1,960 5,350 Dividends (Jan-04 Level) (730) (730) (730) (2,190) Available Cash Flow 1,000 930 1,230 3,160 Other Cash Flows Enterprises Sales 200 - - 200 DOE Settlement 40 - - 40 Boston Generating/Sithe 180 200 - 380 Syn Fuel Investments 50 30 20 100 Other Cash Flows 470 230 20 720 Total Net Cash Flow 1,470 1,160 1,250 3,880 Cash Uses Strengthen ComEd Balance Sheet (1,200) - - - - (1,200) Other Retired Debt (230) (560) (650) (1,450) Increase Dividend Payout (3) (40) (350) (400) (790) Other Uses (i.e., stock buyback (4) ) - - (250) (200) (450) Net Cash Uses (1,470) (1,160) (1,250) (3,880) Assumed Common Shares (MM) 662 664 658 |

| Peer Comparisons Sources: Thomson Financial, Bloomberg Market data as of 8/31/04 CAGR = Compound annual growth rate *Exelon estimates: excludes transition debt interest, EXC coverage ratio also excludes Boston Generating Facility debt ** Edison International reinstated dividend 1/04. Note: See presentation appendix for reconciliation to Exelon GAAP EPS. 2000-2003 CAGR 2000-2003 CAGR 2003 EBITDA 2005E EPS (%) Div. (%) Int. Cov. (X) Yield (%) P/E (X) Exelon 10.6 24.3 7.2* 3.3 12.4 AEP -7.8 -11.7 4.6* 4.3 13.6 Ameren -4.0 0 5.7 5.4 15.3 Cinergy 0.3 0.7 4.4 4.6 14.1 Consolidated Ed. -3.4 0.9 4.5 5.4 15.0 Dominion Res. 10.6 0 4.0 4.0 12.5 Duke Energy -15.9 -20.6 3.3 5.0 17.2 Edison Int. 20.4 Elim. div.** 2.3 3.0 13.4 Entergy 10.6 9.5 4.9 3.0 12.8 FirstEnergy -11.6 0 3.7* 3.7 13.5 FPL Group 3.7 3.6 7.0 3.9 13.3 PG&E Corp. -15.7 Elim. div. 3.3 0 13.2 Progress Energy -2.3 2.8 4.0 5.2 12.1 PS Enterprise 1.6 0 3.7* 5.2 12.2 Southern -2.6 1.2 6.0 4.7 14.7 TXU -16.4 -40.7 3.0* 1.2 10.4 Average (Excl EXC) -2.2 -4.2 4.3 3.9 13.6 |
| APPENDIX |
| 2004/2005 Earnings Guidance* Exelon's adjusted (non-GAAP) operating earnings for 2004 are expected to be in the range of $2.75 to $2.90 per share and for 2005 in the range of $2.85 to $3.05 per share. Our outlook for adjusted (non-GAAP) operating earnings excludes income resulting from investments in synthetic fuel-producing facilities, the cumulative effect of adopting FIN 46-R, The Exelon Way severance, costs for accelerating the liability management program and any profit or loss related to Boston Generating. These estimates do not include any impact of future changes to GAAP. * Reflects 2-for-1 stock split effective 5/5/04. |
| Free Cash Flow We define free cash flow as: Cash from operations (which includes pension contributions and the benefit of synthetic fuel investments), less Cash used in investing activities, less Transition debt maturities Common stock dividend payments at 2003 rates Other routine activities (e.g., severance payments, tax effect of discretionary items, etc.) Available Cash Flow Cash from operations (excluding the DOE settlement, Boston Generating, Sithe and synthetic fuel investment cash flows) less capital expenditures, less common stock dividend payments at the January 2004 level. Cash from operations also excludes the cash effect of changes in working capital and other non-current assets and liabilities. |

Appendix:
Reconciliation of GAAP Reported and Adjusted (non-GAAP)
Operating Earnings per Diluted Share
2000 GAAP Reported EPS | $ | 1.44 | ||
| Change in common shares | (0.53 | ) | ||
| Extraordinary items | (0.04 | ) | ||
| Cumulative effect of accounting change | — | |||
| Unicom pre-merger results | 0.79 | |||
| Merger-related costs | 0.34 | |||
| Pro forma merger accounting adjustments | (0.07 | ) | ||
2000 Adjusted (non-GAAP) Operating EPS | $ | 1.93 | ||
2001 GAAP Reported EPS | $ | 2.21 | ||
| Cumulative effect of adopting SFAS No. 133 | (0.02 | ) | ||
| Employee severance costs | 0.05 | |||
| Litigation reserves | 0.01 | |||
| Net loss on investments | 0.01 | |||
| CTC prepayment | (0.01 | ) | ||
| Wholesale rate settlement | (0.01 | ) | ||
| Settlement of transition bond swap | — | |||
2001 Adjusted (non-GAAP) Operating EPS | $ | 2.24 | ||
2002 GAAP Reported EPS | $ | 2.22 | ||
| Cumulative effect of adopting SFAS No. 141 and No. 142 | 0.35 | |||
| Gain on sale of investment in AT&T Wireless | (0.18 | ) | ||
| Employee severance costs | 0.02 | |||
2002 Adjusted (non-GAAP) Operating EPS | $ | 2.41 | ||
2003 GAAP Reported EPS | $ | 1.38 | ||
| Boston Generating impairment | 0.87 | |||
| Charges associated with investment in Sithe Energies, Inc. | 0.27 | |||
| Severance | 0.24 | |||
| Cumulative effect of adopting SFAS No. 143 | (0.17 | ) | ||
| Property tax accrual reductions | (0.07 | ) | ||
| Enterprises’ Services goodwill impairment | 0.03 | |||
| Enterprises’ impairments due to anticipated sale | 0.03 | |||
| March 3 ComEd Settlement Agreement | 0.03 | |||
2003 Adjusted (non-GAAP) Operating EPS | $ | 2.61 |
Note:EPS figures reflect 2-for-1 stock split effective 5/5/04. Three-year 2003/2000 compound annual growth rate (CAGR): $1.38/$1.44 =
-1.4% based on GAAP reported results. Three-year 2003/2000 CAGR: $2.61/$1.93 = 10.6% based on adjusted (non-GAAP) operating results.