Sustainable Value John W. Rowe Chairman, President & Chief Executive Officer Exelon Corporation Sanford C. Bernstein & Co. Strategic Decisions Conference New York City May 28, 2008 Exhibit 99.1 |
2 This presentation includes forward-looking statements within the meaning of the Private Securities Litigation Reform Act of 1995, that are subject to risks and uncertainties. The factors that could cause actual results to differ materially from these forward-looking statements include those discussed herein as well as those discussed in (1) Exelon’s 2007 Annual Report on Form 10-K in (a) ITEM 1A. Risk Factors, (b) ITEM 7. Management’s Discussion and Analysis of Financial Condition and Results of Operations and (c) ITEM 8. Financial Statements and Supplementary Data: Note 19; (2) Exelon’s First Quarter 2008 Quarterly Report on Form 10-Q in (a) Part II, Other Information, ITEM 1A. Risk Factors and (b) Part I, Financial Information, ITEM 1. Financial Statements: Note 13; and (3) other factors discussed in filings with the Securities and Exchange Commission by Exelon Corporation, Exelon Generation Company, LLC, Commonwealth Edison Company, and PECO Energy Company (Companies). Readers are cautioned not to place undue reliance on these forward-looking statements, which apply only as of the date of this presentation. None of the Companies undertakes any obligation to publicly release any revision to its forward-looking statements to reflect events or circumstances after the date of this presentation. This presentation includes references to adjusted (non-GAAP) operating earnings that exclude the impact of certain factors. We believe that these adjusted operating earnings are representative of the underlying operational results of the Companies. Please refer to the attachments to the earnings release and the appendix to this presentation for a reconciliation of adjusted (non-GAAP) operating earnings to GAAP earnings. Forward-Looking Statements |
3 Nuclear, Fossil, Hydro & Renewable Generation Power Marketing Nuclear Capacity: 16,969 MW Total Capacity: 32,332 MW • 2008: Generation estimated to contribute ~75-80% of total operating earnings • Operates largest nuclear fleet in US Regional Wholesale Energy Pennsylvania Utility Illinois Utility Customers Electric: 3.8M 1.6M Gas: - 0.5M • 2008: ComEd and PECO estimated to contribute ~20-25% combined of total operating earnings Traditional Transmission & Distribution Company Overview |
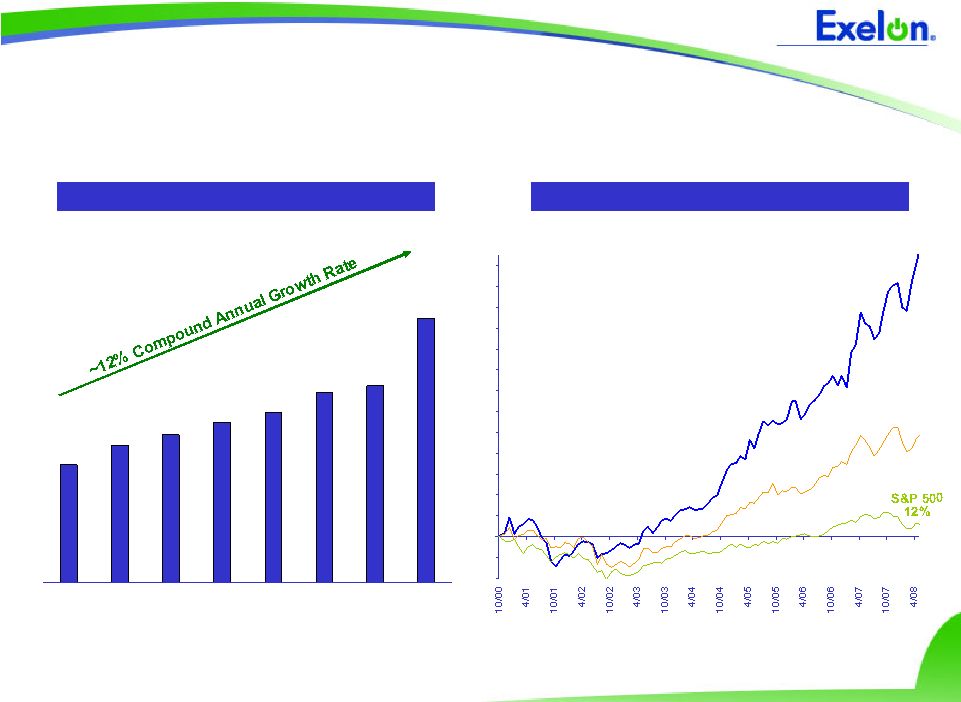
4 $4.32 $3.22 $3.10 $2.78 $2.61 $2.41 $2.24 $1.93 2000 2001 2002 2003 2004 2005 2006 2007 10/20/00 – 5/23/08 Assumes dividend reinvestment Source: Bloomberg EXC 276% UTY 97% Financial Performance Total Shareholder Return Adjusted (non-GAAP) Operating EPS |
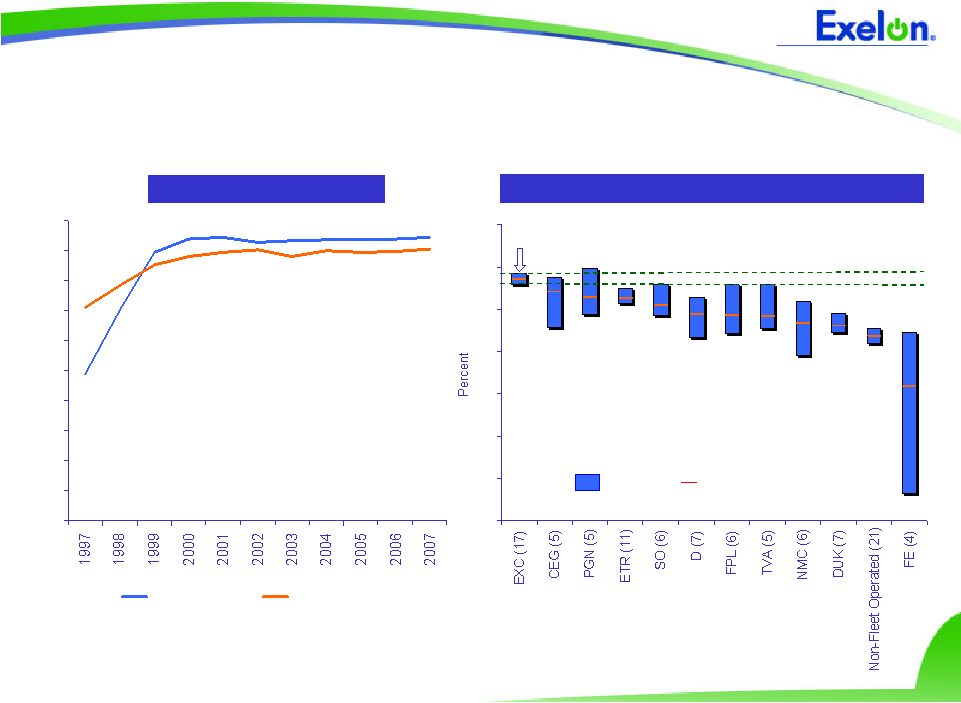
5 World-Class Nuclear Operator 0% 10% 20% 30% 40% 50% 60% 70% 80% 90% 100% Exelon Industry Average Capacity Factor Note: Exelon data prior to 2000 represent ComEd-only nuclear fleet. Sources: Platt’s, Nuclear News, Nuclear Energy Institute and Energy Information Administration (Department of Energy). 65 70 75 80 85 90 95 100 Operator (# of Reactors) Rang 5-Year Average Range of Fleet 2-Yr Avg Capacity Factor (2003-2007) EXC 93.5% |
6 Protect Today’s Value • Deliver superior operating performance • Advance competitive markets • Protect the value of our generation • Build healthy, self-sustaining delivery companies Grow Long-Term Value • Drive the organization to the next level of performance • Set the industry standard for low carbon energy generation and delivery through reductions, displacement and offsets • Pursue and rigorously evaluate new growth opportunities + Strategic Direction |
7 Protect Today’s Value • Deliver superior operating performance • Advance competitive markets • Protect the value of our generation • Build healthy, self-sustaining delivery companies Grow Long-Term Value • Drive the organization to the next level of performance • Set the industry standard for low carbon energy generation and delivery through reductions, displacement and offsets • Pursue and rigorously evaluate new growth opportunities + Strategic Direction |
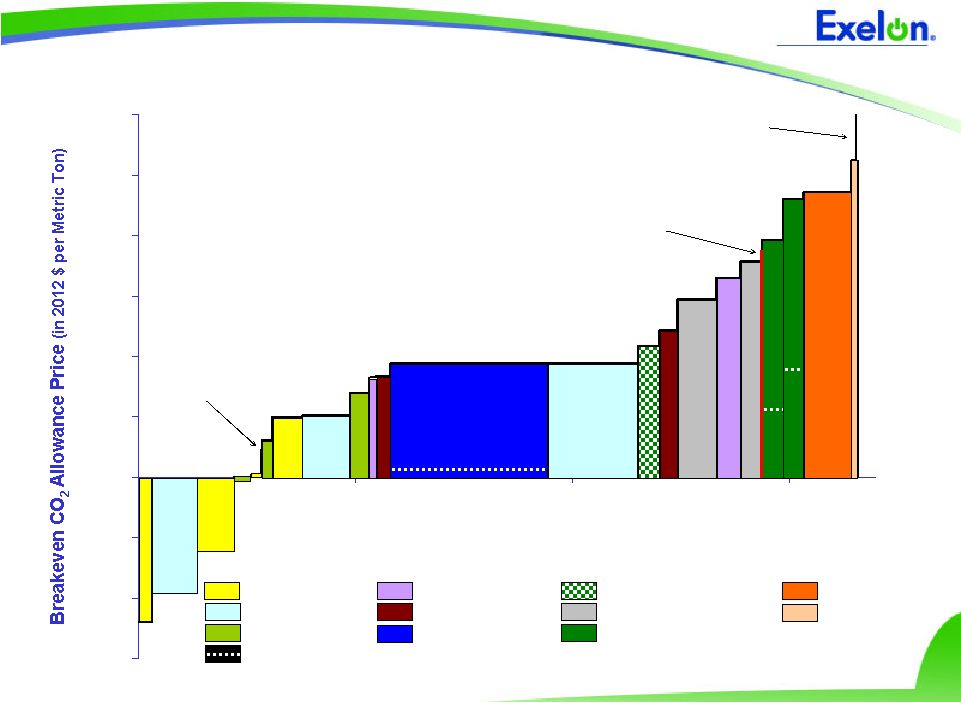
8 Supporting a Low Carbon Future IGCC with CCS Energy Efficiency Nuclear Uprates New Natural Gas Repower Coal Plant Cogeneration New Nuclear Alternative Energy Credits Coal-to-Gas Switch Biomass Dotted line represents price after including effects of loan guarantees / tax incentives Wind ($60) ($40) ($20) $0 $20 $40 $60 $80 $100 $120 0 10 20 30 Solar PV >$800/MT (>$300/MT w/ tax incentives) Million Metric Tons (MT) of CO 2 per Year Landfill Gas 25% Reduction in Internal Energy Use PV = Photovoltaic; IGCC = Integrated Gasification Combined Cycle; CCS = Carbon Capture and Storage Exelon’s CO 2 Abatement Opportunities |
9 |
10 Appendix – GAAP Reconciliation |
11 GAAP EPS Reconciliation 2000-2002 2000 GAAP Reported EPS $1.44 Change in common shares (0.53) Extraordinary items (0.04) Cumulative effect of accounting change -- Unicom pre-merger results 0.79 Merger-related costs 0.34 Pro forma merger accounting adjustments (0.07) 2000 Adjusted (non-GAAP) Operating EPS $1.93 2001 GAAP Reported EPS $2.21 Cumulative effect of adopting SFAS No. 133 (0.02) Employee severance costs 0.05 Litigation reserves 0.01 Net loss on investments 0.01 CTC prepayment (0.01) Wholesale rate settlement (0.01) Settlement of transition bond swap -- 2001 Adjusted (non-GAAP) Operating EPS $2.24 2002 GAAP Reported EPS $2.22 Cumulative effect of adopting SFAS No. 141 and No. 142 0.35 Gain on sale of investment in AT&T Wireless (0.18) Employee severance costs 0.02 2002 Adjusted (non-GAAP) Operating EPS $2.41 |
12 2004 GAAP Reported EPS $2.78 Charges associated with debt repurchases 0.12 Investments in synthetic fuel-producing facilities (0.10) Employee severance costs 0.07 Cumulative effect of adopting FIN 46-R (0.05) Settlement associated with the storage of spent nuclear fuel (0.04) Boston Generating 2004 impact (0.03) Charges associated with investment in Sithe Energies, Inc. 0.02 Charges related to proposed merger with PSEG 0.01 2004 Adjusted (non-GAAP) Operating EPS $2.78 2003 GAAP Reported EPS $1.38 Boston Generating impairment 0.87 Charges associated with investment in Sithe Energies, Inc. 0.27 Employee severance costs 0.24 Cumulative effect of adopting SFAS No. 143 (0.17) Property tax accrual reductions (0.07) Enterprises’ Services goodwill impairment 0.03 Enterprises’ impairments due to anticipated sale 0.03 March 3 ComEd Settlement Agreement 0.03 2003 Adjusted (non-GAAP) Operating EPS $2.61 GAAP EPS Reconciliation 2003-2005 2005 GAAP Reported EPS $1.36 Investments in synthetic fuel-producing facilities (0.10) Charges related to proposed merger with PSEG 0.03 Impairment of ComEd’s goodwill 1.78 2005 financial impact of Generation’s investment in Sithe (0.03) Cumulative effect of adopting FIN 47 2005 Adjusted (non-GAAP) Operating EPS 0.06 $3.10 |
13 GAAP EPS Reconciliation 2006-2007 $3.22 2006 Adjusted (non-GAAP) Operating EPS $2.35 2006 GAAP Reported EPS 1.15 Impairment of ComEd’s goodwill (0.08) Recovery of debt costs at ComEd 0.03 Severance charges (0.13) Nuclear decommissioning obligation reduction (0.14) Recovery of severance costs at ComEd 0.09 Charges related to now terminated merger with PSEG 0.04 Investments in synthetic fuel-producing facilities (0.09) Mark-to-market adjustments from economic hedging activities (0.01) Settlement of a tax matter at Generation related to Sithe (0.04) Non-cash deferred tax items (0.14) Investments in synthetic fuel-producing facilities 0.41 2007 Illinois electric rate settlement (0.19) Termination of State Line PPA 0.11 Georgia Power tolling agreement $4.32 2007 Adjusted (non-GAAP) Operating EPS (0.01) Sale of Generation's investments in TEG and TEP 0.02 City of Chicago settlement (0.03) Nuclear decommissioning obligation reduction 0.15 Mark-to-market adjustments from economic hedging activities $4.05 2007 GAAP Reported EPS |