 Deutsche Bank 2010 Alternative Energy, Utilities & Power Conference William A. Von Hoene, Jr., EVP Finance and Legal May 12, 2010 Exhibit 99.1 |
 2 Forward-Looking Statements This presentation includes forward-looking statements within the meaning of the Private Securities Litigation Reform Act of 1995, that are subject to risks and uncertainties. The factors that could cause actual results to differ materially from these forward-looking statements include those discussed herein as well as those discussed in (1) Exelon’s 2009 Annual Report on Form 10-K in (a) ITEM 1A. Risk Factors, (b) ITEM 7. Management’s Discussion and Analysis of Financial Condition and Results of Operations and (c) ITEM 8. Financial Statements and Supplementary Data: Note 18; (2) Exelon’s First Quarter 2010 Quarterly Report on Form 10-Q in (a) Part II, Other Information, Item 1A. Risk Factors and (b) Part I, Financial Information, Item 1. Financial Statements: Note 12 and (3) other factors discussed in filings with the Securities and Exchange Commission (SEC) by Exelon Corporation, Commonwealth Edison Company, PECO Energy Company and Exelon Generation Company, LLC (Companies). Readers are cautioned not to place undue reliance on these forward-looking statements, which apply only as of the date of this presentation. None of the Companies undertakes any obligation to publicly release any revision to its forward-looking statements to reflect events or circumstances after the date of this presentation. |
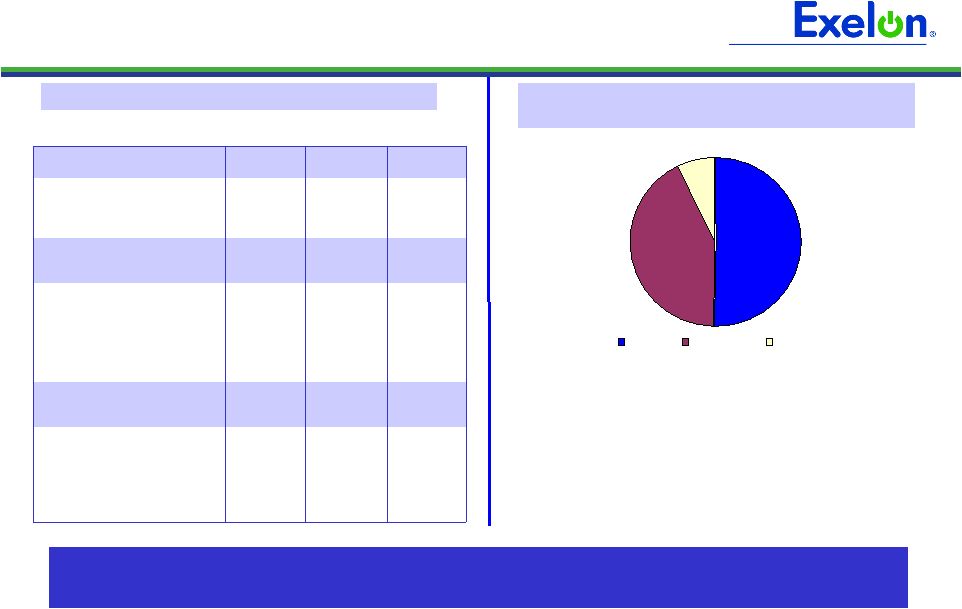 3 10,300 MW 8,700 MW 1,500 MW RTO EMAAC MAAC Exelon Generation Hedging and 2013/2014 RPM Auction $44.50 $44.50 $46.50 Midwest $51.50 $58.00 $36.00 Mid-Atlantic $(6.50) $0.50 $0.50 ERCOT North ATC Spark Spread Effective Realized Energy Price (1) $32.19 $30.71 $29.73 Ni-Hub ATC ($/MWh) $43.47 $42.04 $39.69 PJM-W ATC ($/MWh) Reference Prices 2010 2011 2012 Percentage of Expected Generation Hedged (2) 95-98% 79-82% 48-51% Midwest 92-95 79-82 52-55 Mid-Atlantic 96-99 81-84 44-47 South 97-100 68-71 41-44 Capacity by Region Eligible for 2013/14 RPM Base Residual Auction (3) (3) All generation values are approximate and not inclusive of wholesale transactions. Notes: All capacity values are in installed capacity terms (summer ratings) located in the areas. Eddystone 2 to retire 12/31/13. MAAC = Mid-Atlantic Area Council; EMAAC = Eastern MAAC; the MAAC area encompasses EMAAC. 7% 50% 43% Hedge Profile as of March 31, 2010 Hedging program protects Exelon in market downturns and leaves upside to recovery; capacity auction should provide modest upside to Exelon Generation in 2013/2014 (1) See Footnote 3 on page 19 (2) See Footnote 2 on page 19 |
 4 Utility Load – Emerging Signs of Recovery Weather-Normalized Load Note: C&I = Commercial & Industrial; E = Estimated 2009 (1) 1Q10 2010E Customer Growth (0.4)% (0.1)% 0.1% Average Use-Per-Customer (1.0)% 0.2% 0.1% Total Residential (1.4)% 0.1% 0.2% Small C&I (2.2)% (1.7)% 0.4% Large C&I (6.7)% (1.1)% 1.7% All Customer Classes (3.3)% (0.8)% 0.8% 2009 (1) 1Q10 2010E Customer Growth (0.2)% (0.2)% (0.0)% Average Use-Per-Customer (2.1)% 2.1% 1.2% Total Residential (2.3)% 1.8% 1.1% Small C&I (2.7)% (0.9)% (0.2)% Large C&I (3.0)% 0.1% (0.3)% All Customer Classes (2.6)% 0.5% 0.3% ComEd March 2010 was first month with positive load growth since July 2008 Positive customer growth in 1Q10; first time since December 2008 Expected improvement in C&I load through 2010 PECO Signs of improving demand earlier than expected Increased load in Large C&I in 1Q10 Positive Gross Metro Product forecasted for Philadelphia in 2010 Weather-Normalized Electric Load Beginning to see signs of recovery in Chicago and Philadelphia (1) Not adjusted for leap year effect. |
 5 Constructive Regulatory Relationships for ComEd and PECO ComEd Uncollectibles expense rider allows ComEd to recover bad debt amounts not included in base rates ($70M in 2008-2009) ComEd investing ~$70M in ICC-approved Smart Meter pilot program with rider recovery ComEd expects to file an electric distribution rate case in 2Q10 PECO PECO filed electric and gas distribution rate cases in March 2010 • First electric distribution rate case in 21 years PECO to invest in Smart Meter/Smart Grid over 10-15 years • Received $200M grant from DOE for Smart Grid Investments • Costs recoverable through a combination of surcharge and return on rate base 2 of 4 procurements for post 2010-supply complete; preparing residential customers for overall increases of ~11% Utility investment is being recovered through rate cases and rider mechanisms Note: ICC = Illinois Commerce Commission |
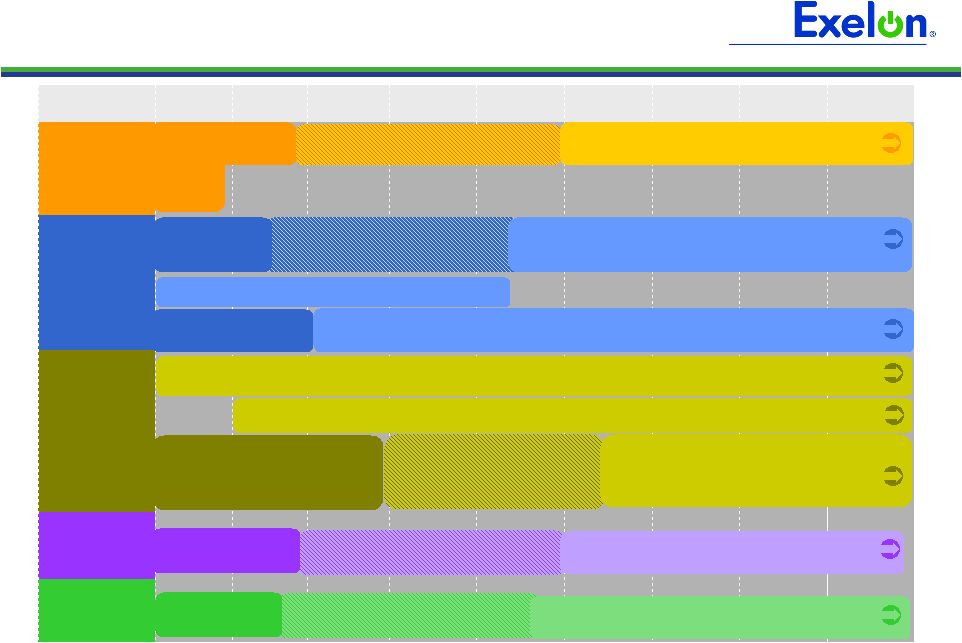
 6 Nuclear Uprates Remain Economic Exelon investing ~$4.4B through 2017 in nuclear uprate projects that will provide an additional 1,300 – 1,500 MWs of additional generation capacity Projects have significantly lower cost and shorter timeline than a new nuclear plant - $2,200-2,500/kW overnight cost Scale of nuclear uprates that Exelon can execute is unmatched Uprate program allows us to adjust timing to respond to market conditions Extended Power Uprates (EPUs) Measurement Uncertainty Recapture (MURs) MW Recovery and Component Upgrades Maximum Potential MW Year Uprates Become Operational 1999- 2008 2009 2010 2011 2012 2013 2014 2015 2016 2017 2009- 2017 Exelon’s Uprate Plan 1,100 MW 1,300 – 1,500 MW 0 200 400 600 800 1,000 1,200 1,400 1,600 ~70 MW |
 7 316(b) 2010 2011 2012 2013 2014 2015 2016 2017 2018 Hazardous Air Pollutants (HAP) Criteria Pollutants Greenhouse Gases Coal Combustion By-Products Compliance with Federal GHG Reporting Rule Pre-Compliance Period PSD/BACT and Title V Applies to GHG Emissions from New and Modified Sources Develop GHG Cap and Trade Legislation or EPA GHG Regulations Under CAA Compliance with GHG Cap and Trade Legislation or EPA GHG Regs Under CAA Compliance with MACT HAP ICR Pre-Compliance Period Develop Coal and Oil MACT Interim CAIR Program Pre-Compliance Period Develop Clean Air Transport Rule (CATR) Compliance with CATR (to replace CAIR) SIP provisions developed in response to revised NAAQS (e.g., Ozone, PM 2.5 , SO2, NO2) Develop Revised NAAQS Pre-Compliance Period Compliance with Federal CCB Regulations Develop Coal Combustion By- Products Rule Pre-Compliance Period Compliance with 316(b) Regulations Develop 316(b) Regulations EPA Regulation Note: For definition of the EPA regulations referred to on this slide, please see the EPA’s Terms of Environment (http://www.epa.gov/OCEPAterms/). |
 8 Appendix |
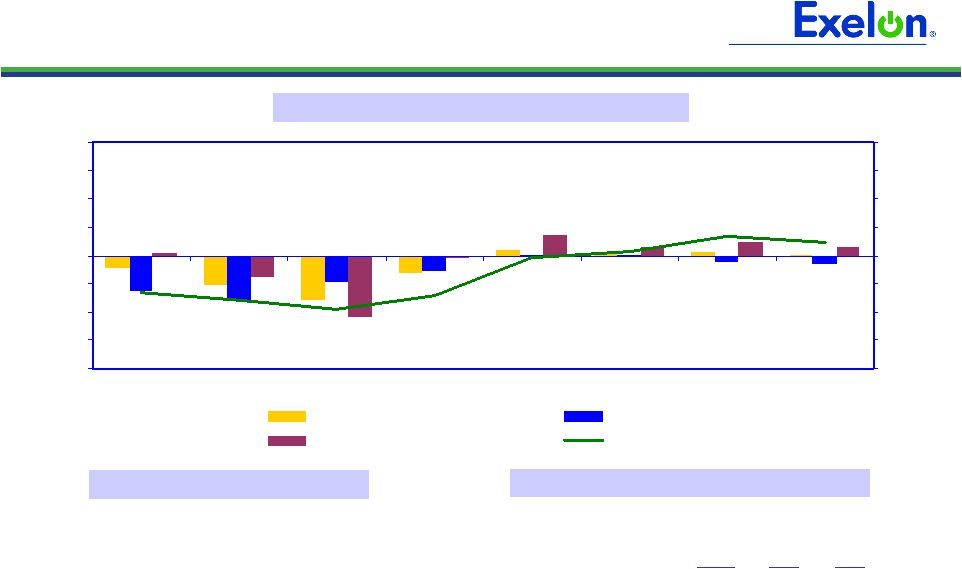
 9 Illinois Power Agency (IPA) RFP Procurement • On April 30, 2010, the ICC approved the bids from the RFP Procurement held on April 28, 2010, for the remaining ComEd 2010-2011 load (~25% of the total) and a portion of its 2011-2012 load (~7% of the total) – Contracts were awarded to 12 successful bidders – $32.54 ATC price for 2010-2011 planning year, in addition to: • Financial Swap price (ATC baseload energy only) of $50.15 for June 2010 – December 2010 and $51.26 for January 2011 – December 2011; increase in notional quantity to 3,000 MW on June 1, 2010 Delivery Period Peak Off-Peak June 2010 - May 2011 5,528 4,344 June 2011 - May 2012 1,980 549 Volume procured in the 2010 IPA Procurement Event (GWh) Note: Chart is for illustrative purposes only. Data on this slide is rounded. 2009 RFP 2009 RFP 2010 RFP 2010 RFP 2011 RFP 2011 RFP 2011 RFP 2012 RFP 2012 RFP 2013 RFP Financial Swap Auction Contract June 2009 June 2010 June 2011 June 2012 June 2013 June 2014 |
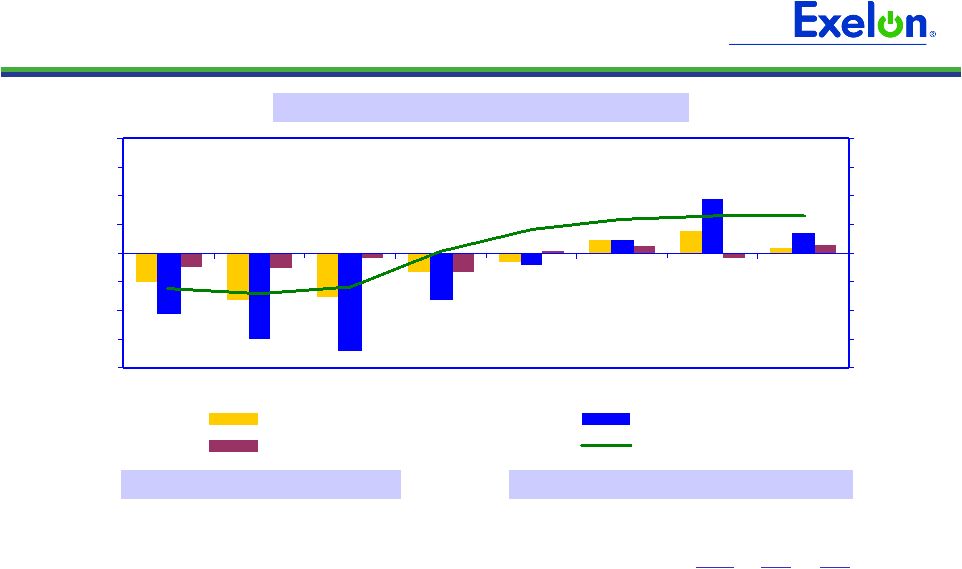 10 -10.0% -7.5% -5.0% -2.5% 0.0% 2.5% 5.0% 7.5% 10.0% 1Q09 2Q09 3Q09 4Q09 1Q10 2Q10E 3Q10E 4Q10E -10.0% -7.5% -5.0% -2.5% 0.0% 2.5% 5.0% 7.5% 10.0% All Customer Classes Large C&I Residential Gross Metro Product ComEd Load Trends Weather-Normalized Load Key Economic Indicators Note: C&I = Commercial & Industrial Weather-Normalized Load Year-over-Year (4) Chicago Unemployment rate (1) 10.9% 2010 annualized growth in gross domestic/metro product (2) 2.9% 1/10 Home price index (3) (4.4)% (1) Source: Illinois Dept. of Employment Security (February 2010) (2) Source: Global Insight (March 2010) (3) Source: S&P Case-Shiller Index (4) Not adjusted for leap year effect 2009 (4) 1Q10 2010E Average Customer Growth (0.4)% (0.1)% 0.1% Average Use-Per-Customer (1.0)% 0.2% 0.1% Total Residential (1.4)% 0.1% 0.2% Small C&I (2.2)% (1.7)% 0.4% Large C&I (6.7)% (1.1)% 1.7% All Customer Classes (3.3)% (0.8)% 0.8% |
 11 PECO Load Trends Weather-Normalized Electric Load Key Economic Indicators Weather-Normalized Load Year-over-Year (3) Philadelphia Unemployment rate (1) 9.2% 2010 annualized growth in gross domestic/metro product (2) 0.8% (1) Source: U.S Dept. of Labor (PHL - February 2010) (2) Source: Moody’s Economy.com (March 2010) (3) Not adjusted for leap year effect -10.0% -7.5% -5.0% -2.5% 0.0% 2.5% 5.0% 7.5% 10.0% 1Q09 2Q09 3Q09 4Q09 1Q10 2Q10E 3Q10E 4Q10E -10.0% -7.5% -5.0% -2.5% 0.0% 2.5% 5.0% 7.5% 10.0% All Customer Classes Large C&I Residential Gross Metro Product Note: C&I = Commercial & Industrial 2009 (3) 1Q10 2010E Average Customer Growth (0.2)% (0.2)% (0.0)% Average Use-Per-Customer (2.1)% 2.1% 1.2% Total Residential (2.3)% 1.8% 1.1% Small C&I (2.7)% (0.9)% (0.2)% Large C&I (3.0)% 0.1% (0.3)% All Customer Classes (2.6)% 0.5% 0.3% |
 12 PECO – Electric & Gas Distribution Rate Case Filings On March 31, PECO filed electric and gas distribution rate cases • First electric distribution rate case since 1989 – Act 129 energy efficiency and smart meter costs recovered separately through rider • Last gas delivery rate case in 2008 53.18% 53.18% Common Equity Ratio R-2010-216-1592 R-2010-216-1575 Docket # 2010 (1) 2010 (1) Test Year ROE: 11.75% ROR: 8.95% ROE: 11.75% ROR: 8.95% Requested Returns $1,100 million $3,236 million Rate Base 6.94% (2) $316 million Electric $44 million Revenue Requirement Increase 5.28% 2011 Proposed Distribution Price Increase as % of Overall Customer Bill Gas Rate Case Request The PAPUC has a nine-month process for litigation of the rate case filings (1) With pro forma adjustments. (2) Excluding Alternative Energy Portfolio Standards (AEPS) and default service surcharge. Note: Electric and gas rate case filings available on PAPUC website or www.peco.com/know. |
 13 5.03 6.26 6.23 0.51 0.70 2.57 9.01 PECO - Electric Residential Rate Increases 2010 to 2011 January 1, 2011 January 1, 2010 Total = 14.7¢ Unit Rates (¢/kWh) Proposed Total Bill Increase ~11 % Total = 16.3¢ AEPS ~0.6% Default Service Surcharge Mechanism based on results of first two procurements ~1.2% Transmission surcharge mechanism ~1.3% Energy / Capacity Competitive Transition Charge Transmission Distribution Distribution rate case ~8.2% 0.38 Energy Efficiency Surcharge Breakdown of 2010 to 2011 ~11% Increase (On Total Bill) Notes: • Rates effective January 1, 2010 include Act 129 Energy Efficiency surcharge of 2%. • A Smart Meter surcharge, which will likely be effective 3Q10, is expected to be less than 1% and is not expected to increase until 2Q/3Q of 2011. As a result, the Smart Meter surcharge will have a minimal impact on rate increases effective January 1, 2011. • Low income discounted rates were subsidized in the Power Purchase Agreement (PPA) in 2010 and will be recovered through distribution rates in 2011. 0.29 |
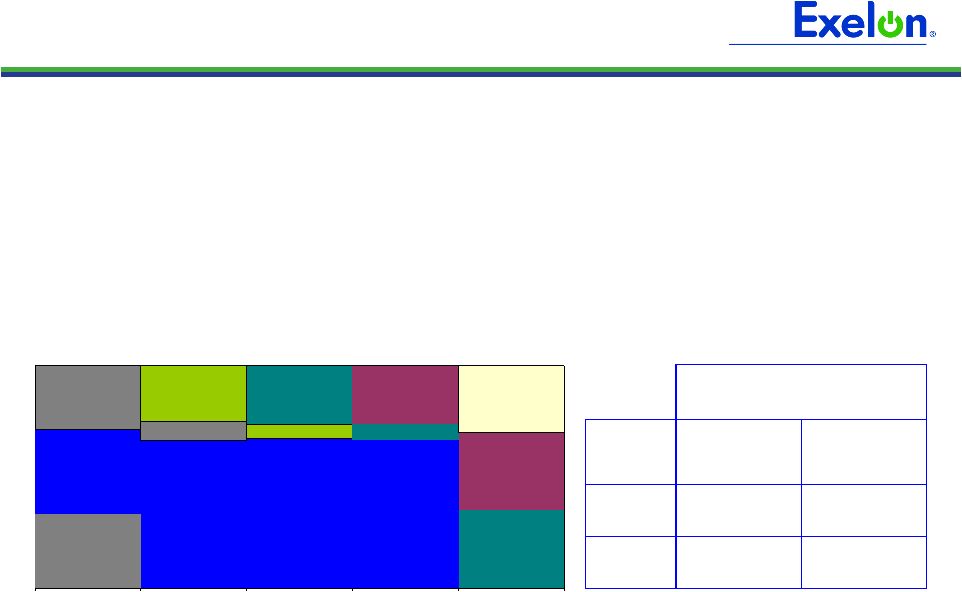
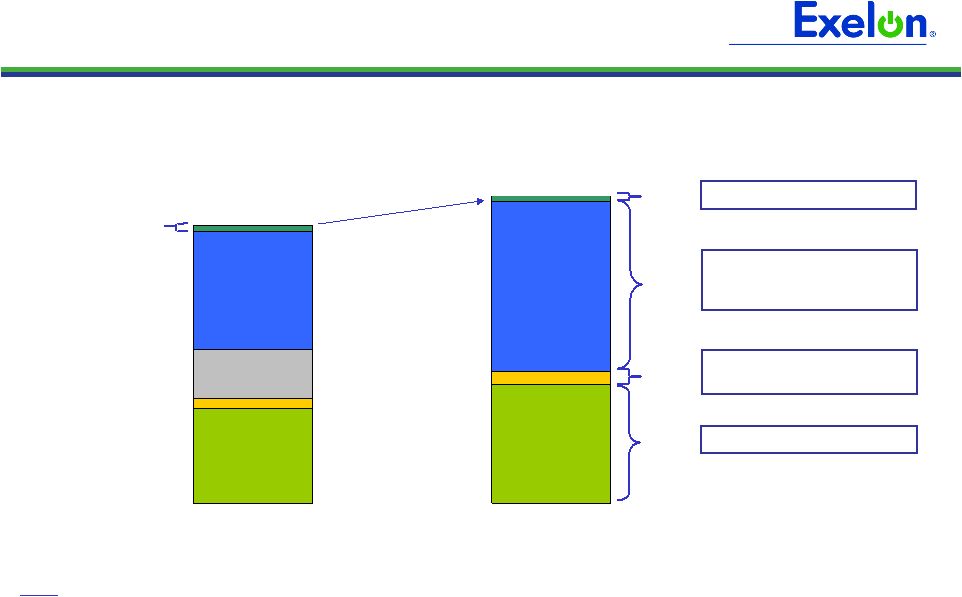
 14 14 14 Exelon Generation Hedging Disclosures (As disclosed on April 23, 2010) Exelon Generation Hedging Disclosures (As disclosed on April 23, 2010) |
 15 15 15 Important Information The following slides are intended to provide additional information regarding the hedging program at Exelon Generation and to serve as an aid for the purposes of modeling Exelon Generation’s gross margin (operating revenues less purchased power and fuel expense). The information on the following slides is not intended to represent earnings guidance or a forecast of future events. In fact, many of the factors that ultimately will determine Exelon Generation’s actual gross margin are based upon highly variable market factors outside of our control. The information on the following slides is as of March 31, 2010. Going forward, we plan to update the information on a quarterly basis. Certain information on the following slides is based upon an internal simulation model that incorporates assumptions regarding future market conditions, including power and commodity prices, heat rates, and demand conditions, in addition to operating performance and dispatch characteristics of our generating fleet. Our simulation model and the assumptions therein are subject to change. For example, actual market conditions and the dispatch profile of our generation fleet in future periods will likely differ – and may differ significantly – from the assumptions underlying the simulation results included in the slides. In addition, the forward- looking information included in the following slides will likely change over time due to continued refinement of our simulation model and changes in our views on future market conditions. |
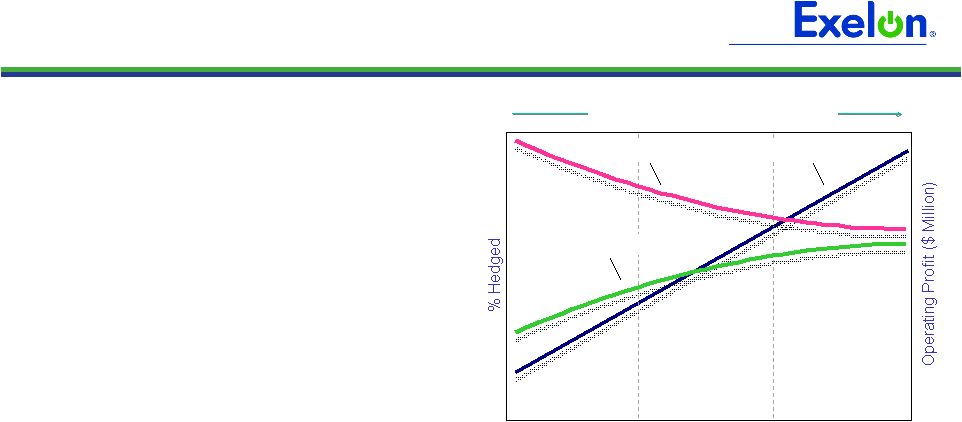 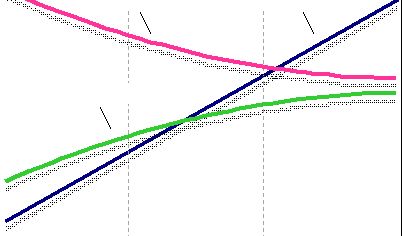     16 Portfolio Management Objective Align Hedging Activities with Financial Commitments • Power Team utilizes several product types and channels to market • Wholesale and retail sales • Block products • Load-following products and load auctions • Put/call options • Exelon’s hedging program is designed to protect the long-term value of our generating fleet and maintain an investment-grade balance sheet • Hedge enough commodity risk to meet future cash requirements if prices drop • Consider: financing policy (credit rating objectives, capital structure, liquidity); spending (capital and O&M); shareholder value return policy • Consider market, credit, operational risk • Approach to managing volatility • Increase hedging as delivery approaches • Have enough supply to meet peak load • Purchase fossil fuels as power is sold • Choose hedging products based on generation portfolio – sell what we own • Heat rate options • Fuel products • Capacity • Renewable credits % Hedged High End of Profit Low End of Profit Open Generation with LT Contracts Portfolio Optimization Portfolio Management Portfolio Management Over Time |
 17 17 17 17 Percentage of Expected Generation Hedged • How many equivalent MW have been hedged at forward market prices; all hedge products used are converted to an equivalent average MW volume • Takes ALL hedges into account whether they are power sales or financial products Equivalent MWs Sold Expected Generation = • Our normal practice is to hedge commodity risk on a ratable basis over the three years leading to the spot market • Carry operational length into spot market to manage forced outage and load-following risks • By using the appropriate product mix, expected generation hedged approaches the mid-90s percentile as the delivery period approaches • Participation in larger procurement events, such as utility auctions, and some flexibility in the timing of hedging may mean the hedge program is not strictly ratable from quarter to quarter Exelon Generation Hedging Program |
 18 18 18 18 2010 2011 2012 Estimated Open Gross Margin ($ millions) (1,2) $5,050 $4,900 $4,750 Open gross margin assumes all expected generation is sold at the Reference Prices listed below Reference Prices (1) Henry Hub Natural Gas ($/MMBtu) NI-Hub ATC Energy Price ($/MWh) PJM-W ATC Energy Price ($/MWh) ERCOT North ATC Spark Spread ($/MWh) (3) $4.48 $29.73 $39.69 $0.43 $5.34 $30.71 $42.04 $(0.42) $5.79 $32.19 $43.47 $0.14 (1) Based on March 31, 2010 market conditions. (2) Gross margin is defined as operating revenues less fuel expense and purchased power expense, excluding the impact of decommissioning and other incidental revenues. Open gross margin is estimated based upon an internal model that is developed by dispatching our expected generation to current market power and fossil fuel prices. Open gross margin assumes there is no hedging in place other than fixed assumptions for capacity cleared in the RPM auctions and uranium costs for nuclear power plants. Open gross margin contains assumptions for other gross margin line items such as various ISO bill and ancillary revenues and costs and PPA capacity revenues and payments. The estimation of open gross margin incorporates management discretion and modeling assumptions that are subject to change. (3) ERCOT North ATC spark spread using Houston Ship Channel Gas, 7,200 heat rate, $2.50 variable O&M. Exelon Generation Open Gross Margin and Reference Prices |
 19 19 19 19 (1) Expected generation represents the amount of energy estimated to be generated or purchased through owned or contracted for capacity. Expected generation is based upon a simulated dispatch model that makes assumptions regarding future market conditions, which are calibrated to market quotes for power, fuel, load following products, and options. Expected generation assumes 10 refueling outages in 2010 and 11 refueling outages in 2011 and 2012 at Exelon-operated nuclear plants and Salem. Expected generation assumes capacity factors of 93.5%, 92.8% and 92.8% in 2010, 2011 and 2012 at Exelon-operated nuclear plants. These estimates of expected generation in 2011 and 2012 do not represent guidance or a forecast of future results as Exelon has not completed its planning or optimization processes for those years. (2) Percent of expected generation hedged is the amount of equivalent sales divided by the expected generation. Includes all hedging products, such as wholesale and retail sales of power, options, and swaps. Uses expected value on options. Reflects decision to permanently retire Cromby Station and Eddystone Units 1&2 as of May 31, 2011. (3) Effective realized energy price is representative of an all-in hedged price, on a per MWh basis, at which expected generation has been hedged. It is developed by considering the energy revenues and costs associated with our hedges and by considering the fossil fuel that has been purchased to lock in margin. It excludes uranium costs and RPM capacity revenue, but includes the mark-to-market value of capacity contracted at prices other than RPM clearing prices including our load obligations. It can be compared with the reference prices used to calculate open gross margin in order to determine the mark-to-market value of Exelon Generation's energy hedges. 2010 2011 2012 Expected Generation (GWh) (1) 164,600 161,700 161,200 Midwest 98,600 98,100 97,000 Mid-Atlantic 58,000 56,600 56,600 South 8,000 7,000 7,600 Percentage of Expected Generation Hedged (2) 95-98% 79-82% 48-51% Midwest 92-95 79-82 52-55 Mid-Atlantic 96-99 81-84 44-47 South 97-100 68-71 41-44 Effective Realized Energy Price ($/MWh) (3) Midwest $46.50 $44.50 $44.50 Mid-Atlantic $36.00 $58.00 $51.50 ERCOT North ATC Spark Spread $0.50 $0.50 $(6.50) Generation Profile |
 20 20 20 20 Gross Margin Sensitivities with Existing Hedges ($ millions) (1) Henry Hub Natural Gas + $1/MMBtu - $1/MMBtu NI-Hub ATC Energy Price +$5/MWH -$5/MWH PJM-W ATC Energy Price +$5/MWH -$5/MWH Nuclear Capacity Factor +1% / -1% 2010 $40 $(20) $20 $(15) $5 $ - +/- $30 2011 $125 $(110) $125 $(115) $75 $(70) +/- $40 2012 $320 $(315) $235 $(225) $175 $(170) +/- $45 (1) Based on March 31, 2010 market conditions and hedged position. Gas price sensitivities are based on an assumed gas-power relationship derived from an internal model that is updated periodically. Power prices sensitivities are derived by adjusting the power price assumption while keeping all other prices inputs constant. Due to correlation of the various assumptions, the hedged gross margin impact calculated by aggregating individual sensitivities may not be equal to the hedged gross margin impact calculated when correlations between the various assumptions are also considered. Exelon Generation Gross Margin Sensitivities (with Existing Hedges) |
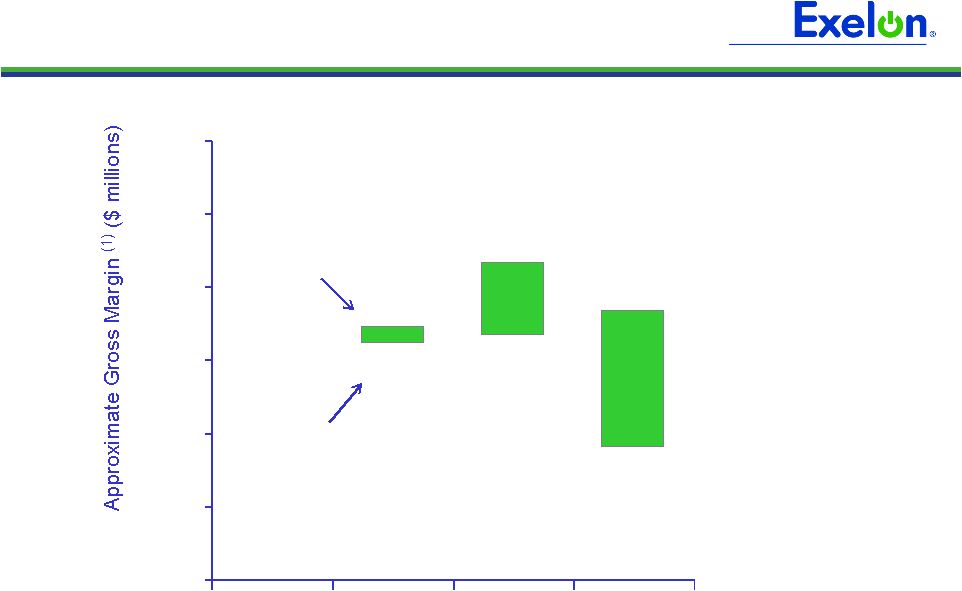 21 21 21 21 95% case 5% case $6,500 $6,200 $4,800 $7,200 $6,300 $6,600 Exelon Generation Gross Margin Upside / Risk (with Existing Hedges) $3,000 $4,000 $5,000 $6,000 $7,000 $8,000 $9,000 2010 2011 2012 (1) Represents an approximate range of expected gross margin, taking into account hedges in place, between the 5th and 95th percent confidence levels assuming all unhedged supply is sold into the spot market. Approximate gross margin ranges are based upon an internal simulation model and are subject to change based upon market inputs, future transactions and potential modeling changes. These ranges of approximate gross margin in 2011 and 2012 do not represent earnings guidance or a forecast of future results as Exelon has not completed its planning or optimization processes for those years. The price distributions that generate this range are calibrated to market quotes for power, fuel, load following products, and options as of March 31, 2010. |
 22 22 22 22 Midwest Mid-Atlantic ERCOT Step 1 Start with fleetwide open gross margin $5.05 billion Step 2 Determine the mark-to-market value of energy hedges 98,600GWh * 93% * ($46.50/MWh-$29.73/MWh) = $1.54 billion 58,000GWh * 97% * ($36.00/MWh-$39.69/MWh) = $(0.21 billion) 8,000GWh * 98% * ($0.50/MWh-$0.43/MWh) = $0.00 billion Step 3 Estimate hedged gross margin by adding open gross margin to mark-to- market value of energy hedges Open gross margin: $5.05 billion MTM value of energy hedges: $1.54 billion + $(0.21 billion) + $0.00 billion Estimated hedged gross margin: $6.38 billion Illustrative Example of Modeling Exelon Generation 2010 Gross Margin (with Existing Hedges) |
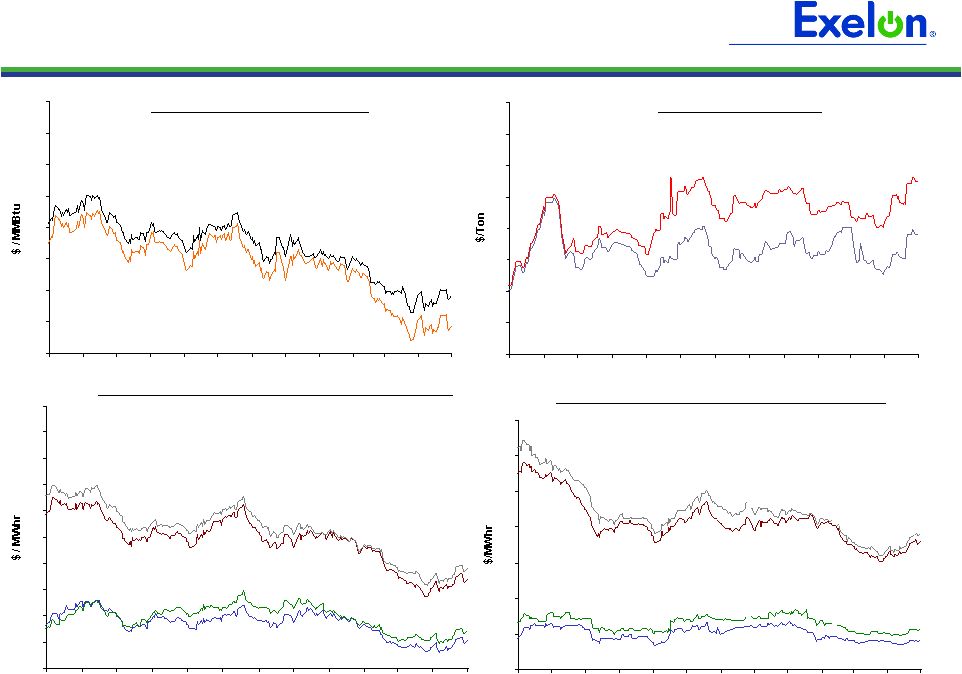 23 23 23 23 23 23 50 55 60 65 70 75 80 85 90 5/09 6/09 7/09 8/09 9/09 10/09 11/09 12/09 1/10 2/10 3/10 4/10 5/10 20 25 30 35 40 45 50 55 5/09 6/09 7/09 8/09 9/09 10/09 11/09 12/09 1/10 2/10 3/10 4/10 5/10 35 40 45 50 55 60 65 70 75 80 85 5/09 6/09 7/09 8/09 9/09 10/09 11/09 12/09 1/10 2/10 3/10 4/10 5/10 5 5.5 6 6.5 7 7.5 8 8.5 9 5/09 6/09 7/09 8/09 9/09 10/09 11/09 12/09 1/10 2/10 3/10 4/10 5/10 23 Market Price Snapshot Forward NYMEX Natural Gas PJM-West and Ni-Hub On-Peak Forward Prices PJM-West and Ni-Hub Wrap Forward Prices 2011 $5.44 2012 $5.92 Rolling 12 months, as of May 3, 2010. Source: OTC quotes and electronic trading system. Quotes are daily. Forward NYMEX Coal 2011 $69.00 2012 $77.35 2011 Ni-Hub $40.27 2012 Ni-Hub $42.15 2012 PJM-West $53.89 2011 PJM-West $51.96 2011 Ni-Hub $24.13 2012 Ni-Hub $25.61 2012 PJM-West $39.12 2011 PJM-West $38.14 |
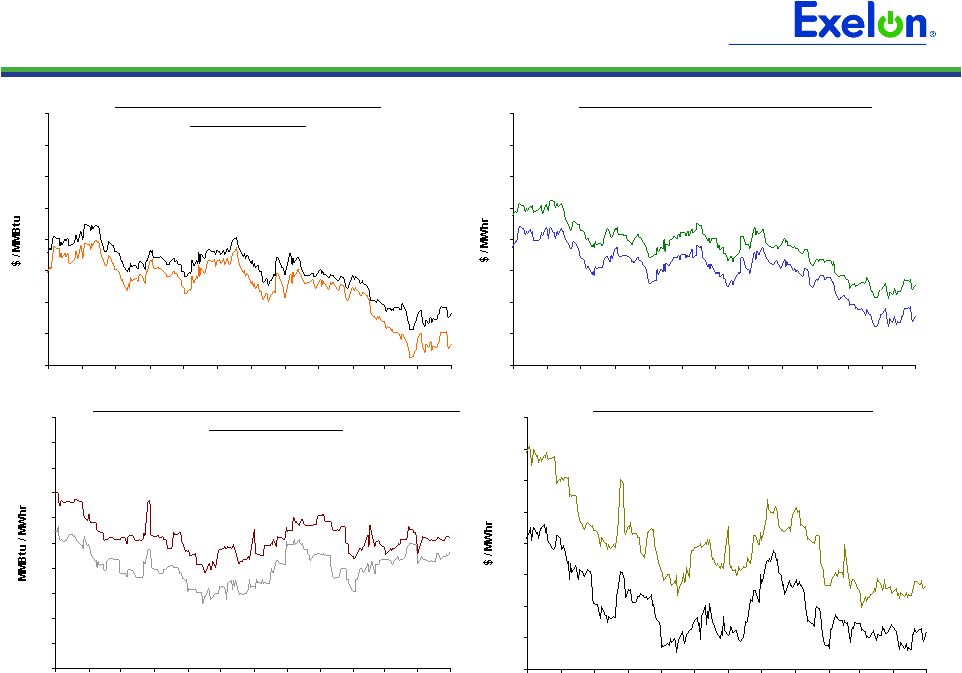 24 24 24 24 24 24 5.5 6.5 7.5 8.5 9.5 10.5 11.5 12.5 13.5 5/09 6/09 7/09 8/09 9/09 10/09 11/09 12/09 1/10 2/10 3/10 4/10 5/10 8 8.2 8.4 8.6 8.8 9 9.2 9.4 9.6 9.8 10 5/09 6/09 7/09 8/09 9/09 10/09 11/09 12/09 1/10 2/10 3/10 4/10 5/10 40 45 50 55 60 65 70 75 80 5/09 6/09 7/09 8/09 9/09 10/09 11/09 12/09 1/10 2/10 3/10 4/10 5/10 5 5.5 6 6.5 7 7.5 8 8.5 9 5/09 6/09 7/09 8/09 9/09 10/09 11/09 12/09 1/10 2/10 3/10 4/10 5/10 24 Market Price Snapshot 2012 $9.04 2011 $8.93 2011 $47.83 2012 $52.73 2011 $5.35 2012 $5.83 Houston Ship Channel Natural Gas Forward Prices ERCOT North On-Peak Forward Prices ERCOT North On-Peak v. Houston Ship Channel Implied Heat Rate 2011 $6.71 2012 $8.17 ERCOT North On Peak Spark Spread Assumes a 7.2 Heat Rate, $1.50 O&M, and $.15 adder Rolling 12 months, as of May 3, 2010. Source: OTC quotes and electronic trading system. Quotes are daily. |