 Earnings Conference Call 1 st Quarter 2014 April 30, 2014 Exhibit 99.2 |
 Cautionary Statements Regarding Forward-Looking Information This presentation contains certain forward-looking statements within the meaning of the Private Securities Litigation Reform Act of 1995, that are subject to risks and uncertainties. The factors that could cause actual results to differ materially from the forward-looking statements made by Exelon Corporation, Commonwealth Edison Company, PECO Energy Company, Baltimore Gas and Electric Company and Exelon Generation Company, LLC (Registrants) include those factors discussed herein, as well as the items discussed in (1) Exelon’s 2013 Annual Report on Form 10-K in (a) ITEM 1A. Risk Factors, (b) ITEM 7. Management’s Discussion and Analysis of Financial Condition and Results of Operations and (c) ITEM 8. Financial Statements and Supplementary Data: Note 22; (2) Exelon’s First Quarter 2014 Quarterly Report on Form 10-Q (to be filed on April 30, 2014) in (a) Part II, Other Information, ITEM 1A. Risk Factors; (b) Part 1, Financial Information, ITEM 2. Management’s Discussion and Analysis of Financial Condition and Results of Operations and (c) Part I, Financial Information, ITEM 1. Financial Statements: Note 15; and (3) other factors discussed in filings with the SEC by the Registrants. Readers are cautioned not to place undue reliance on these forward-looking statements, which apply only as of the date of this presentation. None of the Registrants undertakes any obligation to publicly release any revision to its forward-looking statements to reflect events or circumstances after the date of this presentation. 1 |
 Q1 2014 In Review 2014 1Q Earnings Release Slides 2 Q1 Highlights Adjusted Operating EPS Results (1,2) • Signs of Power Market Recovery • Winter Storms • Nuclear capacity factor: 94.1% • CENG License Transfer • ProLiance Acquisition Regulatory Advocacy • PJM Capacity Market Reforms o Imports o Demand Response o Speculation • Educating Stakeholders on Nuclear Economics ExGen BGE ComEd PECO Q1 2014 $0.62 $0.30 $0.11 $0.10 $0.10 (1) (2) Refer to the Earnings Release Attachments for additional details and to the Appendix for a reconciliation of adjusted (non-GAAP) operating EPS to GAAP EPS. Amounts may not add due to rounding. |
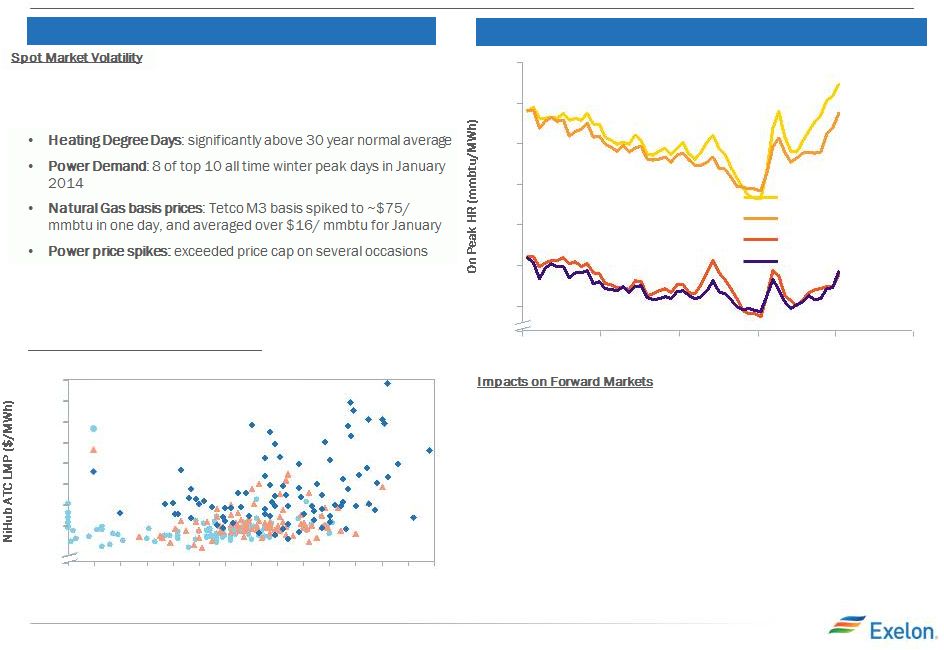 Spot and Forward Market Volatility 2014 1Q Earnings Release Slides 3 Q1 2014 Saw Increased Volatility Forward Markets Reacted To Spot Prices • Forward markets have a tendency to reflect spot market activity • While forward hub natural gas prices stayed relatively flat during the quarter, we saw a significant increase in power prices and therefore heat rates in 2015 and 2016 • This was especially true for PJM West Hub and the largest impacts were due to the pricing of forward winter months • The spot market so far in 2014 has been very volatile • Polar vortex resulted in extreme conditions: • The spot prices in PJM started to reflect the changing nature of the grid and new reliance on different resources such as natural gas supply, demand response, and oil peakers • Even if extreme days are taken out, 2014 saw higher prices at NiHub than previous years $100 $90 $80 $70 $60 $50 $40 $30 $0 Daily Heating Degree Days 2014 2013 2012 NiHub LMP per Daily HDD (Days below $100/MWh) 7/1/2013 12.0 11.5 11.0 10.5 10.0 9.5 9.0 0.0 4/1/2014 1/1/2014 4/1/2013 10/1/2013 NiHub On Peak HR - 2016 NiHub On Peak HR - 2015 Whub On Peak HR - 2016 Whub On Peak HR - 2015 0 5 10 15 20 25 30 35 40 45 50 55 60 65 70 |
 Capacity Market Developments 2014 1Q Earnings Release Slides 4 New England During first quarter, Forward Capacity Auction (FCA) #8 for planning year 17/18 cleared significantly higher than last auction. Rest of Pool cleared $7.025/kw-month and NEMA cleared $15.00/kw-month Clearing results are indicative of a tighter supply/demand situation after the announcement of unit retirements FCA #9 will feature a sloped demand curve for Rest of Pool resulting in a more stable market design A vertical demand curve for constrained zones (i.e., NEMA) remains in place until FCA #10 FERC is expected to rule on the ISO’s proposed Performance Incentives Forward Capacity Market redesign by mid-May New York ISO NYISO’s Summer Strip Auction cleared higher year-over-year for both Rest of State (ROS) and NYC Beginning in May 2014 Lower Hudson Valley (LHV) has been broken out from ROS as a separate capacity zone to enhance reliability MISO MISO’s 2 annual capacity auction cleared higher year-over-year but is still lower than recent results in neighboring PJM RTO We are evaluating recent reports and studies that are showing a tighter supply/demand picture in several MISO zones as plants retire PJM – RPM rule/market design changes Change in DR clearing mechanism which limits total volume of Limited DR and aggregate Sub-Annual products consistent with reliability limits Standardization of demand response capacity sales plans that require Officer Certification of intent to deliver Steam units required to apply temperature correction to establish Installed Capacity (ICAP) ratings Limits on imports into RTO subject to a “pseudo-tie exemption” FERC is expected to rule on PJM’s proposed speculation reforms before the auction opens nd |
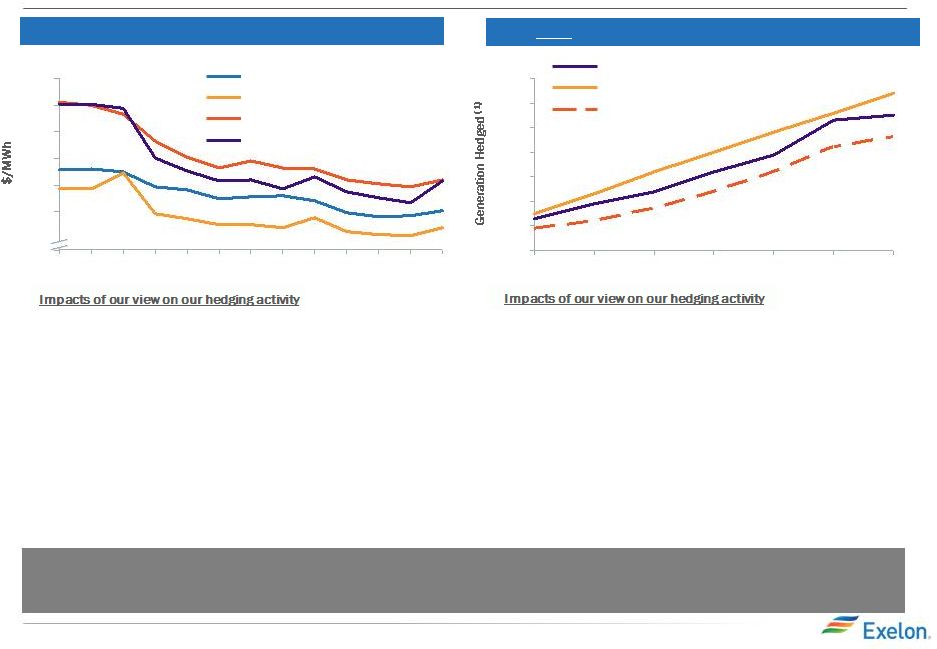 Hedging Activity and Market Fundamentals 5 Fundamental View vs. Market - 2015 2015: Rotating into a Large Heat Rate Strategy (1) Mid-point of disclosed total portfolio hedge % range was used 2015-Actual (excl NG hedges) 2015-Ratable 2015-Actual • We align our hedging strategies with our fundamental views by leaving portfolio exposure to power price upside • As forward heat rates have moved, we have shifted between our two strategies of falling behind ratable and hedging with Natural Gas • When considering our behind ratable and cross commodity strategies, we have left a significant amount of our portfolio open to moves in the power market: • Approximately 45% open in 2015 • Approximately 70% open in 2016 We are deploying a behind ratable strategy and a cross-commodity position in order to leave exposure to power upside 4Q12 3Q12 1Q14 4Q13 3Q13 2Q13 1Q13 • Structural changes in the stack and weather drove higher prices and volatility in the spot energy market during Q1 • The forward market has incorporated some of the upside especially for PJM West Hub and more so in winter months • We expect further upside in NiHub forward heat rates based on our fundamental forecast given current natural gas prices, expected retirements, new generation resources, and load assumptions $60 $55 $50 $45 $40 $35 $15 1Q14 4Q13 3Q13 2Q13 1Q13 4Q12 3Q12 2Q12 1Q12 4Q11 3Q11 2Q11 1Q11 Market PJMW Fundamental View PJMW Market NiHub Fundamental View NiHub 2014 1Q Earnings Release Slides 10% 20% 30% 40% 50% 60% 70% 80% |
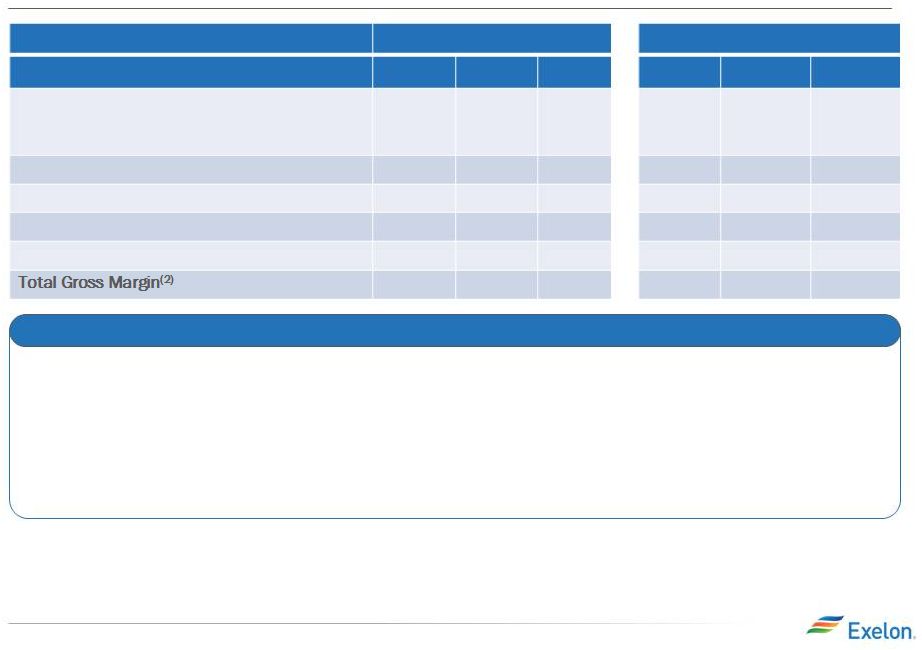 Exelon Generation: Gross Margin Update March 31, 2014 Change from Dec 31, 2013 Gross Margin Category ($M) (1) 2014 2015 2016 2014 2015 2016 Open Gross Margin (3) (including South, West, Canada hedged gross margin) 7,350 6,350 6,250 1,500 650 600 Mark-to-Market of Hedges (3,4) (700) 100 100 (1,450) (400) (150) Power New Business / To Go 250 600 650 (100) (50) (50) Non-Power Margins Executed 250 100 50 150 50 - Non-Power New Business / To Go 150 300 350 (150) (50) - 7,300 7,450 7,400 (50) 200 400 2014 1Q Earnings Release Slides • Severe weather in our load serving regions led to significant power and gas volatility, which allowed us to execute on a significant piece of our new business targets • Our balanced generation to load strategy, as well as our geographic and commodity diversity, allowed us to navigate through several offsetting issues • The return of volatility to the markets may lead to more appropriate pricing of risk premiums Recent Developments 6 1) Gross margin categories rounded to nearest $50M. 2) Total Gross Margin (Non-GAAP) is defined as operating revenues less purchased power and fuel expense, excluding revenue related to decommissioning, gross receipts tax, Exelon Nuclear Partners and variable interest entities. Total Gross Margin is also net of direct cost of sales for certain Constellation businesses. See Slide 25 for a Non-GAAP to GAAP reconciliation of Total Gross Margin. 3) Includes Exelon’s proportionate ownership share of the CENG Joint Venture. 4) Mark to Market of Hedges assumes mid-point of hedge percentages. |
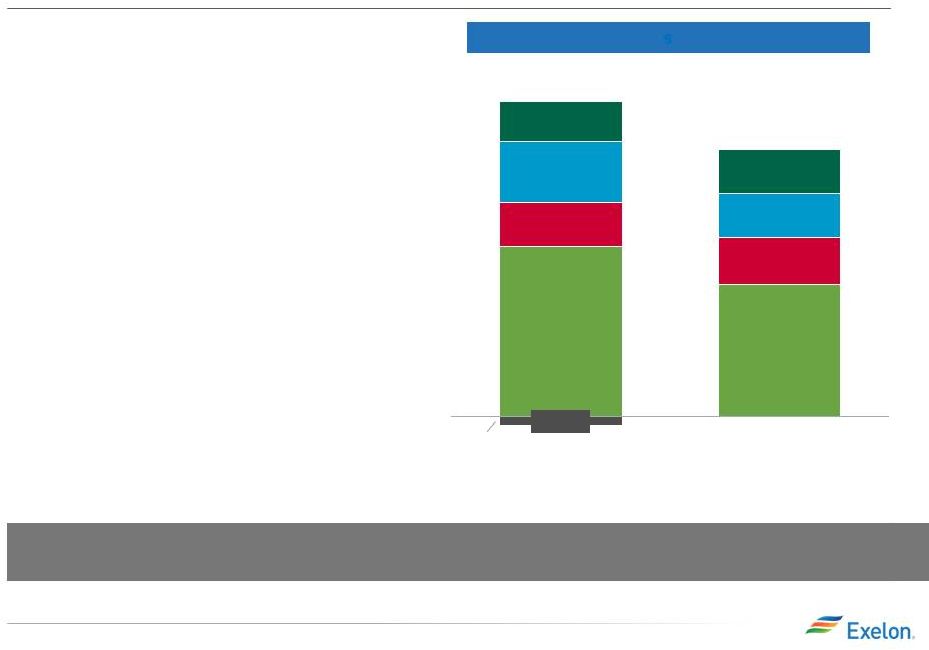 Key Financial Messages • Delivered adjusted (non-GAAP) operating earnings in Q1 of $0.62/share within guidance range provided of $0.60-$0.70/share Q1 2014 vs. Q1 2013: • Utilities – Increased distribution revenue – Increased storm costs • ExGen – Lower realized gross margin – Increased capacity pricing 2014 1Q Earnings Release Slides 7 Expect Q2 2014 earnings of $0.40 - $0.50/share and re-affirm full-year guidance range of $2.25 - $2.55/share (2) HoldCo ExGen ComEd PECO BGE Q1 2013 $0.70 Q1 2014 $0.62 -$0.02 $0.39 $0.10 $0.14 $0.09 $0.30 $0.11 $0.10 $0.10 Adjusted Operating EPS Results (1,3) (1) Refer to the Earnings Release Attachments for additional details and to the Appendix for a reconciliation of adjusted (non-GAAP) operating EPS to GAAP EPS. (2) 2014 earnings guidance based on expected average outstanding shares of ~860M. Refer to Appendix for a reconciliation of adjusted (non-GAAP operating EPS guidance to GAAP EPS ) (3) Amounts may not add due to rounding. 2014 1Q Earnings Release Slides |
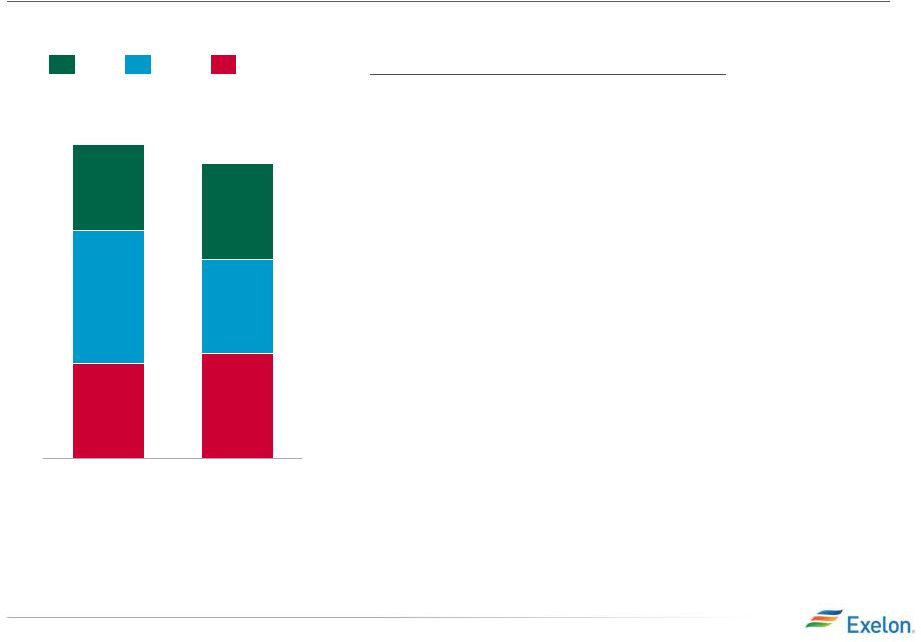 Exelon Utilities Adjusted Operating EPS Contribution (1) BGE (+0.01): • Increased distribution revenue due to rate cases: $0.03 • Increased storm costs: $(0.01) PECO (-0.04): • Increased storm costs, primarily due to the February 5, 2014 ice storm: $(0.05) • Weather: $0.02 ComEd (+0.01): • Weather (2) : $0.01 • Increased distribution revenue due to increased capital investment and higher allowed ROE (2) : $0.01 • Tax interest related to 1999-2001 IRS tax settlement adjustment recorded in the first quarter of 2013: ($0.01) 2014 1Q Earnings Release Slides $0.33 $0.09 $0.14 $0.10 Q1 2014 $0.31 $0.10 $0.10 $0.11 Q1 2013 ComEd PECO BGE 8 Numbers may not add due to rounding. (1) Refer to the Earnings Release Attachments for additional details and to the Appendix for a reconciliation of adjusted (non-GAAP) operating EPS to GAAP EPS. (2) Due to the distribution formula rate, changes in ComEd’s earnings are driven primarily by changes in 30-year U.S. Treasury rates (allowed ROE), rate base and capital structure in addition to weather, load and changes in customer mix. Key Drivers – Q1 2014 vs. Q1 2013: |
 ExGen Adjusted Operating EPS Contribution (1) 2014 1Q Earnings Release Slides Q1 2014 2014 2013 (excludes Salem and CENG) Q1 2013 Actual Q1 2014 Actual Planned Refueling Outage Days 49 52 Non-refueling Outage Days 6 20 Nuclear Capacity Factor 96.4% 94.1% • Lower realized energy prices and higher procurement costs for replacement power $(0.09) • Decrease in nuclear and fossil output in 2014, primarily due to outage days $(0.05) • Higher nuclear fuel amortization and fossil fuel costs $(0.04) • Partially offset by increased capacity pricing $0.08 9 (1) Refer to the Earnings Release Attachments for additional details and to the Appendix for a reconciliation of adjusted (non-GAAP) operating EPS to GAAP EPS. Key Drivers – Q1 2014 vs. Q1 2013 |
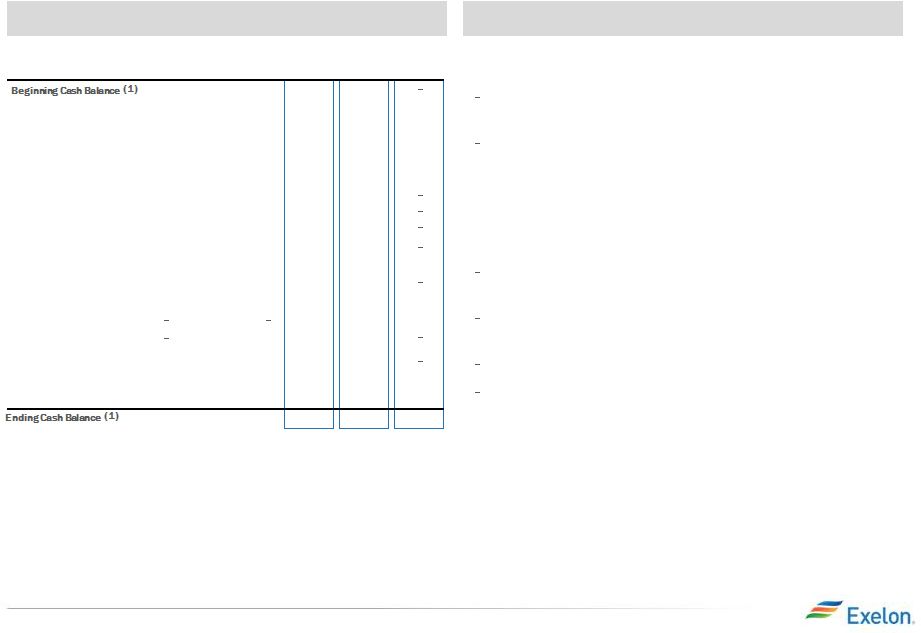 2014 Projected Sources and Uses of Cash Key Messages • Cash from Operations is projected to be $6,200M vs Plan of $6,100M for a $100M variance. This variance is driven by: $150M Reclassification of CENG capital expenditure at EXC ownership ($50M) Lower Constellation gross margin due to plant underperformance • Cash from Financing activities is projected to be equal to Plan of ($825M) • Cash from Investing activities is projected to be ($5,375M) vs Plan of ($5,475M) for a $100M variance. This variance is driven by: $325M early lease termination fee received at Corporate from the City of San Antonio Public Service (“CPS”) ($150M) Reclassification of CENG Capital Expenditure at EXC ownership ($50M) Higher PECO CapEx primarily due to January Ice Storm ($25M) ExGen: additional turbine purchases at Fourmile wind, CENG capital at ownership, and gas and hydro. Projected Sources & Uses (1) Excludes counterparty collateral of $134 million at 12/31/2013. In addition, the 12/31/2014 ending cash balance does not include collateral. (2) Adjusted Cash Flow from Operations (non-GAAP) primarily includes net cash flow from operating activities and net cash flows from investing activities excluding capital expenditures of $5.4B for 2014. For March 31, 2014, includes EDF’s proportionate ownership share of CENG Joint Venture CapEx and Nuclear Fuel. For December 31, 2013, includes 100% of CENG Joint Venture CapEx and Nuclear Fuel. (3) For March 31, 2014, excludes EDF’s proportionate ownership share of CENG Joint Venture CapEx and Nuclear Fuel. For December 31, 2013, excludes 100% of CENG Joint Venture CapEx and Nuclear Fuel. (4) Dividends are subject to declaration by the Board of Directors. (5) “Other” includes CENG distribution to EDF, proceeds from stock options, and expected changes in short-term debt. (6) Includes cash flow activity from Holding Company, eliminations, and other corporate entities. CapEx for Exelon is shown net of $325M CPS early lease termination fee. (7) All amounts rounded to the nearest $25M. (8) Net 2014 sources and uses for each operating company are expected to be $0M, $325M, $100M and $600M for BGE, ComEd, PECO and ExGen, respectively 2014 1Q Earnings Release Slides 10 ($ in millions) BGE ComEd PECO ExGen Exelon (6) As of 4Q13 Variance 1,475 1,475 675 1,425 600 3,475 6,200 6,100 100 (525) (1,575) (500) (1,175) (3,475) (3,675) 200 n/a n/a n/a (975) (975) (900) (75) (1,075) (1,075) n/a n/a n/a (150) (150) (150) n/a n/a n/a (75) (75) (75) n/a n/a n/a (200) (200) (200) n/a n/a n/a (50) (50) (25) (25) (75) (200) (175) n/a (450) (450) 950 300 1,250 1,200 50 (625) (250) (525) (1,375) (1,375) n/a n/a n/a 675 675 675 Adjusted Cash Flow from Operations (3) CapEx (excluding other items below): (3) Nuclear Fuel Dividend (4) Nuclear Uprates Wind Solar Upstream Utility Smart Grid/Smart Meter Net Financing (excluding Dividend): Debt Issuances Debt Retirements Project Finance/Federal Financing Bank Loan Other (5) (75) 350 125 (400) (300) (250) (50) 1,475 1,275 200 (7) (7,8) (2) |
 Exelon Generation Disclosures March 31, 2014 2014 1Q Earnings Release Slides 11 2014 1Q Earnings Release Slides |
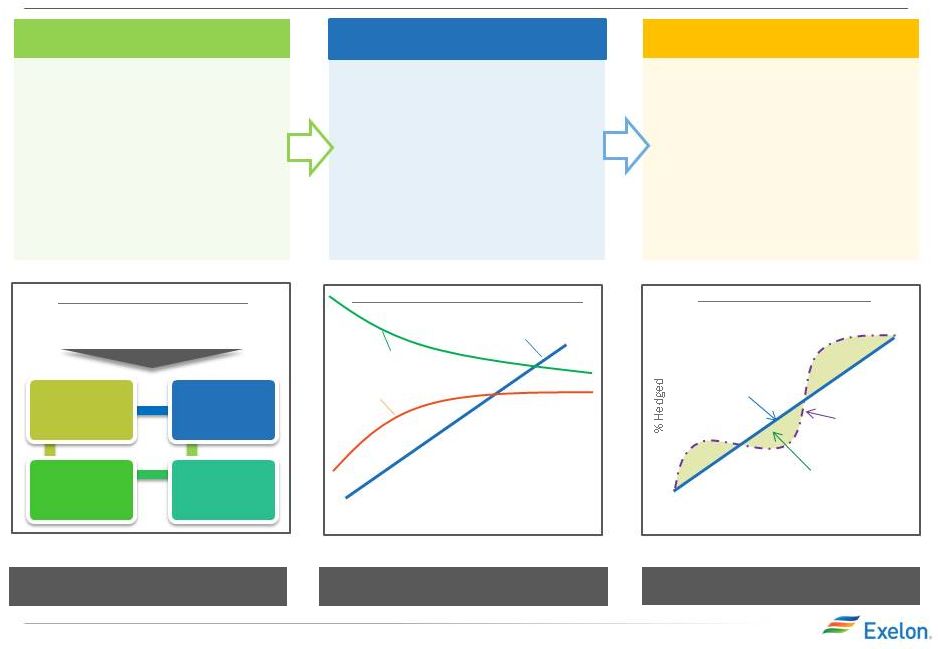 Portfolio Management Strategy Protect Balance Sheet Ensure Earnings Stability Create Value Exercising Market Views Purely ratable Actual hedge % Market views on timing, product allocation and regional spreads reflected in actual hedge % High End of Profit Low End of Profit % Hedged Open Generation with LT Contracts Portfolio Management & Optimization Portfolio Management Over Time Align Hedging & Financials Establishing Minimum Hedge Targets 2014 1Q Earnings Release Slides 12 Credit Rating Capital & Operating Expenditure Dividend Capital Structure • Aligns hedging program with financial policies and financial outlook • Establish minimum hedge targets to meet financial objectives of the company (dividend, credit rating) • Hedge enough commodity risk to meet future cash requirements under a stress scenario • Ensure stability in near-term cash flows and earnings • Disciplined approach to hedging • Tenor aligns with customer preferences and market liquidity • Multiple channels to market that allow us to maximize margins • Large open position in outer years to benefit from price upside • Ability to exercise fundamental market views to create value within the ratable framework • Modified timing of hedges versus purely ratable • Cross-commodity hedging (heat rate positions, options, etc.) • Delivery locations, regional and zonal spread relationships Strategic Policy Alignment Three-Year Ratable Hedging Bull / Bear Program |
 Components of Gross Margin Categories 2014 1Q Earnings Release Slides 13 Gross margin linked to power production and sales Gross margin from other business activities Open Gross Margin MtM of Hedges (2) “Power” New Business “Non Power” Executed “Non Power” New Business Margins move from new business to MtM of hedges over the course of the year as sales are executed (5) Margins move from “Non power new business” to “Non power executed” over the course of the year Load Response Energy Efficiency (4) BGE Home (4) Distributed Solar Portfolio Management / origination fuels new business Proprietary Trading (3) Retail, Wholesale executed gas sales Load Response Energy Efficiency (4) BGE Home (4) Distributed Solar Retail, Wholesale planned electric sales Portfolio Management new business Mid marketing new business Mark to Market (MtM) of power, capacity and ancillary hedges, including cross commodity, retail and wholesale load transactions Provided directly at a consolidated level for five major regions. Provided indirectly for each of the five major regions via Effective Realized Energy Price (EREP), reference price, hedge %, expected generation Generation Gross Margin at current market prices, including capacity and ancillary revenues, nuclear fuel amortization and fossils fuels expense Exploration and Production (4) Power Purchase Agreement (PPA) Costs and Revenues Provided at a consolidated level for all regions (includes hedged gross margin for South, West and Canada (1) ) (1) Hedged gross margins for South, West and Canada region will be included with Open Gross Margin, and no expected generation, hedge %, EREP or reference prices provided for this region. (2) MtM of hedges provided directly for the five larger regions. MtM of hedges is not provided directly at the regional level but can be easily estimated using EREP, reference price and hedged MWh. (3) Proprietary trading gross margins will remain within “Non Power” New Business category and not move to “Non Power” Executed category. (4) Gross margin for these businesses are net of direct “cost of sales”. (5) Margins for South, West & Canada regions and optimization of fuel and PPA activities captured in Open Gross Margin. Retail, Wholesale planned gas sales |
 ExGen Disclosures Gross Margin Category ($M) (1) 2014 2015 2016 Open Gross Margin (including South, West & Canada hedged GM) (3) 7,350 6,350 6,250 Mark to Market of Hedges (3,4) (700) 100 100 Power New Business / To Go 250 600 650 Non-Power Margins Executed 250 100 50 Non-Power New Business / To Go 150 300 350 Total Gross Margin (2) 7,300 7,450 7,400 2014 1Q Earnings Release Slides 14 Gross margin categories rounded to nearest $50M. Total Gross Margin (Non-GAAP) is defined as operating revenues less purchased power and fuel expense, excluding revenue related to decommissioning, gross receipts tax, Exelon Nuclear Partners and variable interest entities. Total Gross Margin is also net of direct cost of sales for certain Constellation businesses. See Slide 25 for a Non-GAAP to GAAP reconciliation of Total Gross Margin. Includes Exelon’s proportionate ownership share of the CENG Joint Venture. Mark to Market of Hedges assumes mid-point of hedge percentages. (4) Based on March 31, 2014 market conditions. (5) (1) (2) (3) Reference Prices (5) 2014 2015 2016 Henry Hub Natural Gas ($/MMbtu) $4.58 $4.20 $4.15 Midwest: NiHub ATC prices ($/MWh) $39.73 $31.82 $31.84 Mid-Atlantic: PJM-W ATC prices ($/MWh) $54.44 $40.59 $39.45 ERCOT-N ATC Spark Spread ($/MWh) HSC Gas, 7.2HR, $2.50 VOM $8.76 $8.57 $7.69 New York: NY Zone A ($/MWh) $53.86 $40.42 $38.16 New England: Mass Hub ATC Spark Spread($/MWh) ALQN Gas, 7.5HR, $0.50 VOM $4.08 $4.85 $2.90 2014 1Q Earnings Release Slides |
 ExGen Disclosures Generation and Hedges 2014 2015 2016 Exp. Gen (GWh) (1) 210,200 203,500 204,600 Midwest 97,300 96,700 97,700 Mid-Atlantic (2) 75,000 70,800 71,800 ERCOT 16,400 19,000 19,200 New York (2) 12,700 9,400 9,300 New England 8,800 7,600 6,600 % of Expected Generation Hedged (3) 91-94% 64-67% 37-40% Midwest 91-94% 66-69% 36-39% Mid-Atlantic (2) 90-93% 63-66% 37-40% ERCOT 93-96% 61-64% 42-45% New York (2) 94-97% 65-68% 47-50% New England 91-94% 53-56% 15-18% Effective Realized Energy Price ($/MWh) (4) Midwest $36.50 $32.50 $33.00 Mid-Atlantic (2) $49.00 $42.00 $43.00 ERCOT (5) $12.00 $7.00 $5.00 New York (2) $43.00 $43.50 $37.50 New England (5) $9.00 $4.00 $0.50 2014 1Q Earnings Release Slides 15 (1) Expected generation represents the amount of energy estimated to be generated or purchased through owned or contracted for capacity. Expected generation is based upon a simulated dispatch model that makes assumptions regarding future market conditions, which are calibrated to market quotes for power, fuel, load following products, and options. Expected generation assumes 14 refueling outages in 2014 and 2015 and 12 refueling outages in 2016 at Exelon-operated nuclear plants, Salem and CENG. Expected generation assumes capacity factors of 93.6%, 93.3% and 94.4% in 2014, 2015 and 2016 at Exelon-operated nuclear plants excluding Salem and CENG. These estimates of expected generation in 2015 and 2016 do not represent guidance or a forecast of future results as Exelon has not completed its planning or optimization processes for those years. (2) Includes Exelon’s proportionate ownership share of CENG Joint Venture. (3) Percent of expected generation hedged is the amount of equivalent sales divided by expected generation. Includes all hedging products, such as wholesale and retail sales of power, options and swaps. Uses expected value on options. (4) Effective realized energy price is representative of an all-in hedged price, on a per MWh basis, at which expected generation has been hedged. It is developed by considering the energy revenues and costs associated with our hedges and by considering the fossil fuel that has been purchased to lock in margin. It excludes uranium costs and RPM capacity revenue, but includes the mark-to-market value of capacity contracted at prices other than RPM clearing prices including our load obligations. It can be compared with the reference prices used to calculate open gross margin in order to determine the mark-to-market value of Exelon Generation's energy hedges. (5) Spark spreads shown for ERCOT and New England. 2014 1Q Earnings Release Slides |
 ExGen Hedged Gross Margin Sensitivities Gross Margin Sensitivities (With Existing Hedges) (1, 2) 2014 2015 2016 Henry Hub Natural Gas ($/Mmbtu) + $1/Mmbtu $60 $285 $490 - $1/Mmbtu $(55) $(230) $(455) NiHub ATC Energy Price + $5/MWh $20 $250 $380 - $5/MWh $(20) $(245) $(375) PJM-W ATC Energy Price + $5/MWh $10 $125 $220 - $5/MWh $- $(120) $(210) NYPP Zone A ATC Energy Price + $5/MWh $- $15 $25 - $5/MWh $- $(15) $(25) Nuclear Capacity Factor (3) +/- 1% +/- $50 +/- $45 +/- $45 2014 1Q Earnings Release Slides 16 (1) Based on March 31, 2014 market conditions and hedged position. Gas price sensitivities are based on an assumed gas-power relationship derived from an internal model that is updated periodically. Power prices sensitivities are derived by adjusting the power price assumption while keeping all other price inputs constant. Due to correlation of the various assumptions, the hedged gross margin impact calculated by aggregating individual sensitivities may not be equal to the hedged gross margin impact calculated when correlations between the various assumptions are also considered. (2) Sensitivities based on commodity exposure which includes open generation and all committed transactions. (3) Includes Exelon’s proportionate ownership share of the CENG Joint Venture. |
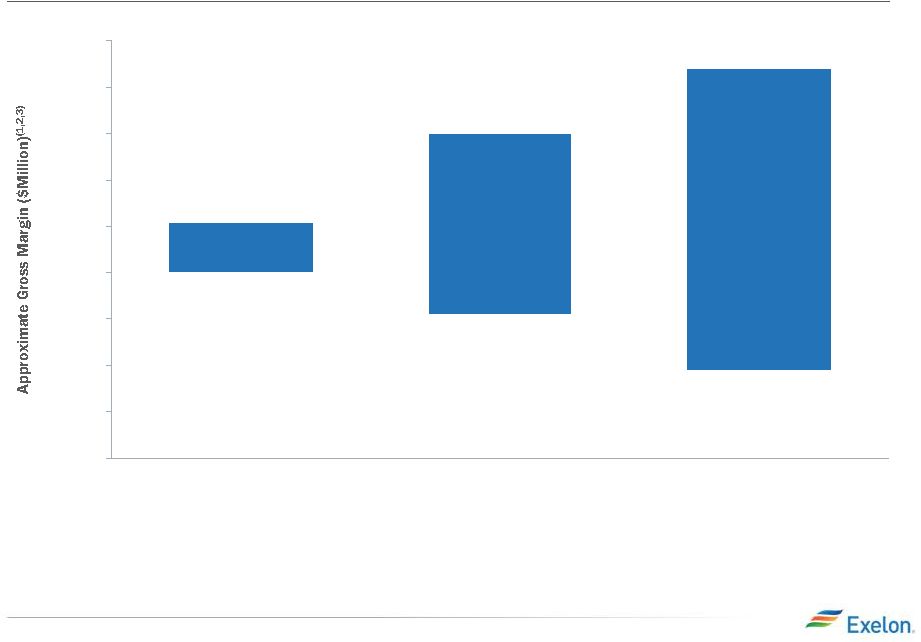 Exelon Generation Hedged Gross Margin Upside/Risk $5,000 $5,500 $6,000 $6,500 $7,000 $7,500 $8,000 $8,500 $9,000 $9,500 2016 $9,200 2015 $8,500 2014 $7,550 $7,000 $6,550 $5,950 2014 1Q Earnings Release Slides 17 (1) Represents an approximate range of expected gross margin, taking into account hedges in place, between the 5th and 95th percent confidence levels assuming all unhedged supply is sold into the spot market. Approximate gross margin ranges are based upon an internal simulation model and are subject to change based upon market inputs, future transactions and potential modeling changes. These ranges of approximate gross margin in 2014, 2015 and 2016 do not represent earnings guidance or a forecast of future results as Exelon has not completed its planning or optimization processes for those years. The price distributions that generate this range are calibrated to market quotes for power, fuel, load following products, and options as of March 31, 2014 (2) Gross Margin Upside/Risk based on commodity exposure which includes open generation and all committed transactions. (3) Gross margin is defined as operating revenues less purchased power and fuel expense, excluding revenue related to decommissioning, gross receipts tax, Exelon Nuclear Partners and variable interest entities . See Slide 25 for a Non-GAAP to GAAP reconciliation of Gross Margin. |
 Illustrative Example of Modeling Exelon Generation 2015 Gross Margin Row Item Midwest Mid- Atlantic ERCOT New York New England South, West & Canada (A) Start with fleet-wide open gross margin $6.35 billion (B) Expected Generation (TWh) 96.7 70.8 19.0 9.4 7.6 (C) Hedge % (assuming mid-point of range) 67.5% 64.5% 62.5% 66.5% 54.5% (D=B*C) Hedged Volume (TWh) 65.3 45.7 11.9 6.3 4.1 (E) Effective Realized Energy Price ($/MWh) $32.50 $42.00 $7.00 $43.50 $4.00 (F) Reference Price ($/MWh) $31.82 $40.59 $8.57 $40.42 $4.85 (G=E-F) Difference ($/MWh) $0.68 $1.41 $(1.57) $3.08 $(0.85) (H=D*G) Mark-to-market value of hedges ($ million) (1) $45 million $65 million $(20) million $20 million $(5) million (I=A+H) Hedged Gross Margin ($ million) $6,450 million (J) Power New Business / To Go ($ million) $600 million (K) Non-Power Margins Executed ($ million) $100 million (L) Non- Power New Business / To Go ($ million) $300 million (N=I+J+K+L) Total Gross Margin (2) $7,450 million (1) Mark-to-market rounded to the nearest $5 million. (2) Total Gross Margin (Non-GAAP) is defined as operating revenues less purchased power and fuel expense, excluding revenue related to decommissioning, gross receipts tax, Exelon Nuclear Partners and variable interest entities. Total Gross Margin is also net of direct cost of sales for certain Constellation businesses. See Slide 25 for a Non-GAAP to GAAP reconciliation of Total Gross Margin. 2014 1Q Earnings Release Slides 18 |
  Additional Disclosures 2014 1Q Earnings Release Slides 19 2014 1Q Earnings Release Slides |
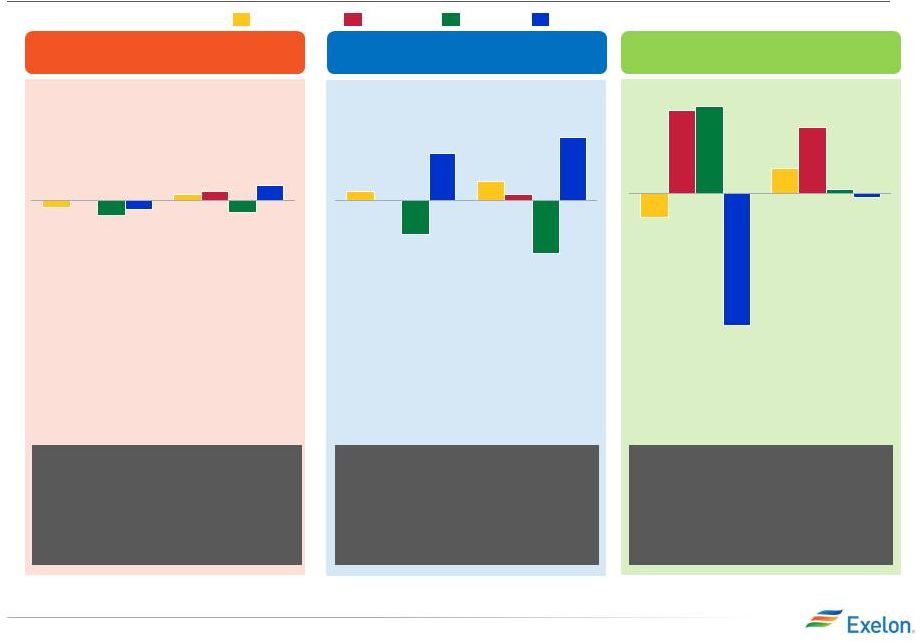 BGE Strong residential growth drives the load in 2014. Improving economic conditions are offset by continued energy efficiency Exelon Utilities Weather-Normalized Load 2014E 0.5% -0.4% 0.3% 0.2% 2013 -0.3% -0.5% 0.0% -0.2% Large C&I Small C&I Residential All Customers ComEd 2014 overall load growth is slightly above 2013 due to slowly improving economic conditions with partially offsetting energy efficiency 2014E 2.0% -1.7% 0.2% 0.6% 2013 1.5% -1.1% 0.0% 0.3% PECO 2014 load growth is driven primarily by Large C&I, partially offset by Small C&I. Improved economic & customer growth is partially offset by energy efficiency 2014E -0.1% 0.1% 1.6% 0.6% 2013 -3.2% 2.1% 2.0% -0.6% Chicago GMP 2.4% Chicago Unemployment 8.2% Philadelphia GMP 1.9% Philadelphia Unemployment 7.1% Baltimore GMP 2.4% Baltimore Unemployment 6.2% 2014 1Q Earnings Release Slides 20 2014 1Q Earnings Release Slides Notes: Data is not adjusted for leap year. Source of economic outlook data is Global Insight (February 2014). Assumes 2014 GDP of 2.7% and U.S unemployment of 6.7%. ComEd has the ROE collar as part of the distribution formula rate and BGE is decoupled which mitigates the load risk. QTD and YTD actual data can be found in earnings release tables. BGE amounts have been adjusted for true-up load from prior quarters. |
 |
 Appendix Reconciliation of Non-GAAP Measures 22 2014 1Q Earnings Release Slides |
 Q1 2014 GAAP EPS Reconciliation Three Months Ended March 31, 2014 ExGen ComEd PECO BGE Other Exelon 2014 Adjusted (non-GAAP) Operating Earnings (Loss) Per Share $0.30 $0.11 $0.10 $0.10 $- $0.62 Mark-to-market impact of economic hedging activities (0.52) - - - - (0.52) Unrealized gains related to NDT fund investments 0.01 - - - - 0.01 Merger and integration costs (0.01) - - - - (0.01) Amortization of commodity contract intangibles (0.04) - - - - (0.04) Tax Settlements 0.04 - - - - 0.04 Q1 2014 GAAP Earnings (Loss) Per Share $(0.22) $0.11 $0.10 $0.10 $- $0.10 NOTE: All amounts shown are per Exelon share and represent contributions to Exelon's EPS. Amounts may not add due to rounding. 2014 1Q Earnings Release Slides 23 Three Months Ended March 31, 2013 ExGen ComEd PECO BGE Other Exelon 2013 Adjusted (non-GAAP) Operating Earnings Per Share $0.39 $0.10 $0.14 $0.09 $(0.02) $0.70 Mark-to-market impact of economic hedging activities (0.29) - - - 0.01 (0.27) Unrealized gains related to nuclear decommissioning trust funds 0.04 - - - - 0.04 Plant retirements and divestitures 0.02 - - - - 0.02 Merger and integration costs (0.03) - (0.00) 0.00 0.00 (0.03) Amortization of commodity contract intangibles (0.14) - - - - (0.14) Amortization of the fair value of certain debt 0.00 - - - - 0.00 Remeasurement of like-kind exchange tax position - (0.20) - - (0.11) (0.31) Nuclear uprate project cancellation (0.02) - - - - (0.02) Q1 2013 GAAP Earnings (Loss) Per Share $(0.02) $(0.09) $0.14 $0.09 $(0.12) $(0.01) |
 GAAP to Operating Adjustments NOTE: All amounts shown are per Exelon share and represent contributions to Exelon's EPS. Amounts may not add due to rounding. 2014 1Q Earnings Release Slides 24 • Exelon’s 2014 adjusted (non-GAAP) operating earnings excludes the earnings effects of the following: Mark-to-market adjustments from economic hedging activities Unrealized gains and losses from NDT fund investments to the extent not offset by contractual accounting as described in the notes to the consolidated financial statements Certain costs incurred associated with the Constellation and CENG merger and integration initiatives Non-cash amortization of intangible assets, net, related to commodity contracts recorded at fair value at the merger date for 2014 Favorable settlements of certain income tax positions on Constellation’s 2009-2012 tax returns One-time impacts of adopting new accounting standards Other unusual items |
 ExGen Total Gross Margin Reconciliation to GAAP Total Gross Margin Reconciliation (in $M) (5) 2014 2015 2016 Revenue Net of Purchased Power and Fuel Expense (1)(6) $7,800 $8,050 $8,050 Non-cash amortization of intangible assets, net, related to commodity contracts recorded at fair value at the merger date (2) $50 - - Other Revenues (3) $(250) $(300) $(300) Direct cost of sales incurred to generate revenues for certain Constellation businesses (4) $(300) $(300) $(350) Total Gross Margin (Non-GAAP, as shown on slide 14) $7,300 $7,450 $7,400 2014 1Q Earnings Release Slides 25 (1) Revenue net of purchased power and fuel expense (RNF), a non-GAAP measure, is calculated as the GAAP measure of operating revenue less the GAAP measure of purchased power and fuel expense. ExGen does not forecast the GAAP components of RNF separately. RNF also includes the RNF of our proportionate ownership share of CENG. (2) The exclusion from operating earnings for activities related to the merger with Constellation ends after 2014. (3) Reflects revenues from Exelon Nuclear Partners, variable interest entities, funds collected through revenues for decommissioning the former PECO nuclear plants through regulated rates and gross receipts tax revenues. (4) Reflects the cost of sales and depreciation expense of certain Constellation businesses of Generation. (5) All amounts rounded to the nearest $50M. (6) Excludes the impact of the operating exclusion for mark-to-market due to the volatility and unpredictability of the future changes to power prices. 2014 1Q Earnings Release Slides |