UNITED STATES
SECURITIES AND EXCHANGE COMMISSION
Washington, D.C. 20549
FORM N-CSR
CERTIFIED SHAREHOLDER REPORT OF REGISTERED MANAGEMENT INVESTMENT
COMPANIES
Investment Company Act file number 811-21050
Name of Fund: BlackRock New Jersey Municipal Bond Trust (BLJ)
Fund Address: 100 Bellevue Parkway, Wilmington, DE 19809
Name and address of agent for service: John M. Perlowski, Chief Executive Officer, BlackRock New Jersey
Municipal Bond Trust, 55 East 52nd Street, New York, NY 10055
Registrant’s telephone number, including area code: (800) 882-0052, Option 4
Date of fiscal year end: 08/31/2018
Date of reporting period: 02/28/2018
| Item 1 – | Report to Stockholders |
FEBRUARY 28, 2018
| | |
SEMI-ANNUAL REPORT (UNAUDITED) | |  |
BlackRock Maryland Municipal Bond Trust (BZM)
BlackRock Massachusetts Tax-Exempt Trust (MHE)
BlackRock MuniHoldings New York Quality Fund, Inc. (MHN)
BlackRock New Jersey Municipal Bond Trust (BLJ)
BlackRock New York Municipal Bond Trust (BQH)
BlackRock New York Municipal Income Quality Trust (BSE)
BlackRock New York Municipal Income Trust II (BFY)
BlackRock Virginia Municipal Bond Trust (BHV)
|
| Not FDIC Insured • May Lose Value • No Bank Guarantee |
The Markets in Review
Dear Shareholder,
In the 12 months ended February 28, 2018, assets with higher risk and return potential, such as stocks and high-yield bonds, continued to deliver strong performance. Faster global growth drove the equity market, while rising interest rates constrained bond returns.
Emerging market stocks posted the strongest performance, as accelerating growth in China, the second-largest economy in the world, improved the outlook for corporate profits and economic growth across most developing nations. Chinese demand for commodities and other raw materials allayed concerns about the country’s banking system, leading to rising equity prices and foreign investment. Higher prices for industrial metals also bolstered the outlook for emerging-market countries.
Rising interest rates worked against high-quality assets with more interest rate sensitivity. Consequently, the 10-year U.S. Treasury — a bellwether of the bond market — posted a negative return, as rising energy prices, higher wages, and steady job growth drove expectations of higher inflation and interest rate increases by the U.S. Federal Reserve (the “Fed”).
The market’s performance reflected reflationary expectations early in the reporting period, as investors began to sense that a global recovery was afoot. Thereafter, many countries experienced sustained and synchronized growth for the first time since the financial crisis. Growth rates and inflation are still relatively low, but they are finally rising together.
The Fed responded to these positive developments by increasing short-term interest rates three times during the year. In October 2017, the Fed also began to reduce its balance sheet, while setting expectations for additional rate hikes in 2018.
By contrast, the European Central Bank (“ECB”) and the Bank of Japan (“BoJ”) continued to expand their balance sheets despite nascent signs of sustained economic growth. Rising global growth and inflation, as well as limited bond supply, put steady pressure on other central banks to follow in the Fed’s footsteps. In October 2017, the ECB announced plans to cut its bond purchases in half for 2018, while the BoJ reiterated its commitment to economic stimulus, as the country’s inflation rate remained below 2.0%.
Rising consumer confidence and improving business sentiment are driving momentum for the U.S. economy. If the Fed maintains a measured pace of stimulus reduction, to the extent that inflation rises, it’s likely to be accompanied by rising real growth and higher wages. That could lead to a favorable combination of moderately higher inflation, steadily rising interest rates, and improving growth in 2018. We continue to believe the primary risks to the economic expansion are trade protectionism, rapidly rising interest rates, and geopolitical tension. In particular, we are closely monitoring trade protectionism and the rise of populism in Western nations.
In December 2017, Congress passed a sweeping tax reform bill. The U.S. tax overhaul is likely to accentuate the existing reflationary themes, including faster growth and rising interest rates. Changing the corporate tax rate to a flat 21% will create many winners and losers among high-and-low tax companies, while the windfall from lower taxes could boost business and consumer spending.
In this environment, investors need to think globally, extend their scope across a broad array of asset classes, and be nimble as market conditions change. We encourage you to talk with your financial advisor and visit blackrock.com for further insight about investing in today’s markets.
Sincerely,

Rob Kapito
President, BlackRock Advisors, LLC

Rob Kapito
President, BlackRock Advisors, LLC
| | | | |
| Total Returns as of February 28, 2018 |
| | | 6-month | | 12-month |
U.S. large cap equities
(S&P 500® Index) | | 10.84% | | 17.10% |
U.S. small cap equities
(Russell 2000® Index) | | 8.30 | | 10.51 |
International equities
(MSCI Europe, Australasia,
Far East Index) | | 7.12 | | 20.13 |
Emerging market equities
(MSCI Emerging Markets Index) | | 10.58 | | 30.51 |
3-month Treasury bills
(ICE BofAML 3-Month U.S. Treasury Bill Index) | | 0.58 | | 0.99 |
U.S. Treasury securities
(ICE BofAML 10-Year U.S. Treasury Index) | | (5.47) | | (2.54) |
U.S. investment grade bonds
(Bloomberg Barclays U.S.
Aggregate Bond Index) | | (2.18) | | 0.51 |
Tax-exempt municipal bonds
(S&P Municipal Bond Index) | | (1.15) | | 2.32 |
U.S. high yield bonds
(Bloomberg Barclays U.S. Corporate High Yield 2% Issuer
Capped Index) | | 1.11 | | 4.18 |
| Past performance is no guarantee of future results. Index performance is shown for illustrative purposes only. You cannot invest directly in an index. |
| | |
| 2 | | THIS PAGEISNOT PARTOF YOUR FUND REPORT |
Table of Contents
Municipal Market Overview For the Reporting Period Ended February 28, 2018
Municipal Market Conditions
Municipal bonds experienced positive performance during the period alongside a favorable technical backdrop and a flattening yield curve resulting from continued Fed monetary policy normalization and benign inflation expectations. Ongoing reassurance from the Fed that rates would be increased gradually and would likely remain low overall resulted in continued demand for fixed income investments. More specifically, investors favored the tax-exempt income, diversification, quality, and value of municipal bonds amid fiscal policy uncertainty, which saw tax reform ultimately lower the top individual tax rate just 2.6% while eliminating deductions and increasing demand for tax shelter. During the 12 months ended February 28, 2018, municipal bond funds experienced net inflows of approximately $30 billion (based on data from the Investment Company Institute).
| | |
| For the same 12-month period, total new issuance remained elevated from a historical perspective at $389 billion (though well below the robust $445 billion issued in the prior 12-month period). Notably, issuance in December posted the highest monthly total on record at $56 billion, as issuers rushed deals to market ahead of the expected elimination of the tax-exemption for advanced refunding bonds and possibly private activity bonds (PABs). Ultimately, the final version of the Tax Cuts and Jobs Act left PABs unchanged, though the elimination of advanced refundings will likely suppress supply going forward, providing a powerful technical. | | S&P Municipal Bond Index |
| | Total Returns as of February 28, 2018 |
| | 6 months: (1.15)% |
| | 12 months: 2.32% |
| | |
A Closer Look at Yields
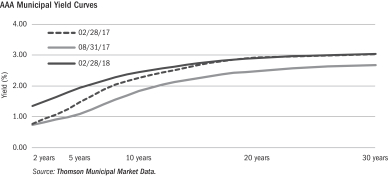
| From February 28, 2017 to February 28, 2018, yields on AAA-rated 30-year municipal bonds increased by just 1 basis point (“bp”) from 3.05% to 3.06%, while 10-year rates increased by 18 bps from 2.29% to 2.47% and 5-year rates increased by 47 bps from 1.50% to 1.97% (as measured by Thomson Municipal Market Data). The municipal yield curve flattened significantly over the 12-month period with the spread between 2- and 30-year maturities flattening by 55 bps. |
During the same time period, on a relative basis, tax-exempt municipal bonds strongly outperformed U.S. Treasuries with the greatest outperformance experienced in the front and intermediate portions of the yield curve. Notably, January saw interest rates move rapidly higher alongside strong global growth and a more hawkish bias from global central banks. The relative positive performance of municipal bonds was driven largely by a supply/demand imbalance within the municipal market as investors sought income and incremental yield in an environment where opportunities became increasingly scarce. The asset class is known for its lower relative volatility and preservation of principal with an emphasis on income as tax rates rise.
Financial Conditions of Municipal Issuers
The majority of municipal credits remain strong, despite well-publicized distress among a few issuers. Four of the five states with the largest amount of debt outstanding — California, New York, Texas and Florida — have exhibited markedly improved credit fundamentals during the slow national recovery. However, several states with the largest unfunded pension liabilities have seen their bond prices decline noticeably and remain vulnerable to additional price deterioration. On the local level, Chicago’s credit quality downgrade is an outlier relative to other cities due to its larger pension liability and inadequate funding remedies. BlackRock maintains the view that municipal bond defaults will remain minimal and in the periphery while the overall market is fundamentally sound. We continue to advocate careful credit research and believe that a thoughtful approach to structure and security selection remains imperative amid uncertainty in a modestly improving economic environment.
The opinions expressed are those of BlackRock as of February 28, 2018, and are subject to change at any time due to changes in market or economic conditions. The comments should not be construed as a recommendation of any individual holdings or market sectors. Investing involves risk including loss of principal. Bond values fluctuate in price so the value of your investment can go down depending on market conditions. Fixed income risks include interest-rate and credit risk. Typically, when interest rates rise, there is a corresponding decline in bond values. Credit risk refers to the possibility that the bond issuer will not be able to make principal and interest payments. There may be less information on the financial condition of municipal issuers than for public corporations. The market for municipal bonds may be less liquid than for taxable bonds. Some investors may be subject to Alternative Minimum Tax (“AMT”). Capital gains distributions, if any, are taxable.
The Standard & Poor’s Municipal Bond Index, a broad, market value-weighted index, seeks to measure the performance of the U.S. municipal bond market. All bonds in the index are exempt from U.S. federal income taxes or subject to the AMT. Past performance is no guarantee of future results. Index performance is shown for illustrative purposes only. It is not possible to invest directly in an index.
| | |
| 4 | | 2018 BLACKROCK SEMI-ANNUAL REPORTTO SHAREHOLDERS |
The Benefits and Risks of Leveraging
The Trusts may utilize leverage to seek to enhance the distribution rate on, and net asset value (“NAV”) of, their common shares (“Common Shares”). However, these objectives cannot be achieved in all interest rate environments.
In general, the concept of leveraging is based on the premise that the financing cost of leverage, which is based on short-term interest rates, is normally lower than the income earned by a Trust on its longer-term portfolio investments purchased with the proceeds from leverage. To the extent that the total assets of the Trusts (including the assets obtained from leverage) are invested in higher-yielding portfolio investments, the Trusts’ shareholders benefit from the incremental net income. The interest earned on securities purchased with the proceeds from leverage is paid to shareholders in the form of dividends, and the value of these portfolio holdings is reflected in the per share NAV.
To illustrate these concepts, assume a Trust’s Common Shares capitalization is $100 million and it utilizes leverage for an additional $30 million, creating a total value of $130 million available for investment in longer-term income securities. If prevailing short-term interest rates are 3% and longer-term interest rates are 6%, the yield curve has a strongly positive slope. In this case, a Trust’s financing costs on the $30 million of proceeds obtained from leverage are based on the lower short-term interest rates. At the same time, the securities purchased by a Trust with the proceeds from leverage earn income based on longer-term interest rates. In this case, a Trust’s financing cost of leverage is significantly lower than the income earned on a Trust’s longer-term investments acquired from such leverage proceeds, and therefore the holders of Common Shares (“Common Shareholders”) are the beneficiaries of the incremental net income.
However, in order to benefit Common Shareholders, the return on assets purchased with leverage proceeds must exceed the ongoing costs associated with the leverage. If interest and other costs of leverage exceed the Trusts’ return on assets purchased with leverage proceeds, income to shareholders is lower than if the Trusts had not used leverage. Furthermore, the value of the Trusts’ portfolio investments generally varies inversely with the direction of long-term interest rates, although other factors can influence the value of portfolio investments. In contrast, the value of the Trusts’ obligations under their respective leverage arrangements generally does not fluctuate in relation to interest rates. As a result, changes in interest rates can influence the Trusts’ NAVs positively or negatively. Changes in the future direction of interest rates are very difficult to predict accurately, and there is no assurance that the Trusts’ intended leveraging strategy will be successful.
The use of leverage also generally causes greater changes in each Trust’s NAV, market price and dividend rates than comparable portfolios without leverage. In a declining market, leverage is likely to cause a greater decline in the NAV and market price of a Trust’s Common Shares than if the Trust were not leveraged. In addition, each Trust may be required to sell portfolio securities at inopportune times or at distressed values in order to comply with regulatory requirements applicable to the use of leverage or as required by the terms of leverage instruments, which may cause the Trusts to incur losses. The use of leverage may limit a Trust’s ability to invest in certain types of securities or use certain types of hedging strategies. Each Trust incurs expenses in connection with the use of leverage, all of which are borne by Common Shareholders and may reduce income to the Common Shares. Moreover, to the extent the calculation of the Trusts’ investment advisory fees includes assets purchased with the proceeds of leverage, the investment advisory fees payable to the Trusts’ investment adviser will be higher than if the Trusts did not use leverage.
To obtain leverage, each Trust has issued Variable Rate Demand Preferred Shares (“VRDP Shares”) and/or leveraged its assets through the use of tender option bond trusts (“TOB Trusts”) as described in the Notes to Financial Statements.
Under the Investment Company Act of 1940, as amended (the “1940 Act”), each Trust is permitted to issue debt up to 33 1/3% of its total managed assets or equity securities (e.g., Preferred Shares) up to 50% of its total managed assets. A Trust may voluntarily elect to limit its leverage to less than the maximum amount permitted under the 1940 Act. In addition, a Trust may also be subject to certain asset coverage, leverage or portfolio composition requirements imposed by the Preferred Shares’ governing instruments or by agencies rating the Preferred Shares, which may be more stringent than those imposed by the 1940 Act.
If a Trust segregates or designates on its books and records cash or liquid assets having a value not less than the value of a Trust’s obligations under the TOB Trust (including accrued interest), then the TOB Trust is not considered a senior security and is not subject to the foregoing limitations and requirements imposed by the 1940 Act.
Derivative Financial Instruments
The Trusts may invest in various derivative financial instruments. These instruments are used to obtain exposure to a security, commodity, index, market, and/or other assets without owning or taking physical custody of securities, commodities and/or other referenced assets or to manage market, equity, credit, interest rate, foreign currency exchange rate, commodity and/or other risks. Derivative financial instruments may give rise to a form of economic leverage and involve risks, including the imperfect correlation between the value of a derivative financial instrument and the underlying asset, possible default of the counterparty to the transaction or illiquidity of the instrument. The Trusts’ successful use of a derivative financial instrument depends on the investment adviser’s ability to predict pertinent market movements accurately, which cannot be assured. The use of these instruments may result in losses greater than if they had not been used, may limit the amount of appreciation a Trust can realize on an investment and/or may result in lower distributions paid to shareholders. The Trusts’ investments in these instruments, if any, are discussed in detail in the Notes to Financial Statements.
| | | | |
| THE BENEFITSAND RISKSOF LEVERAGING | | | 5 | |
| | |
| Trust Summary as of February 28, 2018 | | BlackRock Maryland Municipal Bond Trust |
Trust Overview
BlackRock Maryland Municipal Bond Trust’s (BZM) (the “Trust”) investment objective is to provide current income exempt from regular U.S. federal income taxes and Maryland personal income taxes. The Trust seeks to achieve its investment objectives by investing primarily in municipal bonds exempt from U.S. federal income taxes (except that the interest may be subject to the U.S. federal alternative minimum tax) and Maryland personal income taxes. The Trust invests, under normal market conditions, at least 80% of its managed assets in municipal bonds that are investment grade quality at the time of investment or, if unrated, determined to be of comparable quality by the Trust’s investment adviser at the time of investment. The Trust may invest directly in such securities or synthetically through the use of derivatives.
No assurance can be given that the Trust’s investment objective will be achieved.
Trust Information
| | |
Symbol on NYSE American | | BZM |
Initial Offering Date | | April 30, 2002 |
Yield on Closing Market Price as of February 28, 2018 ($13.32)(a) | | 4.27% |
Tax Equivalent Yield(b) | | 7.99% |
Current Monthly Distribution per Common Share(c) | | $0.0474 |
Current Annualized Distribution per Common Share(c) | | $0.5688 |
Economic Leverage as of February 28, 2018(d) | | 37% |
| | (a) | Yield on closing market price is calculated by dividing the current annualized distribution per share by the closing market price. Past performance does not guarantee future results. | |
| | (b) | Tax equivalent yield assumes the maximum marginal U.S. federal and state tax rate of 46.55%, which includes the 3.8% Medicare tax. Actual tax rates will vary based on income, exemptions and deductions. Lower taxes will result in lower tax equivalent yields. | |
| | (c) | The distribution rate is not constant and is subject to change. | |
| | (d) | Represents VRDP Shares and TOB Trusts as a percentage of total managed assets, which is the total assets of the Trust, including any assets attributable to VRDP Shares and TOB Trusts, minus the sum of accrued liabilities. For a discussion of leveraging techniques utilized by the Trust, please see The Benefits and Risks of Leveraging on page 5. | |
Performance
Returns for the six months ended February 28, 2018 were as follows:
| | | | | | | | |
| | | Returns Based On | |
| | | Market Price | | | NAV | |
BZM(a)(b) | | | (4.57 | )% | | | (0.02 | )% |
Lipper Other States Municipal Debt Funds(c) | | | (5.78 | ) | | | (1.73 | ) |
| | (a) | All returns reflect reinvestment of dividends and/or distributions at actual reinvestment prices. | |
| | (b) | The Trust’s discount to NAV widened during the period, which accounts for the difference between performance based on market price and performance based on NAV. | |
| | (c) | Average return. Returns reflect reinvestment of dividends and/or distributions at NAV on the ex-dividend date as calculated by Lipper. | |
Performance results may include adjustments made for financial reporting purposes in accordance with U.S. generally accepted accounting principles.
Past performance is not indicative of future results.
The following discussion relates to the Trust’s absolute performance based on NAV:
| • | | U.S. municipal bonds lost ground during the semi-annual period, with declining prices offsetting the benefit of income. Stronger economic growth and concerns about emerging inflation pressures fueled expectations that the Fed would continue to tighten monetary policy, dampening returns across the fixed-income market. |
| • | | Maryland benefitted from favorable economic trends and maintained its AAA rating, but the state government remained under pressure from heavy debt and pension burdens. The state’s generally higher-quality debt lagged the general market as lower-quality issues outperformed. |
| • | | The Trust’s largest detractors were its positions in longer-dated, high-quality securities that were issued in the past two years. These bonds had longer call structures, which translated to higher durations and lower income than their lower-rated and/or shorter-call counterparts. (Duration is a measure of interest rate sensitivity; a call is when an issuer redeems a bond prior to its maturity date.) |
| • | | Investments in shorter-maturity debt detracted from performance due to the steady increase in short-term rates throughout the period. Such securities typically have lower coupons, which increases their duration profile. |
| • | | The Trust sought to manage interest rate risk using U.S. Treasury futures. Given that Treasury yields rose, as prices fell, this aspect of the Trust’s positioning had a positive effect on returns. |
| • | | Holdings in non-rated high-yield securities contributed to results due to their higher yields and above-average price performance. |
| • | | The Trust had a notable amount of positions pre-refunded, leading to price appreciation from the shortening of the bonds’ effective maturity and the implied upgrade to a AAA rating. (Bonds that are pre-refunded are backed by U.S. government securities.) This development contributed to performance in a period of rising rates, particularly in January and February. |
| • | | The Trust’s use of leverage made a positive contribution to performance by enhancing income. However, the use of leverage also amplified the impact of falling prices. |
The views expressed reflect the opinions of BlackRock as of the date of this report and are subject to change based on changes in market, economic or other conditions. These views are not intended to be a forecast of future events and are no guarantee of future results.
| | |
| 6 | | 2018 BLACKROCK SEMI-ANNUAL REPORTTO SHAREHOLDERS |
| | |
| Trust Summary as of February 28, 2018 (continued) | | BlackRock Maryland Municipal Bond Trust |
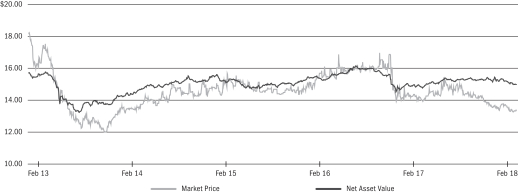
Market Price and Net Asset Value Per Share Summary
| | | | | | | | | | | | | | | | | | | | |
| | | 02/28/18 | | | 08/31/17 | | | Change | | | High | | | Low | |
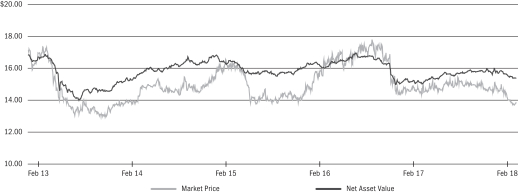
Market Price | | $ | 13.32 | | | $ | 14.29 | | | | (6.79 | )% | | $ | 14.50 | | | $ | 13.24 | |
Net Asset Value | | | 14.96 | | | | 15.32 | | | | (2.35 | ) | | | 15.42 | | | | 14.96 | |
Market Price and Net Asset Value History For the Past Five Years
Overview of the Trust’s Total Investments*
SECTOR ALLOCATION
| | | | | | | | |
Sector | | 02/28/18 | | | 08/31/17 | |
Health | | | 30 | % | | | 28 | % |
Education | | | 20 | | | | 20 | |
Transportation | | | 16 | | | | 16 | |
Utilities | | | 14 | | | | 14 | |
County/City/Special District/School District | | | 10 | | | | 12 | |
Housing | | | 8 | | | | 8 | |
Corporate | | | 1 | | | | 1 | |
Tobacco | | | 1 | | | | 1 | |
For Trust compliance purposes, the Trust’s sector classifications refer to one or more of the sector sub-classifications used by one or more widely recognized market indexes or rating group indexes, and/or as defined by the investment adviser. These definitions may not apply for purposes of this report, which may combine such sector sub-classifications for reporting ease.
CALL/MATURITY SCHEDULE (b)
| | | | |
Calendar Year Ended December 31, | | | | |
2018 | | | 11 | % |
2019 | | | 7 | |
2020 | | | 9 | |
2021 | | | 8 | |
2022 | | | 24 | |
| | (b) | Scheduled maturity dates and/or bonds that are subject to potential calls by issuers over the next five years. | |
| | * | Excludes short-term securities. | |
CREDIT QUALITY ALLOCATION (a)
| | | | | | | | |
Credit Rating | | 02/28/18 | | | 08/31/17 | |
AAA/Aaa | | | 6 | % | | | 8 | % |
AA/Aa | | | 32 | | | | 33 | |
A | | | 30 | | | | 30 | |
BBB/Baa | | | 17 | | | | 17 | |
BB/Ba | | | 2 | | | | 1 | |
B/B | | | — | | | | 1 | |
N/R | | | 13 | | | | 10 | |
| | (a) | For financial reporting purposes, credit quality ratings shown above reflect the highest rating assigned by either Standard & Poor’s (“S&P”) or Moody’s Investors Service (“Moody’s”) if ratings differ. These rating agencies are independent, nationally recognized statistical rating organizations and are widely used. Investment grade ratings are credit ratings of BBB/Baa or higher. Below investment grade ratings are credit ratings of BB/Ba or lower. Investments designated N/R are not rated by either rating agency. Unrated investments do not necessarily indicate low credit quality. Credit quality ratings are subject to change. | |
| | |
| Trust Summary as of February 28, 2018 | | BlackRock Massachusetts Tax-Exempt Trust |
Trust Overview
BlackRock Massachusetts Tax-Exempt Trust’s (MHE) (the “Trust”) investment objective is to provide as high a level of current income exempt from both regular U.S. federal income taxes and Massachusetts personal income taxes as is consistent with the preservation of shareholders’ capital. The Trust seeks to achieve its investment objective by investing primarily in Massachusetts tax-exempt obligations (including bonds, notes and capital lease obligations). The Trust invests, under normal market conditions, at least 80% of its assets in obligations that are rated investment grade at the time of investment or, if unrated, determined to be of comparable quality at the time of investment by the Trust’s investment adviser. Under normal market conditions, the Trust invests its assets so that at least 80% of the income generated by the Trust is exempt from U.S. federal income taxes, including U.S. federal alternative minimum tax, and Massachusetts personal income taxes. The Trust invests primarily in long term municipal obligations with maturities of more than ten years. The Trust may invest directly in such securities or synthetically through the use of derivatives.
No assurance can be given that the Trust’s investment objective will be achieved.
Trust Information
| | |
Symbol on NYSE American | | MHE |
Initial Offering Date | | July 23, 1993 |
Yield on Closing Market Price as of February 28, 2018 ($13.62)(a) | | 4.67% |
Tax Equivalent Yield(b) | | 8.63% |
Current Monthly Distribution per Common Share(c) | | $0.0530 |
Current Annualized Distribution per Common Share(c) | | $0.6360 |
Economic Leverage as of February 28, 2018(d) | | 39% |
| | (a) | Yield on closing market price is calculated by dividing the current annualized distribution per share by the closing market price. Past performance does not guarantee future results. | |
| | (b) | Tax equivalent yield assumes the maximum marginal U.S. federal and state tax rate of 45.9%, which includes the 3.8% Medicare tax. Actual tax rates will vary based on income, exemptions and deductions. Lower taxes will result in lower tax equivalent yields. | |
| | (c) | The monthly distribution per Common Share, declared on March 1, 2018, was decreased to $0.044 per share. The yield on closing market price, current monthly distribution per Common Share and current annualized distribution per Common Share do not reflect the new distribution rate. The new distribution rate is not constant and is subject to change in the future. | |
| | (d) | Represents VRDP Shares and TOB Trusts as a percentage of total managed assets, which is the total assets of the Trust, including any assets attributable to VRDP Shares and TOB Trusts, minus the sum of accrued liabilities. For a discussion of leveraging techniques utilized by the Trust, please see The Benefits and Risks of Leveraging on page 5. | |
Performance
Returns for the six months ended February 28, 2018 were as follows:
| | | | | | | | |
| | | Returns Based On | |
| | | Market Price | | | NAV | |
MHE(a)(b) | | | (0.44 | )% | | | (1.61 | )% |
Lipper Other States Municipal Debt Funds(c) | | | (5.78 | ) | | | (1.73 | ) |
| | (a) | All returns reflect reinvestment of dividends and/or distributions at actual reinvestment prices. | |
| | (b) | The Trust’s premium to NAV widened during the period, which accounts for the difference between performance based on market price and performance based on NAV. | |
| | (c) | Average return. Returns reflect reinvestment of dividends and/or distributions at NAV on the ex-dividend date as calculated by Lipper. | |
Performance results may include adjustments made for financial reporting purposes in accordance with U.S. generally accepted accounting principles.
Past performance is not indicative of future results.
The following discussion relates to the Trust’s absolute performance based on NAV:
| • | | U.S. municipal bonds lost ground during the semi-annual period, with declining prices offsetting the benefit of income. Stronger economic growth and concerns about emerging inflation pressures fueled expectations that the Fed would continue to tighten monetary policy, dampening returns across the fixed-income market. |
| • | | Massachusetts experienced healthy growth trends stemming from its strong fiscal position and the high representation of companies in faster-growing sectors such as technology, health care and finance. However, the state’s municipal market lagged somewhat as its higher-quality nature was a headwind at a time in which lower-rated bonds outperformed. |
| • | | The Trust’s largest detractors were its positions in longer-dated, high-quality securities that were issued in the past two years. These bonds had longer call structures, which translated to higher durations and lower income than their lower-rated and/or shorter-call counterparts. (Duration is a measure of interest rate sensitivity; a call is when an issuer redeems a bond prior to its maturity date.) |
| • | | More generally, positions in higher-quality securities detracted at a time in which lower-rated bonds outperformed. |
| • | | The Trust sought to manage interest rate risk using U.S. Treasury futures. Given that Treasury yields rose, as prices fell, this aspect of the Trust’s positioning had a positive effect on returns. |
| • | | Positions in pre-refunded debt outperformed other market segments due to their short durations and implied AAA quality. |
| • | | The Trust’s allocation to longer-dated securities aided performance. The yield curve flattened over the period, as yields on longer-term maturities rose less than those on shorter-dated issues (indicating outperformance). In addition, longer-term bonds’ higher income helped support their relative performance. |
| • | | The Trust’s use of leverage made a positive contribution to results by enhancing income. However, the use of leverage also amplified the impact of falling prices. |
The views expressed reflect the opinions of BlackRock as of the date of this report and are subject to change based on changes in market, economic or other conditions. These views are not intended to be a forecast of future events and are no guarantee of future results.
| | |
| 8 | | 2018 BLACKROCK SEMI-ANNUAL REPORTTO SHAREHOLDERS |
| | |
| Trust Summary as of February 28, 2018 (continued) | | BlackRock Massachusetts Tax-Exempt Trust |
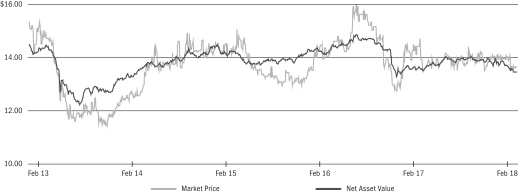
Market Price and Net Asset Value Per Share Summary
| | | | | | | | | | | | | | | | | | | | |
| | | 02/28/18 | | | 08/31/17 | | | Change | | | High | | | Low | |
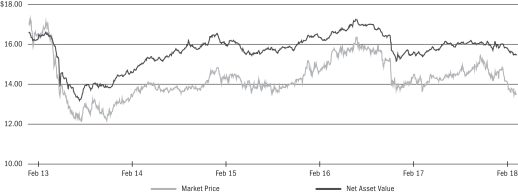
Market Price | | $ | 13.62 | | | $ | 14.00 | | | | (2.71 | )% | | $ | 15.00 | | | $ | 13.16 | |
Net Asset Value | | | 13.44 | | | | 13.98 | | | | (3.86 | ) | | | 14.03 | | | | 13.44 | |
Market Price and Net Asset Value History For the Past Five Years
Overview of the Trust’s Total Investments*
SECTOR ALLOCATION
| | | | | | | | |
Sector | | 02/28/18 | | | 08/31/17 | |
Education | | | 40 | % | | | 42 | % |
State | | | 19 | | | | 19 | |
Health | | | 17 | | | | 14 | |
Transportation | | | 16 | | | | 16 | |
Housing | | | 5 | | | | 6 | |
County/City/Special District/School District | | | 2 | | | | 2 | |
Tobacco | | | 1 | | | | 1 | |
For Trust compliance purposes, the Trust’s sector classifications refer to one or more of the sector sub-classifications used by one or more widely recognized market indexes or rating group indexes, and/or as defined by the investment adviser. These definitions may not apply for purposes of this report, which may combine such sector sub-classifications for reporting ease.
CALL/MATURITY SCHEDULE (b)
| | | | |
Calendar Year Ended December 31, | | | | |
2018 | | | 8 | % |
2019 | | | 13 | |
2020 | | | 13 | |
2021 | | | 9 | |
2022 | | | 14 | |
| | (b) | Scheduled maturity dates and/or bonds that are subject to potential calls by issuers over the next five years. | |
| | * | Excludes short-term securities. | |
CREDIT QUALITY ALLOCATION (a)
| | | | | | | | |
Credit Rating | | 02/28/18 | | | 08/31/17 | |
AAA/Aaa | | | 7 | % | | | 7 | % |
AA/Aa | | | 55 | | | | 53 | |
A | | | 14 | | | | 21 | |
BBB/Baa | | | 17 | | | | 16 | |
BB/Ba | | | 1 | | | | 1 | |
N/R | | | 6 | | | | 2 | |
| | (a) | For financial reporting purposes, credit quality ratings shown above reflect the highest rating assigned by either S&P or Moody’s if ratings differ. These rating agencies are independent, nationally recognized statistical rating organizations and are widely used. Investment grade ratings are credit ratings of BBB/Baa or higher. Below investment grade ratings are credit ratings of BB/Ba or lower. Investments designated N/R are not rated by either rating agency. Unrated investments do not necessarily indicate low credit quality. Credit quality ratings are subject to change. | |
| | |
| Trust Summary as of February 28, 2018 | | BlackRock MuniHoldings New York Quality Fund, Inc. |
Trust Overview
BlackRock MuniHoldings New York Quality Fund, Inc.’s (MHN) (the “Trust”) investment objective is to provide shareholders with current income exempt from U.S. federal income tax and New York State and New York City personal income taxes. The Trust seeks to achieve its investment objective by investing, under normal market conditions, at least 80% of its assets in investment grade (as rated or, if unrated, considered to be of comparable quality at the time of investment by the Trust’s investment adviser) New York municipal obligations exempt from U.S. federal income taxes (except that the interest may be subject to the U.S. federal alternative minimum tax) and New York State and New York City personal income taxes (“New York Municipal Bonds”), except at times when, in the judgment of its investment adviser, New York Municipal Bonds of sufficient quality and quantity are unavailable for investment by the Trust. At all times, except during temporary defensive periods, the Trust invests at least 65% of its assets in New York Municipal Bonds. The Trust invests, under normal market conditions, at least 80% of its assets in municipal obligations with remaining maturities of one year or more. The Trust may invest directly in such securities or synthetically through the use of derivatives.
No assurance can be given that the Trust’s investment objective will be achieved.
Trust Information
| | |
Symbol on New York Stock Exchange (“NYSE”) | | MHN |
Initial Offering Date | | September 19, 1997 |
Yield on Closing Market Price as of February 28, 2018 ($12.75)(a) | | 4.75% |
Tax Equivalent Yield(b) | | 9.43% |
Current Monthly Distribution per Common Share(c) | | $0.0505 |
Current Annualized Distribution per Common Share(c) | | $0.6060 |
Economic Leverage as of February 28, 2018(d) | | 41% |
| | (a) | Yield on closing market price is calculated by dividing the current annualized distribution per share by the closing market price. Past performance does not guarantee future results. | |
| | (b) | Tax equivalent yield assumes the maximum marginal U.S. federal and state tax rate of 49.62%, which includes the 3.8% Medicare tax. Actual tax rates will vary based on income, exemptions and deductions. Lower taxes will result in lower tax equivalent yields. | |
| | (c) | The distribution rate is not constant and is subject to change. | |
| | (d) | Represents VRDP Shares and TOB Trusts as a percentage of total managed assets, which is the total assets of the Trust, including any assets attributable to VRDP Shares and TOB Trusts, minus the sum of accrued liabilities. For a discussion of leveraging techniques utilized by the Trust, please see The Benefits and Risks of Leveraging on page 5. | |
Performance
Returns for the six months ended February 28, 2018 were as follows:
| | | | | | | | |
| | | Returns Based On | |
| | | Market Price | | | NAV | |
MHN(a)(b) | | | (9.04 | )% | | | (1.20 | )% |
Lipper New York Municipal Debt Funds(c) | | | (6.92 | ) | | | (1.73 | ) |
| | (a) | All returns reflect reinvestment of dividends and/or distributions at actual reinvestment prices. | |
| | (b) | The Trust’s discount to NAV widened during the period, which accounts for the difference between performance based on market price and performance based on NAV. | |
| | (c) | Average return. Returns reflect reinvestment of dividends and/or distributions at NAV on the ex-dividend date as calculated by Lipper. | |
Performance results may include adjustments made for financial reporting purposes in accordance with U.S. generally accepted accounting principles.
Past performance is not indicative of future results.
The following discussion relates to the Trust’s absolute performance based on NAV:
| • | | U.S. municipal bonds lost ground during the semi-annual period, with declining prices offsetting the benefit of income. Stronger economic growth and concerns about emerging inflation pressures fueled expectations that the Fed would continue to tighten monetary policy, dampening returns across the fixed-income market. |
| • | | New York municipal bonds underperformed the national market. New issuance in the state was relatively robust compared to the nation as a whole, which contributed to the weaker performance. Unfortunately, much of the new issuance was concentrated in several large issuers in which the Fund already had positions, thereby limiting the opportunity set. New York’s overall economic trends improved, albeit at a rate slightly below the national level, but the state continued to enjoy a broad and diverse economic base. One area of potential concern was the capping of deductibility of state and local taxes due to recently enacted Federal tax-reform policies, which may reduce New York’s ability to raise taxes in the future. |
| • | | The Trust’s allocation to zero-coupon bonds detracted from performance since their longer duration accentuated the impact of the down market. (Duration is a measure of interest rate sensitivity.) |
| • | | Portfolio income, enhanced by leverage, made the largest positive contribution to performance. However, the use of leverage also amplified the impact of falling prices. |
| • | | The Trust sought to manage interest rate risk using U.S. Treasury futures. Given that Treasury yields rose, as prices fell, this aspect of the Trust’s positioning had a positive effect on returns. |
| • | | Exposure to bonds rated A and below was generally a positive contributor to performance, as lower-rated issues outperformed amid investors’ ongoing preference for higher-yielding securities. |
| • | | The Trust’s allocation to the education and transportation sectors was also beneficial. |
The views expressed reflect the opinions of BlackRock as of the date of this report and are subject to change based on changes in market, economic or other conditions. These views are not intended to be a forecast of future events and are no guarantee of future results.
| | |
| 10 | | 2018 BLACKROCK SEMI-ANNUAL REPORTTO SHAREHOLDERS |
| | |
| Trust Summary as of February 28, 2018 (continued) | | BlackRock MuniHoldings New York Quality Fund, Inc. |
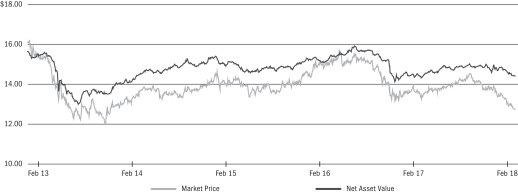
Market Price and Net Asset Value Per Share Summary
| | | | | | | | | | | | | | | | | | | | |
| | | 02/28/18 | | | 08/31/17 | | | Change | | | High | | | Low | |
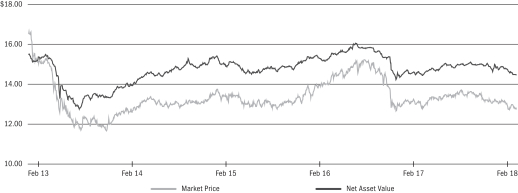
Market Price | | $ | 12.75 | | | $ | 14.36 | | | | (11.21 | )% | | $ | 14.58 | | | $ | 12.69 | |
Net Asset Value | | | 14.40 | | | | 14.93 | | | | (3.55 | ) | | | 15.01 | | | | 14.40 | |
Market Price and Net Asset Value History For the Past Five Years
Overview of the Trust’s Total Investments*
SECTOR ALLOCATION
| | | | | | | | |
Sector | | 02/28/18 | | | 08/31/17 | |
Transportation | | | 26 | % | | | 26 | % |
Education | | | 18 | | | | 19 | |
County/City/Special District/School District | | | 16 | | | | 16 | |
State | | | 16 | | | | 15 | |
Utilities | | | 13 | | | | 12 | |
Health | | | 6 | | | | 7 | |
Housing | | | 2 | | | | 3 | |
Corporate | | | 2 | | | | 1 | |
Tobacco | | | 1 | | | | 1 | |
For Trust compliance purposes, the Trust’s sector classifications refer to one or more of the sector sub-classifications used by one or more widely recognized market indexes or rating group indexes, and/or as defined by the investment adviser. These definitions may not apply for purposes of this report, which may combine such sector sub-classifications for reporting ease.
CALL/MATURITY SCHEDULE (c)
| | | | |
Calendar Year Ended December 31, | | | | |
2018 | | | 10 | % |
2019 | | | 7 | |
2020 | | | 7 | |
2021 | | | 14 | |
2022 | | | 11 | |
| | (c) | Scheduled maturity dates and/or bonds that are subject to potential calls by issuers over the next five years. | |
| | * | Excludes short-term securities. | |
CREDIT QUALITY ALLOCATION (a)
| | | | | | | | |
| Credit Rating | | 02/28/18 | | | 08/31/17 | |
AAA/Aaa | | | 16 | % | | | 19 | % |
AA/Aa | | | 53 | | | | 53 | |
A | | | 19 | | | | 20 | |
BBB/Baa | | | 6 | | | | 6 | |
N/R(b) | | | 6 | | | | 2 | |
| | (a) | For financial reporting purposes, credit quality ratings shown above reflect the highest rating assigned by either S&P or Moody’s if ratings differ. These rating agencies are independent, nationally recognized statistical rating organizations and are widely used. Investment grade ratings are credit ratings of BBB/Baa or higher. Below investment grade ratings are credit ratings of BB/Ba or lower. Investments designated N/R are not rated by either rating agency. Unrated investments do not necessarily indicate low credit quality. Credit quality ratings are subject to change. | |
| | (b) | The investment adviser evaluates the credit quality of unrated investments based upon certain factors including, but not limited to, credit ratings for similar investments and financial analysis of sectors and individual investments. Using this approach, the investment adviser has deemed certain of these unrated securities as investment grade quality. As of February 28, 2018 and August 31, 2017, the market value of unrated securities deemed by the investment adviser to be investment grade each represents less than 4% and 1%, respectively, of the Trust’s total investments. | |
| | |
| Trust Summary as of February 28, 2018 | | BlackRock New Jersey Municipal Bond Trust |
Trust Overview
BlackRock New Jersey Municipal Bond Trust’s (BLJ) (the “Trust”) investment objective is to provide current income exempt from regular U.S. federal income tax and New Jersey gross income tax. The Trust seeks to achieve its investment objective by investing primarily in municipal bonds exempt from U.S. federal income taxes (except that the interest may subject to the U.S. federal alternative minimum tax) and New Jersey gross income taxes. Under normal market conditions, the Trust invests at least 80% of its managed assets in municipal bonds that are investment grade quality at the time of investment or, if unrated, determined to be of comparable quality at the time of investment by the Trust’s investment adviser. The Trust may invest directly in such securities or synthetically through the use of derivatives.
On September 6, 2017, the Boards of the Trust, BlackRock New Jersey Municipal Income Trust (BNJ) and BlackRock MuniYield New Jersey Fund, Inc. (MYJ) approved the reorganizations of the Trust and BNJ with and into MYJ, with MYJ continuing as the surviving fund after the reorganization. At a joint special shareholder meeting held on March 28, 2018, the shareholders of the Trust, BNJ and MYJ approved the reorganizations, which are expected to occur on or about June 8, 2018.
No assurance can be given that the Trust’s investment objective will be achieved.
Trust Information
| | |
Symbol on NYSE American | | BLJ |
Initial Offering Date | | April 30, 2002 |
Yield on Closing Market Price as of February 28, 2018 ($13.85)(a) | | 5.33% |
Tax Equivalent Yield(b) | | 10.61% |
Current Monthly Distribution per Common Share(c) | | $0.0615 |
Current Annualized Distribution per Common Share(c) | | $0.7380 |
Economic Leverage as of February 28, 2018(d) | | 41% |
| | (a) | Yield on closing market price is calculated by dividing the current annualized distribution per share by the closing market price. Past performance does not guarantee future results. | |
| | (b) | Tax equivalent yield assumes the maximum marginal U.S. federal and state tax rate of 49.77%, which includes the 3.8% Medicare tax. Actual tax rates will vary based on income, exemptions and deductions. Lower taxes will result in lower tax equivalent yields. | |
| | (c) | The distribution rate is not constant and is subject to change. | |
| | (d) | Represents VRDP Shares and TOB Trusts as a percentage of total managed assets, which is the total assets of the Trust, including any assets attributable to VRDP Shares and TOB Trusts, minus the sum of accrued liabilities. For a discussion of leveraging techniques utilized by the Trust, please see The Benefits and Risks of Leveraging on page 5. | |
Performance
Returns for the six months ended February 28, 2018 were as follows:
| | | | | | | | |
| | | Returns Based On | |
| | | Market Price | | | NAV | |
BLJ(a)(b) | | | (5.56 | )% | | | (0.43 | )% |
Lipper New Jersey Municipal Debt Funds(c) | | | (6.28 | ) | | | (1.09 | ) |
| | (a) | All returns reflect reinvestment of dividends and/or distributions at actual reinvestment prices. | |
| | (b) | The Trust’s discount to NAV widened during the period, which accounts for the difference between performance based on market price and performance based on NAV. | |
| | (c) | Average return. Returns reflect reinvestment of dividends and/or distributions at NAV on the ex-dividend date as calculated by Lipper. | |
Performance results may include adjustments made for financial reporting purposes in accordance with U.S. generally accepted accounting principles.
Past performance is not indicative of future results.
The following discussion relates to the Trust’s absolute performance based on NAV:
| • | | U.S. municipal bonds lost ground during the semi-annual period, with declining prices offsetting the benefit of income. Stronger economic growth and concerns about emerging inflation pressures fueled expectations that the Fed would continue to tighten monetary policy, dampening returns across the fixed-income market. |
| • | | New Jersey bonds outperformed the national market, as sentiment remained favorable due in part to investors’ positive perception of legislation that redirected roughly $1 billion annually in lottery proceeds to the state’s pension funds. Additionally, the state reported positive tax receipts. |
| • | | Long-term bonds outperformed short-term debt, leading to a flattening of the yield curve. In this environment, the Trust’s short duration posture contributed to relative performance. However, the Trust’s positions in short- and intermediate-term debt detracted. The Trust’s allocation to zero-coupon bonds, while limited, also detracted from performance since their longer duration accentuated the impact of the down market. (Duration is a measure of interest rate sensitivity.) |
| • | | Reinvestment had an adverse effect on the Trust’s income, as the proceeds of higher-yielding bonds that matured or were called needed to be reinvested at lower prevailing rates. |
| • | | The Trust sought to manage interest rate risk using U.S. Treasury futures. Given that Treasury yields rose, as prices fell, this aspect of the Trust’s positioning had a positive effect on returns. |
| • | | At the sector level, positions in corporate-related tax-exempt bonds contributed to performance. The tobacco sector also generated positive absolute returns due to the announcement of a potential refunding of New Jersey’s outstanding tobacco bonds, which could result in $2.9 billion high yield tobacco issues being removed from the market. The announcement created a tailwind for the sector due to the prospect of a reduced supply of liquid, high yield securities. |
| • | | Bonds rated BBB and lower contributed to performance, as continued investor demand for higher yields helped support prices. In addition, these positions generated above-average income. Conversely, the Trust’s positions in higher-quality investments underperformed their lower-rated counterparts. |
The views expressed reflect the opinions of BlackRock as of the date of this report and are subject to change based on changes in market, economic or other conditions. These views are not intended to be a forecast of future events and are no guarantee of future results.
| | |
| 12 | | 2018 BLACKROCK SEMI-ANNUAL REPORTTO SHAREHOLDERS |
| | |
| Trust Summary as of February 28, 2018 (continued) | | BlackRock New Jersey Municipal Bond Trust |
Market Price and Net Asset Value Per Share Summary
| | | | | | | | | | | | | | | | | | | | |
| | | 02/28/18 | | | 08/31/17 | | | Change | | | High | | | Low | |
Market Price | | $ | 13.85 | | | $ | 15.04 | | | | (7.91 | )% | | $ | 15.47 | | | $ | 13.63 | |
Net Asset Value | | | 15.36 | | | | 15.82 | | | | (2.91 | ) | | | 15.97 | | | | 15.36 | |
Market Price and Net Asset Value History For the Past Five Years
Overview of the Trust’s Total Investments*
SECTOR ALLOCATION
| | | | | | | | |
Sector | | 02/28/18 | | | 08/31/17 | |
Transportation | | | 31 | % | | | 31 | % |
Education | | | 19 | | | | 19 | |
County/City/Special District/School District | | | 18 | | | | 18 | |
State | | | 15 | | | | 15 | |
Health | | | 7 | | | | 8 | |
Corporate | | | 6 | | | | 6 | |
Tobacco | | | 2 | | | | 1 | |
Housing | | | 1 | | | | 1 | |
Utilities | | | 1 | | | | 1 | |
For Trust compliance purposes, the Trust’s sector classifications refer to one or more of the sector sub-classifications used by one or more widely recognized market indexes or rating group indexes, and/or as defined by the investment adviser. These definitions may not apply for purposes of this report, which may combine such sector sub-classifications for reporting ease.
CALL/MATURITY SCHEDULE (b)
| | | | |
Calendar Year Ended December 31, | | | | |
2018 | | | 8 | % |
2019 | | | 8 | |
2020 | | | 5 | |
2021 | | | 11 | |
2022 | | | 11 | |
| | (b) | Scheduled maturity dates and/or bonds that are subject to potential calls by issuers over the next five years. | |
| | * | Excludes short-term securities. | |
CREDIT QUALITY ALLOCATION (a)
| | | | | | | | |
| Credit Rating | | 02/28/18 | | | 08/31/17 | |
AAA/Aaa | | | 5 | % | | | 5 | % |
AA/Aa | | | 30 | | | | 38 | |
A | | | 21 | | | | 22 | |
BBB/Baa | | | 34 | | | | 22 | |
BB/Ba | | | 5 | | | | 9 | |
B/B | | | 1 | | | | 2 | |
N/R | | | 4 | | | | 2 | |
| | (a) | For financial reporting purposes, credit quality ratings shown above reflect the highest rating assigned by either S&P or Moody’s if ratings differ. These rating agencies are independent, nationally recognized statistical rating organizations and are widely used. Investment grade ratings are credit ratings of BBB/Baa or higher. Below investment grade ratings are credit ratings of BB/Ba or lower. Investments designated N/R are not rated by either rating agency. Unrated investments do not necessarily indicate low credit quality. Credit quality ratings are subject to change. | |
| | |
| Trust Summary as of February 28, 2018 | | BlackRock New York Municipal Bond Trust |
Trust Overview
BlackRock New York Municipal Bond Trust’s (BQH) (the “Trust”) investment objective is to provide current income exempt from regular U.S. federal income taxes and New York State and New York City personal income taxes. The Trust seeks to achieve its investment objective by investing primarily in municipal bonds exempt from U.S. federal income taxes (except that the interest may be subject to the U.S. federal alternative minimum tax) and New York State and New York City personal income taxes. Under normal market conditions, the Trust invests at least 80% of its managed assets in municipal bonds that are investment grade quality at the time of investment or, if unrated, determined to be of comparable quality at the time of investment by the Trust’s investment adviser. The Trust may invest directly in such securities or synthetically through the use of derivatives.
No assurance can be given that the Trust’s investment objective will be achieved.
Trust Information
| | |
Symbol on NYSE | | BQH |
Initial Offering Date | | April 30, 2002 |
Yield on Closing Market Price as of February 28, 2018 ($13.51)(a) | | 5.24% |
Tax Equivalent Yield(b) | | 10.40% |
Current Monthly Distribution per Common Share(c) | | $0.0590 |
Current Annualized Distribution per Common Share(c) | | $0.7080 |
Economic Leverage as of February 28, 2018(d) | | 40% |
| | (a) | Yield on closing market price is calculated by dividing the current annualized distribution per share by the closing market price. Past performance does not guarantee future results. | |
| | (b) | Tax equivalent yield assumes the maximum marginal U.S. federal and state tax rate of 49.62%, which includes the 3.8% Medicare tax. Actual tax rates will vary based on income, exemptions and deductions. Lower taxes will result in lower tax equivalent yields. | |
| | (c) | The monthly distribution per Common Share, declared on March 1, 2018, was decreased to $0.046 per share. The yield on closing market price, current monthly distribution per Common Share and current annualized distribution per Common Share do not reflect the new distribution rate. The new distribution rate is not constant and is subject to change in the future. | |
| | (d) | Represents VRDP Shares and TOB Trusts as a percentage of total managed assets, which is the total assets of the Trust, including any assets attributable to VRDP Shares and TOB Trusts, minus the sum of accrued liabilities. For a discussion of leveraging techniques utilized by the Trust, please see The Benefits and Risks of Leveraging on page 5. | |
Performance
Returns for the six months ended February 28, 2018 were as follows:
| | | | | | | | |
| | | Returns Based On | |
| | | Market Price | | | NAV | |
BQH(a)(b) | | | (4.85 | )% | | | (1.59 | )% |
Lipper New York Municipal Debt Funds(c) | | | (6.92 | ) | | | (1.73 | ) |
| | (a) | All returns reflect reinvestment of dividends and/or distributions at actual reinvestment prices. | |
| | (b) | The Trust’s discount to NAV widened during the period, which accounts for the difference between performance based on market price and performance based on NAV. | |
| | (c) | Average return. Returns reflect reinvestment of dividends and/or distributions at NAV on the ex-dividend date as calculated by Lipper. | |
Performance results may include adjustments made for financial reporting purposes in accordance with U.S. generally accepted accounting principles.
Past performance is not indicative of future results.
The following discussion relates to the Trust’s absolute performance based on NAV:
| • | | U.S. municipal bonds lost ground during the semi-annual period, with declining prices offsetting the benefit of income. Stronger economic growth and concerns about emerging inflation pressures fueled expectations that the Fed would continue to tighten monetary policy, dampening returns across the fixed-income market. |
| • | | New York municipal bonds underperformed the national market. New issuance in the state was relatively robust compared to the nation as a whole, which contributed to the weaker performance. Unfortunately, much of the new issuance was concentrated in several large issuers in which the Fund already had positions, thereby limiting the opportunity set. New York’s overall economic trends improved, albeit at a rate slightly below the national level, but the state continued to enjoy a broad and diverse economic base. One area of potential concern was the capping of deductibility of state and local taxes due to recently enacted Federal tax-reform policies, which may reduce New York’s ability to raise taxes in the future. |
| • | | The Trust’s allocation to zero-coupon bonds detracted from performance since their longer duration accentuated the impact of the down market. (Duration is a measure of interest rate sensitivity.) |
| • | | Portfolio income, enhanced by leverage, made the largest positive contribution to performance. However, the use of leverage also amplified the impact of falling prices. |
| • | | The Trust sought to manage interest rate risk using U.S. Treasury futures. Given that Treasury yields rose, as prices fell, this aspect of the Trust’s positioning had a positive effect on returns. |
| • | | Exposure to bonds rated A and below was generally a positive contributor to performance, as lower-rated issues outperformed amid investors’ ongoing preference for higher-yielding securities. |
| • | | The Trust’s allocation to the education sector was also beneficial. |
The views expressed reflect the opinions of BlackRock as of the date of this report and are subject to change based on changes in market, economic or other conditions. These views are not intended to be a forecast of future events and are no guarantee of future results.
| | |
| 14 | | 2018 BLACKROCK SEMI-ANNUAL REPORTTO SHAREHOLDERS |
| | |
| Trust Summary as of February 28, 2018 (continued) | | BlackRock New York Municipal Bond Trust |
Market Price and Net Asset Value Per Share Summary
| | | | | | | | | | | | | | | | | | | | |
| | | 02/28/18 | | | 08/31/17 | | | Change | | | High | | | Low | |
Market Price | | $ | 13.51 | | | $ | 14.55 | | | | (7.15 | )% | | $ | 15.65 | | | $ | 13.42 | |
Net Asset Value | | | 15.47 | | | | 16.11 | | | | (3.97 | ) | | | 16.20 | | | | 15.47 | |
Market Price and Net Asset Value History For the Past Five Years
Overview of the Trust’s Total Investments*
SECTOR ALLOCATION
| | | | | | | | |
Sector | | 02/28/18 | | | 08/31/17 | |
County/City/Special District/School District | | | 24 | % | | | 25 | % |
Education | | | 22 | | | | 22 | |
Transportation | | | 17 | | | | 16 | |
Utilities | | | 12 | | | | 12 | |
Health | | | 10 | | | | 11 | |
State | | | 6 | | | | 6 | |
Housing | | | 3 | | | | 3 | |
Corporate | | | 3 | | | | 3 | |
Tobacco | | | 3 | | | | 2 | |
For Trust compliance purposes, the Trust’s sector classifications refer to one or more of the sector sub-classifications used by one or more widely recognized market indexes or rating group indexes, and/or as defined by the investment adviser. These definitions may not apply for purposes of this report, which may combine such sector sub-classifications for reporting ease.
CALL/MATURITY SCHEDULE (c)
| | | | |
Calendar Year Ended December 31, | | | | |
2018 | | | 7 | % |
2019 | | | 6 | |
2020 | | | 7 | |
2021 | | | 16 | |
2022 | | | 11 | |
| | (c) | Scheduled maturity dates and/or bonds that are subject to potential calls by issuers over the next five years. | |
| | * | Excludes short-term securities. | |
CREDIT QUALITY ALLOCATION (a)
| | | | | | | | |
Credit Rating | | 02/28/18 | | | 08/31/17 | |
AAA/Aaa | | | 12 | % | | | 14 | % |
AA/Aa | | | 42 | | | | 48 | |
A | | | 28 | | | | 21 | |
BBB/Baa | | | 6 | | | | 7 | |
BB/Ba | | | 2 | | | | 3 | |
N/R(b) | | | 10 | | | | 7 | |
| | (a) | For financial reporting purposes, credit quality ratings shown above reflect the highest rating assigned by either S&P or Moody’s if ratings differ. These rating agencies are independent, nationally recognized statistical rating organizations and are widely used. Investment grade ratings are credit ratings of BBB/Baa or higher. Below investment grade ratings are credit ratings of BB/Ba or lower. Investments designated N/R are not rated by either rating agency. Unrated investments do not necessarily indicate low credit quality. Credit quality ratings are subject to change. | |
| | (b) | The investment adviser evaluates the credit quality of unrated investments based upon certain factors including, but not limited to, credit ratings for similar investments and financial analysis of sectors and individual investments. Using this approach, the investment adviser has deemed certain of these unrated securities as investment grade quality. As of February 28, 2018 and August 31, 2017, the market value of unrated securities deemed by the investment adviser to be investment grade represents 4% and 2%, respectively, of the Trust’s total investments. | |
| | |
| Trust Summary as of February 28, 2018 | | BlackRock New York Municipal Income Quality Trust |
Trust Overview
BlackRock New York Municipal Income Quality Trust’s (BSE) (the “Trust”) investment objective is to provide current income exempt from U.S. federal income tax, including the alternative minimum tax, and New York State and New York City personal income taxes. The Trust seeks to achieve its investment objective by investing at least 80% of its managed assets in municipal obligations exempt from U.S. federal income taxes (including the U.S. federal alternative minimum tax) and New York State and New York City personal income taxes. Under normal market conditions, the Trust invests primarily in municipal bonds that are investment grade quality at the time of investment or, if unrated, are determined to be of comparable quality at the time of investment by the Trust’s investment adviser. The Trust may invest directly in such securities or synthetically through the use of derivatives.
No assurance can be given that the Trust’s investment objective will be achieved.
Trust Information
| | |
Symbol on NYSE | | BSE |
Initial Offering Date | | October 31, 2002 |
Yield on Closing Market Price as of February 28, 2018 ($12.77)(a) | | 4.37% |
Tax Equivalent Yield(b) | | 8.67% |
Current Monthly Distribution per Common Share(c) | | $0.0465 |
Current Annualized Distribution per Common Share(c) | | $0.5580 |
Economic Leverage as of February 28, 2018(d) | | 39% |
| | (a) | Yield on closing market price is calculated by dividing the current annualized distribution per share by the closing market price. Past performance does not guarantee future results. | |
| | (b) | Tax equivalent yield assumes the maximum marginal U.S. federal and state tax rate of 49.62%, which includes the 3.8% Medicare tax. Actual tax rates will vary based on income, exemptions and deductions. Lower taxes will result in lower tax equivalent yields. | |
| | (c) | The distribution rate is not constant and is subject to change. | |
| | (d) | Represents VRDP Shares and TOB Trusts as a percentage of total managed assets, which is the total assets of the Trust, including any assets attributable to VRDP Shares and TOB Trusts, minus the sum of accrued liabilities. For a discussion of leveraging techniques utilized by the Trust, please see The Benefits and Risks of Leveraging on page 5. | |
Performance
Returns for the six months ended February 28, 2018 were as follows:
| | | | | | | | |
| | | Returns Based On | |
| | | Market Price | | | NAV | |
BSE(a)(b) | | | (3.62 | )% | | | (1.54 | )% |
Lipper New York Municipal Debt Funds(c) | | | (6.92 | ) | | | (1.73 | ) |
| | (a) | All returns reflect reinvestment of dividends and/or distributions at actual reinvestment prices. | |
| | (b) | The Trust’s discount to NAV widened during the period, which accounts for the difference between performance based on market price and performance based on NAV. | |
| | (c) | Average return. Returns reflect reinvestment of dividends and/or distributions at NAV on the ex-dividend date as calculated by Lipper. | |
Performance results may include adjustments made for financial reporting purposes in accordance with U.S. generally accepted accounting principles.
Past performance is not indicative of future results.
The following discussion relates to the Trust’s absolute performance based on NAV:
| • | | U.S. municipal bonds lost ground during the semi-annual period, with declining prices offsetting the benefit of income. Stronger economic growth and concerns about emerging inflation pressures fueled expectations that the Fed would continue to tighten monetary policy, dampening returns across the fixed-income market. |
| • | | New York municipal bonds underperformed the national market. New issuance in the state was relatively robust compared to the nation as a whole, which contributed to the weaker performance. Unfortunately, much of the new issuance was concentrated in several large issuers in which the Fund already had positions, thereby limiting the opportunity set. New York’s overall economic trends improved, albeit at a rate slightly below the national level, but the state continued to enjoy a broad and diverse economic base. One area of potential concern was the capping of deductibility of state and local taxes due to recently enacted Federal tax-reform policies, which may reduce New York’s ability to raise taxes in the future. |
| • | | The Trust’s allocation to zero-coupon bonds detracted from performance since their longer duration accentuated the impact of the down market. (Duration is a measure of interest rate sensitivity.) |
| • | | Portfolio income, enhanced by leverage, made the largest positive contribution to performance. However, the use of leverage also amplified the impact of falling prices. |
| • | | The Trust sought to manage interest rate risk using U.S. Treasury futures. Given that Treasury yields rose, as prices fell, this aspect of the Trust’s positioning had a positive effect on returns. |
| • | | Exposure to bonds rated A and below was generally a positive contributor to performance, as lower-rated issues outperformed amid investors’ ongoing preference for higher-yielding securities. |
| • | | The Trust’s allocation to the education sector was also beneficial. |
The views expressed reflect the opinions of BlackRock as of the date of this report and are subject to change based on changes in market, economic or other conditions. These views are not intended to be a forecast of future events and are no guarantee of future results.
| | |
| 16 | | 2018 BLACKROCK SEMI-ANNUAL REPORTTO SHAREHOLDERS |
| | |
| Trust Summary as of February 28, 2018 (continued) | | BlackRock New York Municipal Income Quality Trust |
Market Price and Net Asset Value Per Share Summary
| | | | | | | | | | | | | | | | | | | | |
| | | 02/28/18 | | | 08/31/17 | | | Change | | | High | | | Low | |
Market Price | | $ | 12.77 | | | $ | 13.55 | | | | (5.76 | )% | | $ | 13.69 | | | $ | 12.67 | |
Net Asset Value | | | 14.48 | | | | 15.04 | | | | (3.72 | ) | | | 15.12 | | | | 14.48 | |
Market Price and Net Asset Value History For the Past Five Years
Overview of the Trust’s Total Investments*
SECTOR ALLOCATION
| | | | | | | | |
| Sector | | 02/28/18 | | | 08/31/17 | |
Education | | | 24 | % | | | 26 | % |
County/City/Special District/School District | | | 19 | | | | 19 | |
Transportation | | | 18 | | | | 16 | |
Utilities | | | 16 | | | | 16 | |
State | | | 13 | | | | 12 | |
Health | | | 7 | | | | 7 | |
Housing | | | 2 | | | | 3 | |
Tobacco | | | 1 | | | | 1 | |
For Trust compliance purposes, the Trust’s sector classifications refer to one or more of the sector sub-classifications used by one or more widely recognized market indexes or rating group indexes, and/or as defined by the investment adviser. These definitions may not apply for purposes of this report, which may combine such sector sub-classifications for reporting ease.
CALL/MATURITY SCHEDULE (c)
| | | | |
Calendar Year Ended December 31, | | | | |
2018 | | | 5 | % |
2019 | | | 4 | |
2020 | | | 2 | |
2021 | | | 12 | |
2022 | | | 7 | |
| | (c) | Scheduled maturity dates and/or bonds that are subject to potential calls by issuers over the next five years. | |
| | * | Excludes short-term securities. | |
CREDIT QUALITY ALLOCATION (a)
| | | | | | | | |
| Credit Rating | | 02/28/18 | | | 08/31/17 | |
AAA/Aaa | | | 11 | % | | | 22 | % |
AA/Aa | | | 53 | | | | 52 | |
A | | | 31 | | | | 23 | |
BBB/Baa | | | 1 | | | | 2 | |
N/R(b) | | | 4 | | | | 1 | |
| | (a) | For financial reporting purposes, credit quality ratings shown above reflect the highest rating assigned by either S&P or Moody’s if ratings differ. These rating agencies are independent, nationally recognized statistical rating organizations and are widely used. Investment grade ratings are credit ratings of BBB/Baa or higher. Below investment grade ratings are credit ratings of BB/Ba or lower. Investments designated N/R are not rated by either rating agency. Unrated investments do not necessarily indicate low credit quality. Credit quality ratings are subject to change. | |
| | (b) | The investment adviser evaluates the credit quality of unrated investments based upon certain factors including, but not limited to, credit ratings for similar investments and financial analysis of sectors and individual investments. Using this approach, the investment adviser has deemed certain of these unrated securities as investment grade quality. As of February 28, 2018 and August 31, 2017, the market value of unrated securities deemed by the investment adviser to be investment grade represents 2% and 1%, respectively, of the Trust’s total investments. | |
| | |
| Trust Summary as of February 28, 2018 | | BlackRock New York Municipal Income Trust II |
Trust Overview
BlackRock New York Municipal Income Trust II’s (BFY) (the “Trust”) investment objective is to provide current income exempt from regular U.S. federal income tax and New York State and New York City personal income taxes. The Trust seeks to achieve its investment objective by investing primarily in municipal bonds exempt from U.S. federal income taxes (except that the interest may be subject to the U.S. federal alternative minimum tax) and New York State and New York City personal income taxes. Under normal market conditions, the Trust invests at least 80% of its managed assets in municipal bonds that are investment grade quality at the time of investment or, if unrated, determined to be of comparable quality at the time of investment by the Trust’s investment adviser. The Trust may invest directly in such securities or synthetically through the use of derivatives.
No assurance can be given that the Trust’s investment objective will be achieved.
Trust Information
| | |
Symbol on NYSE American | | BFY |
Initial Offering Date | | July 30, 2002 |
Yield on Closing Market Price as of February 28, 2018 ($13.76)(a) | | 5.32% |
Tax Equivalent Yield(b) | | 10.56% |
Current Monthly Distribution per Common Share(c) | | $0.0610 |
Current Annualized Distribution per Common Share(c) | | $0.7320 |
Economic Leverage as of February 28, 2018(d) | | 41% |
| | (a) | Yield on closing market price is calculated by dividing the current annualized distribution per share by the closing market price. Past performance does not guarantee future results. | |
| | (b) | Tax equivalent yield assumes the maximum marginal U.S. federal and state tax rate of 49.62%, which includes the 3.8% Medicare tax. Actual tax rates will vary based on income, exemptions and deductions. Lower taxes will result in lower tax equivalent yields. | |
| | (c) | The monthly distribution per Common Share, declared on March 1, 2018, was decreased to $0.049 per share. The yield on closing market price, current monthly distribution per Common Share and current annualized distribution per Common Share do not reflect the new distribution rate. The new distribution rate is not constant and is subject to change in the future. | |
| | (d) | Represents VRDP Shares and TOB Trusts as a percentage of total managed assets, which is the total assets of the Trust, including any assets attributable to VRDP Shares and TOB Trusts, minus the sum of accrued liabilities. For a discussion of leveraging techniques utilized by the Trust, please see The Benefits and Risks of Leveraging on page 5. | |
Performance
Returns for the six months ended February 28, 2018 were as follows:
| | | | | | | | |
| | | Returns Based On | |
| | | Market Price | | | NAV | |
BFY(a)(b) | | | (9.06 | )% | | | (1.60 | )% |
Lipper New York Municipal Debt Funds(c) | | | (6.92 | ) | | | (1.73 | ) |
| | (a) | All returns reflect reinvestment of dividends and/or distributions at actual reinvestment prices. | |
| | (b) | The Trust’s discount to NAV widened during the period, which accounts for the difference between performance based on market price and performance based on NAV. | |
| | (c) | Average return. Returns reflect reinvestment of dividends and/or distributions at NAV on the ex-dividend date as calculated by Lipper. | |
Performance results may include adjustments made for financial reporting purposes in accordance with U.S. generally accepted accounting principles.
Past performance is not indicative of future results.
The following discussion relates to the Trust’s absolute performance based on NAV:
| • | | U.S. municipal bonds lost ground during the semi-annual period, with declining prices offsetting the benefit of income. Stronger economic growth and concerns about emerging inflation pressures fueled expectations that the Fed would continue to tighten monetary policy, dampening returns across the fixed-income market. |
| • | | New York municipal bonds underperformed the national market. New issuance in the state was relatively robust compared to the nation as a whole, which contributed to the weaker performance. Unfortunately, much of the new issuance was concentrated in several large issuers in which the Fund already had positions, thereby limiting the opportunity set. New York’s overall economic trends improved, albeit at a rate slightly below the national level, but the state continued to enjoy a broad and diverse economic base. One area of potential concern was the capping of deductibility of state and local taxes due to recently enacted Federal tax-reform policies, which may reduce New York’s ability to raise taxes in the future. |
| • | | The Trust’s allocation to zero-coupon bonds detracted from performance since their longer duration accentuated the impact of the down market. (Duration is a measure of interest rate sensitivity.) |
| • | | Portfolio income, enhanced by leverage, made the largest positive contribution to performance. However, the use of leverage also amplified the impact of falling prices. |
| • | | The Trust sought to manage interest rate risk using U.S. Treasury futures. Given that Treasury yields rose, as prices fell, this aspect of the Trust’s positioning had a positive effect on returns. |
| • | | Exposure to bonds rated A and below was generally a positive contributor to performance, as lower-rated issues outperformed amid investors’ ongoing preference for higher-yielding securities. |
| • | | The Trust’s allocation to the education sector was also beneficial. |
The views expressed reflect the opinions of BlackRock as of the date of this report and are subject to change based on changes in market, economic or other conditions. These views are not intended to be a forecast of future events and are no guarantee of future results.
| | |
| 18 | | 2018 BLACKROCK SEMI-ANNUAL REPORTTO SHAREHOLDERS |
| | |
| Trust Summary as of February 28, 2018 (continued) | | BlackRock New York Municipal Income Trust II |
Market Price and Net Asset Value Per Share Summary
| | | | | | | | | | | | | | | | | | | | |
| | | 02/28/18 | | | 08/31/17 | | | Change | | | High | | | Low | |
Market Price | | $ | 13.76 | | | $ | 15.51 | | | | (11.28 | )% | | $ | 15.90 | | | $ | 13.69 | |
Net Asset Value | | | 15.08 | | | | 15.71 | | | | (4.01 | ) | | | 15.79 | | | | 15.08 | |
Market Price and Net Asset Value History For the Past Five Years
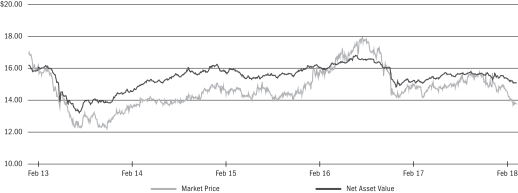
Overview of the Trust’s Total Investments*
SECTOR ALLOCATION
| | | | | | | | |
| Sector | | 02/28/18 | | | 08/31/17 | |
County/City/Special District/School District | | | 22 | % | | | 23 | % |
Transportation | | | 18 | | | | 18 | |
Education | | | 16 | | | | 17 | |
Utilities | | | 14 | | | | 13 | |
State | | | 10 | | | | 9 | |
Health | | | 9 | | | | 9 | |
Housing | | | 5 | | | | 6 | |
Tobacco | | | 3 | | | | 3 | |
Corporate | | | 3 | | | | 2 | |
For Trust compliance purposes, the Trust’s sector classifications refer to one or more of the sector sub-classifications used by one or more widely recognized market indexes or rating group indexes, and/or as defined by the investment adviser. These definitions may not apply for purposes of this report, which may combine such sector sub-classifications for reporting ease.
CALL/MATURITY SCHEDULE (c)
| | | | |
Calendar Year Ended December 31, | | | | |
2018 | | | 6 | % |
2019 | | | 8 | |
2020 | | | 5 | |
2021 | | | 21 | |
2022 | | | 8 | |
| | (c) | Scheduled maturity dates and/or bonds that are subject to potential calls by issuers over the next five years. | |
| | * | Excludes short-term securities. | |
CREDIT QUALITY ALLOCATION (a)
| | | | | | | | |
| Credit Rating | | 02/28/18 | | | 08/31/17 | |
AAA/Aaa | | | 15 | % | | | 15 | % |
AA/Aa | | | 42 | | | | 45 | |
A | | | 28 | | | | 25 | |
BBB/Baa | | | 9 | | | | 8 | |
BB/Ba | | | 3 | | | | 2 | |
B | | | 1 | | | | 1 | |
N/R(b) | | | 2 | | | | 4 | |
| | (a) | For financial reporting purposes, credit quality ratings shown above reflect the highest rating assigned by either S&P or Moody’s if ratings differ. These rating agencies are independent, nationally recognized statistical rating organizations and are widely used. Investment grade ratings are credit ratings of BBB/Baa or higher. Below investment grade ratings are credit ratings of BB/Ba or lower. Investments designated N/R are not rated by either rating agency. Unrated investments do not necessarily indicate low credit quality. Credit quality ratings are subject to change. | |
| | (b) | The investment adviser evaluates the credit quality of unrated investments based upon certain factors including, but not limited to, credit ratings for similar investments and financial analysis of sectors and individual investments. Using this approach, the investment adviser has deemed certain of these unrated securities as investment grade quality. As of February 28, 2018 and August 31, 2017, the market value of unrated securities deemed by the investment adviser to be investment grade represents less than 1% and 2%, respectively, of the Trust’s total investments. | |
| | |
| Trust Summary as of February 28, 2018 | | BlackRock Virginia Municipal Bond Trust |
Trust Overview
BlackRock Virginia Municipal Bond Trust’s (BHV) (the “Trust”) investment objective is to provide current income exempt from regular U.S. federal income tax and Virginia personal income taxes. The Trust seeks to achieve its investment objectives by investing primarily in municipal bonds exempt from U.S. federal income taxes (except that the interest may be subject to the U.S. federal alternative minimum tax) and Virginia personal income taxes. The Trust invests, under normal market conditions, at least 80% of its managed assets in municipal bonds that are investment grade quality at the time of investment or, if unrated, determined to be of comparable quality at the time of investment by the Trust’s investment adviser. The Trust may invest directly in such securities or synthetically through the use of derivatives.
No assurance can be given that the Trust’s investment objective will be achieved.
Trust Information
| | |
Symbol on NYSE American | | BHV |
Initial Offering Date | | April 30, 2002 |
Yield on Closing Market Price as of February 28, 2018 ($15.91)(a) | | 4.75% |
Tax Equivalent Yield(b) | | 8.89% |
Current Monthly Distribution per Common Share(c) | | $0.0630 |
Current Annualized Distribution per Common Share(c) | | $0.7560 |
Economic Leverage as of February 28, 2018(d) | | 40% |
| | (a) | Yield on closing market price is calculated by dividing the current annualized distribution per share by the closing market price. Past performance does not guarantee future results. | |
| | (b) | Tax equivalent yield assumes the maximum marginal U.S. federal and state tax rate of 46.55%, which includes the 3.8% Medicare tax. Actual tax rates will vary based on income, exemptions and deductions. Lower taxes will result in lower tax equivalent yields. | |
| | (c) | The distribution rate is not constant and is subject to change. | |
| | (d) | Represents VRDP Shares and TOB Trusts as a percentage of total managed assets, which is the total assets of the Trust, including any assets attributable to VRDP Shares and TOB Trusts, minus the sum of accrued liabilities. For a discussion of leveraging techniques utilized by the Trust, please see The Benefits and Risks of Leveraging on page 5. | |
Performance
Returns for the six months ended February 28, 2018 were as follows:
| | | | | | | | |
| | | Returns Based On | |
| | | Market Price | | | NAV | |
BHV(a)(b) | | | (12.70 | )% | | | (1.28 | )% |
Lipper Other States Municipal Debt Funds(c) | | | (5.78 | ) | | | (1.73 | ) |
| | (a) | All returns reflect reinvestment of dividends and/or distributions at actual reinvestment prices. | |
| | (b) | The Trust’s premium to NAV narrowed during the period, which accounts for the difference between performance based on market price and performance based on NAV. | |
| | (c) | Average return. Returns reflect reinvestment of dividends and/or distributions at NAV on the ex-dividend date as calculated by Lipper. | |
Performance results may include adjustments made for financial reporting purposes in accordance with U.S. generally accepted accounting principles.
Past performance is not indicative of future results.
The following discussion relates to the Trust’s absolute performance based on NAV:
| • | | U.S. municipal bonds lost ground during the semi-annual period, with declining prices offsetting the benefit of income. Stronger economic growth and concerns about emerging inflation pressures fueled expectations that the Fed would continue to tighten monetary policy, dampening returns across the fixed-income market. |
| • | | Virginia experienced healthy economic growth, with low unemployment, favorable population trends and rising tax revenues. Still, the state’s municipal market lagged somewhat as its higher-quality nature was a headwind at a time in which lower-rated bonds outperformed. |
| • | | The Trust’s largest detractors were its positions in longer-dated, high-quality securities that were issued in the past two years. These bonds had longer call structures, which translated to higher durations and lower income than their lower-rated and/or shorter-call counterparts. (Duration is a measure of interest rate sensitivity; a call is when an issuer redeems a bond prior to its maturity date.) |
| • | | The Trust sought to manage interest rate risk using U.S. Treasury futures. Given that Treasury yields rose, as prices fell, this aspect of the Trust’s strategy had a positive effect on returns. |
| • | | Positions in the high-quality housing sector outperformed as a result of their short duration characteristics. Holdings in the non-investment grade tobacco sector also contributed due to their high income and strong price performance. |
| • | | The Trust’s weighting in high-yield bonds (those rated below investment grade) aided results given the outperformance of lower-quality issues. Conversely, positions in higher-quality securities detracted. |
| • | | The Trust’s use of leverage made a positive contribution to performance by enhancing income. However, the use of leverage also amplified the impact of falling prices. |
The views expressed reflect the opinions of BlackRock as of the date of this report and are subject to change based on changes in market, economic or other conditions. These views are not intended to be a forecast of future events and are no guarantee of future results.
| | |
| 20 | | 2018 BLACKROCK SEMI-ANNUAL REPORTTO SHAREHOLDERS |
| | |
| Trust Summary as of February 28, 2018 (continued) | | BlackRock Virginia Municipal Bond Trust |
Market Price and Net Asset Value Per Share Summary
| | | | | | | | | | | | | | | | | | | | |
| | | 02/28/18 | | | 08/31/17 | | | Change | | | High | | | Low | |
Market Price | | $ | 15.91 | | | $ | 18.68 | | | | (14.83 | )% | | $ | 19.27 | | | $ | 15.83 | |
Net Asset Value | | | 15.17 | | | | 15.75 | | | | (3.68 | ) | | | 15.79 | | | | 15.17 | |
Market Price and Net Asset Value History For the Past Five Years
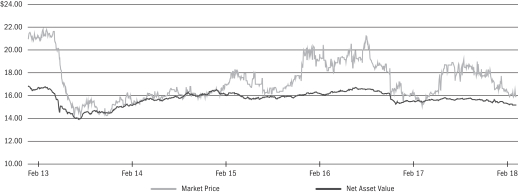
Overview of the Trust’s Total Investments*
SECTOR ALLOCATION
| | | | | | | | |
| Sector | | 02/28/18 | | | 08/31/17 | |
Health | | | 28 | % | | | 26 | % |
Education | | | 21 | | | | 25 | |
Transportation | | | 21 | | | | 19 | |
County/City/Special District/School District | | | 16 | | | | 15 | |
State | | | 5 | | | | 6 | |
Housing | | | 5 | | | | 2 | |
Tobacco | | | 3 | | | | 3 | |
Corporate | | | 1 | | | | 1 | |
Utilities | | | — | | | | 3 | |
For Trust compliance purposes, the Trust’s sector classifications refer to one or more of the sector sub-classifications used by one or more widely recognized market indexes or rating group indexes, and/or as defined by the investment adviser. These definitions may not apply for purposes of this report, which may combine such sector sub-classifications for reporting ease.
CALL/MATURITY SCHEDULE (c)
| | | | |
Calendar Year Ended December 31, | | | | |
2018 | | | 12 | % |
2019 | | | 13 | |
2020 | | | 14 | |
2021 | | | 6 | |
2022 | | | 9 | |
| | (c) | Scheduled maturity dates and/or bonds that are subject to potential calls by issuers over the next five years. | |
| | * | Excludes short-term securities. | |
CREDIT QUALITY ALLOCATION (a)
| | | | | | | | |
| Credit Rating | | 02/28/18 | | | 08/31/17 | |
AAA/Aaa | | | 14 | % | | | 15 | % |
AA/Aa | | | 46 | | | | 47 | |
A | | | 11 | | | | 12 | |
BBB/Baa | | | 6 | | | | 4 | |
BB/Ba | | | 2 | | | | 2 | |
B | | | 2 | | | | 2 | |
N/R(b) | | | 19 | | | | 18 | |
| | (a) | For financial reporting purposes, credit quality ratings shown above reflect the highest rating assigned by either S&P or Moody’s if ratings differ. These rating agencies are independent, nationally recognized statistical rating organizations and are widely used. Investment grade ratings are credit ratings of BBB/Baa or higher. Below investment grade ratings are credit ratings of BB/Ba or lower. Investments designated N/R are not rated by either rating agency. Unrated investments do not necessarily indicate low credit quality. Credit quality ratings are subject to change. | |
| | (b) | The investment adviser evaluates the credit quality of unrated investments based upon certain factors including, but not limited to, credit ratings for similar investments and financial analysis of sectors and individual investments. Using this approach, the investment adviser has deemed certain of these unrated securities as investment grade quality. As of February 28, 2018 and August 31, 2017, the market value of unrated securities deemed by the investment adviser to be investment grade represents 1% and 5%, respectively, of the Trust’s total investments. | |
| | |
Schedule of Investments (unaudited) February 28, 2018 | | BlackRock Maryland Municipal Bond Trust (BZM) (Percentages shown are based on Net Assets) |
| | | | | | | | |
| Security | | Par
(000) | | | Value | |
Municipal Bonds — 141.8% | |
|
| Maryland — 140.4% | |
| Corporate — 1.9% | |
Maryland EDC, Refunding RB: | | | | | | | | |
CNX Marine Terminals, Inc., 5.75%, 09/01/25 | | $ | 320 | | | $ | 335,200 | |
Potomac Electric Power Co., 6.20%, 09/01/22 | | | 250 | | | | 261,153 | |
| | | | | | | | |
| | | | | | | 596,353 | |
| County/City/Special District/School District — 16.0% | |
County of Anne Arundel Maryland Consolidated, Refunding, Special Tax, Villages of Dorchester and Farmington Project, 5.00%, 07/01/32 | | | 500 | | | | 555,670 | |
County of Anne Arundel Maryland Consolidated, RB, Special Taxing District, Villages at Two Rivers Project, 5.25%, 07/01/44 | | | 250 | | | | 251,597 | |
County of Frederick Maryland, RB, Jefferson Technology Park Project, Series B, 7.13%, 07/01/43(a) | | | 250 | | | | 269,480 | |
County of Howard Maryland, Tax Allocation Bonds: | | | | | | | | |
Annapolis Junction Town Center Project, 6.10%, 02/15/44 | | | 250 | | | | 256,117 | |
Downtown Columbia Project, Series A, 4.50%, 02/15/47(a) | | | 500 | | | | 504,650 | |
County of Prince George’s Maryland, Special Obligation, Remarketing, National Harbor Project, 5.20%, 07/01/34 | | | 1,398 | | | | 1,403,187 | |
State of Maryland, GO, State & Local Facilities Loan, 2nd Series B, 3.00%, 08/01/27 | | | 1,725 | | | | 1,747,891 | |
| | | | | | | | |
| | | | | | | 4,988,592 | |
| Education — 30.9% | |
County of Anne Arundel Maryland, Refunding RB, Maryland Economic Development, Anne Arundel Community College Project: | | | | | | | | |
4.00%, 09/01/27 | | | 510 | | | | 533,496 | |
3.25%, 09/01/28 | | | 360 | | | | 363,456 | |
Maryland EDC, Refunding RB: | | | | | | | | |
Towson University Project, 5.00%, 07/01/37 | | | 500 | | | | 530,800 | |
University of Maryland College Park Project (AGM), 5.00%, 06/01/43 | | | 1,350 | | | | 1,515,496 | |
University of Maryland Project, 5.00%, 07/01/39 | | | 500 | | | | 540,710 | |
University Village at Sheppard Pratt, 5.00%, 07/01/33 | | | 1,000 | | | | 1,052,350 | |
Maryland Health & Higher Educational Facilities Authority, RB, Trinity Health Credit Group, Series 2017, 5.00%, 12/01/46 | | | 250 | | | | 280,233 | |
Maryland Health & Higher Educational Facilities Authority, Refunding RB: | | | | | | | | |
Anne Arundel Health System, 4.00%, 07/01/39 | | | 100 | | | | 101,851 | |
Goucher College, Series A, 5.00%, 07/01/34 | | | 1,000 | | | | 1,093,800 | |
Goucher College, Series A, 4.00%, 07/01/37 | | | 500 | | | | 508,165 | |
Johns Hopkins University Project, Series A, 4.00%, 07/01/37 | | | 10 | | | | 10,337 | |
Loyola University Maryland, Series A, 5.00%, 10/01/39 | | | 900 | | | | 987,390 | |
Maryland Institute College, 4.00%, 06/01/42 | | | 500 | | | | 500,055 | |
Maryland Institute College of Art, 5.00%, 06/01/29 | | | 500 | | | | 546,945 | |
Notre Dame Maryland University, 5.00%, 10/01/42 | | | 1,000 | | | | 1,059,470 | |
| | | | | | | | |
| | | | | | | 9,624,554 | |
| Health — 46.2% | |
City of Gaithersburg Maryland, Refunding RB, Asbury Maryland Obligation, Series B, 6.00%, 01/01/23 | | | 250 | | | | 267,085 | |
City of Rockville Maryland, RB, Ingleside at King Farm Project, Series B, 5.00%, 11/01/42 | | | 500 | | | | 544,500 | |
County of Montgomery Maryland, RB, Trinity Health Credit Group, 5.00%, 12/01/45 | | | 750 | | | | 838,493 | |
County of Montgomery Maryland, Refunding RB, Trinity Health Credit Group, 5.00%, 12/01/40 | | | 1,000 | | | | 1,094,490 | |
Maryland Health & Higher Educational Facilities Authority, RB: | | | | | | | | |
Ascension Health Alliance, Series B, 5.00%, 11/15/51 | | | 1,000 | | | | 1,087,850 | |
University of Maryland Medical System Issue, 4.00%, 07/01/48 | | | 300 | | | | 296,862 | |
| | | | | | | | |
| Security | | Par
(000) | | | Value | |
| Health (continued) | |
Maryland Health & Higher Educational Facilities Authority, Refunding RB: | | | | | | | | |
Anne Arundel Health System, 5.00%, 07/01/19(b) | | $ | 1,000 | | | $ | 1,044,160 | |
Charlestown Community Project, 6.25%, 01/01/21(b) | | | 1,000 | | | | 1,121,060 | |
Charlestown Community, Series A, 5.00%, 01/01/45 | | | 500 | | | | 561,835 | |
Frederick Memorial Hospital, Series A, 4.00%, 07/01/38 | | | 1,250 | | | | 1,252,412 | |
Lifebridge Health Issue, 4.13%, 07/01/47 | | | 500 | | | | 509,650 | |
Medstar Health, Inc., 5.00%, 08/15/42 | | | 1,000 | | | | 1,092,490 | |
Meritus Medical Center Issue, 5.00%, 07/01/40 | | | 1,000 | | | | 1,065,560 | |
Peninsula Regional Medical Center, 5.00%, 07/01/45 | | | 700 | | | | 751,317 | |
University of Maryland, 5.00%, 07/01/35 | | | 200 | | | | 222,796 | |
University of Maryland, 4.00%, 07/01/41 | | | 500 | | | | 510,180 | |
University of Maryland Medical System, 5.13%, 07/01/19(b) | | | 1,000 | | | | 1,046,470 | |
University of Maryland Medical System, Series A, 5.00%, 07/01/43 | | | 1,000 | | | | 1,074,540 | |
| | | | | | | | |
| | | | | | | 14,381,750 | |
| Housing — 13.0% | |
County of Howard Maryland Housing Commission, RB, M/F Housing: | | | | | | | | |
Woodfield Oxford Square Apartments, 5.00%, 12/01/42 | | | 500 | | | | 555,350 | |
Columbia Commons Apartments, Series A, 5.00%, 06/01/44 | | | 550 | | | | 586,993 | |
Gateway Village Apartments, 4.00%, 06/01/46 | | | 500 | | | | 505,940 | |
Maryland Community Development Administration, HRB, M/F Housing, Series A, 4.05%, 07/01/42 | | | 1,220 | | | | 1,235,067 | |
Maryland Community Development Administration, RB: | | | | | | | | |
M/F Housing, 3.70%, 07/01/35 | | | 500 | | | | 501,545 | |
S/F Housing, Residential, Series A, 5.05%, 09/01/39 | | | 500 | | | | 509,910 | |
S/F Housing, Residential, Series B, 4.75%, 09/01/39 | | | 150 | | | | 151,189 | |
| | | | | | | | |
| | | | | | | 4,045,994 | |
| Transportation — 15.1% | |
Maryland Economic Development Corp., Refunding RB, Transportation Facilities Project, Series A, 5.00%, 06/01/35 | | | 100 | | | | 111,813 | |
Maryland EDC, RB(b): | | | | | | | | |
Term Project, Series B, 5.75%, 06/01/20 | | | 500 | | | | 545,490 | |
Transportation Facilities Project, Series A, 5.75%, 06/01/20 | | | 500 | | | | 545,490 | |
Maryland State Department of Transportation, RB, Consolidated, 4.00%, 05/15/19(b) | | | 1,000 | | | | 1,030,400 | |
Maryland State Transportation Authority, RB, Baltimore/Washington International Thurgood Marshall Airport Project, Series A, AMT, 4.00%, 06/01/29 | | | 1,925 | | | | 1,977,148 | |
Maryland State Transportation Authority, Refunding RB, Baltimore/Washington International Thurgood Marshall Airport Project, Series B, AMT, 5.00%, 03/01/23 | | | 445 | | | | 488,851 | |
| | | | | | | | |
| | | | | | | 4,699,192 | |
| Utilities — 17.3% | |
City of Annapolis Maryland Water & Sewer Revenue, Refunding RB, Series A, 3.38%, 08/01/40 | | | 780 | | | | 749,658 | |
City of Baltimore Maryland, RB: | | | | | | | | |
Wastewater Project, Series C, 5.00%, 07/01/38 | | | 1,000 | | | | 1,115,270 | |
Water Project, Series A, 5.00%, 07/01/43 | | | 1,000 | | | | 1,108,470 | |
City of Baltimore Maryland, Refunding RB: | | | | | | | | |
Convention Center Hotel, 5.00%, 09/01/46 | | | 750 | | | | 826,215 | |
East Baltimore Research Park, Series A, 5.00%, 09/01/38 | | | 250 | | | | 266,540 | |
City of Baltimore Maryland, Tax Allocation Bonds, Center/West Development, Series A, 5.50%, 06/01/43 | | | 250 | | | | 253,950 | |
County of Montgomery Maryland, RB, Water Quality Protection Charge, Series A: | | | | | | | | |
5.00%, 04/01/31 | | | 500 | | | | 532,520 | |
5.00%, 04/01/32 | | | 500 | | | | 532,205 | |
| | | | | | | | |
| | | | | | | 5,384,828 | |
| | |
| 22 | | 2018 BLACKROCK SEMI-ANNUAL REPORTTO SHAREHOLDERS |
| | |
Schedule of Investments (unaudited) (continued) February 28, 2018 | | BlackRock Maryland Municipal Bond Trust (BZM) (Percentages shown are based on Net Assets) |
| | | | | | | | |
| Security | | Par
(000) | | | Value | |
| Puerto Rico — 1.4% | | | | | | |
| Tobacco — 1.4% | |
Children’s Trust Fund, Refunding RB, Tobacco Settlement Asset-Backed Bonds, 5.63%, 05/15/43 | | $ | 450 | | | $ | 419,341 | |
| | | | | | | | |
Total Municipal Bonds — 141.8%
(Cost — $42,939,076) | | | | 44,140,604 | |
| | | | | | | | |
|
Municipal Bonds Transferred to Tender Option Bond Trusts(c) — 14.3% | |
|
| Maryland — 14.3% | |
| Transportation — 9.7% | |
State of Maryland Transportation Authority, RB, Transportation Facilities Project (AGM), 5.00%, 07/01/41 | | | 3,000 | | | | 3,034,125 | |
| | | | | | | | |
| Utilities — 4.6% | |
City of Baltimore Maryland, RB, Wastewater Project, Sub-Series A, 5.00%, 07/01/46 | | | 1,269 | | | | 1,430,005 | |
| | | | | | | | |
Total Municipal Bonds Transferred to Tender Option Bond Trusts — 14.3%
(Cost — $4,419,944) | | | | 4,464,130 | |
| | | | | | | | |
Total Long-Term Investments — 156.1%
(Cost — $47,359,020) | | | | 48,604,734 | |
| | | | | | | | |
| | | | | | | | |
| Security | |
Shares | | | Value | |
Short-Term Securities — 0.7% | |
BlackRock Liquidity Funds, MuniCash, Institutional Class,
0.94%(d)(e) | | | 233,990 | | | $ | 234,013 | |
| | | | | | | | |
Total Short-Term Securities — 0.7%
(Cost — $233,993) | | | | 234,013 | |
| | | | | | | | |
| |
Total Investments — 156.8%
(Cost — $47,593,013) | | | | 48,838,747 | |
Other Assets Less Liabilities — 1.2% | | | | 375,062 | |
Liability for TOB Trust Certificates, Including Interest Expense and Fees Payable — (6.9)% | | | | (2,138,653 | ) |
VRDP Shares at Liquidation Value, Net of Deferred Offering Costs — (51.1)% | | | | (15,935,834 | ) |
| | | | | | | | |
Net Assets Applicable to Common Shares — 100.0% | | | $ | 31,139,322 | |
| | | | | | | | |
| (a) | Security exempt from registration pursuant to Rule 144A under the Securities Act of 1933, as amended. These securities may be resold in transactions exempt from registration to qualified institutional investors. |
| (b) | U.S. Government securities, held in escrow, are used to pay interest on this security, as well as to retire the bond in full at the date indicated, typically at a premium to par. |
| (c) | Represent bonds transferred to a TOB Trust in exchange of cash and residual certificates received by the Trust. These bonds serve as collateral in a secured borrowing. See Note 4 of the Notes to Financial Statements for details. |
| (d) | Annualized 7-day yield as of period end. |
| (e) | During the period ended February 28, 2018, investments in issuers considered to be an affiliate of the Trust for purposes of Section 2(a)(3) of the Investment Company Act of 1940, as amended, were as follows: |
| | | | | | | | | | | | | | | | | | | | | | | | | | | | |
| Affiliated | | Shares
Held at
08/31/17 | | | Net
Activity | | | Shares
Held at
02/28/18 | | | Value at
02/28/18 | | | Income | | | Net Realized
Gain (Loss) (a) | | | Change in
Unrealized
Appreciation
(Depreciation) | |
BlackRock Liquidity Funds, MuniCash, Institutional Class | | | — | | | | 233,990 | | | | 233,990 | | | $ | 234,013 | | | $ | 587 | | | $ | 2 | | | $ | 20 | |
| | | | | | | | | | | | | | | | | | | | | | | | | | | | |
| | (a) | Includes net capital gain distributions, if applicable. | |
For Trust compliance purposes, the Trust’s sector classifications refer to one or more of the sector sub-classifications used by one or more widely recognized market indexes or rating group indexes, and/or as defined by the investment adviser. These definitions may not apply for purposes of this report, which may combine such sector sub-classifications for reporting ease.
Derivative Financial Instruments Outstanding as of Period End
Futures Contracts
| | | | | | | | | | | | | | | | |
| Description | | Number of
Contracts | | | Expiration
Date | | | Notional
Amount (000) | | | Value/
Unrealized
Appreciation
(Depreciation) | |
Short Contracts: | |
10-Year U.S. Treasury Note | | | 9 | | | | 06/20/18 | | | $ | 1,080 | | | $ | 843 | |
Long U.S. Treasury Bond | | | 11 | | | | 06/20/18 | | | | 1,578 | | | | (6,549 | ) |
5-Year U.S. Treasury Note | | | 4 | | | | 06/29/18 | | | | 456 | | | | 739 | |
| | | | | | | | | | | | | | | | |
| | | | | | $ | (4,967 | ) |
| | | | | | | | | | | | | | | | |
| | | | |
| SCHEDULES OF INVESTMENTS | | | 23 | |
| | |
Schedule of Investments (unaudited) (continued) February 28, 2018 | | BlackRock Maryland Municipal Bond Trust (BZM) |
Derivative Financial Instruments Categorized by Risk Exposure
As of period end, the fair values of derivative financial instruments located in the Statements of Assets and Liabilities were as follows:
| | | | | | | | | | | | | | | | | | | | | | | | | | | | | | | | |
| | | | Commodity
Contracts | | | Credit
Contracts | | | Equity
Contracts | | | Foreign
Currency
Exchange
Contracts | | �� | Interest
Rate
Contracts | | | Other
Contracts | | | Total | |
Assets — Derivative Financial Instruments | | | | | | | | | | | | | | | | | | | | | | | | | | | | | |
Futures contracts | | | | | | | | | | | | | | | | | | | | | | | | | | | | | | | | |
Net unrealized appreciation(a) | | | | | | $ | — | | | $ | — | | | $ | — | | | $ | — | | | $ | 1,582 | | | $ | — | | | $ | 1,582 | |
| | | | | | | | | | | | | | | | | | | | | | | | | | | | | | | | |
| Liabilities — Derivative Financial Instruments | | | | | | | | | | | | | | | | | | | | | | |
Futures contracts | | | | | | | | | | | | | | | | | | | | | | | | | | | | | | | | |
Net unrealized depreciation(a) | | | | | | $ | — | | | $ | — | | | $ | — | | | $ | — | | | $ | 6,549 | | | $ | — | | | $ | 6,549 | |
| | | | | | | | | | | | | | | | | | | | | | | | | | | | | | | | |
| | (a) | Includes cumulative appreciation (depreciation) on futures contracts, if any, as reported in the Schedule of Investments. Only current day’s variation margin is reported within the Statements of Assets and Liabilities. | |
For the six months ended February 28, 2018, the effect of derivative financial instruments in the Statements of Operations was as follows:
| | | | | | | | | | | | | | | | | | | | | | | | | | | | |
| | | Commodity
Contracts | | | Credit
Contracts | | | Equity
Contracts | | | Foreign
Currency
Exchange
Contracts | | | Interest
Rate
Contracts | | | Other
Contracts | | | Total | |
Net Realized Gain (Loss) from: | | | | | | | | | | | | | | | | | | | | | | | | | | | | |
Futures contracts | | $ | — | | | $ | — | | | $ | — | | | $ | — | | | $ | 196,398 | | | $ | — | | | $ | 196,398 | |
| | | | | | | | | | | | | | | | | | | | | | | | | | | | |
Net Change in Unrealized Appreciation (Depreciation) on: | |
Futures contracts | | $ | — | | | $ | — | | | $ | — | | | $ | — | | | $ | 7,386 | | | $ | — | | | $ | 7,386 | |
| | | | | | | | | | | | | | | | | | | | | | | | | | | | |
Average Quarterly Balances of Outstanding Derivative Financial Instruments
| | | | |
Futures contracts: | | | | |
Average notional value of contracts — short | | $ | 2,475,227 | |
For more information about the Trust’s investment risks regarding derivative financial instruments, refer to the Notes to Financial Statements.
Fair Value Hierarchy as of Period End
Various inputs are used in determining the fair value of investments and derivative financial instruments. For information about the Trust’s policy regarding valuation of investments and derivative financial instruments, refer to the Notes to Financial Statements.
The following tables summarize the Trust’s investments and derivative financial instruments categorized in the disclosure hierarchy:
| | | | | | | | | | | | | | | | |
| | | Level 1 | | | Level 2 | | | Level 3 | | | Total | |
Assets: | |
Investments: | |
Long-Term Investments(a) | | $ | — | | | $ | 48,604,734 | | | $ | — | | | $ | 48,604,734 | |
Short-Term Securities | | | 234,013 | | | | — | | | | — | | | | 234,013 | |
| | | | | | | | | | | | | | | | |
| | $ | 234,013 | | | $ | 48,604,734 | | | $ | — | | | $ | 48,838,747 | |
| | | | | | | | | | | | | | | | |
Derivative Financial Instruments(b) | |
Assets: | |
Interest rate contracts | | $ | 1,582 | | | $ | — | | | $ | — | | | $ | 1,582 | |
Liabilities: | |
Interest rate contracts | | | (6,549 | ) | | | — | | | | — | | | | (6,549 | ) |
| | | | | | | | | | | | | | | | |
| | $ | (4,967 | ) | | $ | — | | | $ | — | | | $ | (4,967 | ) |
| | | | | | | | | | | | | | | | |
| | (a) | See above Schedule of Investments for values in each sector. | |
| | (b) | Derivative financial instruments are futures contracts which are valued at the unrealized appreciation (depreciation) on the instrument. | |
| | |
| 24 | | 2018 BLACKROCK SEMI-ANNUAL REPORTTO SHAREHOLDERS |
| | |
Schedule of Investments (unaudited) (continued) February 28, 2018 | | BlackRock Maryland Municipal Bond Trust (BZM) |
The Trust may hold assets and/or liabilities in which the fair value approximates the carrying amount for financial statement purposes. As of period end, such assets and/or liabilities are categorized within the disclosure hierarchy as follows:
| | | | | | | | | | | | | | | | |
| | | Level 1 | | | Level 2 | | | Level 3 | | | Total | |
Liabilities: | |
TOB Trust Certificates | | $ | — | | | $ | (2,134,375 | ) | | $ | — | | | $ | (2,134,375 | ) |
VRDP Shares at Liquidation Value | | | — | | | | (16,000,000 | ) | | | — | | | | (16,000,000 | ) |
| | | | | | | | | | | | | | | | |
| | $ | — | | | $ | (18,134,375 | ) | | $ | — | | | $ | (18,134,375 | ) |
| | | | | | | | | | | | | | | | |
During the six months ended February 28, 2018, there were no transfers between levels.
See notes to financial statements.
| | | | |
| SCHEDULES OF INVESTMENTS | | | 25 | |
| | |
Schedule of Investments (unaudited) February 28, 2018 | | BlackRock Massachusetts Tax-Exempt Trust (MHE) (Percentages shown are based on Net Assets) |
| | | | | | | | |
| Security | | Par
(000) | | | Value | |
Municipal Bonds — 151.6% | |
|
| Massachusetts — 149.9% | |
| County/City/Special District/School District — 3.5% | |
Town of Holyoke Massachusetts, GO, Refunding, 5.00%, 09/01/26 | | $ | 1,000 | | | $ | 1,124,750 | |
| | | | | | | | |
| Education — 64.9% | |
Massachusetts Development Finance Agency, RB: | | | | | | | | |
Emerson College Issue, Series A, 5.25%, 01/01/42 | | | 500 | | | | 561,105 | |
Foxborough Regional Charter School, Series A, 7.00%, 07/01/20(a) | | | 250 | | | | 280,020 | |
Lesley University, Series A, 5.00%, 07/01/35 | | | 300 | | | | 333,273 | |
Lesley University, Series A, 5.00%, 07/01/37 | | | 225 | | | | 248,265 | |
Merrimack College, 5.00%, 07/01/47 | | | 550 | | | | 591,839 | |
Mount Holyoke College, Series B, 5.00%, 07/01/41 | | | 500 | | | | 542,860 | |
UMass Boston Student Housing Project, 5.00%, 10/01/48 | | | 1,000 | | | | 1,082,570 | |
Wellesley College, Series J, 5.00%, 07/01/42 | | | 1,950 | | | | 2,155,608 | |
Wentworth Institute Technology, 5.00%, 10/01/46 | | | 500 | | | | 545,865 | |
WGBH Educational Foundation, Series A (AMBAC), 5.75%, 01/01/42 | | | 650 | | | | 856,615 | |
Massachusetts Development Finance Agency, Refunding RB: | | | | | | | | |
Boston University, Series P, 5.45%, 05/15/59 | | | 1,500 | | | | 1,768,620 | |
Emerson College, 5.00%, 01/01/41 | | | 500 | | | | 543,610 | |
Emerson College, Series A, 5.00%, 01/01/20(a) | | | 185 | | | | 196,507 | |
Emerson College, Series A, 5.00%, 01/01/40 | | | 500 | | | | 557,500 | |
Emerson College, Series A, 5.00%, 01/01/40 | | | 15 | | | | 15,408 | |
Emmanuel College Issue, Series A, 5.00%, 10/01/35 | | | 250 | | | | 273,700 | |
Foxborough Regional Charter School Issue, 5.00%, 07/01/37 | | | 150 | | | | 160,011 | |
Harvard University, Series A, 5.50%, 11/15/18(a) | | | 75 | | | | 77,211 | |
International Charter School, 5.00%, 04/15/40 | | | 1,000 | | | | 1,059,470 | |
Suffolk University, 4.00%, 07/01/39 | | | 500 | | | | 503,080 | |
Trustees of Deerfield Academy, 5.00%, 10/01/40 | | | 1,675 | | | | 1,804,695 | |
Wheelock College, Series C, 5.25%, 10/01/37 | | | 1,000 | | | | 1,000,000 | |
Massachusetts Educational Financing Authority, RB, Education Loan, Issue I, AMT, 5.00%, 01/01/27 | | | 1,000 | | | | 1,102,520 | |
Massachusetts Educational Financing Authority, Refunding RB, Issue J, AMT, 3.50%, 07/01/33 | | | 235 | | | | 226,063 | |
Massachusetts Health & Educational Facilities Authority, RB: | | | | | | | | |
Berklee College of Music, Inc., Series A, 5.00%, 10/01/37 | | | 70 | | | | 70,209 | |
Northeastern University, Series R, 5.00%, 10/01/33 | | | 225 | | | | 229,309 | |
Tufts University, Series O, 5.38%, 08/15/18(a) | | | 1,000 | | | | 1,018,470 | |
Massachusetts Health & Educational Facilities Authority, Refunding RB: | | | | | | | | |
Northeastern University, Series T-2, 5.00%, 10/01/32 | | | 500 | | | | 555,145 | |
Springfield College, 5.63%, 10/15/19(a) | | | 500 | | | | 532,700 | |
Tufts University, Series M, 5.50%, 02/15/27 | | | 1,000 | | | | 1,230,290 | |
University of Massachusetts Building Authority, RB, Senior-Series 2, 5.00%, 11/01/39 | | | 500 | | | | 553,990 | |
| | | | | | | | |
| | | | | | | 20,676,528 | |
| Health — 25.4% | |
Massachusetts Development Finance Agency, RB, Seven Hills Foundation Obligated Group, Series A, 5.00%, 09/01/35 | | | 750 | | | | 793,500 | |
Massachusetts Development Finance Agency, Refunding RB: | | | | | | | | |
Boston Medical Center, Series E, 4.00%, 07/01/38 | | | 500 | | | | 502,090 | |
Carleton-Willard Village, 5.63%, 12/01/30 | | | 500 | | | | 526,705 | |
New Bridge Charles, Inc., 4.13%, 10/01/42(b) | | | 550 | | | | 527,401 | |
Partners Healthcare, 5.00%, 07/01/21(a) | | | 995 | | | | 1,096,440 | |
Partners Healthcare, 5.00%, 07/01/36 | | | 5 | | | | 5,380 | |
Umass Memorial Healthcare, 5.00%, 07/01/44 | | | 300 | | | | 327,306 | |
Massachusetts Health & Educational Facilities Authority, RB: | | | | | | | | |
Cape Cod Healthcare Obligated Group, Series D (AGC), 5.00%, 11/15/19(a) | | | 1,000 | | | | 1,057,210 | |
| | | | | | | | |
| Security | | Par
(000) | | | Value | |
| Health (continued) | |
Massachusetts Health & Educational Facilities Authority, RB (continued): | | | | | | | | |
Caregroup, Series E-1, 5.00%, 07/01/18(a) | | $ | 500 | | | $ | 506,035 | |
Children’s Hospital, Series M, 5.25%, 12/01/39 | | | 600 | | | | 637,680 | |
Children’s Hospital, Series M, 5.50%, 12/01/39 | | | 500 | | | | 533,545 | |
Southcoast Health Obligation Group, Series D, 5.00%, 07/01/39 | | | 500 | | | | 516,575 | |
Massachusetts Health & Educational Facilities Authority, Refunding RB, Winchester Hospital, Series H, 5.25%, 07/01/38 | | | 1,000 | | | | 1,061,490 | |
| | | | | | | | |
| | | | | | | 8,091,357 | |
| Housing — 7.8% | |
Massachusetts HFA, RB, M/F Housing, Series A (FHA), 5.25%, 12/01/35 | | | 185 | | | | 196,252 | |
Massachusetts HFA, Refunding RB, AMT: | | | | | | | | |
Series A, 4.50%, 12/01/47 | | | 500 | | | | 517,305 | |
Series C, 5.00%, 12/01/30 | | | 195 | | | | 199,399 | |
Series C, 5.35%, 12/01/42 | | | 795 | | | | 814,605 | |
Series F, 5.70%, 06/01/40 | | | 745 | | | | 755,281 | |
| | | | | | | | |
| | | | | | | 2,482,842 | |
| State — 23.1% | |
Commonwealth of Massachusetts, GO, Series C, 5.00%, 07/01/45 | | | 1,000 | | | | 1,130,690 | |
Massachusetts Bay Transportation Authority, Refunding RB, Senior Series A, 5.25%, 07/01/29 | | | 730 | | | | 900,199 | |
Massachusetts School Building Authority, RB: | | | | | | | | |
Dedicated Sales Tax, Senior Series A, 5.00%, 05/15/43 | | | 500 | | | | 556,220 | |
Series B, 5.00%, 10/15/41 | | | 1,000 | | | | 1,092,140 | |
Massachusetts State College Building Authority, RB, Series A, 5.50%, 05/01/19(a) | | | 2,500 | | | | 2,616,675 | |
Massachusetts State College Building Authority, Refunding RB, Series B (Syncora), 5.50%, 05/01/39 | | | 825 | | | | 1,070,413 | |
| | | | | | | | |
| | | | | | | 7,366,337 | |
| Transportation — 25.2% | |
Commonwealth of Massachusetts, RB, Series A, 5.00%, 06/15/22(a) | | | 1,000 | | | | 1,127,880 | |
Commonwealth of Massachusetts, Refunding RB, Series A, 5.00%, 06/01/21(a) | | | 500 | | | | 551,565 | |
Massachusetts Department of Transportation, Refunding RB, Senior Series B: | | | | | | | | |
5.00%, 01/01/32 | | | 1,120 | | | | 1,180,480 | |
5.00%, 01/01/37 | | | 1,000 | | | | 1,050,860 | |
Massachusetts Port Authority, RB, AMT: | | | | | | | | |
Series A, 5.00%, 07/01/42 | | | 1,000 | | | | 1,091,660 | |
Series B, 5.00%, 07/01/45 | | | 1,750 | | | | 1,923,092 | |
Metropolitan Boston Transit Parking Corp., Refunding RB, 5.25%, 07/01/36 | | | 1,000 | | | | 1,097,400 | |
| | | | | | | | |
| | | | | | | 8,022,937 | |
| Puerto Rico — 1.7% | |
Children’s Trust Fund, Refunding RB, Tobacco Settlement Asset-Backed Bonds: | | | | | | | | |
5.50%, 05/15/39 | | | 95 | | | | 89,334 | |
5.63%, 05/15/43 | | | 470 | | | | 437,979 | |
| | | | | | | | |
| | | | | | | 527,313 | |
| | | | | | | | |
Total Municipal Bonds — 151.6%
(Cost — $45,536,358) | | | | 48,292,064 | |
| | | | | | | | |
| | |
| 26 | | 2018 BLACKROCK SEMI-ANNUAL REPORTTO SHAREHOLDERS |
| | |
Schedule of Investments (unaudited) (continued) February 28, 2018 | | BlackRock Massachusetts Tax-Exempt Trust (MHE) (Percentages shown are based on Net Assets) |
| | | | | | | | |
| Security | | Par
(000) | | | Value | |
Municipal Bonds Transferred to Tender Option Bond Trusts(c) — 8.1% | |
|
| Massachusetts — 8.1% | |
| Health — 1.4% | |
Massachusetts Development Finance Agency, Refunding RB, Partners Healthcare System, 4.00%, 07/01/35 | | $ | 430 | | | $ | 443,038 | |
| | | | | | | | |
| State — 6.7% | |
Commonwealth of Massachusetts, GO: | | | | | | | | |
Series A, 5.00%, 03/01/46 | | | 1,001 | | | | 1,119,770 | |
Series G, 4.00%, 09/01/42 | | | 1,005 | | | | 1,029,013 | |
| | | | | | | | |
| | | | | | | 2,148,783 | |
| | | | | | | | |
Total Municipal Bonds Transferred to Tender Option Bond Trusts — 8.1%
(Cost — $2,667,754) | | | | 2,591,821 | |
| | | | | | | | |
Total Long-Term Investments — 159.7%
(Cost — $48,204,112) | | | | 50,883,885 | |
| | | | | | | | |
| | | | | | | | |
| Security | |
Shares | | | Value | |
Short-Term Securities — 0.6% | |
BlackRock Liquidity Funds, MuniCash, Institutional Class,
0.94%(d)(e) | | | 172,539 | | | $ | 172,556 | |
| | | | | | | | |
Total Short-Term Securities — 0.6%
(Cost — $172,547) | | | | 172,556 | |
| | | | | | | | |
| |
Total Investments — 160.3%
(Cost — $48,376,659) | | | | 51,056,441 | |
Other Assets Less Liabilities — 2.7% | | | | 866,966 | |
Liability for TOB Trust Certificates, Including Interest Expense and Fees Payable — (5.2)% | | | | (1,643,875 | ) |
VRDP Shares at Liquidation Value, Net of Deferred Offering
Costs — (57.8)% | | | | (18,426,095 | ) |
| | | | | | | | |
Net Assets Applicable to Common Shares — 100.0% | | | $ | 31,853,437 | |
| | | | | | | | |
| (a) | U.S. Government securities, held in escrow, are used to pay interest on this security, as well as to retire the bond in full at the date indicated, typically at a premium to par. |
| (b) | Security exempt from registration pursuant to Rule 144A under the Securities Act of 1933, as amended. These securities may be resold in transactions exempt from registration to qualified institutional investors. |
| (c) | Represent bonds transferred to a TOB Trust in exchange of cash and residual certificates received by the Trust. These bonds serve as collateral in a secured borrowing. See Note 4 of the Notes to Financial Statements for details. |
| (d) | Annualized 7-day yield as of period end. |
| (e) | During the period ended February 28, 2018, investments in issuers considered to be an affiliate of the Trust for purposes of Section 2(a)(3) of the Investment Company Act of 1940, as amended, were as follows: |
| | | | | | | | | | | | | | | | | | | | | | | | | | | | |
| Affiliated | | Shares
Held at
08/31/17 | | | Net
Activity | | | Shares
Held at
02/28/18 | | | Value at
02/28/18 | | | Income | | | Net
Realized
Gain (Loss) (a) | | | Change in
Unrealized
Appreciation
(Depreciation) | |
BlackRock Liquidity Funds, MuniCash, Institutional Class | | | 844,109 | | | | (671,570 | ) | | | 172,539 | | | $ | 172,556 | | | $ | 948 | | | $ | (87 | ) | | $ | 48 | |
| | | | | | | | | | | | | | | | | | | | | | | | |
| | (a) | Includes net capital gain distributions, if applicable. | |
For Trust compliance purposes, the Trust’s sector classifications refer to one or more of the sector sub-classifications used by one or more widely recognized market indexes or rating group indexes, and/or as defined by the investment adviser. These definitions may not apply for purposes of this report, which may combine such sector sub-classifications for reporting ease.
Derivative Financial Instruments Outstanding as of Period End
Futures Contracts
| | | | | | | | | | | | | | | | |
| Description | | Number of
Contracts | | | Expiration
Date | | | Notional
Amount (000) | | | Value/
Unrealized
Appreciation
(Depreciation) | |
Short Contracts: | | | | | | | | | | | | | | | | |
10-Year U.S. Treasury Note | | | 9 | | | | 06/20/18 | | | $ | 1,080 | | | $ | 843 | |
Long U.S. Treasury Bond | | | 12 | | | | 06/20/18 | | | | 1,721 | | | | (7,144 | ) |
5-Year U.S. Treasury Note | | | 4 | | | | 06/29/18 | | | | 456 | | | | 658 | |
| | | | | | | | | | | | | | | | |
| | | | | | | | | | | | | | $ | (5,643 | ) |
| | | | | | | | | | | | | | | | |
| | | | |
| SCHEDULES OF INVESTMENTS | | | 27 | |
| | |
Schedule of Investments (unaudited) (continued) February 28, 2018 | | BlackRock Massachusetts Tax-Exempt Trust (MHE) |
Derivative Financial Instruments Categorized by Risk Exposure
As of period end, the fair values of derivative financial instruments located in the Statements of Assets and Liabilities were as follows:
| | | | | | | | | | | | | | | | | | | | | | | | | | | | |
| | | Commodity
Contracts | | | Credit
Contracts | | | Equity
Contracts | | | Foreign
Currency
Exchange
Contracts | | | Interest
Rate
Contracts | | | Other
Contracts | | | Total | |
Assets — Derivative Financial Instruments | | | | | | | | | | | | | | | | | | | | | | | | | | | | |
Futures contracts | | | | | | | | | | | | | | | | | | | | | | | | | | | | |
Net unrealized appreciation(a) | | $ | — | | | $ | — | | | $ | — | | | $ | — | | | $ | 1,501 | | | $ | — | | | $ | 1,501 | |
| | | | | | | | | | | | | | | | | | | | | | | | | | | | |
Liabilities — Derivative Financial Instruments | | | | | | | | | | | | | | | | | | | | | | | | | | | | |
Futures contracts | | | | | | | | | | | | | | | | | | | | | | | | | | | | |
Net unrealized depreciation(a) | | $ | — | | | $ | — | | | $ | — | | | $ | — | | | $ | 7,144 | | | $ | — | | | $ | 7,144 | |
| | | | | | | | | | | | | | | | | | | | | | | | | | | | |
| | (a) | Includes cumulative appreciation (depreciation) on futures contracts, if any, as reported in the Schedule of Investments. Only current day’s variation margin is reported within the Statements of Assets and Liabilities. | |
For the six months ended February 28, 2018, the effect of derivative financial instruments in the Statements of Operations was as follows:
| | | | | | | | | | | | | | | | | | | | | | | | | | | | |
| | | Commodity
Contracts | | | Credit
Contracts | | | Equity
Contracts | | | Foreign
Currency
Exchange
Contracts | | | Interest
Rate
Contracts | | | Other
Contracts | | | Total | |
Net Realized Gain (Loss) from: | | | | | | | | | | | | | | | | | | | | | | | | | | | | |
Futures contracts | | $ | — | | | $ | — | | | $ | — | | | $ | — | | | $ | 196,782 | | | $ | — | | | $ | 196,782 | |
| | | | | | | | | | | | | | | | | | | | | | | | | | | | |
| Net Change in Unrealized Appreciation (Depreciation) on: | |
Futures contracts | | $ | — | | | $ | — | | | $ | — | | | $ | — | | | $ | 6,826 | | | $ | — | | | $ | 6,826 | |
| | | | | | | | | | | | | | | | | | | | | | | | | | | | |
Average Quarterly Balances of Outstanding Derivative Financial Instruments
| | | | |
Futures contracts | | | | |
Average notional value of contracts — short | | $ | 2,546,946 | |
For more information about the Trust’s investment risks regarding derivative financial instruments, refer to the Notes to Financial Statements.
Fair Value Hierarchy as of Period End
Various inputs are used in determining the fair value of investments and derivative financial instruments. For information about the Trust’s policy regarding valuation of investments and derivative financial instruments, refer to the Notes to Financial Statements.
The following tables summarize the Trust’s investments and derivative financial instruments categorized in the disclosure hierarchy:
| | | | | | | | | | | | | | | | |
| | | Level 1 | | | Level 2 | | | Level 3 | | | Total | |
Assets: | |
Investments: | |
Long-Term Investments(a) | | $ | — | | | $ | 50,883,885 | | | $ | — | | | $ | 50,883,885 | |
Short-Term Securities | | | 172,556 | | | | — | | | | — | | | | 172,556 | |
| | | | | | | | | | | | | | | | |
| | $ | 172,556 | | | $ | 50,883,885 | | | $ | — | | | $ | 51,056,441 | |
| | | | | | | | | | | | | | | | |
Derivative Financial Instruments(b) | |
Assets: | |
Interest rate contracts | | $ | 1,501 | | | $ | — | | | $ | — | | | $ | 1,501 | |
Liabilities: | |
Interest rate contracts | | | (7,144 | ) | | | — | | | | — | | | | (7,144 | ) |
| | | | | | | | | | | | | | | | |
| | $ | (5,643 | ) | | $ | — | | | $ | — | | | $ | (5,643 | ) |
| | | | | | | | | | | | | | | | |
| | (a) | See above Schedule of Investments for values in each state. | |
| | (b) | Derivative financial instruments are futures contracts which are valued at the unrealized appreciation (depreciation) on the instrument. | |
| | |
| 28 | | 2018 BLACKROCK SEMI-ANNUAL REPORTTO SHAREHOLDERS |
| | |
Schedule of Investments (unaudited) (continued) February 28, 2018 | | BlackRock Massachusetts Tax-Exempt Trust (MHE) |
The Trust may hold assets and/or liabilities in which the fair value approximates the carrying amount for financial statement purposes. As of period end, such assets and/or liabilities are categorized within the disclosure hierarchy as follows:
| | | | | | | | | | | | | | | | |
| | | Level 1 | | | Level 2 | | | Level 3 | | | Total | |
Liabilities: | |
TOB Trust Certificates | | $ | — | | | $ | (1,635,858 | ) | | $ | — | | | $ | (1,635,858 | ) |
VRDP Shares at Liquidation Value | | | — | | | | (18,500,000 | ) | | | — | | | | (18,500,000 | ) |
| | | | | | | | | | | | | | | | |
| | $ | — | | | $ | (20,135,858 | ) | | $ | — | | | $ | (20,135,858 | ) |
| | | | | | | | | | | | | | | | |
During the six months ended February 28, 2018, there were no transfers between levels.
See notes to financial statements.
| | | | |
| SCHEDULES OF INVESTMENTS | | | 29 | |
| | |
Schedule of Investments (unaudited) February 28, 2018 | | BlackRock MuniHoldings New York Quality Fund, Inc. (MHN) (Percentages shown are based on Net Assets) |
| | | | | | | | |
| Security | | Par
(000) | | | Value | |
Municipal Bonds — 137.0% | |
|
| New York — 136.7% | |
| Corporate — 2.8% | |
City of New York New York Industrial Development Agency, Refunding RB, Transportation Infrastructure Properties LLC, Series A, AMT, 5.00%, 07/01/28 | | $ | 820 | | | $ | 879,212 | |
County of Onondaga New York Industrial Development Agency, RB, Bristol-Meyers Squibb Co. Project, AMT, 5.75%, 03/01/24 | | | 2,250 | | | | 2,656,283 | |
New York Liberty Development Corp., Refunding RB, Goldman Sachs Headquarters, 5.25%, 10/01/35 | | | 7,250 | | | | 8,905,102 | |
| | | | | | | | |
| | | | | | | 12,440,597 | |
| County/City/Special District/School District — 20.6% | |
City of New York New York, GO, Refunding, Series E: | | | | | | | | |
5.50%, 08/01/25 | | | 2,710 | | | | 3,156,527 | |
5.00%, 08/01/30 | | | 2,000 | | | | 2,235,700 | |
City of New York New York, GO: | | | | | | | | |
Series A-1, 5.00%, 08/01/35 | | | 2,350 | | | | 2,571,722 | |
Sub-Series D-1, 5.00%, 10/01/33 | | | 4,175 | | | | 4,576,844 | |
Sub-Series D-1, Fiscal 2014, 5.00%, 08/01/31 | | | 945 | | | | 1,065,951 | |
Refunding, Fiscal 2012, Series I, 5.00%, 08/01/32 | | | 490 | | | | 542,827 | |
Refunding, Fiscal 2014, Series E, 5.00%, 08/01/32 | | | 2,000 | | | | 2,248,440 | |
City of New York New York Convention Center Development Corp., RB, CAB, Sub Lien, Hotel Unit Fee, Series B(a): | | | | | | | | |
0.00%, 11/15/46 | | | 3,000 | | | | 907,350 | |
(AGM), 0.00%, 11/15/55 | | | 2,485 | | | | 505,250 | |
(AGM), 0.00%, 11/15/56 | | | 3,765 | | | | 731,050 | |
City of New York New York Convention Center Development Corp., Refunding RB, Hotel Unit Fee Secured: | | | | | | | | |
5.00%, 11/15/40 | | | 6,150 | | | | 6,913,584 | |
5.00%, 11/15/45 | | | 12,215 | | | | 13,669,562 | |
City of New York New York Industrial Development Agency, RB, PILOT: | | | | | | | | |
CAB, Yankee Stadium Project, Series A (AGC), 0.00%, 03/01/39(a) | | | 1,380 | | | | 602,025 | |
Queens Baseball Stadium (AGC), 6.38%, 01/01/39 | | | 800 | | | | 830,416 | |
Queens Baseball Stadium (AMBAC), 5.00%, 01/01/31 | | | 3,500 | | | | 3,509,135 | |
Queens Baseball Stadium (AMBAC), 5.00%, 01/01/36 | | | 6,150 | | | | 6,198,585 | |
Yankee Stadium Project (NPFGC), 5.00%, 03/01/36 | | | 2,200 | | | | 2,214,388 | |
Yankee Stadium Project (NPFGC), 5.00%, 03/01/46 | | | 9,500 | | | | 9,553,770 | |
Counties of Buffalo & Erie New York Industrial Development Agency, RB, City School District of Buffalo Project, Series A, 5.25%, 05/01/31 | | | 1,000 | | | | 1,101,400 | |
Counties of Buffalo & Erie New York Industrial Development Agency, Refunding RB, City School District of Buffalo Project, 5.00%, 05/01/28 | | | 1,685 | | | | 1,978,375 | |
County of Erie New York Fiscal Stability Authority, RB, Sales Tax and State Aid Secured Refunding Bonds, Series D: | | | | | | | | |
5.00%, 09/01/35 | | | 275 | | | | 321,151 | |
5.00%, 09/01/36 | | | 245 | | | | 285,454 | |
5.00%, 09/01/37 | | | 275 | | | | 319,666 | |
5.00%, 09/01/38 | | | 420 | | | | 487,465 | |
5.00%, 09/01/39 | | | 335 | | | | 388,211 | |
County of Nassau New York, GO: | | | | | | | | |
Series A, 5.00%, 01/15/31 | | | 1,400 | | | | 1,600,172 | |
Series B, 5.00%, 10/01/30 | | | 70 | | | | 80,235 | |
Refunding Series B, 5.00%, 04/01/32 | | | 1,980 | | | | 2,262,229 | |
Hudson Yards Infrastructure Corp., Refunding RB, Series A: | | | | | | | | |
2nd Indenture, 5.00%, 02/15/45 | | | 3,200 | | | | 3,605,440 | |
Fiscal 2017, 5.00%, 02/15/42 | | | 4,145 | | | | 4,683,850 | |
5.00%, 02/15/37 | | | 515 | | | | 586,230 | |
| | | | | | | | |
| Security | | Par
(000) | | | Value | |
| County/City/Special District/School District (continued) | |
New York Liberty Development Corp., Refunding RB, World Trade Center Project: | | | | | | | | |
4, 5.00%, 11/15/31 | | $ | 1,710 | | | $ | 1,881,872 | |
4, 5.00%, 11/15/44 | | | 4,000 | | | | 4,355,840 | |
7 Class 1, 4.00%, 09/15/35 | | | 885 | | | | 926,294 | |
New York Liberty Development Corp., Refunding RB, World Trade Center Project (continued): | | | | | | | | |
7 Class 2, 5.00%, 09/15/43 | | | 3,430 | | | | 3,731,085 | |
5.75%, 11/15/51 | | | 1,755 | | | | 1,972,655 | |
| | | | | | | | |
| | | | | | | 92,600,750 | |
| Education — 25.2% | |
Albany Capital Resource Corp., Refunding RB, Albany College of Pharmacy and Health Sciences, Series A: | | | | | | | | |
5.00%, 12/01/30 | | | 250 | | | | 275,348 | |
5.00%, 12/01/32 | | | 100 | | | | 109,569 | |
Amherst Development Corp., Refunding RB, University at Buffalo Foundation Faculty-Student Housing Corp., Series A (AGM), 4.63%, 10/01/20(b) | | | 4,975 | | | | 5,351,259 | |
Build NYC Resource Corp., Refunding RB: | | | | | | | | |
City University Queens College, Series A, 5.00%, 06/01/43 | | | 450 | | | | 501,719 | |
Manhattan College Project, 4.00%, 08/01/42 | | | 525 | | | | 533,232 | |
Manhattan College Project, 5.00%, 08/01/47 | | | 505 | | | | 561,868 | |
City of Albany New York Capital Resource Corp., Refunding RB, Albany College of Pharmacy and Health Sciences, Series A, 4.00%, 12/01/34 | | | 110 | | | | 110,641 | |
City of New York New York Trust for Cultural Resources, Refunding RB, Series A: | | | | | | | | |
American Museum of Natural History, 5.00%, 07/01/37 | | | 1,775 | | | | 2,003,318 | |
American Museum of Natural History, 5.00%, 07/01/41 | | | 750 | | | | 844,155 | |
Carnegie Hall, 4.75%, 12/01/39 | | | 3,150 | | | | 3,290,711 | |
Carnegie Hall, 5.00%, 12/01/39 | | | 1,850 | | | | 1,943,795 | |
Wildlife Conservation Society, 5.00%, 08/01/42 | | | 2,840 | | | | 3,151,775 | |
City of Troy New York Capital Resource Corp., Refunding RB, Rensselaer Polytechnic Institute Project, Series A, 5.13%, 09/01/40 | | | 5,535 | | | | 5,840,587 | |
Counties of Buffalo & Erie New York Industrial Land Development Corp., Refunding RB, Buffalo State College Foundation Housing Corp. Project, Series A, 5.38%, 10/01/41 | | | 1,000 | | | | 1,095,610 | |
County of Dutchess New York Local Development Corp., Refunding RB, Vassar College Project: | | | | | | | | |
5.00%, 07/01/42 | | | 985 | | | | 1,121,885 | |
4.00%, 07/01/46 | | | 1,865 | | | | 1,914,665 | |
County of Madison New York Capital Resource Corp., RB, Colgate University Project, Series B: | | | | | | | | |
5.00%, 07/01/40 | | | 685 | | | | 765,446 | |
5.00%, 07/01/43 | | | 2,480 | | | | 2,760,959 | |
County of Monroe New York Industrial Development Corp., Refunding RB: | | | | | | | | |
Nazareth College of Rochester Project, 4.00%, 10/01/47 | | | 295 | | | | 287,395 | |
University of Rochester Project, Series A, 5.00%, 07/01/23(b) | | | 1,240 | | | | 1,427,178 | |
University of Rochester Project, Series A, 4.00%, 07/01/39 | | | 350 | | | | 361,445 | |
University of Rochester Project, Series D, 4.00%, 07/01/43 | | | 1,295 | | | | 1,335,689 | |
| | |
| 30 | | 2018 BLACKROCK SEMI-ANNUAL REPORTTO SHAREHOLDERS |
| | |
Schedule of Investments (unaudited) (continued) February 28, 2018 | | BlackRock MuniHoldings New York Quality Fund, Inc. (MHN) (Percentages shown are based on Net Assets) |
| | | | | | | | |
| Security | | Par
(000) | | | Value | |
| Education (continued) | |
County of Onondaga New York, RB, Syracuse University Project: | | | | | | | | |
5.00%, 12/01/29 | | $ | 1,135 | | | $ | 1,252,983 | |
5.00%, 12/01/36 | | | 1,100 | | | | 1,208,086 | |
County of Orange New York Funding Corp., Refunding RB, Mount St. Mary College Project, Series A: | | | | | | | | |
5.00%, 07/01/37 | | | 715 | | | | 771,685 | |
5.00%, 07/01/42 | | | 445 | | | | 474,904 | |
County of St. Lawrence New York Industrial Development Agency, RB, Clarkson University Project: | | | | | | | | |
6.00%, 09/01/34 | | | 300 | | | | 337,632 | |
5.38%, 09/01/41 | | | 125 | | | | 137,404 | |
County of Tompkins New York Development Corp., RB, Ithaca College Project (AGM)(b): | | | | | | | | |
5.25%, 01/01/21 | | | 700 | | | | 769,188 | |
5.50%, 01/01/21 | | | 500 | | | | 552,865 | |
County of Tompkins New York Industrial Development Agency, RB, Civic Facility Cornell University Project, Series A, 5.00%, 07/01/37 | | | 500 | | | | 535,160 | |
Dobbs Ferry Local Development Corp., RB, Mercy College Project, 5.00%, 07/01/39 | | | 750 | | | | 842,768 | |
State of New York Dormitory Authority, RB: | | | | | | | | |
Convent of the Sacred Heart (AGM), 5.75%, 11/01/40 | | | 1,770 | | | | 1,962,682 | |
Fordham University, Series A, 5.00%, 07/01/21(b) | | | 175 | | | | 192,722 | |
Fordham University, Series A, 5.50%, 07/01/21(b) | | | 1,375 | | | | 1,536,343 | |
General Purpose, Series A, 5.00%, 02/15/36 | | | 4,500 | | | | 4,965,750 | |
New School (AGM), 5.50%, 07/01/20(b) | | | 3,265 | | | | 3,551,145 | |
New York University Mount Sinai School of Medicine, 5.13%, 07/01/19(b) | | | 1,000 | | | | 1,045,930 | |
New York University, Series 1 (AMBAC), 5.50%, 07/01/40 | | | 3,500 | | | | 4,515,910 | |
New York University, Series B, 5.00%, 07/01/19(b) | | | 400 | | | | 418,260 | |
New York University, Series B, 5.00%, 07/01/42 | | | 3,000 | | | | 3,338,520 | |
New York University, Series C, 5.00%, 07/01/18(b) | | | 2,000 | | | | 2,024,220 | |
Siena College, 5.13%, 07/01/19(b) | | | 1,345 | | | | 1,408,605 | |
State University Dormitory Facilities, Series A, 5.00%, 07/01/35 | | | 750 | | | | 803,093 | |
State University Dormitory Facilities, Series A, 5.00%, 07/01/40 | | | 1,500 | | | | 1,604,055 | |
State University Dormitory Facilities, Series A, 5.00%, 07/01/41 | | | 1,500 | | | | 1,635,135 | |
State of New York Dormitory Authority, Refunding RB: | | | | | | | | |
3rd General Resolution, State University Educational Facilities Issue, Series A, 5.00%, 05/15/29 | | | 1,000 | | | | 1,115,190 | |
Barnard College, Series A, 5.00%, 07/01/34 | | | 900 | | | | 1,023,336 | |
Barnard College, Series A, 4.00%, 07/01/37 | | | 510 | | | | 525,346 | |
Barnard College, Series A, 5.00%, 07/01/43 | | | 1,500 | | | | 1,674,075 | |
Cornell University, Series A, 5.00%, 07/01/40 | | | 1,000 | | | | 1,069,610 | |
Fordham University, 5.00%, 07/01/44 | | | 1,900 | | | | 2,112,914 | |
Icahn School of Medicine at Mount Sinai, Series A, 5.00%, 07/01/35 | | | 1,030 | | | | 1,141,024 | |
New York University, Series A, 5.00%, 07/01/31 | | | 3,000 | | | | 3,366,180 | |
New York University, Series A, 5.00%, 07/01/37 | | | 4,180 | | | | 4,666,301 | |
Pratt Institute, 5.00%, 07/01/46 | | | 800 | | | | 889,080 | |
Rochester Institute of Technology, 4.00%, 07/01/31 | | | 1,300 | | | | 1,365,338 | |
Rochester Institute of Technology, 5.00%, 07/01/42 | | | 750 | | | | 820,028 | |
St. John’s University, Series A, 5.00%, 07/01/37 | | | 2,005 | | | | 2,243,234 | |
State University Dormitory Facilities, Series A, 5.25%, 07/01/31 | | | 4,755 | | | | 5,444,523 | |
State University Dormitory Facilities, Series A, 5.25%, 07/01/32 | | | 6,435 | | | | 7,364,664 | |
State University Dormitory Facilities, Series A, 5.00%, 07/01/42 | | | 1,490 | | | | 1,629,762 | |
| | | | | | | | |
| Security | | Par
(000) | | | Value | |
| Education (continued) | |
State of New York Dormitory Authority, Refunding RB (continued): | | | | | | | | |
State University Dormitory Facilities, Series A, 5.00%, 07/01/42 | | $ | 1,435 | | | $ | 1,630,720 | |
State University Dormitory Facilities, Series A, 5.00%, 07/01/46 | | | 440 | | | | 499,633 | |
State University Dormitory Facilities, Series B, 5.00%, 07/01/32 | | | 500 | | | | 570,645 | |
State University Dormitory Facilities, Series B, 5.00%, 07/01/33 | | | 860 | | | | 980,288 | |
Town of Hempstead New York Local Development Corp., Refunding RB, Hofstra University Project, 5.00%, 07/01/47 | | | 1,030 | | | | 1,152,034 | |
| | | | | | | | |
| | | | | | | 112,757,219 | |
| Health — 10.2% | |
City of New York New York Health & Hospital Corp., Refunding RB, Health System, Series A, 5.00%, 02/15/30 | | | 1,800 | | | | 1,892,268 | |
County of Dutchess New York Industrial Development Agency, RB, Vassar Brothers Medical Center (AGC), 5.50%, 04/01/34 | | | 500 | | | | 542,345 | |
County of Dutchess New York Local Development Corp., RB, Health Quest Systems, Inc., Series B, 4.00%, 07/01/41 | | | 585 | | | | 595,776 | |
County of Monroe New York Industrial Development Corp., RB, Rochester General Hospital Project: | | | | | | | | |
4.00%, 12/01/41 | | | 500 | | | | 497,715 | |
5.00%, 12/01/46 | | | 800 | | | | 874,064 | |
Series A, 5.00%, 12/01/37 | | | 1,180 | | | | 1,267,686 | |
County of Monroe New York Industrial Development Corp., Refunding RB, Unity Hospital of Rochester Project (FHA), 5.50%, 08/15/40 | | | 5,925 | | | | 6,516,671 | |
County of Suffolk New York EDC, RB, Catholic Health Services, Series C, 5.00%, 07/01/32 | | | 460 | | | | 503,226 | |
County of Westchester New York Healthcare Corp., Refunding RB, Senior Lien, Remarketing, Series A, 5.00%, 11/01/30 | | | 1,340 | | | | 1,430,825 | |
State of New York Dormitory Authority, RB: | | | | | | | | |
Health System, Series B (AGM), 5.00%, 08/15/18(b) | | | 3,480 | | | | 3,536,968 | |
Health System, Series B (AGM), 5.00%, 02/15/33 | | | 1,020 | | | | 1,036,177 | |
Healthcare, Series A, 5.00%, 03/15/19(b) | | | 2,250 | | | | 2,333,250 | |
New York University Hospitals Center, Series A, 5.75%, 07/01/20(b) | | | 2,680 | | | | 2,930,151 | |
New York University Hospitals Center, Series A, 6.00%, 07/01/20(b) | | | 1,800 | | | | 1,978,254 | |
North Shore-Long Island Jewish Obligated Group, Series A, 5.50%, 05/01/19(b) | | | 1,825 | | | | 1,907,143 | |
North Shore-Long Island Jewish Obligated Group, Series C, 4.25%, 05/01/39 | | | 1,000 | | | | 1,039,160 | |
North Shore-Long Island Jewish Obligated Group, Series D, 4.25%, 05/01/39 | | | 685 | | | | 711,825 | |
State of New York Dormitory Authority, Refunding RB: | | | | | | | | |
Memorial Sloan-Kettering Cancer Center, Series 1, 4.00%, 07/01/37 | | | 295 | | | | 311,458 | |
Memorial Sloan-Kettering Cancer Center, Series 1, 5.00%, 07/01/42 | | | 2,200 | | | | 2,500,058 | |
North Shore-Long Island Jewish Obligated Group, Series A, 5.00%, 05/01/21(b) | | | 2,000 | | | | 2,196,580 | |
North Shore-Long Island Jewish Obligated Group, Series A, 5.25%, 05/01/21(b) | | | 7,375 | | | | 8,156,307 | |
North Shore-Long Island Jewish Obligated Group, Series A, 5.00%, 05/01/32 | | | 2,645 | | | | 2,980,624 | |
| | | | | | | | |
| | | | | | | 45,738,531 | |
| | | | |
| SCHEDULES OF INVESTMENTS | | | 31 | |
| | |
Schedule of Investments (unaudited) (continued) February 28, 2018 | | BlackRock MuniHoldings New York Quality Fund, Inc. (MHN) (Percentages shown are based on Net Assets) |
| | | | | | | | |
| Security | | Par
(000) | | | Value | |
| Housing — 3.8% | |
City of New York New York Housing Development Corp., RB, M/F Housing: | | | | | | | | |
Fund Grant Program, New York City Housing Authority Program, Series B1, 5.25%, 07/01/32 | | $ | 6,505 | | | $ | 7,187,049 | |
Fund Grant Program, New York City Housing Authority Program, Series B1, 5.00%, 07/01/33 | | | 1,375 | | | | 1,496,756 | |
Series A-1-A, AMT, 5.00%, 11/01/30 | | | 750 | | | | 751,192 | |
Series A-1-A, AMT, 5.45%, 11/01/46 | | | 1,335 | | | | 1,341,355 | |
Series H-2-A, AMT, 5.20%, 11/01/35 | | | 835 | | | | 837,513 | |
Series H-2-A, AMT, 5.35%, 05/01/41 | | | 600 | | | | 603,444 | |
City of New York New York Housing Development Corp., Refunding RB, M/F Housing, 8 Spruce Street, Class F, 4.50%, 02/15/48 | | | 1,075 | | | | 1,108,680 | |
City of Yonkers New York Industrial Development Agency, RB, Monastery Manor Associates LP Project, Series A, AMT (SONYMA), 5.25%, 04/01/37 | | | 2,000 | | | | 2,005,080 | |
State of New York HFA, RB, M/F Housing: | | | | | | | | |
Affordable Series B (Ginnie Mae, Fannie Mae & Freddie Mac), 4.00%, 11/01/42 | | | 845 | | | | 863,286 | |
St. Philip’s Housing, Series A, AMT, 4.65%, 11/15/38 | | | 1,000 | | | | 1,000,550 | |
| | | | | | | | |
| | | | | | | 17,194,905 | |
| State — 17.5% | |
City of New York New York Transitional Finance Authority, BARB: | | | | | | | | |
Fiscal 2008, Series S-1, 4.50%, 01/15/38 | | | 1,510 | | | | 1,513,307 | |
Fiscal 2009, Series S-1 (AGC), 5.50%, 07/15/38 | | | 4,000 | | | | 4,060,280 | |
Fiscal 2009, Series S-4 (AGC), 5.50%, 01/15/33 | | | 3,000 | | | | 3,103,200 | |
Fiscal 2009, Series S-4 (AGC), 5.50%, 01/15/39 | | | 1,250 | | | | 1,291,787 | |
City of New York New York Transitional Finance Authority, Refunding RB, Fiscal 2018: | | | | | | | | |
Series S-1, 5.00%, 07/15/35 | | | 1,220 | | | | 1,402,915 | |
Series S-2, 5.00%, 07/15/35 | | | 1,220 | | | | 1,402,915 | |
City of New York New York Transitional Finance Authority Future Tax Secured, RB: | | | | | | | | |
Fiscal 2014, Sub-Series A-1, 5.00%, 11/01/38 | | | 950 | | | | 1,071,457 | |
Fiscal 2014, Sub-Series B-1, 5.00%, 11/01/36 | | | 1,690 | | | | 1,909,294 | |
Fiscal 2016, Sub-Series B-1, 5.00%, 11/01/38 | | | 1,455 | | | | 1,651,789 | |
Series A-2, 5.00%, 08/01/39 | | | 2,090 | | | | 2,386,341 | |
Sub Series A-3, 5.00%, 08/01/41 | | | 4,505 | | | | 5,128,087 | |
Sub-Series B-1, 5.00%, 11/01/35 | | | 2,100 | | | | 2,373,777 | |
Sub-Series E-1, 5.00%, 02/01/38 | | | 4,470 | | | | 5,082,166 | |
Sub-Series F-1, 5.00%, 05/01/38 | | | 3,455 | | | | 3,939,529 | |
Sub-Series F-1, 5.00%, 05/01/39 | | | 4,300 | | | | 4,895,722 | |
City of New York New York Transitional Finance Authority Future Tax Secured, Refunding RB, Series C, 5.00%, 11/01/30 | | | 1,145 | | | | 1,313,842 | |
Metropolitan Transportation Authority, Refunding RB, Dedicated Tax Fund: | | | | | | | | |
Series B, 5.00%, 11/15/19(b) | | | 2,500 | | | | 2,645,650 | |
Sub-Series B-1, 5.00%, 11/15/31 | | | 4,000 | | | | 4,546,480 | |
Sales Tax Asset Receivable Corp., Refunding RB, Fiscal 2015, Series A, 4.00%, 10/15/32 | | | 2,070 | | | | 2,241,210 | |
State of New York Dormitory Authority, RB: | | | | | | | | |
General Purpose, Series A, 5.00%, 02/15/42 | | | 7,500 | | | | 8,463,150 | |
General Purpose, Series B, 5.00%, 03/15/37 | | | 3,000 | | | | 3,288,630 | |
General Purpose, Series B, 5.00%, 03/15/42 | | | 4,600 | | | | 5,031,434 | |
Master BOCES Program Lease (AGC),
5.00%, 08/15/19(b) | | | 250 | | | | 262,600 | |
Series B, 5.00%, 03/15/37 | | | 1,500 | | | | 1,707,495 | |
State Personal Income Tax, Series A, 5.00%, 02/15/43 | | | 495 | | | | 543,827 | |
State of New York Dormitory Authority, Refunding RB, School Districts Financing Program, Series A (AGM),
5.00%, 10/01/18(b) | | | 5,000 | | | | 5,107,800 | |
| | | | | | | | |
| Security | | Par
(000) | | | Value | |
| State (continued) | |
State of New York Urban Development Corp., RB, State Personal Income Tax, Series C, 5.00%, 03/15/32 | | $ | 2,000 | | | $ | 2,237,220 | |
| | | | | | | | |
| | | | | | | 78,601,904 | |
| Tobacco — 2.3% | |
Counties of New York Tobacco Trust VI, Refunding RB, Tobacco Settlement Pass-Through: | | | | | | | | |
Series A, 5.00%, 06/01/41 | | | 400 | | | | 432,512 | |
Series A-2B, 5.00%, 06/01/51 | | | 765 | | | | 794,261 | |
Series B, 5.00%, 06/01/45 | | | 1,500 | | | | 1,592,490 | |
County of Chautauqua New York Tobacco Asset Securitization Corp., Refunding RB, Asset-Backed, 4.75%, 06/01/39 | | | 1,875 | | | | 1,884,937 | |
County of Niagara New York Tobacco Asset Securitization Corp., Refunding RB, Asset-Backed: | | | | | | | | |
5.25%, 05/15/34 | | | 1,495 | | | | 1,612,851 | |
5.25%, 05/15/40 | | | 1,500 | | | | 1,602,855 | |
Westchester New York Tobacco Asset Securitization, Refunding RB, Tobacco Settlement Bonds, Sub-Series C, 4.00%, 06/01/42 | | | 2,510 | | | | 2,422,853 | |
| | | | | | | | |
| | | | | | | 10,342,759 | |
| Transportation — 38.0% | |
Buffalo & Fort Erie Public Bridge Authority, RB, Toll Bridge System: | | | | | | | | |
5.00%, 01/01/42 | | | 970 | | | | 1,089,067 | |
5.00%, 01/01/47 | | | 325 | | | | 363,577 | |
Metropolitan Transportation Authority, RB: | | | | | | | | |
Green Bonds, Series A, 5.00%, 11/15/42 | | | 3,500 | | | | 3,986,640 | |
Series A, 5.00%, 11/15/21(b) | | | 1,000 | | | | 1,116,770 | |
Series A, 5.00%, 05/15/23(b) | | | 3,000 | | | | 3,444,120 | |
Series A-1, 5.25%, 11/15/23(b) | | | 1,620 | | | | 1,899,515 | |
Series A-1, 5.25%, 11/15/23(b) | | | 1,620 | | | | 1,899,515 | |
Series B, 5.25%, 11/15/44 | | | 1,000 | | | | 1,141,630 | |
Series C, 6.50%, 11/15/28 | | | 1,155 | | | | 1,196,522 | |
Series D, 5.25%, 11/15/21(b) | | | 440 | | | | 495,308 | |
Series E, 5.00%, 11/15/38 | | | 8,750 | | | | 9,792,037 | |
Series E, 5.00%, 11/15/43 | | | 1,000 | | | | 1,116,850 | |
Sub-Series A-1, 5.00%, 11/15/45 | | | 1,720 | | | | 1,908,340 | |
Sub-Series B, 5.00%, 11/15/23(b) | | | 1,000 | | | | 1,159,150 | |
Metropolitan Transportation Authority, Refunding RB: | | | | | | | | |
Green Bonds, CAB, Series C-2, 0.00%, 11/15/39(a) | | | 3,380 | | | | 1,430,957 | |
Green Bonds, Climate Bond Certified, Series B-1, 5.00%, 11/15/34 | | | 1,780 | | | | 2,069,553 | |
Green Bonds, Climate Bond Certified, Sub-Series B-2, 4.00%, 11/15/34 | | | 2,500 | | | | 2,637,800 | |
Green Bonds, Series A-1, 5.25%, 11/15/56 | | | 1,830 | | | | 2,066,290 | |
Series B, 5.00%, 11/15/37 | | | 2,010 | | | | 2,273,049 | |
Series D, 5.25%, 11/15/21(b) | | | 1,560 | | | | 1,756,092 | |
Series D, 5.00%, 11/15/30 | | | 885 | | | | 987,970 | |
Metropolitan Transportation Authority Hudson Rail Yards Trust Obligations, Refunding RB, Series A, 5.00%, 11/15/56 | | | 5,410 | | | | 6,002,990 | |
New York Liberty Development Corp., RB, World Trade Center Port Authority Consolidated, 5.25%, 12/15/43 | | | 11,500 | | | | 12,718,540 | |
New York Transportation Development Corp., ARB, LaGuardia Airport Terminal B Redevelopment Project, Series A, AMT: | | | | | | | | |
5.00%, 07/01/46 | | | 7,625 | | | | 8,269,084 | |
5.25%, 01/01/50 | | | 7,670 | | | | 8,389,293 | |
(AGM), 4.00%, 07/01/41 | | | 1,250 | | | | 1,275,187 | |
Niagara Falls Bridge Commission, Refunding RB, Toll Bridge System, Series A (AGC), 4.00%, 10/01/19 | | | 695 | | | | 711,520 | |
| | |
| 32 | | 2018 BLACKROCK SEMI-ANNUAL REPORTTO SHAREHOLDERS |
| | |
Schedule of Investments (unaudited) (continued) February 28, 2018 | | BlackRock MuniHoldings New York Quality Fund, Inc. (MHN) (Percentages shown are based on Net Assets) |
| | | | | | | | |
| Security | | Par
(000) | | | Value | |
| Transportation (continued) | |
Port Authority of New York & New Jersey, ARB: | | | | | | | | |
Consolidated, 163rd Series, 5.00%, 07/15/35 | | $ | 2,500 | | | $ | 2,687,125 | |
Consolidated, 183rd Series, 4.00%, 06/15/44 | | | 1,500 | | | | 1,541,925 | |
Special Project, JFK International Air Terminal LLC Project, Series 6, AMT (NPFGC), 5.75%, 12/01/22 | | | 19,725 | | | | 20,711,842 | |
Port Authority of New York & New Jersey, Refunding ARB: | | | | | | | | |
178th Series, AMT, 5.00%, 12/01/33 | | | 1,000 | | | | 1,112,070 | |
179th Series, 5.00%, 12/01/38 | | | 1,390 | | | | 1,570,936 | |
Consolidated, 177th Series, AMT, 4.00%, 01/15/43 | | | 285 | | | | 288,642 | |
Consolidated, 178th Series, AMT, 5.00%, 12/01/43 | | | 750 | | | | 827,362 | |
Consolidated, 195th Series, AMT, 5.00%, 04/01/36 | | | 1,400 | | | | 1,576,554 | |
Consolidated, 206th Series, AMT, 5.00%, 11/15/42 | | | 2,375 | | | | 2,676,245 | |
State of New York Thruway Authority, RB, Junior Lien, Series A, 5.25%, 01/01/56 | | | 1,080 | | | | 1,214,719 | |
State of New York Thruway Authority, Refunding RB, General: | | | | | | | | |
Series H (AGM), 5.00%, 01/01/37 | | | 8,500 | | | | 8,521,165 | |
Series I, 5.00%, 01/01/37 | | | 4,245 | | | | 4,649,761 | |
Series I, 5.00%, 01/01/42 | | | 4,270 | | | | 4,654,215 | |
Series J, 5.00%, 01/01/41 | | | 5,000 | | | | 5,489,000 | |
Series K, 5.00%, 01/01/29 | | | 1,750 | | | | 2,011,240 | |
Series K, 5.00%, 01/01/31 | | | 1,000 | | | | 1,138,540 | |
Series K, 5.00%, 01/01/32 | | | 1,000 | | | | 1,136,540 | |
Triborough Bridge & Tunnel Authority, RB, Series B: | | | | | | | | |
5.00%, 11/15/40 | | | 940 | | | | 1,069,786 | |
5.00%, 11/15/45 | | | 820 | | | | 929,601 | |
Triborough Bridge & Tunnel Authority, Refunding RB: | | | | | | | | |
General, CAB, Series B, 0.00%, 11/15/32(a) | | | 7,670 | | | | 4,618,490 | |
General, MTA Bridges & Tunnels, Series C-2, 5.00%, 11/15/42 | | | 5,920 | | | | 6,781,242 | |
General, Remarketing, Series A, 5.00%, 11/15/36 | | | 1,000 | | | | 1,115,410 | |
General, Series A, 5.00%, 11/15/41 | | | 5,000 | | | | 5,640,700 | |
General, Series A, 5.25%, 11/15/45 | | | 1,280 | | | | 1,473,306 | |
General, Series A, 5.00%, 11/15/50 | | | 3,000 | | | | 3,359,130 | |
General, Series C, 5.00%, 11/15/18(b) | | | 855 | | | | 877,290 | |
General, Series C, 5.00%, 11/15/38 | | | 530 | | | | 542,720 | |
Sub-Series A, 5.00%, 11/15/29 | | | 875 | | | | 989,739 | |
| | | | | | | | |
| | | | | | | 170,402,661 | |
| Utilities — 16.3% | |
City of New York New York Municipal Water Finance Authority, RB, Water & Sewer System, 2nd General Resolution, Fiscal 2017, Series DD, 5.25%, 06/15/47 | | | 2,455 | | | | 2,847,898 | |
City of New York New York Municipal Water Finance Authority, Refunding RB, Water & Sewer System, 2nd General Resolution: | | | | | | | | |
Fiscal 2010, Series FF, 5.00%, 06/15/31 | | | 1,500 | | | | 1,610,145 | |
Fiscal 2011, Series BB, 5.00%, 06/15/31 | | | 1,000 | | | | 1,073,430 | |
Fiscal 2011, Series GG, 5.00%, 06/15/43 | | | 2,070 | | | | 2,245,847 | |
Fiscal 2015, Series HH, 5.00%, 06/15/39 | | | 2,250 | | | | 2,545,605 | |
Series DD, 5.00%, 06/15/32 | | | 3,750 | | | | 3,787,988 | |
City of New York New York Water & Sewer System, RB: | | | | | | | | |
2nd General Resolution, Fiscal 2017, Series DD, 5.00%, 06/15/47 | | | 3,785 | | | | 4,284,469 | |
Sub-Series BB-1, 5.00%, 06/15/46 | | | 2,250 | | | | 2,561,400 | |
County of Western Nassau New York Water Authority, RB, Series A, 5.00%, 04/01/40 | | | 1,065 | | | | 1,178,454 | |
Long Island Power Authority, RB, General, Electric Systems: | | | | | | | | |
5.00%, 09/01/42 | | | 1,185 | | | | 1,337,794 | |
Series A (AGM), 5.00%, 05/01/21(b) | | | 2,375 | | | | 2,612,286 | |
Long Island Power Authority, Refunding RB: | | | | | | | | |
Electric System, Series B, 5.00%, 09/01/41 | | | 475 | | | | 532,166 | |
Electric System, Series B, 5.00%, 09/01/46 | | | 1,805 | | | | 2,012,358 | |
Electric Systems, Series A (AGC), 5.75%, 04/01/19(b) | | | 1,000 | | | | 1,045,700 | |
General, Electric Systems, Series A (AGC), 6.00%, 05/01/19(b) | | | 1,500 | | | | 1,578,810 | |
| | | | | | | | |
| Security | | Par
(000) | | | Value | |
| Utilities (continued) | |
State of New York Environmental Facilities Corp., RB: | | | | | | | | |
Green Bond, Series CRB, Green Bond, Series CRB, Green Bond, Series C, 5.00%, 08/15/38 | | $ | 1,000 | | | $ | 1,159,080 | |
Green Bond, Series C, 5.00%, 08/15/36 | | | 475 | | | | 552,682 | |
Green Bond, Series C, 5.00%, 08/15/37 | | | 585 | | | | 679,103 | |
Green Bond, Series C, 5.00%, 08/15/41 | | | 965 | | | | 1,113,369 | |
Series B, Revolving Funds, Green Bonds, 5.00%, 09/15/40 | | | 3,170 | | | | 3,625,592 | |
State of New York Environmental Facilities Corp., Refunding RB: | | | | | | | | |
Revolving Funds, New York City Municipal Water, Series B, 5.00%, 06/15/36 | | | 3,200 | | | | 3,506,976 | |
Series A, 5.00%, 06/15/40 | | | 1,545 | | | | 1,786,283 | |
Series A, 5.00%, 06/15/45 | | | 7,935 | | | | 9,044,392 | |
State of New York Power Authority, Refunding RB, Series A, 5.00%, 11/15/38 | | | 2,580 | | | | 2,849,971 | |
Utility Debt Securitization Authority, Refunding RB, Restructuring, Series E, 5.00%, 12/15/41 | | | 15,490 | | | | 17,536,849 | |
| | | | | | | | |
| | | | | | | 73,108,647 | |
| | | | | | | | |
Total Municipal Bonds in New York | | | | 613,187,973 | |
| | | | | | | | |
|
| Guam — 0.3% | |
| Utilities — 0.3% | |
Guam Power Authority, RB, Series A (AGM), 5.00%, 10/01/20(b) | | | 1,175 | | | | 1,275,274 | |
| | | | | | | | |
Total Municipal Bonds — 137.0%
(Cost — $588,121,349) | | | | 614,463,247 | |
| | | | | | | | |
|
Municipal Bonds Transferred to Tender Option Bond Trusts(c) — 29.8% | |
|
| New York — 29.8% | |
| County/City/Special District/School District — 6.2% | |
City of New York New York, GO, Refunding, Series E, 0.00%, 08/01/29 | | | 2,000 | | | | 2,321,250 | |
City of New York New York, GO: | | | | | | | | |
Sub-Series C-3 (AGC), 5.75%, 02/15/19(b)(d) | | | 636 | | | | 662,006 | |
Sub-Series C-3 (AGC), 5.75%, 08/15/28 | | | 9,364 | | | | 9,746,894 | |
Sub-Series I-1, 5.00%, 03/01/36 | | | 2,500 | | | | 2,818,713 | |
City of New York New York Convention Center Development Corp., Refunding RB, Hotel Unit Fee Secured, 5.00%, 11/15/32 | | | 2,500 | | | | 2,854,425 | |
Hudson Yards Infrastructure Corp., RB, Fiscal 2012, Series A, 5.75%, 02/15/47(d) | | | 5,999 | | | | 6,624,642 | |
New York Liberty Development Corp., Refunding RB, 7 World Trade Center Project, Class 1, 5.00%, 09/15/40 | | | 2,610 | | | | 2,880,413 | |
| | | | | | | | |
| | | | | | | 27,908,343 | |
| Education — 4.0% | |
City of New York New York Trust for Cultural Resources, Refunding RB, Wildlife Conservation Society, Series A, 5.00%, 08/01/33 | | | 1,981 | | | | 2,219,426 | |
State of New York Dormitory Authority, RB, State University Dormitory Facilities, New York University, Series A: | | | | | | | | |
5.00%, 07/01/18(b) | | | 5,499 | | | | 5,559,593 | |
5.25%, 07/01/19(b) | | | 5,000 | | | | 5,245,550 | |
5.00%, 07/01/35 | | | 4,448 | | | | 4,860,047 | |
| | | | | | | | |
| | | | | | | 17,884,616 | |
| State — 9.5% | |
City of New York New York Transitional Finance Authority, RB, Future Tax Secured, Sub-Series D-1, 5.00%, 11/01/38 | | | 1,650 | | | | 1,804,363 | |
| | | | |
| SCHEDULES OF INVESTMENTS | | | 33 | |
| | |
Schedule of Investments (unaudited) (continued) February 28, 2018 | | BlackRock MuniHoldings New York Quality Fund, Inc. (MHN) (Percentages shown are based on Net Assets) |
| | | | | | | | |
| Security | | Par
(000) | | | Value | |
| State (continued) | |
Sales Tax Asset Receivable Corp., Refunding RB, Fiscal 2015, Series A: | | | | | | | | |
5.00%, 10/15/31 | | $ | 7,380 | | | $ | 8,529,976 | |
4.00%, 10/15/32 | | | 6,000 | | | | 6,496,260 | |
State of New York Dormitory Authority, ERB, Series B, 5.75%, 03/15/19(b) | | | 5,000 | | | | 5,221,700 | |
State of New York Dormitory Authority, RB: | | | | | | | | |
General Purpose, Series C, 5.00%, 03/15/41 | | | 2,500 | | | | 2,712,838 | |
Mental Health Services Facilities, Series C, AMT (AGM), 5.40%, 02/15/33 | | | 5,458 | | | | 5,551,499 | |
Series A, 5.00%, 03/15/44 | | | 4,858 | | | | 5,445,103 | |
State of New York Dormitory Authority, Refunding RB, Series E, 5.25%, 03/15/33 | | | 4,500 | | | | 5,260,972 | |
State of New York Urban Development Corp., Refunding RB, State Personal Income Tax, Series A, 5.00%, 03/15/45 | | | 1,471 | | | | 1,682,687 | |
| | | | | | | | |
| | | | | | | 42,705,398 | |
| Transportation — 5.3% | |
Port Authority of New York & New Jersey, Refunding ARB: | | | | | | | | |
194th Series, 5.25%, 10/15/55 | | | 3,405 | | | | 3,859,363 | |
Consolidated, Series 169th, 5.00%, 10/15/25 | | | 8,005 | | | | 8,746,560 | |
Triborough Bridge & Tunnel Authority, Refunding RB, General, Series A, 5.00%, 11/15/46 | | | 10,000 | | | | 11,243,050 | |
| | | | | | | | |
| | | | | | | 23,848,973 | |
| Utilities — 4.8% | |
City of New York New York Municipal Water Finance Authority, RB, Water & Sewer System, Fiscal 2009, Series A: | | | | | | | | |
5.75%, 06/15/18(b) | | | 922 | | | | 932,441 | |
5.75%, 06/15/40 | | | 3,081 | | | | 3,118,130 | |
City of New York New York Municipal Water Finance Authority, Refunding RB, Water & Sewer System, 2nd General Resolution: | | | | | | | | |
Fiscal 2011, Series HH, 5.00%, 06/15/32 | | | 7,151 | | | | 7,808,526 | |
Series FF-2, 5.50%, 06/15/40 | | | 2,400 | | | | 2,517,520 | |
New York State Environmental Facilities Corp., Refunding RB, Subordinated SRF Bonds, Series 2016 A, 4.00%, 06/15/46 | | | 601 | | | | 628,635 | |
| | | | | | | | |
| Security | | Par
(000) | | | Value | |
| Utilities (continued) | |
Utility Debt Securitization Authority, Refunding RB, Restructuring: | | | | | | | | |
5.00%, 12/15/36 | | $ | 3,003 | | | $ | 3,462,193 | |
Series B, 4.00%, 12/15/35 | | | 2,600 | | | | 2,760,849 | |
| | | | | | | | |
| | | | | | | 21,228,294 | |
| | | | | | | | |
Total Municipal Bonds Transferred to Tender Option Bond
Trusts — 29.8%
(Cost — $130,517,425) | | | | 133,575,624 | |
| | | | | | | | |
Total Long-Term Investments — 166.8%
(Cost — $718,638,774) | | | | 748,038,871 | |
| | | | | | | | |
| | |
| | | Shares | | | | |
Short-Term Securities — 1.5% | | | | | | | | |
BlackRock Liquidity Funds, MuniCash, Institutional Class,
1.61%(e)(f) | | | 6,711,948 | | | | 6,712,620 | |
| | | | | | | | |
Total Short-Term Securities— 1.5%
(Cost — $6,712,473) | | | | 6,712,620 | |
| | | | | | | | |
| |
Total Investments — 168.3%
(Cost — $725,351,247) | | | | 754,751,491 | |
Other Assets Less Liabilities — 1.6% | | | | 7,138,430 | |
Liability for TOB Trust Certificates, Including Interest Expense and Fees Payable — (15.7)% | | | | (70,221,199 | ) |
VRDP Shares at Liquidation Value, Net of Deferred Offering
Costs — (54.2)% | | | | (243,239,500 | ) |
| | | | | | | | |
Net Assets Applicable to Common Shares — 100.0% | | | $ | 448,429,222 | |
| | | | | | | | |
| (b) | U.S. Government securities, held in escrow, are used to pay interest on this security, as well as to retire the bond in full at the date indicated, typically at a premium to par. |
| (c) | Represent bonds transferred to a TOB Trust in exchange of cash and residual certificates received by the Trust. These bonds serve as collateral in a secured borrowing. See Note 4 of the Notes to Financial Statements for details. |
| (d) | All or a portion of security is subject to a recourse agreement. The aggregate maximum potential amount the Trust could ultimately be required to pay under the agreements, which expire between September 6, 2018 to February 15, 2019, is $8,472,762. See Note 4 of the Notes to Financial Statements for details. |
| (e) | Annualized 7-day yield as of period end. |
| (f) | During the period ended February 28, 2018, investments in issuers considered to be affiliate of the Trust for purposes of Section 2(a)(3) of the Investment Company Act of 1940, as amended, were as follows: |
| | | | | | | | | | | | | | | | | | | | | | | | | | | | |
| Affiliated | | Shares
Held at
08/31/17 | | | Net
Activity | | | Shares
Held at
02/28/18 | | | Value at
02/28/18 | | | Income | | | Net
Realized
Gain (Loss) (a) | | | Change in
Unrealized
Appreciation
(Depreciation) | |
BlackRock Liquidity Funds, MuniCash, Institutional Class | | | 3,259,019 | | | | 3,452,929 | | | | 6,711,948 | | | $ | 6,712,620 | | | $ | 21,656 | | | $ | (163 | ) | | $ | 197 | |
| | | | | | | | | | | | | | | | | | | | | | | | | | | | |
| | (a) | Includes net capital gain distributions, if applicable. | |
For Trust compliance purposes, the Trust’s sector classifications refer to one or more of the sector sub-classifications used by one or more widely recognized market indexes or rating group indexes, and/or as defined by the investment adviser. These definitions may not apply for purposes of this report, which may combine such sector sub-classifications for reporting ease.
| | |
| 34 | | 2018 BLACKROCK SEMI-ANNUAL REPORTTO SHAREHOLDERS |
| | |
Schedule of Investments (unaudited) (continued) February 28, 2018 | | BlackRock MuniHoldings New York Quality Fund, Inc. (MHN) |
Derivative Financial Instruments Outstanding as of Period End
Futures Contracts
| | | | | | | | | | | | | | | | |
| Description | | Number of
Contracts | | | Expiration
Date | | | Notional
Amount (000) | | | Value/
Unrealized
Appreciation
(Depreciation) | |
Short Contracts: | | | | | | | | | | | | | | | | |
10-Year U.S. Treasury Note | | | 148 | | | | 06/20/18 | | | $ | 17,767 | | | $ | 13,868 | |
Long U.S. Treasury Bond | | | 161 | | | | 06/20/18 | | | | 23,093 | | | | (95,848 | ) |
5-Year U.S. Treasury Note | | | 73 | | | | 06/29/18 | | | | 8,317 | | | | 13,336 | |
| | | | | | | | | | | | | | | | |
| | | | | | | | | | | | | | $ | (68,644 | ) |
| | | | | | | | | | | | | | | | |
Derivative Financial Instruments Categorized by Risk Exposure
As of period end, the fair values of derivative financial instruments located in the Statements of Assets and Liabilities were as follows:
| | | | | | | | | | | | | | | | | | | | | | | | | | | | |
| | | Commodity
Contracts | | | Credit
Contracts | | | Equity
Contracts | | | Foreign
Currency
Exchange
Contracts | | | Interest
Rate
Contracts | | | Other
Contracts | | | Total | |
Assets — Derivative Financial Instruments | |
Futures contracts | | | | | | | | | | | | | | | | | | | | | | | | | | | | |
Net unrealized appreciation(a) | | $ | — | | | $ | — | | | $ | — | | | $ | — | | | $ | 27,204 | | | $ | — | | | $ | 27,204 | |
| | | | | | | | | | | | | | | | | | | | | | | | | | | | |
Liabilities — Derivative Financial Instruments | |
Futures contracts | | | | | | | | | | | | | | | | | | | | | | | | | | | | |
Net unrealized depreciation(a) | | $ | — | | | $ | — | | | $ | — | | | $ | — | | | $ | 95,848 | | | $ | — | | | $ | 95,848 | |
| | | | | | | | | | | | | | | | | | | | | | | | | | | | |
| | (a) | Includes cumulative appreciation (depreciation) on futures contracts, if any, as reported in the Schedule of Investments. Only current day’s variation margin is reported within the Statements of Assets and Liabilities. | |
For the six months ended February 28, 2018, the effect of derivative financial instruments in the Statements of Operations was as follows:
| | | | | | | | | | | | | | | | | | | | | | | | | | | | |
| | | Commodity
Contracts | | | Credit
Contracts | | | Equity
Contracts | | | Foreign
Currency
Exchange
Contracts | | | Interest
Rate
Contracts | | | Other
Contracts | | | Total | |
Net Realized Gain (Loss) from: | | | | | | | | | | | | | | | | | | | | | | | | | | | | |
Futures contracts | | $ | — | | | $ | — | | | $ | — | | | $ | — | | | $ | 2,789,691 | | | $ | — | | | $ | 2,789,691 | |
| | | | | | | | | | | | | | | | | | | | | | | | | | | | |
| Net Change in Unrealized Appreciation (Depreciation) on: | | | | | | | | | | | | | | | | | | | | | |
Futures contracts | | $ | — | | | $ | — | | | $ | — | | | $ | — | | | $ | 165,663 | | | $ | — | | | $ | 165,663 | |
| | | | | | | | | | | | | | | | | | | | | | | | | | | | |
Average Quarterly Balances of Outstanding Derivative Financial Instruments
| | | | |
Futures contracts: | |
Average notional value of contracts — short | | $ | 39,104,848 | |
For more information about the Trust’s investment risks regarding derivative financial instruments, refer to the Notes to Financial Statements.
| | | | |
| SCHEDULES OF INVESTMENTS | | | 35 | |
| | |
Schedule of Investments (unaudited) (continued) February 28, 2018 | | BlackRock MuniHoldings New York Quality Fund, Inc. (MHN) |
Fair Value Hierarchy as of Period End
Various inputs are used in determining the fair value of investments and derivative financial instruments. For information about the Trust’s policy regarding valuation of investments and derivative financial instruments, refer to the Notes to Financial Statements.
The following tables summarize the Trust’s investments and derivative financial instruments categorized in the disclosure hierarchy:
| | | | | | | | | | | | | | | | |
| | | Level 1 | | | Level 2 | | | Level 3 | | | Total | |
Assets: | | | | | | | | | | | | | | | | |
Investments: | | | | | | | | | | | | | | | | |
Long-Term Investments(a) | | $ | — | | | $ | 748,038,871 | | | $ | — | | | $ | 748,038,871 | |
Short-Term Securities | | | 6,712,620 | | | | — | | | | — | | | | 6,712,620 | |
| | | | | | | | | | | | | | | | |
| | $ | 6,712,620 | | | $ | 748,038,871 | | | | — | | | $ | 754,751,491 | |
| | | | | | | | | | | | | | | | |
Derivative Financial Instruments(b) | | | | | | | | | | | | | | | | |
Assets: | | | | | | | | | | | | | | | | |
Interest rate contracts | | $ | 27,204 | | | $ | — | | | $ | — | | | $ | 27,204 | |
Liabilities: | | | | | | | | | | | | | | | | |
Interest rate contracts | | | (95,848 | ) | | | — | | | | — | | | | (95,848 | ) |
| | | | | | | | | | | | | | | | |
| | $ | (68,644 | ) | | $ | — | | | $ | — | | | $ | (68,644 | ) |
| | | | | | | | | | | | | | | | |
| | (a) | See above Schedule of Investments for values in each sector. | |
| | (b) | Derivative financial instruments are futures contracts which are valued at the unrealized appreciation (depreciation) on the instrument. | |
The Trust may hold assets and/or liabilities in which the fair value approximates the carrying amount for financial statement purposes. As of period end, such assets and/or liabilities are categorized within the disclosure hierarchy as follows:
| | | | | | | | | | | | | | | | |
| | | Level 1 | | | Level 2 | | | Level 3 | | | Total | |
Liabilities: | |
TOB Trust Certificates | | $ | — | | | $ | (70,007,186 | ) | | $ | — | | | $ | (70,007,186 | ) |
VRDP Shares at Liquidation Value | | | — | | | | (243,600,000 | ) | | | — | | | | (243,600,000 | ) |
| | | | | | | | | | | | | | | | |
| | $ | — | | | $ | (313,607,186 | ) | | $ | — | | | $ | (313,607,186 | ) |
| | | | | | | | | | | | | | | | |
During the six months ended February 28, 2018, there were no transfers between levels.
See notes to financial statements.
| | |
| 36 | | 2018 BLACKROCK SEMI-ANNUAL REPORTTO SHAREHOLDERS |
| | |
Schedule of Investments (unaudited) February 28, 2018 | | BlackRock New Jersey Municipal Bond Trust (BLJ) (Percentages shown are based on Net Assets) |
| | | | | | | | |
| Security | | Par
(000) | | | Value | |
Municipal Bonds — 136.3% | | | | | | | | |
| | |
| New Jersey — 135.2% | | | | | | |
| Corporate — 10.3% | | | | | | |
County of Middlesex New Jersey Improvement Authority, RB, Heldrich Center Hotel, Sub-Series B, 6.25%, 01/01/37(a)(b) | | $ | 560 | | | $ | 5,880 | |
County of Salem New Jersey Pollution Control Financing Authority, Refunding RB, Atlantic City Electric, Series A, 4.88%, 06/01/29 | | | 750 | | | | 789,263 | |
New Jersey EDA, RB, Continental Airlines, Inc. Project, Series B, AMT, 5.63%, 11/15/30 | | | 1,550 | | | | 1,753,159 | |
New Jersey EDA, Refunding RB: | | | | | | | | |
Duke Farms Foundation Project, 4.00%, 07/01/46 | | | 185 | | | | 193,543 | |
New Jersey American Water Co., Inc. Project, Series A, AMT, 5.70%, 10/01/39 | | | 500 | | | | 526,630 | |
New Jersey American Water Co., Inc. Project, Series B, AMT, 5.60%, 11/01/34 | | | 395 | | | | 420,276 | |
| | | | | | | | |
| | | | | | | 3,688,751 | |
| County/City/Special District/School District — 21.3% | | | | | | |
City of Bayonne New Jersey, GO, Refunding, Qualified General Improvement, (BAM): | | | | | | | | |
5.00%, 07/01/33 | | | 150 | | | | 166,932 | |
5.00%, 07/01/35 | | | 235 | | | | 260,270 | |
City of Margate New Jersey, GO, Refunding, Improvement(c): | | | | | | | | |
5.00%, 01/15/21 | | | 230 | | | | 250,893 | |
5.00%, 01/15/21 | | | 110 | | | | 119,992 | |
County of Essex New Jersey Improvement Authority, RB, AMT, 5.25%, 07/01/45(d) | | | 610 | | | | 611,812 | |
County of Essex New Jersey Improvement Authority, Refunding RB, Project Consolidation (NPFGC): | | | | | | | | |
5.50%, 10/01/28 | | | 400 | | | | 495,812 | |
5.50%, 10/01/29 | | | 790 | | | | 986,386 | |
County of Hudson New Jersey Improvement Authority, RB, Harrison Parking Facility Project, Series C (AGC), 5.38%, 01/01/44 | | | 800 | | | | 823,856 | |
County of Mercer New Jersey Improvement Authority, RB, Courthouse Annex Project, 5.00%, 09/01/40 | | | 235 | | | | 261,012 | |
County of Middlesex New Jersey, COP, Refunding, Civic Square IV Redevelopment, 5.00%, 10/15/31 | | | 440 | | | | 526,201 | |
County of Union New Jersey Improvement Authority, LRB, Guaranteed Lease, Family Court Building Project, 5.00%, 05/01/42 | | | 180 | | | | 197,609 | |
Monroe Township Board of Education Middlesex County, GO, Refunding, 5.00%, 03/01/38 | | | 265 | | | | 293,991 | |
New Jersey EDA, Refunding RB, Special Assessment, Kapkowski Road Landfill Project, 6.50%, 04/01/28 | | | 2,250 | | | | 2,632,275 | |
| | | | | | | | |
| | | | | | | 7,627,041 | |
| Education — 26.4% | | | | | | |
County of Atlantic New Jersey Improvement Authority, RB, Stockton University Atlantic City, Series A (AGM), 4.00%, 07/01/46 | | | 200 | | | | 203,972 | |
New Jersey EDA, RB: | | | | | | | | |
Hatikvah International Academy Charter School Project, Series A, 5.25%, 07/01/37(d) | | | 130 | | | | 124,658 | |
Hatikvah International Academy Charter School Project, Series A, 5.38%, 07/01/47(d) | | | 125 | | | | 118,383 | |
School Facilities Construction (AGC), 5.50%, 12/15/18(c) | | | 350 | | | | 361,284 | |
School Facilities Construction (AGC), 5.50%, 12/15/34 | | | 5 | | | | 5,136 | |
Team Academy Charter School Project, 6.00%, 10/01/33 | | | 455 | | | | 506,101 | |
New Jersey EDA, Refunding RB, Greater Brunswick Charter School, Inc. Project, Series A, 5.63%, 08/01/34(d) | | | 215 | | | | 217,930 | |
| | | | | | | | |
| Security | | Par
(000) | | | Value | |
| Education (continued) | | | | | | |
New Jersey Educational Facilities Authority, RB: | | | | | | | | |
Higher Educational Capital Improvement Fund, Series A, 5.00%, 09/01/32 | | $ | 500 | | | $ | 528,945 | |
Rider University Issue, Series F, 4.00%, 07/01/42 | | | 185 | | | | 178,838 | |
Rider University Issue, Series F, 5.00%, 07/01/47 | | | 135 | | | | 145,202 | |
New Jersey Educational Facilities Authority, Refunding RB: | | | | | | | | |
College of New Jersey, Series D (AGM), 5.00%, 07/01/18(c) | | | 690 | | | | 698,218 | |
Georgian Court University, Series D, 5.00%, 04/24/18(c) | | | 150 | | | | 150,813 | |
Kean University, Series A, 5.50%, 09/01/19(c) | | | 700 | | | | 739,697 | |
Montclair State University, Series A, 5.00%, 07/01/44 | | | 1,600 | | | | 1,768,624 | |
New Jersey Institute of Technology, Series H, 5.00%, 07/01/31 | | | 210 | | | | 222,789 | |
Ramapo College, Series B, 5.00%, 07/01/42 | | | 85 | | | | 92,140 | |
Seton Hall University, Series D, 5.00%, 07/01/38 | | | 105 | | | | 115,814 | |
Stevens Institute of Technology, Series A, 5.00%, 07/01/42 | | | 100 | | | | 111,175 | |
New Jersey Higher Education Student Assistance Authority, RB, Student Loan, Series 1A, AMT, 5.00%, 12/01/22 | | | 915 | | | | 1,007,708 | |
New Jersey Higher Education Student Assistance Authority, Refunding RB: | | | | | | | | |
Series 1, AMT, 5.75%, 12/01/29 | | | 385 | | | | 413,051 | |
Series 1A, 5.00%, 12/01/25 | | | 90 | | | | 94,039 | |
Series 1A, 5.00%, 12/01/26 | | | 65 | | | | 67,862 | |
Series 1A, 5.25%, 12/01/32 | | | 300 | | | | 312,906 | |
Student Loan, Series 1A, 5.13%, 12/01/27 | | | 160 | | | | 167,342 | |
New Jersey Institute of Technology, RB, Series A: | | | | | | | | |
5.00%, 07/01/40 | | | 500 | | | | 560,455 | |
5.00%, 07/01/45 | | | 220 | | | | 245,837 | |
Teaneck Community Charter School Project, Series A(d): | | | | | | | | |
5.00%, 09/01/37 | | | 125 | | | | 121,959 | |
5.13%, 09/01/52 | | | 150 | | | | 142,455 | |
| | | | | | | | |
| | | | | | | 9,423,333 | |
| Health — 9.2% | | | | | | |
New Jersey Health Care Facilities Financing Authority, RB: | | | | | | | | |
Hospitall Asset Transformation Program, Series A, 5.25%, 10/01/18(c) | | | 390 | | | | 398,830 | |
Meridian Health System Obligated Group, Series I (AGC), 5.00%, 07/01/18(c) | | | 235 | | | | 237,876 | |
Robert Wood Johnson University Hospital, Series A, 5.50%, 07/01/43 | | | 230 | | | | 259,157 | |
Virtua Health, Series A (AGC), 5.50%, 07/01/38 | | | 400 | | | | 418,116 | |
New Jersey Health Care Facilities Financing Authority, Refunding RB: | | | | | | | | |
AHS Hospital Corp., 6.00%, 07/01/21(c) | | | 610 | | | | 692,868 | |
Princeton Healthcare System, 5.00%, 07/01/39 | | | 250 | | | | 273,293 | |
RWJ Barnabas Health Obligated Group, Series A, 4.00%, 07/01/43 | | | 235 | | | | 239,507 | |
St. Barnabas Health Care System, Series A,
5.63%, 07/01/21(c) | | | 180 | | | | 201,350 | |
St. Barnabas Health Care System, Series A,
5.63%, 07/01/21(c) | | | 505 | | | | 564,898 | |
| | | | | | | | |
| | | | | | | 3,285,895 | |
| Housing — 2.0% | | | | | | |
New Jersey Housing & Mortgage Finance Agency, RB: | | | | | | | | |
M/F Housing, Series A, 4.75%, 11/01/29 | | | 370 | | | | 378,902 | |
S/F Housing, Series CC, 5.00%, 10/01/34 | | | 225 | | | | 230,848 | |
New Jersey Housing & Mortgage Finance Agency, Refunding RB, Series D, AMT, 4.25%, 11/01/37 | | | 120 | | | | 120,158 | |
| | | | | | | | |
| | | | | | | 729,908 | |
| State — 22.7% | | | | | | |
Casino Reinvestment Development Authority, Refunding RB, 5.25%, 11/01/44 | | | 870 | | | | 924,645 | |
| | | | |
| SCHEDULES OF INVESTMENTS | | | 37 | |
| | |
Schedule of Investments (unaudited) (continued) February 28, 2018 | | BlackRock New Jersey Municipal Bond Trust (BLJ) (Percentages shown are based on Net Assets) |
| | | | | | | | |
| Security | | Par
(000) | | | Value | |
| State (continued) | | | | | | |
Garden State Preservation Trust, RB, CAB, Series B (AGM), 0.00%, 11/01/27(e) | | $ | 4,000 | | | $ | 2,918,120 | |
New Jersey EDA, RB: | | | | | | | | |
Motor Vehicle Surcharge, Series A (NPFGC), 5.25%, 07/01/25(f) | | | 55 | | | | 65,886 | |
Motor Vehicle Surcharge, Series A (NPFGC), 5.25%, 07/01/25 | | | 445 | | | | 499,223 | |
New Jersey EDA, Refunding RB: | | | | | | | | |
Cigarette Tax, 5.00%, 06/15/28 | | | 255 | | | | 273,658 | |
Cigarette Tax, 5.00%, 06/15/29 | | | 500 | | | | 535,340 | |
Cigarette Tax (AGM), 5.00%, 06/15/22 | | | 750 | | | | 815,542 | |
School Facilities Construction, Series AA, 5.50%, 06/15/19(c) | | | 335 | | | | 351,556 | |
School Facilities Construction, Series AA, 5.50%, 12/15/29 | | | 165 | | | | 171,178 | |
School Facilities Construction, Series GG, 5.25%, 09/01/27 | | | 1,295 | | | | 1,364,995 | |
State of New Jersey, COP, Equipment Lease Purchase, Series A, 5.25%, 06/15/19(c) | | | 200 | | | | 209,250 | |
| | | | | | | | |
| | | | | | | 8,129,393 | |
| Tobacco — 1.8% | | | | | | |
Tobacco Settlement Financing Corp., Refunding RB, Series 1A, 5.00%, 06/01/41 | | | 650 | | | | 646,763 | |
| | | | | | | | |
| Transportation — 40.4% | | | | | | |
Delaware River Port Authority, RB, Series D, 5.00%, 01/01/40 | | | 250 | | | | 263,270 | |
New Jersey EDA, RB, Goethals Bridge Replacement Project, AMT, Private Activity Bond, 5.38%, 01/01/43 | | | 1,360 | | | | 1,501,671 | |
New Jersey State Turnpike Authority, RB: | | | | | | | | |
Series A, 5.00%, 07/01/22(c) | | | 1,175 | | | | 1,326,751 | |
Series A, 5.00%, 07/01/22(c) | | | 315 | | | | 354,983 | |
Series A, 5.00%, 01/01/35 | | | 125 | | | | 141,978 | |
Series A, 5.00%, 01/01/43 | | | 185 | | | | 202,828 | |
Series E, 5.25%, 01/01/19(c) | | | 370 | | | | 381,840 | |
Series E, 5.00%, 01/01/45 | | | 720 | | | | 797,990 | |
New Jersey Transportation Trust Fund Authority, RB: | | | | | | | | |
CAB, Transportation System, Series C (AGM), 0.00%, 12/15/32(e) | | | 1,250 | | | | 674,125 | |
Federal Highway Reimbursement Revenue Notes, Series A, 5.00%, 06/15/30 | | | 125 | | | | 136,593 | |
Federal Highway Reimbursement Revenue Notes, Series A-2, 5.00%, 06/15/30 | | | 805 | | | | 811,376 | |
Transportation Program, Series AA, 5.00%, 06/15/38 | | | 705 | | | | 735,040 | |
Transportation Program, Series AA, 5.25%, 06/15/41 | | | 480 | | | | 509,467 | |
Transportation System, 6.00%, 12/15/38 | | | 325 | | | | 334,584 | |
Transportation System, Series A, 6.00%, 06/15/35 | | | 1,275 | | | | 1,397,132 | |
Transportation System, Series A, 5.88%, 12/15/38 | | | 555 | | | | 570,834 | |
Transportation System, Series A, 5.50%, 06/15/41 | | | 830 | | | | 873,940 | |
Transportation System, Series A (AGC), 5.63%, 12/15/28 | | | 200 | | | | 205,812 | |
Transportation System, Series AA, 5.50%, 06/15/39 | | | 425 | | | | 452,782 | |
Port Authority of New York & New Jersey, ARB, Special Project, JFK International Air Terminal LLC Project, Series 8, 6.00%, 12/01/42 | | | 450 | | | | 493,556 | |
Port Authority of New York & New Jersey, Refunding ARB, Consolidated: | | | | | | | | |
166th Series, 5.25%, 07/15/36 | | | 500 | | | | 546,550 | |
172nd Series, AMT, 5.00%, 10/01/34 | | | 1,000 | | | | 1,091,110 | |
206th Series, AMT, 5.00%, 11/15/42 | | | 170 | | | | 191,563 | |
206th Series, AMT, 5.00%, 11/15/47 | | | 190 | | | | 213,266 | |
South Jersey Port Corp., Refunding ARB, Marine Terminal, Series B, AMT, 5.00%, 01/01/48 | | | 240 | | | | 253,142 | |
| | | | | | | | |
| | | | | | | 14,462,183 | |
| Utilities — 1.1% | | | | | | |
Rahway Valley Sewerage Authority, RB, CAB, Series A (NPFGC), 0.00%, 09/01/33(e) | | | 650 | | | | 373,347 | |
| | | | | | | | |
| | | | | | | | |
| Security | | Par
(000) | | | Value | |
| Puerto Rico — 1.1% | | | | | | |
Children’s Trust Fund, Refunding RB, Tobacco Settlement Asset-Backed Bonds: | | | | | | | | |
5.50%, 05/15/39 | | $ | 210 | | | $ | 197,476 | |
5.63%, 05/15/43 | | | 200 | | | | 186,374 | |
| | | | | | | | |
| | | | | | | 383,850 | |
| | | | | | | | |
Total Municipal Bonds — 136.3%
(Cost — $46,341,907) | | | | 48,750,464 | |
| | | | | | | | |
|
Municipal Bonds Transferred to Tender Option Bond
Trusts(g) — 31.3% | |
|
| New Jersey — 31.3% | |
| County/City/Special District/School District — 8.7% | |
County of Hudson New Jersey Improvement Authority, RB, Hudson County Vocational-Technical Schools Project,
5.25%, 05/01/51 | | | 340 | | | | 384,496 | |
County of Union New Jersey Utilities Authority, Refunding RB, Series A, AMT: | | | | | | | | |
County Deficiency Agreement, 5.00%, 06/15/41 | | | 690 | | | | 752,790 | |
Resource Recovery Facility, Covanta Union, Inc., 5.25%, 12/01/31 | | | 1,780 | | | | 1,969,294 | |
| | | | | | | | |
| | | | | | | 3,106,580 | |
| Education — 6.0% | |
Rutgers — The State University of New Jersey, Refunding RB: | | | | | | | | |
Series F, 5.00%, 05/01/19(c) | | | 991 | | | | 1,030,497 | |
Series L, 5.00%, 05/01/43 | | | 990 | | | | 1,092,000 | |
| | | | | | | | |
| | | | | | | 2,122,497 | |
| Health — 2.8% | |
New Jersey Health Care Facilities Financing Authority, RB, Inspira Health Obligated Group, 4.00%, 07/01/47 | | | 999 | | | | 1,002,925 | |
| | | | | | | | |
| State — 2.9% | |
New Jersey EDA, RB, School Facilities Construction (AGC)(c): | | | | | | | | |
6.00%, 12/15/18 | | | 986 | | | | 1,021,347 | |
6.00%, 12/15/18 | | | 14 | | | | 14,453 | |
| | | | | | | | |
| | | | | | | 1,035,800 | |
| Transportation — 10.9% | |
New Jersey Transportation Trust Fund Authority, RB, Transportation System: | | | | | | | | |
Series A (AMBAC) (AGM), 5.00%, 12/15/32 | | | 600 | | | | 601,263 | |
Series B, 5.25%, 06/15/36(h) | | | 1,000 | | | | 1,052,161 | |
Port Authority of New York & New Jersey, Refunding ARB, Consolidated, AMT: | | | | | | | | |
152nd Series, 5.25%, 11/01/35 | | | 630 | | | | 633,046 | |
169th Series, 5.00%, 10/15/41 | | | 1,501 | | | | 1,620,381 | |
| | | | | | | | |
| | | | | | | 3,906,851 | |
| | | | | | | | |
Total Municipal Bonds Transferred to Tender Option Bond
Trusts — 31.3%
(Cost — $10,633,239) | | | | 11,174,653 | |
| | | | | | | | |
Total Long-Term Investments — 167.6%
(Cost — $56,975,146) | | | | 59,925,117 | |
| | | | | | | | |
| | |
| 38 | | 2018 BLACKROCK SEMI-ANNUAL REPORTTO SHAREHOLDERS |
| | |
Schedule of Investments (unaudited) (continued) February 28, 2018 | | BlackRock New Jersey Municipal Bond Trust (BLJ) (Percentages shown are based on Net Assets) |
| | | | | | | | |
| Security | |
Shares | | | Value | |
Short-Term Securities — 0.2% | | | | | | | | |
BlackRock Liquidity Funds, MuniCash, Institutional Class,
0.94%(i)(j) | | | 82,825 | | | $ | 82,833 | |
| | | | | | | | |
Total Short-Term Securities — 0.2%
(Cost — $82,833) | | | | 82,833 | |
| | | | | | | | |
| |
Total Investments — 167.8%
(Cost — $57,057,979) | | | | 60,007,950 | |
Other Assets Less Liabilities — 1.4% | | | | 518,902 | |
Liability for TOB Trust Certificates, Including Interest Expense and Fees Payable — (16.8)% | | | | (6,036,088 | ) |
Loan for TOB Trust Certificates — (0.3)% | | | | (99,820 | ) |
VRDP Shares at Liquidation Value, Net of Deferred Offering
Costs — (52.1)% | | | | (18,627,971 | ) |
| | | | | | | | |
Net Assets Applicable to Common Shares — 100.0% | | | $ | 35,762,973 | |
| | | | | | | | |
| (a) | Issuer filed for bankruptcy and/or is in default. |
| (b) | Non-income producing security. |
| (c) | U.S. Government securities, held in escrow, are used to pay interest on this security, as well as to retire the bond in full at the date indicated, typically at a premium to par. |
| (d) | Security exempt from registration pursuant to Rule 144A under the Securities Act of 1933, as amended. These securities may be resold in transactions exempt from registration to qualified institutional investors. |
| (f) | Security is collateralized by municipal bonds or U.S. Treasury obligations. |
| (g) | Represent bonds transferred to a TOB Trust in exchange of cash and residual certificates received by the Trust. These bonds serve as collateral in a secured borrowing. See Note 4 of the Notes to Financial Statements for details. |
| (h) | All or a portion of security is subject to a recourse agreement. The aggregate maximum potential amount the Trust could ultimately be required to pay under the agreements, which expires on June 15, 2019, is $776,985. See Note 4 of the Notes to Financial Statements for details. |
| (i) | Annualized 7-day yield as of period end. |
| (j) | During the period ended February 28, 2018, investments in issuers considered to be an affiliate of the Trust for purposes of Section 2(a)(3) of the Investment Company Act of 1940, as amended, and/or related parties of the Fund were as follows: |
| | | | | | | | | | | | | | | | | | | | | | | | | | | | |
| Affiliated | | Shares
Held at
08/31/17 | | | Net
Activity | | | Shares
Held at
02/28/18 | | | Value at
02/28/28 | | | Income | | | Net
Realized
Gain (Loss) (a) | | | Change in
Unrealized
Appreciation
(Depreciation) | |
BlackRock Liquidity Funds, MuniCash, Institutional Class | | | — | | | | 82,825 | | | | 82,825 | | | $ | 82,833 | | | $ | 161 | | | $ | (5 | ) | | $ | — | |
| | | | | | | | | | | | | | | | | | | | | | | | | | | | |
| | (a) | Includes net capital gain distributions, if applicable. | |
For Trust compliance purposes, the Trust’s sector classifications refer to one or more of the sector sub-classifications used by one or more widely recognized market indexes or rating group indexes, and/or as defined by the investment adviser. These definitions may not apply for purposes of this report, which may combine such sector sub-classifications for reporting ease.
Derivative Financial Instruments Outstanding as of Period End
Futures Contracts
| | | | | | | | | | | | | | | | |
| Description | | Number of
Contracts | | | Expiration
Date | | | Notional
Amount (000) | | | Value/
Unrealized
Appreciation
(Depreciation) | |
Short Contracts: | | | | | | | | | | | | | | | | |
Long U.S. Treasury Bond | | | 8 | | | | 06/20/18 | | | $ | 1,148 | | | $ | (4,763 | ) |
10-Year U.S. Treasury Note | | | 11 | | | | 06/20/18 | | | | 1,321 | | | | 1,031 | |
5-Year U.S. Treasury Note | | | 6 | | | | 06/29/18 | | | | 684 | | | | 986 | |
| | | | | | | | | | | | | | | | |
| | | | | | | | | | | | | | $ | (2,746 | ) |
| | | | | | | | | | | | | | | | |
Derivative Financial Instruments Categorized by Risk Exposure
As of period end, the fair values of derivative financial instruments located in the Statements of Assets and Liabilities were as follows:
| | | | | | | | | | | | | | | | | | | | | | | | | | | | |
| | | Commodity
Contracts | | | Credit
Contracts | | | Equity
Contracts | | | Foreign
Currency
Exchange
Contracts | | | Interest
Rate
Contracts | | | Other
Contracts | | | Total | |
Assets — Derivative Financial Instruments | | | | | | | | | | | | | | | | | | | | | | | | | | | | |
Futures contracts | | | | | | | | | | | | | | | | | | | | | | | | | | | | |
Net unrealized appreciation(a) | | $ | — | | | $ | — | | | $ | — | | | $ | — | | | $ | 2,017 | | | $ | — | | | $ | 2,017 | |
| | | | | | | | | | | | | | | | | | | | | | | | | | | | |
Liabilities — Derivative Financial Instruments | | | | | | | | | | | | | | | | | | | | | | | | | | | | |
Futures contracts | | | | | | | | | | | | | | | | | | | | | | | | | | | | |
Net unrealized depreciation(a) | | $ | — | | | $ | — | | | $ | — | | | $ | — | | | $ | 4,763 | | | $ | — | | | $ | 4,763 | |
| | | | | | | | | | | | | | | | | | | | | | | | | | | | |
| | (a) | Includes cumulative appreciation (depreciation) on futures contracts, if any, as reported in the Schedule of Investments. Only current day’s variation margin is reported within the Statements of Assets and Liabilities. | |
| | | | |
| SCHEDULES OF INVESTMENTS | | | 39 | |
| | |
Schedule of Investments (unaudited) (continued) February 28, 2018 | | BlackRock New Jersey Municipal Bond Trust (BLJ) |
For the six months ended February 28, 2018, the effect of derivative financial instruments in the Statements of Operations was as follows:
| | | | | | | | | | | | | | | | | | | | | | | | |
| | | Credit
Contracts | | | Equity
Contracts | | | Foreign
Currency
Exchange
Contracts | | | Interest
Rate
Contracts | | | Other
Contracts | | | Total | |
Net Realized Gain (Loss) from: | | | | | | | | | | | | | | | | | | | | | | | | |
Futures contracts | | $ | — | | | $ | — | | | $ | — | | | $ | 231,953 | | | $ | — | | | $ | 231,953 | |
| | | | | | | | | | | | | | | | | | | | | | | | |
| Net Change in Unrealized Appreciation (Depreciation) on: | | | | | | | | | | | | | | | | | | |
Futures contracts | | $ | — | | | $ | — | | | $ | — | | | $ | 12,524 | | | $ | — | | | $ | 12,524 | |
| | | | | | | | | | | | | | | | | | | | | | | | |
Average Quarterly Balances of Outstanding Derivative Financial Instruments
| | | | |
Futures contracts: | |
Average notional value of contracts — short | | $ | 2,734,438 | |
For more information about the Trust’s investment risks regarding derivative financial instruments, refer to the Notes to Financial Statements.
Fair Value Hierarchy as of Period End
Various inputs are used in determining the fair value of investments and derivative financial instruments. For information about the Trust’s policy regarding valuation of investments and derivative financial instruments, refer to the Notes to Financial Statements.
The following tables summarize the Trust’s investments and derivative financial instruments categorized in the disclosure hierarchy:
| | | | | | | | | | | | | | | | |
| | | Level 1 | | | Level 2 | | | Level 3 | | | Total | |
Assets: | |
Investments: | |
Long-Term Investments(a) | | $ | — | | | $ | 59,925,117 | | | $ | — | | | $ | 59,925,117 | |
Short-Term Securities | | | 82,833 | | | | — | | | | — | | | | 82,833 | |
| | | | | | | | | | | | | | | | |
| | $ | 82,833 | | | $ | 59,925,117 | | | $ | — | | | $ | 60,007,950 | |
| | | | | | | | | | | | | | | | |
Derivative Financial Instruments(b) | |
Assets: | |
Interest rate contracts | | $ | 2,017 | | | $ | — | | | $ | — | | | $ | 2,017 | |
Liabilities: | |
Interest rate contracts | | | (4,763 | ) | | | — | | | | — | | | | (4,763 | ) |
| | | | | | | | | | | | | | | | |
| | $ | (2,746 | ) | | $ | — | | | $ | — | | | $ | (2,746 | ) |
| | | | | | | | | | | | | | | | |
| | (a) | See above Schedule of Investments for values in each sector. | |
| | (b) | Derivative financial instruments are futures contracts which are valued at the unrealized appreciation (depreciation) on the instrument. | |
The Trust may hold assets and/or liabilities in which the fair value approximates the carrying amount for financial statement purposes. As of period end, such assets and/or liabilities are categorized within the disclosure hierarchy as follows:
| | | | | | | | | | | | | | | | |
| | | Level 1 | | | Level 2 | | | Level 3 | | | Total | |
Liabilities: | |
TOB Trust Certificates | | $ | — | | | $ | (6,015,711 | ) | | $ | — | | | $ | (6,015,711 | ) |
Loan for TOB Trust Certificates | | | — | | | | (99,820 | ) | | | — | | | | (99,820 | ) |
VRDP Shares at Liquidation Value | | | — | | | | (18,700,000 | ) | | | — | | | | (18,700,000 | ) |
| | | | | | | | | | | | | | | | |
| | $ | — | | | $ | (24,815,531 | ) | | $ | — | | | $ | (24,815,531 | ) |
| | | | | | | | | | | | | | | | |
During the six months ended February 28, 2018, there were no transfers between levels.
See notes to financial statements.
| | |
| 40 | | 2018 BLACKROCK SEMI-ANNUAL REPORTTO SHAREHOLDERS |
| | |
Schedule of Investments (unaudited) February 28, 2018 | | BlackRock New York Municipal Bond Trust (BQH) (Percentages shown are based on Net Assets) |
| | | | | | | | |
| Security | | Par
(000) | | | Value | |
Municipal Bonds — 137.6% | |
|
| New York — 136.5% | |
| Corporate — 4.3% | |
Build NYC Resource Corp., Refunding RB, Pratt Paper, Inc. Project, AMT, 5.00%, 01/01/35(a) | | $ | 100 | | | $ | 107,341 | |
City of New York New York Industrial Development Agency, Refunding RB, Transportation Infrastructure Properties LLC, Series A, AMT, 5.00%, 07/01/28 | | | 690 | | | | 739,825 | |
County of Essex New York Industrial Development Agency, RB, International Paper Co. Project, Series A, AMT, 6.63%, 09/01/32 | | | 100 | | | | 102,539 | |
County of Onondaga New York Industrial Development Agency, RB, Bristol-Meyers Squibb Co. Project, AMT, 5.75%, 03/01/24 | | | 250 | | | | 295,143 | |
New York Liberty Development Corp., Refunding RB, Goldman Sachs Headquarters, 5.25%, 10/01/35 | | | 210 | | | | 257,941 | |
Niagara Area Development Corp., Refunding RB, Solid Waste Disposal Facility, Covanta Energy Project, Series A, AMT, 5.25%, 11/01/42(a) | | | 375 | | | | 375,232 | |
| | | | | | | | |
| | | | | | | 1,878,021 | |
| County/City/Special District/School District — 31.8% | |
City of New York New York, GO, Refunding: | | | | | | | | |
Series E, 5.50%, 08/01/25 | | | 150 | | | | 174,715 | |
Series J, 5.00%, 08/01/32 | | | 500 | | | | 571,095 | |
City of New York New York, GO: | | | | | | | | |
Series A-1, 4.75%, 08/15/25 | | | 500 | | | | 507,370 | |
Series D, 5.38%, 06/01/32 | | | 15 | | | | 15,053 | |
Series G-1, 6.25%, 12/15/31 | | | 5 | | | | 5,192 | |
Sub-Series D-1, Fiscal 2014, 5.00%, 08/01/31 | | | 245 | | | | 276,358 | |
Sub-Series G-1, 6.25%, 12/15/18(b) | | | 245 | | | | 254,251 | |
Sub-Series G-1, 5.00%, 04/01/29 | | | 250 | | | | 276,347 | |
Sub-Series I-1, 5.38%, 04/01/19(b) | | | 115 | | | | 119,732 | |
Sub-Series I-1, 5.38%, 04/01/36 | | | 20 | | | | 20,801 | |
City of New York New York Convention Center Development Corp., RB, CAB, Sub Lien, Hotel Unit Fee, Series B (AGM), 0.00%, 11/15/55(c) | | | 500 | | | | 101,660 | |
City of New York New York Convention Center Development Corp., Refunding RB, Hotel Unit Fee Secured: | | | | | | | | |
5.00%, 11/15/40 | | | 1,110 | | | | 1,247,818 | |
5.00%, 11/15/45 | | | 670 | | | | 749,784 | |
City of New York New York Industrial Development Agency, RB, PILOT: | | | | | | | | |
CAB, Yankee Stadium Project, Series A (AGC), 0.00%, 03/01/41(c) | | | 4,155 | | | | 1,622,860 | |
CAB, Yankee Stadium Project, Series A (AGC), 0.00%, 03/01/42(c) | | | 500 | | | | 185,280 | |
CAB, Yankee Stadium Project, Series A (AGC), 0.00%, 03/01/43(c) | | | 2,000 | | | | 704,160 | |
CAB, Yankee Stadium Project, Series A (AGC), 0.00%, 03/01/45(c) | | | 950 | | | | 304,437 | |
(AMBAC), 5.00%, 01/01/39 | | | 325 | | | | 327,515 | |
Queens Baseball Stadium (AGC), 6.38%, 01/01/39 | | | 100 | | | | 103,802 | |
Queens Baseball Stadium (AMBAC), 5.00%, 01/01/46 | | | 175 | | | | 176,158 | |
Yankee Stadium Project (NPFGC), 5.00%, 03/01/46 | | | 175 | | | | 175,990 | |
County of Erie New York Fiscal Stability Authority, RB, Sales Tax and State Aid Secured Refunding Bonds, Series D: | | | | | | | | |
5.00%, 09/01/35 | | | 25 | | | | 29,196 | |
5.00%, 09/01/36 | | | 25 | | | | 29,128 | |
5.00%, 09/01/37 | | | 25 | | | | 29,061 | |
5.00%, 09/01/38 | | | 40 | | | | 46,425 | |
5.00%, 09/01/39 | | | 35 | | | | 40,559 | |
| | | | | | | | |
| Security | | Par
(000) | | | Value | |
| County/City/Special District/School District (continued) | |
County of Nassau New York, GO: | | | | | | | | |
Series A, 5.00%, 01/15/31 | | $ | 250 | | | $ | 285,745 | |
Refunding Series B, 5.00%, 04/01/32 | | | 190 | | | | 217,083 | |
Hudson Yards Infrastructure Corp., Refunding RB, Series A: | | | | | | | | |
2nd Indenture, 5.00%, 02/15/45 | | | 125 | | | | 140,838 | |
Fiscal 2017, 5.00%, 02/15/42 | | | 405 | | | | 457,650 | |
5.00%, 02/15/37 | | | 50 | | | | 56,916 | |
New York Liberty Development Corp., Refunding RB: | | | | | | | | |
2nd Priority, Bank of America Tower at One Bryant Park Project, Class 2, 5.63%, 07/15/47 | | | 1,350 | | | | 1,446,552 | |
2nd Priority, Bank of America Tower at One Bryant Park Project, Class 3, 6.38%, 07/15/49 | | | 285 | | | | 304,713 | |
3 World Trade Center Project, Class 2, 5.38%, 11/15/40(a) | | | 120 | | | | 131,084 | |
4 World Trade Center Project, 5.00%, 11/15/31 | | | 750 | | | | 825,382 | |
7 World Trade Center Project, Class 1, 4.00%, 09/15/35 | | | 320 | | | | 334,931 | |
7 World Trade Center Project, Class 2, 5.00%, 09/15/43 | | | 500 | | | | 543,890 | |
7 World Trade Center Project, Class 3, 5.00%, 03/15/44 | | | 520 | | | | 552,334 | |
World Trade Center Project, 5.75%, 11/15/51 | | | 340 | | | | 382,167 | |
| | | | | | | | |
| | | | | | | 13,774,032 | |
| Education — 35.4% | |
Amherst Development Corp., Refunding RB, University at Buffalo Foundation Faculty-Student Housing Corp., Series A (AGM), 4.63%, 10/01/20(b) | | | 140 | | | | 150,588 | |
Build NYC Resource Corp., Refunding RB: | | | | | | | | |
City University New York-Queens College Student Residences, LLC Project, Series A, 5.00%, 06/01/38 | | | 250 | | | | 279,487 | |
Ethical Culture Fieldston School Project, 5.00%, 06/01/32 | | | 450 | | | | 502,929 | |
Manhattan College Project, 5.00%, 08/01/35 | | | 120 | | | | 135,664 | |
Packer Collegiate Institute Project, 5.00%, 06/01/40 | | | 310 | | | | 339,521 | |
City of New York New York Trust for Cultural Resources, RB, Juilliard School, Series A, 5.00%, 01/01/39 | | | 250 | | | | 256,498 | |
City of New York New York Trust for Cultural Resources, Refunding RB, Series A: | | | | | | | | |
American Museum of Natural History, 5.00%, 07/01/37 | | | 110 | | | | 124,149 | |
Carnegie Hall, 4.75%, 12/01/39 | | | 400 | | | | 417,868 | |
City of Troy New York Capital Resource Corp., Refunding RB, Rensselaer Polytechnic Institute Project: | | | | | | | | |
Series A, 5.13%, 09/01/40 | | | 610 | | | | 643,678 | |
Series B, 4.00%, 08/01/35 | | | 110 | | | | 112,775 | |
City of Yonkers New York Industrial Development Agency, RB, Sarah Lawrence College Project, Series A, 6.00%, 06/01/19(b) | | | 250 | | | | 263,555 | |
Counties of Buffalo & Erie New York Industrial Land Development Corp., Refunding RB, The Charter School for Applied Technologies Project, Series A, 5.00%, 06/01/35 | | | 55 | | | | 58,038 | |
County of Cattaraugus New York, RB, St. Bonaventure University Project, 5.00%, 05/01/39 | | | 60 | | | | 65,130 | |
County of Dutchess New York Local Development Corp., Refunding RB, Vassar College Project: | | | | | | | | |
5.00%, 07/01/42 | | | 100 | | | | 113,897 | |
4.00%, 07/01/46 | | | 185 | | | | 189,927 | |
County of Monroe New York Industrial Development Corp., RB, University of Rochester Project(b): | | | | | | | | |
5.00%, 07/01/21 | | | 110 | | | | 121,327 | |
5.00%, 07/01/21 | | | 390 | | | | 431,492 | |
Series A, 5.00%, 07/01/21 | | | 500 | | | | 553,195 | |
County of Monroe New York Industrial Development Corp., Refunding RB: | | | | | | | | |
Nazareth College of Rochester Project, 4.00%, 10/01/47 | | | 25 | | | | 24,356 | |
University of Rochester Project, Series A,
5.00%, 07/01/23(b) | | | 120 | | | | 138,114 | |
University of Rochester Project, Series D, 4.00%, 07/01/43 | | | 125 | | | | 128,928 | |
| | | | |
| SCHEDULES OF INVESTMENTS | | | 41 | |
| | |
Schedule of Investments (unaudited) (continued) February 28, 2018 | | BlackRock New York Municipal Bond Trust (BQH) (Percentages shown are based on Net Assets) |
| | | | | | | | |
| Security | | Par
(000) | | | Value | |
| Education (continued) | |
County of Nassau New York Industrial Development Agency, Refunding RB, New York Institute of Technology Project, Series A, 4.75%, 03/01/20(b) | | $ | 200 | | | $ | 212,172 | |
County of Tompkins New York Development Corp., RB, Ithaca College Project (AGM), 5.50%, 01/01/21(b) | | | 100 | | | | 110,573 | |
Geneva Development Corp., Refunding RB, Hobart & William Smith Colleges, 5.25%, 09/01/44 | | | 160 | | | | 179,411 | |
State of New York Dormitory Authority, RB: | | | | | | | | |
5.00%, 03/15/30 | | | 500 | | | | 585,070 | |
Convent of the Sacred Heart (AGM), 5.75%, 11/01/40 | | | 300 | | | | 332,658 | |
Education, Series B, 5.75%, 03/15/19(b) | | | 300 | | | | 313,407 | |
New York University, Series 1 (AMBAC) (BHAC), 5.50%, 07/01/31 | | | 245 | | | | 299,662 | |
New York University, Series B, 5.00%, 07/01/42 | | | 500 | | | | 556,420 | |
State University Dormitory Facilities, Series A,
5.00%, 07/01/19(b) | | | 150 | | | | 156,848 | |
Teachers College, Series B, 5.00%, 07/01/42 | | | 750 | | | | 820,027 | |
Touro College & University System, Series A, 5.25%, 01/01/34 | | | 250 | | | | 274,935 | |
Touro College & University System, Series A, 5.50%, 01/01/39 | | | 500 | | | | 553,625 | |
University of Rochester, Series A, 5.13%, 07/01/19(b) | | | 185 | | | | 193,497 | |
University of Rochester, Series A, 5.75%, 07/01/19(b) | | | 150 | | | | 158,118 | |
University of Rochester, Series A, 5.13%, 07/01/39 | | | 30 | | | | 31,346 | |
University of Rochester, Series A, 5.75%, 07/01/39 | | | 25 | | | | 26,374 | |
State of New York Dormitory Authority, Refunding RB: | | | | | | | | |
Barnard College, Series A, 5.00%, 07/01/34 | | | 100 | | | | 113,704 | |
Brooklyn Law School, 5.75%, 07/01/33 | | | 125 | | | | 130,061 | |
Cornell University, Series A, 5.00%, 07/01/40 | | | 150 | | | | 160,442 | |
Fordham University, 5.00%, 07/01/44 | | | 340 | | | | 378,100 | |
Icahn School of Medicine at Mount Sinai, Series A, 5.00%, 07/01/35 | | | 345 | | | | 382,188 | |
New York University, Series A, 5.00%, 07/01/37 | | | 445 | | | | 496,771 | |
New York University, Series A, 5.00%, 07/01/42 | | | 1,750 | | | | 1,947,470 | |
Skidmore College, Series A, 5.00%, 07/01/28 | | | 250 | | | | 273,365 | |
State University Dormitory Facilities, Series A, 5.25%, 07/01/30 | | | 350 | | | | 401,131 | |
State University Dormitory Facilities, Series A, 5.25%, 07/01/32 | | | 350 | | | | 400,564 | |
State University Dormitory Facilities, Series A, 5.00%, 07/01/46 | | | 190 | | | | 215,751 | |
Teachers College, 5.50%, 03/01/19(b) | | | 350 | | | | 364,017 | |
Town of Hempstead New York Local Development Corp., Refunding RB: | | | | | | | | |
Adelphi University Project, 5.00%, 10/01/34 | | | 105 | | | | 117,586 | |
Hofstra University Project, 5.00%, 07/01/47 | | | 100 | | | | 111,848 | |
| | | | | | | | |
| | | | | | | 15,348,257 | |
| Health — 16.7% | | | | | | |
Counties of Buffalo & Erie New York Industrial Land Development Corp., RB, Catholic Health System Obligation, 5.25%, 07/01/35 | | | 500 | | | | 553,395 | |
County of Dutchess New York Local Development Corp., Refunding RB, Health Quest System, Inc., Series A (AGM), 5.75%, 07/01/30 | | | 350 | | | | 382,921 | |
County of Genesee New York Industrial Development Agency, Refunding RB, United Memorial Medical Center Project, 5.00%, 12/01/27 | | | 130 | | | | 130,071 | |
County of Monroe New York Industrial Development Corp., RB, Rochester General Hospital Project: | | | | | | | | |
4.00%, 12/01/41 | | | 100 | | | | 99,543 | |
5.00%, 12/01/46 | | | 160 | | | | 174,813 | |
Series A, 5.00%, 12/01/37 | | | 370 | | | | 397,495 | |
| | | | | | | | |
| Security | | Par
(000) | | | Value | |
| Health (continued) | | | | | | |
County of Monroe New York Industrial Development Corp., Refunding RB, Unity Hospital of Rochester Project (FHA), 5.50%, 08/15/40 | | $ | 275 | | | $ | 302,461 | |
County of Suffolk New York EDC, RB, Catholic Health Services, Series C, 5.00%, 07/01/32 | | | 80 | | | | 87,518 | |
County of Westchester New York Healthcare Corp., Refunding RB, Senior Lien: | | | | | | | | |
Remarketing, Series A, 5.00%, 11/01/30 | | | 1,030 | | | | 1,099,813 | |
Series B, 6.00%, 11/01/20(b) | | | 175 | | | | 194,367 | |
Series B, 6.00%, 11/01/30 | | | 25 | | | | 27,173 | |
County of Westchester New York Local Development Corp., Refunding RB, Kendal On Hudson Project, 5.00%, 01/01/34 | | | 500 | | | | 536,720 | |
State of New York Dormitory Authority, RB: | | | | | | | | |
Mental Health Services (AGM), 5.00%, 08/15/18(b) | | | 5 | | | | 5,082 | |
Mental Health Services (AGM), 5.00%, 02/15/22 | | | 25 | | | | 25,416 | |
New York State Association for Retarded Children, Inc., Series B (AMBAC), 6.00%, 07/01/19(b) | | | 185 | | | | 195,745 | |
New York University Hospitals Center, Series A, 5.75%, 07/01/20(b) | | | 220 | | | | 240,535 | |
North Shore-Long Island Jewish Obligated Group, Series A, 5.75%, 05/01/19(b) | | | 500 | | | | 523,940 | |
State of New York Dormitory Authority, Refunding RB: | | | | | | | | |
Memorial Sloan-Kettering Cancer Center, Series 1, 4.00%, 07/01/37 | | | 25 | | | | 26,395 | |
Memorial Sloan-Kettering Cancer Center, Series 1, 5.00%, 07/01/42 | | | 205 | | | | 232,960 | |
Miriam Osborn Memorial Home Association, 5.00%, 07/01/29 | | | 290 | | | | 300,040 | |
Mount Sinai Hospital, Series A, 5.00%, 07/01/26 | | | 315 | | | | 335,239 | |
North Shore-Long Island Jewish Obligated Group, Series A, 5.00%, 05/01/21(b) | | | 1,000 | | | | 1,098,290 | |
North Shore-Long Island Jewish Obligated Group, Series E, 5.50%, 05/01/33 | | | 250 | | | | 259,247 | |
| | | | | | | | |
| | | | | | | 7,229,179 | |
| Housing — 5.5% | | | | | | |
City of New York New York Housing Development Corp., RB, M/F Housing, Fund Grant Program, New York City Housing Authority Program, Series B1: | | | | | | | | |
5.25%, 07/01/32 | | | 735 | | | | 812,065 | |
5.00%, 07/01/33 | | | 250 | | | | 272,138 | |
City of New York New York Housing Development Corp., Refunding RB, M/F Housing, 8 Spruce Street, Class F, 4.50%, 02/15/48 | | | 500 | | | | 515,665 | |
County of Onondaga New York Trust for Cultural Resources, Refunding RB, Abby Lane Housing Corporation Project, 5.00%, 05/01/40 | | | 135 | | | | 148,748 | |
State of New York HFA, RB: | | | | | | | | |
Affordable Housing, Series E (SONYMA), 4.15%, 11/01/47 | | | 165 | | | | 168,432 | |
M/F Housing, Highland Avenue Senior Apartments, Series A, AMT (SONYMA), 5.00%, 02/15/39 | | | 490 | | | | 491,759 | |
| | | | | | | | |
| | | | | | | 2,408,807 | |
| State — 5.9% | | | | | | |
City of New York New York Transitional Finance Authority, Refunding RB, Fiscal 2018: | | | | | | | | |
Series S-1, 5.00%, 07/15/35 | | | 115 | | | | 132,242 | |
Series S-2, 5.00%, 07/15/35 | | | 115 | | | | 132,242 | |
City of New York New York Transitional Finance Authority Future Tax Secured, RB: | | | | | | | | |
Sub-Series B-1, 5.00%, 11/01/35 | | | 200 | | | | 226,074 | |
Sub-Series F-1, 5.00%, 05/01/38 | | | 325 | | | | 370,578 | |
Sub-Series F-1, 5.00%, 05/01/39 | | | 135 | | | | 153,703 | |
| | |
| 42 | | 2018 BLACKROCK SEMI-ANNUAL REPORTTO SHAREHOLDERS |
| | |
Schedule of Investments (unaudited) (continued) February 28, 2018 | | BlackRock New York Municipal Bond Trust (BQH) (Percentages shown are based on Net Assets) |
| | | | | | | | |
| Security | | Par
(000) | | | Value | |
| State (continued) | | | | | | |
State of New York, GO, Series A, 5.00%, 02/15/39 | | $ | 250 | | | $ | 257,738 | |
State of New York Dormitory Authority, RB, General Purpose, Series A, 5.00%, 02/15/42 | | | 500 | | | | 564,210 | |
State of New York Dormitory Authority, Refunding RB, General Purpose, Series A, 5.00%, 02/15/38 | | | 370 | | | | 422,410 | |
State of New York Urban Development Corp., RB, State Personal Income Tax, Series C, 5.00%, 03/15/30 | | | 250 | | | | 280,532 | |
| | | | | | | | |
| | | | | | | 2,539,729 | |
| Tobacco — 3.8% | | | | | | |
Counties of New York Tobacco Trust IV, Refunding RB, Settlement Pass-Through Turbo, Series A,
6.25%, 06/01/41(a) | | | 200 | | | | 206,134 | |
Counties of New York Tobacco Trust VI, Refunding RB: | | | | | | | | |
Settlement Pass-Through Turbo, Series C, 4.00%, 06/01/51 | | | 400 | | | | 370,196 | |
Tobacco Settlement Pass-Through, Series A-2B, 5.00%, 06/01/51 | | | 340 | | | | 353,005 | |
County of Chautauqua New York Tobacco Asset Securitization Corp., Refunding RB, Asset-Backed, 4.75%, 06/01/39 | | | 75 | | | | 75,397 | |
County of Niagara New York Tobacco Asset Securitization Corp., Refunding RB, Asset-Backed, 5.25%, 05/15/40 | | | 170 | | | | 181,657 | |
Westchester New York Tobacco Asset Securitization, Refunding RB, Tobacco Settlement Bonds, Sub-Series C, 4.00%, 06/01/42 | | | 250 | | | | 241,320 | |
Westchester Tobacco Asset Securitization, Refunding RB, Tobacco Settlement Bonds, Sub-Series C, 5.13%, 06/01/51 | | | 200 | | | | 204,194 | |
| | | | | | | | |
| | | | | | | 1,631,903 | |
| Transportation — 23.4% | | | | | | |
Buffalo & Fort Erie Public Bridge Authority, RB, Toll Bridge System, 5.00%, 01/01/42 | | | 120 | | | | 134,730 | |
County of Albany Airport Authority, Refunding RB, AMT, Series B: | | | | | | | | |
4.00%, 12/15/34 | | | 235 | | | | 236,441 | |
4.00%, 12/15/35 | | | 120 | | | | 120,364 | |
Metropolitan Transportation Authority, RB: | | | | | | | | |
Series A, 5.63%, 11/15/18(b) | | | 45 | | | | 46,369 | |
Series C, 6.50%, 11/15/28 | | | 130 | | | | 134,674 | |
Series D, 5.25%, 11/15/21(b) | | | 220 | | | | 247,654 | |
Sub-Series A-1, 5.00%, 11/15/45 | | | 165 | | | | 183,067 | |
Metropolitan Transportation Authority, Refunding RB: | | | | | | | | |
Green Bonds, CAB, Series C-2, 0.00%, 11/15/39(c) | | | 320 | | | | 135,475 | |
Green Bonds, Climate Bond Certified, Sub-Series B-2, 4.00%, 11/15/34 | | | 200 | | | | 211,024 | |
Series D, 5.25%, 11/15/21(b) | | | 780 | | | | 878,046 | |
Series D, 5.25%, 11/15/23(b) | | | 170 | | | | 199,332 | |
Series D, 5.25%, 11/15/23(b) | | | 250 | | | | 293,135 | |
Series D, 5.25%, 11/15/23(b) | | | 250 | | | | 293,135 | |
Series F, 5.00%, 11/15/30 | | | 500 | | | | 558,175 | |
Metropolitan Transportation Authority Hudson Rail Yards Trust Obligations, Refunding RB, Series A, 5.00%, 11/15/56 | | | 450 | | | | 499,324 | |
New York Transportation Development Corp., ARB, LaGuardia Airport Terminal B Redevelopment Project, Series A, AMT: | | | | | | | | |
5.25%, 01/01/50 | | | 165 | | | | 180,474 | |
(AGM), 4.00%, 07/01/41 | | | 150 | | | | 153,023 | |
New York Transportation Development Corp., Refunding ARB, American Airlines, Inc., AMT, 5.00%, 08/01/31 | | | 690 | | | | 730,531 | |
Port Authority of New York & New Jersey, ARB, Special Project, JFK International Air Terminal LLC Project, Series 8, 6.00%, 12/01/42 | | | 500 | | | | 548,395 | |
| | | | | | | | |
| Security | | Par
(000) | | | Value | |
| Transportation (continued) | | | | | | |
Port Authority of New York & New Jersey, Refunding ARB: | | | | | | | | |
179th Series, 5.00%, 12/01/38 | | $ | 150 | | | $ | 169,525 | |
Consolidated, 195th Series, AMT, 5.00%, 04/01/36 | | | 250 | | | | 281,527 | |
Consolidated, 206th Series, AMT, 5.00%, 11/15/42 | | | 225 | | | | 253,539 | |
Port Authority of New York & New Jersey, Refunding RB, 178th Series, AMT, 5.00%, 12/01/32 | | | 270 | | | | 300,712 | |
State of New York Thruway Authority, RB, Junior Lien, Series A, 5.25%, 01/01/56 | | | 370 | | | | 416,154 | |
State of New York Thruway Authority, Refunding RB, General: | | | | | | | | |
2nd Highway & Bridge Trust, Series A, 5.00%, 04/01/32 | | | 1,000 | | | | 1,112,410 | |
Series I, 5.00%, 01/01/37 | | | 440 | | | | 481,954 | |
Series I, 5.00%, 01/01/42 | | | 140 | | | | 152,597 | |
Series J, 5.00%, 01/01/41 | | | 250 | | | | 274,450 | |
Triborough Bridge & Tunnel Authority, RB, Series B, 5.00%, 11/15/40 | | | 140 | | | | 159,330 | |
Triborough Bridge & Tunnel Authority, Refunding RB, General: | | | | | | | | |
MTA Bridges & Tunnels, Series C-2, 5.00%, 11/15/42 | | | 385 | | | | 441,010 | |
Series A, 5.25%, 11/15/45 | | | 275 | | | | 316,530 | |
| | | | | | | | |
| | | | | | | 10,143,106 | |
| Utilities — 9.7% | | | | | | |
City of New York New York Municipal Water Finance Authority, RB, Water & Sewer System, 2nd General Resolution, Fiscal 2017, Series DD, 5.25%, 06/15/47 | | | 120 | | | | 139,205 | |
City of New York New York Municipal Water Finance Authority, Refunding RB, Water & Sewer System, 2nd General Resolution, Fiscal 2015, Series HH, 5.00%, 06/15/39 | | | 250 | | | | 282,845 | |
City of New York New York Water & Sewer System, RB, 2nd General Resolution, Fiscal 2017, Series DD, 5.00%, 06/15/47 | | | 135 | | | | 152,815 | |
Long Island Power Authority, RB, General, Electric Systems: | | | | | | | | |
5.00%, 09/01/42 | | | 110 | | | | 124,183 | |
Series A (AGM), 5.00%, 05/01/21(b) | | | 225 | | | | 247,480 | |
Series C (CIFG), 5.25%, 09/01/29 | | | 500 | | | | 599,010 | |
Long Island Power Authority, Refunding RB, Electric System: | | | | | | | | |
Series A, 5.50%, 04/01/19(b) | | | 100 | | | | 104,193 | |
Series B, 5.00%, 09/01/41 | | | 50 | | | | 56,017 | |
Series B, 5.00%, 09/01/46 | | | 210 | | | | 234,125 | |
State of New York Environmental Facilities Corp., RB, Green Bond, Series C, 5.00%, 08/15/37 | | | 285 | | | | 330,845 | |
State of New York Power Authority, Refunding RB, Series A, 5.00%, 11/15/38 | | | 600 | | | | 662,784 | |
Utility Debt Securitization Authority, Refunding RB, Restructuring, Series E, 5.00%, 12/15/41 | | | 1,115 | | | | 1,262,336 | |
| | | | | | | | |
| | | | | | | 4,195,838 | |
|
| Puerto Rico — 1.1% | |
| Tobacco — 1.1% | |
Children’s Trust Fund, Refunding RB, Tobacco Settlement Asset-Backed Bonds, 5.63%, 05/15/43 | | | 500 | | | | 465,935 | |
| | | | | | | | |
Total Municipal Bonds — 137.6%
(Cost — $55,654,134) | | | | 59,614,807 | |
| | | | | | | | |
|
Municipal Bonds Transferred to Tender Option Bond Trusts(d) — 25.7% | |
|
| New York — 25.7% | |
| County/City/Special District/School District — 7.5% | |
City of New York New York, GO, Sub-Series I-1, 5.00%, 03/01/36 | | | 250 | | | | 281,871 | |
City of New York New York Convention Center Development Corp., Refunding RB, Hotel Unit Fee Secured, 5.00%, 11/15/32 | | | 300 | | | | 342,531 | |
| | | | |
| SCHEDULES OF INVESTMENTS | | | 43 | |
| | |
Schedule of Investments (unaudited) (continued) February 28, 2018 | | BlackRock New York Municipal Bond Trust (BQH) (Percentages shown are based on Net Assets) |
| | | | | | | | |
| Security | | Par
(000) | | | Value | |
| County/City/Special District/School District (continued) | |
Hudson Yards Infrastructure Corp., RB, Fiscal 2012, Series A, 5.75%, 02/15/47(e) | | $ | 700 | | | $ | 772,875 | |
New York Liberty Development Corp., ARB, 1 World Trade Center Port Authority Consolidated Bonds, 5.25%, 12/15/43 | | | 630 | | | | 695,618 | |
New York Liberty Development Corp., Refunding RB, 7 World Trade Center Project, Class 1, 5.00%, 09/15/40 | | | 1,050 | | | | 1,158,787 | |
| | | | | | | | |
| | | | | | | 3,251,682 | |
| State — 3.9% | | | | | | |
City of New York New York Transitional Finance Authority, BARB, Fiscal 2009, Series S-3, 5.25%, 01/15/39 | | | 500 | | | | 515,101 | |
City of New York New York Transitional Finance Authority, RB, Future Tax Secured, Sub-Series D-1, 5.00%, 11/01/38 | | | 825 | | | | 902,182 | |
Sales Tax Asset Receivable Corp., Refunding RB, Fiscal 2015, Series A, 5.00%, 10/15/31 | | | 255 | | | | 294,735 | |
| | | | | | | | |
| | | | | | | 1,712,018 | |
| Transportation — 3.8% | | | | | | |
Port Authority of New York & New Jersey, Refunding ARB, 194th Series, 5.25%, 10/15/55 | | | 360 | | | | 408,038 | |
State of New York Thruway Authority, Refunding RB, Transportation, Personal Income Tax, Series A, 5.00%, 03/15/31 | | | 600 | | | | 661,848 | |
Triborough Bridge & Tunnel Authority, Refunding RB, General, Series A, 5.00%, 11/15/46 | | | 500 | | | | 562,153 | |
| | | | | | | | |
| | | | | | | 1,632,039 | |
| Utilities — 10.5% | | | | | | |
City of New York New York Municipal Water Finance Authority, RB, Water & Sewer System, Fiscal 2009, Series A: | | | | | | | | |
5.75%, 06/15/18(b) | | | 93 | | | | 94,292 | |
5.75%, 06/15/40 | | | 312 | | | | 315,317 | |
City of New York New York Municipal Water Finance Authority, Refunding RB, Water & Sewer System, 2nd General Resolution: | | | | | | | | |
Fiscal 2011, Series HH, 5.00%, 06/15/32 | | | 990 | | | | 1,081,357 | |
Fiscal 2012, Series BB, 5.00%, 06/15/44 | | | 1,500 | | | | 1,637,160 | |
New York State Environmental Facilities Corp., Refunding RB, Subordinated SRF Bonds, Series 2016 A, 4.00%, 06/15/46 | | | 511 | | | | 534,340 | |
| | | | | | | | |
| Security | | Par
(000) | | | Value | |
| Utilities (continued) | | | | | | |
Utility Debt Securitization Authority, Refunding RB, Restructuring: | | | | | | | | |
5.00%, 12/15/36 | | $ | 496 | | | $ | 571,262 | |
Series B, 4.00%, 12/15/35 | | | 280 | | | | 297,322 | |
| | | | | | | | |
| | | | | | | 4,531,050 | |
| | | | | | | | |
Total Municipal Bonds Transferred to Tender Option Bond Trusts — 25.7%
(Cost — $10,780,742) | | | | 11,126,789 | |
| | | | | | | | |
Total Long-Term Investments — 163.3%
(Cost — $66,434,876) | | | | 70,741,596 | |
| | | | | | | | |
| | |
| | | Shares | | | | |
Short-Term Securities — 0.8% | |
BlackRock Liquidity Funds, MuniCash, Institutional Class,
0.94%(f)(g) | | | 354,279 | | | | 354,314 | |
| | | | | | | | |
Total Short-Term Securities — 0.8%
(Cost — $354,281) | | | | 354,314 | |
| | | | | | | | |
| |
Total Investments — 164.1%
(Cost — $66,789,157) | | | | 71,095,910 | |
Other Assets Less Liabilities — 1.7% | | | | 758,542 | |
Liability for TOB Trust Certificates, Including Interest Expense and Fees Payable — (15.1)% | | | | (6,542,491 | ) |
VRDP Shares at Liquidation Value, Net of Deferred Offering Costs — (50.7)% | | | | (21,995,460 | ) |
| | | | | | | | |
Net Assets Applicable to Common Shares — 100.0% | | | $ | 43,316,501 | |
| | | | | | | | |
| (a) | Security exempt from registration pursuant to Rule 144A under the Securities Act of 1933, as amended. These securities may be resold in transactions exempt from registration to qualified institutional investors. |
| (b) | U.S. Government securities, held in escrow, are used to pay interest on this security, as well as to retire the bond in full at the date indicated, typically at a premium to par. |
| (d) | Represent bonds transferred to a TOB Trust in exchange of cash and residual certificates received by the Trust. These bonds serve as collateral in a secured borrowing. See Note 4 of the Notes to Financial Statements for details. |
| (e) | All or a portion of security is subject to a recourse agreement. The aggregate maximum potential amount the Trust could ultimately be required to pay under the agreement, which expires on February 15, 2019, is $370,682. |
| (f) | Annualized 7-day yield as of period end. |
| (g) | During the period ended February 28, 2018, investments in issuers considered to be an affiliate of the Trust for purposes of Section 2(a)(3) of the Investment Company Act of 1940, as amended, were as follows: |
| | | | | | | | | | | | | | | | | | | | | | | | | | | | |
| Affiliated | | Shares
Held at
08/31/17 | | | Net
Activity | | | Shares
Held at
02/28/18 | | | Value at
02/28/18 | | | Income | | | Net Realized
Gain (Loss) (a) | | | Change in
Unrealized
Appreciation
(Depreciation) | |
BlackRock Liquidity Funds, MuniCash, Institutional Class | | | 225,260 | | | | 129,019 | | | | 354,279 | | | $ | 354,314 | | | $ | 2,507 | | | $ | (35 | ) | | $ | 33 | |
| | | | | | | | | | | | | | | | | | | | | | | | | | | | |
| | (a) | Includes net capital gain distributions, if applicable. | |
For Trust compliance purposes, the Trust’s sector classifications refer to one or more of the sector sub-classifications used by one or more widely recognized market indexes or rating group indexes, and/or as defined by the investment adviser. These definitions may not apply for purposes of this report, which may combine such sector sub classifications for reporting ease.
| | |
| 44 | | 2018 BLACKROCK SEMI-ANNUAL REPORTTO SHAREHOLDERS |
| | |
Schedule of Investments (unaudited) (continued) February 28, 2018 | | BlackRock New York Municipal Bond Trust (BQH) |
Derivative Financial Instruments Outstanding as of Period End
Futures Contracts
| | | | | | | | | | | | | | | | |
| Description | | Number of
Contracts | | | Expiration
Date | | | Notional
Amount (000) | | | Value/
Unrealized
Appreciation
(Depreciation) | |
Short Contracts: | | | | | | | | | | | | | | | | |
10-Year U.S. Treasury Note | | | 11 | | | | 06/20/18 | | | $ | 1,321 | | | $ | 1,031 | |
Long U.S. Treasury Bond | | | 18 | | | | 06/20/18 | | | | 2,582 | | | | (10,716 | ) |
5-Year U.S. Treasury Note | | | 9 | | | | 06/29/18 | | | | 1,025 | | | | 1,682 | |
| | | | | | | | | | | | | | | | |
| | | | | | | | | | | | | | $ | (8,003 | ) |
| | | | | | | | | | | | | | | | |
Derivative Financial Instruments Categorized by Risk Exposure
As of period end, the fair values of derivative financial instruments located in the Statements of Assets and Liabilities were as follows:
| | | | | | | | | | | | | | | | | | | | | | | | | | | | |
| | | Commodity
Contracts | | | Credit
Contracts | | | Equity
Contracts | | | Foreign
Currency
Exchange
Contracts | | | Interest
Rate
Contracts | | | Other
Contracts | | | Total | |
Assets — Derivative Financial Instruments | | | | | | | | | | | | | | | | | | | | | | | | | | | | |
Futures contracts | | | | | | | | | | | | | | | | | | | | | | | | | | | | |
Net unrealized appreciation(a) | | $ | — | | | $ | — | | | $ | — | | | $ | — | | | $ | 2,713 | | | $ | — | | | $ | 2,713 | |
| | | | | | | | | | | | | | | | | | | | | | | | | | | | |
| Liabilities — Derivative Financial Instruments | | | | | | | | | | | | | | | | | | | | | |
Futures contracts | | | | | | | | | | | | | | | | | | | | | | | | | | | | |
Net unrealized depreciation(a) | | $ | — | | | $ | — | | | $ | — | | | $ | — | | | $ | 10,716 | | | $ | — | | | $ | 10,716 | |
| | | | | | | | | | | | | | | | | | | | | | | | | | | | |
| | (a) | Includes cumulative appreciation (depreciation) on futures contracts, if any, as reported in the Schedule of Investments. Only current day’s variation margin is reported within the Statements of Assets and Liabilities. | |
For the six months ended February 28, 2018, the effect of derivative financial instruments in the Statements of Operations was as follows:
| | | | | | | | | | | | | | | | | | | | | | | | | | | | |
| | | Commodity
Contracts | | | Credit
Contracts | | | Equity
Contracts | | | Foreign
Currency
Exchange
Contracts | | | Interest
Rate
Contracts | | | Other
Contracts | | | Total | |
Net Realized Gain (Loss) from: | | | | | | | | | | | | | | | | | | | | | | | | | | | | |
Futures contracts | | $ | — | | | $ | — | | | $ | — | | | $ | — | | | $ | 273,365 | | | $ | — | | | $ | 273,365 | |
| | | | | | | | | | | | | | | | | | | | | | | | | | | | |
| Net Change in Unrealized Appreciation (Depreciation) on: | | | | | | | | | | | | | | | | | | | | | |
Futures contracts | | $ | — | | | $ | — | | | $ | — | | | $ | — | | | $ | 15,615 | | | $ | — | | | $ | 15,615 | |
| | | | | | | | | | | | | | | | | | | | | | | | | | | | |
Average Quarterly Balances of Outstanding Derivative Financial Instruments
| | | | |
Futures contracts: | | | | |
Average notional value of contracts — short | | $ | 3,922,105 | |
For more information about the Trust’s investment risks regarding derivative financial instruments, refer to the Notes to Financial Statements.
| | | | |
| SCHEDULES OF INVESTMENTS | | | 45 | |
| | |
Schedule of Investments (unaudited) (continued) February 28, 2018 | | BlackRock New York Municipal Bond Trust (BQH) |
Fair Value Hierarchy as of Period End
Various inputs are used in determining the fair value of investments and derivative financial instruments. For information about the Trust’s policy regarding valuation of investments and derivative financial instruments, refer to the Notes to Financial Statements.
The following tables summarize the Trust’s investments and derivative financial instruments categorized in the disclosure hierarchy:
| | | | | | | | | | | | | | | | |
| | | Level 1 | | | Level 2 | | | Level 3 | | | Total | |
Assets: | | | | | | | | | | | | | | | | |
Investments: | | | | | | | | | | | | | | | | |
Long-Term Investments(a) | | $ | — | | | $ | 70,741,596 | | | $ | — | | | $ | 70,741,596 | |
Short-Term Securities | | | 354,314 | | | | — | | | | — | | | | 354,314 | |
| | | | | | | | | | | | | | | | |
| | $ | 354,314 | | | $ | 70,741,596 | | | $ | — | | | $ | 71,095,910 | |
| | | | | | | | | | | | | | | | |
Derivative Financial Instruments(b) | | | | | | | | | | | | | | | | |
Assets: | | | | | | | | | | | | | | | | |
Interest rate contracts | | $ | 2,713 | | | $ | — | | | $ | — | | | $ | 2,713 | |
Liabilities: | | | | | | | | | | | | | | | | |
Interest rate contracts | | | (10,716 | ) | | | — | | | | — | | | | (10,716 | ) |
| | | | | | | | | | | | | | | | |
| | $ | (8003 | ) | | $ | — | | | $ | — | | | $ | (8,003 | ) |
| | | | | | | | | | | | | | | | |
| | (a) | See above Schedule of Investments for values in each sector. | |
| | (b) | Derivative financial instruments are futures contracts which are valued at the unrealized appreciation (depreciation) on the instrument. | |
The Trust may hold assets and/or liabilities in which the fair value approximates the carrying amount for financial statement purposes. As of period end, such assets and/or liabilities are categorized within the disclosure hierarchy as follows:
| | | | | | | | | | | | | | | | |
| | | Level 1 | | | Level 2 | | | Level 3 | | | Total | |
Liabilities: | |
TOB Trust Certificates | | $ | — | | | $ | (6,521,464 | ) | | $ | — | | | $ | (6,521,464 | ) |
VRDP Shares at Liquidation Value | | | — | | | | (22,100,000 | ) | | | — | | | | (22,100,000 | ) |
| | | | | | | | | | | | | | | | |
| | $ | — | | | $ | (28,621,464 | ) | | $ | — | | | $ | (28,621,464 | ) |
| | | | | | | | | | | | | | | | |
During the six months ended February 28, 2018, there were no transfers between levels.
See notes to financial statements.
| | |
| 46 | | 2018 BLACKROCK SEMI-ANNUAL REPORTTO SHAREHOLDERS |
| | |
Schedule of Investments (unaudited) February 28, 2018 | | BlackRock New York Municipal Income Quality Trust (BSE) (Percentages shown are based on Net Assets) |
| | | | | | | | |
| Security | | Par
(000) | | | Value | |
Municipal Bonds — 122.4% | |
|
| New York — 122.4% | |
| Corporate — 0.5% | |
New York Liberty Development Corp., Refunding RB, Goldman Sachs Headquarters, 5.25%, 10/01/35 | | $ | 355 | | | $ | 436,043 | |
| | | | | | | | |
| County/City/Special District/School District — 16.1% | |
City of New York New York, GO, Refunding, Series E: | | | | | | | | |
5.50%, 08/01/25 | | | 725 | | | | 844,458 | |
5.00%, 08/01/30 | | | 1,000 | | | | 1,117,850 | |
City of New York New York, GO: | | | | | | | | |
Series A-1, 5.00%, 08/01/35 | | | 200 | | | | 218,870 | |
Sub-Series D-1, Fiscal 2014, 5.00%, 08/01/31 | | | 440 | | | | 496,316 | |
City of New York New York Convention Center Development Corp., RB, CAB, Sub Lien, Hotel Unit Fee, Series B (AGM), 0.00%, 11/15/55(a) | | | 1,000 | | | | 203,320 | |
City of New York New York Convention Center Development Corp., Refunding RB, Hotel Unit Fee Secured: | | | | | | | | |
5.00%, 11/15/40 | | | 1,335 | | | | 1,500,754 | |
5.00%, 11/15/45 | | | 1,250 | | | | 1,398,850 | |
City of New York New York Industrial Development Agency, RB, PILOT: | | | | | | | | |
CAB, Yankee Stadium Project, Series A (AGC), 0.00%, 03/01/39(a) | | | 1,000 | | | | 436,250 | |
Queens Baseball Stadium (AGC), 6.38%, 01/01/39 | | | 150 | | | | 155,703 | |
Counties of Buffalo & Erie New York Industrial Development Agency, RB, City School District of Buffalo Project, Series A, 5.25%, 05/01/31 | | | 200 | | | | 220,280 | |
Counties of Buffalo & Erie New York Industrial Development Agency, Refunding RB, City School District of Buffalo Project, 5.00%, 05/01/28 | | | 565 | | | | 663,372 | |
County of Erie New York Fiscal Stability Authority, RB, Sales Tax and State Aid Secured Refunding Bonds, Series D: | | | | | | | | |
5.00%, 09/01/35 | | | 60 | | | | 70,069 | |
5.00%, 09/01/36 | | | 50 | | | | 58,256 | |
5.00%, 09/01/37 | | | 60 | | | | 69,745 | |
5.00%, 09/01/38 | | | 90 | | | | 104,457 | |
5.00%, 09/01/39 | | | 70 | | | | 81,119 | |
County of Nassau New York, GO, Refunding Series B, 5.00%, 04/01/32 | | | 420 | | | | 479,867 | |
Haverstraw-Stony Point Central School District, GO, Refunding, 5.00%, 10/15/36 | | | 240 | | | | 268,994 | |
Hudson Yards Infrastructure Corp., RB, Senior, Fiscal 2012: | | | | | | | | |
5.75%, 02/15/21(b) | | | 615 | | | | 684,919 | |
5.75%, 02/15/47 | | | 385 | | | | 421,317 | |
Hudson Yards Infrastructure Corp., Refunding RB, Series A: | | | | | | | | |
2nd Indenture, 5.00%, 02/15/45 | | | 465 | | | | 523,915 | |
Fiscal 2017, 5.00%, 02/15/42 | | | 875 | | | | 988,750 | |
New York Liberty Development Corp., Refunding RB, World Trade Center Project: | | | | | | | | |
4, 5.00%, 11/15/31 | | | 1,000 | | | | 1,100,510 | |
4, 5.00%, 11/15/44 | | | 1,250 | | | | 1,361,200 | |
7 Class 1, 4.00%, 09/15/35 | | | 1,100 | | | | 1,151,326 | |
5.75%, 11/15/51 | | | 545 | | | | 612,591 | |
| | | | | | | | |
| | | | | | | 15,233,058 | |
| Education — 35.3% | |
Build NYC Resource Corp., Refunding RB: | | | | | | | | |
City University New York-Queens College Student Residences, LLC Project, Series A, 5.00%, 06/01/38 | | | 250 | | | | 279,488 | |
Ethical Culture Fieldston School Project, 5.00%, 06/01/33 | | | 300 | | | | 334,053 | |
Ethical Culture Fieldston School Project, 5.00%, 06/01/35 | | | 350 | | | | 387,345 | |
Manhattan College Project, 5.00%, 08/01/35 | | | 260 | | | | 293,938 | |
Manhattan College Project, 5.00%, 08/01/47 | | | 135 | | | | 150,202 | |
| | | | | | | | |
| Security | | Par
(000) | | | Value | |
| Education (continued) | |
Build NYC Resource Corp., Refunding RB (continued): | | | | | | | | |
Packer Collegiate Institute Project, 5.00%, 06/01/40 | | $ | 690 | | | $ | 755,709 | |
City of Albany New York Capital Resource Corp., Refunding RB, Albany College of Pharmacy and Health Sciences, Series A: | | | | | | | | |
5.00%, 12/01/33 | | | 175 | | | | 190,974 | |
4.00%, 12/01/34 | | | 130 | | | | 130,758 | |
City of New York New York Trust for Cultural Resources, Refunding RB: | | | | | | | | |
American Museum of Natural History, Series A, 5.00%, 07/01/37 | | | 440 | | | | 496,597 | |
American Museum of Natural History, Series A, 5.00%, 07/01/41 | | | 500 | | | | 562,770 | |
Museum of Modern Art, Series 1A, 5.00%, 10/01/18(b) | | | 700 | | | | 715,092 | |
Wildlife Conservation Society, Series A, 5.00%, 08/01/42 | | | 410 | | | | 455,010 | |
City of Troy New York Capital Resource Corp., Refunding RB, Rensselaer Polytechnic Institute Project: | | | | | | | | |
Series A, 5.13%, 09/01/40 | | | 1,645 | | | | 1,735,820 | |
Series B, 4.00%, 08/01/35 | | | 230 | | | | 235,803 | |
County of Dutchess New York Local Development Corp., Refunding RB, Vassar College Project: | | | | | | | | |
5.00%, 07/01/42 | | | 195 | | | | 222,099 | |
4.00%, 07/01/46 | | | 375 | | | | 384,986 | |
County of Madison New York Capital Resource Corp., Refunding RB, Colgate University Project, Series A, 4.50%, 07/01/39 | | | 1,500 | | | | 1,602,390 | |
County of Monroe New York Industrial Development Corp., RB, University of Rochester Project, Series A,
5.00%, 07/01/21(b) | | | 500 | | | | 553,195 | |
County of Monroe New York Industrial Development Corp., Refunding RB: | | | | | | | | |
Nazareth College of Rochester Project, 4.00%, 10/01/47 | | | 60 | | | | 58,453 | |
University of Rochester Project, Series A, 5.00%, 07/01/23(b) | | | 400 | | | | 460,380 | |
University of Rochester Project, Series D, 4.00%, 07/01/43 | | | 265 | | | | 273,326 | |
County of Orange New York Funding Corp., Refunding RB, Mount St. Mary College Project, Series A: | | | | | | | | |
5.00%, 07/01/37 | | | 180 | | | | 194,270 | |
5.00%, 07/01/42 | | | 115 | | | | 122,728 | |
County of Schenectady New York Capital Resource Corp., Refunding RB, Union College, 5.00%, 07/01/32 | | | 500 | | | | 551,635 | |
County of Tompkins New York Development Corp., RB, Ithaca College Project (AGM), 5.50%, 01/01/21(b) | | | 250 | | | | 276,433 | |
County of Tompkins New York Industrial Development Agency, RB, Civic Facility Cornell University Project, Series A, 5.00%, 07/01/37 | | | 1,000 | | | | 1,070,320 | |
Dobbs Ferry Local Development Corp., RB, Mercy College Project: | | | | | | | | |
5.00%, 07/01/39 | | | 1,000 | | | | 1,123,690 | |
5.00%, 07/01/44 | | | 500 | | | | 560,000 | |
State of New York Dormitory Authority, RB: | | | | | | | | |
5.00%, 03/15/30 | | | 1,000 | | | | 1,170,140 | |
Convent of the Sacred Heart (AGM), 5.75%, 11/01/40 | | | 300 | | | | 332,658 | |
Education, Series B, 5.75%, 03/15/19(b) | | | 600 | | | | 626,814 | |
Fordham University, Series A, 5.00%, 07/01/21(b) | | | 500 | | | | 550,635 | |
New School (AGM), 5.50%, 07/01/20(b) | | | 350 | | | | 380,674 | |
New York University, Series B, 5.00%, 07/01/37 | | | 500 | | | | 558,170 | |
New York University, Series C, 5.00%, 07/01/18(b) | | | 1,000 | | | | 1,012,110 | |
Rochester Institute of Technology, 5.00%, 07/01/40 | | | 550 | | | | 586,207 | |
State University Dormitory Facilities, Series A, 5.00%, 07/01/40 | | | 600 | | | | 641,622 | |
State University Dormitory Facilities, Series A, 5.00%, 07/01/41 | | | 1,000 | | | | 1,090,090 | |
| | | | |
| SCHEDULES OF INVESTMENTS | | | 47 | |
| | |
Schedule of Investments (unaudited) (continued) February 28, 2018 | | BlackRock New York Municipal Income Quality Trust (BSE) (Percentages shown are based on Net Assets) |
| | | | | | | | |
| Security | | Par
(000) | | | Value | |
| Education (continued) | |
State of New York Dormitory Authority, Refunding RB: | | | | | | | | |
Barnard College, Series A, 5.00%, 07/01/34 | | $ | 200 | | | $ | 227,408 | |
Barnard College, Series A, 5.00%, 07/01/43 | | | 2,960 | | | | 3,303,508 | |
Cornell University, Series A, 5.00%, 07/01/40 | | | 250 | | | | 267,403 | |
Fordham University, 5.00%, 07/01/44 | | | 640 | | | | 711,718 | |
Icahn School of Medicine at Mount Sinai, Series A, 5.00%, 07/01/35 | | | 1,380 | | | | 1,528,750 | |
New York University, Series A, 5.00%, 07/01/37 | | | 745 | | | | 831,673 | |
Pratt Institute, Series A, 5.00%, 07/01/44 | | | 500 | | | | 547,880 | |
State University Dormitory Facilities, Series A, 5.25%, 07/01/30 | | | 1,500 | | | | 1,719,135 | |
State University Dormitory Facilities, Series A, 5.25%, 07/01/32 | | | 600 | | | | 686,682 | |
State University Dormitory Facilities, Series A, 5.00%, 07/01/42 | | | 450 | | | | 492,210 | |
State University Dormitory Facilities, Series A, 5.00%, 07/01/46 | | | 375 | | | | 425,824 | |
State University Dormitory Facilities, Series B, 5.00%, 07/01/32 | | | 545 | | | | 622,003 | |
Town of Hempstead New York Local Development Corp., Refunding RB: | | | | | | | | |
Adelphi University Project, 5.00%, 10/01/34 | | | 310 | | | | 347,160 | |
Adelphi University Project, 5.00%, 10/01/35 | | | 310 | | | | 349,134 | |
Hofstra University Project, 5.00%, 07/01/47 | | | 100 | | | | 111,848 | |
| | | | | | | | |
| | | | | | | 33,298,920 | |
| Health — 11.5% | |
Counties of Buffalo & Erie New York Industrial Land Development Corp., RB, Catholic Health System Obligation, 5.25%, 07/01/35 | | | 500 | | | | 553,395 | |
County of Dutchess New York Industrial Development Agency, RB, Vassar Brothers Medical Center (AGC), 5.50%, 04/01/30 | | | 500 | | | | 542,345 | |
County of Monroe New York Industrial Development Corp., RB, Rochester General Hospital Project: | | | | | | | | |
4.00%, 12/01/41 | | | 200 | | | | 199,086 | |
5.00%, 12/01/46 | | | 320 | | | | 349,626 | |
Series A, 5.00%, 12/01/37 | | | 850 | | | | 913,163 | |
County of Monroe New York Industrial Development Corp., Refunding RB, Unity Hospital of Rochester Project (FHA), 5.50%, 08/15/40 | | | 725 | | | | 797,398 | |
County of Suffolk New York EDC, RB, Catholic Health Services, Series C, 5.00%, 07/01/32 | | | 150 | | | | 164,096 | |
County of Westchester New York Healthcare Corp., Refunding RB, Senior Lien, Remarketing, Series A, 5.00%, 11/01/30 | | | 895 | | | | 955,663 | |
State of New York Dormitory Authority, RB: | | | | | | | | |
Mental Health Services (AGM), 5.00%, 08/15/18(b) | | | 5 | | | | 5,082 | |
Mental Health Services (AGM), 5.00%, 08/15/18(b) | | | 5 | | | | 5,082 | |
Mental Health Services (AGM), 5.00%, 02/15/22 | | | 80 | | | | 81,331 | |
Mental Health Services, 2nd Series (AGM),
5.00%, 08/15/18(b) | | | 5 | | | | 5,082 | |
New York University Hospitals Center, Series A,
6.00%, 07/01/20(b) | | | 250 | | | | 274,758 | |
North Shore-Long Island Jewish Obligated Group, Series D, 4.25%, 05/01/39 | | | 500 | | | | 519,580 | |
State of New York Dormitory Authority, Refunding RB: | | | | | | | | |
Memorial Sloan-Kettering Cancer Center, Series 1, 4.00%, 07/01/37 | | | 60 | | | | 63,347 | |
Memorial Sloan-Kettering Cancer Center, Series 1, 5.00%, 07/01/42 | | | 450 | | | | 511,376 | |
North Shore-Long Island Jewish Obligated Group, Series A, 5.00%, 05/01/21(b) | | | 750 | | | | 823,717 | |
North Shore-Long Island Jewish Obligated Group, Series A, 5.00%, 05/01/21(b) | | | 750 | | | | 823,717 | |
| | | | | | | | |
| Security | | Par
(000) | | | Value | |
| Health (continued) | |
State of New York Dormitory Authority, Refunding RB (continued): | | | | | | | | |
North Shore-Long Island Jewish Obligated Group, Series A, 5.25%, 05/01/21(b) | | $ | 1,840 | | | $ | 2,034,930 | |
North Shore-Long Island Jewish Obligated Group, Series A, 5.00%, 05/01/43 | | | 1,140 | | | | 1,256,018 | |
| | | | | | | | |
| | | | | | | 10,878,792 | |
| Housing — 3.9% | |
City of New York New York Housing Development Corp., RB, M/F Housing, Series B1: | | | | | | | | |
Fund Grant Program, New York City Housing Authority Program, 5.25%, 07/01/32 | | | 915 | | | | 1,010,938 | |
Fund Grant Program, New York City Housing Authority Program, 5.00%, 07/01/33 | | | 400 | | | | 435,420 | |
5.25%, 07/01/30 | | | 750 | | | | 836,438 | |
City of New York New York Housing Development Corp., Refunding RB, M/F Housing, 8 Spruce Street, Class F, 4.50%, 02/15/48 | | | 500 | | | | 515,665 | |
County of Onondaga New York Trust for Cultural Resources, Refunding RB, Abby Lane Housing Corporation Project, 5.00%, 05/01/40 | | | 445 | | | | 490,319 | |
State of New York HFA, RB: | | | | | | | | |
Affordable Housing, Series E (SONYMA), 4.15%, 11/01/47 | | | 330 | | | | 336,864 | |
Affordable M/F Housing, Series B (Ginnie Mae, Fannie Mae & Freddie Mac), 4.00%, 11/01/42 | | | 110 | | | | 112,380 | |
| | | | | | | | |
| | | | | | | 3,738,024 | |
| State — 14.6% | |
City of New York New York Transitional Finance Authority, BARB, Fiscal 2009, Series S-4 (AGC), 5.50%, 01/15/33 | | | 1,000 | | | | 1,034,400 | |
City of New York New York Transitional Finance Authority, Refunding RB, Fiscal 2018: | | | | | | | | |
Series S-1, 5.00%, 07/15/35 | | | 250 | | | | 287,483 | |
Series S-2, 5.00%, 07/15/35 | | | 250 | | | | 287,483 | |
City of New York New York Transitional Finance Authority Future Tax Secured, RB: | | | | | | | | |
Sub-Series B-1, 5.00%, 11/01/35 | | | 425 | | | | 480,407 | |
Sub-Series E-1, 5.00%, 02/01/38 | | | 910 | | | | 1,034,625 | |
Sub-Series F-1, 5.00%, 05/01/38 | | | 705 | | | | 803,869 | |
Sub-Series F-1, 5.00%, 05/01/39 | | | 300 | | | | 341,562 | |
City of New York New York Transitional Finance Authority Future Tax Secured, Refunding RB, Series C, 5.00%, 11/01/30 | | | 590 | | | | 677,001 | |
Metropolitan Transportation Authority, Refunding RB, Dedicated Tax Fund: | | | | | | | | |
Series B, 5.00%, 11/15/19(b) | | | 540 | | | | 571,460 | |
Sub-Series B-1, 5.00%, 11/15/31 | | | 750 | | | | 852,465 | |
Sales Tax Asset Receivable Corp., Refunding RB, Fiscal 2015, Series A, 5.00%, 10/15/31 | | | 750 | | | | 867,180 | |
State of New York Dormitory Authority, RB: | | | | | | | | |
General Purpose, Series A, 5.00%, 02/15/42 | | | 500 | | | | 564,210 | |
General Purpose, Series B, 5.00%, 03/15/37 | | | 1,000 | | | | 1,096,210 | |
General Purpose, Series B, 5.00%, 03/15/42 | | | 1,400 | | | | 1,531,306 | |
Sales Tax, Series A, 5.00%, 03/15/37 | | | 100 | | | | 114,958 | |
Series A, 5.00%, 03/15/36 | | | 440 | | | | 504,051 | |
State of New York Dormitory Authority, Refunding RB, School Districts Financing Program, Series A (AGM), 5.00%, 10/01/18(b) | | | 1,000 | | | | 1,021,560 | |
State of New York Urban Development Corp., RB, State Personal Income Tax, Series C: | | | | | | | | |
5.00%, 03/15/30 | | | 500 | | | | 561,065 | |
5.00%, 03/15/32 | | | 1,000 | | | | 1,118,610 | |
| | | | | | | | |
| | | | | | | 13,749,905 | |
| | |
| 48 | | 2018 BLACKROCK SEMI-ANNUAL REPORTTO SHAREHOLDERS |
| | |
Schedule of Investments (unaudited) (continued) February 28, 2018 | | BlackRock New York Municipal Income Quality Trust (BSE) (Percentages shown are based on Net Assets) |
| | | | | | | | |
| Security | | Par
(000) | | | Value | |
| Tobacco — 1.3% | |
Counties of New York Tobacco Trust VI, Refunding RB, Tobacco Settlement Pass-Through: | | | | | | | | |
Series A-2B, 5.00%, 06/01/51 | | $ | 270 | | | $ | 280,327 | |
Series B, 5.00%, 06/01/45 | | | 300 | | | | 318,498 | |
County of Niagara New York Tobacco Asset Securitization Corp., Refunding RB, Asset-Backed, 5.25%, 05/15/40 | | | 290 | | | | 309,885 | |
Westchester New York Tobacco Asset Securitization, Refunding RB, Tobacco Settlement Bonds, Sub-Series C, 4.00%, 06/01/42 | | | 295 | | | | 284,758 | |
| | | | | | | | |
| | | | | | | 1,193,468 | |
| Transportation — 25.4% | |
Buffalo & Fort Erie Public Bridge Authority, RB, Toll Bridge System, 5.00%, 01/01/42 | | | 265 | | | | 297,529 | |
Metropolitan Transportation Authority, RB: | | | | | | | | |
Series A, 5.00%, 11/15/21(b) | | | 575 | | | | 642,143 | |
Series A-1, 5.25%, 11/15/23(b) | | | 270 | | | | 316,586 | |
Series C, 6.50%, 11/15/28 | | | 145 | | | | 150,213 | |
Series D, 5.25%, 11/15/21(b) | | | 440 | | | | 495,308 | |
Series E, 5.00%, 11/15/38 | | | 650 | | | | 727,408 | |
Sub-Series A-1, 5.00%, 11/15/45 | | | 350 | | | | 388,325 | |
Metropolitan Transportation Authority, Refunding RB: | | | | | | | | |
Green Bonds, CAB, Series C-2, 0.00%, 11/15/39(a) | | | 690 | | | | 292,118 | |
Green Bonds, Climate Bond Certified, Series B-1, 5.00%, 11/15/34 | | | 365 | | | | 424,375 | |
Green Bonds, Climate Bond Certified, Sub-Series B-2, 4.00%, 11/15/34 | | | 500 | | | | 527,560 | |
Series B, 5.00%, 11/15/37 | | | 1,110 | | | | 1,255,266 | |
Series D, 5.25%, 11/15/21(b) | | | 1,560 | | | | 1,756,092 | |
Series D, 5.25%, 11/15/23(b) | | | 750 | | | | 879,405 | |
Metropolitan Transportation Authority Hudson Rail Yards Trust Obligations, Refunding RB, Series A: | | | | | | | | |
5.00%, 11/15/56 | | | 1,345 | | | | 1,492,425 | |
5.00%, 11/15/51 | | | 115 | | | | 124,849 | |
Port Authority of New York & New Jersey, Refunding ARB, 179th Series, 5.00%, 12/01/38 | | | 245 | | | | 276,892 | |
State of New York Thruway Authority, RB, Junior Lien, Series A, 5.25%, 01/01/56 | | | 210 | | | | 236,195 | |
State of New York Thruway Authority, Refunding RB, General: | | | | | | | | |
2nd Highway & Bridge Trust, Series A, 5.00%, 04/01/32 | | | 250 | | | | 278,103 | |
Series H (AGM), 5.00%, 01/01/37 | | | 4,000 | | | | 4,009,960 | |
Series I, 5.00%, 01/01/37 | | | 1,325 | | | | 1,451,339 | |
Series I, 5.00%, 01/01/42 | | | 425 | | | | 463,241 | |
Series K, 5.00%, 01/01/32 | | | 750 | | | | 852,405 | |
Triborough Bridge & Tunnel Authority, RB, Series B, 5.00%, 11/15/40 | | | 280 | | | | 318,660 | |
Triborough Bridge & Tunnel Authority, Refunding RB: | | | | | | | | |
General, CAB, Series B, 0.00%, 11/15/32(a) | | | 635 | | | | 382,365 | |
General, MTA Bridges & Tunnels, Series C-2, 5.00%, 11/15/42 | | | 1,490 | | | | 1,706,765 | |
General, Remarketing, Series A, 5.00%, 11/15/34 | | | 1,000 | | | | 1,118,240 | |
General, Series A, 5.25%, 11/15/45 | | | 370 | | | | 425,877 | |
General, Series C, 5.00%, 11/15/18(b) | | | 615 | | | | 631,033 | |
General, Series C, 5.00%, 11/15/38 | | | 385 | | | | 394,240 | |
Sub-Series A, 5.00%, 11/15/29 | | | 1,485 | | | | 1,679,728 | |
| | | | | | | | |
| | | | | | | 23,994,645 | |
| Utilities — 13.8% | |
Albany Municipal Water Finance Authority, Refunding RB, Series A, 5.00%, 12/01/33 | | | 1,000 | | | | 1,105,850 | |
City of New York New York Municipal Water Finance Authority, Refunding RB, Water & Sewer System, 2nd General Resolution: | | | | | | | | |
Fiscal 2015, Series HH, 5.00%, 06/15/39 | | | 1,000 | | | | 1,131,380 | |
Series DD, 5.00%, 06/15/32 | | | 1,100 | | | | 1,111,143 | |
| | | | | | | | |
| Security | | Par
(000) | | | Value | |
| Utilities (continued) | |
County of Western Nassau New York Water Authority, RB, Series A, 5.00%, 04/01/40 | | $ | 250 | | | $ | 276,632 | |
Long Island Power Authority, RB, General, Electric Systems: | | | | | | | | |
5.00%, 09/01/42 | | | 240 | | | | 270,946 | |
Series A (AGM), 5.00%, 05/01/21(b) | | | 500 | | | | 549,955 | |
Series C (CIFG), 5.25%, 09/01/29 | | | 1,000 | | | | 1,198,020 | |
Long Island Power Authority, Refunding RB: | | | | | | | | |
Electric System, Series B, 5.00%, 09/01/41 | | | 110 | | | | 123,239 | |
Electric System, Series B, 5.00%, 09/01/46 | | | 405 | | | | 451,526 | |
Electric Systems, Series A (AGC), 5.75%, 04/01/19(b) | | | 1,690 | | | | 1,767,233 | |
General, Electric Systems, Series A (AGC), 6.00%, 05/01/19(b) | | | 2,000 | | | | 2,105,080 | |
State of New York Environmental Facilities Corp., RB, Series B, Revolving Funds, Green Bonds, 5.00%, 09/15/40 | | | 635 | | | | 726,262 | |
State of New York Power Authority, Refunding RB, Series A, 5.00%, 11/15/38 | | | 1,000 | | | | 1,104,640 | |
Utility Debt Securitization Authority, Refunding RB, Restructuring, Series E, 5.00%, 12/15/41 | | | 1,000 | | | | 1,132,140 | |
| | | | | | | | |
| | | | | | | 13,054,046 | |
| | | | | | | | |
Total Municipal Bonds — 122.4%
(Cost — $110,536,193) | | | | 115,576,901 | |
| | | | | | | | |
|
Municipal Bonds Transferred to Tender Option Bond Trusts(c) — 39.7% | |
|
| New York — 39.7% | |
| County/City/Special District/School District — 15.0% | |
City of New York New York, GO, Refunding, Series E, 5.00%, 08/01/29 | | | 1,000 | | | | 1,160,625 | |
City of New York New York, GO: | | | | | | | | |
Sub-Series C-3 (AGC), 5.75%, 02/15/19(b)(d) | | | 64 | | | | 66,201 | |
Sub-Series C-3 (AGC), 5.75%, 08/15/28(d) | | | 936 | | | | 974,689 | |
Sub-Series G-1, 5.00%, 04/01/29 | | | 1,000 | | | | 1,104,690 | |
Sub-Series I-1, 5.00%, 03/01/36 | | | 250 | | | | 281,871 | |
Refunding Fiscal 2015, Series B, 4.00%, 08/01/32 | | | 1,790 | | | | 1,883,474 | |
City of New York New York Convention Center Development Corp., Refunding RB, Hotel Unit Fee Secured, 5.00%, 11/15/32 | | | 500 | | | | 570,885 | |
Hudson Yards Infrastructure Corp., RB, Fiscal 2012, Series A, 5.75%, 02/15/47(d) | | | 1,800 | | | | 1,987,392 | |
New York Liberty Development Corp., ARB, 1 World Trade Center Port Authority Consolidated Bonds, 5.25%, 12/15/43 | | | 3,495 | | | | 3,859,023 | |
New York Liberty Development Corp., Refunding RB, 7 World Trade Center Project, Class 1, 5.00%, 09/15/40 | | | 2,085 | | | | 2,301,020 | |
| | | | | | | | |
| | | | | | | 14,189,870 | |
| Education — 2.3% | |
State of New York Dormitory Authority, RB, State University Dormitory Facilities, New York University, Series A, 5.00%, 07/01/35 | | | 1,999 | | | | 2,184,291 | |
| | | | | | | | |
| State — 6.7% | |
City of New York New York Transitional Finance Authority, RB, Future Tax Secured, Sub-Series D-1, 5.00%, 11/01/38 | | | 2,475 | | | | 2,706,545 | |
Sales Tax Asset Receivable Corp., Refunding RB, Fiscal 2015, Series A: | | | | | | | | |
5.00%, 10/15/31 | | | 990 | | | | 1,144,265 | |
4.00%, 10/15/32 | | | 1,500 | | | | 1,624,065 | |
State of New York Dormitory Authority, RB, General Purpose, Series C, 5.00%, 03/15/41 | | | 750 | | | | 813,851 | |
| | | | | | | | |
| | | | | | | 6,288,726 | |
| | | | |
| SCHEDULES OF INVESTMENTS | | | 49 | |
| | |
Schedule of Investments (unaudited) (continued) February 28, 2018 | | BlackRock New York Municipal Income Quality Trust (BSE) (Percentages shown are based on Net Assets) |
| | | | | | | | |
| Security | | Par
(000) | | | Value | |
| Transportation — 3.0% | |
Port Authority of New York & New Jersey, Refunding ARB, 194th Series, 5.25%, 10/15/55 | | $ | 735 | | | $ | 833,078 | |
State of New York Thruway Authority, Refunding RB, Transportation, Personal Income Tax, Series A, 5.00%, 03/15/31 | | | 800 | | | | 882,464 | |
Triborough Bridge & Tunnel Authority, Refunding RB, General, Series A, 5.00%, 11/15/46 | | | 1,000 | | | | 1,124,305 | |
| | | | | | | | |
| | | | | | | 2,839,847 | |
| Utilities — 12.7% | |
City of New York New York Municipal Water Finance Authority, RB, Water & Sewer System, Fiscal 2009, Series A: | | | | | | | | |
5.75%, 06/15/18(b) | | | 114 | | | | 115,246 | |
5.75%, 06/15/40 | | | 381 | | | | 385,387 | |
City of New York New York Municipal Water Finance Authority, Refunding RB, Water & Sewer System, 2nd General Resolution: | | | | | | | | |
Fiscal 2011, Series HH, 5.00%, 06/15/32 | | | 2,249 | | | | 2,455,511 | |
Fiscal 2012, Series BB, 5.00%, 06/15/44 | | | 2,010 | | | | 2,193,795 | |
Series FF-2, 5.50%, 06/15/40 | | | 405 | | | | 424,832 | |
New York State Environmental Facilities Corp., Refunding RB, Subordinated SRF Bonds, Series 2016 A, 4.00%, 06/15/46 | | | 691 | | | | 722,930 | |
Utility Debt Securitization Authority, Refunding RB: | | | | | | | | |
5.00%, 12/15/41 | | | 3,719 | | | | 4,205,131 | |
Restructuring, 5.00%, 12/15/36 | | | 1,006 | | | | 1,159,835 | |
Restructuring, Series B, 4.00%, 12/15/35 | | | 280 | | | | 297,322 | |
| | | | | | | | |
| | | | | | | 11,959,989 | |
| | | | | | | | |
Total Municipal Bonds Transferred to Tender Option Bond
Trusts — 39.7%
(Cost — $35,917,793) | | | | 37,462,723 | |
| | | | | | | | |
Total Long-Term Investments — 162.1%
(Cost — $146,453,986) | | | | 153,039,624 | |
| | | | | | | | |
| | | | | | | | |
| Security | | Shares | | | Value | |
Short-Term Securities — 0.9% | |
BlackRock Liquidity Funds, MuniCash, Institutional Class,
0.94%(e)(f) | | | 866,475 | | | $ | 866,562 | |
| | | | | | | | |
Total Short-Term Securities — 0.9%
(Cost — $866,515) | | | | 866,562 | |
| | | | | | | | |
| |
Total Investments — 163.0%
(Cost — $147,320,501) | | | | 153,906,186 | |
Other Assets Less Liabilities — 1.6% | | | | 1,563,196 | |
Liability for TOB Trust Certificates, Including Interest Expense and Fees Payable — (21.9)% | | | | (20,665,280 | ) |
VRDP Shares at Liquidation Value, Net of Deferred Offering
Costs — (42.7)% | | | | (40,386,989 | ) |
| | | | | | | | |
Net Assets Applicable to Common Shares — 100.0% | | | $ | 94,417,113 | |
| | | | | | | | |
| (b) | U.S. Government securities, held in escrow, are used to pay interest on this security, as well as to retire the bond in full at the date indicated, typically at a premium to par. |
| (c) | Represent bonds transferred to a TOB Trust in exchange of cash and residual certificates received by the Trust. These bonds serve as collateral in a secured borrowing. See Note 4 of the Notes to Financial Statements for details. |
| (d) | All or a portion of security is subject to a recourse agreement. The aggregate maximum potential amount the Trust could ultimately be required to pay under the agreements, which expire between September 6, 2018 to February 15, 2019, is $1,482,731. See Note 4 of the Notes to Financial Statements for details. |
| (e) | Annualized 7-day yield as of period end. |
| (f) | During the period ended February 28, 2018, investments in issuers considered to be an affiliate of the Trust for purposes of Section 2(a)(3) of the Investment Company Act of 1940, as amended, were as follows: |
| | | | | | | | | | | | | | | | | | | | | | | | | | | | |
| Affiliated | | Shares
Held at
08/31/17 | | | Net
Activity | | | Shares
Held at
02/28/18 | | | Value at
02/28/18 | | | Income | | | Net
Realized
Gain (Loss) (a) | | | Change in
Unrealized
Appreciation
(Depreciation) | |
BlackRock Liquidity Funds, MuniCash, Institutional Class | | | 1,143,510 | | | | (277,035 | ) | | | 866,475 | | | $ | 866,562 | | | $ | 4,534 | | | $ | (9 | ) | | $ | 97 | |
| | | | | | | | | | | | | | | | | | | | | | | | | | | | |
| | (a) | Includes net capital gain distributions, if applicable. | |
For Trust compliance purposes, the Trust’s sector classifications refer to one or more of the sector sub-classifications used by one or more widely recognized market indexes or rating group indexes, and/or as defined by the investment adviser. These definitions may not apply for purposes of this report, which may combine such sector sub-classifications for reporting ease.
Derivative Financial Instruments Outstanding as of Period End
Futures Contracts
| | | | | | | | | | | | | | | | |
| Description | | Number of
Contracts | | | Expiration
Date | | | Notional
Amount (000) | | | Value/
Unrealized
Appreciation
(Depreciation) | |
Short Contracts: | | | | | | | | | | | | | | | | |
10-Year U.S. Treasury Note | | | 32 | | | | 06/20/18 | | | $ | 3,842 | | | $ | 2,999 | |
Long U.S. Treasury Bond | | | 30 | | | | 06/20/18 | | | | 4,303 | | | | (17,860 | ) |
5-Year U.S. Treasury Note | | | 21 | | | | 06/29/18 | | | | 2,393 | | | | 3,897 | |
| | | | | | | | | | | | | | | | |
| | | | | | | | | | | | | | $ | (10,964 | ) |
| | | | | | | | | | | | | | | | |
| | |
| 50 | | 2018 BLACKROCK SEMI-ANNUAL REPORTTO SHAREHOLDERS |
| | |
Schedule of Investments (unaudited) (continued) February 28, 2018 | | BlackRock New York Municipal Income Quality Trust (BSE) |
Derivative Financial Instruments Categorized by Risk Exposure
As of period end, the fair values of derivative financial instruments located in the Statements of Assets and Liabilities were as follows:
| | | | | | | | | | | | | | | | | | | | | | | | | | | | |
| | | Commodity
Contracts | | | Credit
Contracts | | | Equity
Contracts | | | Foreign
Currency
Exchange
Contracts | | | Interest
Rate
Contracts | | | Other
Contracts | | | Total | |
Assets — Derivative Financial Instruments | | | | | | | | | | | | | | | | | | | | | | | | | | | | |
Futures contracts | | | | | | | | | | | | | | | | | | | | | | | | | | | | |
Net unrealized appreciation(a) | | $ | — | | | $ | — | | | $ | — | | | $ | — | | | $ | 6,896 | | | $ | — | | | $ | 6,896 | |
| | | | | | | | | | | | | | | | | | | | | | | | | | | | |
Liabilities — Derivative Financial Instruments | | | | | | | | | | | | | | | | | | | | | | | | | | | | |
Futures contracts | | | | | | | | | | | | | | | | | | | | | | | | | | | | |
Net unrealized depreciation(a) | | $ | — | | | $ | — | | | $ | — | | | $ | — | | | $ | 17,860 | | | $ | — | | | $ | 17,860 | |
| | | | | | | | | | | | | | | | | | | | | | | | | | | | |
| | (a) | Includes cumulative appreciation (depreciation) on futures contracts, if any, as reported in the Schedule of Investments. Only current day’s variation margin is reported within the Statements of Assets and Liabilities. | |
For the six months ended February 28, 2018, the effect of derivative financial instruments in the Statements of Operations was as follows:
| | | | | | | | | | | | | | | | | | | | | | | | | | | | |
| | | Commodity
Contracts | | | Credit
Contracts | | | Equity
Contracts | | | Foreign
Currency
Exchange
Contracts | | | Interest
Rate
Contracts | | | Other
Contracts | | | Total | |
Net Realized Gain (Loss) from: | | | | | | | | | | | | | | | | | | | | | | | | | | | | |
Futures contracts | | $ | — | | | $ | — | | | $ | — | | | $ | — | | | $ | 573,767 | | | $ | — | | | $ | 573,767 | |
| | | | | | | | | | | | | | | | | | | | | | | | | | | | |
| Net Change in Unrealized Appreciation (Depreciation) on: | | | | | | | | | | | | | | | | | | | |
Futures contracts | | $ | — | | | $ | — | | | $ | — | | | $ | — | | | $ | 39,067 | | | $ | — | | | $ | 39,067 | |
| | | | | | | | | | | | | | | | | | | | | | | | | | | | |
Average Quarterly Balances of Outstanding Derivative Financial Instruments
| | | | |
Futures contracts | | | | |
Average notional value of contracts — short | | $ | 8,496,402 | |
For more information about the Trust’s investment risks regarding derivative financial instruments, refer to the Notes to Financial Statements.
Fair Value Hierarchy as of Period End
Various inputs are used in determining the fair value of investments and derivative financial instruments. For information about the Trust’s policy regarding valuation of investments and derivative financial instruments, refer to the Notes to Financial Statements.
The following tables summarize the Trust’s investments and derivative financial instruments categorized in the disclosure hierarchy:
| | | | | | | | | | | | | | | | |
| | | Level 1 | | | Level 2 | | | Level 3 | | | Total | |
Assets: | |
Investments: | |
Long-Term Investments(a) | | $ | — | | | $ | 153,039,624 | | | $ | — | | | $ | 153,039,624 | |
Short-Term Securities | | | 866,562 | | | | — | | | | — | | | | 866,562 | |
| | | | | | | | | | | | | | | | |
| | $ | 866,562 | | | $ | 153,039,624 | | | $ | | | | $ | 153,906,186 | |
| | | | | | | | | | | | | | | | |
Derivative Financial Instruments (b) | |
Assets: | |
Interest rate contracts | | $ | 6,896 | | | $ | — | | | $ | — | | | $ | 6,896 | |
Liabilities: | |
Interest rate contracts | | | (17,860 | ) | | | — | | | | — | | | | (17,860 | ) |
| | | | | | | | | | | | | | | | |
| | $ | (10,964 | ) | | $ | | | | $ | | | | $ | (10,964 | ) |
| | | | | | | | | | | | | | | | |
| | (a) | See above Schedule of Investments for values in each sector. | |
| | (b) | Derivative financial instruments are futures contracts which are valued at the unrealized appreciation (depreciation) on the instrument. | |
| | | | |
| SCHEDULES OF INVESTMENTS | | | 51 | |
| | |
Schedule of Investments (unaudited) (continued) February 28, 2018 | | BlackRock New York Municipal Income Quality Trust (BSE) |
The Trust may hold assets and/or liabilities in which the fair value approximates the carrying amount for financial statement purposes. As of period end, such assets and/or liabilities are categorized within the disclosure hierarchy as follows:
| | | | | | | | | | | | | | | | |
| | | Level 1 | | | Level 2 | | | Level 3 | | | Total | |
Liabilities: | |
TOB Trust Certificates | | $ | — | | | $ | (20,604,151 | ) | | $ | — | | | $ | (20,604,151 | ) |
VRDP Shares at Liquidation Value | | | — | | | | (40,500,000 | ) | | | — | | | | (40,500,000 | ) |
| | | | | | | | | | | | | | | | |
| | $ | | | | $ | (61,104,151 | ) | | $ | | | | $ | (61,104,151 | ) |
| | | | | | | | | | | | | | | | |
During the six months ended February 28, 2018, there were no transfers between levels.
See notes to financial statements.
| | |
| 52 | | 2018 BLACKROCK SEMI-ANNUAL REPORTTO SHAREHOLDERS |
| | |
Schedule of Investments (unaudited) February 28, 2018 | | BlackRock New York Municipal Income Trust II (BFY) (Percentages shown are based on Net Assets) |
| | | | | | | | |
| Security | | Par (000) | | | Value | |
Municipal Bonds — 148.0% | |
|
| New York — 144.1% | |
| Corporate — 5.1% | |
Build NYC Resource Corp., Refunding RB, Pratt Paper, Inc. Project, AMT, 5.00%, 01/01/35(a) | | $ | 140 | | | $ | 150,277 | |
City of New York New York Industrial Development Agency, Refunding RB, Transportation Infrastructure Properties LLC, Series A, AMT: | | | | | | | | |
5.00%, 07/01/22 | | | 350 | | | | 384,633 | |
5.00%, 07/01/28 | | | 330 | | | | 353,829 | |
County of Essex New York Industrial Development Agency, RB, International Paper Co. Project, Series A, AMT, 6.63%, 09/01/32 | | | 200 | | | | 205,078 | |
County of Onondaga New York Industrial Development Agency, RB, Bristol-Meyers Squibb Co. Project, AMT, 5.75%, 03/01/24 | | | 500 | | | | 590,285 | |
New York Liberty Development Corp., Refunding RB, Goldman Sachs Headquarters, 5.25%, 10/01/35 | | | 1,270 | | | | 1,559,928 | |
Niagara Area Development Corp., Refunding RB, Solid Waste Disposal Facility, Covanta Energy Project, Series A, AMT, 5.25%, 11/01/42(a) | | | 625 | | | | 625,388 | |
| | | | | | | | |
| | | | | | | 3,869,418 | |
| County/City/Special District/School District — 32.5% | |
City of New York New York, GO, Refunding: | | | | | | | | |
Series A, 5.00%, 08/01/30 | | | 1,700 | | | | 1,959,845 | |
Series E, 5.50%, 08/01/25 | | | 965 | | | | 1,124,003 | |
Series E, 5.00%, 08/01/30 | | | 500 | | | | 558,925 | |
City of New York New York, GO: | | | | | | | | |
Series A-1, 4.75%, 08/15/25 | | | 500 | | | | 507,370 | |
Series G-1, 6.25%, 12/15/31 | | | 5 | | | | 5,192 | |
Sub-Series D-1, Fiscal 2014, 5.00%, 08/01/31 | | | 690 | | | | 778,313 | |
Sub-Series G-1, 6.25%, 12/15/18(b) | | | 245 | | | | 254,251 | |
Sub-Series I-1, 5.38%, 04/01/19(b) | | | 120 | | | | 124,938 | |
Sub-Series I-1, 5.38%, 04/01/36 | | | 15 | | | | 15,601 | |
City of New York New York Convention Center Development Corp., RB, CAB, Sub Lien, Hotel Unit Fee, Series B (AGM), 0.00%, 11/15/55(c) | | | 1,000 | | | | 203,320 | |
City of New York New York Convention Center Development Corp., Refunding RB, Hotel Unit Fee Secured: | | | | | | | | |
5.00%, 11/15/40 | | | 1,445 | | | | 1,624,411 | |
5.00%, 11/15/45 | | | 2,340 | | | | 2,618,647 | |
City of New York New York Industrial Development Agency, RB, PILOT: | | | | | | | | |
CAB, Yankee Stadium Project, Series A (AGC), 0.00%, 03/01/42(c) | | | 1,750 | | | | 648,480 | |
CAB, Yankee Stadium Project, Series A (AGC), 0.00%, 03/01/45(c) | | | 500 | | | | 160,230 | |
CAB, Yankee Stadium Project, Series A (AGC), 0.00%, 03/01/35(c) | | | 500 | | | | 266,785 | |
Queens Baseball Stadium (AGC), 6.38%, 01/01/39 | | | 100 | | | | 103,802 | |
Queens Baseball Stadium (AMBAC), 5.00%, 01/01/39 | | | 500 | | | | 503,870 | |
Queens Baseball Stadium (AMBAC), 5.00%, 01/01/46 | | | 400 | | | | 402,648 | |
Yankee Stadium Project (NPFGC), 4.75%, 03/01/46 | | | 400 | | | | 400,600 | |
Yankee Stadium Project (NPFGC), 5.00%, 03/01/46 | | | 500 | | | | 502,830 | |
City of Syracuse New York, GO, Airport Terminal Security & Access, Series A, AMT (AGM), 4.75%, 11/01/31 | | | 500 | | | | 529,770 | |
County of Erie New York Fiscal Stability Authority, RB, Sales Tax and State Aid Secured Refunding Bonds, Series D: | | | | | | | | |
5.00%, 09/01/35 | | | 45 | | | | 52,552 | |
5.00%, 09/01/36 | | | 40 | | | | 46,605 | |
5.00%, 09/01/37 | | | 45 | | | | 52,309 | |
5.00%, 09/01/38 | | | 70 | | | | 81,244 | |
5.00%, 09/01/39 | | | 55 | | | | 63,736 | |
| | | | | | | | |
| Security | | Par (000) | | | Value | |
| County/City/Special District/School District (continued) | |
County of Nassau New York, GO, Refunding Series B, 5.00%, 04/01/32 | | $ | 335 | | | $ | 382,751 | |
Haverstraw-Stony Point Central School District, GO, Refunding, 5.00%, 10/15/36 | | | 120 | | | | 134,497 | |
Hudson Yards Infrastructure Corp., RB, Senior, Fiscal 2012: | | | | | | | | |
5.75%, 02/15/21(b) | | | 960 | | | | 1,069,143 | |
5.75%, 02/15/47 | | | 590 | | | | 645,655 | |
Hudson Yards Infrastructure Corp., Refunding RB, Series A: | | | | | | | | |
2nd Indenture, 5.00%, 02/15/45 | | | 565 | | | | 636,586 | |
Fiscal 2017, 5.00%, 02/15/42 | | | 700 | | | | 791,000 | |
New York Liberty Development Corp., Refunding RB: | | | | | | | | |
2nd Priority, Bank of America Tower at One Bryant Park Project, Class 2, 5.63%, 07/15/47 | | | 1,400 | | | | 1,500,128 | |
2nd Priority, Bank of America Tower at One Bryant Park Project, Class 3, 6.38%, 07/15/49 | | | 500 | | | | 534,585 | |
3 World Trade Center Project, Class 2, 5.38%, 11/15/40(a) | | | 200 | | | | 218,474 | |
4 World Trade Center Project, 5.00%, 11/15/31 | | | 1,000 | | | | 1,100,510 | |
4 World Trade Center Project, 5.00%, 11/15/44 | | | 1,250 | | | | 1,361,200 | |
7 World Trade Center Project, Class 2, 5.00%, 09/15/43 | | | 1,000 | | | | 1,087,780 | |
7 World Trade Center Project, Class 3, 5.00%, 03/15/44 | | | 690 | | | | 732,904 | |
World Trade Center Project, 5.75%, 11/15/51 | | | 670 | | | | 753,093 | |
| | | | | | | | |
| | | | | | | 24,538,583 | |
| Education — 26.2% | |
Amherst Development Corp., Refunding RB, University at Buffalo Foundation Faculty-Student Housing Corp., Series A (AGM), 4.63%, 10/01/20(b) | | | 275 | | | | 295,798 | |
Build NYC Resource Corp., Refunding RB: | | | | | | | | |
City University New York-Queens College Student Residences, LLC Project, Series A, 5.00%, 06/01/38 | | | 250 | | | | 279,488 | |
Manhattan College Project, 5.00%, 08/01/35 | | | 215 | | | | 243,064 | |
City of New York New York Trust for Cultural Resources, RB, Juilliard School, Series A, 5.00%, 01/01/39 | | | 500 | | | | 512,995 | |
City of New York New York Trust for Cultural Resources, Refunding RB, Series A: | | | | | | | | |
American Museum of Natural History, 5.00%, 07/01/37 | | | 440 | | | | 496,597 | |
Carnegie Hall, 4.75%, 12/01/39 | | | 700 | | | | 731,269 | |
City of Troy New York Capital Resource Corp., Refunding RB, Rensselaer Polytechnic Institute Project: | | | | | | | | |
Series A, 5.13%, 09/01/40 | | | 1,000 | | | | 1,055,210 | |
Series B, 4.00%, 08/01/35 | | | 190 | | | | 194,794 | |
City of Yonkers New York Industrial Development Agency, RB, Sarah Lawrence College Project, Series A, 6.00%, 06/01/19(b) | | | 500 | | | | 527,110 | |
Counties of Buffalo & Erie New York Industrial Land Development Corp., Refunding RB, Series A: | | | | | | | | |
Buffalo State College Foundation Housing Corp. Project, 5.38%, 10/01/41 | | | 280 | | | | 306,771 | |
The Charter School for Applied Technologies Project, 5.00%, 06/01/35 | | | 100 | | | | 105,523 | |
County of Cattaraugus New York, RB, St. Bonaventure University Project, 5.00%, 05/01/39 | | | 125 | | | | 135,688 | |
County of Dutchess New York Local Development Corp., Refunding RB, Vassar College Project: | | | | | | | | |
5.00%, 07/01/42 | | | 165 | | | | 187,930 | |
4.00%, 07/01/46 | | | 310 | | | | 318,255 | |
County of Monroe New York Industrial Development Corp., RB, University of Rochester Project, Series A, 5.00%, 07/01/21(b) | | | 1,000 | | | | 1,106,390 | |
County of Monroe New York Industrial Development Corp., Refunding RB: | | | | | | | | |
Nazareth College of Rochester Project, 4.00%, 10/01/47 | | | 50 | | | | 48,711 | |
University of Rochester Project, Series A, 5.00%, 07/01/23(b) | | | 240 | | | | 276,228 | |
| | | | |
| SCHEDULES OF INVESTMENTS | | | 53 | |
| | |
Schedule of Investments (unaudited) (continued) February 28, 2018 | | BlackRock New York Municipal Income Trust II (BFY) (Percentages shown are based on Net Assets) |
| | | | | | | | |
| Security | | Par (000) | | | Value | |
| Education (continued) | |
County of Monroe New York Industrial Development Corp., Refunding RB (continued): | | | | | | | | |
University of Rochester Project, Series D, 4.00%, 07/01/43 | | $ | 215 | | | $ | 221,755 | |
County of Nassau New York Industrial Development Agency, Refunding RB, New York Institute of Technology Project, Series A, 4.75%, 03/01/20(b) | | | 350 | | | | 371,301 | |
County of St. Lawrence New York Industrial Development Agency, RB, Clarkson University Project: | | | | | | | | |
6.00%, 09/01/34 | | | 150 | | | | 168,816 | |
5.38%, 09/01/41 | | | 650 | | | | 714,499 | |
County of Tompkins New York Development Corp., RB, Ithaca College Project (AGM), 5.50%, 01/01/21(b) | | | 450 | | | | 497,579 | |
Geneva Development Corp., Refunding RB, Hobart & William Smith Colleges, 5.25%, 09/01/44 | | | 400 | | | | 448,528 | |
State of New York Dormitory Authority, RB: | | | | | | | | |
Convent of the Sacred Heart (AGM), 5.75%, 11/01/40 | | | 500 | | | | 554,430 | |
Education, Series B, 5.75%, 03/15/19(b) | | | 300 | | | | 313,407 | |
Fordham University, Series A, 5.50%, 07/01/21(b) | | | 150 | | | | 167,601 | |
State University Dormitory Facilities, Series A, 5.00%, 07/01/19(b) | | | 250 | | | | 261,413 | |
State University Dormitory Facilities, Series A, 5.00%, 07/01/41 | | | 670 | | | | 730,360 | |
Touro College & University System, Series A, 5.25%, 01/01/34 | | | 1,200 | | | | 1,319,688 | |
University of Rochester, Series A, 5.13%, 07/01/19(b) | | | 215 | | | | 224,875 | |
University of Rochester, Series A, 5.13%, 07/01/39 | | | 35 | | | | 36,570 | |
State of New York Dormitory Authority, Refunding RB: | | | | | | | | |
Barnard College, Series A, 5.00%, 07/01/34 | | | 150 | | | | 170,556 | |
Brooklyn Law School, 5.75%, 07/01/33 | | | 250 | | | | 260,123 | |
Fordham University, 5.00%, 07/01/44 | | | 640 | | | | 711,718 | |
Icahn School of Medicine at Mount Sinai, Series A, 5.00%, 07/01/35 | | | 685 | | | | 758,836 | |
New York University, Series A, 5.00%, 07/01/37 | | | 600 | | | | 669,804 | |
Skidmore College, Series A, 5.25%, 07/01/29 | | | 200 | | | | 220,836 | |
Skidmore College, Series A, 5.25%, 07/01/31 | | | 300 | | | | 330,948 | |
State University Dormitory Facilities, Series A, 5.25%, 07/01/30 | | | 1,220 | | | | 1,398,230 | |
State University Dormitory Facilities, Series A, 5.25%, 07/01/32 | | | 700 | | | | 801,129 | |
State University Dormitory Facilities, Series A, 5.00%, 07/01/46 | | | 310 | | | | 352,014 | |
Teachers College, 5.50%, 03/01/19(b) | | | 650 | | | | 676,032 | |
Town of Hempstead New York Local Development Corp., Refunding RB: | | | | | | | | |
Adelphi University Project, 5.00%, 10/01/35 | | | 210 | | | | 236,510 | |
Hofstra University Project, 4.00%, 07/01/37 | | | 220 | | | | 226,208 | |
Hofstra University Project, 5.00%, 07/01/47 | | | 100 | | | | 111,848 | |
| | | | | | | | |
| | | | | | | 19,777,435 | |
| Health — 14.8% | |
County of Dutchess New York Local Development Corp., RB, Health Quest Systems, Inc., Series B, 4.00%, 07/01/41 | | | 185 | | | | 188,408 | |
County of Dutchess New York Local Development Corp., Refunding RB, Health Quest System, Inc., Series A, 5.75%, 07/01/40 | | | 300 | | | | 326,631 | |
County of Genesee New York Industrial Development Agency, Refunding RB, United Memorial Medical Center Project, 5.00%, 12/01/27 | | | 210 | | | | 210,116 | |
County of Monroe New York Industrial Development Corp., RB, Rochester General Hospital Project: | | | | | | | | |
4.00%, 12/01/41 | | | 200 | | | | 199,086 | |
5.00%, 12/01/46 | | | 320 | | | | 349,626 | |
| | | | | | | | |
| Security | | Par (000) | | | Value | |
| Health (continued) | |
County of Monroe New York Industrial Development Corp., RB, Rochester General Hospital Project (continued): | | | | | | | | |
Series A, 5.00%, 12/01/32 | | $ | 180 | | | $ | 194,861 | |
Series A, 5.00%, 12/01/37 | | | 250 | | | | 268,577 | |
County of Monroe New York Industrial Development Corp., Refunding RB, Unity Hospital of Rochester Project (FHA), 5.50%, 08/15/40 | | | 1,425 | | | | 1,567,300 | |
County of Suffolk New York EDC, RB, Catholic Health Services, Series C, 5.00%, 07/01/32 | | | 150 | | | | 164,096 | |
County of Westchester New York Healthcare Corp., Refunding RB, Senior Lien: | | | | | | | | |
Remarketing, Series A, 5.00%, 11/01/30 | | | 895 | | | | 955,663 | |
Series B, 6.00%, 11/01/20(b) | | | 130 | | | | 144,387 | |
Series B, 6.00%, 11/01/30 | | | 20 | | | | 21,738 | |
County of Westchester New York Local Development Corp., Refunding RB, Kendal On Hudson Project, 5.00%, 01/01/34 | | | 500 | | | | 536,720 | |
State of New York Dormitory Authority, RB, Series A(b): | | | | | | | | |
Healthcare, 5.00%, 03/15/19 | | | 500 | | | | 518,500 | |
New York State Association for Retarded Children, Inc., 6.00%, 07/01/19 | | | 250 | | | | 264,520 | |
New York University Hospitals Center, 5.75%, 07/01/20 | | | 425 | | | | 464,669 | |
State of New York Dormitory Authority, Refunding RB: | | | | | | | | |
General Purpose, Series A, 5.00%, 02/15/42 | | | 250 | | | | 282,105 | |
Memorial Sloan-Kettering Cancer Center, Series 1, 4.00%, 07/01/37 | | | 50 | | | | 52,790 | |
Memorial Sloan-Kettering Cancer Center, Series 1, 5.00%, 07/01/42 | | | 370 | | | | 420,464 | |
Miriam Osborn Memorial Home Association, 5.00%, 07/01/29 | | | 130 | | | | 134,501 | |
Mount Sinai Hospital, Series A, 5.00%, 07/01/26 | | | 500 | | | | 532,125 | |
North Shore-Long Island Jewish Obligated Group, Series A, 5.00%, 05/01/21(b) | | | 1,000 | | | | 1,098,290 | |
North Shore-Long Island Jewish Obligated Group, Series A, 5.00%, 05/01/21(b) | | | 750 | | | | 823,717 | |
North Shore-Long Island Jewish Obligated Group, Series A, 5.00%, 05/01/43 | | | 860 | | | | 947,522 | |
North Shore-Long Island Jewish Obligated Group, Series E, 5.50%, 05/01/33 | | | 500 | | | | 518,495 | |
| | | | | | | | |
| | | | | | | 11,184,907 | |
| Housing — 5.2% | |
City of New York New York Housing Development Corp., RB, M/F Housing, Fund Grant Program, New York City Housing Authority Program, Series B1: | | | | | | | | |
5.25%, 07/01/32 | | | 915 | | | | 1,010,938 | |
5.00%, 07/01/33 | | | 400 | | | | 435,420 | |
City of New York New York Housing Development Corp., Refunding RB, M/F Housing, 8 Spruce Street, Class F, 4.50%, 02/15/48 | | | 500 | | | | 515,665 | |
County of Onondaga New York Trust for Cultural Resources, Refunding RB, Abby Lane Housing Corporation Project, 5.00%, 05/01/40 | | | 265 | | | | 291,988 | |
State of New York HFA, RB: | | | | | | | | |
Affordable Housing, Series E (SONYMA), 4.15%, 11/01/47 | | | 660 | | | | 673,728 | |
M/F Housing, Highland Avenue Senior Apartments, Series A, AMT (SONYMA), 5.00%, 02/15/39 | | | 970 | | | | 973,482 | |
| | | | | | | | |
| | | | | | | 3,901,221 | |
| State — 12.8% | |
City of New York New York Transitional Finance Authority, Refunding RB, Fiscal 2018: | | | | | | | | |
Series S-1, 5.00%, 07/15/35 | | | 205 | | | | 235,736 | |
Series S-2, 5.00%, 07/15/35 | | | 205 | | | | 235,736 | |
| | |
| 54 | | 2018 BLACKROCK SEMI-ANNUAL REPORTTO SHAREHOLDERS |
| | |
Schedule of Investments (unaudited) (continued) February 28, 2018 | | BlackRock New York Municipal Income Trust II (BFY) (Percentages shown are based on Net Assets) |
| | | | | | | | |
| Security | | Par (000) | | | Value | |
| State (continued) | |
City of New York New York Transitional Finance Authority Future Tax Secured, RB: | | | | | | | | |
Fiscal 2012, Sub-Series D-1, 5.00%, 11/01/38 | | $ | 825 | | | $ | 903,119 | |
Fiscal 2014, Sub-Series B-1, 5.00%, 11/01/36 | | | 340 | | | | 384,118 | |
Series A-2, 5.00%, 08/01/39 | | | 355 | | | | 405,335 | |
Sub-Series E-1, 5.00%, 02/01/38 | | | 750 | | | | 852,713 | |
Sub-Series F-1, 5.00%, 05/01/38 | | | 580 | | | | 661,339 | |
Sub-Series F-1, 5.00%, 05/01/39 | | | 245 | | | | 278,942 | |
Metropolitan Transportation Authority, Refunding RB, Dedicated Tax Fund, Sub-Series B-1, 5.00%, 11/15/31 | | | 750 | | | | 852,465 | |
State of New York, GO, Series A, 5.00%, 02/15/39 | | | 500 | | | | 515,475 | |
State of New York Dormitory Authority, RB: | | | | | | | | |
General Purpose, Series B, 5.00%, 03/15/37 | | | 1,070 | | | | 1,172,945 | |
General Purpose, Series B, 5.00%, 03/15/42 | | | 1,000 | | | | 1,093,790 | |
General Purpose, Series C, 5.00%, 03/15/34 | | | 1,000 | | | | 1,087,010 | |
Series A, 5.00%, 03/15/36 | | | 350 | | | | 400,950 | |
State of New York Urban Development Corp., RB, State Personal Income Tax, Series C, 5.00%, 03/15/30 | | | 500 | | | | 561,065 | |
| | | | | | | | |
| | | | | | | 9,640,738 | |
| Tobacco — 3.8% | |
Counties of New York Tobacco Trust IV, Refunding RB, Settlement Pass-Through Turbo, Series A,
6.25%, 06/01/41(a) | | | 400 | | | | 412,268 | |
Counties of New York Tobacco Trust VI, Refunding RB: | | | | | | | | |
Settlement Pass-Through Turbo, Series C, 4.00%, 06/01/51 | | | 750 | | | | 694,117 | |
Tobacco Settlement Pass-Through, Series A-2B, 5.00%, 06/01/51 | | | 600 | | | | 622,950 | |
County of Chautauqua New York Tobacco Asset Securitization Corp., Refunding RB, Asset-Backed, 4.75%, 06/01/39 | | | 250 | | | | 251,325 | |
County of Niagara New York Tobacco Asset Securitization Corp., Refunding RB, Asset-Backed, 5.25%, 05/15/40 | | | 230 | | | | 245,771 | |
Westchester New York Tobacco Asset Securitization, Refunding RB, Tobacco Settlement Bonds, Sub-Series C, 4.00%, 06/01/42 | | | 295 | | | | 284,758 | |
Westchester Tobacco Asset Securitization, Refunding RB, Tobacco Settlement Bonds, Sub-Series C, 5.13%, 06/01/51 | | | 355 | | | | 362,444 | |
| | | | | | | | |
| | | | | | | 2,873,633 | |
| Transportation — 26.8% | |
Buffalo & Fort Erie Public Bridge Authority, RB, Toll Bridge System, 5.00%, 01/01/42 | | | 215 | | | | 241,391 | |
Metropolitan Transportation Authority, RB: | | | | | | | | |
Series A-1, 5.25%, 11/15/23(b) | | | 270 | | | | 316,586 | |
Series C, 6.50%, 11/15/28 | | | 145 | | | | 150,213 | |
Series E, 5.00%, 11/15/38 | | | 1,000 | | | | 1,119,090 | |
Metropolitan Transportation Authority, Refunding RB: | | | | | | | | |
Green Bonds, CAB, Series C-2, 0.00%, 11/15/39(c) | | | 570 | | | | 241,315 | |
Green Bonds, Climate Bond Certified, Sub-Series B-2, 4.00%, 11/15/34 | | | 500 | | | | 527,560 | |
Green Bonds, Series A-1, 5.25%, 11/15/56 | | | 250 | | | | 282,280 | |
Series B, 5.00%, 11/15/37 | | | 915 | | | | 1,034,746 | |
Series F, 5.00%, 11/15/30 | | | 1,500 | | | | 1,674,525 | |
Series F, 5.00%, 11/15/35 | | | 500 | | | | 566,460 | |
Metropolitan Transportation Authority Hudson Rail Yards Trust Obligations, Refunding RB, Series A, 5.00%, 11/15/56 | | | 1,120 | | | | 1,242,763 | |
New York Liberty Development Corp., RB, World Trade Center Port Authority Consolidated, 5.25%, 12/15/43 | | | 500 | | | | 552,980 | |
New York Transportation Development Corp., ARB, LaGuardia Airport Terminal B Redevelopment Project, Series A, AMT: | | | | | | | | |
5.00%, 07/01/46 | | | 1,320 | | | | 1,431,500 | |
5.25%, 01/01/50 | | | 1,325 | | | | 1,449,259 | |
(AGM), 4.00%, 07/01/41 | | | 300 | | | | 306,045 | |
| | | | | | | | |
| Security | | Par (000) | | | Value | |
| Transportation (continued) | |
New York Transportation Development Corp., Refunding ARB, American Airlines, Inc., AMT, 5.00%, 08/01/31 | | $ | 920 | | | $ | 974,041 | |
Port Authority of New York & New Jersey, ARB, Special Project, JFK International Air Terminal LLC Project, Series 8, 6.00%, 12/01/42 | | | 1,000 | | | | 1,096,790 | |
Port Authority of New York & New Jersey, Refunding ARB, Consolidated, AMT: | | | | | | | | |
177th Series, 4.00%, 01/15/43 | | | 480 | | | | 486,134 | |
178th Series, 5.00%, 12/01/43 | | | 430 | | | | 474,355 | |
State of New York Thruway Authority, RB, Junior Lien, Series A, 5.25%, 01/01/56 | | | 305 | | | | 343,046 | |
State of New York Thruway Authority, Refunding RB, General: | | | | | | | | |
Series I, 5.00%, 01/01/37 | | | 1,530 | | | | 1,675,886 | |
Series I, 5.00%, 01/01/42 | | | 1,030 | | | | 1,122,679 | |
Series J, 5.00%, 01/01/41 | | | 1,000 | | | | 1,097,800 | |
Triborough Bridge & Tunnel Authority, RB, Series B, 5.00%, 11/15/40 | | | 240 | | | | 273,137 | |
Triborough Bridge & Tunnel Authority, Refunding RB, General: | | | | | | | | |
MTA Bridges & Tunnels, Series C-2, 5.00%, 11/15/42 | | | 505 | | | | 578,467 | |
Series A, 5.25%, 11/15/45 | | | 370 | | | | 425,877 | |
Series A, 5.00%, 11/15/50 | | | 500 | | | | 559,855 | |
| | | | | | | | |
| | | | | | | 20,244,780 | |
| Utilities — 16.9% | |
City of New York New York Municipal Water Finance Authority, RB, Water & Sewer System, 2nd General Resolution, Fiscal 2017, Series DD, 5.25%, 06/15/47 | | | 245 | | | | 284,210 | |
City of New York New York Municipal Water Finance Authority, Refunding RB, Water & Sewer System, 2nd General Resolution, Fiscal 2015, Series HH, 5.00%, 06/15/39 | | | 1,500 | | | | 1,697,070 | |
City of New York New York Water & Sewer System, RB, 2nd General Resolution, Fiscal 2017, Series DD, 5.00%, 06/15/47 | | | 270 | | | | 305,629 | |
Long Island Power Authority, RB, Electric Systems: | | | | | | | | |
CAB, Series A (AGM), 0.00%, 06/01/28(c) | | | 3,515 | | | | 2,523,559 | |
General, 5.00%, 09/01/42 | | | 200 | | | | 225,788 | |
General, Series C (CIFG), 5.25%, 09/01/29 | | | 1,000 | | | | 1,198,020 | |
Long Island Power Authority, Refunding RB, Electric System: | | | | | | | | |
Series A, 5.50%, 04/01/19(b) | | | 500 | | | | 520,965 | |
Series B, 5.00%, 09/01/41 | | | 75 | | | | 84,026 | |
Series B, 5.00%, 09/01/46 | | | 335 | | | | 373,485 | |
State of New York Environmental Facilities Corp., RB, Green Bond, Series C, 5.00%, 08/15/37 | | | 510 | | | | 592,039 | |
State of New York Environmental Facilities Corp., Refunding RB, New York City Municipal Water: | | | | | | | | |
Revolving Funds, Series B, 5.00%, 06/15/36 | | | 350 | | | | 383,575 | |
State Clean Water & Drinking Water Revolving Finance Authority Projects, Series A, 5.00%, 06/15/37 | | | 1,500 | | | | 1,513,890 | |
Utility Debt Securitization Authority, Refunding RB, Restructuring, Series E, 5.00%, 12/15/41 | | | 2,690 | | | | 3,045,457 | |
| | | | | | | | |
| | | | | | | 12,747,713 | |
|
| Multi-State — 2.8% | |
| Housing — 2.8% | | | | | | |
Centerline Equity Issuer Trust(a)(d): | | | | | | | | |
Series A-4-2, 6.00%, 10/31/19 | | | 1,000 | | | | 1,046,490 | |
Series B-3-2, 6.30%, 10/31/19 | | | 1,000 | | | | 1,049,930 | |
| | | | | | | | |
| | | | | | | 2,096,420 | |
|
| Puerto Rico — 1.1% | |
| Tobacco — 1.1% | |
Children’s Trust Fund, Refunding RB, Tobacco Settlement Asset-Backed Bonds, 5.63%, 05/15/43 | | | 900 | | | | 838,683 | |
| | | | | | | | |
Total Municipal Bonds — 148.0%
(Cost — $105,564,513) | | | | 111,713,531 | |
| | | | | | | | |
| | | | |
| SCHEDULES OF INVESTMENTS | | | 55 | |
| | |
Schedule of Investments (unaudited) (continued) February 28, 2018 | | BlackRock New York Municipal Income Trust II (BFY) (Percentages shown are based on Net Assets) |
| | | | | | | | |
| Security | | Par (000) | | | Value | |
Municipal Bonds Transferred to Tender Option Bond Trusts (e) — 18.2% | |
|
| New York — 18.2% | |
| County/City/Special District/School District — 4.4% | | | | | | |
City of New York New York, GO, Sub-Series I-1, 5.00%, 03/01/36 | | $ | 500 | | | $ | 563,743 | |
City of New York New York Convention Center Development Corp., Refunding RB, Hotel Unit Fee Secured, 5.00%, 11/15/32 | | | 500 | | | | 570,885 | |
New York Liberty Development Corp., ARB, 1 World Trade Center Port Authority Consolidated Bonds, 5.25%, 12/15/43 | | | 1,995 | | | | 2,202,790 | |
| | | | | | | | |
| | | | | | | 3,337,418 | |
| Education — 0.8% | |
City of New York New York Trust for Cultural Resources, Refunding RB, Wildlife Conservation Society, Series A, 5.00%, 08/01/33 | | | 510 | | | | 571,670 | |
| | | | | | | | |
| State — 4.1% | |
City of New York New York Transitional Finance Authority, BARB, Fiscal 2009, Series S-3, 5.25%, 01/15/39 | | | 1,300 | | | | 1,339,263 | |
Sales Tax Asset Receivable Corp., Refunding RB, Fiscal 2015, Series A: | | | | | | | | |
5.00%, 10/15/31 | | | 255 | | | | 294,735 | |
4.00%, 10/15/32 | | | 350 | | | | 378,948 | |
State of New York Dormitory Authority, RB, General Purpose, Series C, 5.00%, 03/15/41 | | | 1,000 | | | | 1,085,135 | |
| | | | | | | | |
| | | | | | | 3,098,081 | |
| Transportation — 3.3% | |
Port Authority of New York & New Jersey, Refunding ARB: | | | | | | | | |
194th Series, 5.25%, 10/15/55 | | | 735 | | | | 833,078 | |
Consolidated, Series 169th, 5.00%, 10/15/26 | | | 1,000 | | | | 1,092,460 | |
Triborough Bridge & Tunnel Authority, Refunding RB, General, Series A, 5.00%, 11/15/46 | | | 500 | | | | 562,153 | |
| | | | | | | | |
| | | | | | | 2,487,691 | |
| Utilities — 5.6% | |
City of New York New York Municipal Water Finance Authority, RB, Water & Sewer System, Fiscal 2009, Series A: | | | | | | | | |
5.75%, 06/15/18(b) | | | 55 | | | | 55,877 | |
5.75%, 06/15/40 | | | 185 | | | | 186,854 | |
City of New York New York Municipal Water Finance Authority, Refunding RB, Water & Sewer System, 2nd General Resolution: | | | | | | | | |
Fiscal 2011, Series HH, 5.00%, 06/15/32 | | | 1,500 | | | | 1,638,420 | |
Fiscal 2012, Series BB, 5.00%, 06/15/44 | | | 1,005 | | | | 1,096,898 | |
| | | | | | | | |
| Security | | Par (000) | | | Value | |
| Utilities (continued) | |
New York State Environmental Facilities Corp., Refunding RB, Subordinated SRF Bonds, Series 2016 A, 4.00%, 06/15/46 | | $ | 992 | | | $ | 1,037,247 | |
Utility Debt Securitization Authority, Refunding RB, Restructuring, Series B, 4.00%, 12/15/35 | | | 190 | | | | 201,754 | |
| | | | | | | | |
| | | | | | | 4,217,050 | |
| | | | | | | | |
Total Municipal Bonds Transferred to Tender Option Bond
Trusts — 18.2%
(Cost — $13,184,771) | | | | 13,711,910 | |
| | | | | | | | |
Total Long-Term Investments — 166.2%
(Cost — $118,749,284) | | | | 125,425,441 | |
| | | | | | | | |
| | |
| | | Shares | | | | |
Short-Term Securities — 0.9% | |
BlackRock Liquidity Funds, MuniCash, Institutional Class, 0.94%(f)(g) | | | 669,805 | | | | 669,872 | |
| | | | | | | | |
Total Short-Term Investments — 0.9%
(Cost — $669,813) | | | | 669,872 | |
Total Investments — 167.1%
(Cost — $119,419,097) | | | | 126,095,313 | |
Other Assets Less Liabilities — 1.9% | | | | 1,487,703 | |
Liability for TOB Trust Certificates, Including Interest
Expense and Fees Payable — (10.4)% | | | | (7,840,313 | ) |
VRDP Shares at Liquidation Value, Net of Deferred Offering
Costs — (58.6)% | | | | (44,292,548 | ) |
| | | | | | | | |
Net Assets Applicable to Common Shares — 100.0% | | | $ | 75,450,155 | |
| | | | | | | | |
| (a) | Security exempt from registration pursuant to Rule 144A under the Securities Act of 1933, as amended. These securities may be resold in transactions exempt from registration to qualified institutional investors. |
| (b) | U.S. Government securities, held in escrow, are used to pay interest on this security, as well as to retire the bond in full at the date indicated, typically at a premium to par. |
| (d) | Represents a beneficial interest in a trust. The collateral deposited into the trust is federally tax-exempt revenue bonds issued by various state or local governments, or their respective agencies or authorities. The security is subject to remarketing prior to its stated maturity. |
| (e) | Represent bonds transferred to a TOB Trust in exchange of cash and residual certificates received by the Trust. These bonds serve as collateral in a secured borrowing. See Note 4 of the Notes to Financial Statements for details. |
| (f) | Annualized 7-day yield as of period end. |
| (g) | During the period ended February 28, 2018, investments in issuers considered to be an affiliate of the Trust for purposes of Section 2(a)(3) of the Investment Company Act of 1940, as amended, were as follows: |
| | | | | | | | | | | | | | | | | | | | | | | | | | | | |
| Affiliated | | Shares
Held at
08/31/17 | | | Net
Activity | | | Shares
Held at
02/28/18 | | | Value at
02/28/18 | | | Income | | | Net Realized
Gain (Loss) (a) | | | Change in
Unrealized
Appreciation
(Depreciation) | |
BlackRock Liquidity Funds, MuniCash, Institutional Class | | | 604,604 | | | | 65,201 | | | | 669,805 | | | $ | 669,872 | | | $ | 4,029 | | | $ | (24 | ) | | $ | 59 | |
| | | | | | | | | | | | | | | | | | | | | | | | | | | | |
| | (a) | Includes net capital gain distributions, if applicable. | |
For Trust compliance purposes, the Trust’s sector classifications refer to one or more of the sector sub-classifications used by one or more widely recognized market indexes or rating group indexes, and/or as defined by the investment adviser. These definitions may not apply for purposes of this report, which may combine such sector sub-classifications for reporting ease.
| | |
| 56 | | 2018 BLACKROCK SEMI-ANNUAL REPORTTO SHAREHOLDERS |
| | |
Schedule of Investments (unaudited) (continued) February 28, 2018 | | BlackRock New York Municipal Income Trust II (BFY) |
Derivative Financial Instruments Outstanding as of Period End
Futures Contracts
| | | | | | | | | | | | | | | | |
| Description | | Number of
Contracts | | | Expiration
Date | | | Notional
Amount (000) | | | Value/
Unrealized
Appreciation
(Depreciation) | |
Short Contracts: | | | | | | | | | | | | | | | | |
10-Year U.S. Treasury Note | | | 25 | | | | 06/20/18 | | | $ | 3,001 | | | $ | 2,343 | |
Long U.S. Treasury Bond | | | 28 | | | | 06/20/18 | | | | 4,016 | | | | (16,647 | ) |
5-Year U.S. Treasury Note | | | 15 | | | | 06/29/18 | | | | 1,709 | | | | 2,749 | |
| | | | | | | | | | | | | | | | |
| | | | | | | | | | | | | | $ | (11,555 | ) |
| | | | | | | | | | | | | | | | |
Derivative Financial Instruments Categorized by Risk Exposure
As of period end, the fair values of derivative financial instruments located in the Statements of Assets and Liabilities were as follows:
| | | | | | | | | | | | | | | | | | | | | | | | | | | | |
| | | Commodity
Contracts | | | Credit
Contracts | | | Equity
Contracts | | | Foreign
Currency
Exchange
Contracts | | | Interest
Rate
Contracts | | | Other
Contracts | | | Total | |
Assets — Derivative Financial Instruments | | | | | | | | | | | | | | | | | | | | | | | | | | | | |
Futures contracts | | | | | | | | | | | | | | | | | | | | | | | | | | | | |
Net unrealized appreciation(a) | | $ | — | | | $ | — | | | $ | — | | | $ | — | | | $ | 5,092 | | | $ | — | | | $ | 5,092 | |
| | | | | | | | | | | | | | | | | | | | | | | | | | | | |
Liabilities — Derivative Financial Instruments | | | | | | | | | | | | | | | | | | | | | | | | | | | | |
Futures contracts | | | | | | | | | | | | | | | | | | | | | | | | | | | | |
Net unrealized depreciation(a) | | $ | — | | | $ | — | | | $ | — | | | $ | — | | | $ | 16,647 | | | $ | — | | | $ | 16,647 | |
| | | | | | | | | | | | | | | | | | | | | | | | | | | | |
| | (a) | Includes cumulative appreciation (depreciation) on futures if any, as reported in the Schedule of Investments. Only current day’s variation margin is reported within the Statements of Assets and Liabilities. | |
For the six months ended February 28, 2018, the effect of derivative financial instruments in the Statements of Operations was as follows:
| | | | | | | | | | | | | | | | | | | | | | | | | | | | |
| | | Commodity
Contracts | | | Credit
Contracts | | | Equity
Contracts | | | Foreign
Currency
Exchange
Contracts | | | Interest
Rate
Contracts | | | Other
Contracts | | | Total | |
Net Realized Gain (Loss) from: | | | | | | | | | | | | | | | | | | | | | | | | | | | | |
Futures contracts | | $ | — | | | $ | — | | | $ | — | | | $ | — | | | $ | 480,542 | | | $ | — | | | $ | 480,542 | |
| | | | | | | | | | | | | | | | | | | | | | | | | | | | |
| Net Change in Unrealized Appreciation (Depreciation) on: | | | | | | | | | | | | | | | | | | | | | |
Futures contracts | | $ | — | | | $ | — | | | $ | — | | | $ | — | | | $ | 28,442 | | | $ | — | | | $ | 28,442 | |
| | | | | | | | | | | | | | | | | | | | | | | | | | | | |
Average Quarterly Balances of Outstanding Derivative Financial Instruments
| | | | |
Futures contracts: | |
Average notional value of contracts — short | | $ | 6,980,051 | |
For more information about the Trust’s investment risks regarding derivative financial instruments, refer to the Notes to Financial Statements
| | | | |
| SCHEDULES OF INVESTMENTS | | | 57 | |
| | |
Schedule of Investments (unaudited) (continued) February 28, 2018 | | BlackRock New York Municipal Income Trust II (BFY) |
Fair Value Hierarchy as of Period End
Various inputs are used in determining the fair value of investments and derivative financial instruments. For information about the Trust’s policy regarding valuation of investments and derivative financial instruments, refer to the Notes to Financial Statements.
The following tables summarize the Trust’s investments and derivative financial instruments categorized in the disclosure hierarchy:
| | | | | | | | | | | | | | | | |
| | | Level 1 | | | Level 2 | | | Level 3 | | | Total | |
Assets: | | | | | | | | | | | | | | | | |
Investments: | |
Long-Term Investments(a) | | $ | — | | | $ | 125,425,441 | | | $ | — | | | $ | 125,425,441 | |
Short-Term Securities | | | 669,872 | | | | — | | | | — | | | | 669,872 | |
| | | | | | | | | | | | | | | | |
| | $ | 669,872 | | | $ | 125,425,441 | | | $ | — | | | $ | 126,095,313 | |
| | | | | | | | | | | | | | | | |
Derivative Financial Instruments(b) | | | | | | | | | | | | | | | | |
Assets: | |
Interest rate contracts | | $ | 5,092 | | | $ | — | | | $ | — | | | $ | 5,092 | |
Liabilities: | | | | | | | | | | | | | | | | |
Interest rate contracts | | | (16,647 | ) | | | — | | | | — | | | | (16,647 | ) |
| | | | | | | | | | | | | | | | |
| | $ | (11,555 | ) | | $ | — | | | $ | — | | | $ | (11,555 | ) |
| | | | | | | | | | | | | | | | |
| | (a) | See above Schedule of Investments for values in each sector. | |
| | (b) | Derivative financial instruments are futures contracts which are valued at the unrealized appreciation (depreciation) on the instrument. | |
The Trust may hold assets and/or liabilities in which the fair value approximates the carrying amount for financial statement purposes. As of period end, such assets and/or liabilities are categorized within the disclosure hierarchy as follows:
| | | | | | | | | | | | | | | | |
| | | Level 1 | | | Level 2 | | | Level 3 | | | Total | |
Liabilities: | |
TOB Trust Certificates | | $ | — | | | $ | (7,816,903 | ) | | $ | — | | | $ | (7,816,903 | ) |
VRDP Shares at Liquidation Value | | | — | | | | (44,400,000 | ) | | | — | | | | (44,400,000 | ) |
| | | | | | | | | | | | | | | | |
| | $ | — | | | $ | (52,216,903 | ) | | $ | — | | | $ | (52,216,903 | ) |
| | | | | | | | | | | | | | | | |
During the six months ended February 28, 2018, there were no transfers between levels.
See notes to financial statements.
| | |
| 58 | | 2018 BLACKROCK SEMI-ANNUAL REPORTTO SHAREHOLDERS |
| | |
Schedule of Investments (unaudited) February 28, 2018 | | BlackRock Virginia Municipal Bond Trust (BHV) (Percentages shown are based on Net Assets) |
| | | | | | | | |
| Security | | Par
(000) | | | Value | |
Municipal Bonds — 131.7% | |
|
| Virginia — 120.5% | |
| Corporate — 2.1% | |
County of Chesterfield Virginia EDA, RB, Virginia Electric Power Co. Project, Series A, AMT, 5.60%, 11/01/31 | | $ | 500 | | | $ | 501,295 | |
| | | | | | | | |
| County/City/Special District/School District — 25.4% | | | | | | |
Ballston Quarter Community Development Authority, Tax Allocation Bonds, Series A, 5.38%, 03/01/36 | | | 250 | | | | 260,588 | |
Cherry Hill Virginia Community Development Authority, Special Assessment Bonds, Potomac Shores Project, 5.40%, 03/01/45(a) | | | 250 | | | | 255,695 | |
City of Portsmouth Virginia, GO, Refunding Series D(b): | | | | | | | | |
5.00%, 07/15/20 | | | 485 | | | | 522,946 | |
5.00%, 07/15/20 | | | 15 | | | | 16,192 | |
City of Suffolk Virginia, GO, Refunding, 5.00%, 06/01/21(b) | | | 1,000 | | | | 1,103,130 | |
County of Fairfax Virginia EDA, RB, Silverline Phase I Project, 5.00%, 04/01/20(b) | | | 1,000 | | | | 1,069,080 | |
County of Fairfax Virginia Redevelopment & Housing Authority, Refunding RB, Fairfax Redevelopment & Housing, 5.00%, 10/01/39 | | | 1,500 | | | | 1,562,010 | |
Dulles Town Center Community Development Authority, Refunding, Special Assessment, Dulles Town Center Project, 4.25%, 03/01/26 | | | 500 | | | | 499,665 | |
Lower Magnolia Green Community Development Authority, Special Assessment Bonds, 5.00%, 03/01/35(a) | | | 245 | | | | 249,194 | |
Mosaic District Community Development Authority, Special Assessment, Series A, 6.88%, 03/01/36 | | | 250 | | | | 270,405 | |
State of Virginia Public School Authority, RB, Fluvanna County School Financing, 6.50%, 12/01/18(b) | | | 360 | | | | 373,838 | |
| | | | | | | | |
| | | | | | | 6,182,743 | |
| Education — 22.0% | |
City of Norfolk Virginia, GO, Refunding(b): | | | | | | | | |
5.00%, 08/01/23 | | | 465 | | | | 533,917 | |
5.00%, 08/01/23 | | | 35 | | | | 40,284 | |
County of Montgomery Virginia EDA, Refunding RB, Virginia Tech Foundation, Series A, 5.00%, 06/01/20(b) | | | 355 | | | | 381,856 | |
Virginia College Building Authority, RB, Marymount University Project, Series B, 5.00%, 07/01/45(a) | | | 100 | | | | 104,997 | |
Virginia College Building Authority, Refunding RB: | | | | | | | | |
Liberty University Projects, 5.00%, 03/01/41 | | | 1,000 | | | | 1,060,470 | |
Marymount University Project, Series A, 5.00%, 07/01/45(a) | | | 400 | | | | 419,976 | |
Washington & Lee University Project (NPFGC), 5.25%, 01/01/26 | | | 500 | | | | 568,580 | |
Washington & Lee University Project (NPFGC), 5.25%, 01/01/31 | | | 1,000 | | | | 1,193,970 | |
Virginia Small Business Financing Authority, RB, Roanoke College, 5.75%, 04/01/41 | | | 500 | | | | 533,995 | |
Virginia Small Business Financing Authority, Refunding RB, 4.00%, 10/01/38 | | | 500 | | | | 513,090 | |
| | | | | | | | |
| | | | | | | 5,351,135 | |
| Health — 31.9% | |
City of Danville Virginia IDA, Refunding RB, Danville Regional Medical Center (AMBAC), 5.25%, 10/01/28(c) | | | 1,000 | | | | 1,131,730 | |
County of Fairfax Virginia EDA, Refunding RB, Vinson Hall LLC, Series A, 5.00%, 12/01/42 | | | 500 | | | | 521,760 | |
County of Fairfax Virginia IDA, RB, Series A, 5.00%, 05/15/44 | | | 1,000 | | | | 1,109,640 | |
County of Hanover Virginia EDA, Refunding RB, Covenant Woods, Series A, 5.00%, 07/01/42 | | | 500 | | | | 515,860 | |
County of Henrico Virginia EDA, Refunding RB, United Methodist Homes, 4.25%, 06/01/26 | | | 145 | | | | 149,830 | |
Lexington Industrial Development Authority, RB, Series A, 5.00%, 01/01/42 | | | 690 | | | | 744,089 | |
| | | | | | | | |
| Security | | Par
(000) | | | Value | |
| Health (continued) | |
Roanoke Virginia EDA, Refunding RB: | | | | | | | | |
Carilion Clinic Obligation Group, 5.00%, 07/01/30 | | $ | 795 | | | $ | 861,502 | |
Carilion Health System (AGM), 5.00%, 07/01/20(b) | | | 5 | | | | 5,385 | |
Carilion Health System, Series B (AGM), 5.00%, 07/01/38 | | | 495 | | | | 518,607 | |
Winchester Virginia EDA, Refunding RB, Valley Health System Obligation: | | | | | | | | |
5.00%, 01/01/44 | | | 1,000 | | | | 1,089,900 | |
Series A, 5.00%, 01/01/44 | | | 400 | | | | 432,912 | |
Winchester Virginia IDA, RB, Valley Health System Obligation, Series E, 5.63%, 01/01/19(b) | | | 650 | | | | 671,976 | |
| | | | | | | | |
| | | | | | | 7,753,191 | |
| Housing — 8.7% | |
Virginia HDA, RB, M/F Housing, Rental Housing: | | | | | | | | |
Series A, 5.25%, 05/01/41 | | | 750 | | | | 797,820 | |
Series B, 5.63%, 06/01/39 | | | 1,000 | | | | 1,043,640 | |
Series F, 5.25%, 10/01/38 | | | 250 | | | | 278,438 | |
| | | | | | | | |
| | | | | | | 2,119,898 | |
| State — 7.7% | |
Virginia College Building Authority, RB, Public Higher Education Financing Program, Series A, 5.00%, 09/01/18(b) | | | 1,000 | | | | 1,018,930 | |
Virginia Public School Authority, RB, School Financing, 1997 Resolution, Series B(b): | | | | | | | | |
5.25%, 08/01/18 | | | 400 | | | | 406,712 | |
4.00%, 08/01/21 | | | 405 | | | | 434,508 | |
| | | | | | | | |
| | | | | | | 1,860,150 | |
| Tobacco — 3.2% | |
Tobacco Settlement Financing Corp., Refunding RB, Senior: | | | | | | | | |
Convertible, Series B2, 5.20%, 06/01/46 | | | 500 | | | | 492,310 | |
Series B-1, 5.00%, 06/01/47 | | | 300 | | | | 291,180 | |
| | | | | | | | |
| | | | | | | 783,490 | |
| Transportation — 19.0% | |
Capital Region Airport Commission, Refunding RB, Series A, 4.00%, 07/01/38 | | | 300 | | | | 312,069 | |
Hampton Roads Transportation Accountability Commission, RB, Series A, 5.00%, 07/01/42 | | | 100 | | | | 114,893 | |
Richmond Metropolitan Authority, Refunding RB, (NPFGC), 5.25%, 07/15/22 | | | 500 | | | | 532,550 | |
Virginia Port Authority, RB, 5.00%, 07/01/36 | | | 500 | | | | 535,040 | |
Virginia Resources Authority, RB, Series B: | | | | | | | | |
5.00%, 11/01/18(b) | | | 1,155 | | | | 1,183,367 | |
5.00%, 11/01/33 | | | 740 | | | | 757,279 | |
Virginia Small Business Financing Authority, RB, AMT: | | | | | | | | |
Senior Lien, Elizabeth River Crossings OpCo LLC Project, 6.00%, 01/01/37 | | | 820 | | | | 921,647 | |
Transform 66 P3 Project, 5.00%, 12/31/52 | | | 250 | | | | 268,485 | |
| | | | | | | | |
| | | | | | | 4,625,330 | |
| Utilities — 0.5% | |
Virginia Resources Authority, RB, 5.00%, 11/01/18(b) | | | 105 | | | | 107,579 | |
| | | | | | | | |
| District of Columbia — 9.9% | |
Metropolitan Washington Airports Authority, Refunding RB: | | | | | | | | |
Dulles Toll Road, 1st Senior Lien, Series A, 5.00%, 10/01/39 | | | 290 | | | | 302,772 | |
Dulles Toll Road, 1st Senior Lien, Series A, 5.25%, 10/01/44 | | | 460 | | | | 481,597 | |
Series B, 5.00%, 10/01/29 | | | 1,000 | | | | 1,051,720 | |
Washington Metropolitan Area Transit Authority, RB, Series B, 5.00%, 07/01/42 | | | 500 | | | | 570,780 | |
| | | | | | | | |
| | | | | | | 2,406,869 | |
| | | | |
| SCHEDULES OF INVESTMENTS | | | 59 | |
| | |
Schedule of Investments (unaudited) (continued) February 28, 2018 | | BlackRock Virginia Municipal Bond Trust (BHV) (Percentages shown are based on Net Assets) |
| | | | | | | | |
| Security | | Par
(000) | | | Value | |
| Puerto Rico — 1.3% | |
Children’s Trust Fund, Refunding RB, Tobacco Settlement Asset-Backed Bonds, 5.63%, 05/15/43 | | $ | 335 | | | $ | 312,176 | |
| | | | | | | | |
| |
Total Municipal Bonds — 131.7%
(Cost — $30,312,037) | | | | 32,003,856 | |
| | | | | | | | |
Municipal Bonds Transferred to Tender Option Bond Trusts(d) — 31.9% | |
|
| Virginia — 31.9% | |
| Education — 12.5% | |
University of Virginia, Refunding RB, General, 5.00%, 06/01/18(b) | | | 2,999 | | | | 3,027,024 | |
| | | | | | | | |
| Health — 13.7% | |
County of Fairfax Virginia EDA, RB, Metrorail Parking System Project, 5.00%, 04/01/47(e) | | | 2,000 | | | | 2,272,920 | |
Virginia Small Business Financing Authority, Refunding RB, Sentara Healthcare, 5.00%, 11/01/40 | | | 1,000 | | | | 1,056,285 | |
| | | | | | | | |
| | | | | | | 3,329,205 | |
| Transportation — 5.7% | |
Virginia Commonwealth Transportation Board, RB, Capital Projects, 5.00%, 05/15/21(b) | | | 1,261 | | | | 1,388,696 | |
| | | | | | | | |
| |
Total Municipal Bonds Transferred to Tender Option Bond
Trusts — 31.9%
(Cost — $7,579,811) | | | | 7,744,925 | |
| | | | | | | | |
Total Long-Term Investments — 163.6%
(Cost — $37,891,848) | | | | 39,748,781 | |
| | | | | | | | |
| | | | | | | | |
| Security | | Shares | | | Value | |
Short-Term Securities — 0.2% | |
BlackRock Liquidity Funds, MuniCash, Institutional Class, 0.94%(f)(g) | | | 59,255 | | | $ | 59,261 | |
| | | | | | | | |
| |
Total Short-Term Securities — 0.2%
(Cost — $59,261) | | | | 59,261 | |
| | | | | | | | |
| |
Total Investments — 163.8%
(Cost — $37,951,109) | | | | 39,808,042 | |
Other Assets Less Liabilities — 1.6% | | | | 413,610 | |
Liability for TOB Trust Certificates, Including Interest Expense
and Fees Payable — (17.9)% | | | | (4,375,866 | ) |
VRDP Shares at Liquidation Value, Net of Deferred Offering
Costs — (47.5)% | | | | (11,537,219 | ) |
| | | | | | | | |
Net Assets Applicable to Common Shares — 100.0% | | | $ | 24,308,567 | |
| | | | | | | | |
| (a) | Security exempt from registration pursuant to Rule 144A under the Securities Act of 1933, as amended. These securities may be resold in transactions exempt from registration to qualified institutional investors. |
| (b) | U.S. Government securities, held in escrow, are used to pay interest on this security, as well as to retire the bond in full at the date indicated, typically at a premium to par. |
| (c) | Security is collateralized by municipal bonds or U.S. Treasury obligations. |
| (d) | Represent bonds transferred to a TOB Trust in exchange of cash and residual certificates received by the Trust. These bonds serve as collateral in a secured borrowing. See Note 4 of the Notes to Financial Statements for details. |
| (e) | All or a portion of security is subject to a recourse agreement. The aggregate maximum potential amount the Trust could ultimately be required to pay under the agreement, which expires on October 1, 2024, is $1,051,389. |
| (f) | Annualized 7-day yield as of period end. |
| (g) | During the period ended February 28, 2018, investments in issuers considered to be an affiliate of the Trust for purposes of Section 2(a)(3) of the Investment Company Act of 1940, as amended, were as follows: |
| | | | | | | | | | | | | | | | | | | | | | | | | | | | |
| Affiliated | | Shares
Held at
08/31/17 | | | Net
Activity | | | Shares
Held at
02/28/18 | | | Value at
02/28/18 | | | Income | | | Net Realized
Gain (Loss) (a) | | | Change in
Unrealized
Appreciation
(Depreciation) | |
BlackRock Liquidity Funds, MuniCash, Institutional Class | | | — | | | | 59,255 | | | | 59,255 | | | $ | 59,261 | | | $ | 385 | | | $ | 4 | | | $ | — | |
| | | | | | | | | | | | | | | | | | | | | | | | | | | | |
| | (a) | Includes net capital gain distributions, if applicable. | |
For Trust compliance purposes, the Trust’s sector classifications refer to one or more of the sector sub-classifications used by one or more widely recognized market indexes or rating group indexes, and/or as defined by the investment adviser. These definitions may not apply for purposes of this report, which may combine such sector sub-classifications for reporting ease.
Derivative Financial Instruments Outstanding as of Period End
Futures Contracts
| | | | | | | | | | | | | | | | |
| Description | | Number of
Contracts | | | Expiration
Date | | | Notional
Amount (000) | | | Value/
Unrealized
Appreciation
(Depreciation) | |
Short Contracts: | | | | | | | | | | | | | | | | |
10-Year U.S. Treasury Note | | | 4 | | | | 06/20/18 | | | $ | 480 | | | $ | 375 | |
Long U.S. Treasury Bond | | | 4 | | | | 06/20/18 | | | | 574 | | | | (2,382 | ) |
5-Year U.S. Treasury Note | | | 2 | | | | 06/29/18 | | | | 228 | | | | 410 | |
| | | | | | | | | | | | | | | | |
| | | | | | | | | | | | | | $ | (1,597 | ) |
| | | | | | | | | | | | | | | | |
| | |
| 60 | | 2018 BLACKROCK SEMI-ANNUAL REPORTTO SHAREHOLDERS |
| | |
Schedule of Investments (unaudited) (continued) February 28, 2018 | | BlackRock Virginia Municipal Bond Trust (BHV) |
Derivative Financial Instruments Categorized by Risk Exposure
As of period end, the fair values of derivative financial instruments located in the Statements of Assets and Liabilities were as follows:
| | | | | | | | | | | | | | | | | | | | | | | | | | | | |
| | | Commodity
Contracts | | | Credit
Contracts | | | Equity
Contracts | | | Foreign
Currency
Exchange
Contracts | | | Interest
Rate
Contracts | | | Other
Contracts | | | Total | |
Assets — Derivative Financial Instruments | | | | | | | | | | | | | | | | | | | | | | | | | | | | |
Futures contracts | | | | | | | | | | | | | | | | | | | | | | | | | | | | |
Net unrealized appreciation(a) | | $ | — | | | $ | — | | | $ | — | | | $ | — | | | $ | 785 | | | $ | — | | | $ | 785 | |
| | | | | | | | | | | | | | | | | | | | | | | | | | | | |
Liabilities — Derivative Financial Instruments | | | | | | | | | | | | | | | | | | | | | | | | | | | | |
Futures contracts | | | | | | | | | | | | | | | | | | | | | | | | | | | | |
Net unrealized depreciation(a) | | $ | — | | | $ | — | | | $ | — | | | $ | — | | | $ | 2,382 | | | $ | — | | | $ | 2,382 | |
| | | | | | | | | | | | | | | | | | | | | | | | | | | | |
| | (a) | Includes cumulative appreciation (depreciation) on futures contracts, if any, as reported in the Schedule of Investments. Only current day’s variation margin is reported within the Statements of Assets and Liabilities. | |
For the six months ended February 28, 2018, the effect of derivative financial instruments in the Statements of Operations was as follows:
| | | | | | | | | | | | | | | | | | | | | | | | | | | | |
| | | Commodity
Contracts | | | Credit
Contracts | | | Equity
Contracts | | | Foreign
Currency
Exchange
Contracts | | | Interest
Rate
Contracts | | | Other
Contracts | | | Total | |
Net Realized Gain (Loss) from: | | | | | | | | | | | | | | | | | | | | | | | | | | | | |
Futures contracts | | $ | — | | | $ | — | | | $ | — | | | $ | — | | | $ | 76,665 | | | $ | — | | | $ | 76,665 | |
| | | | | | | | | | | | | | | | | | | | | | | | | | | | |
Net Change in Unrealized Appreciation (Depreciation) on: | | | | | | | | | �� | | | | | | | | | | | | | | | | | | | |
Futures contracts | | $ | — | | | $ | — | | | $ | — | | | $ | — | | | $ | 4,595 | | | $ | — | | | $ | 4,595 | |
| | | | | | | | | | | | | | | | | | | | | | | | | | | | |
Average Quarterly Balances of Outstanding Derivative Financial Instruments
| | | | |
Futures contracts: | | | | |
Average notional value of contracts — short | | $ | 1,167,039 | |
For more information about the Trust’s investment risks regarding derivative financial instruments, refer to the Notes to Financial Statements.
Fair Value Hierarchy as of Period End
Various inputs are used in determining the fair value of investments and derivative financial instruments. For information about the Trust’s policy regarding valuation of investments and derivative financial instruments, refer to the Notes to Financial Statements.
The following tables summarize the Trust’s investments and derivative financial instruments categorized in the disclosure hierarchy:
| | | | | | | | | | | | | | | | |
| | | Level 1 | | | Level 2 | | | Level 3 | | | Total | |
Assets: | |
Investments: | |
Long-Term Investments(a) | | $ | — | | | $ | 39,748,781 | | | $ | — | | | $ | 39,748,781 | |
Short-Term Securities | | | 59,261 | | | | — | | | | — | | | | 59,261 | |
| | | | | | | | | | | | | | | | |
| | $ | 59,261 | | | $ | 39,748,781 | | | $ | — | | | $ | 39,808,042 | |
| | | | | | | | | | | | | | | | |
Derivative Financial Instruments(b) | |
Assets: | |
Interest rate contracts | | $ | 785 | | | $ | — | | | $ | — | | | $ | 785 | |
Liabilities: | |
Interest rate contracts | | | (2,382 | ) | | | — | | | | — | | | | (2,382 | ) |
| | | | | | | | | | | | | | | | |
| | $ | (1,597 | ) | | $ | — | | | $ | — | | | $ | (1,597 | ) |
| | | | | | | | | | | | | | | | |
| | (a) | See above Schedule of Investments for values in each sector. | |
| | (b) | Derivative financial instruments are futures contracts which are valued at the unrealized appreciation (depreciation) on the instrument. | |
| | | | |
| SCHEDULES OF INVESTMENTS | | | 61 | |
| | |
Schedule of Investments (unaudited) (continued) February 28, 2018 | | BlackRock Virginia Municipal Bond Trust (BHV) |
The Trust may hold assets and/or liabilities in which the fair value approximates the carrying amount for financial statement purposes. As of period end, such assets and/or liabilities are categorized within the disclosure hierarchy as follows:
| | | | | | | | | | | | | | | | |
| | | Level 1 | | | Level 2 | | | Level 3 | | | Total | |
Liabilities: | |
TOB Trust Certificates | | $ | — | | | $ | (4,360,368 | ) | | $ | — | | | $ | (4,360,368 | ) |
VRDP Shares at Liquidation Value | | | — | | | | (11,600,000 | ) | | | — | | | | (11,600,000 | ) |
| | | | | | | | | | | | | | | | |
| | $ | — | | | $ | (15,960,368 | ) | | $ | — | | | $ | (15,960,368 | ) |
| | | | | | | | | | | | | | | | |
During the six months ended February 28, 2018, there were no transfers between levels.
See notes to financial statements.
| | |
| 62 | | 2018 BLACKROCK SEMI-ANNUAL REPORTTO SHAREHOLDERS |
Statements of Assets and Liabilities (unaudited)
February 28, 2018
| | | | | | | | | | | | | | | | |
| | | BZM | | | MHE | | | MHN | | | BLJ | |
| | | | |
ASSETS | | | | | | | | | | | | | | | | |
Investments at value — unaffiliated(a) | | $ | 48,604,734 | | | $ | 50,883,885 | | | $ | 748,038,871 | | | $ | 59,925,117 | |
Investments at value — affiliated(b) | | | 234,013 | | | | 172,556 | | | | 6,712,620 | | | | 82,833 | |
Cash | | | 12,656 | | | | 13,313 | | | | 197,274 | | | | 12,234 | |
Cash pledged for futures contracts | | | 39,350 | | | | 42,050 | | | | 589,850 | | | | 34,900 | |
Receivables: | | | | | | | | | | | | | | | | |
Interest — unaffiliated | | | 495,028 | | | | 614,391 | | | | 8,371,171 | | | | 729,815 | |
Dividends — affiliated | | | 169 | | | | 123 | | | | 2,755 | | | | 76 | |
Investments sold | | | — | | | | 390,084 | | | | 1,530,356 | | | | — | |
Prepaid expenses | | | 13,307 | | | | 11,018 | | | | 14,134 | | | | 3,853 | |
| | | | | | | | | | | | | | | | |
Total assets | | | 49,399,257 | | | | 52,127,420 | | | | 765,457,031 | | | | 60,788,828 | |
| | | | | | | | | | | | | | | | |
| | | | |
ACCRUED LIABILITIES | | | | | | | | | | | | | | | | |
Payables: | | | | | | | | | | | | | | | | |
Income dividends — Common Shares | | | 98,648 | | | | 125,637 | | | | 1,572,167 | | | | 143,167 | |
Investment advisory fees | | | 22,714 | | | | 19,980 | | | | 292,249 | | | | 30,265 | |
Variation margin on futures contracts | | | 12,250 | | | | 13,125 | | | | 184,719 | | | | 10,313 | |
Trustees’ and Officer’s fees | | | 11,964 | | | | 710 | | | | 239,510 | | | | 11,156 | |
Interest expense and fees | | | 4,278 | | | | 8,017 | | | | 214,013 | | | | 20,413 | |
Investments purchased | | | — | | | | — | | | | 1,099,537 | | | | — | |
Offering costs payable | | | — | | | | — | | | | — | | | | 15,315 | |
Other accrued expenses | | | 39,872 | | | | 44,561 | | | | 178,928 | | | | 51,724 | |
| | | | | | | | | | | | | | | | |
Total accrued liabilities | | | 189,726 | | | | 212,030 | | | | 3,781,123 | | | | 282,353 | |
| | | | | | | | | | | | | | | | |
| | | | |
OTHER LIABILITIES | | | | | | | | | | | | | | | | |
TOB Trust Certificates | | | 2,134,375 | | | | 1,635,858 | | | | 70,007,186 | | | | 6,015,711 | |
Loan for TOB Trust Certificates | | | — | | | | — | | | | — | | | | 99,820 | |
VRDP Shares, at liquidation value of $100,000 per share, net of deferred offering costs(c)(d) | | | 15,935,834 | | | | 18,426,095 | | | | 243,239,500 | | | | 18,627,971 | |
| | | | | | | | | | | | | | | | |
Total other liabilities | | | 18,070,209 | | | | 20,061,953 | | | | 313,246,686 | | | | 24,743,502 | |
| | | | | | | | | | | | | | | | |
Total liabilities | | | 18,259,935 | | | | 20,273,983 | | | | 317,027,809 | | | | 25,025,855 | |
| | | | | | | | | | | | | | | | |
| | | | |
NET ASSETS APPLICABLE TO COMMON SHAREHOLDERS | | $ | 31,139,322 | | | $ | 31,853,437 | | | $ | 448,429,222 | | | $ | 35,762,973 | |
| | | | | | | | | | | | | | | | |
| | | | |
NET ASSETS APPLICABLE TO COMMON SHAREHOLDERS CONSIST OF | | | | | | | | | | | | | | | | |
Paid-in capital(e)(f)(g) | | $ | 29,493,729 | | | $ | 29,330,486 | | | $ | 437,198,641 | | | $ | 33,004,414 | |
Undistributed net investment income | | | 253,817 | | | | 122,575 | | | | 1,497,147 | | | | 260,312 | |
Accumulated net realized loss | | | 151,009 | | | | (273,763 | ) | | | (19,598,166 | ) | | | (448,978 | ) |
Net unrealized appreciation (depreciation) | | | 1,240,767 | | | | 2,674,139 | | | | 29,331,600 | | | | 2,947,225 | |
| | | | | | | | | | | | | | | | |
Net Assets Applicable to Common Shareholders | | $ | 31,139,322 | | | $ | 31,853,437 | | | $ | 448,429,222 | | | $ | 35,762,973 | |
| | | | | | | | | | | | | | | | |
Net asset value per Common Share | | $ | 14.96 | | | $ | 13.44 | | | $ | 14.40 | | | $ | 15.36 | |
| | | | | | | | | | | | | | | | |
Shares authorized | | | | | | | | | | | | | | | | |
(a) Investments at cost — unaffiliated | | $ | 47,359,020 | | | $ | 48,204,112 | | | $ | 718,638,774 | | | $ | 56,975,146 | |
(b) Investments at cost — affiliated | | $ | 233,993 | | | $ | 172,547 | | | $ | 6,712,473 | | | $ | 82,833 | |
(c) Preferred Shares outstanding: | | | | | | | | | | | | | | | | |
Par value $0.001 per share | | | 160 | | | | — | | | | — | | | | 187 | |
Par value $0.01 per share | | | — | | | | 185 | | | | — | | | | — | |
Par value $0.10 per share | | | — | | | | — | | | | 2,436 | | | | — | |
(d) Preferred Shares authorized | | | unlimited | | | | unlimited | | | | 14,956 | | | | unlimited | |
(e) Par Value per Common Shares | | $ | 0.001 | | | $ | 0.010 | | | $ | 0.100 | | | $ | 0.001 | |
(f) Common Shares outstanding | | | 2,081,183 | | | | 2,370,510 | | | | 31,132,023 | | | | 2,327,921 | |
(g) Common Shares authorized | | | unlimited | | | | unlimited | | | | 199,985,044 | | | | unlimited | |
See notes to financial statements.
Statements of Assets and Liabilities (unaudited) (continued)
February 28, 2018
| | | | | | | | | | | | | | | | |
| | | BQH | | | BSE | | | BFY | | | BHV | |
| | | | |
ASSETS | | | | | | | | | | | | | | | | |
Investments at value — unaffiliated(a) | | $ | 70,741,596 | | | $ | 153,039,624 | | | $ | 125,425,441 | | | $ | 39,748,781 | |
Investments at value — affiliated(b) | | | 354,314 | | | | 866,562 | | | | 669,872 | | | | 59,261 | |
Cash | | | 19,711 | | | | 41,086 | | | | 34,664 | | | | 5,109 | |
Cash pledged for futures contracts | | | 61,350 | | | | 119,300 | | | | 103,400 | | | | 15,950 | |
Receivables: | | | | | | | | | | | | | | | | |
Interest — unaffiliated | | | 775,268 | | | | 1,756,168 | | | | 1,388,313 | | | | 551,651 | |
Dividends — affiliated | | | 349 | | | | 493 | | | | 507 | | | | 39 | |
Investments sold | | | 151,610 | | | | 100,553 | | | | 384,814 | | | | — | |
Prepaid expenses | | | 34,884 | | | | 37,603 | | | | 46,983 | | | | 3,225 | |
| | | | | | | | | | | | | | | | |
Total assets | | | 72,139,082 | | | | 155,961,389 | | | | 128,053,994 | | | | 40,384,016 | |
| | | | | | | | | | | | | | | | |
| | | | |
ACCRUED LIABILITIES | | | | | | | | | | | | | | | | |
Payables: | | | | | | | | | | | | | | | | |
Income dividends — Common Shares | | | 165,206 | | | | 303,164 | | | | 305,300 | | | | 100,944 | |
Investment advisory fees | | | 30,413 | | | | 65,751 | | | | 53,975 | | | | 16,088 | |
Variation margin on futures contracts | | | 19,344 | | | | 36,219 | | | | 32,156 | | | | 4,688 | |
Trustees’ and Officer’s fees | | | 12,021 | | | | 11,489 | | | | 13,734 | | | | 8,935 | |
Interest expense and fees | | | 21,027 | | | | 61,129 | | | | 23,410 | | | | 15,498 | |
Other accrued expenses | | | 57,646 | | | | 75,384 | | | | 65,813 | | | | 31,709 | |
| | | | | | | | | | | | | | | | |
Total accrued liabilities | | | 305,657 | | | | 553,136 | | | | 494,388 | | | | 177,862 | |
| | | | | | | | | | | | | | | | |
| | | | |
OTHER LIABILITIES | | | | | | | | | | | | | | | | |
TOB Trust Certificates | | | 6,521,464 | | | | 20,604,151 | | | | 7,816,903 | | | | 4,360,368 | |
VRDP Shares, at liquidation value of $100,000 per share, net of deferred offering costs(c)(d) | | | 21,995,460 | | | | 40,386,989 | | | | 44,292,548 | | | | 11,537,219 | |
| | | | | | | | | | | | | | | | |
Total other liabilities | | | 28,516,924 | | | | 60,991,140 | | | | 52,109,451 | | | | 15,897,587 | |
| | | | | | | | | | | | | | | | |
Total liabilities | | | 28,822,581 | | | | 61,544,276 | | | | 52,603,839 | | | | 16,075,449 | |
| | | | | | | | | | | | | | | | |
| | | | |
NET ASSETS APPLICABLE TO COMMON SHAREHOLDERS | | $ | 43,316,501 | | | $ | 94,417,113 | | | $ | 75,450,155 | | | $ | 24,308,567 | |
| | | | | | | | | | | | | | | | |
| | | | |
NET ASSETS APPLICABLE TO COMMON SHAREHOLDERS CONSIST OF | | | | | | | | | | | | | | | | |
Paid-in capital(e)(f)(g) | | $ | 39,699,290 | | | $ | 90,805,577 | | | $ | 70,249,553 | | | $ | 22,869,818 | |
Undistributed net investment income | | | 294,392 | | | | 155,014 | | | | 539,706 | | | | 181,769 | |
Accumulated net realized loss | | | (975,931 | ) | | | (3,118,199 | ) | | | (2,003,765 | ) | | | (598,356 | ) |
Net unrealized appreciation (depreciation) | | | 4,298,750 | | | | 6,574,721 | | | | 6,664,661 | | | | 1,855,336 | |
| | | | | | | | | | | | | | | | |
Net Assets Applicable to Common Shareholders | | $ | 43,316,501 | | | $ | 94,417,113 | | | $ | 75,450,155 | | | $ | 24,308,567 | |
| | | | | | | | | | | | | | | | |
Net asset value per Common Share | | $ | 15.47 | | | $ | 14.48 | | | $ | 15.08 | | | $ | 15.17 | |
| | | | | | | | | | | | | | | | |
(a) Investments at cost — unaffiliated | | $ | 66,434,876 | | | $ | 146,453,986 | | | $ | 118,749,284 | | | $ | 37,891,848 | |
(b) Investments at cost — affiliated | | $ | 354,281 | | | $ | 866,515 | | | $ | 669,813 | | | $ | 59,261 | |
(c) Preferred Shares outstanding: | | | | | | | | | | | | | | | | |
Par value $0.001 per share | | | 221 | | | | 405 | | | | 444 | | | | 116 | |
(d) Preferred Shares authorized | | | unlimited | | | | unlimited | | | | unlimited | | | | unlimited | |
(e) Par Value per Common Shares | | $ | 0.001 | | | $ | 0.001 | | | $ | 0.001 | | | $ | 0.001 | |
(f) Common Shares outstanding | | | 2,800,105 | | | | 6,519,660 | | | | 5,004,922 | | | | 1,602,282 | |
(g) Common Shares authorized | | | unlimited | | | | unlimited | | | | unlimited | | | | unlimited | |
See notes to financial statements.
| | |
| 64 | | 2018 BLACKROCK SEMI-ANNUAL REPORTTO SHAREHOLDERS |
Statements of Operations (unaudited)
Six Months Ended February 28, 2018
| | | | | | | | | | | | | | | | |
| | | BZM | | | MHE | | | . MHN | | | BLJ | |
| | | | |
INVESTMENT INCOME | | | | | | | | | | | | | | | | |
Interest — unaffiliated | | $ | 976,690 | | | $ | 1,060,852 | | | $ | 14,832,534 | | | $ | 1,348,121 | |
Dividends — affiliated | | | 587 | | | | 948 | | | | 21,656 | | | | 161 | |
| | | | | | | | | | | | | | | | |
Total investment income | | | 977,277 | | | | 1,061,800 | | | | 14,854,190 | | | | 1,348,282 | |
| | | | | | | | | | | | | | | | |
| | | | |
EXPENSES | | | | | | | | | | | | | | | | |
Investment advisory | | | 160,560 | | | | 130,590 | | | | 2,109,412 | | | | 197,889 | |
Liquidity fees | | | 57,463 | | | | — | | | | 12,303 | | | | — | |
Professional | | | 21,212 | | | | 19,540 | | | | 58,126 | | | | 22,809 | |
Transfer agent | | | 7,578 | | | | 7,987 | | | | 16,270 | | | | 7,805 | |
Remarketing fees on Preferred Shares | | | 5,631 | | | | — | | | | 12,080 | | | | — | |
Accounting services | | | 5,109 | | | | 5,390 | | | | 50,657 | | | | 5,791 | |
Printing | | | 2,703 | | | | 2,875 | | | | 5,792 | | | | 2,893 | |
Custodian | | | 1,780 | | | | 1,584 | | | | 16,971 | | | | 1,656 | |
Trustees and Officer | | | 1,583 | | | | 1,642 | | | | 23,401 | | | | 1,811 | |
Registration | | | 333 | | | | 379 | | | | 4,112 | | | | 372 | |
Reorganization costs | | | — | | | | — | | | | — | | | | 109,738 | |
Rating agency | | | 14,476 | | | | 14,480 | | | | 20,358 | | | | 14,480 | |
Miscellaneous | | | 6,107 | | | | 4,684 | | | | 17,978 | | | | 7,648 | |
| | | | | | | | | | | | | | | | |
Total expenses excluding interest expense, fees and amortization of offering costs | | | 284,535 | | | | 189,151 | | | | 2,347,460 | | | | 372,892 | |
Interest expense, fees and amortization of offering costs(a) | | | 118,588 | | | | 189,171 | | | | 2,925,176 | | | | 231,480 | |
| | | | | | | | | | | | | | | | |
Total expenses | | | 403,123 | | | | 378,322 | | | | 5,272,636 | | | | 604,372 | |
Less fees waived and/or reimbursed by the Manager | | | (12,405 | ) | | | (111 | ) | | | (182,348 | ) | | | (22 | ) |
| | | | | | | | | | | | | | | | |
Total expenses after fees waived and/or reimbursed | | | 390,718 | | | | 378,211 | | | | 5,090,288 | | | | 604,350 | |
| | | | | | | | | | | | | | | | |
Net investment income | | | 586,559 | | | | 683,589 | | | | 9,763,902 | | | | 743,932 | |
| | | | | | | | | | | | | | | | |
| | | | |
REALIZED AND UNREALIZED GAIN (LOSS) | | | | | | | | | | | | | | | | |
Net realized gain (loss) from: | | | | | | | | | | | | | | | | |
Investments — unaffiliated | | | 56,899 | | | | (22,107 | ) | | | 584,350 | | | | (6,052 | ) |
Investments — affiliated | | | (31 | ) | | | (182 | ) | | | (2,033 | ) | | | (5 | ) |
Futures contracts | | | 196,398 | | | | 196,782 | | | | 2,789,691 | | | | 231,953 | |
Capital gain distributions from investment companies — affiliated | | | 33 | | | | 95 | | | | 1,870 | | | | — | |
| | | | | | | | | | | | | | | | |
| | | 253,299 | | | | 174,588 | | | | 3,373,878 | | | | 225,896 | |
| | | | | | | | | | | | | | | | |
Net change in unrealized appreciation (depreciation) on: | | | | | | | | | | | | | | | | |
Investments — unaffiliated | | | (925,716 | ) | | | (1,391,120 | ) | | | (19,519,861 | ) | | | (1,177,942 | ) |
Investments — affiliated | | | 20 | | | | 48 | | | | 197 | | | | — | |
Futures contracts | | | 7,386 | | | | 6,826 | | | | 165,663 | | | | 12,524 | |
| | | | | | | | | | | | | | | | |
| | | (918,310 | ) | | | (1,384,246 | ) | | | (19,354,001 | ) | | | (1,165,418 | ) |
| | | | | | | | | | | | | | | | |
Net realized and unrealized loss | | | (665,011 | ) | | | (1,209,658 | ) | | | (15,980,123 | ) | | | (939,522 | ) |
| | | | | | | | | | | | | | | | |
NET DECREASE IN NET ASSETS APPLICABLE TO COMMON SHAREHOLDERS RESULTING FROM OPERATIONS | | $ | (78,452 | ) | | $ | (526,069 | ) | | $ | (6,216,221 | ) | | $ | (195,590 | ) |
| | | | | | | | | | | | | | | | |
| (a) | Related to TOB Trusts and/or VRDP Shares. |
See notes to financial statements.
Statements of Operations (unaudited) (continued)
Six Months Ended February 28, 2018
| | | | | | | | | | | | | | | | |
| | | BQH | | | BSE | | | BFY | | | BHV | |
| | | | |
INVESTMENT INCOME | | | | | | | | | | | | | | | | |
Interest — unaffiliated | | $ | 1,412,167 | | | $ | 2,960,204 | | | $ | 2,579,330 | | | $ | $885,227 | |
Dividends — affiliated | | | 2,507 | | | | 4,534 | | | | 4,029 | | | | 385 | |
| | | | | | | | | | | | | | | | |
Total investment income | | | 1,414,674 | | | | 2,964,738 | | | | 2,583,359 | | | | 885,612 | |
| | | | | | | | | | | | | | | | |
| | | | |
EXPENSES | | | | | | | | | | | | | | | | |
Investment advisory | | | 235,876 | | | | 430,816 | | | | 353,912 | | | | 131,437 | |
Liquidity fees | | | — | | | | — | | | | — | | | | 42,062 | |
Professional | | | 22,975 | | | | 27,496 | | | | 25,306 | | | | 16,076 | |
Transfer agent | | | 7,767 | | | | 9,414 | | | | 8,363 | | | | 7,456 | |
Remarketing fees on Preferred Shares | | | — | | | | — | | | | — | | | | 4,083 | |
Accounting services | | | 6,852 | | | | 14,282 | | | | 8,656 | | | | 1,840 | |
Printing | | | 3,036 | | | | 3,394 | | | | 3,228 | | | | 2,724 | |
Custodian | | | 2,360 | | | | 4,138 | | | | 3,797 | | | | 1,407 | |
Trustees and Officer | | | 2,286 | | | | 4,904 | | | | 3,928 | | | | 1,265 | |
Registration | | | 3,222 | | | | 3,222 | | | | 799 | | | | 256 | |
Rating agency | | | 20,129 | | | | 20,147 | | | | 20,151 | | | | 14,472 | |
Miscellaneous | | | 9,798 | | | | 10,710 | | | | 10,655 | | | | 5,871 | |
| | | | | | | | | | | | | | | | |
Total expenses excluding interest expense, fees and amortization of offering costs | | | 314,301 | | | | 528,523 | | | | 438,795 | | | | 228,949 | |
Interest expense, fees and amortization of offering costs(a) | | | 271,282 | | | | 568,100 | | | | 496,343 | | | | 107,543 | |
| | | | | | | | | | | | | | | | |
Total expenses | | | 585,583 | | | | 1,096,623 | | | | 935,138 | | | | 336,492 | |
Less fees waived and/or reimbursed by the Manager | | | (36,537 | ) | | | (497 | ) | | | (421 | ) | | | (26,332 | ) |
| | | | | | | | | | | | | | | | |
Total expenses after fees waived and/or reimbursed | | | 549,046 | | | | 1,096,126 | | | | 934,717 | | | | 310,160 | |
| | | | | | | | | | | | | | | | |
Net investment income | | | 865,628 | | | | 1,868,612 | | | | 1,648,642 | | | | 575,452 | |
| | | | | | | | | | | | | | | | |
| | | | |
REALIZED AND UNREALIZED GAIN (LOSS) | | | | | | | | | | | | | | | | |
Net realized gain (loss) from: | | | | | | | | | | | | | | | | |
Investments — unaffiliated | | | 58,822 | | | | 43,746 | | | | 102,311 | | | | 175,894 | |
Investments — affiliated | | | (264 | ) | | | (321 | ) | | | (321 | ) | | | — | |
Futures contracts | | | 273,365 | | | | 573,767 | | | | 480,542 | | | | 76,665 | |
Capital gain distributions from investment companies — affiliated | | | 229 | | | | 312 | | | | 297 | | | | 4 | |
| | | | | | | | | | | | | | | | |
| | | 332,152 | | | | 617,504 | | | | 582,829 | | | | 252,563 | |
| | | | | | | | | | | | | | | | |
Net change in unrealized appreciation (depreciation) on: | | | | | | | | | | | | | | | | |
Investments — unaffiliated | | | (2,018,879 | ) | | | (4,257,398 | ) | | | (3,623,272 | ) | | | (1,124,120 | ) |
Investments — affiliated | | | 33 | | | | 97 | | | | 59 | | | | — | |
Futures contracts | | | 15,615 | | | | 39,067 | | | | 28,442 | | | | 4,595 | |
| | | | | | | | | | | | | | | | |
| | | (2,003,231 | ) | | | (4,218,234 | ) | | | (3,594,771 | ) | | | (1,119,525 | ) |
| | | | | | | | | | | | | | | | |
Net realized and unrealized loss | | | (1,671,079 | ) | | | (3,600,730 | ) | | | (3,011,942 | ) | | | (866,962 | ) |
| | | | | | | | | | | | | | | | |
NET DECREASE IN NET ASSETS APPLICABLE TO COMMON SHAREHOLDERS RESULTING FROM OPERATIONS | | $ | (805,451 | ) | | $ | (1,732,118 | ) | | $ | (1,363,300 | ) | | $ | (291,510 | ) |
| | | | | | | | | | | | | | | | |
| (a) | Related to TOB Trusts and/or VRDP Shares. |
See notes to financial statements.
| | |
| 66 | | 2018 BLACKROCK SEMI-ANNUAL REPORTTO SHAREHOLDERS |
Statements of Changes in Net Assets
| | | | | | | | | | | | | | | | | | | | |
| | | BZM | | | | | | MHE | |
| | | Six Months Ended
02/28/18
(unaudited) | | | Year Ended
08/31/17 | | | | | | Six Months Ended
02/28/18
(unaudited) | | | Year Ended
08/31/17 | |
| | | | | |
INCREASE (DECREASE) IN NET ASSETS APPLICABLE TO COMMON SHAREHOLDERS | | | | | | | | | | | | | | | | | | | | |
| | | | | |
OPERATIONS | | | | | | | | | | | | | | | | | | | | |
Net investment income | | $ | 586,559 | | | $ | 1,220,727 | | | | | | | $ | 683,589 | | | $ | 1,458,297 | |
Net realized gain (loss) | | | 253,299 | | | | 94,503 | | | | | | | | 174,588 | | | | (15,349 | ) |
Net change in unrealized appreciation (depreciation) | | | (918,310 | ) | | | (1,470,250 | ) | | | | | | | (1,384,246 | ) | | | (1,620,354 | ) |
| | | | | | | | | | | | | | | | | | | | |
Net decrease in net assets applicable to Common Shareholders resulting from operations | | | (78,452 | ) | | | (155,020 | ) | | | | | | | (526,069 | ) | | | (177,406 | ) |
| | | | | | | | | | | | | | | | | | | | |
| | | | | |
DISTRIBUTIONS TO COMMON SHAREHOLDERS(a) | | | | | | | | | | | | | | | | | | | | |
From net investment income | | | (592,442 | ) | | | (1,183,544 | ) | | | | | | | (753,656 | ) | | | (1,506,359 | ) |
From net realized gain | | | (83,044 | ) | | | — | | | | | | | | — | | | | — | |
| | | | | | | | | | | | | | | | | | | | |
Decrease in net assets resulting from distributions to shareholders | | | (675,486 | ) | | | (1,183,544 | ) | | | | | | | (753,656 | ) | | | (1,506,359 | ) |
| | | | | | | | | | | | | | | | | | | | |
| | | | | |
CAPITAL SHARE TRANSACTIONS | | | | | | | | | | | | | | | | | | | | |
Reinvestment of common distributions | | | — | | | | 30,246 | | | | | | | | 17,798 | | | | 26,673 | |
| | | | | | | | | | | | | | | | | | | | |
| | | | | |
NET ASSETS APPLICABLE TO COMMON SHAREHOLDERS | | | | | | | | | | | | | | | | | | | | |
Total decrease in net assets applicable to Common Shareholders | | | (753,938 | ) | | | (1,308,318 | ) | | | | | | | (1,261,927 | ) | | | (1,657,092 | ) |
Beginning of period | | | 31,893,260 | | | | 33,201,578 | | | | | | | | 33,115,364 | | | | 34,772,456 | |
| | | | | | | | | | | | | | | | | | | | |
End of period | | $ | 31,139,322 | | | $ | 31,893,260 | | | | | | | $ | 31,853,437 | | | $ | 33,115,364 | |
| | | | | | | | | | | | | | | | | | | | |
Undistributed net investment income, end of period | | $ | 253,817 | | | $ | 259,700 | | | | | | | $ | 122,575 | | | $ | 192,642 | |
| | | | | | | | | | | | | | | | | | | | |
| (a) | Distributions for annual periods determined in accordance with U.S. federal income tax regulations. |
See notes to financial statements.
Statements of Changes in Net Assets (continued)
| | | | | | | | | | | | | | | | | | | | |
| | | MHN | | | | | | BLJ | |
| | | Six Months Ended
02/28/18
(unaudited) | | | Year Ended
08/31/17 | | | | | | Six Months Ended
02/28/18
(unaudited) | | | Year Ended
08/31/17 | |
| | | | | |
INCREASE (DECREASE) IN NET ASSETS APPLICABLE TO COMMON SHAREHOLDERS | | | | | | | | | | | | | | | | | | | | |
| | | | | |
OPERATIONS | | | | | | | | | | | | | | | | | | | | |
Net investment income | | $ | 9,763,902 | | | $ | 21,343,909 | | | | | | | $ | 743,932 | | | $ | 1,741,974 | |
Net realized gain | | | 3,373,878 | | | | 2,216,818 | | | | | | | | 225,896 | | | | 250,501 | |
Net change in unrealized appreciation (depreciation) | | | (19,354,001 | ) | | | (25,369,660 | ) | | | | | | | (1,165,418 | ) | | | (2,314,253 | ) |
| | | | | | | | | | | | | | | | | | | | |
Net decrease in net assets applicable to Common Shareholders resulting from operations | | | (6,216,221 | ) | | | (1,808,933 | ) | | | | | | | (195,590 | ) | | | (321,778 | ) |
| | | | | | | | | | | | | | | | | | | | |
| | | | | |
DISTRIBUTIONS TO COMMON SHAREHOLDERS(a) | | | | | | | | | | | | | | | | | | | | |
From net investment income | | | (10,172,201 | ) | | | (21,691,673 | ) | | | | | | | (859,003 | ) | | | (1,839,286 | ) |
| | | | | | | | | | | | | | | | | | | | |
| | | | | |
CAPITAL SHARE TRANSACTIONS | | | | | | | | | | | | | | | | | | | | |
Reinvestment of common distributions | | | — | | | | — | | | | | | | | — | | | | 20,051 | |
| | | | | | | | | | | | | | | | | | | | |
| | | | | |
NET ASSETS APPLICABLE TO COMMON SHAREHOLDERS | | | | | | | | | | | | | | | | | | | | |
Total decrease in net assets applicable to Common Shareholders | | | (16,388,422 | ) | | | (23,500,606 | ) | | | | | | | (1,054,593 | ) | | | (2,141,013 | ) |
Beginning of period | | | 464,817,644 | | | | 488,318,250 | | | | | | | | 36,817,566 | | | | 38,958,579 | |
| | | | | | | | | | | | | | | | | | | | |
End of period | | $ | 448,429,222 | | | $ | 464,817,644 | | | | | | | $ | 35,762,973 | | | $ | 36,817,566 | |
| | | | | | | | | | | | | | | | | | | | |
Undistributed net investment income, end of period | | $ | 1,497,147 | | | $ | 1,905,446 | | | | | | | $ | 260,312 | | | $ | 375,383 | |
| | | | | | | | | | | | | | | | | | | | |
| (a) | Distributions for annual periods determined in accordance with U.S. federal income tax regulations. |
See notes to financial statements.
| | |
| 68 | | 2018 BLACKROCK SEMI-ANNUAL REPORTTO SHAREHOLDERS |
Statements of Changes in Net Assets (continued)
| | | | | | | | | | | | | | | | | | | | |
| | | BQH | | | | | | BSE | |
| | | Six Months Ended
02/28/18 (unaudited) | | | Year Ended
08/31/17 | | | | | | Six Months Ended
02/28/18 (unaudited) | | | Year Ended
08/31/17 | |
| | | | | |
INCREASE (DECREASE) IN NET ASSETS APPLICABLE TO COMMON SHAREHOLDERS | | | | | | | | | | | | | | | | | | | | |
| | | | | |
OPERATIONS | | | | | | | | | | | | | | | | | | | | |
Net investment income | | $ | 865,628 | | | $ | 1,876,649 | | | | | | | $ | 1,868,612 | | | $ | 4,108,641 | |
Net realized gain | | | 332,152 | | | | 285,329 | | | | | | | | 617,504 | | | | 534,682 | |
Net change in unrealized appreciation (depreciation) | | | (2,003,231 | ) | | | (2,647,715 | ) | | | | | | | (4,218,234 | ) | | | (5,787,817 | ) |
| | | | | | | | | | | | | | | | | | | | |
Net decrease in net assets applicable to Common Shareholders resulting from operations | | | (805,451 | ) | | | (485,737 | ) | | | | | | | (1,732,118 | ) | | | (1,144,494 | ) |
| | | | | | | | | | | | | | | | | | | | |
| | | | | |
DISTRIBUTIONS TO COMMON SHAREHOLDERS(a) | | | | | | | | | | | | | | | | | | | | |
From net investment income | | | (991,237 | ) | | | (1,982,474 | ) | | | | | | | (1,926,560 | ) | | | (4,075,779 | ) |
| | | | | | | | | | | | | | | | | | | | |
| | | | | |
NET ASSETS APPLICABLE TO COMMON SHAREHOLDERS | | | | | | | | | | | | | | | | | | | | |
Total decrease in net assets applicable to Common Shareholders | | | (1,796,688 | ) | | | (2,468,211 | ) | | | | | | | (3,658,678 | ) | | | (5,220,273 | ) |
Beginning of period | | | 45,113,189 | | | | 47,581,400 | | | | | | | | 98,075,791 | | | | 103,296,064 | |
| | | | | | | | | | | | | | | | | | | | |
End of period | | $ | 43,316,501 | | | $ | 45,113,189 | | | | | | | $ | 94,417,113 | | | $ | 98,075,791 | |
| | | | | | | | | | | | | | | | | | | | |
Undistributed net investment income, end of period | | $ | 294,392 | | | $ | 420,001 | | | | | | | $ | 155,014 | | | $ | 212,962 | |
| | | | | | | | | | | | | | | | | | | | |
| (a) | Distributions for annual periods determined in accordance with U.S. federal income tax regulations. |
See notes to financial statements.
Statements of Changes in Net Assets (continued)
| | | | | | | | | | | | | | | | | | | | |
| | | BFY | | | | | | BHV | |
| | | Six Months Ended
02/28/18
(unaudited) | | | Year Ended
08/31/17 | | | | | | Six Months Ended
02/28/18
(unaudited) | | | Year Ended
08/31/17 | |
| | | | | |
INCREASE (DECREASE) IN NET ASSETS APPLICABLE TO COMMON SHAREHOLDERS | | | | | | | | | | | | | | | | | | | | |
| | | | | |
OPERATIONS | | | | | | | | | | | | | | | | | | | | |
Net investment income | | $ | 1,648,642 | | | $ | 3,573,037 | | | | | | | $ | 575,452 | | | $ | 1,246,653 | |
Net realized gain | | | 582,829 | | | | 204,867 | | | | | | | | 252,563 | | | | 88,117 | |
Net change in unrealized appreciation (depreciation) | | | (3,594,771 | ) | | | (4,281,706 | ) | | | | | | | (1,119,525 | ) | | | (1,426,601 | ) |
| | | | | | | | | | | | | | | | | | | | |
Net decrease in net assets applicable to Common Shareholders resulting from operations | | | (1,363,300 | ) | | | (503,802 | ) | | | | | | | (291,510 | ) | | | (91,831 | ) |
| | | | | | | | | | | | | | | | | | | | |
| | | | | |
DISTRIBUTIONS TO COMMON SHAREHOLDERS(a) | | | | | | | | | | | | | | | | | | | | |
From net investment income | | | (1,831,785 | ) | | | (3,813,493 | ) | | | | | | | (639,999 | ) | | | (1,209,228 | ) |
| | | | | | | | | | | | | | | | | | | | |
| | | | | |
CAPITAL SHARE TRANSACTIONS | | | | | | | | | | | | | | | | | | | | |
Reinvestment of common distributions | | | 4,281 | | | | 31,711 | | | | | | | | 24,550 | | | | 54,508 | |
| | | | | | | | | | | | | | | | | | | | |
| | | | | |
NET ASSETS APPLICABLE TO COMMON SHAREHOLDERS | | | | | | | | | | | | | | | | | | | | |
Total decrease in net assets applicable to Common Shareholders | | | (3,190,804 | ) | | | (4,285,584 | ) | | | | | | | (906,959 | ) | | | (1,246,551 | ) |
Beginning of period | | | 78,640,959 | | | | 82,926,543 | | | | | | | | 25,215,526 | | | | 26,462,077 | |
| | | | | | | | | | | | | | | | | | | | |
End of period | | $ | 75,450,155 | | | $ | 78,640,959 | | | | | | | $ | 24,308,567 | | | $ | 25,215,526 | |
| | | | | | | | | | | | | | | | | | | | |
Undistributed net investment income, end of period | | $ | 539,706 | | | $ | 722,849 | | | | | | | $ | 181,769 | | | $ | 246,316 | |
| | | | | | | | | | | | | | | | | | | | |
| (a) | Distributions for annual periods determined in accordance with U.S. federal income tax regulations. |
See notes to financial statements.
| | |
| 70 | | 2018 BLACKROCK SEMI-ANNUAL REPORTTO SHAREHOLDERS |
Statements of Cash Flows (unaudited)
Six Months Ended February 28, 2018
| | | | | | | | | | | | | | | | |
| | | BZM | | | MHE | | | MHN | | | BLJ | |
| | | | |
CASH PROVIDED BY (USED FOR) OPERATING ACTIVITIES | | | | | | | | | | | | | | | | |
Net decrease in net assets resulting from operations | | $ | (78,452 | ) | | $ | (526,069 | ) | | $ | (6,216,221 | ) | | $ | (195,590 | ) |
Adjustments to reconcile net decrease in net assets resulting from operations to net cash provided by operating activities: | | | | | | | | | | | | | | | | |
Proceeds from sales of long-term investments | | | 1,755,509 | | | | 3,015,914 | | | | 45,459,178 | | | | 2,678,835 | |
Purchases of long-term investments | | | (1,582,184 | ) | | | (4,183,226 | ) | | | (46,220,323 | ) | | | (1,469,910 | ) |
Net (purchases) sales of short-term securities | | | (234,025 | ) | | | 671,671 | | | | (3,454,460 | ) | | | (82,825 | ) |
Amortization of premium and accretion of discount on investments and other fees | | | 114,677 | | | | 127,765 | | | | 2,250,857 | | | | 27,643 | |
Net realized (gain) loss on investments | | | (56,868 | ) | | | 22,289 | | | | (582,317 | ) | | | 6,057 | |
Net unrealized loss on investments | | | 925,696 | | | | 1,391,072 | | | | 19,519,664 | | | | 1,177,942 | |
| (Increase) Decrease in Assets: | | | | | | | | | | | | |
Cash pledged for futures contracts | | | 16,000 | | | | 11,000 | | | | 179,000 | | | | 26,000 | |
Receivables: | | | | | | | | | | | | | | | | |
Interest — unaffiliated | | | (3,978 | ) | | | 21,912 | | | | (114,139 | ) | | | (11,470 | ) |
Dividends — affiliated | | | (168 | ) | | | 324 | | | | (725 | ) | | | (29 | ) |
Prepaid expenses | | | (720 | ) | | | 13,122 | | | | 15,330 | | | | 13,176 | |
| Increase (Decrease) in Liabilities: | | | | | | | | | | | | |
Payables: | | | | | | | | | | | | | | | | |
Investment advisory fees | | | (2,734 | ) | | | (2,435 | ) | | | (40,203 | ) | | | (3,457 | ) |
Interest expense and fees | | | 1,268 | | | | 1,680 | | | | 50,912 | | | | 6,929 | |
Trustees’ and Officer’s fees | | | 58 | | | | 66 | | | | (7,353 | ) | | | 46 | |
Variation margin on futures contracts | | | 3,750 | | | | 4,992 | | | | 66,851 | | | | 1,297 | |
Other accrued expenses | | | (15,673 | ) | | | (13,711 | ) | | | 2,916 | | | | (13,347 | ) |
| | | | | | | | | | | | | | | | |
Net cash provided by operating activities | | | 842,156 | | | | 556,366 | | | | 10,908,967 | | | | 2,161,297 | |
| | | | | | | | | | | | | | | | |
| | | | |
CASH PROVIDED BY (USED FOR) FINANCING ACTIVITIES | | | | | | | | | | | | | | | | |
Cash payments for offering costs | | | — | | | | — | | | | — | | | | 15,315 | |
Proceeds from TOB Trust Certificates | | | — | | | | 215,000 | | | | — | | | | 391,195 | |
Proceeds from Loan for TOB Trust Certificates | | | — | | | | — | | | | — | | | | 491,015 | |
Repayments of Loan for TOB Trust Certificates | | | — | | | | — | | | | — | | | | (391,195 | ) |
Repayments of TOB Trust Certificates | | | — | | | | — | | | | — | | | | (491,015 | ) |
Cash dividends paid to Common Shareholders | | | (675,486 | ) | | | (735,790 | ) | | | (10,405,691 | ) | | | (859,003 | ) |
Decrease in bank overdraft | | | (155,520 | ) | | | (23,917 | ) | | | (313,660 | ) | | | (1,306,844 | ) |
Amortization of deferred offering costs | | | 1,506 | | | | 1,654 | | | | 7,658 | | | | 1,469 | |
| | | | | | | | | | | | | | | | |
Net cash used for financing activities | | | (829,500 | ) | | | (543,053 | ) | | | (10,711,693 | ) | | | (2,149,063 | ) |
| | | | | | | | | | | | | | | | |
| | | | |
CASH | | | | | | | | | | | | | | | | |
Net increase in cash | | | 12,656 | | | | 13,313 | | | | 197,274 | | | | 12,234 | |
Cash at beginning of period | | | — | | | | — | | | | — | | | | — | |
| | | | | | | | | | | | | | | | |
Cash at end of period | | $ | 12,656 | | | $ | 13,313 | | | $ | 197,274 | | | $ | 12,234 | |
| | | | | | | | | | | | | | | | |
| | | | |
SUPPLEMENTAL DISCLOSURE OF CASH FLOW INFORMATION | | | | | | | | | | | | | | | | |
Cash paid during the period for interest expense | | $ | 115,814 | | | $ | 185,837 | | | $ | 2,866,606 | | | $ | 223,082 | |
| | | | | | | | | | | | | | | | |
| | | | |
NON-CASH FINANCING ACTIVITIES | | | | | | | | | | | | | | | | |
Capital shares issued in reinvestment of distributions paid to Common Shareholders | | $ | — | | | $ | 17,798 | | | $ | — | | | $ | — | |
| | | | | | | | | | | | | | | | |
See notes to financial statements.
Statements of Cash Flows (unaudited) (continued)
Six Months Ended February 28, 2018
| | | | | | | | | | | | | | | | |
| | | BQH | | | BSE | | | BFY | | | BHV | |
| | | | |
CASH PROVIDED BY (USED FOR) OPERATING ACTIVITIES | | | | | | | | | | | | | | | | |
Net decrease in net assets resulting from operations | | $ | (805,451 | ) | | $ | (1,732,118 | ) | | $ | (1,363,300 | ) | | $ | (291,510 | ) |
Adjustments to reconcile net decrease in net assets resulting from operations to net cash provided by operating activities: | | | | | | | | | | | | | | | | |
Proceeds from sales of long-term investments | | | 2,650,533 | | | | 9,226,484 | | | | 7,639,795 | | | | 4,327,467 | |
Purchases of long-term investments | | | (2,813,912 | ) | | | (10,460,198 | ) | | | (8,088,819 | ) | | | (4,133,300 | ) |
Net (purchases) sales of short-term securities | | | (129,218 | ) | | | 277,067 | | | | (65,348 | ) | | | (59,255 | ) |
Amortization of premium and accretion of discount on investments and other fees | | | 156,872 | | | | 495,733 | | | | 245,312 | | | | 64,660 | |
Net realized (gain) loss on investments | | | (58,558 | ) | | | (43,425 | ) | | | (101,990 | ) | | | (175,894 | ) |
Net unrealized loss on investments | | | 2,018,846 | | | | 4,257,301 | | | | 3,623,213 | | | | 1,124,120 | |
| (Increase) Decrease in Assets: | | | | | | | | | | | | |
Cash pledged for futures contracts | | | 13,000 | | | | 41,000 | | | | 28,000 | | | | 9,000 | |
Receivables: | | | | | | | | | | | | | | | | |
Interest — unaffiliated | | | (15,885 | ) | | | (43,989 | ) | | | (19,677 | ) | | | 25,343 | |
Dividends — affiliated | | | (176 | ) | | | 87 | | | | (131 | ) | | | (32 | ) |
Prepaid expenses | | | 22,413 | | | | 21,525 | | | | 17,063 | | | | 13,574 | |
| Increase (Decrease) in Liabilities: | | | | | | | | | | | | |
Payables: | | | | | | | | | | | | | | | | |
Investment advisory fees | | | (3,931 | ) | | | (8,373 | ) | | | (6,964 | ) | | | (2,076 | ) |
Interest expense and fees | | | 5,317 | | | | 15,675 | | | | 6,142 | | | | 4,170 | |
Trustees’ and Officer’s fees | | | 133 | | | | 231 | | | | 185 | | | | 68 | |
Variation margin on futures contracts | | | 7,633 | | | | 12,094 | | | | 11,867 | | | | 1,047 | |
Other accrued expenses | | | (10,542 | ) | | | (7,756 | ) | | | (8,225 | ) | | | (10,664 | ) |
| | | | | | | | | | | | | | | | |
Net cash provided by operating activities | | | 1,037,074 | | | | 2,051,338 | | | | 1,917,123 | | | | 896,718 | |
| | | | | | | | | | | | | | | | |
| | | | |
CASH PROVIDED BY (USED FOR) FINANCING ACTIVITIES | | | | | | | | | | | | | | | | |
Cash dividends paid to Common Shareholders | | | (991,237 | ) | | | (1,962,418 | ) | | | (1,827,488 | ) | | | (615,355 | ) |
Decrease in bank overdraft | | | (29,018 | ) | | | (50,934 | ) | | | (58,110 | ) | | | (277,536 | ) |
Amortization of deferred offering costs | | | 2,892 | | | | 3,100 | | | | 3,139 | | | | 1,282 | |
| | | | | | | | | | | | | | | | |
Net cash used for financing activities | | | (1,017,363 | ) | | | (2,010,252 | ) | | | (1,882,459 | ) | | | (891,609 | ) |
| | | | | | | | | | | | | | | | |
| | | | |
CASH | | | | | | | | | | | | | | | | |
Net increase in cash | | | 19,711 | | | | 41,086 | | | | 34,664 | | | | 5,109 | |
Cash at beginning of period | | | — | | | | — | | | | — | | | | — | |
| | | | | | | | | | | | | | | | |
Cash at end of period | | $ | 19,711 | | | $ | 41,086 | | | $ | 34,664 | | | $ | 5,109 | |
| | | | | | | | | | | | | | | | |
| | | | |
SUPPLEMENTAL DISCLOSURE OF CASH FLOW INFORMATION | | | | | | | | | | | | | | | | |
Cash paid during the period for interest expense | | $ | 263,073 | | | $ | 549,325 | | | $ | 487,062 | | | $ | 102,091 | |
| | | | | | | | | | | | | | | | |
| | | | |
NON-CASH FINANCING ACTIVITIES | | | | | | | | | | | | | | | | |
Capital shares issued in reinvestment of distributions paid to Common Shareholders | | $ | — | | | $ | — | | | $ | 4,281 | | | $ | 24,550 | |
| | | | | | | | | | | | | | | | |
See notes to financial statements.
| | |
| 72 | | 2018 BLACKROCK SEMI-ANNUAL REPORTTO SHAREHOLDERS |
Financial Highlights
(For a share outstanding throughout each period)
| | | | | | | | | | | | | | | | | | | | | | | | | | | | |
| | | BZM | |
| | | Six Months Ended
02/28/2018
(unaudited) | | | | | | Year Ended August 31, | |
| | | | | 2017 | | | 2016 | | | 2015 | | | 2014 | | | 2013 | |
Net asset value, beginning of period | | $ | 15.32 | | | | | | | $ | 15.97 | | | $ | 14.96 | | | $ | 15.20 | | | $ | 13.33 | | | $ | 15.60 | |
| | | | | | | | | | | | | | | | | | | | | | | | | | | | |
Net investment income(a) | | | 0.28 | | | | | | | | 0.59 | | | | 0.61 | | | | 0.63 | | | | 0.70 | | | | 0.72 | |
Net realized and unrealized gain (loss) | | | (0.32 | ) | | | | | | | (0.67 | ) | | | 1.02 | | | | (0.19 | ) | | | 1.90 | | | | (2.23 | ) |
| | | | | | | | | | | | | | | | | | | | | | | | | | | | |
Net increase (decrease) from investment operations | | | (0.04 | ) | | | | | | | (0.08 | ) | | | 1.63 | | | | 0.44 | | | | 2.60 | | | | (1.51 | ) |
| | | | | | | | | | | | | | | | | | | | | | | | | | | | |
Distributions to Common Shareholders(b) | | | | | | | | | | | | | | | | | | | | | | | | | | | | |
From net investment income | | | (0.28 | ) | | | | | | | (0.57 | ) | | | (0.62 | ) | | | (0.68 | ) | | | (0.73 | ) | | | (0.76 | ) |
From net realized gain | | | (0.04 | ) | | | | | | | — | | | | — | | | | — | | | | — | | | | — | |
| | | | | | | | | | | | | | | | | | | | | | | | | | | | |
Total distribution | | | (0.32 | ) | | | | | | | (0.57 | ) | | | (0.62 | ) | | | (0.68 | ) | | | (0.73 | ) | | | (0.76 | ) |
| | | | | | | | | | | | | | | | | | | | | | | | | | | | |
Net asset value, end of period | | $ | 14.96 | | | | | | | $ | 15.32 | | | $ | 15.97 | | | $ | 14.96 | | | $ | 15.20 | | | $ | 13.33 | |
| | | | | | | | | | | | | | | | | | | | | | | | | | | | |
Market price, end of period | | $ | 13.32 | | | | | | | $ | 14.29 | | | $ | 16.06 | | | $ | 14.44 | | | $ | 14.59 | | | $ | 12.66 | |
| | | | | | | | | | | | | | | | | | | | | | | | | | | | |
| | | | | | |
Total Return Applicable to Common Shareholders(c) | | | | | | | | | | | | | | | | | | | | | | | | | |
Based on net asset value | | | (0.02 | )%(d) | | | | | | | (0.31 | )% | | | 11.15 | % | | | 3.07 | % | | | 20.39 | % | | | (10.24 | )% |
| | | | | | | | | | | | | | | | | | | | | | | | | | | | |
Based on market price | | | (4.57 | )%(d) | | | | | | | (7.53 | )% | | | 15.80 | % | | | 3.64 | % | | | 21.68 | % | | | (27.84 | )% |
| | | | | | | | | | | | | | | | | | | | | | | | | | | | |
| | | | | | | |
Ratios to Average Net Assets Applicable to Common Shareholders | | | | | | | | | | | | | | | | | | | | | | | | | | | | |
Total expenses | | | 2.57 | %(e) | | | | | | | 2.35 | % | | | 2.10 | % | | | 1.96 | % | | | 2.00 | % | | | 2.04 | % |
| | | | | | | | | | | | | | | | | | | | | | | | | | | | |
Total expenses after fees waived and/or reimbursed and paid indirectly | | | 2.49 | %(e) | | | | | | | 2.27 | % | | | 2.02 | % | | | 1.88 | % | | | 1.92 | % | | | 2.02 | % |
| | | | | | | | | | | | | | | | | | | | | | | | | | | | |
Total expenses after fees waived and/or reimbursed and paid indirectly and excluding interest expense, fees and amortization of offering costs(f) | | | 1.73 | %(e)(g) | | | | | | | 1.75 | %(g) | | | 1.83 | %(g) | | | 1.41 | %(g) | | | 1.34 | % | | | 1.41 | % |
| | | | | | | | | | | | | | | | | | | | | | | | | | | | |
Net investment income to Common Shareholders | | | 3.73 | %(e) | | | | | | | 3.87 | % | | | 3.98 | % | | | 4.19 | % | | | 4.88 | % | | | 4.73 | % |
| | | | | | | | | | | | | | | | | | | | | | | | | | | | |
| | | | | | | |
Supplemental Data | | | | | | | | | | | | | | | | | | | | | | | | | | | | |
Net assets applicable to Common Shareholders, end of period (000) | | $ | 31,139 | | | | | | | $ | 31,893 | | | $ | 33,202 | | | $ | 31,073 | | | $ | 31,535 | | | $ | 27,642 | |
| | | | | | | | | | | | | | | | | | | | | | | | | | | | |
VRDP Shares outstanding at $100,000 liquidation value, end of period (000) | | $ | 16,000 | | | | | | | $ | 16,000 | | | $ | 16,000 | | | $ | 16,000 | | | $ | 16,000 | | | $ | 16,000 | |
| | | | | | | | | | | | | | | | | | | | | | | | | | | | |
Asset coverage per VRDP Shares at $100,000 liquidation value, end of period | | $ | 294,621 | | | | | | | $ | 299,333 | | | $ | 307,510 | | | $ | 294,207 | | | $ | 297,091 | | | $ | 272,765 | |
| | | | | | | | | | | | | | | | | | | | | | | | | | | | |
Borrowings outstanding, end of period (000) | | $ | 2,134 | | | | | | | $ | 2,134 | | | $ | 1,500 | | | $ | 1,500 | | | $ | 1,500 | | | $ | 1,500 | |
| | | | | | | | | | | | | | | | | | | | | | | | | | | | |
Portfolio turnover rate | | | 3 | % | | | | | | | 12 | % | | | 11 | % | | | 18 | % | | | 15 | % | | | 11 | % |
| | | | | | | | | | | | | | | | | | | | | | | | | | | | |
| (a) | Based on average Common Shares outstanding. |
| (b) | Distributions for annual periods determined in accordance with U.S. federal income tax regulations. |
| (c) | Total returns based on market price, which can be significantly greater or less than the net asset value, may result in substantially different returns. Where applicable, excludes the effects of any sales charges and assumes the reinvestment of distributions at actual reinvestment prices. |
| (d) | Aggregate total return. |
| (f) | Interest expense, fees and amortization of offering costs related to TOBs and/or VRDP Shares. See Note 4 and Note 10 of the Notes to Financial Statements for details. |
| (g) | For the six months ended February 28, 2018 and years ended August 31, 2017, August 31, 2016 and August 31, 2015, the total expense ratio after fees waived and/or reimbursed and paid indirectly and excluding interest expense, fees, amortization of offering costs, liquidity and remarketing fees were 1.32%, 1.31%, 1.39% and 1.33%, respectively. |
See notes to financial statements.
Financial Highlights (continued)
(For a share outstanding throughout each period)
| | | | | | | | | | | | | | | | | | | | | | | | | | | | |
| | | MHE | |
| | | Six Months Ended
02/28/18
(unaudited) | | | | | | Year Ended August 31, | |
| | | | | 2017 | | | 2016 | | | 2015 | | | 2014 | | | 2013 | |
Net asset value, beginning of period | | $ | 13.98 | | | | | | | $ | 14.69 | | | $ | 13.89 | | | $ | 14.02 | | | $ | 12.34 | | | $ | 14.35 | |
| | | | | | | | | | | | | | | | | | | | | | | | | | | | |
Net investment income(a) | | | 0.29 | | | | | | | | 0.62 | | | | 0.65 | | | | 0.68 | | | | 0.69 | | | | 0.71 | |
Net realized and unrealized gain (loss) | | | (0.51 | ) | | | | | | | (0.69 | ) | | | 0.83 | | | | (0.10 | ) | | | 1.74 | | | | (1.97 | ) |
| | | | | | | | | | | | | | | | | | | | | | | | | | | | |
Net increase (decrease) from investment operations | | | (0.22 | ) | | | | | | | (0.07 | ) | | | 1.48 | | | | 0.58 | | | | 2.43 | | | | (1.26 | ) |
| | | | | | | | | | | | | | | | | | | | | | | | | | | | |
Distributions to Common Shareholders from net investment income(b) | | | (0.32 | ) | | | | | | | (0.64 | ) | | | (0.68 | ) | | | (0.71 | ) | | | (0.75 | ) | | | (0.75 | ) |
| | | | | | | | | | | | | | | | | | | | | | | | | | | | |
Net asset value, end of period | | $ | 13.44 | | | | | | | $ | 13.98 | | | $ | 14.69 | | | $ | 13.89 | | | $ | 14.02 | | | $ | 12.34 | |
| | | | | | | | | | | | | | | | | | | | | | | | | | | | |
Market price, end of period | | $ | 13.62 | | | | | | | $ | 14.00 | | | $ | 15.32 | | | $ | 13.26 | | | $ | 13.75 | | | $ | 11.91 | |
| | | | | | | | | | | | | | | | | | | | | | | | | | | | |
| | | | | | |
Total Return Applicable to Common Shareholders(c) | | | | | | | | | | | | | | | | | | | | | | | | | |
Based on net asset value | | | (1.61 | )%(d) | | | | | | | (0.34 | )% | | | 11.01 | % | | | 4.25 | % | | | 20.47 | % | | | (9.27 | )% |
| | | | | | | | | | | | | | | | | | | | | | | | | | | | |
Based on market price | | | (0.44 | )%(d) | | | | | | | (4.30 | )% | | | 21.27 | % | | | 1.47 | % | | | 22.42 | % | | | (15.72 | )% |
| | | | | | | | | | | | | | | | | | | | | | | | | | | | |
| | | | | | | |
Ratios to Average Net Assets Applicable to Common Shareholders | | | | | | | | | | | | | | | | | | | | | | | | | | | | |
Total expenses | | | 2.33 | %(e) | | | | | | | 2.17 | % | | | 1.77 | % | | | 1.71 | % | | | 1.78 | % | | | 1.77 | % |
| | | | | | | | | | | | | | | | | | | | | | | | | | | | |
Total expenses after fees waived and/or reimbursed and paid indirectly | | | 2.33 | %(e) | | | | | | | 2.17 | % | | | 1.77 | % | | | 1.71 | % | | | 1.78 | % | | | 1.77 | % |
| | | | | | | | | | | | | | | | | | | | | | | | | | | | |
Total expenses after fees waived and/or reimbursed and paid indirectly and excluding interest expense, fees and amortization of offering costs(f) | | | 1.17 | %(e) | | | | | | | 1.18 | %(g) | | | 1.15 | %(g) | | | 1.15 | % | | | 1.16 | % | | | 1.12 | % |
| | | | | | | | | | | | | | | | | | | | | | | | | | | | |
Net investment income to Common Shareholders | | | 4.22 | %(e) | | | | | | | 4.44 | % | | | 4.53 | % | | | 4.82 | % | | | 5.22 | % | | | 5.06 | % |
| | | | | | | | | | | | | | | | | | | | | | | | | | | | |
| | | | | | | |
Supplemental Data | | | | | | | | | | | | | | | | | | | | | | | | | | | | |
Net assets applicable to Common Shareholders, end of period (000) | | $ | 31,853 | | | | | | | $ | 33,115 | | | $ | 34,772 | | | $ | 32,864 | | | $ | 33,139 | | | $ | 29,163 | |
| | | | | | | | | | | | | | | | | | | | | | | | | | | | |
VRDP Shares outstanding at $100,000 liquidation value, end of period (000) | | $ | 18,500 | | | | | | | $ | 18,500 | | | $ | 18,500 | | | $ | 18,500 | | | $ | 18,500 | | | $ | 18,500 | |
| | | | | | | | | | | | | | | | | | | | | | | | | | | | |
Asset coverage per VRDP Shares at $100,000 liquidation value, end of period | | $ | 272,181 | | | | | | | $ | 279,002 | | | $ | 287,959 | | | $ | 277,646 | | | $ | 279,130 | | | $ | 257,637 | |
| | | | | | | | | | | | | | | | | | | | | | | | | | | | |
Borrowings outstanding, end of period (000) | | $ | 1,636 | | | | | | | $ | 1,421 | | | $ | 751 | | | $ | — | | | $ | — | | | $ | 1,840 | |
| | | | | | | | | | | | | | | | | | | | | | | | | | | | |
Portfolio turnover rate | | | 6 | % | | | | | | | 18 | % | | | 30 | % | | | 8 | % | | | 14 | % | | | 11 | % |
| | | | | | | | | | | | | | | | | | | | | | | | | | | | |
| (a) | Based on average Common Shares outstanding. |
| (b) | Distributions for annual periods determined in accordance with U.S. federal income tax regulations. |
| (c) | Total returns based on market price, which can be significantly greater or less than the net asset value, may result in substantially different returns. Where applicable, excludes the effects of any sales charges and assumes the reinvestment of distributions at actual reinvestment prices. |
| (d) | Aggregate total return. |
| (f) | Interest expense, fees and amortization of offering costs related to TOB Trusts and/or VRDP Shares. See Note 4 and Note 10 of the Notes to Financial Statements for details. |
| (g) | For the years ended August 31, 2017 and August 31, 2016, the total expense ratio after fees waived and/or reimbursed and paid indirectly and excluding interest expense, fees, amortization of offering costs, liquidity and remarketing fees were 1.18% and 1.15%, respectively. |
See notes to financial statements.
| | |
| 74 | | 2018 BLACKROCK SEMI-ANNUAL REPORTTO SHAREHOLDERS |
Financial Highlights (continued)
(For a share outstanding throughout each period)
| | | | | | | | | | | | | | | | | | | | | | | | | | | | |
| | | MHN | |
| | | Six Months Ended
02/28/18
(unaudited) | | | | | | Year Ended August 31, | |
| | | | | 2017 | | | 2016 | | | 2015 | | | 2014 | | | 2013 | |
Net asset value, beginning of period | | $ | 14.93 | | | | | | | $ | 15.69 | | | $ | 14.81 | | | $ | 14.98 | | | $ | 13.14 | | | $ | 15.64 | |
| | | | | | | | | | | | | | | | | | | | | | | | | | | | |
Net investment income(a) | | | 0.31 | | | | | | | | 0.69 | | | | 0.75 | | | | 0.80 | | | | 0.83 | | | | 0.87 | |
Net realized and unrealized gain (loss) | | | (0.51 | ) | | | | | | | (0.75 | ) | | | 0.91 | | | | (0.15 | ) | | | 1.88 | | | | (2.45 | ) |
| | | | | | | | | | | | | | | | | | | | | | | | | | | | |
Net increase (decrease) from investment operations | | | (0.20 | ) | | | | | | | (0.06 | ) | | | 1.66 | | | | 0.65 | | | | 2.71 | | | | (1.58 | ) |
| | | | | | | | | | | | | | | | | | | | | | | | | | | | |
Distributions to Common Shareholders from net investment income(b) | | | (0.33 | ) | | | | | | | (0.70 | ) | | | (0.78 | ) | | | (0.82 | ) | | | (0.87 | ) | | | (0.92 | ) |
| | | | | | | | | | | | | | | | | | | | | | | | | | | | |
Net asset value, end of period | | $ | 14.40 | | | | | | | $ | 14.93 | | | $ | 15.69 | | | $ | 14.81 | | | $ | 14.98 | | | $ | 13.14 | |
| | | | | | | | | | | | | | | | | | | | | | | | | | | | |
Market price, end of period | | $ | 12.75 | | | | | | | $ | 14.36 | | | $ | 15.04 | | | $ | 13.65 | | | $ | 13.64 | | | $ | 12.65 | |
| | | | | | | | | | | | | | | | | | | | | | | | | | | | |
| | | | | | |
Total Return Applicable to Common Shareholders(c) | | | | | | | | | | | | | | | | | | | | | | | | | |
Based on net asset value | | | (1.20 | )%(d) | | | | | | | 0.04 | % | | | 11.63 | % | | | 4.88 | % | | | 21.74 | % | | | (10.59 | )% |
| | | | | | | | | | | | | | | | | | | | | | | | | | | | |
Based on market price | | | (9.04 | )%(d) | | | | | | | 0.37 | % | | | 16.10 | % | | | 6.16 | % | | | 15.15 | % | | | (15.12 | )% |
| | | | | | | | | | | | | | | | | | | | | | | | | | | | |
| | | | | | | |
Ratios to Average Net Assets Applicable to Common Shareholders | | | | | | | | | | | | | | | | | | | | | | | | | | | | |
Total expenses | | | 2.31 | %(e) | | | | | | | 2.13 | % | | | 1.68 | % | | | 1.58 | % | | | 1.66 | % | | | 1.75 | % |
| | | | | | | | | | | | | | | | | | | | | | | | | | | | |
Total expenses after fees waived and/or reimbursed and paid indirectly | | | 2.23 | %(e) | | | | | | | 2.05 | % | | | 1.62 | % | | | 1.52 | % | | | 1.59 | % | | | 1.67 | % |
| | | | | | | | | | | | | | | | | | | | | | | | | | | | |
Total expenses after fees waived and/or reimbursed and paid indirectly and excluding interest expense, fees and amortization of offering costs(f)(g) | | | 0.95 | %(e) | | | | | | | 0.96 | % | | | 0.95 | % | | | 0.95 | % | | | 1.22 | % | | | 1.36 | % |
| | | | | | | | | | | | | | | | | | | | | | | | | | | | |
Net investment income to Common Shareholders | | | 4.28 | %(e) | | | | | | | 4.65 | % | | | 4.91 | % | | | 5.35 | % | | | 5.86 | % | | | 5.73 | % |
| | | | | | | | | | | | | | | | | | | | | | | | | | | | |
| | | | | | | |
Supplemental Data | | | | | | | | | | | | | | | | | | | | | | | | | | | | |
Net assets applicable to Common Shareholders, end of period (000) | | $ | 448,429 | | | | | | | $ | 464,818 | | | $ | 488,318 | | | $ | 461,159 | | | $ | 466,412 | | | $ | 408,935 | |
| | | | | | | | | | | | | | | | | | | | | | | | | | | | |
VRDP Shares outstanding at $100,000 liquidation value, end of period (000) | | $ | 243,600 | | | | | | | $ | 243,600 | | | $ | 243,600 | | | $ | 243,600 | | | $ | 243,600 | | | $ | 243,600 | |
| | | | | | | | | | | | | | | | | | | | | | | | | | | | |
Asset coverage per VRDP Shares at $100,000 liquidation value, end of period | | $ | 284,084 | | | | | | | $ | 290,812 | | | $ | 300,459 | | | $ | 289,310 | | | $ | 291,466 | | | $ | 267,871 | |
| | | | | | | | | | | | | | | | | | | | | | | | | | | | |
Borrowings outstanding, end of period (000) | | $ | 70,007 | | | | | | | $ | 70,007 | | | $ | 76,443 | | | $ | 53,308 | | | $ | 51,890 | | | $ | 64,658 | |
| | | | | | | | | | | | | | | | | | | | | | | | | | | | |
Portfolio turnover rate | | | 6 | % | | | | | | | 17 | % | | | 13 | % | | | 19 | % | | | 16 | % | | | 18 | % |
| | | | | | | | | | | | | | | | | | | | | | | | | | | | |
| (a) | Based on average Common Shares outstanding. |
| (b) | Distributions for annual periods determined in accordance with U.S. federal income tax regulations. |
| (c) | Total returns based on market price, which can be significantly greater or less than the net asset value, may result in substantially different returns. Where applicable, excludes the effects of any sales charges and assumes the reinvestment of distributions at actual reinvestment prices. |
| (d) | Aggregate total return. |
| (f) | Interest expense, fees and amortization of offering costs related to TOB Trusts and/or VRDP Shares. See Note 4 and Note 10 of the Notes to Financial Statements for details. |
| (g) | For the six months ended February 28, 2018 and the years ended August 31, 2017, August 31, 2016, August 31, 2015, August 31, 2014 and August 31, 2013, the total expense ratio after fees waived and/or reimbursed and paid indirectly and excluding interest expense, fees, amortization of offering costs, liquidity and remarketing fees was 0.94%, 0.95%, 0.94%, 0.94%, 0.95% and 0.95%, respectively. |
See notes to financial statements.
Financial Highlights (continued)
(For a share outstanding throughout each period)
| | | | | | | | | | | | | | | | | | | | | | | | | | | | |
| | | BLJ | |
| | | Six Months Ended
02/28/2018
(unaudited) | | | | | | Year Ended August 31, | |
| | | | | | | 2017 | | | 2016 | | | 2015 | | | 2014 | | | 2013 | |
Net asset value, beginning of period | | $ | 15.82 | | | | | | | $ | 16.74 | | | $ | 15.65 | | | $ | 16.29 | | | $ | 14.13 | | | $ | 16.67 | |
| | | | | | | | | | | | | | | | | | | | | | | | | | | | |
Net investment income(a) | | | 0.32 | | | | | | | | 0.75 | | | | 0.81 | | | | 0.82 | | | | 0.87 | | | | 0.88 | |
Net realized and unrealized gain (loss) | | | (0.41 | ) | | | | | | | (0.88 | ) | | | 1.11 | | | | (0.59 | ) | | | 2.18 | | | | (2.54 | ) |
| | | | | | | | | | | | | | | | | | | | | | | | | | | | |
Net increase (decrease) from investment operations | | | (0.09 | ) | | | | | | | (0.13 | ) | | | 1.92 | | | | 0.23 | | | | 3.05 | | | | (1.66 | ) |
| | | | | | | | | | | | | | | | | | | | | | | | | | | | |
Distributions to Common Shareholders from net investment income(b) | | | (0.37 | ) | | | | | | | (0.79 | ) | | | (0.83 | ) | | | (0.87 | ) | | | (0.89 | ) | | | (0.88 | ) |
| | | | | | | | | | | | | | | | | | | | | | | | | | | | |
Net asset value, end of period | | $ | 15.36 | | | | | | | $ | 15.82 | | | $ | 16.74 | | | $ | 15.65 | | | $ | 16.29 | | | $ | 14.13 | |
| | | | | | | | | | | | | | | | | | | | | | | | | | | | |
Market price, end of period | | $ | 13.85 | | | | | | | $ | 15.04 | | | $ | 17.40 | | | $ | 13.99 | | | $ | 14.68 | | | $ | 13.54 | |
| | | | | | | | | | | | | | | | | | | | | | | | | | | | |
| | | | | | | |
Total Return Applicable to Common Shareholders(c) | | | | | | | | | | | | | | | | | | | | | | | | | | | | |
Based on net asset value | | | (0.43 | )%(d) | | | | | | | (0.45 | )% | | | 12.80 | % | | | 1.74 | % | | | 22.83 | % | | | (10.43 | )% |
| | | | | | | | | | | | | | | | | | | | | | | | | | | | |
Based on market price | | | (5.56 | )%(d) | | | | | | | (8.95 | )% | | | 31.16 | % | | | 0.93 | % | | | 15.51 | % | | | (14.12 | )% |
| | | | | | | | | | | | | | | | | | | | | | | | | | | | |
| | | | | | | |
Ratios to Average Net Assets Applicable to Common Shareholders | | | | | | | | | | | | | | | | | | | | | | | | | | | | |
Total expenses | | | 3.33 | %(e) | | | | | | | 2.48 | % | | | 2.07 | % | | | 1.98 | % | | | 2.05 | % | | | 2.10 | % |
| | | | | | | | | | | | | | | | | | | | | | | | | | | | |
Total expenses after fees waived and/or reimbursed and paid indirectly | | | 3.33 | %(e) | | | | | | | 2.48 | % | | | 2.07 | % | | | 1.98 | % | | | 2.05 | % | | | 2.10 | % |
| | | | | | | | | | | | | | | | | | | | | | | | | | | | |
Total expenses after fees waived and/or reimbursed and paid indirectly and excluding interest expense, fees and amortization of offering costs(f) | | | 2.06 | %(e) | | | | | | | 1.43 | % | | | 1.41 | % | | | 1.39 | % | | | 1.42 | % | | | 1.45 | % |
| | | | | | | | | | | | | | | | | | | | | | | | | | | | |
Net investment income to Common Shareholders | | | 4.10 | %(e) | | | | | | | 4.80 | % | | | 5.03 | % | | | 5.07 | % | | | 5.74 | % | | | 5.39 | % |
| | | | | | | | | | | | | | | | | | | | | | | | | | | | |
| | | | | | | |
Supplemental Data | | | | | | | | | | | | | | | | | | | | | | | | | | | | |
Net assets applicable to Common Shareholders, end of period (000) | | $ | 35,763 | | | | | | | $ | 36,818 | | | $ | 38,959 | | | $ | 36,376 | | | $ | 37,868 | | | $ | 32,841 | |
| | | | | | | | | | | | | | | | | | | | | | | | | | | | |
VRDP Shares outstanding at $100,000 liquidation value, end of period (000) | | $ | 18,700 | | | | | | | $ | 18,700 | | | $ | 18,700 | | | $ | 18,700 | | | $ | 18,700 | | | $ | 18,700 | |
| | | | | | | | | | | | | | | | | | | | | | | | | | | | |
Asset coverage per VRDP Shares at $100,000 liquidation value, end of period | | $ | 291,246 | | | | | | | $ | 296,885 | | | $ | 308,335 | | | $ | 294,526 | | | $ | 302,505 | | | $ | 275,620 | |
| | | | | | | | | | | | | | | | | | | | | | | | | | | | |
Borrowings outstanding, end of period (000) | | $ | 6,016 | | | | | | | $ | 6,116 | | | $ | 4,776 | | | $ | 4,520 | | | $ | 4,520 | | | $ | 4,520 | |
| | | | | | | | | | | | | | | | | | | | | | | | | | | | |
Portfolio turnover rate | | | 2 | % | | | | | | | 7 | % | | | 6 | % | | | 13 | % | | | 16 | % | | | 8 | % |
| | | | | | | | | | | | | | | | | | | | | | | | | | | | |
| (a) | Based on average Common Shares outstanding. |
| (b) | Distributions for annual periods determined in accordance with U.S. federal income tax regulations. |
| (c) | Total returns based on market price, which can be significantly greater or less than the net asset value, may result in substantially different returns. Where applicable, excludes the effects of any sales charges and assumes the reinvestment of distributions at actual reinvestment prices. |
| (d) | Aggregate total return. |
| (f) | Interest expense, fees and amortization of offering costs related to TOB Trusts and/or VRDP Shares. See Note 4 and Note 10 of the Notes to Financial Statements for details. |
See notes to financial statements.
| | |
| 76 | | 2018 BLACKROCK SEMI-ANNUAL REPORTTO SHAREHOLDERS |
Financial Highlights (continued)
(For a share outstanding throughout each period)
| | | | | | | | | | | | | | | | | | | | | | | | | | | | |
| | | BQH | |
| | | Six Months Ended
02/28/18
(unaudited) | | | | | | Year Ended August 31, | |
| | | | | 2017 | | | 2016 | | | 2015 | | | 2014 | | | 2013 | |
Net asset value, beginning of period | | $ | 16.11 | | | | | | | $ | 16.99 | | | $ | 15.75 | | | $ | 15.77 | | | $ | 13.32 | | | $ | 16.53 | |
| | | | | | | | | | | | | | | | | | | | | | | | | | | | |
Net investment income(a) | | | 0.31 | | | | | | | | 0.67 | | | | 0.71 | | | | 0.74 | | | | 0.79 | | | | 0.84 | |
Net realized and unrealized gain (loss) | | | (0.60 | ) | | | | | | | (0.84 | ) | | | 1.27 | | | | 0.03 | | | | 2.46 | | | | (3.00 | ) |
| | | | | | | | | | | | | | | | | | | | | | | | | | | | |
Net increase (decrease) from investment operations | | | (0.29 | ) | | | | | | | (0.17 | ) | | | 1.98 | | | | 0.77 | | | | 3.25 | | | | (2.16 | ) |
| | | | | | | | | | | | | | | | | | | | | | | | | | | | |
Distributions to Common Shareholders(b) | | | | | | | | | | | | | | | | | | | | | | | | | | | | |
From net investment income | | | (0.35 | ) | | | | | | | (0.71 | ) | | | (0.74 | ) | | | (0.79 | ) | | | (0.80 | ) | | | (0.83 | ) |
From net realized gain | | | — | | | | | | | | — | | | | — | | | | — | | | | — | | | | (0.22 | ) |
| | | | | | | | | | | | | | | | | | | | | | | | | | | | |
Total distributions | | | (0.35 | ) | | | | | | | (0.71 | ) | | | (0.74 | ) | | | (0.79 | ) | | | (0.80 | ) | | | (1.05 | ) |
| | | | | | | | | | | | | | | | | | | | | | | | | | | | |
Net asset value, end of period | | $ | 15.47 | | | | | | | $ | 16.11 | | | $ | 16.99 | | | $ | 15.75 | | | $ | 15.77 | | | $ | 13.32 | |
| | | | | | | | | | | | | | | | | | | | | | | | | | | | |
Market price, end of period | | $ | 13.51 | | | | | | | $ | 14.55 | | | $ | 15.70 | | | $ | 13.66 | | | $ | 13.86 | | | $ | 12.45 | |
| | | | | | | | | | | | | | | | | | | | | | | | | | | | |
| | | | | | |
Total Return Applicable to Common Shareholders(c) | | | | | | | | | | | | | | | | | | | | | | | | | |
Based on net asset value | | | (1.59 | )%(d) | | | | | | | (0.47 | )% | | | 13.22 | % | | | 5.57 | % | | | 25.66 | % | | | (13.83 | )% |
| | | | | | | | | | | | | | | | | | | | | | | | | | | | |
Based on market price | | | (4.85 | )%(d) | | | | | | | (2.73 | )% | | | 20.63 | % | | | 4.18 | % | | | 18.16 | % | | | (19.61 | )% |
| | | | | | | | | | | | | | | | | | | | | | | | | | | | |
| | | | | | | |
Ratios to Average Net Assets Applicable to Common Shareholders | | | | | | | | | | | | | | | | | | | | | | | | | | | | |
Total expenses | | | 2.65 | %(e) | | | | | | | 2.44 | % | | | 2.10 | % | | | 2.08 | % | | | 2.23 | % | | | 2.26 | % |
| | | | | | | | | | | | | | | | | | | | | | | | | | | | |
Total expenses after fees waived and/or reimbursed and paid indirectly | | | 2.48 | %(e) | | | | | | | 2.28 | % | | | 2.07 | % | | | 2.07 | % | | | 2.23 | % | | | 2.26 | % |
| | | | | | | | | | | | | | | | | | | | | | | | | | | | |
Total expenses after fees waived and/or reimbursed and paid indirectly and excluding interest expense, fees and amortization of offering costs(f) | | | 1.26 | %(e) | | | | | | | 1.24 | % | | | 1.48 | %(g) | | | 1.91 | %(g) | | | 2.02 | %(g) | | | 1.96 | %(g) |
| | | | | | | | | | | | | | | | | | | | | | | | | | | | |
Net investment income to Common Shareholders | | | 3.92 | %(e) | | | | | | | 4.21 | % | | | 4.31 | % | | | 4.68 | % | | | 5.45 | % | | | 5.26 | % |
| | | | | | | | | | | | | | | | | | | | | | | | | | | | |
| | | | | | | |
Supplemental Data | | | | | | | | | | | | | | | | | | | | | | | | | | | | |
Net assets applicable to Common Shareholders, end of period (000) | | $ | 43,317 | | | | | | | $ | 45,113 | | | $ | 47,581 | | | $ | 44,111 | | | $ | 44,158 | | | $ | 37,302 | |
| | | | | | | | | | | | | | | | | | | | | | | | | | | | |
VRDP Shares outstanding at $100,000 liquidation value, end of period (000) | | $ | 22,100 | | | | | | | $ | 22,100 | | | $ | 22,100 | | | $ | 22,100 | | | $ | 22,100 | | | $ | 22,100 | |
| | | | | | | | | | | | | | | | | | | | | | | | | | | | |
Asset coverage per VRDP Shares at $100,000 liquidation value, end of period | | $ | 296,002 | | | | | | | $ | 304,132 | | | $ | 315,300 | | | $ | 299,597 | | | $ | 299,812 | | | $ | 268,789 | |
| | | | | | | | | | | | | | | | | | | | | | | | | | | | |
Borrowings outstanding, end of period (000) | | $ | 6,521 | | | | | | | $ | 6,521 | | | $ | 6,381 | | | $ | 5,070 | | | $ | 4,900 | | | $ | 4,775 | |
| | | | | | | | | | | | | | | | | | | | | | | | | | | | |
Portfolio turnover rate | | | 4 | % | | | | | | | 17 | % | | | 13 | % | | | 22 | % | | | 18 | % | | | 18 | % |
| | | | | | | | | | | | | | | | | | | | | | | | | | | | |
| (a) | Based on average Common Shares outstanding. |
| (b) | Distributions for annual periods determined in accordance with U.S. federal income tax regulations. |
| (c) | Total returns based on market price, which can be significantly greater or less than the net asset value, may result in substantially different returns. Where applicable, excludes the effects of any sales charges and assumes the reinvestment of distributions at actual reinvestment prices. |
| (d) | Aggregate total return. |
| (f) | Interest expense, fees and amortization of offering costs related to TOB Trusts and/or VRDP Shares. See Note 4 and Note 10 of the Notes to Financial Statements for details. |
| (g) | For the years ended August 31, 2016, August 31, 2015, August 31, 2014 and August 31, 2013, the total expense ratio after fees waived and/or reimbursed and paid indirectly and excluding interest expense, fees, amortization of offering costs, liquidity and remarketing fees was 1.41%, 1.41%, 1.46% and 1.47%, respectively. |
See notes to financial statements.
Financial Highlights (continued)
(For a share outstanding throughout each period)
| | | | | | | | | | | | | | | | | | | | | | | | | | | | |
| | | BSE | |
| | | Six Months Ended
02/28/18
(unaudited) | | | | | | Year Ended August 31, | |
| | | | | 2017 | | | 2016 | | | 2015 | | | 2014 | | | 2013 | |
Net asset value, beginning of period | | $ | 15.04 | | | | | | | $ | 15.84 | | | $ | 14.81 | | | $ | 14.92 | | | $ | 12.92 | | | $ | 15.51 | |
| | | | | | | | | | | | | | | | | | | | | | | | | | | | |
Net investment income(a) | | | 0.29 | | | | | | | | 0.63 | | | | 0.68 | | | | 0.70 | | | | 0.72 | | | | 0.78 | |
Net realized and unrealized gain (loss) | | | (0.55 | ) | | | | | | | (0.80 | ) | | | 1.03 | | | | (0.08 | ) | | | 2.05 | | | | (2.54 | ) |
| | | | | | | | | | | | | | | | | | | | | | | | | | | | |
Net increase (decrease) from investment operations | | | (0.26 | ) | | | | | | | (0.17 | ) | | | 1.71 | | | | 0.62 | | | | 2.77 | | | | (1.76 | ) |
| | | | | | | | | | | | | | | | | | | | | | | | | | | | |
Distributions to Common Shareholders from net investment income(b) | | | (0.30 | ) | | | | | | | (0.63 | ) | | | (0.68 | ) | | | (0.73 | ) | | | (0.77 | ) | | | (0.83 | ) |
| | | | | | | | | | | | | | | | | | | | | | | | | | | | |
Net asset value, end of period | | $ | 14.48 | | | | | | | $ | 15.04 | | | $ | 15.84 | | | $ | 14.81 | | | $ | 14.92 | | | $ | 12.92 | |
| | | | | | | | | | | | | | | | | | | | | | | | | | | | |
Market price, end of period | | $ | 12.77 | | | | | | | $ | 13.55 | | | $ | 14.84 | | | $ | 12.99 | | | $ | 13.16 | | | $ | 12.05 | |
| | | | | | | | | | | | | | | | | | | | | | | | | | | | |
| | | | | | |
Total Return Applicable to Common Shareholders(c) | | | | | | | | | | | | | | | | | | | | | | | | | |
Based on net asset value | | | (1.54 | )%(d) | | | | | | | (0.55 | )% | | | 12.22 | % | | | 4.88 | % | | | 22.65 | % | | | (11.80 | )% |
| | | | | | | | | | | | | | | | | | | | | | | | | | | | |
Based on market price | | | (3.62 | )%(d) | | | | | | | (4.36 | )% | | | 19.87 | % | | | 4.29 | % | | | 15.99 | % | | | (18.94 | )% |
| | | | | | | | | | | | | | | | | | | | | | | | | | | | |
| | | | | | | |
Ratios to Average Net Assets Applicable to Common Shareholders | | | | | | | | | | | | | | | | | | | | | | | | | | | | |
Total expenses | | | 2.28 | %(e) | | | | | | | 2.10 | % | | | 1.76 | % | | | 1.70 | % | | | 1.75 | % | | | 1.79 | % |
| | | | | | | | | | | | | | | | | | | | | | | | | | | | |
Total expenses after fees waived and/or reimbursed and paid indirectly | | | 2.28 | %(e) | | | | | | | 2.09 | % | | | 1.75 | % | | | 1.70 | % | | | 1.75 | % | | | 1.78 | % |
| | | | | | | | | | | | | | | | | | | | | | | | | | | | |
Total expenses after fees waived and/or reimbursed and paid indirectly and excluding interest expense, fees and amortization of offering costs(f) | | | 1.10 | %(e) | | | | | | | 1.10 | % | | | 1.17 | %(g) | | | 1.51 | %(g) | | | 1.55 | %(g) | | | 1.51 | %(g) |
| | | | | | | | | | | | | | | | | | | | | | | | | | | | |
Net investment income to Common Shareholders | | | 3.89 | %(e) | | | | | | | 4.23 | % | | | 4.40 | % | | | 4.72 | % | | | 5.18 | % | | | 5.20 | % |
| | | | | | | | | | | | | | | | | | | | | | | | | | | | |
| | | | | | | |
Supplemental Data | | | | | | | | | | | | | | | | | | | | | | | | | | | | |
Net assets applicable to Common Shareholders, end of period (000) | | $ | 94,417 | | | | | | | $ | 98,076 | | | $ | 103,296 | | | $ | 96,587 | | | $ | 97,276 | | | $ | 84,262 | |
| | | | | | | | | | | | | | | | | | | | | | | | | | | | |
VRDP Shares outstanding at $100,000 liquidation value, end of period (000) | | $ | 40,500 | | | | | | | $ | 40,500 | | | $ | 40,500 | | | $ | 40,500 | | | $ | 40,500 | | | $ | 40,500 | |
| | | | | | | | | | | | | | | | | | | | | | | | | | | | |
Asset coverage per VRDP Shares at $100,000 liquidation value, end of period | | $ | 333,129 | | | | | | | $ | 342,162 | | | $ | 355,052 | | | $ | 338,486 | | | $ | 340,188 | | | $ | 308,055 | |
| | | | | | | | | | | | | | | | | | | | | | | | | | | | |
Borrowings outstanding, end of period (000) | | $ | 20,604 | | | | | | | $ | 20,604 | | | $ | 21,873 | | | $ | 18,091 | | | $ | 17,431 | | | $ | 17,054 | |
| | | | | | | | | | | | | | | | | | | | | | | | | | | | |
Portfolio turnover rate | | | 6 | % | | | | | | | 13 | % | | | 8 | % | | | 20 | % | | | 24 | % | | | 25 | % |
| | | | | | | | | | | | | | | | | | | | | | | | | | | | |
| (a) | Based on average Common Shares outstanding. |
| (b) | Distributions for annual periods determined in accordance with U.S. federal income tax regulations. |
| (c) | Total returns based on market price, which can be significantly greater or less than the net asset value, may result in substantially different returns. Where applicable, excludes the effects of any sales charges and assumes the reinvestment of distributions at actual reinvestment prices. |
| (d) | Aggregate total return. |
| (f) | Interest expense, fees and amortization of offering costs related to TOBs and/or VRDP Shares. See Note 4 and Note 10 of the Notes to Financial Statements for details. |
| (g) | For the years ended August 31, 2016, August 31, 2015, August 31, 2014 and August 31, 2013, the total expense ratio after fees waived and/or reimbursed and paid indirectly and excluding interest expense, fees, amortization of offering costs, liquidity and remarketing fees was 1.12%, 1.09%, 1.09% and 1.09%, respectively. |
See notes to financial statements.
| | |
| 78 | | 2018 BLACKROCK SEMI-ANNUAL REPORTTO SHAREHOLDERS |
Financial Highlights (continued)
(For a share outstanding throughout each period)
| | | | | | | | | | | | | | | | | | | | | | | | | | | | |
| | | BFY | |
| | | Six Months Ended
02/28/18
(unaudited) | | | | | | Year Ended August 31, | |
| | | | | 2017 | | | 2016 | | | 2015 | | | 2014 | | | 2013 | |
Net asset value, beginning of period | | $ | 15.71 | | | | | | | $ | 16.58 | | | $ | 15.57 | | | $ | 15.66 | | | $ | 13.36 | | | $ | 16.09 | |
| | | | | | | | | | | | | | | | | | | | | | | | | | | | |
Net investment income(a) | | | 0.33 | | | | | | | | 0.71 | | | | 0.78 | | | | 0.82 | | | | 0.84 | | | | 0.89 | |
Net realized and unrealized gain (loss) | | | (0.59 | ) | | | | | | | (0.82 | ) | | | 1.06 | | | | (0.07 | ) | | | 2.30 | | | | (2.73 | ) |
| | | | | | | | | | | | | | | | | | | | | | | | | | | | |
Net increase (decrease) from investment operations | | | (0.26 | ) | | | | | | | (0.11 | ) | | | 1.84 | | | | 0.75 | | | | 3.14 | | | | (1.84 | ) |
| | | | | | | | | | | | | | | | | | | | | | | | | | | | |
Distributions to Common Shareholders from net investment income(b) | | | (0.37 | ) | | | | | | | (0.76 | ) | | | (0.83 | ) | | | (0.84 | ) | | | (0.84 | ) | | | (0.89 | ) |
| | | | | | | | | | | | | | | | | | | | | | | | | | | | |
Net asset value, end of period | | $ | 15.08 | | | | | | | $ | 15.71 | | | $ | 16.58 | | | $ | 15.57 | | | $ | 15.66 | | | $ | 13.36 | |
| | | | | | | | | | | | | | | | | | | | | | | | | | | | |
Market price, end of period | | $ | 13.76 | | | | | | | $ | 15.51 | | | $ | 17.01 | | | $ | 14.16 | | | $ | 14.02 | | | $ | 12.56 | |
| | | | | | | | | | | | | | | | | | | | | | | | | | | | |
| | | | | | | |
Total Return Applicable to Common Shareholders(c) | | | | | | | | | | | | | | | | | | | | | | | | | | | | |
Based on net asset value | | | (1.60 | )%(d) | | | | | | | (0.37 | )% | | | 12.24 | % | | | 5.33 | % | | | 24.75 | % | | | (12.01 | )% |
| | | | | | | | | | | | | | | | | | | | | | | | | | | | |
Based on market price | | | (9.06 | )%(d) | | | | | | | (4.13 | )% | | | 26.61 | % | | | 7.00 | % | | | 18.80 | % | | | (20.82 | )% |
| | | | | | | | | | | | | | | | | | | | | | | | | | | | |
| | | | | | | |
Ratios to Average Net Assets Applicable to Common Shareholders | | | | | | | | | | | | | | | | | | | | | | | | | | | | |
Total expenses | | | 2.43 | %(e) | | | | | | | 2.21 | % | | | 1.86 | % | | | 1.83 | % | | | 1.96 | % | | | 1.97 | % |
| | | | | | | | | | | | | | | | | | | | | | | | | | | | |
Total expenses after fees waived and/or reimbursed and paid indirectly | | | 2.43 | %(e) | | | | | | | 2.21 | % | | | 1.85 | % | | | 1.83 | % | | | 1.95 | % | | | 1.97 | % |
| | | | | | | | | | | | | | | | | | | | | | | | | | | | |
Total expenses after fees waived and/or reimbursed and paid indirectly and excluding interest expense, fees and amortization of offering costs(f) | | | 1.14 | %(e) | | | | | | | 1.12 | % | | | 1.23 | %(g) | | | 1.69 | %(g) | | | 1.78 | %(g) | | | 1.71 | %(g) |
| | | | | | | | | | | | | | | | | | | | | | | | | | | | |
Net investment income to Common Shareholders | | | 4.29 | %(e) | | | | | | | 4.60 | % | | | 4.83 | % | | | 5.25 | % | | | 5.76 | % | | | 5.68 | % |
| | | | | | | | | | | | | | | | | | | | | | | | | | | | |
| | | | | | | |
Supplemental Data | | | | | | | | | | | | | | | | | | | | | | | | | | | | |
Net assets applicable to Common Shareholders, end of period (000) | | $ | 75,450 | | | | | | | $ | 78,641 | | | $ | 82,927 | | | $ | 77,854 | | | $ | 78,304 | | | $ | 66,772 | |
| | | | | | | | | | | | | | | | | | | | | | | | | | | | |
VRDP Shares outstanding at $100,000 liquidation value, end of period (000) | | $ | 44,400 | | | | | | | $ | 44,400 | | | $ | 44,400 | | | $ | 44,400 | | | $ | 44,400 | | | $ | 44,400 | |
| | | | | | | | | | | | | | | | | | | | | | | | | | | | |
Asset coverage per VRDP Shares at $100,000 liquidation value, end of period | | $ | 269,933 | | | | | | | $ | 277,119 | | | $ | 286,771 | | | $ | 275,347 | | | $ | 276,360 | | | $ | 250,387 | |
| | | | | | | | | | | | | | | | | | | | | | | | | | | | |
Borrowings outstanding, end of period (000) | | $ | 7,817 | | | | | | | $ | 7,817 | | | $ | 8,061 | | | $ | 5,895 | | | $ | 5,725 | | | $ | 5,198 | |
| | | | | | | | | | | | | | | | | | | | | | | | | | | | |
Portfolio turnover rate | | | 6 | % | | | | | | | 14 | % | | | 17 | % | | | 20 | % | | | 21 | % | | | 30 | % |
| | | | | | | | | | | | | | | | | | | | | | | | | | | | |
| (a) | Based on average Common Shares outstanding. |
| (b) | Distributions for annual periods determined in accordance with U.S. federal income tax regulations. |
| (c) | Total returns based on market price, which can be significantly greater or less than the net asset value, may result in substantially different returns. Where applicable, excludes the effects of any sales charges and assumes the reinvestment of distributions at actual reinvestment prices. |
| (d) | Aggregate total return. |
| (f) | Interest expense, fees and amortization of offering costs related to TOBs and/or VRDP Shares. See Note 4 and Note 10 of the Notes to Financial Statements for details. |
| (g) | For the years ended August 31, 2016, August 31, 2015, August 31, 2014 and August 31, 2013, the total expense ratio after fees waived and/or reimbursed and paid indirectly and excluding interest expense, fees, amortization of offering costs, liquidity and remarketing fees was 1.16%, 1.13%, 1.15% and 1.14%, respectively. |
See notes to financial statements.
Financial Highlights (continued)
(For a share outstanding throughout each period)
| | | | | | | | | | | | | | | | | | | | | | | | | | | | |
| | | BHV | |
| | | Six Months Ended
02/28/2018
(unaudited) | | | | | | Year Ended August 31, | |
| | | | | 2017 | | | 2016 | | | 2015 | | | 2014 | | | 2013 | |
Net asset value, beginning of period | | $ | 15.75 | | | | | | | $ | 16.56 | | | $ | 15.90 | | | $ | 15.95 | | | $ | 14.03 | | | $ | 16.74 | |
| | | | | | | | | | | | | | | | | | | | | | | | | | | | |
Net investment income(a) | | | 0.36 | | | | | | | | 0.78 | | | | 0.81 | | | | 0.81 | | | | 0.83 | | | | 0.84 | |
Net realized and unrealized gain (loss) | | | (0.54 | ) | | | | | | | (0.83 | ) | | | 0.66 | | | | (0.01 | ) | | | 1.95 | | | | (2.64 | ) |
| | | | | | | | | | | | | | | | | | | | | | | | | | | | |
Net increase (decrease) from investment operations | | | (0.18 | ) | | | | | | | (0.05 | ) | | | 1.47 | | | | 0.80 | | | | 2.78 | | | | (1.80 | ) |
| | | | | | | | | | | | | | | | | | | | | | | | | | | | |
Distributions to Common Shareholders from net investment income(b) | | | (0.40 | ) | | | | | | | (0.76 | ) | | | (0.81 | ) | | | (0.85 | ) | | | (0.86 | ) | | | (0.91 | ) |
| | | | | | | | | | | | | | | | | | | | | | | | | | | | |
Net asset value, end of period | | $ | 15.17 | | | | | | | $ | 15.75 | | | $ | 16.56 | | | $ | 15.90 | | | $ | 15.95 | | | $ | 14.03 | |
| | | | | | | | | | | | | | | | | | | | | | | | | | | | |
Market price, end of period | | $ | 15.91 | | | | | | | $ | 18.68 | | | $ | 19.14 | | | $ | 16.70 | | | $ | 16.35 | | | $ | 14.91 | |
| | | | | | | | | | | | | | | | | | | | | | | | | | | | |
| | | | | | | |
Total Return Applicable to Common Shareholders(c) | | | | | | | | | | | | | | | | | | | | | | | | | | | | |
Based on net asset value | | | (1.28 | )%(d) | | | | | | | (0.44 | )% | | | 9.05 | % | | | 5.02 | % | | | 20.31 | % | | | (11.96 | )% |
| | | | | | | | | | | | | | | | | | | | | | | | | | | | |
Based on market price | | | (12.70 | )%(d) | | | | | | | 2.17 | % | | | 20.00 | % | | | 7.61 | % | | | 16.06 | % | | | (20.01 | )% |
| | | | | | | | | | | | | | | | | | | | | | | | | | | | |
| | | | | | | |
Ratios to Average Net Assets Applicable to Common Shareholders | | | | | | | | | | | | | | | | | | | | | | | | | | | | |
Total expenses | | | 2.73 | %(e) | | | | | | | 2.46 | % | | | 2.16 | % | | | 1.98 | % | | | 2.01 | % | | | 2.18 | % |
| | | | | | | | | | | | | | | | | | | | | | | | | | | | |
Total expenses after fees waived and/or reimbursed and paid indirectly | | | 2.52 | %(e) | | | | | | | 2.25 | % | | | 1.95 | % | | | 1.77 | % | | | 1.96 | % | | | 2.18 | % |
| | | | | | | | | | | | | | | | | | | | | | | | | | | | |
Total expenses after fees waived and/or reimbursed and paid indirectly and excluding interest expense, fees and amortization of offering costs(f) | | | 1.65 | %(e)(g) | | | | | | | 1.61 | %(g) | | | 1.70 | %(g) | | | 1.30 | %(g) | | | 1.38 | % | | | 1.58 | % |
| | | | | | | | | | | | | | | | | | | | | | | | | | | | |
Net investment income to Common Shareholders | | | 4.68 | %(e) | | | | | | | 4.95 | % | | | 5.00 | % | | | 5.08 | % | | | 5.52 | % | | | 5.18 | % |
| | | | | | | | | | | | | | | | | | | | | | | | | | | | |
| | | | | | | |
Supplemental Data | | | | | | | | | | | | | | | | | | | | | | | | | | | | |
Net assets applicable to Common Shareholders, end of period (000) | | $ | 24,309 | | | | | | | $ | 25,216 | | | $ | 26,462 | | | $ | 25,336 | | | $ | 25,373 | | | $ | 22,256 | |
| | | | | | | | | | | | | | | | | | | | | | | | | | | | |
VRDP Shares outstanding at $100,000 liquidation value, end of period (000) | | $ | 11,600 | | | | | | | $ | 11,600 | | | $ | 11,600 | | | $ | 11,600 | | | $ | 11,600 | | | $ | 11,600 | |
| | | | | | | | | | | | | | | | | | | | | | | | | | | | |
Asset coverage per VRDP Shares at $100,000 liquidation value, end of period | | $ | 309,557 | | | | | | | $ | 317,375 | | | $ | 328,121 | | | $ | 318,414 | | | $ | 318,733 | | | $ | 291,862 | |
| | | | | | | | | | | | | | | | | | | | | | | | | | | | |
Borrowings outstanding, end of period (000) | | $ | 4,360 | | | | | | | $ | 4,360 | | | $ | 3,860 | | | $ | 3,019 | | | $ | 3,019 | | | $ | 3,019 | |
| | | | | | | | | | | | | | | | | | | | | | | | | | | | |
Portfolio turnover rate | | | 10 | % | | | | | | | 10 | % | | | 6 | % | | | 9 | % | | | 11 | % | | | 8 | % |
| | | | | | | | | | | | | | | | | | | | | | | | | | | | |
| (a) | Based on average Common Shares outstanding. |
| (b) | Distributions for annual periods determined in accordance with U.S. federal income tax regulations. |
| (c) | Total returns based on market price, which can be significantly greater or less than the net asset value, may result in substantially different returns. Where applicable, excludes the effects of any sales charges and assumes the reinvestment of distributions at actual reinvestment prices. |
| (d) | Aggregate total return. |
| (f) | Interest expense, fees and amortization of offering costs related to TOBs and/or VRDP Shares. See Note 4 and Note 10 of the Notes to Financial Statements for details. |
| (g) | For the six months ended February 28, 2018 and the years ended August 31, 2017, August 31, 2016 and August 31, 2015, the total expense ratio after fees waived and/or reimbursed and paid indirectly and excluding interest expense, fees, amortization of offering costs, liquidity and remarketing fees was 1.27%, 1.22%, 1.30% and 1.23%, respectively. |
See notes to financial statements.
| | |
| 80 | | 2018 BLACKROCK SEMI-ANNUAL REPORTTO SHAREHOLDERS |
Notes to Financial Statements (unaudited)
The following are registered under the Investment Company Act of 1940, as amended (the “1940 Act”), as closed-end management investment companies and are referred to herein collectively as the “Trusts”, or individually as a “Trust”:
| | | | | | |
| Trust Name | | Herein Referred To As | | Organized | | Diversification
Classification |
BlackRock Maryland Municipal Bond Trust | | BZM | | Delaware | | Non-diversified |
BlackRock Massachusetts Tax-Exempt Trust | | MHE | | Massachusetts | | Non-diversified |
BlackRock MuniHoldings New York Quality Fund, Inc. | | MHN | | Maryland | | Non-diversified |
BlackRock New Jersey Municipal Bond Trust | | BLJ | | Delaware | | Non-diversified |
BlackRock New York Municipal Bond Trust | | BQH | | Delaware | | Diversified |
BlackRock New York Municipal Income Quality Trust | | BSE | | Delaware | | Non-diversified |
BlackRock New York Municipal Income Trust II | | BFY | | Delaware | | Non-diversified |
BlackRock Virginia Municipal Bond Trust | | BHV | | Delaware | | Non-diversified |
The Board of Directors and Boards of Trustees of the Trusts are collectively referred to throughout this report as the “Board of Trustees” or the “Board,” and the directors/trustees thereof are collectively referred to throughout this report as “Trustees”. The Trusts determine and make available for publication the net asset values (“NAVs”) of their Common Shares on a daily basis.
The Trusts, together with certain other registered investment companies advised by BlackRock Advisors, LLC (the “Manager”) or its affiliates, are included in a complex of closed-end funds referred to as the Closed-End Complex.
| 2. | SIGNIFICANT ACCOUNTING POLICIES |
The financial statements are prepared in conformity with accounting principles generally accepted in the United States of America (“U.S. GAAP”), which may require management to make estimates and assumptions that affect the reported amounts of assets and liabilities in the financial statements, disclosure of contingent assets and liabilities at the date of the financial statements and the reported amounts of increases and decreases in net assets from operations during the reporting period. Actual results could differ from those estimates. Each Trust is considered an investment company under U.S. GAAP and follows the accounting and reporting guidance applicable to investment companies. Below is a summary of significant accounting policies:
Investment Transactions and Income Recognition: For financial reporting purposes, investment transactions are recorded on the dates the transactions are entered into (the “trade dates”). Realized gains and losses on investment transactions are determined on the identified cost basis. Dividend income and non-cash dividend income are recorded on the ex-dividend date. Interest income, including amortization and accretion of premiums and discounts on debt securities, is recognized on an accrual basis.
Segregation and Collateralization: In cases where a Trust enters into certain investments (e.g., futures contracts) or certain borrowings (e.g., TOB Trust transactions) that would be treated as “senior securities” for 1940 Act purposes, a Trust may segregate or designate on its books and records cash or liquid assets having a market value at least equal to the amount of its future obligations under such investments or borrowings. Doing so allows the investment or borrowing to be excluded from treatment as a “senior security.” Furthermore, if required by an exchange or counterparty agreement, the Trusts may be required to deliver/deposit cash and/or securities to/with an exchange, or broker-dealer or custodian as collateral for certain investments or obligations.
Distributions: Distributions from net investment income are declared and paid monthly. Distributions of capital gains are distributed at least annually and are recorded on the ex-dividend dates. The character and timing of distributions are determined in accordance with U.S. federal income tax regulations, which may differ from U.S. GAAP.
Distributions to Preferred Shareholders are accrued and determined as described in Note 10.
Deferred Compensation Plan: Under the Deferred Compensation Plan (the “Plan”) approved by each Trust’s Board, the independent Trustees (“Independent Trustees”) may defer a portion of their annual complex-wide compensation. Deferred amounts earn an approximate return as though equivalent dollar amounts had been invested in common shares of certain other BlackRock Closed-End Funds selected by the Independent Trustees. This has the same economic effect for the Independent Trustees as if the Independent Trustees had invested the deferred amounts directly in certain other BlackRock Closed-End Funds.
The Plan is not funded and obligations thereunder represent general unsecured claims against the general assets of each Trust, if applicable. Deferred compensation liabilities are included in the trustees’ and officer’s fees payable in the Statements of Assets and Liabilities and will remain as a liability of the Trusts until such amounts are distributed in accordance with the Plan.
Recent Accounting Standards: In November 2016, the Financial Accounting Standards Board issued Accounting Standards Update “Restricted Cash” which will require entities to include the total of cash, cash equivalents, restricted cash, and restricted cash equivalents in the beginning and ending cash balances in the Statements of Cash Flows. The guidance will be applied retrospectively and is effective for fiscal years beginning after December 15, 2017, and interim periods within those years. Management is evaluating the impact, if any, of this guidance on the Trusts’ presentation in the Statements of Cash Flows.
In March 2017, the Financial Accounting Standards Board issued Accounting Standards Update “Premium Amortization of Purchased Callable Debt Securities” which amends the amortization period for certain purchased callable debt securities. Under the new guidance, the premium amortization of purchased callable debt securities that have explicit, non-contingent call features and are callable at fixed prices will be amortized to the earliest call date. The guidance will be applied on a modified
| | | | |
| NOTESTO FINANCIAL STATEMENTS | | | 81 | |
Notes to Financial Statements (unaudited) (continued)
retrospective basis and is effective for fiscal years, and their interim periods, beginning after December 15, 2018. Management is currently evaluating the impact of this guidance to the Trusts.
Indemnifications: In the normal course of business, a Trust enters into contracts that contain a variety of representations that provide general indemnification. A Trust’s maximum exposure under these arrangements is unknown because it involves future potential claims against a Trust, which cannot be predicted with any certainty.
Other: Expenses directly related to a Trust are charged to that Trust. Other operating expenses shared by several funds, including other funds managed by the Manager, are prorated among those funds on the basis of relative net assets or other appropriate methods.
| 3. | INVESTMENT VALUATION AND FAIR VALUE MEASUREMENTS |
Investment Valuation Policies: The Trusts’ investments are valued at fair value (also referred to as “market value” within the financial statements) as of the close of trading on the New York Stock Exchange (“NYSE”) (generally 4:00 p.m., Eastern time). U.S. GAAP defines fair value as the price the Trusts would receive to sell an asset or pay to transfer a liability in an orderly transaction between market participants at the measurement date. The Trusts determine the fair values of their financial instruments using various independent dealers or pricing services under policies approved by the Board of Trustees of each Trust (the “Board”). The BlackRock Global Valuation Methodologies Committee (the “Global Valuation Committee”) is the committee formed by management to develop global pricing policies and procedures and to oversee the pricing function for all financial instruments.
Fair Value Inputs and Methodologies: The following methods and inputs are used to establish the fair value of each Trust’s assets and liabilities:
| | • | | Municipal investments (including commitments to purchase such investments on a “when-issued” basis) are valued on the basis of prices provided by dealers or pricing services. In determining the value of a particular investment, pricing services may use certain information with respect to transactions in such investments, quotations from dealers, pricing matrixes, market transactions in comparable investments and information with respect to various relationships between investments. |
| | • | | Investments in open-end U.S. mutual funds are valued at NAV each business day. |
| | • | | Futures contracts traded on exchanges are valued at their last sale price. |
If events (e.g., a company announcement, market volatility or a natural disaster) occur that are expected to materially affect the value of such investments, or in the event that the application of these methods of valuation results in a price for an investment that is deemed not to be representative of the market value of such investment, or if a price is not available, the investment will be valued by the Global Valuation Committee, or its delegate, in accordance with a policy approved by the Board as reflecting fair value (“Fair Valued Investments”). The fair valuation approaches that may be used by the Global Valuation Committee will include market approach, income approach and cost approach. Valuation techniques such as discounted cash flow, use of market comparables and matrix pricing are types of valuation approaches and are typically used in determining fair value. When determining the price for Fair Valued Investments, the Global Valuation Committee, or its delegate, seeks to determine the price that each Trust might reasonably expect to receive or pay from the current sale or purchase of that asset or liability in an arm’s-length transaction. Fair value determinations shall be based upon all available factors that the Global Valuation Committee, or its delegate, deems relevant and consistent with the principles of fair value measurement. The pricing of all Fair Valued Investments is subsequently reported to the Board or a committee thereof on a quarterly basis.
Fair Value Hierarchy: Various inputs are used in determining the fair value of investments and derivative financial instruments. These inputs to valuation techniques are categorized into a fair value hierarchy consisting of three broad levels for financial statement purposes as follows:
| | • | | Level 1 — Unadjusted price quotations in active markets/exchanges for identical assets or liabilities that each Trust has the ability to access |
| | • | | Level 2 — Other observable inputs (including, but not limited to, quoted prices for similar assets or liabilities in markets that are active, quoted prices for identical or similar assets or liabilities in markets that are not active, inputs other than quoted prices that are observable for the assets or liabilities (such as interest rates, yield curves, volatilities, prepayment speeds, loss severities, credit risks and default rates) or other market–corroborated inputs) |
| | • | | Level 3 — Unobservable inputs based on the best information available in the circumstances, to the extent observable inputs are not available (including each Trust’s own assumptions used in determining the fair value of investments and derivative financial instruments) |
The hierarchy gives the highest priority to unadjusted quoted prices in active markets for identical assets or liabilities (Level 1 measurements) and the lowest priority to unobservable inputs (Level 3 measurements). Accordingly, the degree of judgment exercised in determining fair value is greatest for instruments categorized in Level 3. The inputs used to measure fair value may fall into different levels of the fair value hierarchy. In such cases, for disclosure purposes, the fair value hierarchy classification is determined based on the lowest level input that is significant to the fair value measurement in its entirety. Investments classified within Level 3 have significant unobservable inputs used by the Global Valuation Committee in determining the price for Fair Valued Investments. Level 3 investments include equity or debt issued by privately held companies or funds. There may not be a secondary market, and/or there are a limited number of investors. Level 3 investments may also be adjusted to reflect illiquidity and/or non-transferability, with the amount of such discount estimated by the Global Valuation Committee in the absence of market information.
Changes in valuation techniques may result in transfers into or out of an assigned level within the hierarchy. In accordance with each Trust’s policy, transfers between different levels of the fair value hierarchy are deemed to have occurred as of the beginning of the reporting period. The categorization of a value determined for investments and derivative financial instruments is based on the pricing transparency of the investments and derivative financial instruments and is not necessarily an indication of the risks associated with investing in those securities.
| | |
| 82 | | 2018 BLACKROCK SEMI-ANNUAL REPORTTO SHAREHOLDERS |
Notes to Financial Statements (unaudited) (continued)
| 4. | SECURITIES AND OTHER INVESTMENTS |
Zero-Coupon Bonds: Zero-coupon bonds are normally issued at a significant discount from face value and do not provide for periodic interest payments. These bonds may experience greater volatility in market value than other debt obligations of similar maturity which provide for regular interest payments.
Forward Commitments and When-Issued Delayed Delivery Securities: Certain trusts may purchase securities on a when-issued basis and may purchase or sell securities on a forward commitment basis. Settlement of such transactions normally occurs within a month or more after the purchase or sale commitment is made. A trust may purchase securities under such conditions with the intention of actually acquiring them, but may enter into a separate agreement to sell the securities before the settlement date. Since the value of securities purchased may fluctuate prior to settlement, a trust may be required to pay more at settlement than the security is worth. In addition, a trust is not entitled to any of the interest earned prior to settlement. When purchasing a security on a delayed delivery basis, a trust assumes the rights and risks of ownership of the security, including the risk of price and yield fluctuations. In the event of default by the counterparty, a trust’s maximum amount of loss is the unrealized appreciation of unsettled when-issued transactions.
Municipal Bonds Transferred to TOB Trusts: Certain trusts leverage their assets through the use of “TOB Trust” transactions. The trusts transfer municipal bonds into a special purpose trust (a “TOB Trust”). A TOB Trust issues two classes of beneficial interests: short-term floating rate interests (“TOB Trust Certificates”), which are sold to third party investors, and residual inverse floating rate interests (“TOB Residuals”), which are issued to the participating trusts that contributed the municipal bonds to the TOB Trust. The TOB Trust Certificates have interest rates that reset weekly and their holders have the option to tender such certificates to the TOB Trust for redemption at par and any accrued interest at each reset date. The TOB Residuals held by a trust provide the trust with the right to cause the holders of a proportional share of the TOB Trust Certificates to tender their certificates to the TOB Trust at par plus accrued interest. The trusts may withdraw a corresponding share of the municipal bonds from the TOB Trust. Other funds managed by the investment adviser may also contribute municipal bonds to a TOB Trust into which a trust has contributed bonds. If multiple BlackRock-advised funds participate in the same TOB Trust, the economic rights and obligations under the TOB Residuals will be shared among the funds ratably in proportion to their participation in the TOB Trust.
TOB Trusts are supported by a liquidity facility provided by a third party bank or other financial institution (the “Liquidity Provider”) that allows the holders of the TOB Trust Certificates to tender their certificates in exchange for payment of par plus accrued interest on any business day. The tendered TOB Trust Certificates are remarketed by a Remarketing Agent. In the event of a failed remarketing, the TOB Trust may draw upon a loan from the Liquidity Provider to purchase the tendered TOB Trust Certificates. Any loans made by the Liquidity Provider will be secured by the purchased TOB Trust Certificates held by the TOB Trust and will be subject to an increased interest rate based on number of days the loan is outstanding.
The TOB Trust may be collapsed without the consent of a trust, upon the occurrence of a termination event as defined in the TOB Trust agreement. Upon the occurrence of a termination event, a TOB Trust would be liquidated with the proceeds applied first to any accrued fees owed to the trustee of the TOB Trust, the Remarketing Agent and the Liquidity Provider. Upon certain termination events, TOB Trust Certificates holders will be paid before the TOB Residuals holders (i.e., the Trusts) whereas in other termination events, TOB Trust Certificates holders and TOB Residuals holders will be paid pro rata.
While a trust’s investment policies and restrictions expressly permit investments in inverse floating rate securities, such as TOB Residuals, they restrict the ability of a trust to borrow money for purposes of making investments. MHE’s management believes that the trust’s restrictions on borrowings do not apply to the trust’s TOB Trust transactions. Each trust’s transfer of the municipal bonds to a TOB Trust is considered a secured borrowing for financial reporting purposes. The cash received by the TOB Trust from the sale of the TOB Trust Certificates, less certain transaction expenses, is paid to a trust. A trust typically invests the cash received in additional municipal bonds.
Accounting for TOB Trusts: The municipal bonds deposited into a TOB Trust are presented in a trust’s Schedule of Investments and the TOB Trust Certificates are shown in Other Liabilities in the Statements of Assets and Liabilities. Any loans drawn by the TOB Trust pursuant to the liquidity facility to purchase tendered TOB Trust Certificates are shown as Loan for TOB Trust Certificates. The carrying amount of a trust’s payable to the holder of the TOB Trust Certificates, as reported in the Statements of Assets and Liabilities as TOB Trust Certificates, approximates its fair value.
Interest income, including amortization and accretion of premiums and discounts, from the underlying municipal bonds is recorded by a trust on an accrual basis. Interest expense incurred on the TOB Trust transaction and other expenses related to remarketing, administration, trustee, liquidity and other services to a TOB Trust are shown as interest expense, fees and amortization of offering costs in the Statements of Operations. Fees paid upon creation of the TOB Trust are recorded as debt issuance costs and are amortized to interest expense, fees and amortization of offering costs in the Statements of Operations to the expected maturity of the TOB Trust. In connection with the restructurings of the TOB Trusts to non-bank sponsored TOB Trusts, a trust incurred non-recurring, legal and restructuring fees, which are recorded as interest expense, fees and amortization of deferred offering costs in the Statements of Operations. Amounts recorded within interest expense, fees and amortization of offering costs in the Statements of Operations are:
| | | | | | | | | | | | | | | | |
| | | Interest Expense | | | Liquidity Fees | | | Other Expenses | | | Total | |
BZM | | $ | 11,467 | | | $ | 2,782 | | | $ | 1,087 | | | $ | 15,336 | |
MHE | | | 8,010 | | | | 3,196 | | | | 992 | | | | 12,198 | |
MHN | | | 376,052 | | | | 157,141 | | | | 55,968 | | | | 589,161 | |
BLJ | | | 33,681 | | | | 12,192 | | | | 6,925 | | | | 52,798 | |
BQH | | | 35,178 | | | | 14,663 | | | | 5,451 | | | | 55,292 | |
BSE | | | 110,216 | | | | 49,023 | | | | 15,241 | | | | 174,480 | |
BFY | | | 41,981 | | | | 18,333 | | | | 4,765 | | | | 65,079 | |
BHV | | | 23,073 | | | | 10,443 | | | | 2,609 | | | | 36,125 | |
| | | | |
| NOTESTO FINANCIAL STATEMENTS | | | 83 | |
Notes to Financial Statements (unaudited) (continued)
For the six months ended February 28, 2018, the following table is a summary of each Trust’s TOB Trusts:
| | | | | | | | | | | | | | | | | | | | |
| | | Underlying
Municipal Bonds
Transferred to
TOB Trusts (a) | | | Liability for
TOB Trust
Certificates (b) | | | Range of Interest Rates
on TOB Trust
Certificates at
Period End | | | Average
TOB Trust
Certificates
Outstanding | | | Daily Weighted
Average Rate
of Interest and
Other Expenses
on TOB Trusts | |
BZM | | $ | 4,464,130 | | | $ | 2,134,375 | | | | 1.12% - 1.13 | % | | $ | 2,134,375 | | | | 1.45 | % |
MHE | | | 2,591,820 | | | | 1,635,858 | | | | 1.11 - 1.13 | | | | 1,498,067 | | | | 1.64 | |
MHN | | | 133,575,624 | | | | 70,007,186 | | | | 1.11 - 1.24 | | | | 70,007,186 | | | | 1.70 | |
BLJ | | | 11,174,653 | | | | 6,015,711 | | | | 1.09 - 1.29 | | | | 6,086,883 | | | | 1.74 | |
BQH | | | 11,126,789 | | | | 6,521,464 | | | | 1.11 - 1.24 | | | | 6,521,464 | | | | 1.71 | |
BSE | | | 37,462,723 | | | | 20,604,151 | | | | 1.11 - 1.24 | | | | 20,604,151 | | | | 1.71 | |
BFY | | | 13,711,910 | | | | 7,816,903 | | | | 1.11 - 1.24 | | | | 7,816,903 | | | | 1.68 | |
BHV | | | 7,744,925 | | | | 4,360,368 | | | | 1.11 - 1.12 | | | | 4,360,368 | | | | 1.67 | |
| | (a) | The municipal bonds transferred to a TOB Trust are generally high grade municipal bonds. In certain cases, when municipal bonds transferred are lower grade municipal bonds, the TOB Trust transaction may include a credit enhancement feature that provides for the timely payment of principal and interest on the bonds to the TOB Trust by a credit enhancement provider in the event of default of the municipal bond. The TOB Trust would be responsible for the payment of the credit enhancement fee and the trusts, as TOB Residuals holders, would be responsible for reimbursement of any payments of principal and interest made by the credit enhancement provider. The maximum potential amounts owed by the trusts, for such reimbursements, as applicable, are included in the maximum potential amounts disclosed for recourse TOB Trusts. | |
| | (b) | TOB Trusts may be structured on a non-recourse or recourse basis. When a Trust invests in TOB Trusts on a non-recourse basis, the Liquidity Provider may be required to make a payment under the liquidity facility to allow the TOB Trust to repurchase TOB Trust Certificates. The Liquidity Provider will be reimbursed from the liquidation of bonds held in the TOB Trust. If a trust invests in a TOB Trust on a recourse basis, the trust enters into a reimbursement agreement with the Liquidity Provider where a trust is required to reimburse the Liquidity Provider for any shortfall between the amount paid by the Liquidity Provider and proceeds received from liquidation of municipal bonds held in the TOB Trust (the “Liquidation Shortfall”). As a result, if a trust invests in a recourse TOB Trust, a trust will bear the risk of loss with respect to any Liquidation Shortfall. If multiple funds participate in any such TOB Trust, these losses will be shared ratably, including the maximum potential amounts owed by a trust at February 28, 2018, in proportion to their participation in the TOB Trust. The recourse TOB Trusts are identified in the Schedules of Investments including the maximum potential amounts owed a trust at February 28, 2018. | |
For the six months ended February 28, 2018, the following table is a summary of each Trust’s Loan for TOB Trust Certificates:
| | | | | | | | | | | | | | | | |
| | | Loan
Outstanding
at Period End | | | Interest Rate
on Loan at Period End | | | Average
Loans
Outstanding | | | Daily Weighted
Average Rate
of Interest and
Other Expenses
on Loans | |
BLJ | | $ | 99,820 | | | | 0.25 | % | | $ | 28,648 | | | | 0.75 | % |
| 5. | DERIVATIVE FINANCIAL INSTRUMENTS |
The Trusts engage in various portfolio investment strategies using derivative contracts both to increase the returns of the Trusts and/or to manage their exposure to certain risks such as credit risk, equity risk, interest rate risk, foreign currency exchange rate risk, commodity price risk or other risks (e.g., inflation risk). Derivative financial instruments categorized by risk exposure are included in the Schedules of Investments. These contracts may be transacted on an exchange or over-the-counter (“OTC”).
Futures Contracts: Futures contracts are purchased or sold to gain exposure to, or manage exposure to, changes in interest rates (interest rate risk), changes in the value of equity securities (equity risk) or foreign currencies (foreign currency exchange rate risk).
Futures contracts are agreements between the Trusts and a counterparty to buy or sell a specific quantity of an underlying instrument at a specified price and on a specified date. Depending on the terms of a contract, it is settled either through physical delivery of the underlying instrument on the settlement date or by payment of a cash amount on the settlement date. Upon entering into a futures contract, the Trusts are required to deposit initial margin with the broker in the form of cash or securities in an amount that varies depending on a contract’s size and risk profile. The initial margin deposit must then be maintained at an established level over the life of the contract.
Securities deposited as initial margin are designated in the Schedules of Investments and cash deposited, if any, is shown as cash pledged for futures contracts in the Statements of Assets and Liabilities. Pursuant to the contract, the Trusts agree to receive from or pay to the broker an amount of cash equal to the daily fluctuation in market value of the contract (“variation margin”). Variation margin is recorded as unrealized appreciation (depreciation) and, if any, shown as variation margin receivable (or payable) on futures contracts in the Statements of Assets and Liabilities. When the contract is closed, a realized gain or loss is recorded in the Statements of Operations equal to the difference between the notional value of the contract at the time it was opened and the notional value at the time it was closed. The use of futures contracts involves the risk of an imperfect correlation in the movements in the price of futures contracts and interest, foreign currency exchange rates or underlying assets.
| 6. | INVESTMENT ADVISORY AGREEMENT AND OTHER TRANSACTIONS WITH AFFILIATES: |
The PNC Financial Services Group, Inc. is the largest stockholder and an affiliate of BlackRock, Inc. (“BlackRock”) for 1940 Act purposes.
Investment Advisory: Each Trust entered into an Investment Advisory Agreement with the Manager, the Trusts’ investment adviser, an indirect, wholly-owned subsidiary of BlackRock, to provide investment advisory services. The Manager is responsible for the management of each Trust’s portfolio and provides the personnel, facilities, equipment and certain other services necessary to the operations of each Trust.
| | |
| 84 | | 2018 BLACKROCK SEMI-ANNUAL REPORTTO SHAREHOLDERS |
Notes to Financial Statements (unaudited) (continued)
For such services, each Trust, except for MHE and MHN, pays the Manager a monthly fee, at an annual rate equal to a percentage of each Trust’s average weekly managed assets. For such services, MHE and MHN each pays the Manager a monthly fee, at an annual rate equal to a percentage of each Trust’s average daily net assets. The Trusts pay their respective fees based on the following annual rates:
| | | | | | | | | | | | | | | | | | | | | | | | | | | | | | | | |
| | | BZM | | | MHE | | | MHN | | | BLJ | | | BQH | | | BSE | | | BFY | | | BHV | |
Investment advisory fee | | | 0.65 | % | | | 0.50 | % | | | 0.55 | % | | | 0.65 | % | | | 0.65 | % | | | 0.55 | % | | | 0.55 | % | | | 0.65 | % |
For purposes of calculating these fees, “net assets” mean the total assets of each Trust minus the sum of its accrued liabilities (which does not include liabilities represented by TOB Trusts and the liquidation preference of any outstanding preferred shares). It is understood that the liquidation preference of any outstanding preferred shares (other than accumulated dividends) and TOB Trusts is not considered a liability in determining a Trust’s NAV. For purposes of calculating these fees, “managed assets” mean the total assets of the Trust minus the sum of its accrued liabilities (other than the aggregate indebtedness constituting financial leverage).
Expense Limitations and Waivers: With respect to BZM, BQH and BHV, the Manager voluntarily agreed to waive and/or reimburse fees or expenses in order to limit expenses, excluding interest expense, dividend expense, tax expense, acquired fund fees and expenses, and certain other fund expenses, which constitute extraordinary expenses not incurred in the ordinary course of each Trust’s business (“expense limitation”). The expense limitations as a percentage of average weekly managed assets are as follows:
| | | | | | | | | | | | |
| | | BZM | | | BQH | | | BHV | |
Fee waived | | | 0.05 | % | | | 0.10 | % | | | 0.13 | % |
The Manager, for MHN, voluntarily agreed to waive its investment advisory fee on the proceeds of the Preferred Shares and TOB Trusts that exceed 35% of total assets minus the sum of its accrued liabilities (which does not include liabilities represented by TOB Trusts and the liquidation preference of any outstanding preferred shares). These amounts are included in fees waived and/or reimbursed by the Manager in the Statements of Operations. For the six months ended February 28, 2018, waivers were as follows:
| | | | | | | | | | | | | | | | |
| | | BZM | | | MHN | | | BQH | | | BHV | |
Amounts waived | | $ | 12,351 | | | $ | 180,057 | | | $ | 36,289 | | | $ | 26,287 | |
With respect to each Trust, the Manager voluntarily agreed to waive its investment advisory fees by the amount of investment advisory fees each Trust pays to the Manager indirectly through its investment in affiliated money market funds (the “affiliated money market fund waiver”). The amount of waivers and/or reimbursements of fees and expenses made pursuant to the expense limitation will be reduced by the amount of the affiliated money market fund waiver. These amounts are included in fees waived and/or reimbursed by the Manager in the Statements of Operations. For the six months ended February 28, 2018, the amounts waived were as follows:
| | | | | | | | | | | | | | | | | | | | | | | | | | | | | | | | |
| | | BZM | | | MHE | | | MHN | | | BLJ | | | BQH | | | BSE | | | BFY | | | BHV | |
Amounts waived | | | $54 | | | $ | 111 | | | $ | 2,291 | | | $ | 22 | | | $ | 248 | | | $ | 497 | | | $ | 421 | | | $ | 45 | |
The Manager contractually agreed to waive its investment advisory fee with respect to any portion of each Trust’s assets invested in affiliated equity and fixed-income mutual funds and affiliated exchange-traded funds that have a contractual management fee through June 30, 2018. The agreement can be renewed for annual periods thereafter, and may be terminated on 90 days’ notice, each subject to approval by a majority of the Trusts’ Independent Trustees. For the six months ended February 28, 2018, there were no fees waived by the Manager.
Trustees and Officers: Certain trustees and/or officers of the Trusts are directors and/or officers of BlackRock or its affiliates. The Trusts reimburse the Manager for a portion of the compensation paid to the Trusts’ Chief Compliance Officer, which is included in Trustees and Officer in the Statements of Operations.
For the six months ended February 28, 2018, purchases and sales of investments, excluding short-term securities, were as follows:
| | | | | | | | | | | | | | | | | | | | | | | | | | | | | | | | |
| | | BZM | | | MHE | | | MHN | | | BLJ | | | BQH | | | BSE | | | BFY | | | BHV | |
Purchases | | $ | 1,582,184 | | | $ | 3,101,138 | | | $ | 45,468,577 | | | $ | 1,469,910 | | | $ | 2,634,774 | | | $ | 10,066,046 | | | $ | 7,784,257 | | | $ | 4,133,300 | |
Sales | | | 1,755,509 | | | | 3,405,998 | | | | 46,548,946 | | | | 2,678,835 | | | | 2,659,774 | | | | 9,327,037 | | | | 7,982,665 | | | | 4,327,467 | |
It is each Trust’s policy to comply with the requirements of the Internal Revenue Code of 1986, as amended, applicable to regulated investment companies, and to distribute substantially all of their taxable income to their shareholders. Therefore, no U.S. federal income tax provision is required.
Each Trust files U.S. federal and various state and local tax returns. No income tax returns are currently under examination. The statute of limitations on each Trust’s U.S. federal tax returns generally remains open for each of the four years ended August 31, 2017. The statutes of limitations on each Trust’ state and local tax returns may remain open for an additional year depending upon the jurisdiction.
Management has analyzed tax laws and regulations and their application to the Trusts as of February 28, 2018, inclusive of the open tax return years, and does not believe that there are any uncertain tax positions that require recognition of a tax liability in the Trusts’ financial statements.
| | | | |
| NOTESTO FINANCIAL STATEMENTS | | | 85 | |
Notes to Financial Statements (unaudited) (continued)
As of August 31, 2017, the Trusts had capital loss carryforwards available to offset future realized capital gains through the indicated expiration dates as follows:
| | | | | | | | | | | | | | | | | | | | | | | | | | | | | | | | |
| Expires August 31, | | BZM | | | MHE | | | MHN | | | BLJ | | | BQH | | | BSE | | | BFY | | | BHV | |
No expiration date(a) | | $ | — | | | $ | 421,253 | | | $ | 17,199,043 | | | $ | 408,671 | | | $ | 1,190,209 | | | $ | 1,862,742 | | | $ | 1,545,537 | | | $ | 770,865 | |
2018 | | | — | | | | 32,672 | | | | 3,861,956 | | | | — | | | | — | | | | 1,544,362 | | | | 357,549 | | | | — | |
2019 | | | 8,953 | | | | 74 | | | | 673,531 | | | | — | | | | — | | | | — | | | | 255,001 | | | | 51,866 | |
| | | | | | | | | | | | | | | | | | | | | | | | | | | | | | | | |
| | $ | 8,953 | | | $ | 453,999 | | | $ | 21,734,530 | | | $ | 408,671 | | | $ | 1,190,209 | | | $ | 3,407,104 | | | $ | 2,158,087 | | | $ | 822,731 | |
| | | | | | | | | | | | | | | | | | | | | | | | | | | | | | | | |
| | (a) | Must be utilized prior to losses subject to expiration. | |
As of February 28, 2018, gross unrealized appreciation and depreciation for investments and derivatives based on cost for U.S. federal income tax purposes were as follows:
| | | | | | | | | | | | | | | | | | | | | | | | | | | | | | | | |
| | | BZM | | | MHE | | | MHN | | | BLJ | | | BQH | | | BSE | | | BFY | | | BHV | |
Tax cost | | $ | 45,456,673 | | | $ | 46,734,491 | | | $ | 655,366,874 | | | $ | 51,062,720 | | | $ | 60,311,535 | | | $ | 126,892,721 | | | $ | 111,607,509 | | | $ | 33,604,187 | |
| | | | | | | | | | | | | | | | | | | | | | | | | | | | | | | | |
Gross unrealized appreciation | | $ | 1,409,561 | | | $ | 2,894,445 | | | $ | 32,714,086 | | | $ | 3,594,351 | | | $ | 4,631,754 | | | $ | 7,192,808 | | | $ | 7,214,771 | | | $ | 1,907,141 | |
Gross unrealized depreciation | | | (166,829 | ) | | | (213,996 | ) | | | (3,405,299 | ) | | | (767,398 | ) | | | (376,846 | ) | | | (794,458 | ) | | | (555,425 | ) | | | (65,251 | ) |
| | | | | | | | | | | | | | | | | | | | | | | | | | | | | | | | |
Net unrealized appreciation | | $ | 1,242,732 | | | $ | 2,680,449 | | | $ | 29,308,787 | | | $ | 2,826,953 | | | $ | 4,254,908 | | | $ | 6,398,350 | | | $ | 6,659,346 | | | $ | 1,841,890 | |
| | | | | | | | | | | | | | | | | | | | | | | | | | | | | | | | |
Many municipalities insure repayment of their bonds, which may reduce the potential for loss due to credit risk. The market value of these bonds may fluctuate for other reasons, including market perception of the value of such insurance, and there is no guarantee that the insurer will meet its obligation.
Inventories of municipal bonds held by brokers and dealers may decrease, which would lessen their ability to make a market in these securities. Such a reduction in market making capacity could potentially decrease a Trust’s ability to buy or sell bonds. As a result, a Trust may sell a security at a lower price, sell other securities to raise cash, or give up an investment opportunity, any of which could have a negative impact on performance. If a Trust needed to sell large blocks of bonds, those sales could further reduce the bonds’ prices and impact performance.
In the normal course of business, certain Trusts invest in securities or other instruments and may enter into certain transactions, and such activities subject each Trust to various risks, including among others, fluctuations in the market (market risk) or failure of an issuer to meet all of its obligations. The value of securities or other instruments may also be affected by various factors, including, without limitation: (i) the general economy; (ii) the overall market as well as local, regional or global political and/or social instability; (iii) regulation, taxation or international tax treaties between various countries; or (iv) currency, interest rate and price fluctuations.
Each Trust may be exposed to prepayment risk, which is the risk that borrowers may exercise their option to prepay principal earlier than scheduled during periods of declining interest rates, which would force each Trust to reinvest in lower yielding securities. Each Trust may also be exposed to reinvestment risk, which is the risk that income from each Trust’s portfolio will decline if each Trust invests the proceeds from matured, traded or called fixed-income securities at market interest rates that are below each Trust portfolio’s current earnings rate.
The Trusts may hold a significant amount of bonds subject to calls by the issuers at defined dates and prices. When bonds are called by issuers and the Trusts reinvest the proceeds received, such investments may be in securities with lower yields than the bonds originally held, and correspondingly, could adversely impact the yield and total return performance of a Trust.
A Trust structures and “sponsors” the TOB Trusts in which it holds TOB Residuals and has certain duties and responsibilities, which may give rise to certain additional risks including, but not limited to, compliance, securities law and operational risks.
Should short-term interest rates rise, the Trusts’ investments in TOB Trusts may adversely affect the Trusts’ net investment income and dividends to Common Shareholders. Also, fluctuations in the market value of municipal bonds deposited into the TOB Trust may adversely affect the Trusts’ NAVs per share.
The SEC and various federal banking and housing agencies have adopted credit risk retention rules for securitizations (the “Risk Retention Rules”). The Risk Retention Rules would require the sponsor of a TOB Trust to retain at least 5% of the credit risk of the underlying assets supporting the TOB Trust’s municipal bonds. The Risk Retention Rules may adversely affect the Trust’s ability to engage in TOB Trust transactions or increase the costs of such transactions in certain circumstances
TOB Trusts constitute an important component of the municipal bond market. Any modifications or changes to rules governing TOB Trusts may adversely impact the municipal market and the Trusts, including through reduced demand for and liquidity of municipal bonds and increased financing costs for municipal issuers. The ultimate impact of any potential modifications on the TOB Trust market and the overall municipal market is not yet certain.
Counterparty Credit Risk: The Trusts may be exposed to counterparty credit risk, or the risk that an entity may fail to or be unable to perform on its commitments related to unsettled or open transactions. The Trusts manage counterparty credit risk by entering into transactions only with counterparties that the Manager believes have the financial resources to honor their obligations and by monitoring the financial stability of those counterparties. Financial assets, which potentially expose the Trusts to market, issuer and counterparty credit risks, consist principally of financial instruments and receivables due from counterparties. The extent of the Trusts’ exposure to market, issuer and counterparty credit risks with respect to these financial assets is approximately their value recorded in the Statements of Assets and Liabilities, less any collateral held by the Trusts.
A derivative contract may suffer a mark-to-market loss if the value of the contract decreases due to an unfavorable change in the market rates or values of the underlying instrument. Losses can also occur if the counterparty does not perform under the contract.
| | |
| 86 | | 2018 BLACKROCK SEMI-ANNUAL REPORTTO SHAREHOLDERS |
Notes to Financial Statements (unaudited) (continued)
With exchange-traded futures, there is less counterparty credit risk to the Trusts since the exchange or clearinghouse, as counterparty to such instruments, guarantees against a possible default. The clearinghouse stands between the buyer and the seller of the contract; therefore, credit risk is limited to failure of the clearinghouse. While offset rights may exist under applicable law, a Trust does not have a contractual right of offset against a clearing broker or clearinghouse in the event of a default (including the bankruptcy or insolvency). Additionally, credit risk exists in exchange-traded futures with respect to initial and variation margin that is held in a clearing broker’s customer accounts. While clearing brokers are required to segregate customer margin from their own assets, in the event that a clearing broker becomes insolvent or goes into bankruptcy and at that time there is a shortfall in the aggregate amount of margin held by the clearing broker for all its clients, typically the shortfall would be allocated on a pro rata basis across all the clearing broker’s customers, potentially resulting in losses to the Trusts.
Concentration Risk: Each Trust invests a substantial amount of its assets in issuers located in a single state or limited number of states. This may subject each Trust to the risk that economic, political or social issues impacting a particular state or group of states could have an adverse and disproportionate impact on the income from, or the value or liquidity of, the Trusts’ portfolios. Investment percentages in specific states or U.S. territories are presented in the Schedules of Investments.
As of period end, BZM and BHV invested a significant portion of their assets in securities in the health sector. MHE invested a significant portion of its assets in securities in the education sector. MHN and BLJ invested a significant portion of their assets in securities in the transportation sector. Changes in economic conditions affecting such sectors would have a greater impact on the Trusts and could affect the value, income and/or liquidity of positions in such securities.
Certain Trusts invest a significant portion of their assets in fixed-income securities and/or use derivatives tied to the fixed-income markets. Changes in market interest rates or economic conditions may affect the value and/or liquidity of such investments Interest rate risk is the risk that prices of bonds and other fixed-income securities will increase as interest rates fall and decrease as interest rates rise.
| 10. | CAPITAL SHARE TRANSACTIONS |
Each Trust, except for MHN, is authorized to issue an unlimited number of shares, all of which were initially classified as Common Shares. MHN is authorized to issue 200 million shares, all of which were initially classified as Common Shares. The par value for each Trust’s Common Shares is $0.001, except for MHE and MHN, which is $0.01 and $0.10, respectively. The par value for each Trust’s Preferred Shares outstanding is $0.001, except for MHE and MHN, which is $0.01 and $0.10 respectively. The Board is authorized, however, to reclassify any unissued Common Shares to Preferred Shares without the approval of Common Shareholders.
Common Shares
For the periods shown, shares issued and outstanding increased by the following amounts as a result of dividend reinvestment:
| | | | | | | | | | | | | | | | | | | | |
| | | BZM | | | MHE | | | BLJ | | | BFY | | | BHV | |
Six months ended February 28, 2018 | | | — | | | | 1,287 | | | | — | | | | 273 | | | | 1,483 | |
Year ended August 31, 2017 | | | 1,922 | | | | 1,915 | | | | 1,212 | | | | 1,924 | | | | 3,295 | |
For the six months ended February 28, 2018 and the year ended August 31, 2017, shares issued and outstanding remained constant for MHN, BQH and BSE.
Preferred Shares
Each Trust’s Preferred Shares rank prior to the Trust’s Common Shares as to the payment of dividends by the Trust and distribution of assets upon dissolution or liquidation of a Trust. The 1940 Act prohibits the declaration of any dividend on a Trust’s Common Shares or the repurchase of a Trust’s Common Shares if a Trust fails to maintain asset coverage of at least 200% of the liquidation preference of the Trust’s outstanding Preferred Shares. In addition, pursuant to the Preferred Shares’ governing instruments, a Trust is restricted from declaring and paying dividends on classes of shares ranking junior to or on parity with the Trust’s Preferred Shares or repurchasing such shares if a Trust fails to declare and pay dividends on the Preferred Shares, redeem any Preferred Shares required to be redeemed under the Preferred Shares’ governing instruments or comply with the basic maintenance amount requirement of the ratings agencies rating the Preferred Shares.
The holders of Preferred Shares have voting rights equal to the voting rights of the holders of Common Shares (one vote per share) and will vote together with holders of Common Shares (one vote per share) as a single class on certain matters. However, the holders of Preferred Shares, voting as a separate class, are also entitled to elect two Trustees to the Board of each Trust. The holders of Preferred Shares are also entitled to elect the full Board of Directors if dividends on the Preferred Shares are not paid for a period of two years. The holders of Preferred Shares are also generally entitled to a separate class vote to amend the Preferred Share governing documents. In addition, the 1940 Act requires the approval of the holders of a majority of any outstanding Preferred Shares, voting as a separate class, to (a) adopt any plan of reorganization that would adversely affect the Preferred Shares, (b) change a Trust’s sub-classification as a closed-end investment company or change its fundamental investment restrictions or (c) change its business so as to cease to be an investment company.
VRDP Shares
The VRDP Trusts have issued Series W-7 VRDP Shares, $100,000 liquidation preference per share, in privately negotiated offerings. The VRDP Shares were offered to qualified institutional buyers as defined pursuant to Rule 144A under the Securities Act of 1933, as amended (the “Securities Act”). The VRDP Shares include a liquidity feature and VRDP Shares of certain Trusts are currently in a special rate period, each as described below.
| | | | |
| NOTESTO FINANCIAL STATEMENTS | | | 87 | |
Notes to Financial Statements (unaudited) (continued)
As of period end, the VRDP Shares outstanding of each Trust were as follows:
| | | | | | | | | | | | | | | | |
| | | Issue
Date | | | Shares
Issued | | | Aggregate
Principal | | | Maturity
Date | |
BZM | | | 06/14/12 | | | | 160 | | | $ | 16,000,000 | | | | 07/01/42 | |
MHE | | | 06/14/12 | | | | 185 | | | | 18,500,000 | | | | 07/01/42 | |
MHN | | | 06/30/11 | | | | 2,436 | | | | 243,600,000 | | | | 07/01/41 | |
BLJ | | | 06/14/12 | | | | 187 | | | | 18,700,000 | | | | 07/01/42 | |
BQH | | | 09/15/11 | | | | 221 | | | | 22,100,000 | | | | 10/01/41 | |
BSE | | | 09/15/11 | | | | 405 | | | | 40,500,000 | | | | 10/01/41 | |
BFY | | | 09/15/11 | | | | 444 | | | | 44,400,000 | | | | 10/01/41 | |
BHV | | | 06/14/12 | | | | 116 | | | | 11,600,000 | | | | 07/01/42 | |
Redemption Terms: Each VRDP Trust is required to redeem its VRDP Shares on the maturity date, unless earlier redeemed or repurchased. Six months prior to the maturity date, each Trust is required to begin to segregate liquid assets with the Trust’s custodian to fund the redemption. In addition, each Trust is required to redeem certain of its outstanding VRDP Shares if it fails to comply with certain asset coverage, basic maintenance amount or leverage requirements.
Subject to certain conditions, the VRDP Shares may also be redeemed, in whole or in part, at any time at the option of each Trust. The redemption price per VRDP Share is equal to the liquidation preference per share plus any outstanding unpaid dividends.
Liquidity Feature: Each Trust entered into a fee agreement with the liquidity provider that requires an upfront commitment and a per annum liquidity fee payable to the liquidity provider. These fees, if applicable, are shown as liquidity fees in the Statements of Operations.
The fee agreement between each Trust and the liquidity provider is set to expire, unless renewed or terminated in advance, as follows:
| | | | | | | | | | | | | | | | | | | | | | | | | | | | | | | | |
| | | BZM | | | MHE | | | MHN | | | BLJ | | | BQH | | | BSE | | | BFY | | | BHV | |
Expiration Date | | | 07/05/18 | | | | 07/05/18 | | | | 04/15/20 | | | | 07/05/18 | | | | 10/22/18 | | | | 10/22/18 | | | | 10/22/18 | | | | 07/05/18 | |
In the event a Trust’s fee agreement is not renewed or is terminated in advance, and that Trust does not enter into a fee agreement with an alternate liquidity provider, the VRDP Shares will be subject to mandatory purchase by the liquidity provider prior to the termination of the fee agreement. In the event of such mandatory purchase, the Trust is required to redeem the VRDP Shares six months after the purchase date. Immediately after such mandatory purchase, the Trust is required to begin to segregate liquid assets with its custodian to fund the redemption. There is no assurance the Trust will replace such redeemed VRDP Shares with any other preferred shares or other form of leverage.
Remarketing: MHE, MHN, BLJ, BQH, BSE and BFY may incur remarketing fees of 0.10% on the aggregate principal amount of the Trust’s VRDP Shares and BZM and BHV may incur remarketing fees of 0.07% on the aggregate principal amount of the Trust’s VRDP Shares, which, if any, are included in remarketing fees on Preferred Shares in the Statements of Operations. During any special rate period (as described below), the VRDP Trusts may incur no remarketing fees.
Dividends: Dividends on the VRDP Shares are payable monthly at a variable rate set weekly by the remarketing agent. Such dividend rates are generally based upon a spread over a base rate and cannot exceed a maximum rate. In the event of a failed remarketing, the dividend rate of the VRDP Shares will be reset to a maximum rate. The maximum rate is determined based on, among other things, the long-term preferred share rating assigned to the VRDP Shares and the length of time that the VRDP Shares fail to be remarketed. At the date of issuance, the VRDP Shares were assigned long-term ratings of Aaa from Moody’s and AAA from Fitch. Subsequent to the issuance of the VRDP Shares, Moody’s completed a review of its methodology for rating securities issued by registered closed-end funds. As of period end, the VRDP Shares were assigned a long-term rating of Aa2 for BZM, BQH, MHN, BLJ, BSE, BFY and BHV and Aa3 for MHE from Moody’s under its new ratings methodology. The VRDP Shares continue to be assigned a long-term rating of AAA from Fitch.
For the six months ended February 28, 2018, the annualized dividend rates for the VRDP Shares were as follows:
| | | | | | | | | | | | | | | | | | | | | | | | | | | | | | | | |
| | | BZM | | | MHE | | | MHN | | | BLJ | | | BQH | | | BSE | | | BFY | | | BHV | |
Rate | | | 1.26 | % | | | 1.88 | % | | | 1.90 | % | | | 1.88 | % | | | 1.92 | % | | | 1.92 | % | | | 1.92 | % | | | 1.20 | % |
Ratings: The short-term ratings on the VRDP Shares are directly related to the short-term ratings of the liquidity provider for such VRDP Shares. Changes in the credit quality of the liquidity provider could cause a change in the short-term credit ratings of the VRDP Shares as rated by Moody’s, Fitch and/or S&P. A change in the short-term credit rating of the liquidity provider or the VRDP Shares may adversely affect the dividend rate paid on such shares, although the dividend rate paid on the VRDP Shares is not directly based upon either short-term rating. As of period end, the short-term ratings of the liquidity provider and the VRDP Shares for BZM and BHV were P1/F1 as rated by Moody’s, Fitch and/or S&P, respectively, which is within the two highest rating categories.
Special Rate Period: Upon issuance of the VRDP Shares on June 14, 2012, MHE and BLJ commenced a three-year term ending June 24, 2015 (“special rate period”) with respect to their VRDP Shares. The special rate period for MHE and BLJ has been extended each year for an additional one-year term and is currently scheduled to expire on June 20, 2018.
On April 17, 2014, MHN commenced a three-year special rate period ending April 19, 2017 with respect to its VRDP Shares. The special rate period for MHN was extended for an additional three-year term and is currently scheduled to expire on April 15, 2020.
| | |
| 88 | | 2018 BLACKROCK SEMI-ANNUAL REPORTTO SHAREHOLDERS |
Notes to Financial Statements (unaudited) (continued)
On October 22, 2015, BQH, BSE and BFY commenced a three-year special rate period ending April 18, 2018 with respect to their VRDP Shares. The implementation of the special rate period resulted in a mandatory tender of the VRDP Shares prior to the commencement of the special rate period. The mandatory tender event was not the result of a failed remarketing. The short-term ratings on the VRDP Shares for BQH, BSE and BFY were withdrawn by Moody’s, Fitch and/or S&P at the commencement of the special rate period. The special rate period for BQH, BSE and BFY has been extended each year for an additional one-year term and is currently scheduled to expire on April 17, 2019.
Prior to their respective expiration date, a Trust and the holders of their VRDP Shares may mutually agree to extend the special rate period. If the special rate period is not extended, the VRDP Shares will revert to remarketable securities upon the termination of the special rate period and will be remarketed and available for purchase by qualified institutional investors. Short-term ratings may be re-assigned upon the termination of the special rate period when the VRDP Shares revert back to remarketable securities.
During the special rate period, the liquidity and fee agreements will remain in effect and the VRDP Shares will remain subject to mandatory redemption by the Trusts on the maturity date. The VRDP Shares will not be remarketed or subject to optional or mandatory tender events during the special rate period. During the special rate period, the Trusts will be required to comply with the same asset coverage, basic maintenance amount and leverage requirements for the VRDP Shares as is required when the VRDP Shares are not in a special rate period. The Trusts will not pay any fees to the liquidity provider and remarketing agent during the special rate period, except MHN which pays 0.01%. The Trusts will also pay dividends monthly based on the sum of the Securities Industry and Financial Markets Association (“SIFMA”) Municipal Swap Index rate and a percentage per annum based on the long-term ratings assigned to the VRDP Shares.
If the Trusts redeem the VRDP Shares prior to end of the special rate period and the VRDP Shares have long-term ratings above A1/A+ and its equivalent by all ratings agencies then rating the VRDP Shares, then such redemption may be subject to a redemption premium payable to the holder of the VRDP Shares based on the time remaining in the special rate period, subject to certain exceptions for redemptions that are required to comply with minimum asset coverage requirements.
For the six months ended February 28, 2018, VRDP Shares issued and outstanding of each Trust remained constant.
Offering Costs: The Trusts incurred costs in connection with the issuance of VRDP Shares, which were recorded as a direct deduction from the carrying value of the related debt liability and will be amortized over the life of the VRDP Shares with the exception of upfront fees paid to the liquidity provider which were amortized over the life of the liquidity agreement. Amortization of these costs is included in interest expense, fees and amortization of offering costs in the Statements of Operations.
Financial Reporting: The VRDP Shares are considered debt of the issuer; therefore, the liquidation preference, which approximates fair value of the VRDP Shares, is recorded as a liability in the Statements of Assets and Liabilities net of deferred offering costs. Unpaid dividends are included in interest expense and fees payable in the Statements of Assets and Liabilities, and the dividends accrued and paid on the VRDP Shares are included as a component of interest expense, fees and amortization of offering costs in the Statements of Operations. The VRDP Shares are treated as equity for tax purposes. Dividends paid to holders of the VRDP Shares are generally classified as tax-exempt income for tax-reporting purposes. Dividends and amortization of deferred offering costs on VRDP Shares are included in interest expense, fees and amortization of offering costs in the Statements of Operations:
| | | | | | | | |
| | | Dividends
Accrued | | | Deferred
Offering Costs
Amortization | |
BZM | | $ | 101,746 | | | $ | 1,506 | |
MHE | | | 175,319 | | | | 1,654 | |
MHN | | | 2,328,357 | | | | 7,658 | |
BLJ | | | 177,213 | | | | 1,469 | |
BQH | | | 213,098 | | | | 2,892 | |
BSE | | | 390,520 | | | | 3,100 | |
BFY | | | 428,125 | | | | 3,139 | |
BHV | | | 70,136 | | | | 1,282 | |
Management’s evaluation of the impact of all subsequent events on the Trusts’ financial statements was completed through the date the financial statements were issued and the following items were noted:
At a joint special shareholder meeting held on March 28, 2018, the shareholders of BLJ, BlackRock New Jersey Municipal Income Trust and BlackRock MuniYield New Jersey Fund, Inc. approved the reorganizations, which are expected to occur on or about June 8, 2018.
| | | | |
| NOTESTO FINANCIAL STATEMENTS | | | 89 | |
Notes to Financial Statements (unaudited) (continued)
| | | | | | | | | | | | | | | | | | | | | | | | |
| | | Common Dividend
Per Share | | | | | | Preferred Shares (c) | |
| | | Paid (a) | | | Declared (b) | | | | | | Shares | | | Series | | | Declared | |
BZM | | $ | 0.0474 | | | $ | 0.0474 | | | | | | | | VRDP | | | | W-7 | | | $ | 19,603 | |
MHE | | | 0.0440 | | | | 0.0440 | | | | | | | | VRDP | | | | W-7 | | | | 34,390 | |
MHN | | | 0.0505 | | | | 0.0505 | | | | | | | | VRDP | | | | W-7 | | | | 454,364 | |
BLJ | | | 0.0615 | | | | 0.0615 | | | | | | | | VRDP | | | | W-7 | | | | 34,761 | |
BQH | | | 0.0460 | | | | 0.0460 | | | | | | | | VRDP | | | | W-7 | | | | 41,609 | |
BSE | | | 0.0465 | | | | 0.0465 | | | | | | | | VRDP | | | | W-7 | | | | 76,251 | |
BFY | | | 0.0490 | | | | 0.0490 | | | | | | | | VRDP | | | | W-7 | | | | 83,594 | |
BHV | | | 0.0630 | | | | 0.0630 | | | | | | | | VRDP | | | | W-7 | | | | 14,213 | |
| | (a) | Net investment income dividend paid on April 2, 2018 to Common Shareholders of record on March 15, 2018. | |
| | (b) | Net investment income dividend declared on April 2, 2018, payable to Common Shareholders of record on April 16, 2018. | |
| | (c) | Dividends declared for period March 1, 2018 to March 31, 2018. | |
| | |
| 90 | | 2018 BLACKROCK SEMI-ANNUAL REPORTTO SHAREHOLDERS |
Trustee and Officer Information
Richard E. Cavanagh, Chair of the Board and Trustee
Karen P. Robards, Vice Chair of the Board and Trustee
Michael J. Castellano, Trustee
Cynthia L. Egan, Trustee
Frank J. Fabozzi, Trustee
R. Glenn Hubbard, Trustee
W. Carl Kester, Trustee
Catherine A. Lynch, Trustee
Robert Fairbairn, Trustee
John M. Perlowski, Trustee, President and Chief Executive Officer
Jonathan Diorio, Vice President
Neal J. Andrews, Chief Financial Officer
Jay M. Fife, Treasurer
Charles Park, Chief Compliance Officer
Janey Ahn, Secretary
Effective December 31, 2017, Jerrold B. Harris retired as a Trustee of the Trusts.
Effective February 16, 2018, Barbara G. Novick resigned, and Robert Fairbairn was appointed, as an interested Trustee of the Trusts.
| | |
| Investment Adviser | | VRDP Liquidity Providers |
| BlackRock Advisors, LLC | | Bank of America, N.A.(a) |
| Wilmington, DE 19809 | | New York, NY 10036 |
| | |
| Accounting Agent and Custodian | | Citibank, N.A.(b) |
| State Street Bank and Trust Company | | New York, NY 10179 |
| Boston, MA 02111 | | |
| | |
| Transfer Agent | | Barclays Bank PLC.(c) |
| Computershare Trust Company, N.A. | | New York, NY 10019 |
| Canton, MA 02021 | | |
| | |
| VRDP Tender and Paying Agent | | Independent Registered Public Accounting Firm |
| The Bank of New York Mellon | | Deloitte & Touche LLP |
| New York, NY 10289 | | Boston, MA 02116 |
| | |
| | |
| VRDP Remarketing Agent | | Legal Counsel |
| Merrill Lynch, Pierce, Fenner & Smith Incorporated(a) | | Skadden, Arps, Slate, Meagher & Flom LLP |
| New York, NY 10036 | | Boston, MA 02116 |
| | |
| | |
| Citigroup Global Markets, Inc.(b) | | Address of the Trusts |
| New York, NY 10179 | | 100 Bellevue Parkway |
| | Wilmington, DE 19809 |
| | |
| Barclays Capital, Inc.(c) | | |
New York, NY 10019 | | |
| (b) | For BZM, MHE, BLJ and BHV. |
| (c) | For BQH, BSE and BFY. |
| | | | |
| TRUSTEEAND OFFICER INFORMATION | | | 91 | |
Additional Information
Proxy Results
At a joint special meeting of shareholders of BlackRock New Jersey Municipal Bond Trust (the “Trust”) held on Wednesday, March 28, 2018, Trust shareholders were asked to vote on the following proposals:
Common and Preferred Shareholders
Proposal 1(A). The common and preferred shareholders of the Trust were asked to vote as a single class on a proposal to approve an Agreement and Plan of Reorganization between the Trust and BlackRock MuniYield New Jersey Fund, Inc. and the transactions contemplated therein, including the termination of the Trust’s registration under the 1940 Act and the dissolution of the Trust in accordance with its Agreement and Declaration of Trust and Delaware law.
With respect to Proposal 1(A), the shares of the Trust were voted as follows:
| | | | |
| For | | Against | | Abstain |
| 1,167,949 | | 38,146 | | 56,092 |
Preferred Shareholders
Proposal 1(B). The preferred shareholders of the Trust were asked to vote as a separate class on a proposal to approve an Agreement and Plan of Reorganization between the Trust and BlackRock MuniYield New Jersey Fund, Inc. and the transactions contemplated therein, including the termination of the Trust’s registration under the 1940 Act and the dissolution of the Trust under Delaware law.
With respect to Proposal 1(B), the shares of the Trust were voted as follows:
| | | | |
| For | | Against | | Abstain |
| 187 | | — | | — |
Trust Certification
Certain Trusts are listed for trading on the NYSE and have filed with the NYSE their annual chief executive officer certification regarding compliance with the NYSE’s listing standards. The Trusts filed with the SEC the certification of its chief executive officer and chief financial officer required by section 302 of the Sarbanes-Oxley Act.
Dividend Policy
Each Trust’s dividend policy is to distribute all or a portion of its net investment income to its shareholders on a monthly basis. In order to provide shareholders with a more stable level of distributions, the Trusts may at times pay out less than the entire amount of net investment income earned in any particular month and may at times in any particular month pay out such accumulated but undistributed income in addition to net investment income earned in that month. As a result, the distributions paid by the Trusts for any particular month may be more or less than the amount of net investment income earned by the Trusts during such month. The Trusts’ current accumulated but undistributed net investment income, if any, is disclosed in the Statements of Assets and Liabilities, which comprises part of the financial information included in this report.
General Information
The Trusts do not make available copies of their Statements of Additional Information because the Trusts’ shares are not continuously offered, which means that the Statement of Additional Information of each Trust has not been updated after completion of the respective Trust’s offerings and the information contained in each Trust’s Statement of Additional Information may have become outdated.
During the period, there were no material changes in the Trusts’ investment objectives or policies or to the Trusts’ charters or by-laws that would delay or prevent a change of control of the Trusts that were not approved by the shareholders or in the principal risk factors associated with investment in the Trusts. There have been no changes in the persons who are primarily responsible for the day-to-day management of the Trusts’ portfolios.
Quarterly performance, semi-annual and annual reports, current net asset value and other information regarding the Trusts, may be found on BlackRock’s website, which can be accessed at http://www.blackrock.com. Any reference to BlackRock’s website in this report is intended to allow investors public access to information regarding the Trusts and does not, and is not intended to, incorporate BlackRock’s website into this report.
Electronic Delivery
Shareholders can sign up for e-mail notifications of quarterly statements, annual and semi-annual shareholder reports by enrolling in the electronic delivery program. Electronic copies of shareholder reports are available on BlackRock’s website.
| | |
| 92 | | 2018 BLACKROCK SEMI-ANNUAL REPORTTO SHAREHOLDERS |
Additional Information (continued)
To enroll in electronic delivery:
Shareholders Who Hold Accounts with Investment Advisers, Banks or Brokerages:
Please contact your financial advisor. Please note that not all investment advisers, banks or brokerages may offer this service.
Householding
The Trusts will mail only one copy of shareholder documents, annual and semi-annual reports and proxy statements, to shareholders with multiple accounts at the same address. This practice is commonly called “householding” and is intended to reduce expenses and eliminate duplicate mailings of shareholder documents. Mailings of your shareholder documents may be householded indefinitely unless you instruct us otherwise. If you do not want the mailing of these documents to be combined with those for other members of your household, please call the Trusts at (800) 882-0052.
Availability of Quarterly Schedule of Investments
The Trusts file their complete schedule of portfolio holdings with the SEC for the first and third quarters of each fiscal year on Form N-Q. The Trusts’ Forms N-Q are available on the SEC’s website at http://www.sec.gov and may also be reviewed and copied at the SEC’s Public Reference Room in Washington, D.C. Information on the operation of the Public Reference Room or how to access documents on the SEC’s website without charge may be obtained by calling (800) SEC-0330. The Trusts’ Forms N-Q may also be obtained upon request and without charge by calling (800) 882-0052.
Availability of Proxy Voting Policies and Procedures
A description of the policies and procedures that the Trusts use to determine how to vote proxies relating to portfolio securities is available upon request and without charge (1) by calling (800) 882-0052; (2) at http://www.blackrock.com; and (3) on the SEC’s website at http://www.sec.gov.
Availability of Proxy Voting Record
Information about how the Trusts voted proxies relating to securities held in the Trusts’ portfolios during the most recent 12-month period ended June 30 is available upon request and without charge (1) at http://www.blackrock.com; or by calling (800) 882-0052; and (2) on the SEC’s website at http://www.sec.gov.
Availability of Trust Updates
BlackRock will update performance and certain other data for the Trusts on a monthly basis on its website in the “Closed-end Funds” section of http://www.blackrock.com as well as certain other material information as necessary from time to time. Investors and others are advised to check the website for updated performance information and the release of other material information about the Trusts. This reference to BlackRock’s website is intended to allow investors public access to information regarding the Trusts and does not, and is not intended to, incorporate BlackRock’s website in this report.
BlackRock Privacy Principles
BlackRock is committed to maintaining the privacy of its current and former fund investors and individual clients (collectively, “Clients”) and to safeguarding their non-public personal information. The following information is provided to help you understand what personal information BlackRock collects, how we protect that information and why in certain cases we share such information with select parties.
If you are located in a jurisdiction where specific laws, rules or regulations require BlackRock to provide you with additional or different privacy-related rights beyond what is set forth below, then BlackRock will comply with those specific laws, rules or regulations.
BlackRock obtains or verifies personal non-public information from and about you from different sources, including the following: (i) information we receive from you or, if applicable, your financial intermediary, on applications, forms or other documents; (ii) information about your transactions with us, our affiliates, or others; (iii) information we receive from a consumer reporting agency; and (iv) from visits to our websites.
BlackRock does not sell or disclose to non-affiliated third parties any non-public personal information about its Clients, except as permitted by law or as is necessary to respond to regulatory requests or to service Client accounts. These non-affiliated third parties are required to protect the confidentiality and security of this information and to use it only for its intended purpose.
We may share information with our affiliates to service your account or to provide you with information about other BlackRock products or services that may be of interest to you. In addition, BlackRock restricts access to non-public personal information about its Clients to those BlackRock employees with a legitimate business need for the information. BlackRock maintains physical, electronic and procedural safeguards that are designed to protect the non-public personal information of its Clients, including procedures relating to the proper storage and disposal of such information.
| | | | |
| ADDITIONAL INFORMATION | | | 93 | |
Glossary of Terms Used in this Report
| | |
| Portfolio Abbreviations |
| |
| AGC | | Assured Guarantee Corp. |
| AGM | | Assured Guaranty Municipal Corp. |
| AMBAC | | American Municipal Bond Assurance Corp. |
| AMT | | Alternative Minimum Tax (subject to) |
| ARB | | Airport Revenue Bonds |
| BAM | | Build America Mutual Assurance Co. |
| BARB | | Building Aid Revenue Bonds |
| BHAC | | Berkshire Hathaway Assurance Corp. |
| BOCES | | Board of Cooperative Educational Services |
| CAB | | Capital Appreciation Bonds |
| CIFG | | CIFG Assurance North America, Inc. |
| COP | | Certificates of Participation |
| EDA | | Economic Development Authority |
| EDC | | Economic Development Corp. |
| ERB | | Education Revenue Bonds |
| FHA | | Federal Housing Administration |
| GO | | General Obligation Bonds |
| HDA | | Housing Development Authority |
| HFA | | Housing Finance Agency |
| HRB | | Housing Revenue Bonds |
| IDA | | Industrial Development Authority |
| LRB | | Lease Revenue Bonds |
| M/F | | Multi-Family |
| NPFGC | | National Public Finance Guarantee Corp. |
| PILOT | | Payment in Lieu of Taxes |
| RB | | Revenue Bonds |
| S/F | | Single-Family |
| SONYMA | | State of New York Mortgage Agency |
| SRF | | State Revolving Fund |
| Syncora | | Syncora Guarantee |
| | |
| 94 | | 2018 BLACKROCK SEMI-ANNUAL REPORTTO SHAREHOLDERS |
This report is intended for current holders. It is not a prospectus. Past performance results shown in this report should not be considered a representation of future performance. The Trusts have leveraged their Common Shares, which creates risks for Common Shareholders, including the likelihood of greater volatility of net asset value and market price of the Common Shares, and the risk that fluctuations in short-term interest rates may reduce the Common Shares’ yield. Statements and other information herein are as dated and are subject to change.

| | |
| CEF-STMUNI-8-2/18-SAR | |  |
| | |
| Item 2 – | | Code of Ethics – Not Applicable to this semi-annual report |
| |
| Item 3 – | | Audit Committee Financial Expert – Not Applicable to this semi-annual report |
| |
| Item 4 – | | Principal Accountant Fees and Services – Not Applicable to this semi-annual report |
| |
| Item 5 – | | Audit Committee of Listed Registrants – Not Applicable to this semi-annual report |
| |
| Item 6 – | | Investments |
| | (a) The registrant’s Schedule of Investments is included as part of the Report to Stockholders filed under Item 1 of this Form. |
| | (b) Not Applicable due to no such divestments during the semi-annual period covered since the previous Form N-CSR filing. |
| |
| Item 7 – | | Disclosure of Proxy Voting Policies and Procedures for Closed-End Management Investment Companies – Not Applicable to this semi-annual report |
| |
| Item 8 – | | Portfolio Managers of Closed-End Management Investment Companies |
| | (a) Not Applicable to this semi-annual report. |
| | (b) As of the date of this filing, there have been no changes in any of the portfolio managers identified in the most recent annual report on Form N-CSR. |
| |
| Item 9 – | | Purchases of Equity Securities by Closed-End Management Investment Company and Affiliated Purchasers – Not Applicable |
| |
| Item 10 – | | Submission of Matters to a Vote of Security Holders – There have been no material changes to these procedures. |
| |
| Item 11 – | | Controls and Procedures |
| |
| | (a) – The registrant’s principal executive and principal financial officers, or persons performing similar functions, have concluded that the registrant’s disclosure controls and procedures (as defined in Rule 30a-3(c) under the Investment Company Act of 1940, as amended (the “1940 Act”)) are effective as of a date within 90 days of the filing of this report based on the evaluation of these controls and procedures required by Rule 30a-3(b) under the 1940 Act and Rule 13a-15(b) under the Securities Exchange Act of 1934, as amended. |
| |
| | (b) – There were no changes in the registrant’s internal control over financial reporting (as defined in Rule 30a-3(d) under the 1940 Act) that occurred during the second fiscal quarter of the period covered by this report that have materially affected, or are reasonably likely to materially affect, the registrant’s internal control over financial reporting. |
| |
| Item 12 – | | Disclosure of Securities Lending Activities for Closed-End Management Investment Companies – Not Applicable |
| |
| Item 13 – | | Exhibits attached hereto |
| |
| | (a)(1) – Code of Ethics – Not Applicable to this semi-annual report |
| |
| | (a)(2) – Certifications – Attached hereto |
2
| | |
| | (a)(3) – Not Applicable |
| |
| | (a)(4) – Not Applicable |
| |
| | (b) – Certifications – Attached hereto |
3
Pursuant to the requirements of the Securities Exchange Act of 1934 and the Investment Company Act of 1940, the registrant has duly caused this report to be signed on its behalf by the undersigned, thereunto duly authorized.
BlackRock New Jersey Municipal Bond Trust
| | |
| By: | | /s/ John M. Perlowski |
| | John M. Perlowski |
| | Chief Executive Officer (principal executive officer) of |
| | BlackRock New Jersey Municipal Bond Trust |
Date: May 4, 2018
Pursuant to the requirements of the Securities Exchange Act of 1934 and the Investment Company Act of 1940, this report has been signed below by the following persons on behalf of the registrant and in the capacities and on the dates indicated.
| | |
| By: | | /s/ John M. Perlowski |
| | John M. Perlowski |
| | Chief Executive Officer (principal executive officer) of |
| | BlackRock New Jersey Municipal Bond Trust |
| | |
| By: | | /s/ Neal J. Andrews |
| | Neal J. Andrews |
| | Chief Financial Officer (principal financial officer) of |
| | BlackRock New Jersey Municipal Bond Trust |
4