UNITED STATES
SECURITIES AND EXCHANGE COMMISSION
Washington, D.C. 20549
FORM N-CSR
CERTIFIED SHAREHOLDER REPORT OF REGISTERED
MANAGEMENT INVESTMENT COMPANIES
Investment Company Act File Number: 811-21055
T. Rowe Price Institutional Income Funds, Inc.
(Exact name of registrant as specified in charter)
100 East Pratt Street, Baltimore, MD 21202
(Address of principal executive offices)
David Oestreicher
100 East Pratt Street, Baltimore, MD 21202
(Name and address of agent for service)
Registrant’s telephone number, including area code: (410) 345-2000
Date of fiscal year end: May 31
Date of reporting period: May 31, 2024
Item 1. Reports to Shareholders
(a) Report pursuant to Rule 30e-1
Annual Shareholder Report
May 31, 2024
Institutional Long Duration Credit Fund
This annual shareholder report contains important information about Institutional Long Duration Credit Fund (the "fund") for the period of June 1, 2023 to May 31, 2024. You can find the fund’s prospectus, financial information on Form N-CSR (which includes required tax information for dividends), holdings, proxy voting information, and other information atwww.troweprice.com/prospectus. You can also request this information without charge by contacting T. Rowe Price at 1-800-638-5660 or info@troweprice.com or contacting your intermediary.
What were the fund costs for the last year? (based on a hypothetical $10,000 investment)
| Costs of a $10,000 investment | Costs paid as a percentage of a $10,000 investment |
|---|
| Institutional Long Duration Credit Fund | $45 | 0.45% |
What drove fund performance during the past 12 months?
The U.S. long duration credit market posted positive returns for the reporting period. Despite generally higher U.S. Treasury yields, higher coupon payments and tighter credit spreads benefited bond investors.
In the government-related sector, select taxable municipal holdings and allocations to emerging markets debt performed well for the fund relative to the Bloomberg U.S. Long Credit Bond Index. Taxable municipal bonds benefited from a scarcity premium with investors looking to add yield, while increased demand and falling interest rate volatility helped buoy emerging markets.
An emphasis on intermediate corporate bonds, which can be less volatile compared with longer-term corporates, detracted relative to the Bloomberg U.S. Long Credit Bond Index. Longer-term corporate credit spreads tightened more meaningfully on strong demand for yield.
The fund seeks to provide high income through a diversified portfolio of longer-duration debt instruments issued by corporations as well as certain noncorporate issuers. With high-grade corporate bond yields at attractive levels, the fund increased its holdings in investment-grade corporates as the macroeconomic backdrop remained mostly supportive.
The fund held exposure to derivatives, including credit and interest rate derivatives. Broadly speaking, the fund’s use of derivatives was beneficial, and the use of credit derivatives aided absolute returns. However, interest rate derivatives had a negative impact on absolute performance.
How has the fund performed?
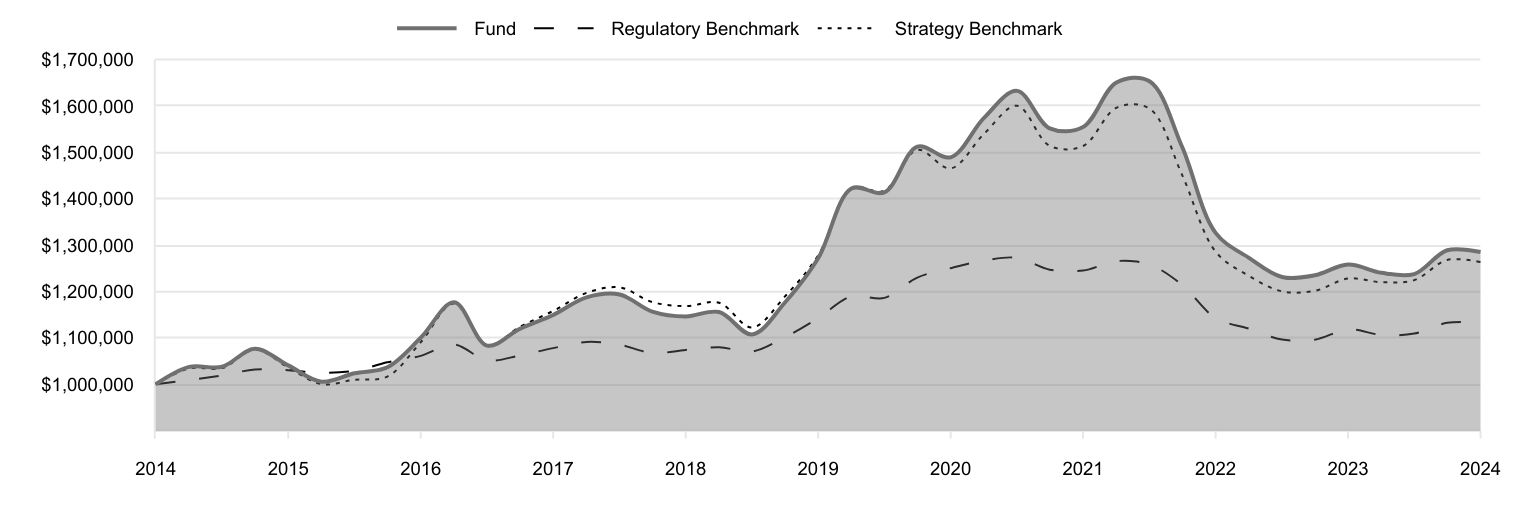
Cumulative Returns of a Hypothetical $1 Million Investment as of May 31, 2024
| Fund | Regulatory Benchmark | Strategy Benchmark |
|---|
| 2014 | 1,000,000 | 1,000,000 | 1,000,000 |
| 2014 | 1,037,383 | 1,009,025 | 1,034,149 |
| 2014 | 1,037,798 | 1,019,205 | 1,034,714 |
| 2015 | 1,076,678 | 1,031,757 | 1,074,886 |
| 2015 | 1,040,666 | 1,030,342 | 1,036,157 |
| 2015 | 1,005,573 | 1,024,718 | 1,000,203 |
| 2015 | 1,023,683 | 1,029,095 | 1,009,698 |
| 2016 | 1,036,685 | 1,047,261 | 1,016,632 |
| 2016 | 1,100,185 | 1,061,199 | 1,090,455 |
| 2016 | 1,176,729 | 1,085,853 | 1,174,157 |
| 2016 | 1,083,384 | 1,051,443 | 1,082,416 |
| 2017 | 1,119,320 | 1,062,083 | 1,123,849 |
| 2017 | 1,149,443 | 1,077,951 | 1,158,060 |
| 2017 | 1,187,376 | 1,091,201 | 1,197,008 |
| 2017 | 1,193,493 | 1,085,238 | 1,208,776 |
| 2018 | 1,156,759 | 1,067,447 | 1,177,238 |
| 2018 | 1,146,238 | 1,073,913 | 1,168,431 |
| 2018 | 1,155,682 | 1,079,750 | 1,175,731 |
| 2018 | 1,107,463 | 1,070,673 | 1,122,388 |
| 2019 | 1,175,828 | 1,101,283 | 1,188,827 |
| 2019 | 1,271,598 | 1,142,647 | 1,277,609 |
| 2019 | 1,421,988 | 1,189,587 | 1,422,782 |
| 2019 | 1,413,671 | 1,186,211 | 1,417,160 |
| 2020 | 1,512,254 | 1,229,943 | 1,505,453 |
| 2020 | 1,489,317 | 1,250,234 | 1,465,209 |
| 2020 | 1,574,192 | 1,266,595 | 1,539,766 |
| 2020 | 1,632,511 | 1,272,614 | 1,600,435 |
| 2021 | 1,551,702 | 1,246,960 | 1,513,988 |
| 2021 | 1,554,627 | 1,245,172 | 1,513,614 |
| 2021 | 1,650,486 | 1,265,527 | 1,596,135 |
| 2021 | 1,653,159 | 1,257,934 | 1,594,302 |
| 2022 | 1,511,343 | 1,213,988 | 1,450,936 |
| 2022 | 1,326,312 | 1,142,793 | 1,285,982 |
| 2022 | 1,272,607 | 1,119,789 | 1,233,508 |
| 2022 | 1,231,311 | 1,096,421 | 1,200,235 |
| 2023 | 1,234,893 | 1,095,965 | 1,201,387 |
| 2023 | 1,258,176 | 1,118,306 | 1,227,875 |
| 2023 | 1,240,270 | 1,106,428 | 1,220,089 |
| 2023 | 1,237,554 | 1,109,356 | 1,224,600 |
| 2024 | 1,288,961 | 1,132,430 | 1,268,054 |
| 2024 | 1,285,038 | 1,132,905 | 1,263,436 |
202405-3565004, 202407-3567288
Average Annual Total Returns
| 1 Year | 5 Years | 10 Years |
|---|
| Institutional Long Duration Credit Fund | 2.14% | 0.21% | 2.54% |
| Bloomberg U.S. Aggregate Bond Index (Regulatory Benchmark) | 1.31 | | 1.26 |
| Bloomberg U.S. Long Credit Bond Index (Strategy Benchmark) | 2.90 | | 2.37 |
The preceding line graph shows the value of a hypothetical $1,000,000 investment in the fund over the past 10 fiscal year periods or since inception (for funds lacking 10-year records). The fund’s performance information included in the line graph and table above is compared with a regulatory required index that represents an overall securities market (Regulatory Benchmark). In addition, the line graph and table may also include one or more indexes that more closely aligns to the fund's investment strategy (Strategy Benchmark(s)). Due to new SEC Rules on shareholder reporting the fund adopted a new broad-based securities market index, referred to as the Regulatory Benchmark. Market index returns do not include expenses, which are deducted from fund returns. The fund's total return figures reflect the reinvestment of dividends and capital gains, if any. Neither the fund’s returns nor the index returns reflect the deduction of taxes that a shareholder would pay on fund distributions or redemptions of fund shares. The fund’s past performance is not a good predictor of the fund’s future performance. Updated performance information can be found at www.troweprice.com.
What are some fund statistics?
| Total Net Assets (000s) | $156,733 |
| Number of Portfolio Holdings | 453 |
| Investment Advisory Fees Paid (000s) | $427 |
| Portfolio Turnover Rate | 59.3% |
What did the fund invest in?
Credit Quality Allocation* (as a % of Net Assets)
| AAA Rated | 1.6% |
| AA Rated | 8.6 |
| A Rated | 34.5 |
| BBB Rated | 42.1 |
| U.S. Treasury Securities | 12.0 |
| Reserves | 1.2 |
*Credit ratings for the securities held in the Fund are provided by Moody’s, Standard & Poor’s, and Fitch and are converted to the Standard & Poor’s nomenclature. A rating of AAA represents the highest-rated securities, and a rating of D represents the lowest rated securities. If the ratings agencies differ, the highest rating is applied to the security. If a rating is not available, the security is classified as Not Rated. The rating of the underlying investment vehicle is used to determine the creditworthiness of credit default swaps and sovereign securities. The Fund is not rated by any agency.
Top Ten Holdings (as a % of Net Assets)
| U.S. Treasury Bonds | 12.0% |
| AT&T | 1.7 |
| CVS Health | 1.3 |
| UnitedHealth Group | 1.3 |
| Bank of America | 1.2 |
| JPMorgan Chase | 1.2 |
| Anheuser-Busch | 1.2 |
| AbbVie | 1.1 |
| Amgen | 1.1 |
| Verizon Communications | 1.0 |
If you invest directly with T. Rowe Price, you can elect to receive future shareholder reports or other important documents through electronic delivery by enrolling at www.troweprice.com/paperless. If you invest through a financial intermediary such as an investment advisor, a bank, retirement plan sponsor or a brokerage firm, please contact that organization and ask if it can provide electronic delivery.
Bloomberg does not accept any liability for any errors or omissions in the indexes or data, and hereby expressly disclaim all warranties of originality, accuracy, completeness, timeliness, merchantability and fitness for a particular purpose. No party may rely on any indexes or data contained in this communication. Visit www.troweprice.com/en/us/market-data-disclosures for additional legal notices & disclaimers.
Institutional Long Duration Credit Fund
(RPLCX)
T. Rowe Price Investment Services, Inc.
100 East Pratt Street
Baltimore, MD 21202
Item 1. (b) Notice pursuant to Rule 30e-3.
Not applicable.
Item 2. Code of Ethics.
The registrant has adopted a code of ethics, as defined in Item 2 of Form N-CSR, applicable to its principal executive officer, principal financial officer, principal accounting officer or controller, or persons performing similar functions. A copy of this code of ethics is filed as an exhibit to this Form N-CSR. No substantive amendments were approved or waivers were granted to this code of ethics during the period covered by this report.
Item 3. Audit Committee Financial Expert.
The registrant’s Board of Directors has determined that Mr. Paul F. McBride qualifies as an audit committee financial expert, as defined in Item 3 of Form N-CSR. Mr. McBride is considered independent for purposes of Item 3 of Form N-CSR.
Item 4. Principal Accountant Fees and Services.
(a) – (d) Aggregate fees billed for the last two fiscal years for professional services rendered to, or on behalf of, the registrant by the registrant’s principal accountant were as follows:
| | | | | | | | | | | | | | |
| | | 2024 | | | | | | 2023 | | | |
Audit Fees | | $ | 33,841 | | | | | | | $ | 33,192 | |
Audit-Related Fees | | | - | | | | | | | | - | |
Tax Fees | | | - | | | | | | | | - | |
All Other Fees | | | - | | | | | | | | - | |
Audit fees include amounts related to the audit of the registrant’s annual financial statements and services normally provided by the accountant in connection with statutory and regulatory filings. Audit-related fees include amounts reasonably related to the performance of the audit of the registrant’s financial statements and specifically include the issuance of a report on internal controls and, if applicable, agreed-upon procedures related to fund acquisitions. Tax fees include amounts related to services for tax compliance, tax planning, and tax advice. The nature of these services specifically includes the review of distribution calculations and the preparation of Federal, state, and excise tax returns. All other fees include the registrant’s pro-rata share of amounts for agreed-upon procedures in conjunction with service contract approvals by the registrant’s Board of Directors/Trustees.
(e)(1) The registrant’s audit committee has adopted a policy whereby audit and non-audit services performed by the registrant’s principal accountant for the registrant, its investment adviser, and any entity controlling, controlled by, or under common control with the investment adviser that provides ongoing services to the registrant require pre-approval in advance at regularly scheduled audit committee meetings. If such a service is required between regularly scheduled audit committee meetings, pre-approval may be authorized by one audit committee member with ratification at the next scheduled audit committee meeting. Waiver of pre-approval for audit or non-audit services requiring fees of a de minimis amount is not permitted.
(2) No services included in (b) – (d) above were approved pursuant to paragraph (c)(7)(i)(C) of Rule 2-01 of Regulation S-X.
(f) Less than 50 percent of the hours expended on the principal accountant’s engagement to audit the registrant’s financial statements for the most recent fiscal year were attributed to work performed by persons other than the principal accountant’s full-time, permanent employees.
(g) The aggregate fees billed for the most recent fiscal year and the preceding fiscal year by the registrant’s principal accountant for non-audit services rendered to the registrant, its investment adviser, and any entity controlling, controlled by, or under common control with the investment adviser that provides ongoing services to the registrant were $1,230,000 and $1,521,000, respectively.
(h) All non-audit services rendered in (g) above were pre-approved by the registrant’s audit committee. Accordingly, these services were considered by the registrant’s audit committee in maintaining the principal accountant’s independence.
(i) Not applicable.
(j) Not applicable.
Item 5. Audit Committee of Listed Registrants.
Not applicable.
Item 6. Investments.
(a) Not applicable. The complete schedule of investments is included in Item 7 of this Form N-CSR.
(b) Not applicable.
Item 7. Financial Statements and Financial Highlights for Open-End Management Investment Companies.
(a – b) Report pursuant to Regulation S-X.
Financial
Statements
and
Other
Information
Institutional
Long
Duration
Credit
Fund
For
more
insights
from
T.
Rowe
Price
investment
professionals,
go
to
troweprice.com
.
Financial
Highlights
Portfolio
of
Investments
Financial
Statements
and
Notes
Additional
Fund
Information
T.
ROWE
PRICE
Institutional
Long
Duration
Credit
Fund
Go
Paperless
Going
paperless
offers
a
host
of
benefits,
which
include:
Timely
delivery
of
important
documents
Convenient
access
to
your
documents
anytime,
anywhere
Strong
security
protocols
to
safeguard
sensitive
data
Waive
your
account
service
fee
by
going
paperless.
*
To
Enroll:
˃
If
you
invest
directly
with
T.
Rowe
Price,
go
to
troweprice.com/paperless
.
If
you
invest
through
a
financial
intermediary
such
as
an
investment
advisor,
a
bank,
or
a
brokerage
firm,
please
contact
that
organization
and
ask
if
it
can
provide
electronic
documentation.
Log
in
to
your
account
at
troweprice.com
for
more
information.
*
An
account
service
fee
will
be
charged
annually
for
each
T.
Rowe
Price
mutual
fund
account
unless
you
meet
criteria
for
a
fee
waiver.
Go
to
troweprice.com/personal-investing/help/fees-and-minimums.html
to
learn
more
about
this
account
service
fee,
including
other
ways
to
waive
it.
T.
ROWE
PRICE
Institutional
Long
Duration
Credit
Fund
For
a
share
outstanding
throughout
each
period
The
accompanying
notes
are
an
integral
part
of
these
financial
statements.
..
Year
..
..
Ended
.
5/31/24
5/31/23
5/31/22
5/31/21
5/31/20
NET
ASSET
VALUE
Beginning
of
period
$
7
.77
$
8
.59
$
10
.70
$
11
.00
$
10
.68
Investment
activities
Net
investment
income
(1)(2)
0
.37
0
.34
0
.33
0
.36
0
.40
Net
realized
and
unrealized
gain/loss
(
0
.21
)
(
0
.79
)
(
1
.76
)
0
.15
1
.35
Total
from
investment
activities
0
.16
(
0
.45
)
(
1
.43
)
0
.51
1
.75
Distributions
Net
investment
income
(
0
.41
)
(
0
.37
)
(
0
.38
)
(
0
.41
)
(
0
.43
)
Net
realized
gain
–
–
(
0
.27
)
(
0
.40
)
(
1
.00
)
Tax
return
of
capital
–
–
(
0
.03
)
–
–
Total
distributions
(
0
.41
)
(
0
.37
)
(
0
.68
)
(
0
.81
)
(
1
.43
)
NET
ASSET
VALUE
End
of
period
$
7
.52
$
7
.77
$
8
.59
$
10
.70
$
11
.00
Ratios/Supplemental
Data
Total
return
(2)(3)
2
.14
%
(
5
.14
)
%
(
14
.69
)
%
4
.39
%
17
.12
%
Ratios
to
average
net
assets:
(2)
Gross
expenses
before
waivers/payments
by
Price
Associates
0
.45
%
0
.45
%
0
.45
%
0
.45
%
0
.46
%
Net
expenses
after
waivers/payments
by
Price
Associates
0
.45
%
0
.45
%
0
.45
%
0
.45
%
0
.46
%
Net
investment
income
4
.87
%
4
.26
%
3
.21
%
3
.19
%
3
.56
%
Portfolio
turnover
rate
59
.3
%
46
.7
%
59
.9
%
50
.9
%
70
.5
%
Net
assets,
end
of
period
(in
thousands)
$
156,733
$
55,544
$
24,849
$
19,168
$
23,979
(1)
Per
share
amounts
calculated
using
average
shares
outstanding
method.
(2)
Includes
the
impact
of
expense-related
arrangements
with
Price
Associates.
(3)
Total
return
reflects
the
rate
that
an
investor
would
have
earned
on
an
investment
in
the
fund
during
each
period,
assuming
reinvestment
of
all
distributions,
and
payment
of
no
redemption
or
account
fees,
if
applicable.
T.
ROWE
PRICE
Institutional
Long
Duration
Credit
Fund
May
31,
2024
Par/Shares
$
Value
(Amounts
in
000s)
‡
CORPORATE
BONDS
78.4%
Banking
12.3%
Australia
&
New
Zealand
Banking
Group,
6.742%,
12/8/32 (1)
200
212
Banco
Bilbao
Vizcaya
Argentaria,
VR,
6.033%,
3/13/35 (2)
400
401
Banco
Santander,
6.921%,
8/8/33
200
211
Bank
of
America,
5.00%,
1/21/44
500
472
Bank
of
America,
VR,
2.676%,
6/19/41 (2)
200
140
Bank
of
America,
VR,
2.687%,
4/22/32 (2)
200
167
Bank
of
America,
VR,
3.824%,
1/20/28 (2)
100
96
Bank
of
America,
VR,
4.078%,
4/23/40 (2)
300
254
Bank
of
America,
VR,
4.33%,
3/15/50 (2)
455
379
Bank
of
America,
VR,
5.468%,
1/23/35 (2)
210
209
Bank
of
America,
Series N,
VR,
2.651%,
3/11/32 (2)
250
209
Bank
of
New
York
Mellon,
VR,
6.474%,
10/25/34 (2)
230
247
Barclays,
5.25%,
8/17/45 (3)
250
238
Barclays,
VR,
6.036%,
3/12/55 (2)
200
204
Barclays,
VR,
7.437%,
11/2/33 (2)
200
219
BNP
Paribas,
VR,
2.871%,
4/19/32 (1)(2)
200
168
CaixaBank,
VR,
6.84%,
9/13/34 (1)
(2)
230
244
Capital
One
Financial,
VR,
3.273%,
3/1/30 (2)
250
224
Capital
One
Financial,
VR,
6.051%,
2/1/35 (2)
150
151
Capital
One
Financial,
VR,
6.377%,
6/8/34 (2)
300
307
Citigroup,
4.65%,
7/30/45
530
470
Citigroup,
VR,
5.827%,
2/13/35 (2)
500
495
Citigroup,
VR,
6.174%,
5/25/34 (2)
115
116
Credit
Agricole,
5.365%,
3/11/34 (1)
500
493
Danske
Bank,
VR,
5.705%,
3/1/30 (1)(2)
200
200
Fifth
Third
Bancorp,
8.25%,
3/1/38
300
351
Goldman
Sachs
Group,
2.60%,
2/7/30
100
87
Goldman
Sachs
Group,
4.75%,
10/21/45
515
464
Goldman
Sachs
Group,
5.15%,
5/22/45
200
188
Goldman
Sachs
Group,
6.25%,
2/1/41
700
752
HSBC
Holdings,
7.625%,
5/17/32
155
169
HSBC
Holdings,
VR,
5.719%,
3/4/35 (2)
275
277
HSBC
Holdings,
VR,
6.332%,
3/9/44 (2)
400
421
Par/Shares
$
Value
(Amounts
in
000s)
‡
HSBC
Holdings,
VR,
7.399%,
11/13/34 (2)
290
315
ING
Groep,
VR,
5.55%,
3/19/35 (2)
500
495
ING
Groep,
VR,
6.114%,
9/11/34 (2)
200
206
Intesa
Sanpaolo,
6.625%,
6/20/33 (1)
330
341
JPMorgan
Chase,
5.625%,
8/16/43
1,005
1,029
JPMorgan
Chase,
VR,
3.882%,
7/24/38 (2)
730
622
JPMorgan
Chase,
VR,
5.336%,
1/23/35 (2)
185
182
Lloyds
Banking
Group,
4.344%,
1/9/48
200
156
Lloyds
Banking
Group,
VR,
5.679%,
1/5/35 (2)
225
224
Morgan
Stanley,
4.30%,
1/27/45
450
385
Morgan
Stanley,
VR,
3.217%,
4/22/42 (2)
450
335
NatWest
Group,
VR,
6.016%,
3/2/34 (2)
250
255
PNC
Financial
Services
Group,
VR,
4.626%,
6/6/33 (2)
250
231
Santander
Holdings
USA,
VR,
6.342%,
5/31/35 (2)
560
561
Societe
Generale,
VR,
6.066%,
1/19/35 (1)(2)
365
364
Standard
Chartered,
VR,
5.905%,
5/14/35 (1)(2)
650
650
Standard
Chartered,
VR,
6.301%,
1/9/29 (1)(2)
200
204
State
Street,
VR,
5.159%,
5/18/34 (2)
305
299
Sumitomo
Mitsui
Financial
Group,
5.766%,
1/13/33
200
205
U.S.
Bancorp,
VR,
5.678%,
1/23/35 (2)
325
324
UBS
Group,
VR,
3.179%,
2/11/43 (1)
(2)
200
143
UBS
Group,
VR,
5.699%,
2/8/35 (1)
(2)
200
199
UBS
Group,
VR,
6.301%,
9/22/34 (1)
(2)
200
208
Wells
Fargo,
3.90%,
5/1/45
350
279
Wells
Fargo,
VR,
2.393%,
6/2/28 (2)
150
138
Wells
Fargo,
VR,
3.068%,
4/30/41 (2)
850
627
Wells
Fargo,
VR,
5.499%,
1/23/35 (2)
250
248
Wells
Fargo,
VR,
5.557%,
7/25/34 (2)
200
198
Wells
Fargo
Bank,
6.60%,
1/15/38
250
271
Westpac
Banking,
VR,
2.668%,
11/15/35 (2)
500
410
19,339
Basic
Industry
2.1%
BHP
Billiton
Finance
USA,
5.50%,
9/8/53
35
34
Celanese
U.S.
Holdings,
6.70%,
11/15/33
60
63
Dow
Chemical,
4.80%,
5/15/49
490
418
Dow
Chemical,
5.60%,
2/15/54
350
336
Ecolab,
2.70%,
12/15/51
300
186
Ecolab,
3.70%,
11/1/46
30
22
T.
ROWE
PRICE
Institutional
Long
Duration
Credit
Fund
Par/Shares
$
Value
(Amounts
in
000s)
‡
Freeport-McMoRan,
5.45%,
3/15/43
300
283
International
Paper,
4.35%,
8/15/48
139
112
LYB
International
Finance
III,
5.625%,
5/15/33
250
253
LyondellBasell
Industries,
4.625%,
2/26/55
400
318
Newmont,
5.45%,
6/9/44
195
188
Nucor,
4.40%,
5/1/48 (3)
75
64
Southern
Copper,
5.25%,
11/8/42
200
186
Southern
Copper,
7.50%,
7/27/35
200
231
Vale
Overseas,
6.875%,
11/21/36
300
318
Westlake,
3.125%,
8/15/51
500
315
3,327
Brokerage
Assetmanagers
Exchanges
1.2%
BlackRock
Funding,
5.00%,
3/14/34
750
741
Intercontinental
Exchange,
4.95%,
6/15/52
300
274
Intercontinental
Exchange,
5.25%,
6/15/31
345
346
Nasdaq,
3.95%,
3/7/52
220
164
Nasdaq,
5.95%,
8/15/53
340
345
1,870
Capital
Goods
3.8%
Amphenol,
5.25%,
4/5/34
270
269
Boeing,
5.705%,
5/1/40
300
274
Boeing,
5.805%,
5/1/50
500
447
Carrier
Global,
6.20%,
3/15/54
400
428
CRH
America
Finance,
5.40%,
5/21/34
750
743
Honeywell
International,
5.25%,
3/1/54
500
482
Ingersoll
Rand,
5.70%,
6/15/54
170
172
Johnson
Controls
International,
4.50%,
2/15/47
250
209
L3Harris
Technologies,
4.854%,
4/27/35
280
264
Martin
Marietta
Materials,
4.25%,
12/15/47
305
247
Masco,
4.50%,
5/15/47
360
296
Owens
Corning,
5.95%,
6/15/54
550
552
Republic
Services,
5.00%,
12/15/33
530
515
Republic
Services,
5.00%,
4/1/34
25
24
Stanley
Black
&
Decker,
2.75%,
11/15/50
800
456
Vulcan
Materials,
4.50%,
6/15/47
130
109
Waste
Connections,
2.95%,
1/15/52
175
111
Waste
Management,
4.875%,
2/15/34
350
342
5,940
Communications
10.1%
American
Tower,
5.45%,
2/15/34
265
262
American
Tower,
5.90%,
11/15/33
300
307
AT&T,
3.50%,
6/1/41
1,150
873
AT&T,
3.80%,
12/1/57
2,228
1,545
AT&T,
5.40%,
2/15/34
200
198
Bell
Canada,
5.10%,
5/11/33
250
243
Par/Shares
$
Value
(Amounts
in
000s)
‡
Charter
Communications
Operating,
3.70%,
4/1/51
600
365
Charter
Communications
Operating,
5.75%,
4/1/48
425
357
Charter
Communications
Operating,
6.484%,
10/23/45
300
276
Charter
Communications
Operating,
6.65%,
2/1/34 (3)
280
284
Comcast,
2.45%,
8/15/52
350
195
Comcast,
3.90%,
3/1/38
150
126
Comcast,
4.049%,
11/1/52
755
584
Cox
Communications,
2.95%,
10/1/50 (1)
230
136
Cox
Communications,
5.70%,
6/15/33 (1)
500
495
Crown
Castle,
2.90%,
4/1/41
250
172
Crown
Castle,
4.75%,
5/15/47
185
157
Interpublic
Group
of
Companies,
5.375%,
6/15/33
340
335
Meta
Platforms,
4.95%,
5/15/33 (3)
170
170
Meta
Platforms,
5.60%,
5/15/53
380
384
NBCUniversal
Media,
4.45%,
1/15/43
1,700
1,462
Rogers
Communications,
4.35%,
5/1/49
175
138
Rogers
Communications,
4.50%,
3/15/42
160
134
Rogers
Communications,
4.55%,
3/15/52
250
203
Rogers
Communications,
5.00%,
3/15/44
350
313
Rogers
Communications,
5.30%,
2/15/34
225
219
T-Mobile
USA,
5.05%,
7/15/33
250
243
T-Mobile
USA,
5.75%,
1/15/34
300
307
T-Mobile
USA,
5.75%,
1/15/54
680
677
Telefonica
Emisiones,
5.52%,
3/1/49
500
465
Time
Warner
Cable,
5.875%,
11/15/40
700
605
TWDC
Enterprises
18,
4.125%,
6/1/44
700
584
Verizon
Communications,
2.65%,
11/20/40
1,000
690
Verizon
Communications,
2.987%,
10/30/56
1,536
937
Videotron,
5.125%,
4/15/27 (1)
70
68
Vodafone
Group,
4.875%,
6/19/49
230
200
Warnermedia
Holdings,
5.05%,
3/15/42
1,285
1,061
15,770
Consumer
Cyclical
4.6%
Amazon.com,
4.95%,
12/5/44
400
387
AutoZone,
4.75%,
2/1/33
250
238
AutoZone,
5.20%,
8/1/33
200
196
Best
Buy,
1.95%,
10/1/30
200
164
CBRE
Services,
5.95%,
8/15/34 (3)
245
247
Cummins,
5.45%,
2/20/54
1,000
980
Daimler
Truck
Finance
North
America,
5.375%,
1/18/34 (1)
450
445
T.
ROWE
PRICE
Institutional
Long
Duration
Credit
Fund
Par/Shares
$
Value
(Amounts
in
000s)
‡
Dollar
General,
5.45%,
7/5/33 (3)
250
247
eBay,
4.00%,
7/15/42
500
400
Ford
Motor,
4.75%,
1/15/43
200
161
Ford
Motor
Credit,
7.122%,
11/7/33
215
229
General
Motors,
6.60%,
4/1/36
600
627
Home
Depot,
4.20%,
4/1/43
500
422
Home
Depot,
4.40%,
3/15/45
200
172
Lowe's,
4.65%,
4/15/42
250
220
Lowe's,
5.625%,
4/15/53
400
386
Lowe's,
5.85%,
4/1/63
300
293
Magna
International,
5.50%,
3/21/33
270
274
McDonald's,
4.20%,
4/1/50
90
72
McDonald's,
5.45%,
8/14/53
250
242
Mercedes-Benz
Finance
North
America,
5.05%,
8/3/33 (1)
300
295
Tractor
Supply,
5.25%,
5/15/33
250
247
Volkswagen
Group
of
America
Finance,
5.90%,
9/12/33 (1)
250
253
7,197
Consumer
Non-Cyclical
12.2%
AbbVie,
4.05%,
11/21/39
500
433
AbbVie,
4.25%,
11/21/49
735
611
AbbVie,
4.50%,
5/14/35
400
376
AbbVie,
5.50%,
3/15/64
335
329
Altria
Group,
5.80%,
2/14/39
140
139
Amgen,
4.95%,
10/1/41
600
556
Amgen,
5.65%,
3/2/53
1,125
1,109
Anheuser-Busch,
4.90%,
2/1/46
1,980
1,814
Anheuser-Busch
InBev
Worldwide,
5.45%,
1/23/39
305
306
Anheuser-Busch
InBev
Worldwide,
5.55%,
1/23/49
400
399
Astrazeneca
Finance,
4.875%,
3/3/33
200
197
Banner
Health,
2.913%,
1/1/51
115
75
BAT
Capital,
6.00%,
2/20/34
110
111
BAT
Capital,
7.079%,
8/2/43
180
192
Bayer
U.S.
Finance,
6.875%,
11/21/53 (1)
200
207
Becton
Dickinson
&
Company,
4.669%,
6/6/47
200
174
Biogen,
3.15%,
5/1/50
270
175
Bristol-Myers
Squibb,
4.125%,
6/15/39
800
693
Bristol-Myers
Squibb,
5.65%,
2/22/64
225
220
Centra
Health,
4.70%,
1/1/48
190
161
Cigna
Group,
3.875%,
10/15/47
370
280
CommonSpirit
Health,
3.91%,
10/1/50
170
129
CommonSpirit
Health,
4.187%,
10/1/49
135
107
CVS
Health,
4.125%,
4/1/40
330
266
CVS
Health,
5.05%,
3/25/48
765
661
CVS
Health,
5.25%,
2/21/33
170
165
CVS
Health,
6.00%,
6/1/44
750
736
CVS
Health,
6.00%,
6/1/63
250
240
Eli
Lilly,
5.00%,
2/9/54
350
333
Par/Shares
$
Value
(Amounts
in
000s)
‡
Hackensack
Meridian
Health,
4.211%,
7/1/48 (3)
170
143
HCA,
4.375%,
3/15/42
580
478
HCA,
4.625%,
3/15/52
400
311
HCA,
5.90%,
6/1/53
250
243
Icon
Investments
Six,
6.00%,
5/8/34
200
203
IQVIA,
6.25%,
2/1/29
95
97
Mars,
4.75%,
4/20/33 (1)
225
217
Merck,
5.00%,
5/17/53
340
319
Nestle
Holdings,
4.85%,
3/14/33 (1)
300
298
Pfizer
Investment
Enterprises,
5.11%,
5/19/43
1,300
1,234
Pfizer
Investment
Enterprises,
5.30%,
5/19/53
190
182
Philip
Morris
International,
5.25%,
2/13/34
500
489
Reynolds
American,
5.70%,
8/15/35
150
146
Reynolds
American,
5.85%,
8/15/45
600
559
Roche
Holdings,
5.218%,
3/8/54 (1)
500
486
Solventum,
5.90%,
4/30/54 (1)
750
720
Sutter
Health,
5.547%,
8/15/53
95
97
Sysco,
6.00%,
1/17/34
400
418
Thermo
Fisher
Scientific,
5.404%,
8/10/43
350
351
Tyson
Foods,
5.10%,
9/28/48
195
170
Utah
Acquisition
Sub,
5.25%,
6/15/46
250
205
Viatris,
4.00%,
6/22/50
400
271
West
Virginia
United
Health
System
Obligated
Group,
Series 2018,
4.924%,
6/1/48
95
84
Zoetis,
4.70%,
2/1/43
300
267
19,182
Electric
10.0%
AEP
Texas,
5.40%,
6/1/33
220
214
Ameren
Illinois,
4.50%,
3/15/49 (3)
500
427
American
Electric
Power,
5.625%,
3/1/33
250
248
Appalachian
Power,
6.375%,
4/1/36
145
150
Appalachian
Power,
7.00%,
4/1/38
200
218
Baltimore
Gas
&
Electric,
5.40%,
6/1/53
95
91
Berkshire
Hathaway
Energy,
3.80%,
7/15/48
1,000
737
Berkshire
Hathaway
Energy,
6.125%,
4/1/36
300
312
Commonwealth
Edison,
5.30%,
2/1/53
40
38
Commonwealth
Edison,
5.65%,
6/1/54
500
498
Consolidated
Edison
of
New
York,
6.15%,
11/15/52
400
424
Constellation
Energy
Generation,
5.75%,
3/15/54
500
483
Constellation
Energy
Generation,
6.25%,
10/1/39
300
309
Consumers
Energy,
3.75%,
2/15/50
500
382
DTE
Energy,
5.85%,
6/1/34
360
364
T.
ROWE
PRICE
Institutional
Long
Duration
Credit
Fund
Par/Shares
$
Value
(Amounts
in
000s)
‡
Duke
Energy,
3.75%,
9/1/46
130
96
Duke
Energy,
6.10%,
9/15/53
250
256
Duke
Energy
Indiana,
5.40%,
4/1/53
70
66
Duke
Energy
Ohio,
5.55%,
3/15/54
750
724
Duke
Energy
Progress,
5.35%,
3/15/53
200
190
El
Paso
Electric,
5.00%,
12/1/44
110
92
Exelon,
4.10%,
3/15/52
170
131
Exelon,
5.60%,
3/15/53
285
275
FirstEnergy
Pennsylvania
Electric,
6.15%,
10/1/38
165
168
Florida
Power
&
Light,
2.875%,
12/4/51
130
83
Florida
Power
&
Light,
5.60%,
6/15/54
500
503
Georgia
Power,
4.95%,
5/17/33
140
136
Indianapolis
Power
&
Light,
5.70%,
4/1/54 (1)
740
722
IPALCO
Enterprises,
5.75%,
4/1/34 (1)
825
811
ITC
Holdings,
5.65%,
5/9/34 (1)
1,000
1,001
Kentucky
Utilities,
4.375%,
10/1/45
200
165
Louisville
Gas
&
Electric,
4.375%,
10/1/45
100
83
Nevada
Power,
6.00%,
3/15/54
300
303
New
York
State
Electric
&
Gas,
5.85%,
8/15/33 (1)
90
91
NextEra
Energy
Capital
Holdings,
3.00%,
1/15/52
45
28
NextEra
Energy
Capital
Holdings,
5.25%,
2/28/53
585
544
Niagara
Mohawk
Power,
5.29%,
1/17/34 (1)
500
485
Pacific
Gas
&
Electric,
4.95%,
7/1/50
250
209
Pacific
Gas
&
Electric,
6.15%,
1/15/33
150
153
Pacific
Gas
&
Electric,
6.75%,
1/15/53
390
411
Pacific
Gas
&
Electric,
6.95%,
3/15/34
410
442
PECO
Energy,
4.90%,
6/15/33
300
294
Public
Service
Company
of
Colorado,
5.25%,
4/1/53
100
92
San
Diego
Gas
&
Electric,
Series TTT,
4.10%,
6/15/49
55
43
Southern,
4.25%,
7/1/36
430
381
Southern,
4.40%,
7/1/46
600
504
Southern,
5.70%,
3/15/34
140
142
Southern
California
Edison,
5.75%,
4/15/54
500
494
Southern
California
Edison,
5.875%,
12/1/53
250
250
Southern
California
Edison,
Series C,
4.125%,
3/1/48
150
117
Vistra
Operations,
4.30%,
7/15/29 (1)
225
210
Vistra
Operations,
6.95%,
10/15/33 (1)
90
96
15,686
Par/Shares
$
Value
(Amounts
in
000s)
‡
Energy
6.1%
Canadian
Natural
Resources,
6.25%,
3/15/38
300
308
Cheniere
Energy,
5.65%,
4/15/34 (1)
250
248
Cheniere
Energy
Partners,
5.75%,
8/15/34 (1)
820
813
ConocoPhillips,
5.55%,
3/15/54
350
344
Diamondback
Energy,
4.25%,
3/15/52
170
132
Enbridge,
5.95%,
4/5/54
500
495
Enbridge,
6.70%,
11/15/53
120
131
Enbridge
Energy
Partners,
7.375%,
10/15/45
120
137
Energy
Transfer,
5.95%,
5/15/54
425
408
Energy
Transfer,
6.50%,
2/1/42
595
613
Eni,
5.95%,
5/15/54 (1)
295
292
Enterprise
Products
Operating,
3.30%,
2/15/53
1,400
940
Kinder
Morgan
Energy
Partners,
6.95%,
1/15/38
195
212
Marathon
Oil,
5.20%,
6/1/45
300
277
MPLX,
5.65%,
3/1/53
300
282
Occidental
Petroleum,
4.40%,
4/15/46
350
275
ONEOK,
6.625%,
9/1/53
295
316
ONEOK
Partners,
6.85%,
10/15/37
250
266
Ovintiv,
6.25%,
7/15/33
75
77
Patterson-UTI
Energy,
7.15%,
10/1/33
85
89
Raizen
Fuels
Finance,
6.45%,
3/5/34 (1)
200
203
Southern
Natural
Gas,
4.80%,
3/15/47 (1)
205
167
Spectra
Energy
Partners,
5.95%,
9/25/43
115
113
Suncor
Energy,
4.00%,
11/15/47
310
233
Targa
Resources,
4.95%,
4/15/52
80
68
Targa
Resources,
6.50%,
2/15/53
100
105
TotalEnergies
Capital,
5.488%,
4/5/54
800
791
TransCanada
PipeLines,
6.10%,
6/1/40
450
456
Transcanada
Trust,
VR,
5.30%,
3/15/77 (2)
120
112
Transcontinental
Gas
Pipe
Line,
4.60%,
3/15/48
575
491
Williams,
4.85%,
3/1/48
100
86
9,480
Finance
Companies
1.3%
AerCap
Ireland
Capital,
3.40%,
10/29/33
300
249
AerCap
Ireland
Capital,
5.30%,
1/19/34
500
485
AerCap
Ireland
Capital,
6.15%,
9/30/30
150
154
GATX,
5.45%,
9/15/33
250
243
GATX,
6.90%,
5/1/34
270
291
T.
ROWE
PRICE
Institutional
Long
Duration
Credit
Fund
Par/Shares
$
Value
(Amounts
in
000s)
‡
SMBC
Aviation
Capital
Finance,
5.55%,
4/3/34 (1)
600
585
2,007
Insurance
5.4%
Aetna,
3.875%,
8/15/47
500
364
Aflac,
4.75%,
1/15/49
550
482
AIA
Group,
5.375%,
4/5/34 (1)
365
357
American
International
Group,
5.125%,
3/27/33
425
415
Arch
Capital
Group,
7.35%,
5/1/34
200
226
Arthur
J
Gallagher,
5.75%,
7/15/54
750
721
Chubb,
Series 1,
6.50%,
5/15/38
200
221
Chubb
INA
Holdings,
2.85%,
12/15/51
100
65
Corebridge
Financial,
4.40%,
4/5/52
300
234
Elevance
Health,
4.375%,
12/1/47
355
297
Elevance
Health,
5.125%,
2/15/53
100
92
Equitable
Holdings,
5.594%,
1/11/33
100
100
Humana,
5.50%,
3/15/53
75
70
Humana,
5.75%,
4/15/54 (3)
260
251
Humana,
5.95%,
3/15/34
185
188
Jackson
Financial,
4.00%,
11/23/51
300
200
Liberty
Mutual
Group,
4.85%,
8/1/44 (1)
180
154
Marsh
&
McLennan,
5.45%,
3/15/53
200
193
Marsh
&
McLennan,
5.70%,
9/15/53
155
156
Metropolitan
Life
Global
Funding
I,
5.05%,
1/8/34 (1)
500
489
Principal
Financial
Group,
6.05%,
10/15/36
235
244
Reinsurance
Group
of
America,
6.00%,
9/15/33
250
255
Teachers
Insurance
&
Annuity
Assn.
of
America,
4.90%,
9/15/44 (1)
200
178
UnitedHealth
Group,
3.25%,
5/15/51
500
344
UnitedHealth
Group,
3.50%,
8/15/39
300
241
UnitedHealth
Group,
5.35%,
2/15/33
160
162
UnitedHealth
Group,
5.375%,
4/15/54
315
305
UnitedHealth
Group,
5.875%,
2/15/53
900
938
Voya
Financial,
5.70%,
7/15/43
500
483
8,425
Miscellaneous
0.2%
Ally
Financial,
8.00%,
11/1/31
200
218
218
Natural
Gas
1.9%
Boston
Gas,
6.119%,
7/20/53 (1)
215
212
Engie,
5.875%,
4/10/54 (1)
750
735
NiSource,
3.95%,
3/30/48
260
195
NiSource,
5.35%,
4/1/34
750
731
NiSource,
5.40%,
6/30/33
75
74
Piedmont
Natural
Gas,
5.40%,
6/15/33
250
248
Sempra,
4.00%,
2/1/48
120
91
Sempra,
5.50%,
8/1/33 (3)
250
249
Par/Shares
$
Value
(Amounts
in
000s)
‡
Sempra
Energy,
3.80%,
2/1/38
600
490
3,025
Real
Estate
Investment
Trusts
1.4%
Alexandria
Real
Estate
Equities,
4.75%,
4/15/35
70
65
Alexandria
Real
Estate
Equities,
5.25%,
5/15/36
110
105
Essex
Portfolio,
4.50%,
3/15/48 (3)
130
107
Kilroy
Realty,
2.65%,
11/15/33 (3)
350
256
NNN
REIT,
4.80%,
10/15/48
235
197
Prologis,
5.00%,
3/15/34
500
488
Public
Storage
Operating,
5.35%,
8/1/53
55
53
Regency
Centers,
5.25%,
1/15/34
520
506
Simon
Property
Group,
5.85%,
3/8/53
200
197
Simon
Property
Group,
6.65%,
1/15/54
250
275
2,249
Technology
3.6%
Apple,
2.95%,
9/11/49
400
271
Apple,
3.75%,
9/12/47
400
318
Apple,
4.85%,
5/10/53 (3)
200
191
Broadcom,
4.926%,
5/15/37 (1)
400
372
Fiserv,
4.40%,
7/1/49
185
151
Fiserv,
5.45%,
3/15/34
715
709
Fiserv,
5.60%,
3/2/33
85
85
Foundry
JV
Holdco,
6.40%,
1/25/38 (1)
495
507
Intuit,
5.50%,
9/15/53
115
115
Micron
Technology,
3.366%,
11/1/41
400
292
Motorola
Solutions,
5.40%,
4/15/34
140
138
NXP,
3.25%,
5/11/41
400
293
Oracle,
3.60%,
4/1/40
1,000
769
Oracle,
3.95%,
3/25/51
350
257
Oracle,
5.55%,
2/6/53
630
594
Texas
Instruments,
5.00%,
3/14/53
250
233
Texas
Instruments,
5.05%,
5/18/63
180
167
Workday,
3.80%,
4/1/32
200
179
5,641
Transportation
2.2%
Burlington
Northern
Santa
Fe,
5.05%,
3/1/41
75
71
Burlington
Northern
Santa
Fe,
5.20%,
4/15/54
300
284
Canadian
National
Railway,
5.85%,
11/1/33
270
283
Canadian
Pacific
Railway,
3.10%,
12/2/51
125
83
Canadian
Pacific
Railway,
4.70%,
5/1/48
500
430
CSX,
4.30%,
3/1/48
140
117
CSX,
4.50%,
11/15/52
400
341
ERAC
USA
Finance,
5.20%,
10/30/34 (1)
500
491
T.
ROWE
PRICE
Institutional
Long
Duration
Credit
Fund
Par/Shares
$
Value
(Amounts
in
000s)
‡
ERAC
USA
Finance,
5.40%,
5/1/53 (1)
250
241
FedEx,
4.55%,
4/1/46
800
664
Norfolk
Southern,
4.837%,
10/1/41
250
228
Norfolk
Southern,
5.35%,
8/1/54
250
238
3,471
Total
Corporate
Bonds
(Cost
$128,544)
122,827
FOREIGN
GOVERNMENT
OBLIGATIONS
&
MUNICIPALITIES
2.8%
Owned
No
Guarantee
0.9%
Corp.
Nacional
del
Cobre
de
Chile,
6.44%,
1/26/36 (1)
390
398
Petroleos
Mexicanos,
5.50%,
6/27/44
175
108
Petroleos
Mexicanos,
6.50%,
6/2/41
1,000
691
Petroleos
Mexicanos,
7.69%,
1/23/50
200
146
1,343
Sovereign
1.9%
Kingdom
of
Saudi
Arabia,
5.75%,
1/16/54 (1)
370
358
Republic
of
Colombia,
4.125%,
5/15/51
200
119
Republic
of
Colombia,
8.75%,
11/14/53
200
210
Republic
of
Panama,
4.50%,
4/16/50
400
266
Republic
of
Panama,
4.50%,
1/19/63
200
126
Republic
of
Panama,
7.875%,
3/1/57
200
206
Republic
of
Peru,
3.00%,
1/15/34 (3)
400
321
State
of
Qatar,
4.40%,
4/16/50 (1)
200
171
United
Mexican
States,
4.40%,
2/12/52
400
296
United
Mexican
States,
4.75%,
3/8/44
600
487
United
Mexican
States,
6.00%,
5/7/36
310
305
United
Mexican
States,
6.338%,
5/4/53
200
191
3,056
Total
Foreign
Government
Obligations
&
Municipalities
(Cost
$4,584)
4,399
MUNICIPAL
SECURITIES
5.2%
California
1.2%
Bay
Area
Toll
Auth.,
Series S-10,
3.276%,
4/1/50
400
293
Bay
Area
Toll
Auth.,
Series S-3,
Build
America,
6.907%,
10/1/50
350
405
California,
Build
America,
GO,
7.50%,
4/1/34
500
575
California,
Various
Purpose,
GO,
5.20%,
3/1/43
350
343
Par/Shares
$
Value
(Amounts
in
000s)
‡
Los
Angeles
Dept.
of
Water
&
Power,
Build
America,
6.574%,
7/1/45
200
220
1,836
District
of
Columbia
0.2%
Metropolitan
Washington
Airports
Auth.,
Dulles
Toll
Road
Revenue,
Build
America,
7.462%,
10/1/46
200
242
242
Florida
0.3%
Florida
Dev.
Finance,
Nova
Southeastern
Univ.,
Series B,
4.109%,
4/1/50
375
296
Miami-Dade
County
Transit
System,
Series B,
Build
America,
5.624%,
7/1/40
200
202
498
Georgia
0.8%
Fulton
County,
Build
America,
GO,
5.148%,
7/1/39
505
491
Municipal
Electric
Auth.
of
Georgia,
Build
America,
Vogtle
Units,
6.655%,
4/1/57
633
712
1,203
Illinois
0.1%
Illinois
Municipal
Electric
Agency,
Build
America,
6.832%,
2/1/35
190
202
202
Louisiana
0.0%
Louisiana
Local
Government
Environmental
Fac.,
CDA,
Series A,
4.475%,
8/1/39
90
83
83
Maryland
0.1%
Maryland
Economic
Development,
Seagirt
Marine
Terminal,
Series B,
4.75%,
6/1/42
150
129
129
Massachusetts
0.2%
Massachusetts
Bay
Transportation
Auth.,
Build
America,
5.869%,
7/1/40
115
119
Massachusetts
Water
Resources
Auth.,
Series C,
2.823%,
8/1/41
200
155
274
Michigan
0.4%
Gerald
R
Ford
Int'l.
Airport
Auth.,
Series A,
5.435%,
1/1/43
220
222
Michigan
Fin.
Auth.,
Trinity
Health
Credit
Group,
3.084%,
12/1/34
500
431
653
Minnesota
0.1%
Western
Minnesota
Municipal
Power
Agency,
Series A,
3.156%,
1/1/39
150
123
123
Ohio
0.3%
American
Municipal
Power,
Series C,
Build
America,
6.053%,
2/15/43
500
514
514
T.
ROWE
PRICE
Institutional
Long
Duration
Credit
Fund
Par/Shares
$
Value
(Amounts
in
000s)
‡
Tennessee
0.0%
Metropolitan
Government
Nashville
&
Davidson
County
Health
&
Ed.
Facs,
Vanderbilt
Univ.
Medical,
Series B,
3.235%,
7/1/52
85
53
53
Texas
1.3%
Board
of
Regents
of
the
Univ.
of
Texas
System,
Series D,
Build
America,
5.134%,
8/15/42
200
199
Central
Texas
Regional
Mobility
Auth.,
Series E,
3.167%,
1/1/41
150
113
Central
Texas
Turnpike
System,
Series C,
3.029%,
8/15/41
305
228
Dallas/Fort
Worth
Int'l.
Airport,
Series A,
2.994%,
11/1/38
630
521
Dallas/Fort
Worth
Int'l.
Airport,
Series A,
4.507%,
11/1/51
150
132
Dallas/Fort
Worth
Int'l.
Airport,
Series A,
5.045%,
11/1/47
250
240
Texas
Natural
Gas
Securitization
Fin.,
Series 2023-1,
Class
A2,
5.169%,
4/1/41
545
540
Texas
Private
Activity
Bond
Surface
Transportation,
North
Tarrant
Express,
Series B,
3.922%,
12/31/49
125
101
2,074
Virginia
0.2%
Univ.
of
Virginia,
Series B,
2.584%,
11/1/51
300
187
Virginia
Commonwealth
Univ.
Health
System
Auth.,
Series A,
4.956%,
1/1/44
105
99
286
Total
Municipal
Securities
(Cost
$8,651)
8,170
NON-U.S.
GOVERNMENT
MORTGAGE-BACKED
SECURITIES
0.4%
Commercial
Mortgage-Backed
Securities
0.4%
Federal
Home
Loan
Mortgage
Multifamily
Structured
PTC
Series K137,
Class
A2,
ARM
2.347%,
11/25/31
460
386
Federal
Home
Loan
Mortgage
Multifamily
Structured
PTC
Series K150,
Class
A2,
ARM
3.71%,
9/25/32
265
243
Total
Non-U.S.
Government
Mortgage-Backed
Securities
(Cost
$668)
629
Par/Shares
$
Value
(Amounts
in
000s)
‡
U.S.
GOVERNMENT
AGENCY
OBLIGATIONS
(EXCLUDING
MORTGAGE-BACKED)
12.0%
U.S.
Treasury
Obligations
12.0%
U.S.
Treasury
Bonds,
2.375%,
2/15/42 (4)
75
54
U.S.
Treasury
Bonds,
2.50%,
2/15/45 (4)
16,885
11,894
U.S.
Treasury
Bonds,
3.125%,
5/15/48
3,300
2,534
U.S.
Treasury
Bonds,
3.625%,
2/15/53
55
46
U.S.
Treasury
Bonds,
4.125%,
8/15/53
530
486
U.S.
Treasury
Bonds,
4.625%,
5/15/54
1,000
999
U.S.
Treasury
Bonds,
4.75%,
11/15/53
2,730
2,782
Total
U.S.
Government
Agency
Obligations
(Excluding
Mortgage-
Backed)
(Cost
$19,266)
18,795
SHORT-TERM
INVESTMENTS
0.2%
Money
Market
Funds
0.2%
T.
Rowe
Price
Government
Reserve
Fund,
5.39% (5)(6)
244
244
Total
Short-Term
Investments
(Cost
$244)
244
SECURITIES
LENDING
COLLATERAL
2.1%
INVESTMENTS
IN
A
POOLED
ACCOUNT
THROUGH
SECURITIES
LENDING
PROGRAM
WITH
JPMORGAN
CHASE
BANK 0.2%
Money
Market
Funds 0.2%
T.
Rowe
Price
Government
Reserve
Fund,
5.39% (5)(6)
312
312
Total
Investments
in
a
Pooled
Account
through
Securities
Lending
Program
with
JPMorgan
Chase
Bank
312
T.
ROWE
PRICE
Institutional
Long
Duration
Credit
Fund
Par/Shares
$
Value
(Amounts
in
000s)
‡
INVESTMENTS
IN
A
POOLED
ACCOUNT
THROUGH
SECURITIES
LENDING
PROGRAM
WITH
STATE
STREET
BANK
AND
TRUST
COMPANY 1.9%
Money
Market
Funds 1.9%
T.
Rowe
Price
Government
Reserve
Fund,
5.39% (5)(6)
3,057
3,057
Total
Investments
in
a
Pooled
Account
through
Securities
Lending
Program
with
State
Street
Bank
and
Trust
Company
3,057
Total
Securities
Lending
Collateral
(Cost
$3,369)
3,369
Total
Investments
in
Securities
101.1%
of
Net
Assets
(Cost
$165,326)
$
158,433
‡
Par/Shares
and
Notional
Amount
are
denominated
in
U.S.
dollars
unless
otherwise
noted.
(1)
Security
was
purchased
pursuant
to
Rule
144A
under
the
Securities
Act
of
1933
and
may
be
resold
in
transactions
exempt
from
registration
only
to
qualified
institutional
buyers.
Total
value
of
such
securities
at
period-end
amounts
to
$17,433
and
represents
11.1%
of
net
assets.
(2)
Security
is
a
fix-to-float
security,
which
carries
a
fixed
coupon
until
a
certain
date,
upon
which
it
switches
to
a
floating
rate.
Reference
rate
and
spread
are
provided
if
the
rate
is
currently
floating.
(3)
See
Note
4
.
All
or
a
portion
of
this
security
is
on
loan
at
May
31,
2024.
(4)
At
May
31,
2024,
all
or
a
portion
of
this
security
is
pledged
as
collateral
and/or
margin
deposit
to
cover
future
funding
obligations.
(5)
Seven-day
yield
(6)
Affiliated
Companies
ARM
Adjustable
Rate
Mortgage
(ARM);
rate
shown
is
effective
rate
at
period-end.
The
rates
for
certain
ARMs
are
not
based
on
a
published
reference
rate
and
spread
but
may
be
determined
using
a
formula
based
on
the
rates
of
the
underlying
loans.
CDA
Community
Development
Administration/Authority
GO
General
Obligation
PTC
Pass-Through
Certificate
VR
Variable
Rate;
rate
shown
is
effective
rate
at
period-end.
The
rates
for
certain
variable
rate
securities
are
not
based
on
a
published
reference
rate
and
spread
but
are
determined
by
the
issuer
or
agent
and
based
on
current
market
conditions.
T.
ROWE
PRICE
Institutional
Long
Duration
Credit
Fund
(Amounts
in
000s)
SWAPS
0.8%
Description
Notional
Amount
$
Value
Initial
$
Value
**
Unrealized
$
Gain/(Loss)
CENTRALLY
CLEARED
SWAPS
0.8%
Credit
Default
Swaps,
Protection
Sold
0.8%
Protection
Sold
(Relevant
Credit:
Markit
CDX.NA.HY-S41,
5
Year
Index),
Receive
5.00%
Quarterly,
Pay
upon
credit
default,
12/20/28
8,415
663
295
368
Protection
Sold
(Relevant
Credit:
Markit
CDX.NA.HY-S42,
5
Year
Index),
Receive
5.00%
Quarterly,
Pay
upon
credit
default,
6/20/29
3,300
257
228
29
Protection
Sold
(Relevant
Credit:
Markit
CDX.NA.IG-S41,
5
Year
Index),
Receive
1.00%
Quarterly,
Pay
upon
credit
default,
12/20/28
7,100
176
122
54
Protection
Sold
(Relevant
Credit:
Markit
CDX.NA.IG-S42,
10
Year
Index),
Receive
1.00%
Quarterly,
Pay
upon
credit
default,
6/20/34
5,000
48
29
19
Protection
Sold
(Relevant
Credit:
Markit
CDX.NA.IG-S42,
5
Year
Index),
Receive
1.00%
Quarterly,
Pay
upon
credit
default,
6/20/29
2,750
67
62
5
Total
Centrally
Cleared
Credit
Default
Swaps,
Protection
Sold
474
Total
Centrally
Cleared
Swaps
474
Net
payments
(receipts)
of
variation
margin
to
date
(
447
)
Variation
margin
receivable
(payable)
on
centrally
cleared
swaps
$
27
**
Includes
interest
purchased
or
sold
but
not
yet
collected
of
$10.
T.
ROWE
PRICE
Institutional
Long
Duration
Credit
Fund
FUTURES
CONTRACTS
($000s)
Expiration
Date
Notional
Amount
Value
and
Unrealized
Gain
(Loss)
Long,
134
U.S.
Treasury
Long
Bond
contracts
9/24
15,552
$
(
113
)
Short,
29
U.S.
Treasury
Notes
five
year
contracts
9/24
(3,068)
2
Short,
30
U.S.
Treasury
Notes
ten
year
contracts
9/24
(3,264)
4
Long,
76
Ultra
U.S.
Treasury
Bonds
contracts
9/24
9,305
(
115
)
Short,
144
Ultra
U.S.
Treasury
Notes
ten
year
contracts
9/24
(16,132)
56
Net
payments
(receipts)
of
variation
margin
to
date
231
Variation
margin
receivable
(payable)
on
open
futures
contracts
$
65
T.
ROWE
PRICE
Institutional
Long
Duration
Credit
Fund
The
accompanying
notes
are
an
integral
part
of
these
financial
statements.
AFFILIATED
COMPANIES
($000s)
The
fund
may
invest
in
certain
securities
that
are
considered
affiliated
companies.
As
defined
by
the
1940
Act,
an
affiliated
company
is
one
in
which
the
fund
owns
5%
or
more
of
the
outstanding
voting
securities,
or
a
company
that
is
under
common
ownership
or
control.
The
following
securities
were
considered
affiliated
companies
for
all
or
some
portion
of
the
year
ended
May
31,
2024.
Net
realized
gain
(loss),
investment
income,
change
in
net
unrealized
gain/loss,
and
purchase
and
sales
cost
reflect
all
activity
for
the
period
then
ended.
Affiliate
Net
Realized
Gain
(Loss)
Change
in
Net
Unrealized
Gain/Loss
Investment
Income
T.
Rowe
Price
Government
Reserve
Fund,
5.39%
$
—
$
—
$
76
++
Totals
$
—
#
$
—
$
76
+
Supplementary
Investment
Schedule
Affiliate
Value
05/31/23
Purchase
Cost
Sales
Cost
Value
05/31/24
T.
Rowe
Price
Government
Reserve
Fund,
5.39%
$
1,278
^
^
$
3,613
Total
$
3,613
^
#
Capital
gain
distributions
from
underlying
Price
funds
represented
$0
of
the
net
realized
gain
(loss).
++
Excludes
earnings
on
securities
lending
collateral,
which
are
subject
to
rebates
and
fees
as
described
in
Note
4
.
+
Investment
income
comprised
$76
of
dividend
income
and
$0
of
interest
income.
^
Purchase
and
sale
information
not
shown
for
cash
management
funds.
^
The
cost
basis
of
investments
in
affiliated
companies
was
$3,613.
T.
ROWE
PRICE
Institutional
Long
Duration
Credit
Fund
May
31,
2024
Statement
of
Assets
and
Liabilities
($000s,
except
shares
and
per
share
amounts)
The
accompanying
notes
are
an
integral
part
of
these
financial
statements.
Assets
Investments
in
securities,
at
value
(cost
$165,326)
$
158,433
Interest
receivable
1,942
Receivable
for
shares
sold
526
Variation
margin
receivable
on
futures
contracts
65
Variation
margin
receivable
on
centrally
cleared
swaps
27
Cash
9
Other
assets
10
Total
assets
161,012
Liabilities
Obligation
to
return
securities
lending
collateral
3,369
Payable
for
investment
securities
purchased
499
Payable
for
shares
redeemed
364
Investment
management
and
administrative
fees
payable
47
Total
liabilities
4,279
NET
ASSETS
$
156,733
Net
Assets
Consist
of:
Total
distributable
earnings
(loss)
$
(
11,309
)
Paid-in
capital
applicable
to
20,841,013
shares
of
$0.0001
par
value
capital
stock
outstanding;
4,000,000,000
shares
of
the
Corporation
authorized
168,042
NET
ASSETS
$
156,733
NET
ASSET
VALUE
PER
SHARE
$
7.52
T.
ROWE
PRICE
Institutional
Long
Duration
Credit
Fund
The
accompanying
notes
are
an
integral
part
of
these
financial
statements.
Year
Ended
5/31/24
Investment
Income
(Loss)
Income
Interest
$
4,972
Dividend
76
Securities
lending
9
Total
income
5,057
Investment
management
and
administrative
expense
427
Net
investment
income
4,630
Realized
and
Unrealized
Gain
/
Loss
–
Net
realized
gain
(loss)
Securities
(
1,415
)
Futures
(
307
)
Swaps
796
Net
realized
loss
(
926
)
Change
in
net
unrealized
gain
/
loss
Securities
(
1,314
)
Futures
(
184
)
Swaps
226
Change
in
net
unrealized
gain
/
loss
(
1,272
)
Net
realized
and
unrealized
gain
/
loss
(
2,198
)
INCREASE
IN
NET
ASSETS
FROM
OPERATIONS
$
2,432
T.
ROWE
PRICE
Institutional
Long
Duration
Credit
Fund
Statement
of
Changes
in
Net
Assets
The
accompanying
notes
are
an
integral
part
of
these
financial
statements.
Year
.
.
.
..
.
.
.
.
.
.
.
. ..
.
..
Ended
.
.
.
.
.
.
. .
.
.
.
.
..
..
.
5/31/24
5/31/23
Increase
(Decrease)
in
Net
Assets
Operations
Net
investment
income
$
4,630
$
1,330
Net
realized
loss
(
926
)
(
918
)
Change
in
net
unrealized
gain
/
loss
(
1,272
)
(
1,667
)
Increase
(decrease)
in
net
assets
from
operations
2,432
(
1,255
)
Distributions
to
shareholders
Net
earnings
(
5,117
)
(
1,489
)
Capital
share
transactions
*
Shares
sold
125,763
34,945
Distributions
reinvested
4,817
1,105
Shares
redeemed
(
26,706
)
(
2,611
)
Increase
in
net
assets
from
capital
share
transactions
103,874
33,439
Net
Assets
Increase
during
period
101,189
30,695
Beginning
of
period
55,544
24,849
End
of
period
$
156,733
$
55,544
*Share
information
(000s)
Shares
sold
16,653
4,439
Distributions
reinvested
638
140
Shares
redeemed
(
3,597
)
(
326
)
Increase
in
shares
outstanding
13,694
4,253
T.
ROWE
PRICE
Institutional
Long
Duration
Credit
Fund
NOTES
TO
FINANCIAL
STATEMENTS
T.
Rowe
Price
Institutional
Income
Funds,
Inc. (the
corporation) is
registered
under
the
Investment
Company
Act
of
1940
(the
1940
Act).
The
Institutional
Long
Duration
Credit
Fund
(the
fund)
is a
diversified, open-end
management
investment
company
established
by
the
corporation. The
fund
seeks
to
provide
high
income.
NOTE
1
-
SIGNIFICANT
ACCOUNTING
POLICIES
Basis
of
Preparation
The fund
is
an
investment
company
and
follows
accounting
and
reporting
guidance
in
the
Financial
Accounting
Standards
Board
(FASB)
Accounting
Standards
Codification
Topic
946
(ASC
946).
The
accompanying
financial
statements
were
prepared
in
accordance
with
accounting
principles
generally
accepted
in
the
United
States
of
America
(GAAP),
including,
but
not
limited
to,
ASC
946.
GAAP
requires
the
use
of
estimates
made
by
management.
Management
believes
that
estimates
and
valuations
are
appropriate;
however,
actual
results
may
differ
from
those
estimates,
and
the
valuations
reflected
in
the
accompanying
financial
statements
may
differ
from
the
value
ultimately
realized
upon
sale
or
maturity.
Investment
Transactions,
Investment
Income,
and
Distributions
Investment
transactions
are
accounted
for
on
the
trade
date
basis.
Income
and
expenses
are
recorded
on
the
accrual
basis.
Realized
gains
and
losses
are
reported
on
the
identified
cost
basis. Premiums
and
discounts
on
debt
securities
are
amortized
for
financial
reporting
purposes. Paydown
gains
and
losses
are
recorded
as
an
adjustment
to
interest
income. Income
tax-related
interest
and
penalties,
if
incurred,
are
recorded
as
income
tax
expense. Dividends
received
from other
investment
companies are
reflected
as
dividend income;
capital
gain
distributions
are
reflected
as
realized
gain/loss. Dividend
income and
capital
gain
distributions
are
recorded
on
the
ex-dividend
date. Non-cash
dividends,
if
any,
are
recorded
at
the
fair
market
value
of
the
asset
received. Proceeds
from
litigation
payments,
if
any,
are
included
in
either
net
realized
gain
(loss)
or
change
in
net
unrealized
gain/loss
from
securities. Distributions
to
shareholders
are
recorded
on
the
ex-dividend
date. Income
distributions,
if
any, are
declared daily
and
paid
monthly. A
capital
gain
distribution,
if
any, may
also
be
declared
and
paid
by
the
fund
annually.
Capital
Transactions
Each
investor’s
interest
in
the
net
assets
of the
fund
is
represented
by
fund
shares. The
fund’s
net
asset
value
(NAV)
per
share
is
computed
at
the
close
of
the
New
York
Stock
Exchange
(NYSE),
normally
4
p.m.
ET,
each
day
the
NYSE
is
open
for
business.
However,
the
NAV
per
share
may
be
calculated
at
a
time
other
than
the
normal
close
of
the
NYSE
if
trading
on
the
NYSE
is
restricted,
if
the
NYSE
closes
earlier,
or
as
may
be
permitted
by
the
SEC.
Purchases
and
redemptions
of
fund
shares
are
transacted
at
the
next-computed
NAV
per
share,
after
receipt
of
the
transaction
order
by
T.
Rowe
Price
Associates,
Inc.,
or
its
agents.
Indemnification
In
the
normal
course
of
business, the
fund
may
provide
indemnification
in
connection
with
its
officers
and
directors,
service
providers,
and/or
private
company
investments. The
fund’s
maximum
exposure
under
these
arrangements
is
unknown;
however,
the
risk
of
material
loss
is
currently
considered
to
be
remote.
NOTE
2
-
VALUATION
Fair
Value
The
fund’s
financial
instruments
are
valued
at
the
close
of
the
NYSE
and
are
reported
at
fair
value,
which
GAAP
defines
as
the
price
that
would
be
received
to
sell
an
asset
or
paid
to
transfer
a
liability
in
an
orderly
transaction
between
market
participants
at
the
measurement
date. The fund’s
Board
of
Directors
(the
Board)
has
designated
T.
Rowe
Price
Associates,
Inc.
as
the
fund’s
valuation
designee
(Valuation
Designee).
Subject
to
oversight
by
the
Board,
the
Valuation
Designee
performs
the
following
functions
in
performing
fair
value
determinations:
assesses
and
manages
valuation
risks;
establishes
and
applies
fair
value
methodologies;
tests
fair
value
methodologies;
and
evaluates
pricing
vendors
and
pricing
agents.
The
duties
and
responsibilities
of
the
Valuation
Designee
are
performed
by
its
Valuation
Committee. The
Valuation
Designee provides
periodic
reporting
to
the
Board
on
valuation
matters.
Various
valuation
techniques
and
inputs
are
used
to
determine
the
fair
value
of
financial
instruments.
GAAP
establishes
the
following
fair
value
hierarchy
that
categorizes
the
inputs
used
to
measure
fair
value:
T.
ROWE
PRICE
Institutional
Long
Duration
Credit
Fund
Level
1
–
quoted
prices
(unadjusted)
in
active
markets
for
identical
financial
instruments
that
the
fund
can
access
at
the
reporting
date
Level
2
–
inputs
other
than
Level
1
quoted
prices
that
are
observable,
either
directly
or
indirectly
(including,
but
not
limited
to,
quoted
prices
for
similar
financial
instruments
in
active
markets,
quoted
prices
for
identical
or
similar
financial
instruments
in
inactive
markets,
interest
rates
and
yield
curves,
implied
volatilities,
and
credit
spreads)
Level
3
–
unobservable
inputs
(including
the Valuation
Designee’s assumptions
in
determining
fair
value)
Observable
inputs
are
developed
using
market
data,
such
as
publicly
available
information
about
actual
events
or
transactions,
and
reflect
the
assumptions
that
market
participants
would
use
to
price
the
financial
instrument.
Unobservable
inputs
are
those
for
which
market
data
are
not
available
and
are
developed
using
the
best
information
available
about
the
assumptions
that
market
participants
would
use
to
price
the
financial
instrument.
GAAP
requires
valuation
techniques
to
maximize
the
use
of
relevant
observable
inputs
and
minimize
the
use
of
unobservable
inputs.
When
multiple
inputs
are
used
to
derive
fair
value,
the
financial
instrument
is
assigned
to
the
level
within
the
fair
value
hierarchy
based
on
the
lowest-level
input
that
is
significant
to
the
fair
value
of
the
financial
instrument.
Input
levels
are
not
necessarily
an
indication
of
the
risk
or
liquidity
associated
with
financial
instruments
at
that
level
but
rather
the
degree
of
judgment
used
in
determining
those
values.
Valuation
Techniques
Debt
securities
generally
are
traded
in
the over-the-counter
(OTC)
market
and
are
valued
at
prices
furnished
by
independent
pricing
services
or
by
broker
dealers
who
make
markets
in
such
securities.
When
valuing
securities,
the
independent
pricing
services
consider
factors
such
as,
but
not
limited
to,
the
yield
or
price
of
bonds
of
comparable
quality,
coupon,
maturity,
and
type,
as
well
as
prices
quoted
by
dealers
who
make
markets
in
such
securities.
Investments
in
mutual
funds
are
valued
at
the
mutual
fund’s
closing
NAV
per
share
on
the
day
of
valuation.
Futures
contracts
are
valued
at
closing
settlement
prices.
Swaps
are
valued
at
prices
furnished
by
an
independent
pricing
service
or
independent
swap
dealers.
Assets
and
liabilities
other
than
financial
instruments,
including
short-term
receivables
and
payables,
are
carried
at
cost,
or
estimated
realizable
value,
if
less,
which
approximates
fair
value.
Investments
for
which
market
quotations are
not
readily
available
or
deemed
unreliable
are
valued
at
fair
value
as
determined
in
good
faith
by
the
Valuation
Designee.
The
Valuation
Designee
has
adopted
methodologies
for
determining
the
fair
value
of
investments
for
which
market
quotations
are
not
readily
available
or
deemed
unreliable,
including
the
use
of
other
pricing
sources.
Factors
used
in
determining
fair
value
vary
by
type
of
investment
and
may
include
market
or
investment
specific
considerations.
The
Valuation
Designee typically
will
afford
greatest
weight
to
actual
prices
in
arm’s
length
transactions,
to
the
extent
they
represent
orderly
transactions
between
market
participants,
transaction
information
can
be
reliably
obtained,
and
prices
are
deemed
representative
of
fair
value.
However,
the
Valuation
Designee may
also
consider
other
valuation
methods
such
as
market-based
valuation
multiples;
a
discount
or
premium
from
market
value
of
a
similar,
freely
traded
security
of
the
same
issuer;
discounted
cash
flows;
yield
to
maturity;
or
some
combination.
Fair
value
determinations
are
reviewed
on
a
regular
basis.
Because
any
fair
value
determination
involves
a
significant
amount
of
judgment,
there
is
a
degree
of
subjectivity
inherent
in
such
pricing
decisions. Fair
value
prices
determined
by
the
Valuation
Designee could
differ
from
those
of
other
market
participants,
and
it
is
possible
that
the
fair
value
determined
for
a
security
may
be
materially
different
from
the
value
that
could
be
realized
upon
the
sale
of
that
security.
T.
ROWE
PRICE
Institutional
Long
Duration
Credit
Fund
Valuation
Inputs
The
following
table
summarizes
the
fund’s
financial
instruments,
based
on
the
inputs
used
to
determine
their
fair
values
on
May
31,
2024
(for
further
detail
by
category,
please
refer
to
the
accompanying
Portfolio
of
Investments):
NOTE
3
-
DERIVATIVE
INSTRUMENTS
During
the
year ended
May
31,
2024,
the
fund
invested
in
derivative
instruments.
As
defined
by
GAAP,
a
derivative
is
a
financial
instrument
whose
value
is
derived
from
an
underlying
security
price,
foreign
exchange
rate,
interest
rate,
index
of
prices
or
rates,
or
other
variable;
it
requires
little
or
no
initial
investment
and
permits
or
requires
net
settlement.
The
fund
invests
in
derivatives
only
if
the
expected
risks
and
rewards
are
consistent
with
its
investment
objectives,
policies,
and
overall
risk
profile,
as
described
in
its
prospectus
and
Statement
of
Additional
Information.
The
fund
may
use
derivatives
for
a
variety
of
purposes
and
may
use
them
to
establish
both
long
and
short
positions
within
the
fund’s
portfolio.
Potential
uses
include
to
hedge
against
declines
in
principal
value,
increase
yield,
invest
in
an
asset
with
greater
efficiency
and
at
a
lower
cost
than
is
possible
through
direct
investment,
to
enhance
return,
or
to
adjust
portfolio
duration
and
credit
exposure.
The
risks
associated
with
the
use
of
derivatives
are
different
from,
and
potentially
much
greater
than,
the
risks
associated
with
investing
directly
in
the
instruments
on
which
the
derivatives
are
based.
The
fund
values
its
derivatives
at
fair
value
and
recognizes
changes
in
fair
value
currently
in
its
results
of
operations.
Accordingly,
the
fund
does
not
follow
hedge
accounting,
even
for
derivatives
employed
as
economic
hedges.
Generally,
the
fund
accounts
for
its
derivatives
on
a
gross
basis.
It
does
not
offset
the
fair
value
of
derivative
liabilities
against
the
fair
value
of
derivative
assets
on
its
financial
statements,
nor
does
it
offset
the
fair
value
of
derivative
instruments
against
the
right
to
reclaim
or
obligation
to
return
collateral.
The
following
table
summarizes
the
fair
value
of
the
fund’s
derivative
instruments
held
as
of
May
31,
2024,
and
the
related
location
on
the
accompanying
Statement
of
Assets
and
Liabilities,
presented
by
primary
underlying
risk
exposure:
($000s)
Level
1
Level
2
Level
3
Total
Value
Assets
Fixed
Income
Securities
1
$
—
$
154,820
$
—
$
154,820
Short-Term
Investments
244
—
—
244
Securities
Lending
Collateral
3,369
—
—
3,369
Total
Securities
3,613
154,820
—
158,433
Swaps*
—
474
—
474
Futures
Contracts*
62
—
—
62
Total
$
3,675
$
155,294
$
—
$
158,969
Liabilities
Futures
Contracts*
$
228
$
—
$
—
$
228
1
Includes
Corporate
Bonds,
Foreign
Government
Obligations
&
Municipalities,
Municipal
Securities,
Non-U.S.
Government
Mortgage-
Backed
Securities
and
U.S.
Government
Agency
Obligations
(Excluding
Mortgage-Backed).
*
The
fair
value
presented
includes
cumulative
gain
(loss)
on
open
futures
contracts
and
centrally
cleared
swaps;
however,
the
net
value
reflected
on
the
accompanying
Portfolio
of
Investments
is
only
the
unsettled
variation
margin
receivable
(payable)
at
that
date.
T.
ROWE
PRICE
Institutional
Long
Duration
Credit
Fund
Additionally,
the
amount
of
gains
and
losses
on
derivative
instruments
recognized
in
fund
earnings
during
the
year ended
May
31,
2024,
and
the
related
location
on
the
accompanying
Statement
of
Operations
is
summarized
in
the
following
table
by
primary
underlying
risk
exposure:
Counterparty
Risk
and
Collateral
The
fund
invests
in
exchange-traded
and/or
centrally
cleared
derivative
contracts,
such
as
futures,
exchange-traded
options,
and
centrally
cleared
swaps.
Counterparty
risk
on
such
derivatives
is
minimal
because
the
clearinghouse
provides
protection
against
counterparty
defaults.
For
futures
and
centrally
cleared
swaps,
the
fund
is
required
to
deposit
collateral
in
an
amount
specified
by
the
clearinghouse
and
the
clearing
firm
(margin
requirement),
and
the
margin
requirement
must
be
maintained
over
the
life
of
the
contract.
Each
clearinghouse
and
clearing
firm,
in
its
sole
discretion,
may
adjust
the
margin
requirements
applicable
to
the
fund.
Collateral may
be
in
the
form
of
cash
or
debt
securities
issued
by
the
U.S.
government
or
related
agencies.
Cash
posted
by
the
fund
is
reflected
as
cash
deposits
in
the
accompanying
financial
statements
and
generally
is
restricted
from
withdrawal
by
the
fund;
securities
posted
by
the
fund
are
so
noted
in
the
accompanying
Portfolio
of
Investments;
both
remain
in
the
fund’s
assets.
While
typically
not
sold
in
the
same
manner
as
equity
or
fixed
income
securities,
exchange-
traded
or
centrally
cleared
derivatives
may
be
closed
out
only
on
the
exchange
or
clearinghouse
where
the
contracts
were
cleared.
This
ability
is
subject
to
the
liquidity
of
underlying
positions. As
of
May
31,
2024,
securities
valued
at $2,030,000
had
been
posted
by
the
fund
for
exchange-traded
and/or
centrally
cleared
derivatives.
($000s)
Location
on
Statement
of
Assets
and
Liabilities
Fair
Value*
Assets
Interest
rate
derivatives
Futures
$
62
Credit
derivatives
Centrally
Cleared
Swaps
474
*
Total
$
536
*
Liabilities
Interest
rate
derivatives
Futures
$
228
Total
$
228
*
The
fair
value
presented
includes
cumulative
gain
(loss)
on
open
futures
contracts
and
centrally
cleared
swaps;
however,
the
value
reflected
on
the
accompanying
Statement
of
Assets
and
Liabilities
is
only
the
unsettled
variation
margin
receivable
(payable)
at
that
date.
($000s)
Location
of
Gain
(Loss)
on
Statement
of
Operations
Futures
Swaps
Total
Realized
Gain
(Loss)
Interest
rate
derivatives
$
(307)
$
—
$
(307)
Credit
derivatives
—
796
796
Total
$
(307)
$
796
$
489
Change
in
Unrealized
Gain
(Loss)
Interest
rate
derivatives
$
(184)
$
—
$
(184)
Credit
derivatives
—
226
226
Total
$
(184)
$
226
$
42
T.
ROWE
PRICE
Institutional
Long
Duration
Credit
Fund
Futures
Contracts
The
fund
is
subject
to interest
rate
risk in
the
normal
course
of
pursuing
its
investment
objectives
and
uses
futures
contracts
to
help
manage
such
risk.
The fund
may
enter
into
futures
contracts
to
manage
exposure
to
interest
rate
and
yield
curve
movements,
security
prices,
foreign
currencies,
credit
quality,
and
mortgage
prepayments;
as
an
efficient
means
of
adjusting
exposure
to
all
or
part
of
a
target
market;
to
enhance
income;
as
a
cash
management
tool;
or
to
adjust
portfolio
duration
and
credit
exposure. A
futures
contract
provides
for
the
future
sale
by
one
party
and
purchase
by
another
of
a
specified
amount
of
a
specific
underlying
financial
instrument
at
an
agreed-upon
price,
date,
time,
and
place.
The
fund
currently
invests
only
in
exchange-traded
futures,
which
generally
are
standardized
as
to
maturity
date,
underlying
financial
instrument,
and
other
contract
terms.
Payments
are
made
or
received
by
the
fund
each
day
to
settle
daily
fluctuations
in
the
value
of
the
contract
(variation
margin),
which
reflect
changes
in
the
value
of
the
underlying
financial
instrument.
Variation
margin
is
recorded
as
unrealized
gain
or
loss
until
the
contract
is
closed.
The
value
of
a
futures
contract
included
in
net
assets
is
the
amount
of
unsettled
variation
margin;
net
variation
margin
receivable
is
reflected
as
an
asset
and
net
variation
margin
payable
is
reflected
as
a
liability
on
the
accompanying
Statement
of
Assets
and
Liabilities.
When
a
contract
is
closed,
a
realized
gain
or
loss
is
recorded
on
the
accompanying
Statement
of
Operations.
Risks
related
to
the
use
of
futures
contracts
include
possible
illiquidity
of
the
futures
markets,
contract
prices
that
can
be
highly
volatile
and
imperfectly
correlated
to
movements
in
hedged
security
values
and/or
interest
rates,
and
potential
losses
in
excess
of
the
fund’s
initial
investment.
During
the
year ended
May
31,
2024,
the
volume
of
the
fund’s
activity
in
futures,
based
on
underlying
notional
amounts,
was
generally
between
4%
and
27%
of
net
assets.
Swaps
The
fund
is
subject
to
credit
risk in
the
normal
course
of
pursuing
its
investment
objectives
and
uses
swap
contracts
to
help
manage
such
risk.
The
fund
may
use
swaps
in
an
effort
to
manage
both
long
and
short
exposure
to
changes
in
interest
rates,
inflation
rates,
and
credit
quality;
to
adjust
overall
exposure
to
certain
markets;
to
enhance
total
return
or
protect
the
value
of
portfolio
securities;
to
serve
as
a
cash
management
tool;
or
to
adjust
portfolio
duration
and
credit
exposure.
Swap
agreements
can
be
settled
either
directly
with
the
counterparty
(bilateral
swap)
or
through
a
central
clearinghouse
(centrally
cleared
swap).
Fluctuations
in
the
fair
value
of
a
contract
are
reflected
in
unrealized
gain
or
loss
and
are
reclassified
to
realized
gain
or
loss
on
the
accompanying
Statement
of
Operations upon
contract
termination
or
cash
settlement.
Net
periodic
receipts
or
payments
required
by
a
contract
increase
or
decrease,
respectively,
the
value
of
the
contract
until
the
contractual
payment
date,
at
which
time
such
amounts
are
reclassified
from
unrealized
to
realized
gain
or
loss
on
the
accompanying
Statement
of
Operations.
For
bilateral
swaps,
cash
payments
are
made
or
received
by
the
fund
on
a
periodic
basis
in
accordance
with
contract
terms;
unrealized
gain
on
contracts
and
premiums
paid
are
reflected
as
assets
and
unrealized
loss
on
contracts
and
premiums
received
are
reflected
as
liabilities
on
the
accompanying
Statement
of
Assets
and
Liabilities.
For
bilateral
swaps,
premiums
paid
or
received
are
amortized
over
the
life
of
the
swap
and
are
recognized
as
realized
gain
or
loss
on
the
accompanying
Statement
of
Operations.
For
centrally
cleared
swaps,
payments
are
made
or
received
by
the
fund
each
day
to
settle
the
daily
fluctuation
in
the
value
of
the
contract
(variation
margin).
Accordingly,
the
value
of
a
centrally
cleared
swap
included
in
net
assets
is
the
unsettled
variation
margin;
net
variation
margin
receivable
is
reflected
as
an
asset
and
net
variation
margin
payable
is
reflected
as
a
liability
on
the
accompanying
Statement
of
Assets
and
Liabilities.
Credit
default
swaps
are
agreements
where
one
party
(the
protection
buyer)
agrees
to
make
periodic
payments
to
another
party
(the
protection
seller)
in
exchange
for
protection
against
specified
credit
events,
such
as
certain
defaults
and
bankruptcies
related
to
an
underlying
credit
instrument,
or
issuer
or
index
of
such
instruments.
Upon
occurrence
of
a
specified
credit
event,
the
protection
seller
is
required
to
pay
the
buyer
the
difference
between
the
notional
amount
of
the
swap
and
the
value
of
the
underlying
credit,
either
in
the
form
of
a
net
cash
settlement
or
by
paying
the
gross
notional
amount
and
accepting
delivery
of
the
relevant
underlying
credit.
For
credit
default
swaps
where
the
underlying
credit
is
an
index,
a
specified
credit
event
may
affect
all
or
individual
underlying
securities
included
in
the
index
and
will
be
settled
based
upon
the
relative
weighting
of
the
affected
underlying
security(ies)
within
the
index. Generally,
the
payment
risk
for
the
seller
of
protection
is
inversely
related
to
the
current
market
price
or
credit
rating
of
the
underlying
credit
or
the
market
value
of
the
contract
relative
to
the
notional
amount,
which
are
indicators
of
the
markets’
valuation
of
credit
quality.
As
of
May
31,
2024,
the
notional
amount
of
protection
sold
by
the
fund
totaled $26,565,000
(16.9%
of
net
assets),
which
reflects
the
maximum
potential
amount
the
fund
could
be
required
to
pay
under
such
contracts.
Risks
related
to
the
use
of
credit
default
swaps
include
the
possible
inability
of
the
fund
to
accurately
assess
the
current
and
future
creditworthiness
of
underlying
issuers,
the
possible
failure
of
a
counterparty
to
perform
in
accordance
with
the
terms
of
the
swap
agreements,
T.
ROWE
PRICE
Institutional
Long
Duration
Credit
Fund
potential
government
regulation
that
could
adversely
affect
the
fund’s
swap
investments,
and
potential
losses
in
excess
of
the
fund’s
initial
investment.
During
the
year ended
May
31,
2024,
the
volume
of
the
fund’s
activity
in
swaps,
based
on
underlying
notional
amounts,
was
generally
between
14%
and
21%
of
net
assets.
NOTE
4
-
OTHER
INVESTMENT
TRANSACTIONS
Consistent
with
its
investment
objective, the
fund
engages
in
the
following
practices
to
manage
exposure
to
certain
risks
and/or
to
enhance
performance.
The
investment
objective,
policies,
program,
and
risk
factors
of the
fund
are
described
more
fully
in the
fund’s prospectus
and
Statement
of
Additional
Information.
Restricted
Securities
The
fund
invests
in
securities
that
are
subject
to
legal
or
contractual
restrictions
on
resale.
Prompt
sale
of
such
securities
at
an
acceptable
price
may
be
difficult
and
may
involve
substantial
delays
and
additional
costs.
Mortgage-Backed
Securities
The
fund
invests
in
mortgage-backed
securities
(MBS
or
pass-through
certificates)
that
represent
an
interest
in
a
pool
of
specific
underlying
mortgage
loans
and
entitle
the
fund
to
the
periodic
payments
of
principal
and
interest
from
those
mortgages.
MBS
may
be
issued
by
government
agencies
or
corporations,
or
private
issuers.
Most
MBS
issued
by
government
agencies
are
guaranteed;
however,
the
degree
of
protection
differs
based
on
the
issuer.
MBS are
sensitive
to
changes
in
economic
conditions
that
affect
the
rate
of
prepayments
and
defaults
on
the
underlying
mortgages;
accordingly,
the
value,
income,
and
related
cash
flows
from
MBS
may
be
more
volatile
than
other
debt
instruments.
Securities
Lending
The fund
may
lend
its
securities
to
approved
borrowers
to
earn
additional
income.
Its
securities
lending
activities
are
administered
by
a
lending
agent
in
accordance
with
a
securities
lending
agreement.
Security
loans
generally
do
not
have
stated
maturity
dates,
and
the
fund
may
recall
a
security
at
any
time.
The
fund
receives
collateral
in
the
form
of
cash
or
U.S.
government
securities.
Collateral
is
maintained
over
the
life
of
the
loan
in
an
amount
not
less
than
the
value
of
loaned
securities;
any
additional
collateral
required
due
to
changes
in
security
values
is
delivered
to
the
fund
the
next
business
day.
Cash
collateral
is
invested
in
accordance
with
investment
guidelines
approved
by
fund
management.
Additionally,
the
lending
agent
indemnifies
the
fund
against
losses
resulting
from
borrower
default.
Although
risk
is
mitigated
by
the
collateral
and
indemnification,
the
fund
could
experience
a
delay
in
recovering
its
securities
and
a
possible
loss
of
income
or
value
if
the
borrower
fails
to
return
the
securities,
collateral
investments
decline
in
value,
and
the
lending
agent
fails
to
perform.
Securities
lending
revenue
consists
of
earnings
on
invested
collateral
and
borrowing
fees,
net
of
any
rebates
to
the
borrower,
compensation
to
the
lending
agent,
and
other
administrative
costs.
In
accordance
with
GAAP,
investments
made
with
cash
collateral
are
reflected
in
the
accompanying
financial
statements,
but
collateral
received
in
the
form
of
securities
is
not.
At
May
31,
2024,
the
value
of
loaned
securities
was
$3,048,000;
the
value
of
cash
collateral
and
related
investments
was
$3,369,000.
Other
Purchases
and
sales
of
portfolio
securities
other
than
in-kind
transactions,
if
any,
short-term and
U.S.
government
securities
aggregated $96,900,000 and
$1,249,000,
respectively,
for
the
year ended
May
31,
2024.
Purchases
and
sales
of
U.S.
government
securities
aggregated
$62,297,000 and
$54,508,000,
respectively,
for
the
year ended
May
31,
2024.
NOTE
5
-
FEDERAL
INCOME
TAXES
Generally,
no
provision
for
federal
income
taxes
is
required
since
the
fund
intends
to continue
to
qualify
as
a
regulated
investment
company
under
Subchapter
M
of
the
Internal
Revenue
Code
and
distribute
to
shareholders
all
of
its taxable
income
and
gains.
Distributions
determined
in
accordance
with
federal
income
tax
regulations
may
differ
in
amount
or
character
from
net
investment
income
and
realized
gains
for
financial
reporting
purposes.
The
fund
files
U.S.
federal,
state,
and
local
tax
returns
as
required.
The
fund’s
tax
returns
are
subject
to
examination
by
the
relevant
tax
authorities
until
expiration
of
the
applicable
statute
of
limitations,
which
is
generally
three
years
after
the
filing
of
the
tax
return
but
which
can
be
extended
to
six
years
in
certain
circumstances.
Tax
returns
for
open
years
have
incorporated
no
uncertain
tax
positions
that
require
a
provision
for
income
taxes.
T.
ROWE
PRICE
Institutional
Long
Duration
Credit
Fund
Capital
accounts
within
the
financial
reporting
records
are
adjusted
for
permanent
book/tax
differences
to
reflect
tax
character
but
are
not
adjusted
for
temporary
differences.
The
permanent
book/tax
adjustments,
if
any,
have
no
impact
on
results
of
operations
or
net
assets.
The
permanent
book/tax
adjustments
relate
primarily
to
the
character
of
income
on
swaps.
The
tax
character
of
distributions
paid
for
the
periods
presented
was
as
follows:
At
May
31,
2024,
the
tax-basis
cost
of
investments
(including
derivatives,
if
any)
and
gross
unrealized
appreciation
and
depreciation
were as
follows:
At
May
31,
2024,
the
tax-basis
components
of
accumulated
net
earnings
(loss)
were
as
follows:
Temporary
differences
between
book-basis
and
tax-basis
components
of
total
distributable
earnings
(loss)
arise
when
certain
items
of
income,
gain,
or
loss
are
recognized
in
different
periods
for
financial
statement
purposes
versus
for
tax
purposes;
these
differences
will
reverse
in
a
subsequent
reporting
period.
The
temporary
differences
relate
primarily
to
the
deferral
of
losses
from
wash
sales
and
the
realization
of
gains/losses
on
certain
open
derivative
contracts.
The
loss
carryforwards
and
deferrals
primarily
relate
to
capital
loss
carryforwards
and
straddle
deferrals.
Capital
loss
carryforwards
are
available
indefinitely
to
offset
future
realized
capital
gains.
Further,
a
portion
of
the
fund’s
available
capital
loss
carryforwards
are
subject
to
certain
limitations
on
amount
or
timing
of
use
related
to
an
ownership
change.
NOTE
6
-
RELATED
PARTY
TRANSACTIONS
The
fund
is
managed
by
T.
Rowe
Price
Associates,
Inc.
(Price
Associates),
a
wholly
owned
subsidiary
of
T.
Rowe
Price
Group,
Inc.
(Price
Group). The
investment
management
and
administrative
agreement
between
the
fund
and
Price
Associates
provides
for
an
all-inclusive
annual
fee
equal
to
0.45%
of
the
fund’s
average
daily
net
assets.
The
fee
is
computed
daily
and
paid
monthly. The
all-inclusive
fee
covers
investment
management
services
and
ordinary,
recurring
operating
expenses
but
does
not
cover
interest
expense;
expenses
related
to
borrowing,
taxes,
and
brokerage;
or
nonrecurring,
extraordinary
expenses.
In
addition,
the
fund
has
entered
into
service
agreements
with
Price
Associates
and
a
wholly
owned
subsidiary
of
Price
Associates,
each
an
affiliate
of
the
fund.
Price
Associates
provides
certain
accounting
and
administrative
services
to
the
funds.
T.
Rowe
Price
Services,
Inc.
provides
shareholder
and
administrative
services
in
its
capacity
as
the
fund’s
transfer
and
dividend-disbursing
agent.
Pursuant
to
the
all-inclusive
fee
arrangement
under
the
investment
management
($000s)
May
31,
2024
May
31,
2023
Ordinary
income
(including
short-term
capital
gains,
if
any)
$
5,117
$
1,489
($000s)
Cost
of
investments
$
166,153
Unrealized
appreciation
$
847
Unrealized
depreciation
(7,831)
Net
unrealized
appreciation
(depreciation)
$
(6,984)
($000s)
Undistributed
ordinary
income
$
245
Net
unrealized
appreciation
(depreciation)
(6,984
)
Loss
carryforwards
and
deferrals
(4,570
)
Total
distributable
earnings
(loss)
$
(11,309
)
T.
ROWE
PRICE
Institutional
Long
Duration
Credit
Fund
and
administrative
agreement,
expenses
incurred
by
the
funds
pursuant
to
these
service
agreements
are
paid
by
Price
Associates.
T.
Rowe
Price
Investment
Services,
Inc.
(Investment
Services)
serves
as
distributor
to
the
fund.
Pursuant
to
an
underwriting
agreement,
no
compensation
for
any
distribution
services
provided
is
paid
to
Investment
Services
by
the
fund
(except
for
12b-1
fees
under
a
Board-approved
Rule
12b-1
plan).
The fund
may
invest
its
cash
reserves
in
certain
open-end
management
investment
companies
managed
by
Price
Associates
and
considered
affiliates
of
the
fund:
the
T.
Rowe
Price
Government
Reserve
Fund
or
the
T.
Rowe
Price
Treasury
Reserve
Fund,
organized
as
money
market
funds
(together,
the
Price
Reserve
Funds).
The
Price
Reserve
Funds
are
offered
as
short-term
investment
options
to
mutual
funds,
trusts,
and
other
accounts
managed
by
Price
Associates
or
its
affiliates
and
are
not
available
for
direct
purchase
by
members
of
the
public.
Cash
collateral
from
securities
lending,
if
any,
is
invested
in
the
T.
Rowe
Price
Government
Reserve Fund. The
Price
Reserve
Funds
pay
no
investment
management
fees.
The fund may
participate
in
securities
purchase
and
sale
transactions
with
other
funds
or
accounts
advised
by
Price
Associates
(cross
trades),
in
accordance
with
procedures
adopted
by the
fund’s
Board
and
Securities
and
Exchange
Commission
rules,
which
require,
among
other
things,
that
such
purchase
and
sale
cross
trades
be
effected
at
the
independent
current
market
price
of
the
security.
During
the
year
ended
May
31,
2024,
the
fund
had
no
purchases
or
sales
cross
trades
with
other
funds
or
accounts
advised
by
Price
Associates.
NOTE
7
-
OTHER
MATTERS
Unpredictable environmental,
political,
social
and
economic
events,
including
but
not
limited
to,
environmental
or
natural
disasters,
war
and
conflict
(including
Russia’s
military
invasion
of
Ukraine
and
the
conflict
in
Israel,
Gaza
and
surrounding
areas),
terrorism,
geopolitical
developments
(including
trading
and
tariff
arrangements,
sanctions
and
cybersecurity
attacks),
and
public
health
epidemics
(including
the
global
outbreak
of
COVID-19)
and
similar
public
health
threats,
may
significantly
affect
the
economy
and
the
markets
and
issuers
in
which
a
fund
invests.
The
extent
and
duration
of
such
events
and
resulting
market
disruptions
cannot
be
predicted.
These
and
other
similar
events
may
cause
instability
across
global
markets,
including
reduced
liquidity
and
disruptions
in
trading
markets,
while
some
events
may
affect
certain
geographic
regions,
countries,
sectors,
and
industries
more
significantly
than
others,
and
exacerbate
other
pre-existing
political,
social,
and
economic
risks.
The
fund’s
performance
could
be
negatively
impacted
if
the
value
of
a
portfolio
holding
were
harmed
by
these
or
such
events.
Management
actively
monitors
the
risks
and
financial
impacts
arising
from
such
events.
T.
ROWE
PRICE
Institutional
Long
Duration
Credit
Fund
Report
of
Independent
Registered
Public
Accounting
Firm
To
the
Board
of
Directors
of
T.
Rowe
Price
Institutional
Income
Funds,
Inc.
and
Shareholders
of
T.
Rowe
Price
Institutional
Long
Duration
Credit
Fund
Opinion
on
the
Financial
Statements
We
have
audited
the
accompanying
statement
of
assets
and
liabilities,
including
the
portfolio
of
investments,
of
T.
Rowe
Price
Institutional
Long
Duration
Credit
Fund
(one
of
the
funds
constituting
T.
Rowe
Price
Institutional
Income
Funds,
Inc.,
referred
to
hereafter
as
the
"Fund")
as
of
May
31,
2024,
the
related
statement
of
operations
for
the
year
ended
May
31,
2024,
the
statement
of
changes
in
net
assets
for
each
of
the
two
years
in
the
period
ended
May
31,
2024,
including
the
related
notes,
and
the
financial
highlights
for
each
of
the
five
years
in
the
period
ended
May
31,
2024
(collectively
referred
to
as
the
“financial
statements”).
In
our
opinion,
the
financial
statements
present
fairly,
in
all
material
respects,
the
financial
position
of
the
Fund
as
of
May
31,
2024,
the
results
of
its
operations
for
the
year
then
ended,
the
changes
in
its
net
assets
for
each
of
the
two
years
in
the
period
ended
May
31,
2024
and
the
financial
highlights
for
each
of
the
five
years
in
the
period
ended
May
31,
2024,
in
conformity
with
accounting
principles
generally
accepted
in
the
United
States
of
America.
Basis
for
Opinion
These
financial
statements
are
the
responsibility
of
the
Fund’s
management.
Our
responsibility
is
to
express
an
opinion
on
the
Fund’s
financial
statements
based
on
our
audits.
We
are
a
public
accounting
firm
registered
with
the
Public
Company
Accounting
Oversight
Board
(United
States)
(PCAOB)
and
are
required
to
be
independent
with
respect
to
the
Fund
in
accordance
with
the
U.S.
federal
securities
laws
and
the
applicable
rules
and
regulations
of
the
Securities
and
Exchange
Commission
and
the
PCAOB.
We
conducted
our
audits
of
these
financial
statements
in
accordance
with
the
standards
of
the
PCAOB.
Those
standards
require
that
we
plan
and
perform
the
audit
to
obtain
reasonable
assurance
about
whether
the
financial
statements
are
free
of
material
misstatement,
whether
due
to
error
or
fraud.
Our
audits
included
performing
procedures
to
assess
the
risks
of
material
misstatement
of
the
financial
statements,
whether
due
to
error
or
fraud,
and
performing
procedures
that
respond
to
those
risks.
Such
procedures
included
examining,
on
a
test
basis,
evidence
regarding
the
amounts
and
disclosures
in
the
financial
statements.
Our
audits
also
included
evaluating
the
accounting
principles
used
and
significant
estimates
made
by
management,
as
well
as
evaluating
the
overall
presentation
of
the
financial
statements.
Our
procedures
included
confirmation
of
securities
owned
as
of
May
31,
2024
by
correspondence
with
the
custodians,
transfer
agent
and
brokers;
when
replies
were
not
received
from
brokers,
we
performed
other
auditing
procedures.
We
believe
that
our
audits
provide
a
reasonable
basis
for
our
opinion.
/s/
PricewaterhouseCoopers
LLP
Baltimore,
Maryland
July
18,
2024
We
have
served
as
the
auditor
of
one
or
more
investment
companies
in
the
T.
Rowe
Price
group
of
investment
companies
since
1973.
T.
ROWE
PRICE
Institutional
Long
Duration
Credit
Fund
TAX
INFORMATION
(UNAUDITED)
FOR
THE
TAX
YEAR
ENDED 5/31/24
We
are
providing
this
information
as
required
by
the
Internal
Revenue
Code.
The
amounts
shown
may
differ
from
those
elsewhere
in
this
report
because
of
differences
between
tax
and
financial
reporting
requirements.
For
shareholders
subject
to
interest
expense
deduction
limitation
under
Section
163(j),
$4,332,000
of
the
fund’s
income
qualifies
as
a
Section
163(j)
interest
dividend
and
can
be
treated
as
interest
income
for
purposes
of
Section
163(j),
subject
to
holding
period
requirements
and
other
limitations.
T.
ROWE
PRICE
Institutional
Long
Duration
Credit
Fund
APPROVAL
OF
INVESTMENT
MANAGEMENT
AGREEMENT
Each
year,
the
fund’s
Board
of
Directors
(Board)
considers
the
continuation
of
the
investment
management
agreement
(Advisory
Contract)
between
the
fund
and
its
investment
adviser,
T.
Rowe
Price
Associates,
Inc.
(Adviser).
In
that
regard,
at
a
meeting
held
on
March
11–12,
2024
(Meeting),
the
Board,
including
all
of
the
fund’s
independent
directors
present
in
person
at
the
Meeting,
approved
the
continuation
of
the
fund’s
Advisory
Contract.
At
the
Meeting,
the
Board
considered
the
factors
and
reached
the
conclusions
described
below
relating
to
the
selection
of
the
Adviser
and
the
approval
of
the
Advisory
Contract.
The
independent
directors
were
assisted
in
their
evaluation
of
the
Advisory
Contract
by
independent
legal
counsel
from
whom
they
received
separate
legal
advice
and
with
whom
they
met
separately.
In
providing
information
to
the
Board,
the
Adviser
was
guided
by
a
detailed
set
of
requests
for
information
submitted
by
independent
legal
counsel
on
behalf
of
the
independent
directors.
In
considering
and
approving
the
continuation
of
the
Advisory
Contract,
the
Board
considered
the
information
it
believed
was
relevant,
including,
but
not
limited
to,
the
information
discussed
below.
The
Board
considered
not
only
the
specific
information
presented
in
connection
with
the
Meeting,
but
also
the
knowledge
gained
over
time
through
interaction
with
the
Adviser
about
various
topics.
The
Board
meets
regularly
and,
at
each
of
its
meetings,
covers
an
extensive
agenda
of
topics
and
materials
and
considers
factors
that
are
relevant
to
its
annual
consideration
of
the
renewal
of
the
T.
Rowe
Price
funds’
advisory
contracts,
including
performance
and
the
services
and
support
provided
to
the
funds
and
their
shareholders.
Services
Provided
by
the
Adviser
The
Board
considered
the
nature,
quality,
and
extent
of
the
services
provided
to
the
fund
by
the
Adviser.
These
services
included,
but
were
not
limited
to,
directing
the
fund’s
investments
in
accordance
with
its
investment
program
and
the
overall
management
of
the
fund’s
portfolio,
as
well
as
a
variety
of
related
activities
such
as
financial,
investment
operations,
and
administrative
services;
compliance;
maintaining
the
fund’s
records
and
registrations;
and
shareholder
communications.
The
Board
also
reviewed
the
background
and
experience
of
the
Adviser’s
senior
management
team
and
investment
personnel
involved
in
the
management
of
the
fund,
as
well
as
the
Adviser’s
compliance
record.
The
Board
concluded
that
the
information
it
considered
with
respect
to
the
nature,
quality,
and
extent
of
the
services
provided
by
the
Adviser,
as
well
as
the
other
factors
considered
at
the
Meeting,
supported
the
Board’s
approval
of
the
continuation
of
the
Advisory
Contract.
Investment
Performance
of
the
Fund
The
Board
took
into
account
discussions
with
the
Adviser
and
detailed
reports
that
it
regularly
receives
throughout
the
year
on
relative
and
absolute
performance
for
the
T.
Rowe
Price
funds.
In
connection
with
the
Meeting,
the
Board
reviewed
information
provided
by
the
Adviser
that
compared
the
fund’s
total
returns,
as
well
as
a
wide
variety
of
other
previously
agreed-upon
performance
measures
and
market
data,
against
relevant
benchmark
indexes
and
peer
groups
of
funds
with
similar
investment
programs
for
various
periods
through
December
31,
2023.
Additionally,
the
Board
reviewed
the
fund’s
relative
performance
information
as
of
September
30,
2023,
which
ranked
the
returns
of
the
fund
for
various
periods
against
a
universe
of
funds
with
similar
investment
programs
selected
by
Broadridge,
an
independent
provider
of
mutual
fund
data.
In
the
course
of
its
deliberations,
the
Board
considered
performance
information
provided
throughout
the
year
and
in
connection
with
the
Advisory
Contract
review
at
the
Meeting,
as
well
as
information
provided
during
investment
review
meetings
conducted
with
portfolio
managers
and
senior
investment
personnel
during
the
course
of
the
year
regarding
the
fund’s
performance.
The
Board
also
considered
relevant
factors,
such
as
overall
market
conditions
and
trends
that
could
adversely
impact
the
fund’s
performance,
the
length
of
the
fund’s
performance
track
record,
and
how
closely
the
fund’s
strategies
align
with
its
benchmarks
and
peer
groups.
The
Board
concluded
that
the
information
it
considered
with
respect
to
the
fund’s
performance,
as
well
as
the
other
factors
considered
at
the
Meeting,
supported
the
Board’s
approval
of
the
continuation
of
the
Advisory
Contract.
Costs,
Benefits,
Profits,
and
Economies
of
Scale
The
Board
reviewed
detailed
information
regarding
the
revenues
received
by
the
Adviser
under
the
Advisory
Contract
and
other
direct
and
indirect
benefits
that
the
Adviser
(and
its
affiliates)
may
have
realized
from
its
relationship
with
the
fund.
In
considering
soft-dollar
arrangements
pursuant
to
which
research
may
be
received
from
broker-dealers
that
execute
the
fund’s
portfolio
transactions,
the
Board
noted
that
during
2023
the
Adviser
paid
the
costs
of
research
services
for
all
client
accounts
that
it
advises,
including
the
T.
Rowe
Price
funds.
However,
effective
January
1,
2024,
the
Adviser
will
begin
using
brokerage
commissions
in
connection
with
certain
T.
Rowe
Price
funds’
securities
transactions
to
pay
for
research
when
permissible.
T.
ROWE
PRICE
Institutional
Long
Duration
Credit
Fund
The
Board
received
information
on
the
estimated
costs
incurred
and
profits
realized
by
the
Adviser
from
managing
the
T.
Rowe
Price
funds.
While
the
Board
did
not
review
information
regarding
profits
realized
from
managing
the
fund
in
particular
because
the
fund
had
either
not
achieved
sufficient
portfolio
asset
size
or
not
recognized
sufficient
revenues
to
produce
meaningful
profit
margin
percentages,
the
Board
concluded
that
the
Adviser’s
profits
were
reasonable
in
light
of
the
services
provided
to
the
T.
Rowe
Price
funds.
The
Board
also
considered
whether
the
fund
benefits
under
the
fee
levels
set
forth
in
the
Advisory
Contract
or
otherwise
from
any
economies
of
scale
realized
by
the
Adviser.
Under
the
Advisory
Contract,
the
fund
pays
the
Adviser
an
all-inclusive
management
fee,
which
is
based
on
the
fund’s
average
daily
net
assets.
The
all-inclusive
management
fee
includes
investment
management
services
and
provides
for
the
Adviser
to
pay
all
of
the
fund’s
ordinary,
recurring
operating
expenses
except
for
interest,
taxes,
portfolio
transaction
fees,
and
any
nonrecurring
extraordinary
expenses
that
may
arise.
The
Adviser
has
generally
implemented
an
all-inclusive
management
fee
structure
in
situations
where
a
fixed
total
expense
ratio
is
useful
for
purposes
of
providing
certainty
of
fees
and
expenses
for
the
fund’s
investors
and
has
historically
sought
to
set
the
initial
all-inclusive
management
fee
rate
at
levels
below
the
expense
ratios
of
comparable
funds
to
take
into
account
potential
future
economies
of
scale.
In
addition,
the
assets
of
the
fund
are
included
in
the
calculation
of
the
group
fee
rate,
which
serves
as
a
component
of
the
management
fee
for
many
T.
Rowe
Price
funds
and
declines
at
certain
asset
levels
based
on
the
combined
average
net
assets
of
most
of
the
T.
Rowe
Price
funds
(including
the
fund).
Although
the
fund
does
not
have
a
group
fee
component
to
its
management
fee,
its
assets
are
included
in
the
calculation
because
certain
resources
utilized
to
operate
the
fund
are
shared
with
other
T.
Rowe
Price
funds.
In
addition,
the
Board
noted
that
the
fund
potentially
shares
in
indirect
economies
of
scale
through
the
Adviser’s
ongoing
investments
in
its
business
in
support
of
the
T.
Rowe
Price
funds,
including
investments
in
trading
systems,
technology,
and
regulatory
support
enhancements,
and
the
ability
to
possibly
negotiate
lower
fee
arrangements
with
third-party
service
providers.
The
Board
concluded
that
the
advisory
fee
structure
for
the
fund
provides
for
a
reasonable
sharing
of
benefits
from
any
economies
of
scale
with
the
fund’s
investors.
Fees
and
Expenses
The
Board
was
provided
with
information
regarding
industry
trends
in
management
fees
and
expenses.
Among
other
things,
the
Board
reviewed
data
for
peer
groups
that
were
compiled
by
Broadridge,
which
compared:
(i)
contractual
management
fees,
actual
management
fees,
nonmanagement
expenses,
and
total
expenses
of
the
fund
with
a
group
of
competitor
funds
selected
by
Broadridge
(Expense
Group)
and
(ii)
actual
management
fees,
nonmanagement
expenses,
and
total
expenses
of
the
fund
with
a
broader
set
of
funds
within
the
Lipper
investment
classification
(Expense
Universe).
The
Board
considered
the
fund’s
contractual
management
fee
rate,
actual
management
fee
rate
(which
reflects
the
management
fees
actually
received
from
the
fund
by
the
Adviser
after
any
applicable
waivers,
reductions,
or
reimbursements),
operating
expenses,
and
total
expenses
(which
reflect
the
net
total
expense
ratio
of
the
fund
after
any
waivers,
reductions,
or
reimbursements)
in
comparison
with
the
information
for
the
Broadridge
peer
groups.
Broadridge
generally
constructed
the
peer
groups
by
seeking
the
most
comparable
funds
based
on
similar
investment
classifications
and
objectives,
expense
structure,
asset
size,
and
operating
components
and
attributes
and
ranked
funds
into
quintiles,
with
the
first
quintile
representing
the
funds
with
the
lowest
relative
expenses
and
the
fifth
quintile
representing
the
funds
with
the
highest
relative
expenses.
The
information
provided
to
the
Board
indicated
that
the
fund’s
contractual
management
fee
ranked
in
the
second
quintile
(Expense
Group),
the
fund’s
actual
management
fee
rate
ranked
in
the
fourth
quintile
(Expense
Group)
and
fifth
quintile
(Expense
Universe),
and
the
fund’s
total
expenses
ranked
in
the
first
quintile
(Expense
Group)
and
second
quintile
(Expense
Universe).
The
Board
also
reviewed
the
fee
schedules
for
other
investment
portfolios
with
similar
mandates
that
are
advised
or
subadvised
by
the
Adviser
and
its
affiliates,
including
separately
managed
accounts
for
institutional
and
individual
investors;
subadvised
funds;
and
other
sponsored
investment
portfolios,
including
collective
investment
trusts
and
pooled
vehicles
organized
and
offered
to
investors
outside
the
United
States.
Management
provided
the
Board
with
information
about
the
Adviser’s
responsibilities
and
services
provided
to
subadvisory
and
other
institutional
account
clients,
including
information
about
how
the
requirements
and
economics
of
the
institutional
business
are
fundamentally
different
from
those
of
the
proprietary
mutual
fund
business.
The
Board
considered
information
showing
that
the
Adviser’s
mutual
fund
business
is
generally
more
complex
from
a
business
and
compliance
perspective
than
its
institutional
account
business
and
considered
various
relevant
factors,
such
as
the
broader
scope
of
operations
and
oversight,
more
extensive
shareholder
communication
infrastructure,
greater
asset
flows,
heightened
business
risks,
and
differences
in
applicable
laws
and
regulations
associated
T.
ROWE
PRICE
Institutional
Long
Duration
Credit
Fund
with
the
Adviser’s
proprietary
mutual
fund
business.
In
assessing
the
reasonableness
of
the
fund’s
management
fee
rate,
the
Board
considered
the
differences
in
the
nature
of
the
services
required
for
the
Adviser
to
manage
its
mutual
fund
business
versus
managing
a
discrete
pool
of
assets
as
a
subadviser
to
another
institution’s
mutual
fund
or
for
an
institutional
account
and
that
the
Adviser
generally
performs
significant
additional
services
and
assumes
greater
risk
in
managing
the
fund
and
other
T.
Rowe
Price
funds
than
it
does
for
institutional
account
clients,
including
subadvised
funds.
On
the
basis
of
the
information
provided
and
the
factors
considered,
the
Board
concluded
that
the
fees
paid
by
the
fund
under
the
Advisory
Contract
are
reasonable.
Approval
of
the
Advisory
Contract
As
noted,
the
Board
approved
the
continuation
of
the
Advisory
Contract.
No
single
factor
was
considered
in
isolation
or
to
be
determinative
to
the
decision.
Rather,
the
Board
concluded,
in
light
of
a
weighting
and
balancing
of
all
factors
considered,
that
it
was
in
the
best
interests
of
the
fund
and
its
shareholders
for
the
Board
to
approve
the
continuation
of
the
Advisory
Contract
(including
the
fees
to
be
charged
for
services
thereunder).
100
East
Pratt
Street
Baltimore,
MD
21202
T.
Rowe
Price
Investment
Services,
Inc.
Call
1-800-225-5132
to
request
a
prospectus
or
summary
prospectus;
each
includes
investment
objectives,
risks,
fees,
expenses,
and
other
information
that
you
should
read
and
consider
carefully
before
investing.
E151-050
7/24
Item 8. Changes in and Disagreements with Accountants for Open-End Management Investment Companies.
Not applicable.
Item 9. Proxy Disclosures for Open-End Management Investment Companies.
Not applicable.
Item 10. Remuneration Paid to Directors, Officers, and Others of Open-End Management Investment Companies.
Remuneration paid to Directors is included in Item 7 of this Form N-CSR.
Item 11. Statement Regarding Basis for Approval of Investment Advisory Contract.
If applicable, see Item 7.
Item 12. Disclosure of Proxy Voting Policies and Procedures for Closed-End Management Investment Companies.
Not applicable.
Item 13. Portfolio Managers of Closed-End Management Investment Companies.
Not applicable.
Item 14. Purchases of Equity Securities by Closed-End Management Investment Company and Affiliated Purchasers.
Not applicable.
Item 15. Submission of Matters to a Vote of Security Holders.
There has been no change to the procedures by which shareholders may recommend nominees to the registrant’s board of directors.
Item 16. Controls and Procedures.
(a) The registrant’s principal executive officer and principal financial officer have evaluated the registrant’s disclosure controls and procedures within 90 days of this filing and have concluded that the registrant’s disclosure controls and procedures were effective, as of that date, in ensuring that information required to be disclosed by the registrant in this Form N-CSR was recorded, processed, summarized, and reported timely.
(b) The registrant’s principal executive officer and principal financial officer are aware of no change in the registrant’s internal control over financial reporting that occurred during the period covered by this report that has materially affected, or is reasonably likely to materially affect, the registrant’s internal control over financial reporting.
Item 17. Disclosure of Securities Lending Activities for Closed-End Management Investment Companies.
Not applicable.
Item 18. Recovery of Erroneously Awarded Compensation.
Not applicable.
Item 19. Exhibits.
SIGNATURES
Pursuant to the requirements of the Securities Exchange Act of 1934 and the Investment Company Act of 1940, the registrant has duly caused this report to be signed on its behalf by the undersigned, thereunto duly authorized.
| | | | |
| T. Rowe Price Institutional Long Duration Credit Fund |
| | |
| By | | /s/ David Oestreicher | | |
| | David Oestreicher | | |
| | Principal Executive Officer | | |
| | |
| Date | | July 18, 2024 | | |
Pursuant to the requirements of the Securities Exchange Act of 1934 and the Investment Company Act of 1940, this report has been signed below by the following persons on behalf of the registrant and in the capacities and on the dates indicated.
| | | | |
| By | | /s/ David Oestreicher | | |
| | David Oestreicher | | |
| | Principal Executive Officer | | |
| | |
| Date | | July 18, 2024 | | |
| | | | |
| By | | /s/ Alan S. Dupski | | |
| | Alan S. Dupski | | |
| | Principal Financial Officer | | |
| | |
| Date | | July 18, 2024 | | |