UNITED STATES
SECURITIES AND EXCHANGE COMMISSION
Washington, D.C. 20549
FORM N-CSR
CERTIFIED SHAREHOLDER REPORT OF REGISTERED
MANAGEMENT INVESTMENT COMPANIES
Investment Company Act File Number: 811-21055
| T. Rowe Price Institutional Income Funds, Inc. |
|
| (Exact name of registrant as specified in charter) |
| |
| 100 East Pratt Street, Baltimore, MD 21202 |
|
| (Address of principal executive offices) |
| |
| David Oestreicher |
| 100 East Pratt Street, Baltimore, MD 21202 |
|
| (Name and address of agent for service) |
Registrant’s telephone number, including area code: (410) 345-2000
Date of fiscal year end: May 31
Date of reporting period: May 31, 2015
Item 1. Report to Shareholders
| Institutional Core Plus Fund | May 31, 2015 |
| ● | Bonds offered modest returns over our fiscal year as long-term yields defied expectations and declined—although credit spreads widened somewhat. |
| |
| ● | The Institutional Core Plus Fund outperformed its peers and benchmark in the six months since our last letter; we performed roughly in line with the benchmark and outpaced our peer group over the full fiscal year. |
| |
| ● | Our relative performance benefited from both security selection and sector weightings. |
| |
| ● | We expect a volatile rate environment in the coming months, and we have generally been reducing our risk posture both to limit the downside to the portfolio and to have some “dry powder” on hand when market dislocations provide attractive entry points. |
The views and opinions in this report were current as of May 31, 2015. They are not guarantees of performance or investment results and should not be taken as investment advice. Investment decisions reflect a variety of factors, and the managers reserve the right to change their views about individual stocks, sectors, and the markets at any time. As a result, the views expressed should not be relied upon as a forecast of the fund’s future investment intent. The report is certified under the Sarbanes-Oxley Act, which requires mutual funds and other public companies to affirm that, to the best of their knowledge, the information in their financial reports is fairly and accurately stated in all material respects.
Manager’s Letter
T. Rowe Price Institutional Core Plus Fund
Dear Investor
Bonds offered modest returns for investors over our fiscal year ended May 31, 2015. Yields on developed market government bonds, including U.S. Treasuries, finished the period lower, providing a tailwind to total return in most fixed income sectors. Energy prices remained a heavy influence on credit markets. Sectors with high energy exposure—particularly high yield bonds, but also investment-grade corporates and Treasury inflation protected securities (TIPS)—felt a negative impact. Other sectors, such as asset-backed securities (ABS) and commercial mortgage-backed securities (CMBS), were largely insulated from the energy decline and performed well. Another important factor in markets was the strong U.S. dollar, which appreciated significantly against most developed and emerging markets currencies. We are pleased to report that our diversified and global portfolio outperformed its benchmark and peer group in the more challenging environment since our last letter.
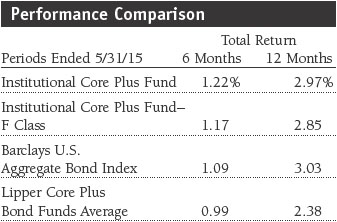
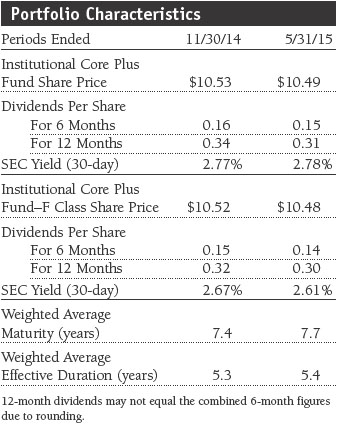
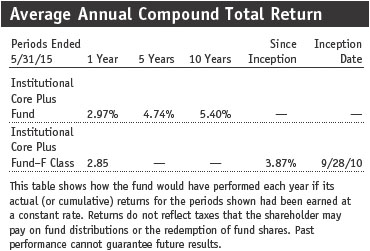
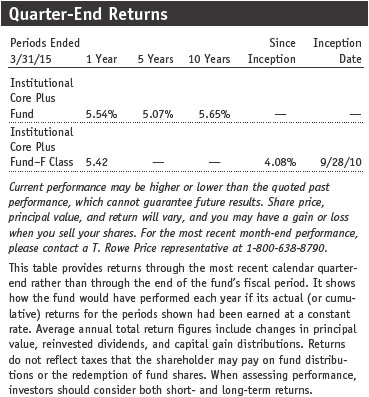
The Institutional Core Plus Fund returned 2.97% over the 12 months ended May 31, 2015, with 1.22% of those gains coming in the six months since our semi-annual report. Over the full fiscal year, the fund slightly trailed its benchmark but outperformed its peer group average; over the past six months, the fund outperformed both. (Performance for F Class shares can vary, reflecting their different fee structure and other factors. Past performance cannot guarantee future results.)
Economy and Interest Rates
The U.S. economic expansion remained on track and marked its sixth anniversary in the second half of our fiscal year. After surprising on the upside in late 2014, growth slowed considerably in early 2015—indeed, the Commerce Department’s latest estimate is that the economy contracted 0.7% in the first quarter. Another bout of especially cold weather in much of the country, a strike at West Coast ports, and other transitory factors appeared largely to be at work, however, and several signs suggested that the economy was once again headed for a spring thaw. Most notably, payroll growth remained generally strong, and healthy income increases appeared finally to be driving solid consumer spending growth by late spring.
Even if temporary, the winter chill did appear to push back expectations for the first increase in the federal funds rate. In January, the yield on the 10-year Treasury note reached its lowest level since May 2013, reflecting a series of poor economic readings. Seeing the “soft patch” in economic data as transitory, Fed Chair Janet Yellen told Congress that the central bank would begin to evaluate an initial interest rate hike on a meeting-by-meeting basis, and Fed officials later stressed that any decision to raise rates would be data dependent. Against the backdrop of weaker-than-expected first-quarter data, investors began questioning the timing and pace of Fed rate hikes. Indeed, minutes from the Fed’s April policymaking meeting indicated that most officials thought rate increases were unlikely until later in the year.
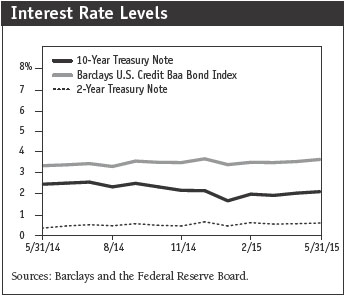
While the near-term prospects for less accommodative monetary policy in the U.S. appeared to diminish, major central banks in Europe and Asia expanded their monetary easing. In January, the European Central Bank made the long-awaited announcement that it would expand its asset purchases to include sovereign bonds. The purchases soon drove the yields of high-quality, short-term sovereign debt into negative territory, and the yield on the 10-year German bond reached as low as 0.05%. Japan expanded its massive quantitative easing program as well, and China’s central bank lowered its benchmark interest rate three times in an effort to ease the decline in the country’s growth rate and avoid a so-called hard landing. The diverging monetary policies caused a sharp rise in the U.S. dollar relative to most major currencies, although the dollar’s ascent slowed in March as growth signals improved, especially in Europe. The ongoing prospect of a Greek debt default and possible eurozone exit continued to roil markets periodically, however.
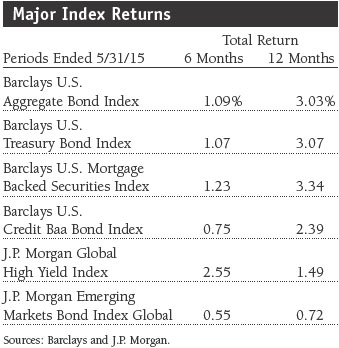
Weighed down by heavy exposure to the energy sector, high yield bonds performed poorly in late 2014. Oil prices, however, found some footing in the first quarter of 2015 and managed to recover a portion of their steep losses. Riding this momentum, the high yield sector was able to outperform the other sectors in our investment universe over the trailing six-month period. Mortgage-backed securities (MBS) outperformed Treasuries as an expected wave of prepayments—resulting from policy efforts to expand lending and lower mortgage rates—failed to materialize. Investment-grade corporate bonds trailed lower-quality issues over the past six months, although they fared better than high yield over our fiscal year as a whole. In part, heavy new issuance has recently outpaced robust investor demand, but the decline in energy and basic materials prices took a more significant toll on the investment-grade segment. Emerging markets debt was the worst performer for both the year and the last six months. Global growth concerns centered on China’s slowdown had a ripple effect on many emerging economies, and particular political and economic challenges weighed on markets such as Russia, Ukraine, and Brazil. Debt denominated in declining local currencies performed especially poorly for U.S. investors.
Performance and Investment Review
The fund’s investment approach is built on the foundation of a strong global research platform, which informs both our bottom-up selection of individual securities and our top-down decisions about sector allocations and yield curve positioning. We seek to add value in a number of ways for shareholders and enhance returns in a range of market environments while maintaining a highly diversified portfolio that can offer some downside protection. Finally, we strive to maintain a risk-aware approach that balances our conviction in individual holdings and themes with a recognition of the available opportunities.
Reflecting the importance of our bottom-up research, the fund’s performance relative to its benchmark over its fiscal year benefited from security selection. Within the MBS sector, we added to our holdings of GNMAs at the start of 2015 after a sharp sell-off following the announcement of the government plan to reduce GNMA mortgage insurance premiums—a benefit to homeowners but a potential negative to investors given that more affordable housing would potentially increase refinancing rates and prepayments. A wave of new issuance failed to materialize, however, and we benefited as GNMAs rebounded in the spring. An overweight to FNMAs late in 2014 also benefited as investors prized the securities for their liquidity, and our modest allocation to non-agency MBS further contributed. Within MBS, we maintain a barbell positioning: an emphasis on both lower coupons, where prepayments are less likely, and select higher coupons, where homeowners are unlikely to refinance given that they have not done so already—the so-called burnout phenomenon.
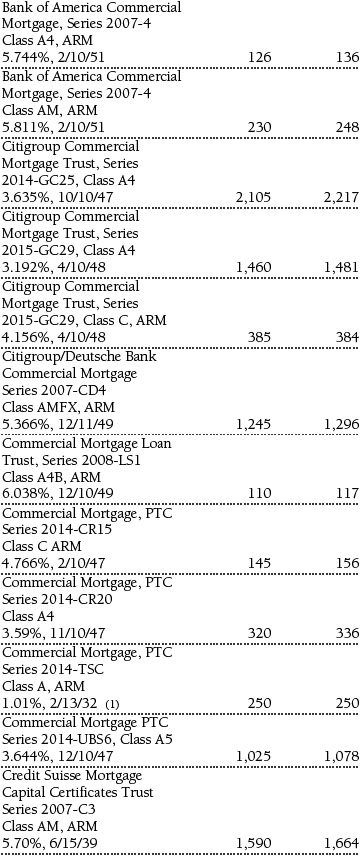
Our security selection among investment-grade corporates was also a strong contributor to performance. We were underweight the energy sector, which proved beneficial as the plunge in oil prices weighed on the segment. We later took advantage of the sell-off, adding to select issues with solid balance sheets that we felt would be able to weather the volatility in oil prices. Among financials, we saw favorable results from European banks BPCE, Lloyds TSB Bank, and Barclays, as well as U.S. money center banks Morgan Stanley and Goldman Sachs. Recently, we have found new opportunities in telecom and health care issuers. Finally, we saw good results from our lower-rated CMBS holdings, which have benefited from improving real estate fundamentals and insulation from the oil slide. (Please refer to the fund’s portfolio of investments for a complete list of our holdings and the amount each represents in the portfolio.)
Our sector allocations were also beneficial over the fiscal year. Our out-of-benchmark position in high yield benefited from the rebound in oil prices this spring. With valuations on below investment-grade debt at more attractive levels late last year, the sector experienced significant inflows after oil prices found some footing in the first quarter. We also received a positive contribution from our underweight position in investment-grade corporate debt. As noted previously, energy market weakness and heavy new issuance has weighed on the segment. New issuance was largely driven by increased merger and acquisition (M&A) activity as well as corporations rushing to bring new deals to the market in advance of the Fed’s first interest rate increase in nine years. Our TIPS allocation weighed on results as inflation expectations waned due to increased global growth concerns, the tumble in oil prices, and the significantly stronger U.S. dollar.
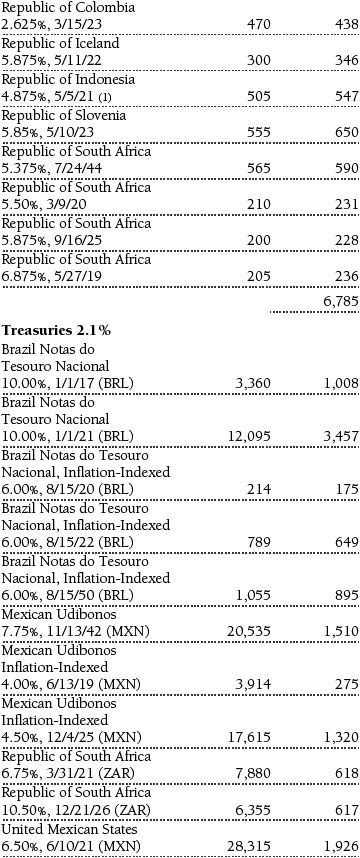
As we have described previously, we maintain an out-of-benchmark allocation to foreign holdings in order to add diversification and seek opportunities that are not available in the U.S. market, where valuations have grown extended in recent years. We saw good results from several of these positions, including holdings in Brazil, where we had a higher allocation to inflation-linked bonds that benefited from continued pricing pressures. Our positions in South Africa also helped as the central bank left rates unchanged as economic growth has continued to muddle along, as we expected when we initiated the position. Our holdings of locally denominated Mexican debt also performed well as tepid economic data on the U.S. economy also pushed down yields in the heavily linked Mexican economy. The performance of foreign exchange positions was mixed. Our negative view on select developed market currencies, including the euro, Australian dollar, Japanese yen, and New Zealand dollar, benefited returns and generally offset the detraction from our long positions in the emerging markets currencies of Mexico and Brazil.
Our interest rate management detracted from results over the full fiscal year. Our modestly short duration posture relative to the benchmark, held as a defensive measure against potential rate increases, reduced our income and further detracted on a price basis as long-term yields declined in late 2014. However, our curve positioning contributed, as our underweight to short-term issues benefited us as the yield curve flattened.
Fixed income sectors have generally remained fairly valued in recent months, offering less opportunity to make larger-scale sector allocation changes in the portfolio. As a result, we see less room for price appreciation and believe that returns will mostly be driven by coupon returns. To gain a yield advantage versus our benchmark, we remain underweight in Treasuries in favor of credit sectors, where our emphasis on fundamental research can add value. Nevertheless, in anticipation of reduced market liquidity, particularly as we head into the summer months, we are balancing our exposure to riskier sectors with allocations to more liquid Treasuries and MBS.
As such, our moves have been more incremental in nature and have been focused on reducing risk ahead of what could be bouts of market volatility as the Fed takes initial steps toward normalizing monetary policy. We have recently increased our allocation to investment-grade issues, however, allowing the portfolio more room to participate in select merger and acquisition-driven new issues that we feel offer compelling value. More broadly, and in line with our concerns about potential volatility, we have been focusing on higher-quality issues within our investment-grade corporate holdings.
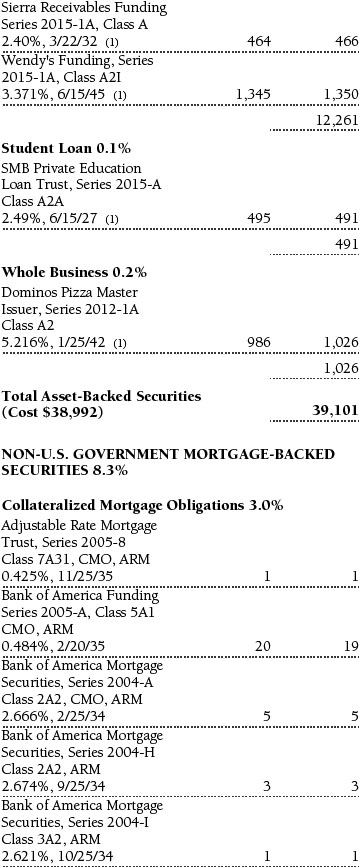
We also added a bit to our holdings of ABS and CMBS, where we remain overweight. CMBS boast attractive valuations, are backed by generally solid real estate fundamentals, and typically have little exposure to oil and related commodities, as noted earlier. We have recently been harvesting profits among lower-quality legacy CMBS and focusing instead on higher-quality new issues. ABS are benefiting from the strengthening economy and consumer finances and are attractively valued relative to other high-quality and shorter-duration alternatives. We see especially attractive valuations in securities such as time-shares and whole business securitizations. Finally, we have trimmed our holdings of high yield and emerging markets corporate debt, wanting to reduce our exposure to these riskier segments following their recent rebound.
Outlook
Interest rate volatility has increased in recent weeks, a pattern we expect to continue over the next few months. The weak showing of the U.S. economy in the first quarter appears to have been temporary, and more current economic data suggest that the Fed remains on track to raise interest rates by the end of the year, as Fed Chair Yellen herself has noted. In addition, deflation fears have diminished globally, which has recently been seen in the sharp rise in German bond yields. For this reason, we are maintaining a short duration posture but also limiting our exposure to the short-term securities at the front end of the yield curve. The ongoing standoff between Greece and its creditors may also fuel additional swings in bond yields.
In anticipation of further volatility, we have also been chipping away at our risk profile over the past few months, both to limit the downside to the portfolio and to leave room to add to riskier positions when their valuations improve. We are simultaneously keeping a close eye on liquidity conditions in the market. If rates spike and cause a fall in bond prices, the bond market could see outflows, temporarily putting a strain on more thinly traded issues. These liquidity issues are another argument for maintaining dry powder, as they may offer the opportunity to add particular securities at highly attractive prices. We will continue to rely on the careful work of our global team of analysts to help sift out the individual securities where the risk/reward trade-off holds the most promise.
As always, we appreciate your confidence and thank you for investing with T. Rowe Price.
Respectfully submitted,

Brian J. Brennan
Chairman of the fund’s Investment Advisory Committee
June 16, 2015
The committee chairman has day-to-day responsibility for managing the portfolio and works with committee members in developing and executing the fund’s investment program.
Bonds are subject to interest rate risk, the decline in bond prices that usually accompanies a rise in interest rates, and credit risk, the chance that any fund holding could have its credit rating downgraded or that a bond issuer will default (fail to make timely payments of interest or principal), potentially reducing the fund’s income level and share price. MBS are subject to prepayment risk, particularly if falling rates lead to heavy refinancing activity, and extension risk, which is an increase in interest rates that causes a fund’s average maturity to lengthen unexpectedly due to a drop in mortgage prepayments. This could increase the fund’s sensitivity to rising interest rates and its potential for price declines.
Barclays U.S. Aggregate Bond Index: An unmanaged index that tracks domestic investment-grade bonds, including corporate, government, and mortgage-backed securities.
Barclays U.S. Credit Baa Bond Index: A measure of corporate and noncorporate fixed income securities that are rated investment grade (Baa by Moody’s Investors Service and BBB by Standard & Poor’s) and have at least 10 years to final maturity.
Barclays U.S. Mortgage Backed Securities Index: An unmanaged index that tracks the performance of the mortgage-backed pass-through securities of Ginnie Mae (GNMA), Fannie Mae (FNMA), and Freddie Mac (FHLMC).
Barclays U.S. Treasury Bond Index: An unmanaged index of publicly traded obligations of the U.S. Treasury.
Basis point: One one-hundredth of a percentage point, or 0.01%.
Duration: A measure of a bond fund’s sensitivity to changes in interest rates. For example, a fund with a duration of five years would fall about 5% in price in response to a one-percentage-point rise in interest rates, and vice versa.
J.P. Morgan Emerging Markets Bond Index Global: Tracks U.S. dollar-denominated government bonds of a broad range of emerging markets.
J.P. Morgan Global High Yield Index: Tracks the investable universe of the U.S. dollar-denominated global high yield corporate debt market, including domestic and international issues.
Lipper averages: The averages of available mutual fund performance returns for specified time periods in categories defined by Lipper Inc.
SEC yield (30-day): A method of calculating a fund’s yield that assumes all portfolio securities are held until maturity. Yield will vary and is not guaranteed.
Treasury inflation protected securities (TIPS): Income-generating bonds that are issued by the federal government and whose interest and principal payments are adjusted for inflation. The inflation adjustment, which is typically applied monthly to the principal of the bond, follows a designated inflation index, such as the consumer price index.
Weighted average maturity: A measure of a fund’s interest rate sensitivity. In general, the longer the average maturity, the greater the fund’s sensitivity to interest rate changes. The weighted average maturity may take into account the interest rate readjustment dates for certain securities.
Yield curve: A graph depicting the relationship between yields and maturity dates for a set of similar securities. These curves are in constant flux. One of the key activities in managing any fixed income portfolio is to study the trends reflected by yield curves.
Performance and Expenses
T. Rowe Price Institutional Core Plus Fund
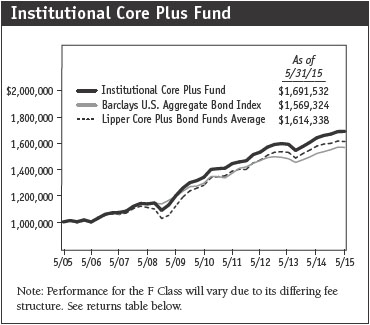
This chart shows the value of a hypothetical $1 million investment in the fund over the past 10 fiscal year periods or since inception (for funds lacking 10-year records). The result is compared with benchmarks, which may include a broad-based market index and a peer group average or index. Market indexes do not include expenses, which are deducted from fund returns as well as mutual fund averages and indexes.
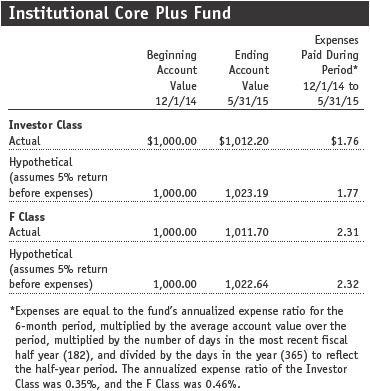
Fund Expense Example
As a mutual fund shareholder, you may incur two types of costs: (1) transaction costs, such as redemption fees or sales loads, and (2) ongoing costs, including management fees, distribution and service (12b-1) fees, and other fund expenses. The following example is intended to help you understand your ongoing costs (in dollars) of investing in the fund and to compare these costs with the ongoing costs of investing in other mutual funds. The example is based on an investment of $1,000 invested at the beginning of the most recent six-month period and held for the entire period.
Actual Expenses
The first line of the following table (Actual) provides information about actual account values and actual expenses. You may use the information on this line, together with your account balance, to estimate the expenses that you paid over the period. Simply divide your account value by $1,000 (for example, an $8,600 account value divided by $1,000 = 8.6), then multiply the result by the number on the first line under the heading “Expenses Paid During Period” to estimate the expenses you paid on your account during this period.
Hypothetical Example for Comparison Purposes
The information on the second line of the table (Hypothetical) is based on hypothetical account values and expenses derived from the fund’s actual expense ratio and an assumed 5% per year rate of return before expenses (not the fund’s actual return). You may compare the ongoing costs of investing in the fund with other funds by contrasting this 5% hypothetical example and the 5% hypothetical examples that appear in the shareholder reports of the other funds. The hypothetical account values and expenses may not be used to estimate the actual ending account balance or expenses you paid for the period.
You should also be aware that the expenses shown in the table highlight only your ongoing costs and do not reflect any transaction costs, such as redemption fees or sales loads. Therefore, the second line of the table is useful in comparing ongoing costs only and will not help you determine the relative total costs of owning different funds. To the extent a fund charges transaction costs, however, the total cost of owning that fund is higher.
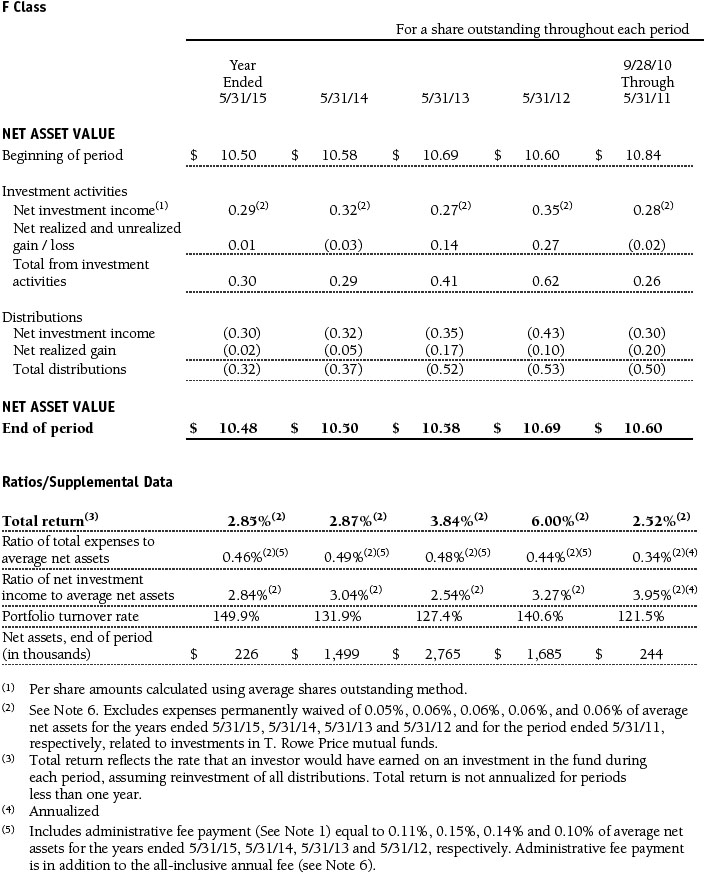
Financial Highlights
T. Rowe Price Institutional Core Plus Fund
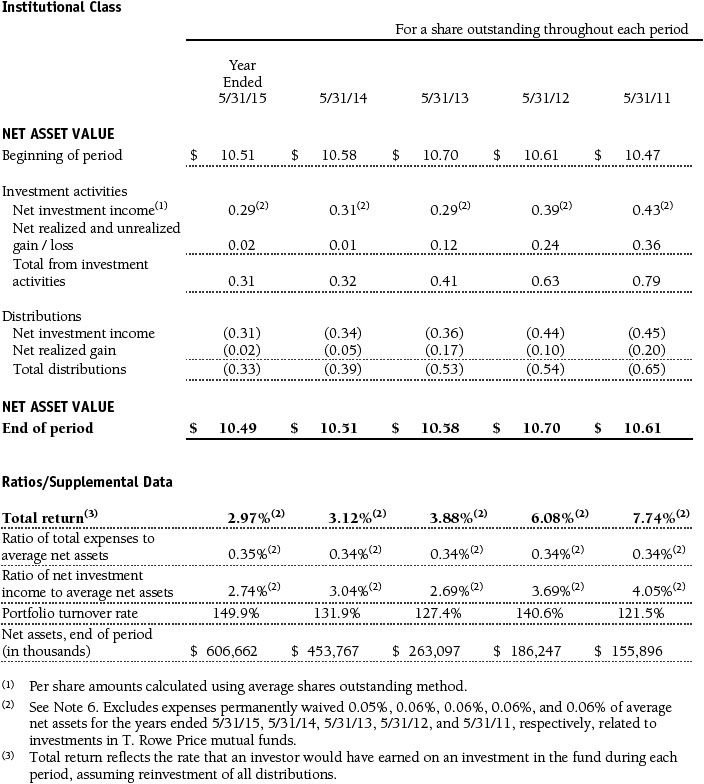
The accompanying notes are an integral part of these financial statements.
Financial Highlights
T. Rowe Price Institutional Core Plus Fund
The accompanying notes are an integral part of these financial statements.
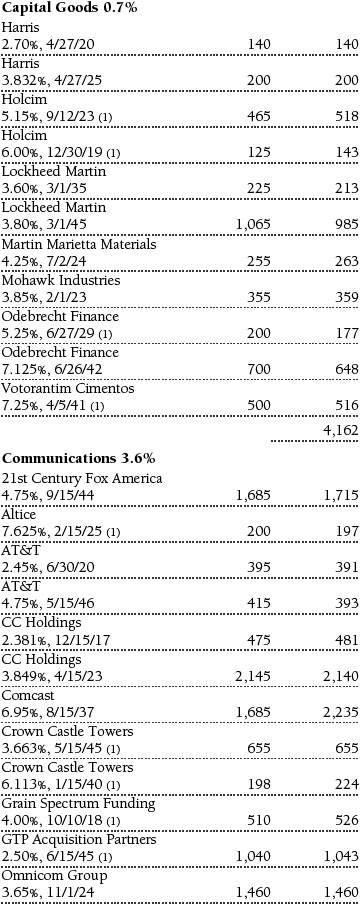
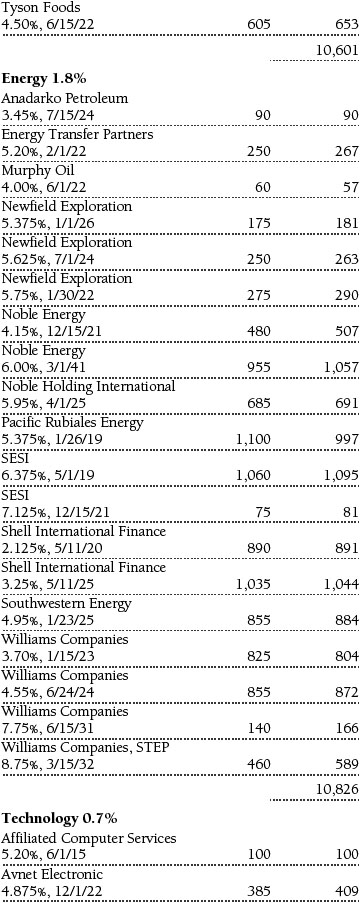
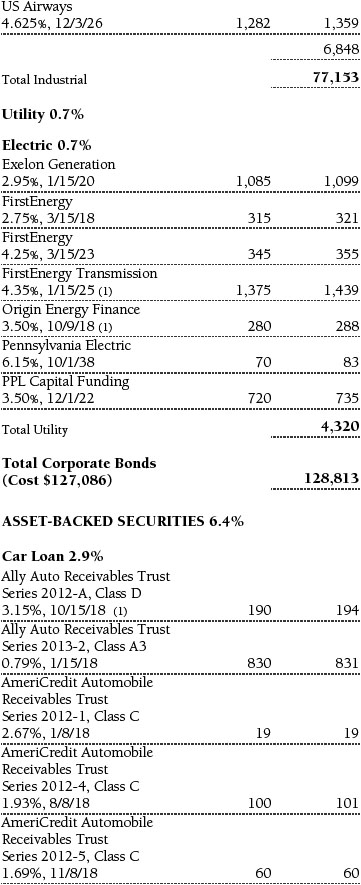
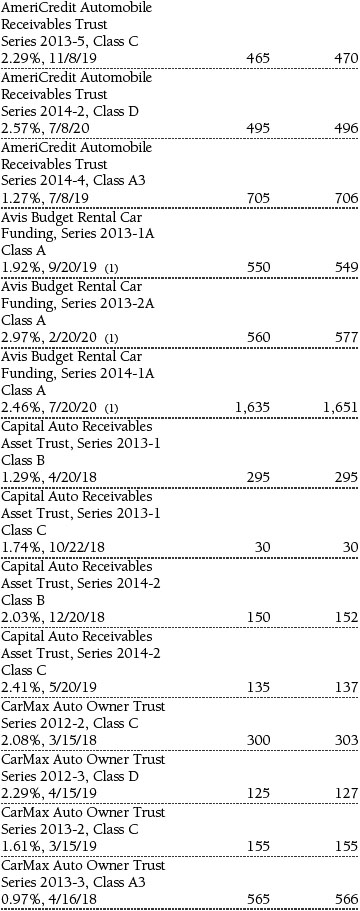
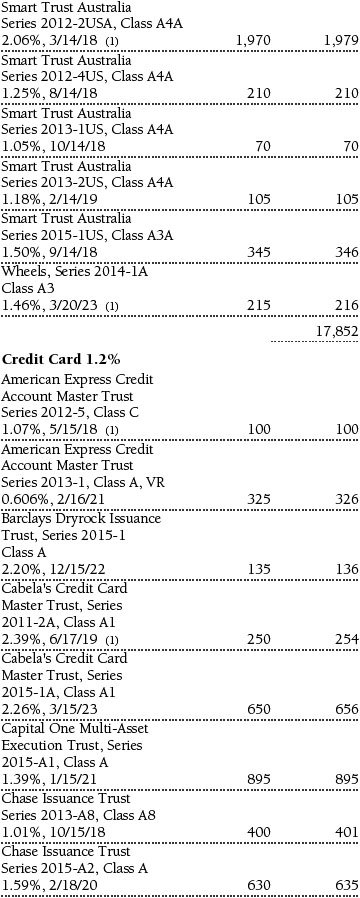
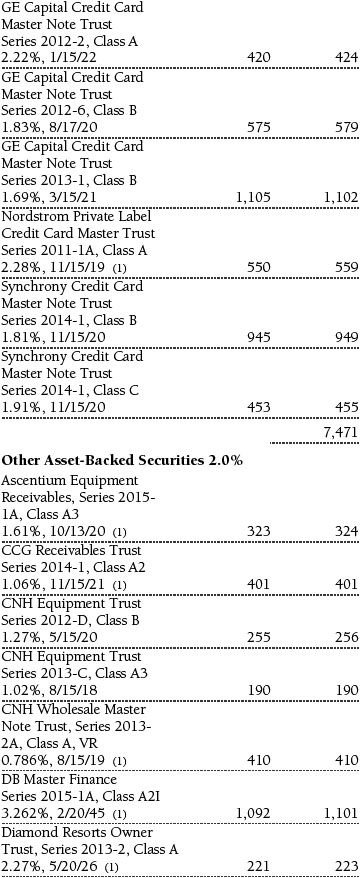
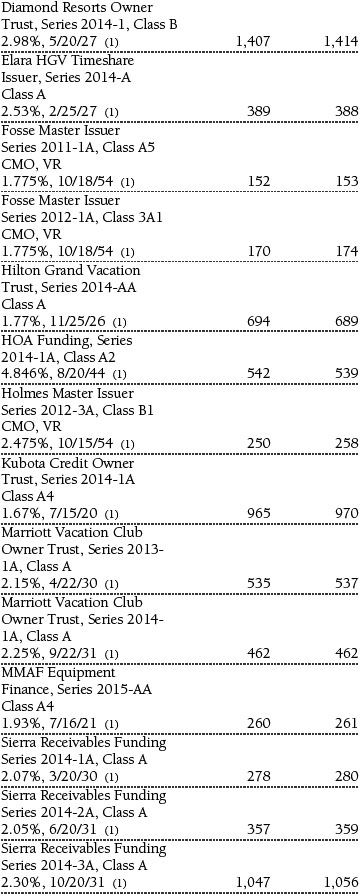
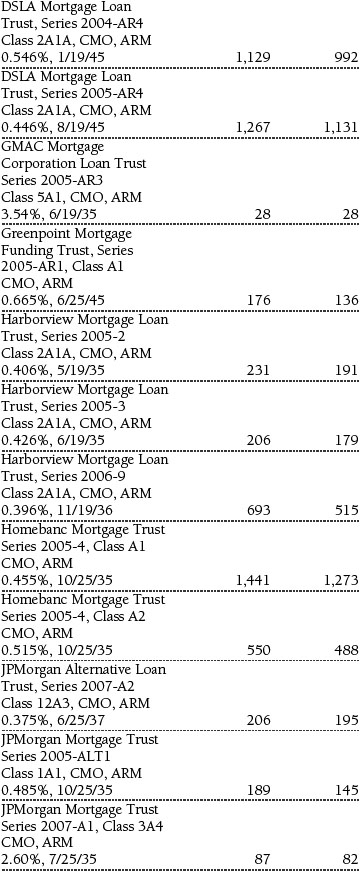
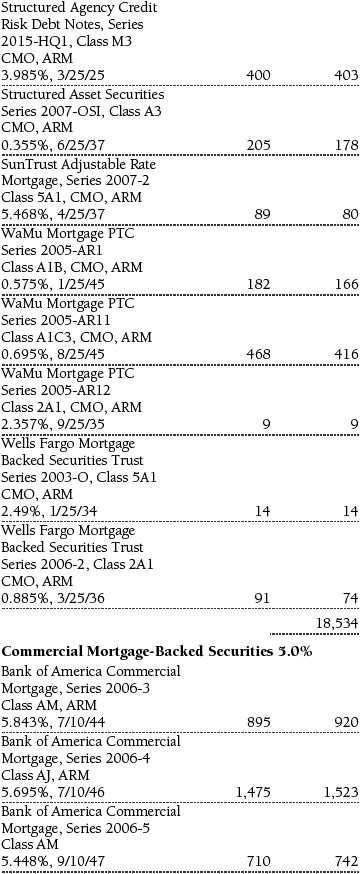
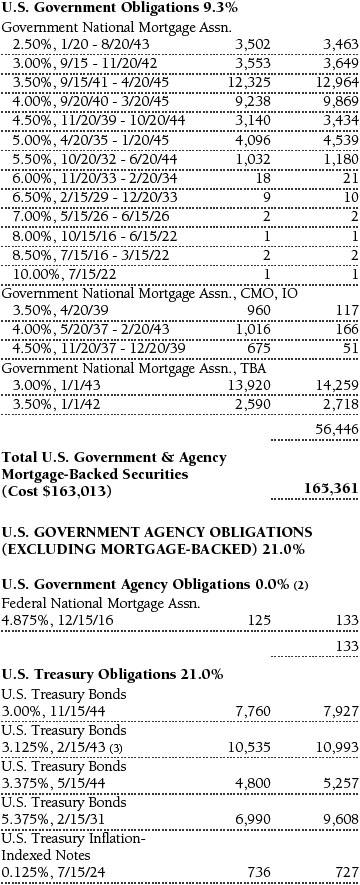
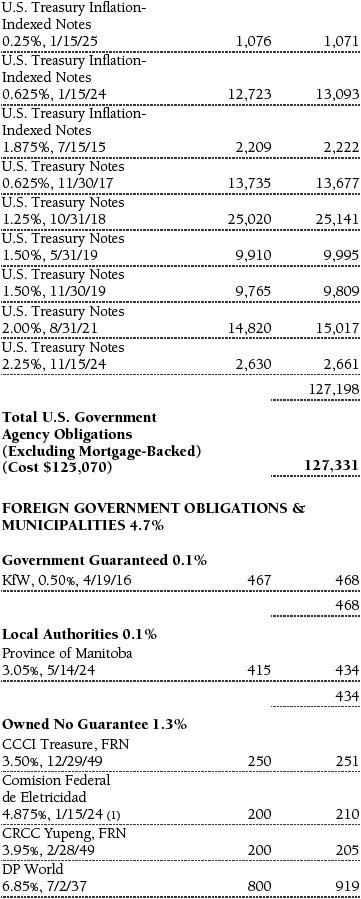
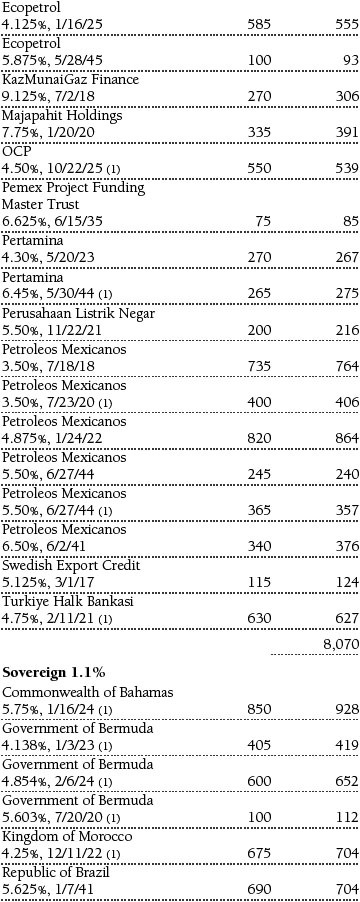
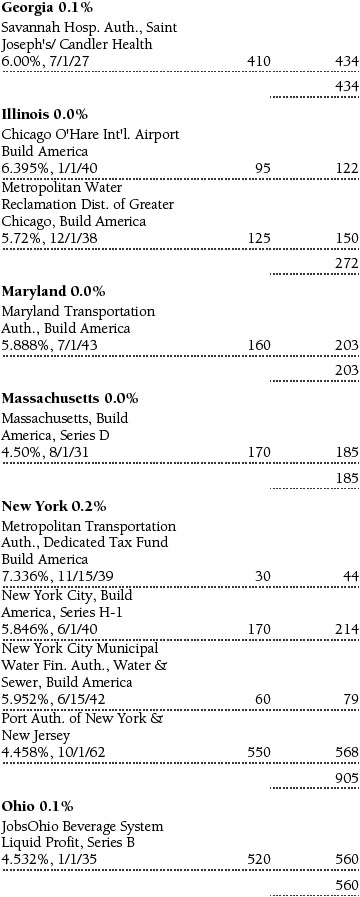
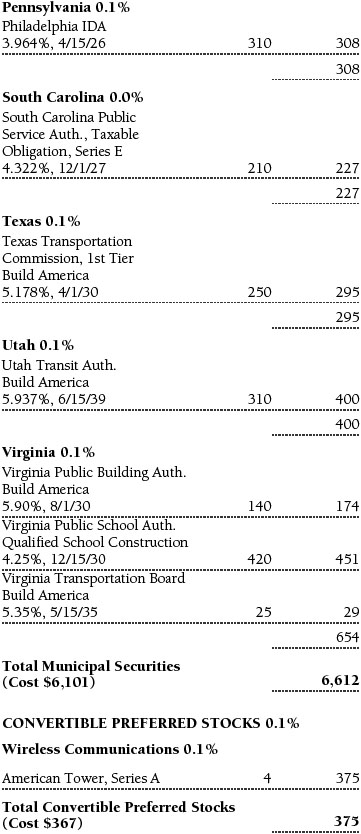
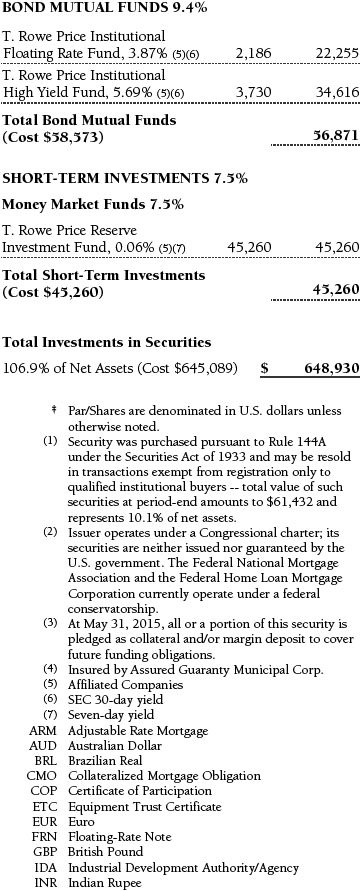
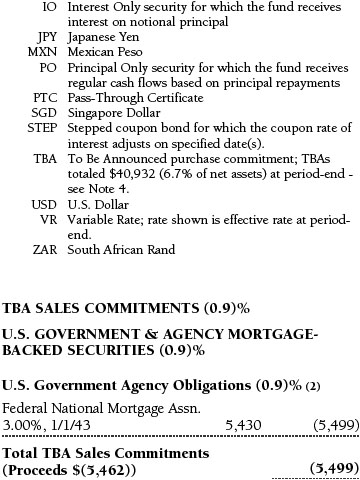
Portfolio of Investments‡
T. Rowe Price Institutional Core Plus Fund
May 31, 2015


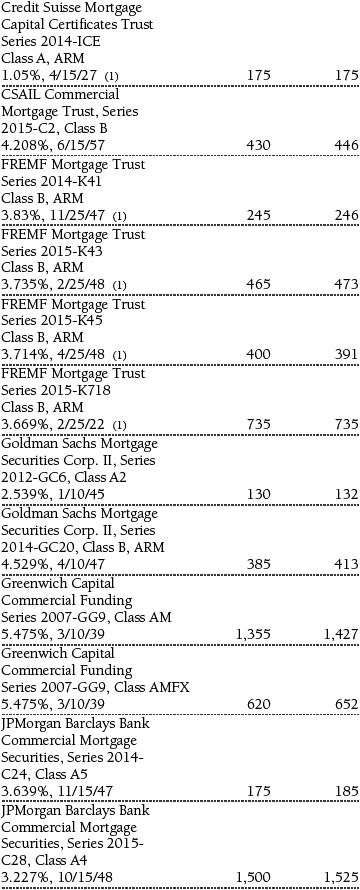
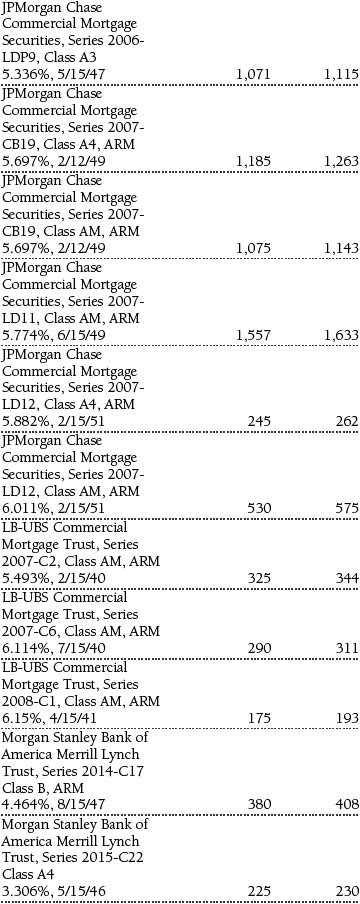

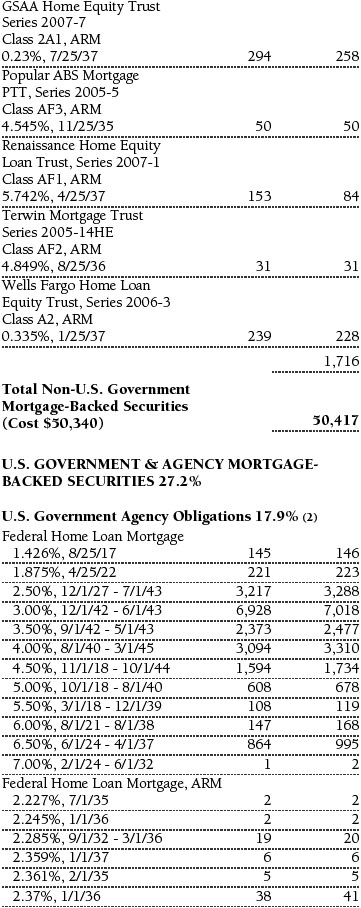
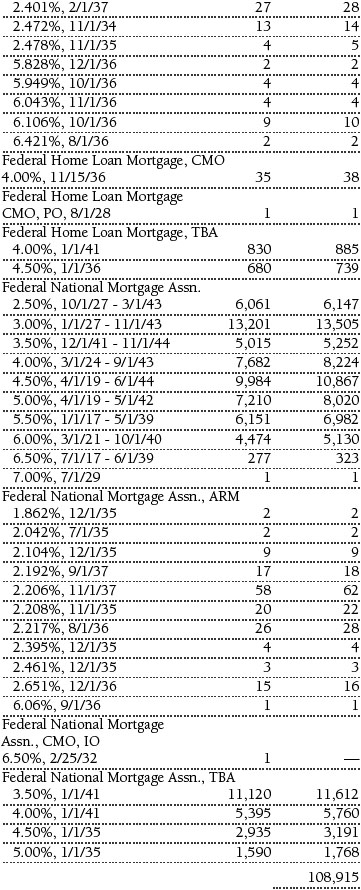

The accompanying notes are an integral part of these financial statements.
Statement of Assets and Liabilities
T. Rowe Price Institutional Core Plus Fund
May 31, 2015
($000s, except shares and per share amounts)
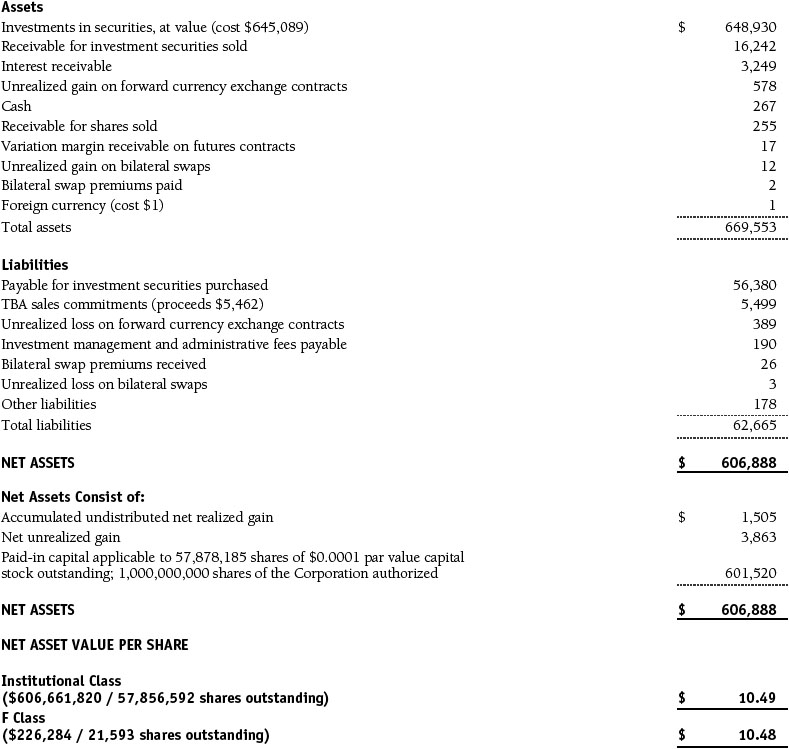
The accompanying notes are an integral part of these financial statements.
Statement of Operations
T. Rowe Price Institutional Core Plus Fund
($000s)

The accompanying notes are an integral part of these financial statements.
Statement of Changes in Net Assets
T. Rowe Price Institutional Core Plus Fund
($000s)
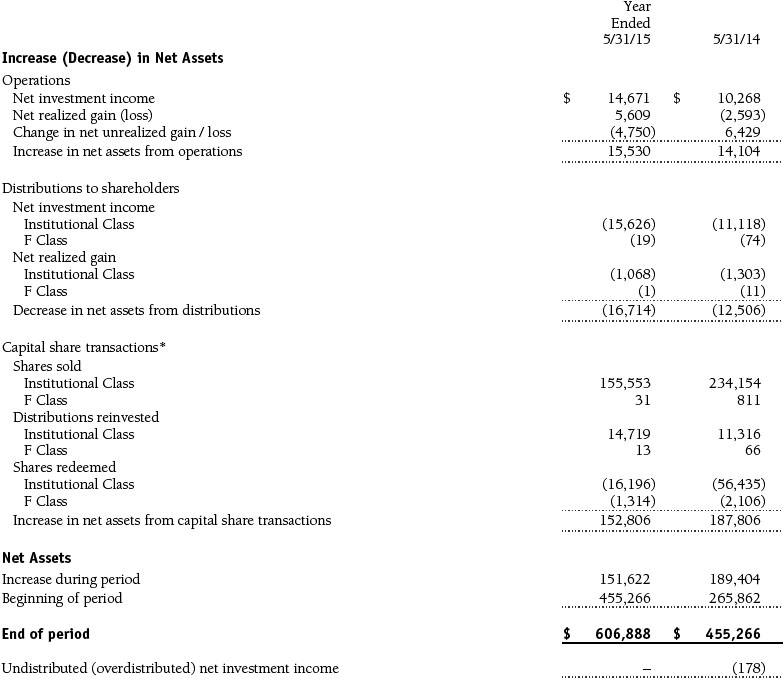

The accompanying notes are an integral part of these financial statements.
Notes to Financial Statements
T. Rowe Price Institutional Core Plus Fund
May 31, 2015
T. Rowe Price Institutional Income Funds, Inc. (the corporation), is registered under the Investment Company Act of 1940 (the 1940 Act). The Institutional Core Plus Fund (the fund) is a diversified, open-end management investment company established by the corporation. The fund seeks to maximize total return through income and capital appreciation. The fund has two classes of shares: the Institutional Core Plus Fund original share class, referred to in this report as the Institutional Class, offered since November 30, 2004, and the Institutional Core Plus Fund–F Class (F Class), offered since September 28, 2010. F Class shares are available only through financial advisors and certain third-party intermediaries that have entered into an administrative fee agreement with T. Rowe Price Services, Inc. The F Class participates in a Board-approved administrative fee payment program pursuant to which the fund compensates certain financial intermediaries at a rate of up to 0.10% of average daily net assets (up to 0.15% of average daily net assets for certain defined contribution plans) per year for various shareholder and administrative services they provide to underlying investors. Each class has exclusive voting rights on matters related solely to that class; separate voting rights on matters that relate to both classes; and, in all other respects, the same rights and obligations as the other class.
NOTE 1 - SIGNIFICANT ACCOUNTING POLICIES
Basis of Preparation The fund is an investment company and follows accounting and reporting guidance in the Financial Accounting Standards Board (FASB) Accounting Standards Codification Topic 946 (ASC 946). The accompanying financial statements were prepared in accordance with accounting principles generally accepted in the United States of America (GAAP), including but not limited to ASC 946. GAAP requires the use of estimates made by management. Management believes that estimates and valuations are appropriate; however, actual results may differ from those estimates, and the valuations reflected in the accompanying financial statements may differ from the value ultimately realized upon sale or maturity.
Investment Transactions, Investment Income, and Distributions Income and expenses are recorded on the accrual basis. Premiums and discounts on debt securities are amortized for financial reporting purposes. Paydown gains and losses are recorded as an adjustment to interest income. Inflation adjustments to the principal amount of inflation-indexed bonds are reflected as interest income. Dividends received from mutual fund investments are reflected as dividend income; capital gain distributions are reflected as realized gain/loss. Dividend income and capital gain distributions are recorded on the ex-dividend date. Income tax-related interest and penalties, if incurred, would be recorded as income tax expense. Investment transactions are accounted for on the trade date. Realized gains and losses are reported on the identified cost basis. Distributions to shareholders are recorded on the ex-dividend date. Income distributions are declared by each class daily and paid monthly. Capital gain distributions, if any, are generally declared and paid by the fund annually.
Currency Translation Assets, including investments, and liabilities denominated in foreign currencies are translated into U.S. dollar values each day at the prevailing exchange rate, using the mean of the bid and asked prices of such currencies against U.S. dollars as quoted by a major bank. Purchases and sales of securities, income, and expenses are translated into U.S. dollars at the prevailing exchange rate on the date of the transaction. The effect of changes in foreign currency exchange rates on realized and unrealized security gains and losses is reflected as a component of security gains and losses.
Class Accounting The F Class pays certain shareholder and administrative expenses in an amount not exceeding 0.15% of the class’s average daily net assets. Investment income and investment management and administrative expense are allocated to the classes based upon the relative daily net assets of each class’s settled shares; realized and unrealized gains and losses are allocated based upon the relative daily net assets of each class’s outstanding shares.
New Accounting Guidance In June 2014, FASB issued Accounting Standards Update (ASU) No. 2014-11, Transfers and Servicing (Topic 860), Repurchase-to-Maturity Transactions, Repurchase Financings, and Disclosures. The ASU changes the accounting for certain repurchase agreements and expands disclosure requirements related to repurchase agreements, securities lending, repurchase-to-maturity and similar transactions. The ASU is effective for interim and annual reporting periods beginning after December 15, 2014. Adoption will have no effect on the fund’s net assets or results of operations.
In May 2015, FASB issued ASU No. 2015-07, Fair Value Measurement (Topic 820), Disclosures for Investments in Certain Entities That Calculate Net Asset Value per Share (or Its Equivalent). The ASU removes the requirement to categorize within the fair value hierarchy all investments for which fair value is measured using the net asset value per share practical expedient and amends certain disclosure requirements for such investments. The ASU is effective for interim and annual reporting periods beginning after December 15, 2015. Adoption will have no effect on the fund’s net assets or results of operations.
NOTE 2 - VALUATION
The fund’s financial instruments are valued and each class’s net asset value (NAV) per share is computed at the close of the New York Stock Exchange (NYSE), normally 4 p.m. ET, each day the NYSE is open for business.
Fair Value The fund’s financial instruments are reported at fair value, which GAAP defines as the price that would be received to sell an asset or paid to transfer a liability in an orderly transaction between market participants at the measurement date. The T. Rowe Price Valuation Committee (the Valuation Committee) has been established by the fund’s Board of Directors (the Board) to ensure that financial instruments are appropriately priced at fair value in accordance with GAAP and the 1940 Act. Subject to oversight by the Board, the Valuation Committee develops and oversees pricing-related policies and procedures and approves all fair value determinations. Specifically, the Valuation Committee establishes procedures to value securities; determines pricing techniques, sources, and persons eligible to effect fair value pricing actions; oversees the selection, services, and performance of pricing vendors; oversees valuation-related business continuity practices; and provides guidance on internal controls and valuation-related matters. The Valuation Committee reports to the Board; is chaired by the fund’s treasurer; and has representation from legal, portfolio management and trading, operations, and risk management.
Various valuation techniques and inputs are used to determine the fair value of financial instruments. GAAP establishes the following fair value hierarchy that categorizes the inputs used to measure fair value:
Level 1 – quoted prices (unadjusted) in active markets for identical financial instruments that the fund can access at the reporting date
Level 2 – inputs other than Level 1 quoted prices that are observable, either directly or indirectly (including, but not limited to, quoted prices for similar financial instruments in active markets, quoted prices for identical or similar financial instruments in inactive markets, interest rates and yield curves, implied volatilities, and credit spreads)
Level 3 – unobservable inputs
Observable inputs are developed using market data, such as publicly available information about actual events or transactions, and reflect the assumptions that market participants would use to price the financial instrument. Unobservable inputs are those for which market data are not available and are developed using the best information available about the assumptions that market participants would use to price the financial instrument. GAAP requires valuation techniques to maximize the use of relevant observable inputs and minimize the use of unobservable inputs. When multiple inputs are used to derive fair value, the financial instrument is assigned to the level within the fair value hierarchy based on the lowest-level input that is significant to the fair value of the financial instrument. Input levels are not necessarily an indication of the risk or liquidity associated with financial instruments at that level but rather the degree of judgment used in determining those values.
Valuation Techniques Debt securities generally are traded in the over-the-counter (OTC) market. Securities with remaining maturities of one year or more at the time of acquisition are valued at prices furnished by dealers who make markets in such securities or by an independent pricing service, which considers the yield or price of bonds of comparable quality, coupon, maturity, and type, as well as prices quoted by dealers who make markets in such securities. Securities with remaining maturities of less than one year at the time of acquisition generally use amortized cost in local currency to approximate fair value. However, if amortized cost is deemed not to reflect fair value or the fund holds a significant amount of such securities with remaining maturities of more than 60 days, the securities are valued at prices furnished by dealers who make markets in such securities or by an independent pricing service. Generally, debt securities are categorized in Level 2 of the fair value hierarchy; however, to the extent the valuations include significant unobservable inputs, the securities would be categorized in Level 3.
Equity securities listed or regularly traded on a securities exchange or in the OTC market are valued at the last quoted sale price or, for certain markets, the official closing price at the time the valuations are made. OTC Bulletin Board securities are valued at the mean of the closing bid and asked prices. A security that is listed or traded on more than one exchange is valued at the quotation on the exchange determined to be the primary market for such security. Listed securities not traded on a particular day are valued at the mean of the closing bid and asked prices. Actively traded domestic equity securities generally are categorized in Level 1 of the fair value hierarchy. OTC Bulletin Board securities, certain preferred securities, and equity securities traded in inactive markets generally are categorized in Level 2 of the fair value hierarchy.
Investments in mutual funds are valued at the mutual fund’s closing NAV per share on the day of valuation and are categorized in Level 1 of the fair value hierarchy. Financial futures contracts are valued at closing settlement prices and are categorized in Level 1 of the fair value hierarchy. Forward currency exchange contracts are valued using the prevailing forward exchange rate and are categorized in Level 2 of the fair value hierarchy. Swaps are valued at prices furnished by independent swap dealers or by an independent pricing service and generally are categorized in Level 2 of the fair value hierarchy; however, if unobservable inputs are significant to the valuation, the swap would be categorized in Level 3. Assets and liabilities other than financial instruments, including short-term receivables and payables, are carried at cost, or estimated realizable value, if less, which approximates fair value.
Thinly traded financial instruments and those for which the above valuation procedures are inappropriate or are deemed not to reflect fair value are stated at fair value as determined in good faith by the Valuation Committee. The objective of any fair value pricing determination is to arrive at a price that could reasonably be expected from a current sale. Financial instruments fair valued by the Valuation Committee are primarily private placements, restricted securities, warrants, rights, and other securities that are not publicly traded.
Subject to oversight by the Board, the Valuation Committee regularly makes good faith judgments to establish and adjust the fair valuations of certain securities as events occur and circumstances warrant. For instance, in determining the fair value of troubled or thinly traded debt instruments, the Valuation Committee considers a variety of factors, which may include, but are not limited to, the issuer’s business prospects, its financial standing and performance, recent investment transactions in the issuer, strategic events affecting the company, market liquidity for the issuer, and general economic conditions and events. In consultation with the investment and pricing teams, the Valuation Committee will determine an appropriate valuation technique based on available information, which may include both observable and unobservable inputs. The Valuation Committee typically will afford greatest weight to actual prices in arm’s length transactions, to the extent they represent orderly transactions between market participants; transaction information can be reliably obtained; and prices are deemed representative of fair value. However, the Valuation Committee may also consider other valuation methods such as a discount or premium from market value of a similar, freely traded security of the same issuer; discounted cash flows; yield to maturity; or some combination. Fair value determinations are reviewed on a regular basis and updated as information becomes available, including actual purchase and sale transactions of the issue. Because any fair value determination involves a significant amount of judgment, there is a degree of subjectivity inherent in such pricing decisions and fair value prices determined by the Valuation Committee could differ from those of other market participants. Depending on the relative significance of unobservable inputs, including the valuation technique(s) used, fair valued securities may be categorized in Level 2 or 3 of the fair value hierarchy.
Valuation Inputs The following table summarizes the fund’s financial instruments, based on the inputs used to determine their fair values on May 31, 2015:
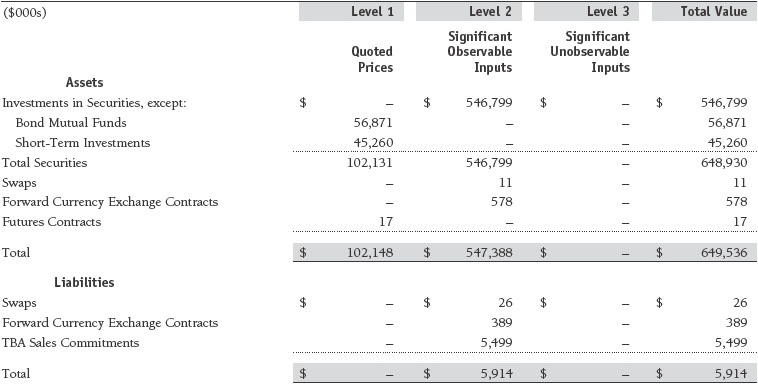
There were no material transfers between Levels 1 and 2 during the year ended May 31, 2015.
NOTE 3 - DERIVATIVE INSTRUMENTS
During the year ended May 31, 2015, the fund invested in derivative instruments. As defined by GAAP, a derivative is a financial instrument whose value is derived from an underlying security price, foreign exchange rate, interest rate, index of prices or rates, or other variable; it requires little or no initial investment and permits or requires net settlement. The fund invests in derivatives only if the expected risks and rewards are consistent with its investment objectives, policies, and overall risk profile, as described in its prospectus and Statement of Additional Information. The fund may use derivatives for a variety of purposes, such as seeking to hedge against declines in principal value, increase yield, invest in an asset with greater efficiency and at a lower cost than is possible through direct investment, or to adjust portfolio duration and credit exposure. The risks associated with the use of derivatives are different from, and potentially much greater than, the risks associated with investing directly in the instruments on which the derivatives are based. The fund at all times maintains sufficient cash reserves, liquid assets, or other SEC-permitted asset types to cover its settlement obligations under open derivative contracts.
The fund values its derivatives at fair value, as described in Note 2, and recognizes changes in fair value currently in its results of operations. Accordingly, the fund does not follow hedge accounting, even for derivatives employed as economic hedges. Generally, the fund accounts for its derivatives on a gross basis. It does not offset the fair value of derivative liabilities against the fair value of derivative assets on its financial statements, nor does it offset the fair value of derivative instruments against the right to reclaim or obligation to return collateral.
The following table summarizes the fair value of the fund’s derivative instruments held as of May 31, 2015, and the related location on the accompanying Statement of Assets and Liabilities, presented by primary underlying risk exposure:

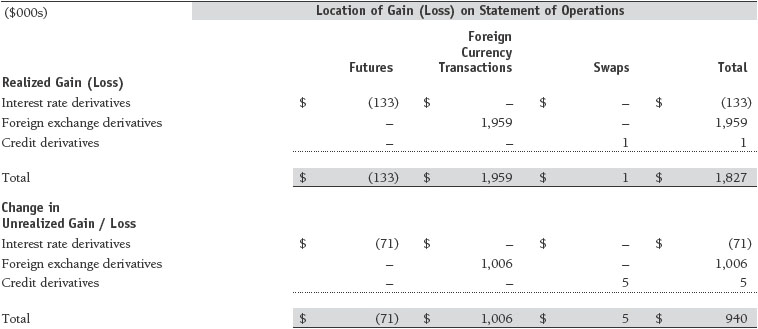
Additionally, the amount of gains and losses on derivative instruments recognized in fund earnings during the year ended May 31, 2015, and the related location on the accompanying Statement of Operations is summarized in the following table by primary underlying risk exposure:
Counterparty Risk and Collateral The fund invests in derivatives in various markets, which expose it to differing levels of counterparty risk. Counterparty risk on exchange-traded and centrally cleared derivative contracts, such as futures, exchange-traded options, and centrally cleared swaps, is minimal because the clearinghouse provides protection against counterparty defaults. For futures and centrally cleared swaps, the fund is required to deposit collateral in an amount equal to a certain percentage of the contract value (margin requirement) and the margin requirement must be maintained over the life of the contract. Each clearing broker, in its sole discretion, may adjust the margin requirements applicable to the fund.
Derivatives, such as bilateral swaps, forward currency exchange contracts, and OTC options, that are transacted and settle directly with a counterparty (bilateral derivatives) expose the fund to greater counterparty risk. To mitigate this risk, the fund has entered into master netting arrangements (MNAs) with certain counterparties that permit net settlement under specified conditions and, for certain counterparties, also provide collateral agreements. MNAs may be in the form of International Swaps and Derivatives Association master agreements (ISDAs) or foreign exchange letter agreements (FX letters).
MNAs govern the ability to offset amounts the fund owes a counterparty against amounts the counterparty owes the fund (net settlement). Both ISDAs and FX letters generally allow net settlement in the event of contract termination and permit termination by either party prior to maturity upon the occurrence of certain stated events, such as failure to pay or bankruptcy. In addition, ISDAs specify other events, the occurrence of which would allow one of the parties to terminate. For example, a downgrade in credit rating of a counterparty would allow the fund to terminate while a decline in the fund’s net assets of more than a certain percentage would allow the counterparty to terminate. Upon termination, all bilateral derivatives with that counterparty would be liquidated and a net amount settled. ISDAs typically include collateral agreements whereas FX letters do not. Collateral requirements are determined based on the net aggregate unrealized gain or loss on all bilateral derivatives with each counterparty, subject to minimum transfer amounts that typically range from $100,000 to $250,000. Any additional collateral required due to changes in security values is transferred the next business day.
Collateral may be in the form of cash or debt securities issued by the U.S. government or related agencies. Cash and currencies posted by the fund are reflected as cash deposits in the accompanying financial statements and generally are restricted from withdrawal by the fund; securities posted by the fund are so noted in the accompanying Portfolio of Investments; both remain in the fund’s assets. Collateral pledged by counterparties is not included in the fund’s assets because the fund does not obtain effective control over those assets. For bilateral derivatives, collateral posted or received by the fund is held in a segregated account by the fund’s custodian. As of May 31, 2015, no collateral had been posted by the fund to counterparties for bilateral derivatives. As of May 31, 2015, collateral pledged by counterparties to the fund for bilateral derivatives consisted of securities valued at $101,000. As of May 31, 2015, securities valued at $248,000 had been posted by the fund for exchange-traded and/or centrally cleared derivatives.
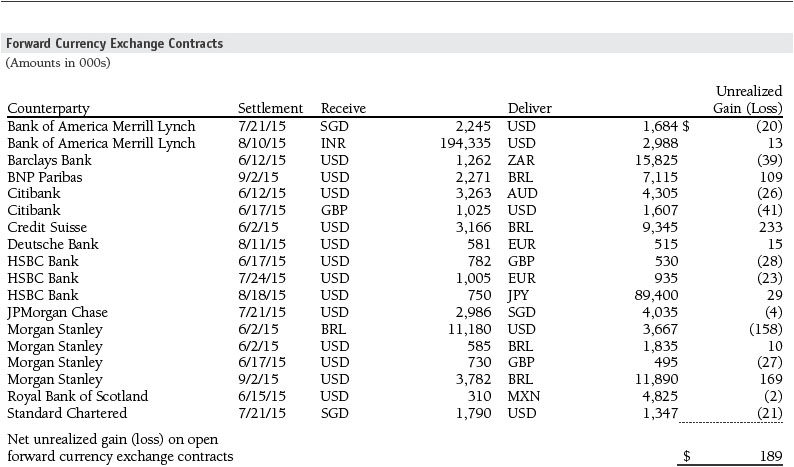
Forward Currency Exchange Contracts The fund is subject to foreign currency exchange rate risk in the normal course of pursuing its investment objectives. It uses forward currency exchange contracts (forwards) primarily to protect its non-U.S. dollar-denominated securities from adverse currency movements relative to the U.S. dollar. A forward involves an obligation to purchase or sell a fixed amount of a specific currency on a future date at a price set at the time of the contract. Although certain forwards may be settled by exchanging only the net gain or loss on the contract, most forwards are settled with the exchange of the underlying currencies in accordance with the specified terms. Forwards are valued at the unrealized gain or loss on the contract, which reflects the net amount the fund either is entitled to receive or obligated to deliver, as measured by the difference between the forward exchange rates at the date of entry into the contract and the forward rates at the reporting date. Appreciated forwards are reflected as assets, and depreciated forwards are reflected as liabilities on the accompanying Statement of Assets and Liabilities. Risks related to the use of forwards include the possible failure of counterparties to meet the terms of the agreements; that anticipated currency movements will not occur, thereby reducing the fund’s total return; and the potential for losses in excess of the fund’s initial investment. During the year ended May 31, 2015, the volume of the fund’s activity in forwards, based on underlying notional amounts, was generally between 2% and 15% of net assets.
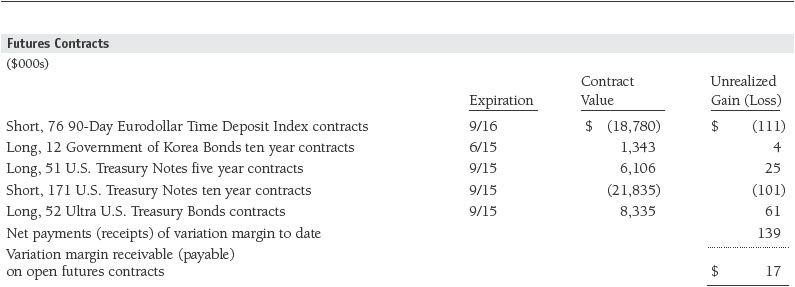
Futures Contracts The fund is subject to interest rate risk in the normal course of pursuing its investment objectives and uses futures contracts to help manage such risk. The fund may enter into futures contracts to manage exposure to interest rate and yield curve movements, security prices, foreign currencies, credit quality, and mortgage prepayments; as an efficient means of adjusting exposure to all or part of a target market; to enhance income; as a cash management tool; or to adjust portfolio duration and credit exposure. A futures contract provides for the future sale by one party and purchase by another of a specified amount of a specific underlying financial instrument at an agreed-upon price, date, time, and place. The fund currently invests only in exchange-traded futures, which generally are standardized as to maturity date, underlying financial instrument, and other contract terms. Payments are made or received by the fund each day to settle daily fluctuations in the value of the contract (variation margin), which reflect changes in the value of the underlying financial instrument. Variation margin is recorded as unrealized gain or loss until the contract is closed. The value of a futures contract included in net assets is the amount of unsettled variation margin; net variation margin receivable is reflected as an asset and net variation margin payable is reflected as a liability on the accompanying Statement of Assets and Liabilities. Risks related to the use of futures contracts include possible illiquidity of the futures markets, contract prices that can be highly volatile and imperfectly correlated to movements in hedged security values and/or interest rates, and potential losses in excess of the fund’s initial investment. During the year ended May 31, 2015, the volume of the fund’s activity in futures, based on underlying notional amounts, was generally between 7% and 11% of net assets.
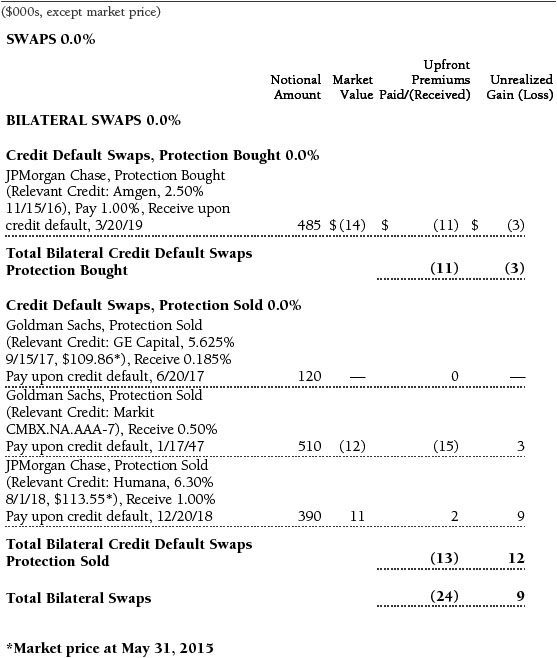
Swaps The fund is subject to credit risk in the normal course of pursuing its investment objectives and uses swap contracts to help manage such risk. The fund may use swaps in an effort to manage exposure to changes in interest rates, inflation rates, and credit quality; to adjust overall exposure to certain markets; to enhance total return or protect the value of portfolio securities; to serve as a cash management tool; or to adjust portfolio duration and credit exposure. Swap agreements can be settled either directly with the counterparty (bilateral swap) or through a central clearinghouse (centrally cleared swap). Fluctuations in the fair value of a contract are reflected in unrealized gain or loss and are reclassified to realized gain or loss upon contract termination or cash settlement. Net periodic receipts or payments required by a contract increase or decrease, respectively, the value of the contract until the contractual payment date, at which time such amounts are reclassified from unrealized to realized gain or loss. For bilateral swaps, cash payments are made or received by the fund on a periodic basis in accordance with contract terms; unrealized gain on contracts and premiums paid are reflected as assets, and unrealized loss on contracts and premiums received are reflected as liabilities on the accompanying Statement of Assets and Liabilities. For centrally cleared swaps, payments are made or received by the fund each day to settle the daily fluctuation in the value of the contract (variation margin). Accordingly, the value of a centrally cleared swap included in net assets is the unsettled variation margin; net variation margin receivable is reflected as an asset and net variation margin payable is reflected as a liability on the accompanying Statement of Assets and Liabilities.
Credit default swaps are agreements where one party (the protection buyer) agrees to make periodic payments to another party (the protection seller) in exchange for protection against specified credit events, such as certain defaults and bankruptcies related to an underlying credit instrument, or issuer or index of such instruments. Upon occurrence of a specified credit event, the protection seller is required to pay the buyer the difference between the notional amount of the swap and the value of the underlying credit, either in the form of a net cash settlement or by paying the gross notional amount and accepting delivery of the relevant underlying credit. For credit default swaps where the underlying credit is an index, a specified credit event may affect all or individual underlying securities included in the index and will be settled based upon the relative weighting of the affected underlying security(s) within the index. Generally, the payment risk for the seller of protection is inversely related to the current market price or credit rating of the underlying credit or the market value of the contract relative to the notional amount, which are indicators of the markets’ valuation of credit quality. As of May 31, 2015, the notional amount of protection sold by the fund totaled $1,020,000 (0.2% of net assets), which reflects the maximum potential amount the fund could be required to pay under such contracts. Risks related to the use of credit default swaps include the possible inability of the fund to accurately assess the current and future creditworthiness of underlying issuers, the possible failure of a counterparty to perform in accordance with the terms of the swap agreements, potential government regulation that could adversely affect the fund’s swap investments, and potential losses in excess of the fund’s initial investment.
During the year ended May 31, 2015, the volume of the fund’s activity in swaps, based on underlying notional amounts, was generally less than 1% of net assets.
NOTE 4 - OTHER INVESTMENT TRANSACTIONS
Consistent with its investment objective, the fund engages in the following practices to manage exposure to certain risks and/or to enhance performance. The investment objective, policies, program, and risk factors of the fund are described more fully in the fund’s prospectus and Statement of Additional Information.
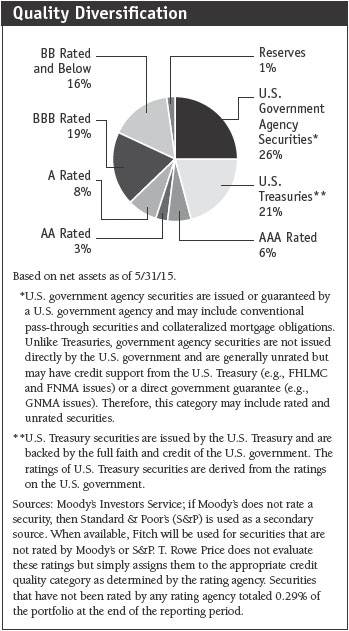
Noninvestment-Grade Debt Securities At May 31, 2015, approximately 15% of the fund’s net assets were invested, either directly or through its investment in T. Rowe Price institutional funds, in noninvestment-grade debt securities, commonly referred to as “high yield” or “junk” bonds. The noninvestment-grade bond market may experience sudden and sharp price swings due to a variety of factors, including changes in economic forecasts, stock market activity, large sustained sales by major investors, a high-profile default, or a change in market sentiment. These events may decrease the ability of issuers to make principal and interest payments and adversely affect the liquidity or value, or both, of such securities.
Restricted Securities The fund may invest in securities that are subject to legal or contractual restrictions on resale. Prompt sale of such securities at an acceptable price may be difficult and may involve substantial delays and additional costs.
TBA Purchase and Sale Commitments The fund may enter into to-be-announced (TBA) purchase or sale commitments, pursuant to which it agrees to purchase or sell, respectively, mortgage-backed securities for a fixed unit price, with payment and delivery at a scheduled future date beyond the customary settlement period for such securities. With TBA transactions, the particular securities to be delivered are not identified at the trade date; however, delivered securities must meet specified terms, including issuer, rate, and mortgage term, and be within industry-accepted “good delivery” standards. The fund may enter into TBA purchase transactions with the intention of taking possession of the underlying securities, may elect to extend the settlement by “rolling” the transaction, and/or may use TBAs to gain interim exposure to underlying securities. Until settlement, the fund maintains liquid assets sufficient to settle its TBA commitments.
To mitigate counterparty risk, the fund has entered into agreements with TBA counterparties that provide for collateral and the right to offset amounts due to or from those counterparties under specified conditions. Subject to minimum transfer amounts, collateral requirements are determined and transfers made based on the net aggregate unrealized gain or loss on all TBA commitments with a particular counterparty. At any time, the fund’s risk of loss from a particular counterparty related to its TBA commitments is the aggregate unrealized gain on appreciated TBAs in excess of unrealized loss on depreciated TBAs and collateral received, if any, from such counterparty. As of May 31, 2015, no collateral was pledged by the fund or counterparties for TBAs.
Mortgage-Backed Securities The fund may invest in mortgage-backed securities (MBS or pass-through certificates) that represent an interest in a pool of specific underlying mortgage loans and entitle the fund to the periodic payments of principal and interest from those mortgages. MBS may be issued by government agencies or corporations, or private issuers. Most MBS issued by government agencies are guaranteed; however, the degree of protection differs based on the issuer. The fund also may invest in stripped MBS, created when a traditional MBS is split into an interest-only (IO) and a principal-only (PO) strip. MBS, including IOs and POs, are sensitive to changes in economic conditions that affect the rate of prepayments and defaults on the underlying mortgages; accordingly, the value, income, and related cash flows from MBS may be more volatile than other debt instruments. IOs also risk loss of invested principal from faster-than-anticipated prepayments.
Other Purchases and sales of portfolio securities other than short-term and U.S. government securities aggregated $210,826,000 and $134,911,000, respectively, for the year ended May 31, 2015. Purchases and sales of U.S. government securities aggregated $737,785,000 and $637,245,000, respectively, for the year ended May 31, 2015.
NOTE 5 - FEDERAL INCOME TAXES
No provision for federal income taxes is required since the fund intends to continue to qualify as a regulated investment company under Subchapter M of the Internal Revenue Code and distribute to shareholders all of its taxable income and gains. Distributions determined in accordance with federal income tax regulations may differ in amount or character from net investment income and realized gains for financial reporting purposes. Financial reporting records are adjusted for permanent book/tax differences to reflect tax character but are not adjusted for temporary differences.
The fund files U.S. federal, state, and local tax returns as required. The fund’s tax returns are subject to examination by the relevant tax authorities until expiration of the applicable statute of limitations, which is generally three years after the filing of the tax return but which can be extended to six years in certain circumstances. Tax returns for open years have incorporated no uncertain tax positions that require a provision for income taxes.
Reclassifications between income and gain relate primarily to the character of paydown gains and losses on asset-backed securities. For the year ended May 31, 2015, the following reclassifications were recorded to reflect tax character (there was no impact on results of operations or net assets):

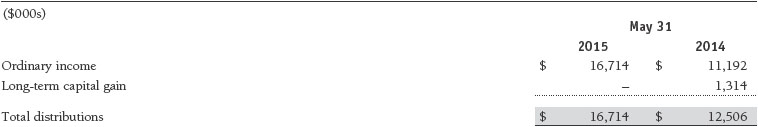
Distributions during the years ended May 31, 2015 and May 31, 2014, were characterized for tax purposes as follows:
At May 31, 2015, the tax-basis cost of investments and components of net assets were as follows:
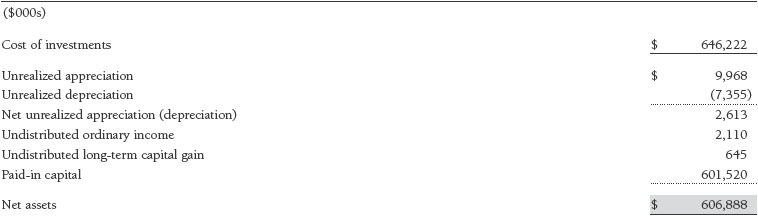
The difference between book-basis and tax-basis net unrealized appreciation (depreciation) is attributable to the deferral of losses from certain open derivative contracts for tax purposes. The fund intends to retain realized gains to the extent of available capital loss carryforwards. Net realized capital losses may be carried forward indefinitely to offset future realized capital gains. During the year ended May 31, 2015, the fund utilized $1,757,000 of capital loss carryforwards.
NOTE 6 - RELATED PARTY TRANSACTIONS
The fund is managed by T. Rowe Price Associates, Inc. (Price Associates), a wholly owned subsidiary of T. Rowe Price Group, Inc. (Price Group). The investment management and administrative agreement between the fund and Price Associates provides for an all-inclusive annual fee equal to 0.40% of the fund’s average daily net assets. The fee is computed daily and paid monthly. The all-inclusive fee covers investment management, shareholder servicing, transfer agency, accounting, and custody services provided to the fund, as well as fund directors’ fees and expenses. Interest, taxes, brokerage commissions, and extraordinary expenses are paid directly by the fund.
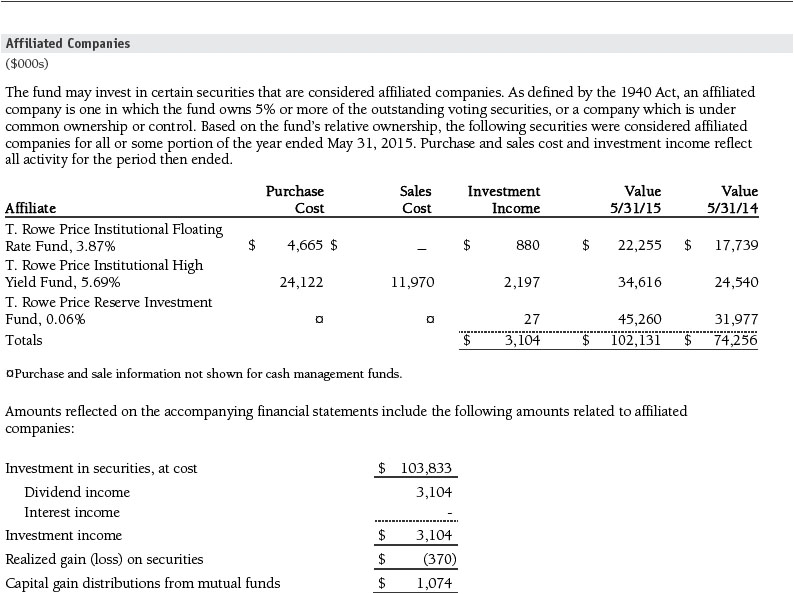
The fund may invest in the T. Rowe Price Reserve Investment Fund, the T. Rowe Price Government Reserve Investment Fund, or the T. Rowe Price Short-Term Reserve Fund (collectively, the Price Reserve Investment Funds), open-end management investment companies managed by Price Associates and considered affiliates of the fund. The Price Reserve Investment Funds are offered as short-term investment options to mutual funds, trusts, and other accounts managed by Price Associates or its affiliates and are not available for direct purchase by members of the public. The Price Reserve Investment Funds pay no investment management fees.
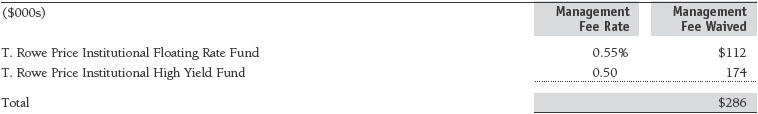
The fund may also invest in certain other T. Rowe Price funds as a means of gaining efficient and cost-effective exposure to certain markets. The fund does not invest for the purpose of exercising management or control; however, investments by the fund may represent a significant portion of an underlying T. Rowe Price fund’s net assets. Each underlying T. Rowe Price fund is an open-end management investment company managed by Price Associates and is considered an affiliate of the fund. To ensure that the fund does not incur duplicate management fees (paid by the underlying T. Rowe Price fund(s) and the fund), Price Associates has agreed to permanently waive a portion of its management fee charged to the fund in an amount sufficient to fully offset that portion of management fees paid by each underlying T. Rowe Price fund related to the fund’s investment therein. The accompanying Statement of Operations reflects management fees permanently waived pursuant to this agreement. Annual fee rates and management fees waived related to investments in the underlying T. Rowe Price fund(s) for the year ended May 31, 2015, are as follows:
As of May 31, 2015, T. Rowe Price Group, Inc., or its wholly owned subsidiaries owned 1,814,848 shares of the Institutional Class, representing 3% of the fund’s net assets.
Report of Independent Registered Public Accounting Firm
To the Board of Directors of T. Rowe Price Institutional Income Funds, Inc.
and Shareholders of T. Rowe Price Institutional Core Plus Fund
In our opinion, the accompanying statement of assets and liabilities, including the portfolio of investments, and the related statements of operations and of changes in net assets and the financial highlights present fairly, in all material respects, the financial position of the T. Rowe Price Institutional Core Plus Fund (one of the portfolios comprising T. Rowe Price Institutional Income Funds, Inc., hereafter referred to as the “Fund”) at May 31, 2015, the results of its operations, the changes in its net assets and the financial highlights for each of the periods indicated therein, in conformity with accounting principles generally accepted in the United States of America. These financial statements and financial highlights (hereafter referred to as “financial statements”) are the responsibility of the Fund’s management. Our responsibility is to express an opinion on these financial statements based on our audits. We conducted our audits of these financial statements in accordance with the standards of the Public Company Accounting Oversight Board (United States). Those standards require that we plan and perform the audit to obtain reasonable assurance about whether the financial statements are free of material misstatement. An audit includes examining, on a test basis, evidence supporting the amounts and disclosures in the financial statements, assessing the accounting principles used and significant estimates made by management, and evaluating the overall financial statement presentation. We believe that our audits, which included confirmation of securities at May 31, 2015 by correspondence with the custodian and brokers, and confirmation of the underlying funds by correspondence with the transfer agent, provide a reasonable basis for our opinion.
PricewaterhouseCoopers LLP
Baltimore, Maryland
July 16, 2015
| Tax Information (Unaudited) for the Tax Year Ended 5/31/15 |
We are providing this information as required by the Internal Revenue Code. The amounts shown may differ from those elsewhere in this report because of differences between tax and financial reporting requirements.
The fund’s distributions to shareholders included $1,382,000 from short-term capital gains.
For taxable non-corporate shareholders, $10,000 of the fund’s income represents qualified dividend income subject to a long-term capital gains tax rate of not greater than 20%.
For corporate shareholders, $9,000 of the fund’s income qualifies for the dividends-received deduction.
| Information on Proxy Voting Policies, Procedures, and Records |
A description of the policies and procedures used by T. Rowe Price funds and portfolios to determine how to vote proxies relating to portfolio securities is available in each fund’s Statement of Additional Information. You may request this document by calling 1-800-225-5132 or by accessing the SEC’s website, sec.gov.
The description of our proxy voting policies and procedures is also available on our website, troweprice.com. To access it, click on the words “Social Responsibility” at the top of our corporate homepage. Next, click on the words “Conducting Business Responsibly” on the left side of the page that appears. Finally, click on the words “Proxy Voting Policies” on the left side of the page that appears.
Each fund’s most recent annual proxy voting record is available on our website and through the SEC’s website. To access it through our website, follow the directions above to reach the “Conducting Business Responsibly” page. Click on the words “Proxy Voting Records” on the left side of that page, and then click on the “View Proxy Voting Records” link at the bottom of the page that appears.
| How to Obtain Quarterly Portfolio Holdings |
The fund files a complete schedule of portfolio holdings with the Securities and Exchange Commission for the first and third quarters of each fiscal year on Form N-Q. The fund’s Form N-Q is available electronically on the SEC’s website (sec.gov); hard copies may be reviewed and copied at the SEC’s Public Reference Room, 100 F St. N.E., Washington, DC 20549. For more information on the Public Reference Room, call 1-800-SEC-0330.
| Approval of Investment Management Agreement |
On March 13, 2015, the fund’s Board of Directors (Board), including a majority of the fund’s independent directors, approved the continuation of the investment management agreement (Advisory Contract) between the fund and its investment advisor, T. Rowe Price Associates, Inc. (Advisor). In connection with its deliberations, the Board requested, and the Advisor provided, such information as the Board (with advice from independent legal counsel) deemed reasonably necessary. The Board considered a variety of factors in connection with its review of the Advisory Contract, also taking into account information provided by the Advisor during the course of the year, as discussed below:
Services Provided by the Advisor
The Board considered the nature, quality, and extent of the services provided to the fund by the Advisor. These services included, but were not limited to, directing the fund’s investments in accordance with its investment program and the overall management of the fund’s portfolio, as well as a variety of related activities such as financial, investment operations, and administrative services; compliance; maintaining the fund’s records and registrations; and shareholder communications. The Board also reviewed the background and experience of the Advisor’s senior management team and investment personnel involved in the management of the fund, as well as the Advisor’s compliance record. The Board concluded that it was satisfied with the nature, quality, and extent of the services provided by the Advisor.
Investment Performance of the Fund
The Board reviewed the fund’s three-month, one-year, and year-by-year returns, as well as the fund’s average annualized total returns over the 3-, 5-, and 10-year periods, and compared these returns with a wide variety of previously agreed-upon comparable performance measures and market data, including those supplied by Lipper and Morningstar, which are independent providers of mutual fund data.
On the basis of this evaluation and the Board’s ongoing review of investment results, and factoring in the relative market conditions during certain of the performance periods, the Board concluded that the fund’s performance was satisfactory.
Costs, Benefits, Profits, and Economies of Scale
The Board reviewed detailed information regarding the revenues received by the Advisor under the Advisory Contract and other benefits that the Advisor (and its affiliates) may have realized from its relationship with the fund, including any research received under “soft dollar” agreements and commission-sharing arrangements with broker-dealers. The Board considered that the Advisor may receive some benefit from soft-dollar arrangements pursuant to which research is received from broker-dealers that execute the applicable fund’s portfolio transactions. The Board received information on the estimated costs incurred and profits realized by the Advisor from managing T. Rowe Price mutual funds. The Board also reviewed estimates of the profits realized from managing the fund in particular, and the Board concluded that the Advisor’s profits were reasonable in light of the services provided to the fund.
The Board also considered whether the fund benefits under the fee levels set forth in the Advisory Contract from any economies of scale realized by the Advisor. The Board noted that, under the Advisory Contract, the fund pays the Advisor a single fee based on the fund’s average daily net assets that includes investment management services and provides for the Advisor to pay all expenses of the fund’s operations except for interest, taxes, portfolio transaction fees, and any nonrecurring extraordinary expenses that may arise. The Board concluded that, based on the profitability data it reviewed and consistent with this single-fee structure, the Advisory Contract provided for a reasonable sharing of any benefits from economies of scale with the fund.
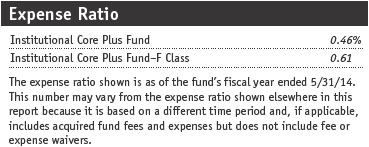
Fees
The Board was provided with information regarding industry trends in management fees and expenses, and the Board reviewed the fund’s single-fee structure in comparison with fees and expenses of other comparable funds based on information and data supplied by Lipper. For these purposes, the Board assumed that the fund’s management fee rate was equal to the single fee less the fund’s operating expenses. The total expense ratio for the F Class also reflects the class’s participation in the administrative fee program. The information provided to the Board indicated that the fund’s management fee rate and total expense ratio for both classes were at or below the median for comparable funds.
The Board also reviewed the fee schedules for institutional accounts and private accounts with similar mandates that are advised or subadvised by the Advisor and its affiliates. Management provided the Board with information about the Advisor’s responsibilities and services provided to institutional account clients, including information about how the requirements and economics of the institutional business are fundamentally different from those of the mutual fund business. The Board considered information showing that the mutual fund business is generally more complex from a business and compliance perspective than the institutional business and that the Advisor generally performs significant additional services and assumes greater risk in managing the fund and other T. Rowe Price mutual funds than it does for institutional account clients.
On the basis of the information provided and the factors considered, the Board concluded that the fees paid by the fund under the Advisory Contract are reasonable.
Approval of the Advisory Contract
As noted, the Board approved the continuation of the Advisory Contract. No single factor was considered in isolation or to be determinative to the decision. Rather, the Board concluded, in light of a weighting and balancing of all factors considered, that it was in the best interests of the fund and its shareholders for the Board to approve the continuation of the Advisory Contract (including the fees to be charged for services thereunder). The independent directors were advised throughout the process by independent legal counsel.
| About the Fund’s Directors and Officers |
Your fund is overseen by a Board of Directors (Board) that meets regularly to review a wide variety of matters affecting or potentially affecting the fund, including performance, investment programs, compliance matters, advisory fees and expenses, service providers, and business and regulatory affairs. The Board elects the fund’s officers, who are listed in the final table. At least 75% of the Board’s members are independent of T. Rowe Price Associates, Inc. (T. Rowe Price), and its affiliates; “inside” or “interested” directors are employees or officers of T. Rowe Price. The business address of each director and officer is 100 East Pratt Street, Baltimore, Maryland 21202. The Statement of Additional Information includes additional information about the fund directors and is available without charge by calling a T. Rowe Price representative at 1-800-638-5660.
| Independent Directors |
| |
Name (Year of Birth)
Year Elected* [Number of
T. Rowe Price Portfolios
Overseen] | | Principal Occupation(s) and Directorships of Public Companies and Other Investment Companies During the Past Five Years |
| | | |
William R. Brody, M.D., Ph.D. (1944)
2009 [165] | | President and Trustee, Salk Institute for Biological Studies (2009 to present); Director, BioMed Realty Trust (2013 to present); Director, Novartis, Inc. (2009 to 2014); Director, IBM (2007 to present) |
| | |
Anthony W. Deering (1945)
2002 [165] | | Chairman, Exeter Capital, LLC, a private investment firm (2004 to present); Director, Brixmor Real Estate Investment Trust (2012 to present); Director and Advisory Board Member, Deutsche Bank North America (2004 to present); Director, Under Armour (2008 to present); Director, Vornado Real Estate Investment Trust (2004 to 2012) |
| | | |
Donald W. Dick, Jr. (1943)
2002 [165] | | Principal, EuroCapital Partners, LLC, an acquisition and management advisory firm (1995 to present) |
| | | |
Bruce W. Duncan (1951)
2013 [165] | | President, Chief Executive Officer, and Director, First Industrial Realty Trust, an owner and operator of industrial properties (2009 to present); Chairman of the Board (2005 to present) and Director (1999 to present), Starwood Hotels & Resorts, a hotel and leisure company |
| | | |
Robert J. Gerrard, Jr. (1952)
2013 [165] | | Chairman of Compensation Committee and Director, Syniverse Holdings, Inc., a provider of wireless voice and data services for telecommunications companies (2008 to 2011); Advisory Board Member, Pipeline Crisis/Winning Strategies, a collaborative working to improve opportunities for young African Americans (1997 to present) |
| | | |
Karen N. Horn (1943)
2003 [165] | | Limited Partner and Senior Managing Director, Brock Capital Group, an advisory and investment banking firm (2004 to present); Director, Eli Lilly and Company (1987 to present); Director, Simon Property Group (2004 to present); Director, Norfolk Southern (2008 to present) |
| | | |
Paul F. McBride (1956)
2013 [165] | | Former Company Officer and Senior Vice President, Human Resources and Corporate Initiatives, Black & Decker Corporation (2004 to 2010) |
| | | |
Cecilia E. Rouse, Ph.D. (1963)
2013 [165] | | Dean, Woodrow Wilson School (2012 to present); Professor and Researcher, Princeton University (1992 to present); Director, MDRC, a nonprofit education and social policy research organization (2011 to present); Member, National Academy of Education (2010 to present); Research Associate, National Bureau of Economic Research’s Labor Studies Program (2011 to present); Member, President’s Council of Economic Advisers (2009 to 2011); Chair of Committee on the Status of Minority Groups in the Economic Profession, American Economic Association (2012 to present) |
| | | |
John G. Schreiber (1946)
2002 [165] | | Owner/President, Centaur Capital Partners, Inc., a real estate investment company (1991 to present); Cofounder and Partner, Blackstone Real Estate Advisors, L.P. (1992 to present); Director, General Growth Properties, Inc. (2010 to 2013); Director, Blackstone Mortgage Trust, a real estate financial company (2012 to present); Director and Chairman of the Board, Brixmor Property Group, Inc. (2013 to present); Director, Hilton Worldwide (2013 to present); Director, Hudson Pacific Properties (2014 to present) |
| | | |
Mark R. Tercek (1957)
2009 [165] | | President and Chief Executive Officer, The Nature Conservancy (2008 to present) |
| | |
| *Each independent director serves until retirement, resignation, or election of a successor. |
| |
| Inside Directors |
| |
Name (Year of Birth)
Year Elected* [Number of
T. Rowe Price Portfolios
Overseen] | | Principal Occupation(s) and Directorships of Public Companies and Other Investment Companies During the Past Five Years |
| | | |
Edward C. Bernard (1956)
2006 [165] | | Director and Vice President, T. Rowe Price; Vice Chairman of the Board, Director, and Vice President, T. Rowe Price Group, Inc.; Chairman of the Board, Director, and President, T. Rowe Price Investment Services, Inc.; Chairman of the Board and Director, T. Rowe Price Retirement Plan Services, Inc., and T. Rowe Price Services, Inc.; Chairman of the Board, Chief Executive Officer, Director, and President, T. Rowe Price International and T. Rowe Price Trust Company; Chairman of the Board, all funds |
| | | |
Edward A. Wiese, CFA (1959)
2015 [54] | | Director and Vice President, T. Rowe Price Trust Company; Vice President, T. Rowe Price, T. Rowe Price Group, Inc., and T. Rowe Price International |
| |
| *Each inside director serves until retirement, resignation, or election of a successor. |
| Officers |
| |
Name (Year of Birth)
Position Held With Institutional Income Funds | | Principal Occupation(s) |
| | | |
Jason A. Bauer (1979)
Vice President | | Vice President, T. Rowe Price and T. Rowe Price Group, Inc. |
| | | |
Michael F. Blandino (1971)
Vice President | | Vice President, T. Rowe Price and T. Rowe Price Group, Inc. |
| | | |
Steven E. Boothe, CFA (1977)
Vice President | | Vice President, T. Rowe Price and T. Rowe Price Group, Inc. |
| | | |
Darrell N. Braman (1963)
Vice President | | Vice President, Price Hong Kong, Price Singapore, T. Rowe Price, T. Rowe Price Group, Inc., T. Rowe Price International, T. Rowe Price Investment Services, Inc., and T. Rowe Price Services, Inc. |
| | | |
Brian J. Brennan, CFA (1964)
Executive Vice President | | Vice President, T. Rowe Price, T. Rowe Price Group, Inc., T. Rowe Price International, and T. Rowe Price Trust Company |
| | | |
Andrew M. Brooks (1956)
Vice President | | Vice President, T. Rowe Price and T. Rowe Price Group, Inc. |
| | | |
Christopher P. Brown, Jr., CFA (1977)
Vice President | | Vice President, T. Rowe Price and T. Rowe Price Group, Inc. |
| | | |
Brian E. Burns (1960)
Vice President | | Vice President, T. Rowe Price, T. Rowe Price Group, Inc., and T. Rowe Price Trust Company |
| | | |
Andrew L. Cohen, CFA (1979)
Vice President | | Vice President, T. Rowe Price and T. Rowe Price Group, Inc.; formerly, Associate, Power & Energy/Strategic Investments, Metlife Investments (to 2010) |
| | | |
Michael J. Conelius, CFA (1964)
Vice President | | Vice President, T. Rowe Price, T. Rowe Price Group, Inc., T. Rowe Price International, and T. Rowe Price Trust Company |
| | | |
Michael F. Connelly, CFA (1977)
Vice President | | Vice President, T. Rowe Price and T. Rowe Price Group, Inc. |
| | | |
Michael P. Daley (1981)
Vice President | | Vice President, T. Rowe Price and T. Rowe Price Group, Inc. |
| | | |
Stephen M. Finamore, CPA (1976)
Vice President | | Vice President, T. Rowe Price and T. Rowe Price Group, Inc. |
| | | |
Justin T. Gerbereux, CFA (1975)
Vice President | | Vice President, T. Rowe Price, T. Rowe Price Group, Inc., and T. Rowe Price Trust Company |
| | | |
John R. Gilner (1961)
Chief Compliance Officer | | Chief Compliance Officer and Vice President, T. Rowe Price; Vice President, T. Rowe Price Group, Inc., and T. Rowe Price Investment Services, Inc. |
| | |
David R. Giroux, CFA (1975)
Vice President | | Vice President, T. Rowe Price, T. Rowe Price Group, Inc., and T. Rowe Price Trust Company |
| | | |
Michael J. Grogan, CFA (1971)
Vice President | | Vice President, T. Rowe Price and T. Rowe Price Group, Inc. |
| | | |
Gregory K. Hinkle, CPA (1958)
Treasurer | | Vice President, T. Rowe Price, T. Rowe Price Group, Inc., and T. Rowe Price Trust Company |
| | | |
Steven C. Huber, CFA, FSA (1958)
Executive Vice President | | Vice President, T. Rowe Price and T. Rowe Price Group, Inc. |
| | | |
Arif Husain, CFA (1972)
Vice President | | Vice President, T. Rowe Price Group, Inc., and T. Rowe Price International; formerly, Director/Head of UK and Euro Fixed Income, AllianceBernstein |
| | | |
Andrew P. Jamison (1981)
Vice President | | Vice President, T. Rowe Price and T. Rowe Price Group, Inc. |
| | | |
Andrew J. Keirle (1974)
Vice President | | Vice President, T. Rowe Price Group, Inc., and T. Rowe Price International |
| | | |
Michael Lambe, CFA (1977)
Vice President | | Vice President, T. Rowe Price Group, Inc., and T. Rowe Price International |
| | | |
Robert M. Larkins, CFA (1973)
Vice President | | Vice President, T. Rowe Price, T. Rowe Price Group, Inc., and T. Rowe Price Trust Company |
| | | |
Patricia B. Lippert (1953)
Secretary | | Assistant Vice President, T. Rowe Price and T. Rowe Price Investment Services, Inc. |
| | | |
Paul M. Massaro, CFA (1975)
Executive Vice President | | Vice President, T. Rowe Price, T. Rowe Price Group, Inc., and T. Rowe Price Trust Company |
| | | |
Andrew C. McCormick (1960)
Vice President | | Vice President, T. Rowe Price, T. Rowe Price Group, Inc., and T. Rowe Price Trust Company |
| | | |
Michael J. McGonigle (1966)
Vice President | | Vice President, T. Rowe Price and T. Rowe Price Group, Inc. |
| | | |
Samy B. Muaddi, CFA (1984)
Vice President | | Vice President, T. Rowe Price and T. Rowe Price Group, Inc. |
| | | |
James M. Murphy, CFA (1967)
Vice President | | Vice President, T. Rowe Price and T. Rowe Price Group, Inc. |
| | | |
Alexander S. Obaza (1981)
Vice President | | Vice President, T. Rowe Price, T. Rowe Price Group, Inc., and T. Rowe Price Trust Company |
| | | |
David Oestreicher (1967)
Vice President | | Director, Vice President, and Secretary, T. Rowe Price Investment Services, Inc., T. Rowe Price Retirement Plan Services, Inc., T. Rowe Price Services, Inc., and T. Rowe Price Trust Company; Chief Legal Officer, Vice President, and Secretary, T. Rowe Price Group, Inc.; Vice President and Secretary, T. Rowe Price and T. Rowe Price International; Vice President, Price Hong Kong and Price Singapore |
| | | |
Miso Park, CFA (1982)
Vice President | | Vice President, T. Rowe Price Group, Inc., and T. Rowe Price International; formerly, Credit Analyst, M&G Investments (to 2010) |
| | | |
John W. Ratzesberger (1975)
Vice President | | Vice President, T. Rowe Price, T. Rowe Price Group, Inc., and T. Rowe Price Trust Company; formerly, North American Head of Listed Derivatives Operation, Morgan Stanley (to 2013) |
| | | |
Rodney M. Rayburn, CFA (1970)
Vice President | | Vice President, T. Rowe Price and T. Rowe Price Group, Inc.; formerly, Managing Director, Värde Partners (to 2014) |
| | | |
Vernon A. Reid, Jr. (1954)
Vice President | | Vice President, T. Rowe Price and T. Rowe Price Group, Inc. |
| | | |
Theodore E. Robson, CFA (1965)
Vice President | | Vice President, T. Rowe Price, T. Rowe Price Group, Inc., and T. Rowe Price Trust Company |
| | | |
Brian M. Ropp, CPA (1969)
Vice President | | Vice President, T. Rowe Price and T. Rowe Price Group, Inc. |
| | | |
Brian A. Rubin, CPA (1974)
Vice President | | Vice President, T. Rowe Price, T. Rowe Price Group, Inc., and T. Rowe Price Trust Company |
| | | |
Deborah D. Seidel (1962)
Vice President | | Vice President, T. Rowe Price, T. Rowe Price Group, Inc., T. Rowe Price Investment Services, Inc., and T. Rowe Price Services, Inc. |
| | | |
Daniel O. Shackelford, CFA (1958)
Vice President | | Vice President, T. Rowe Price, T. Rowe Price Group, Inc., and T. Rowe Price Trust Company |
| | | |
Scott D. Solomon, CFA (1981)
Vice President | | Vice President, T. Rowe Price |
| | | |
David A. Stanley (1963)
Vice President | | Vice President, T. Rowe Price Group, Inc., and T. Rowe Price International |
| | | |
Kimberly A. Stokes (1969)
Vice President | | Vice President, T. Rowe Price and T. Rowe Price Group, Inc. |
| | | |
Ju Yen Tan (1972)
Vice President | | Vice President, T. Rowe Price Group, Inc., and T. Rowe Price International |
| | | |
Thomas E. Tewksbury (1961)
Vice President | | Vice President, T. Rowe Price, T. Rowe Price Group, Inc., and T. Rowe Price Trust Company |
| | | |
Robert T. Thomas (1971)
Vice President | | Vice President, T. Rowe Price Group, Inc., and T. Rowe Price International; formerly, Senior Vice President, Moody’s Investors Service, London (to 2011) |
| | | |
Siby Thomas (1979)
Vice President | | Vice President, T. Rowe Price and T. Rowe Price Group, Inc. |
| | | |
David A. Tiberii, CFA (1965)
Executive Vice President | | Vice President, T. Rowe Price, T. Rowe Price Group, Inc., T. Rowe Price International, and T. Rowe Price Trust Company |
| | | |
Mark J. Vaselkiv (1958)
President | | Vice President, T. Rowe Price, T. Rowe Price Group, Inc., and T. Rowe Price Trust Company |
| | | |
Lauren T. Wagandt (1984)
Vice President | | Vice President, T. Rowe Price and T. Rowe Price Group, Inc. |
| | | |
Thea N. Williams (1961)
Vice President | | Vice President, T. Rowe Price, T. Rowe Price Group, Inc., and T. Rowe Price Trust Company |
| | | |
J. Howard Woodward, CFA (1974)
Vice President | | Vice President, T. Rowe Price Group, Inc., and T. Rowe Price International |
| | | |
Jeffrey T. Zoller (1970)
Vice President | | Vice President, T. Rowe Price and T. Rowe Price Trust Company |
| | |
| Unless otherwise noted, officers have been employees of T. Rowe Price or T. Rowe Price International for at least 5 years. |
Item 2. Code of Ethics.
The registrant has adopted a code of ethics, as defined in Item 2 of Form N-CSR, applicable to its principal executive officer, principal financial officer, principal accounting officer or controller, or persons performing similar functions. A copy of this code of ethics is filed as an exhibit to this Form N-CSR. No substantive amendments were approved or waivers were granted to this code of ethics during the period covered by this report.
Item 3. Audit Committee Financial Expert.
The registrant’s Board of Directors/Trustees has determined that Mr. Bruce W. Duncan qualifies as an audit committee financial expert, as defined in Item 3 of Form N-CSR. Mr. Duncan is considered independent for purposes of Item 3 of Form N-CSR.
Item 4. Principal Accountant Fees and Services.
(a) – (d) Aggregate fees billed for the last two fiscal years for professional services rendered to, or on behalf of, the registrant by the registrant’s principal accountant were as follows:

Audit fees include amounts related to the audit of the registrant’s annual financial statements and services normally provided by the accountant in connection with statutory and regulatory filings. Audit-related fees include amounts reasonably related to the performance of the audit of the registrant’s financial statements and specifically include the issuance of a report on internal controls and, if applicable, agreed-upon procedures related to fund acquisitions. Tax fees include amounts related to services for tax compliance, tax planning, and tax advice. The nature of these services specifically includes the review of distribution calculations and the preparation of Federal, state, and excise tax returns. All other fees include the registrant’s pro-rata share of amounts for agreed-upon procedures in conjunction with service contract approvals by the registrant’s Board of Directors/Trustees.
(e)(1) The registrant’s audit committee has adopted a policy whereby audit and non-audit services performed by the registrant’s principal accountant for the registrant, its investment adviser, and any entity controlling, controlled by, or under common control with the investment adviser that provides ongoing services to the registrant require pre-approval in advance at regularly scheduled audit committee meetings. If such a service is required between regularly scheduled audit committee meetings, pre-approval may be authorized by one audit committee member with ratification at the next scheduled audit committee meeting. Waiver of pre-approval for audit or non-audit services requiring fees of a de minimis amount is not permitted.
(2) No services included in (b) – (d) above were approved pursuant to paragraph (c)(7)(i)(C) of Rule 2-01 of Regulation S-X.
(f) Less than 50 percent of the hours expended on the principal accountant’s engagement to audit the registrant’s financial statements for the most recent fiscal year were attributed to work performed by persons other than the principal accountant’s full-time, permanent employees.
(g) The aggregate fees billed for the most recent fiscal year and the preceding fiscal year by the registrant’s principal accountant for non-audit services rendered to the registrant, its investment adviser, and any entity controlling, controlled by, or under common control with the investment adviser that provides ongoing services to the registrant were $2,677,000 and $1,759,000, respectively.
(h) All non-audit services rendered in (g) above were pre-approved by the registrant’s audit committee. Accordingly, these services were considered by the registrant’s audit committee in maintaining the principal accountant’s independence.
Item 5. Audit Committee of Listed Registrants.
Not applicable.
Item 6. Investments.
(a) Not applicable. The complete schedule of investments is included in Item 1 of this Form N-CSR.
(b) Not applicable.
Item 7. Disclosure of Proxy Voting Policies and Procedures for Closed-End Management Investment Companies.
Not applicable.
Item 8. Portfolio Managers of Closed-End Management Investment Companies.
Not applicable.
Item 9. Purchases of Equity Securities by Closed-End Management Investment Company and Affiliated Purchasers.
Not applicable.
Item 10. Submission of Matters to a Vote of Security Holders.
Not applicable.
Item 11. Controls and Procedures.
(a) The registrant’s principal executive officer and principal financial officer have evaluated the registrant’s disclosure controls and procedures within 90 days of this filing and have concluded that the registrant’s disclosure controls and procedures were effective, as of that date, in ensuring that information required to be disclosed by the registrant in this Form N-CSR was recorded, processed, summarized, and reported timely.
(b) The registrant’s principal executive officer and principal financial officer are aware of no change in the registrant’s internal control over financial reporting that occurred during the registrant’s second fiscal quarter covered by this report that has materially affected, or is reasonably likely to materially affect, the registrant’s internal control over financial reporting.
Item 12. Exhibits.
(a)(1) The registrant’s code of ethics pursuant to Item 2 of Form N-CSR is attached.
(2) Separate certifications by the registrant's principal executive officer and principal financial officer, pursuant to Section 302 of the Sarbanes-Oxley Act of 2002 and required by Rule 30a-2(a) under the Investment Company Act of 1940, are attached.
(3) Written solicitation to repurchase securities issued by closed-end companies: not applicable.
(b) A certification by the registrant's principal executive officer and principal financial officer, pursuant to Section 906 of the Sarbanes-Oxley Act of 2002 and required by Rule 30a-2(b) under the Investment Company Act of 1940, is attached.
SIGNATURES
Pursuant to the requirements of the Securities Exchange Act of 1934 and the Investment Company Act of 1940, the registrant has duly caused this report to be signed on its behalf by the undersigned, thereunto duly authorized.
T. Rowe Price Institutional Income Funds, Inc.
| By | /s/ Edward C. Bernard |
| | Edward C. Bernard |
| | Principal Executive Officer |
| | |
| Date July 16, 2015 | | |
Pursuant to the requirements of the Securities Exchange Act of 1934 and the Investment Company Act of 1940, this report has been signed below by the following persons on behalf of the registrant and in the capacities and on the dates indicated.
| By | /s/ Edward C. Bernard |
| | Edward C. Bernard |
| | Principal Executive Officer |
| | |
| Date July 16, 2015 | | |
| | |
| | |
| By | /s/ Gregory K. Hinkle |
| | Gregory K. Hinkle |
| | Principal Financial Officer |
| | |
| Date July 16, 2015 | | |
| | | |